Article

Investigation on the Optimal Amount of Y and B Elements in High-Temperature Titanium Alloy Ti-5.9Al-4Sn-3.9Zr-3.8Mo-0.4Si-xY-yB

1
Key Laboratory of the Ministry of Education, Southwest Jiaotong University, Chengdu 610031, China
2
School of Materials Science and Engineering, Southwest Jiaotong University, Chengdu 610031, China
*
Author to whom correspondence should be addressed.
Submission received: 20 September 2023 / Revised: 19 October 2023 / Accepted: 26 October 2023 / Published: 30 October 2023

Abstract

:
This article presents a novel and feasible approach for researching the quantity of the ceramic phase and component optimization in high-temperature titanium alloys with small trace amounts of ceramic phases. Different near-α titanium alloys with varying yttrium and boron contents were prepared through the utilization of a vacuum non-consumable arc furnace melting method. The alloy used was a Ti-5.9Al-4Sn-3.9Zr-3.8Mo-0.4Si base. Its microstructure, texture, mechanical properties, and fracture behavior were studied. The observation of the as-cast structure shows that the addition of different doses of trace Y and B elements significantly refines both the original β grains and α grains. Moreover, the addition of the B element transforms the Widmanstätten structure in the titanium alloy structure into a basketweave structure. The addition of Y can refine the grain structure, improve the uniformity of the matrix structure, and act as a strong deoxidizer, which will take away the oxygen in the matrix and purify it. The TiB whiskers generated with the addition of B promotes dynamic recrystallization behavior and leads to more equiaxed α grains being precipitated around them, resulting in a significant refinement of the microstructure of the as-cast alloy. After adding a small amount of B, the texture strength of the α phase is significantly reduced, indicating that TiB whiskers inhibit the formation of texture. After conducting performance screening and structure analysis, the study supplements the analysis of Y’s regulation of the titanium alloy structure. The regulation is primarily explained by combining the results of the analysis of boron content, phase diagram analysis, mechanical properties, and fracture analysis. The mechanical analysis introduces the unique load transfer strengthening of TiB whiskers combined with an analysis of high-temperature mechanical properties, as the threshold for addition. The optimal amounts of Y and B additions are 0.6 wt% and 0.8 wt%, respectively. The optimized alloy obtained under this condition can achieve a tensile strength of 950 Mpa at 500 °C without any plastic deformation or heat treatment.

1. Introduction

Titanium alloys are potential materials for applications in aerospace, automotive, energy, and biomedical fields [1,2,3]. Their extensive use is mainly attributed to the superior properties of the alloys, such as a high strength-to-weight ratio, excellent mechanical properties and oxidation resistance at high temperatures, excellent thermal stability, and biocompatibility [1,2,3]. The density of titanium alloys is about 4.5 g/cm−3, only half that of nickel alloys. Although the density of aluminum or magnesium alloys is relatively low, their specific strength is lower than that of titanium alloys. The use of titanium alloys ensures both the load-bearing capacity of structural components and the maximum possible reduction in the weight of the workpiece. High-temperature titanium alloys mainly refer to near-α titanium alloys, especially those at 550–600 °C, such as Ti-1100 (Ti-6.0-Al-2.9-Sn-4.2-0.41Zr-0.39-Mo-Si, USA), IMI834 (Ti-6.0-Al-4.0-Sn-3.5-0.7Zr-0.5-Mo-NB-0.35-Si, UK), BT36 (Ti-6.2-Al-2.0-Sn-3.6-0.15 Zr-0.7-Mo-Si-5.0W, Russia), Ti60 (Ti-5.8-4.8Al-Sn-2-Zr-1-Mo-0.85-0.35-Si, China) [4,5,6]. However, the maximum operating temperature of traditional high-temperature titanium alloys [7,8] is limited to 600 °C. The main reasons are as follows: First, the solid solution strengthening of the Ti-Al-Sn-Zr-Mo-Si alloy system has reached its limit. If the alloy’s room temperature and high-temperature strength are further increased through solid solution strengthening, its toughness match and thermal stability will decrease. Second, 600 °C has exceeded the alloy’s oxidation resistance limit. When serving under high-temperature conditions for a long time, the surface oxidation is severe, which can easily cause part failure. Third, 600 °C is the “equal coagulation temperature” [9] of near-α titanium alloys. When the temperature is higher than 600 °C, the grain boundary strength is equivalent to or weaker than the intragranular strength, and grain boundary slip is more easily induced, which makes the material more prone to deformation, and is not conducive to improving high-temperature strength.
In recent years, titanium-based composites based on high-temperature titanium alloys have been widely studied to improve their operating temperature. However, excessive reinforcing agents limit the alloy’s plasticity. To fully highlight the advantages of the matrix alloy and the reinforcing phase, it is necessary to reduce the content of the reinforcing phase. Therefore, the addition of trace ceramic particles such as Al2O3, SiC, TiC, and TiB has received widespread attention in recent years. Among these ceramic phases, TiB whiskers are a better choice for improving the mechanical properties of titanium alloys. TiB whiskers have a density and thermal expansion coefficient like pure titanium, and have a high modulus, about four times that of pure titanium [10]. TiB whiskers have excellent tensile strength, about eight times that of a Ti64 alloy [11]. In as-cast, forged, and heat-treated alloys, there are no reaction products at the matrix/reinforcement interface, indicating that the alloy has good thermodynamic and chemical stability [12]. The TiB phase of the B27 structure grows along the [10]] crystal direction at a much higher rate than other crystal directions, resulting in a whisker-like morphology. Ma [13] et al. introduced the strengthening factor C0 to reveal the effect of whisker orientation on the mechanical properties of titanium-based composites. At the same time, research has shown that Y is beneficial to improve the tensile toughness, thermal stability, and creep properties of a Ti-1100 alloy. Tuo et al. [14] also showed that adding Y can refine the microstructure and improve the mechanical properties of IMI829. Li et al. [15] reported that as the Y content increases, the grain size and interlamellar spacing of a Ti-47Al alloy decrease significantly, up to 0.3 at.%. Kong et al. also found similar results. Therefore, the addition of Y helps to re-form the microstructure of titanium alloys and improve their mechanical properties [16].
However, so far, there have been few studies focusing on the combined addition of yttrium and boron elements to high-temperature titanium alloys, and most researchers have only limited their analysis of the addition of boron elements to the level of a structural analysis [17]. This article aims to start with the addition of the yttrium element, observe its structural changes, analyze the effect of adding yttrium, and then add the boron element to explore the optimal addition amount of both in the process of joint addition of Y and B in high-temperature titanium alloy Ti-5.9Al-4Sn-3.9Zr-3.8Mo-0.4Si-xY-yB, combining multiple factors such as microstructure, grain size, texture, load transfer operation, and high-temperature tensile fracture analysis.

2. Experimental Procedure

In this study, near-α titanium alloy Ti-5.9Al-4Sn-3.9Zr-3.8Mo-0.4Si (TA5.9) and Ti-5.9Al-4Sn-3.9Zr-3.8Mo-0.4Si-xY-yB (TA5.9-xY-yB) alloys with the addition of Y and B were used. The values of x and y varied (x = 0.1, 0.2, 0.4, 0.6, 0.8; y = 0.2, 0.4, 0.6, 0.8, 1.0). A WS-4 vacuum non-consumable arc furnace was used to melt 50 g of cylindrical titanium alloy ingots with a radius of 30 mm and a height of 15 mm under a vacuum condition of 5 × 10⁻⁴ MPa using an arc melting nozzle with a maximum temperature of 3000 °C. The alloy raw materials used were sponge Ti (99.5%), pure Al (99.99%), sponge Zr (99.5%), silicon powder (99.9%), boron powder (99.9%), and intermediate alloys such as Ti-Sn and Al-Mo. To ensure the high uniformity of the alloy, the ingots were melted and flipped in a copper crucible at least three times. The chemical composition of TA5.9 and TA5.9-xY-yB was confirmed using an ICAP-7000(OES) inductively coupled plasma emission spectrometer (ICP), as shown in Table 1 and Table 2. The phase composition of the titanium alloy before and after the addition of B was studied using an X-ray diffractometer (XRD) produced by EMPYREAN. The alloy microstructure was characterized using a JSM 7800 field emission scanning electron microscope (SEM) and electron backscatter diffraction (EBSD) imaging. The characterized samples were small squares measuring 3 × 4 × 5 mm cut from the as-cast samples. These squares underwent stage grinding with 400#, 1000#, 2000#, 3000#, and 4000# sandpaper, followed by mechanically polishing for 20 min using a 50 nm silica polishing solution. High-temperature tensile tests were conducted at 500 °C using an MTS E45.105 microcomputer-controlled electronic universal testing machine. The initial strain rate was set at 1.54 × 10⁻³ s−1, and the tensile sample used was a 23 mm flat sample that complied with the GB/T228.1-2010 standard.

3. Results and Discussion

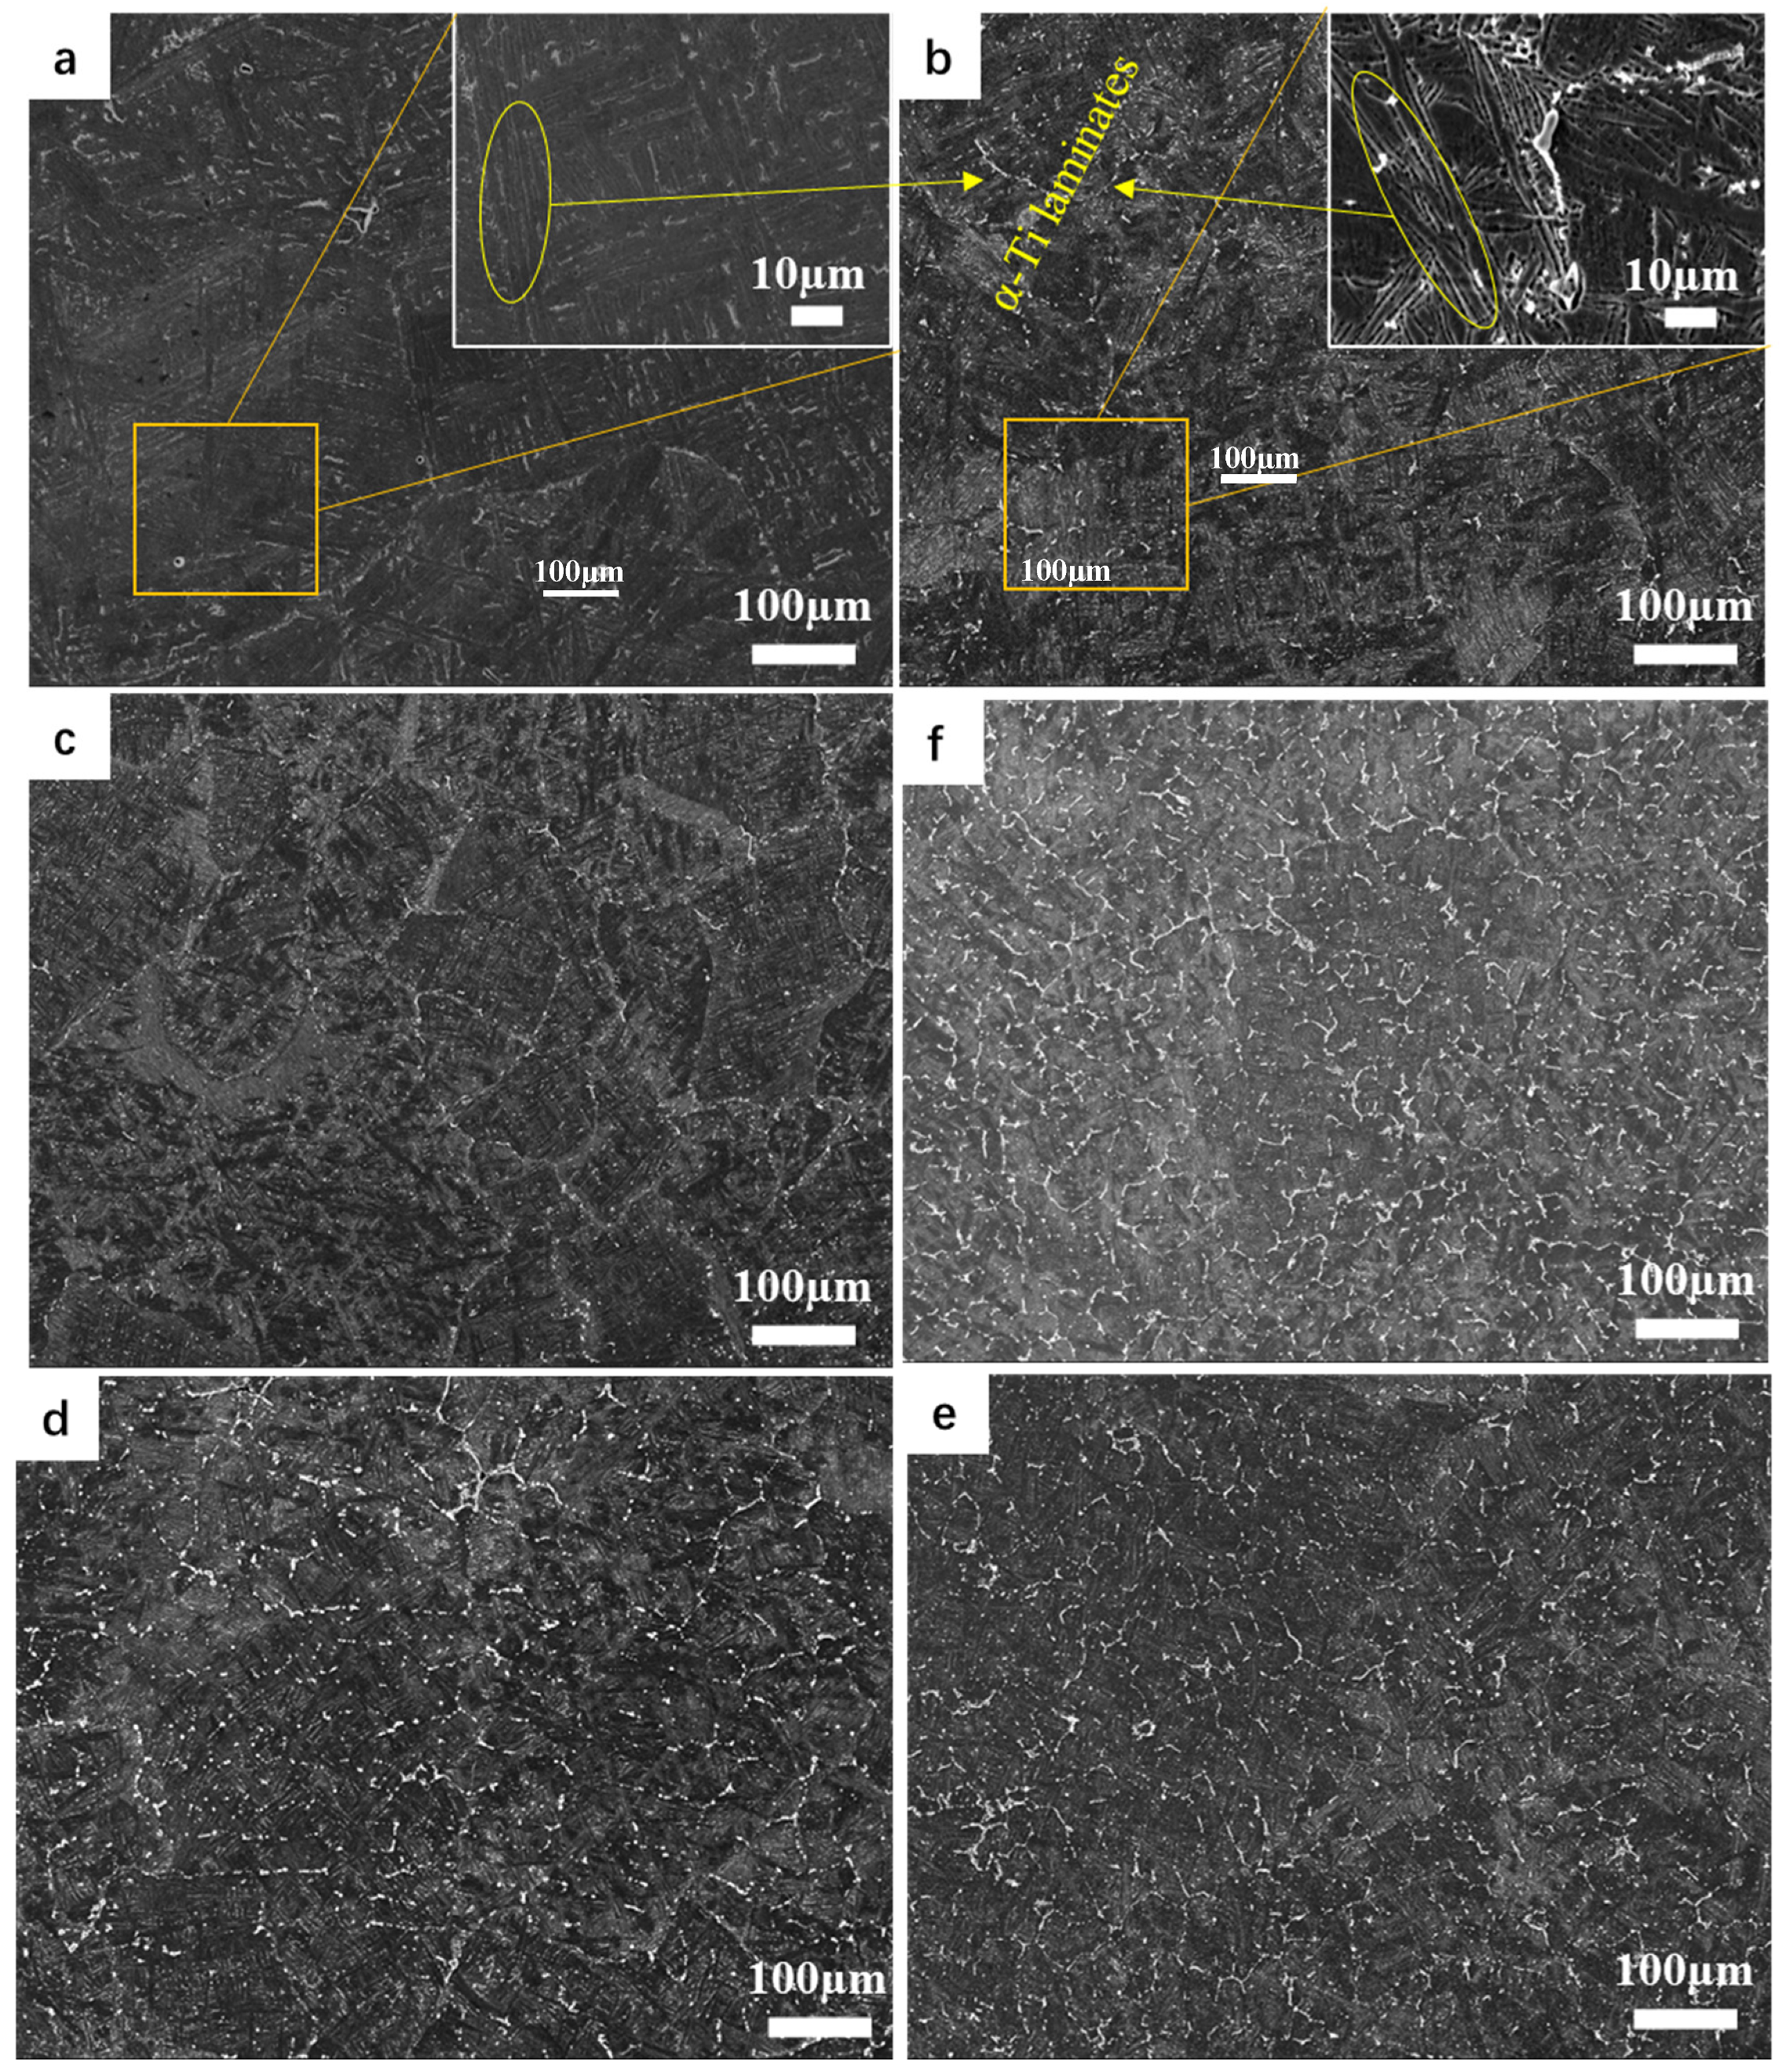
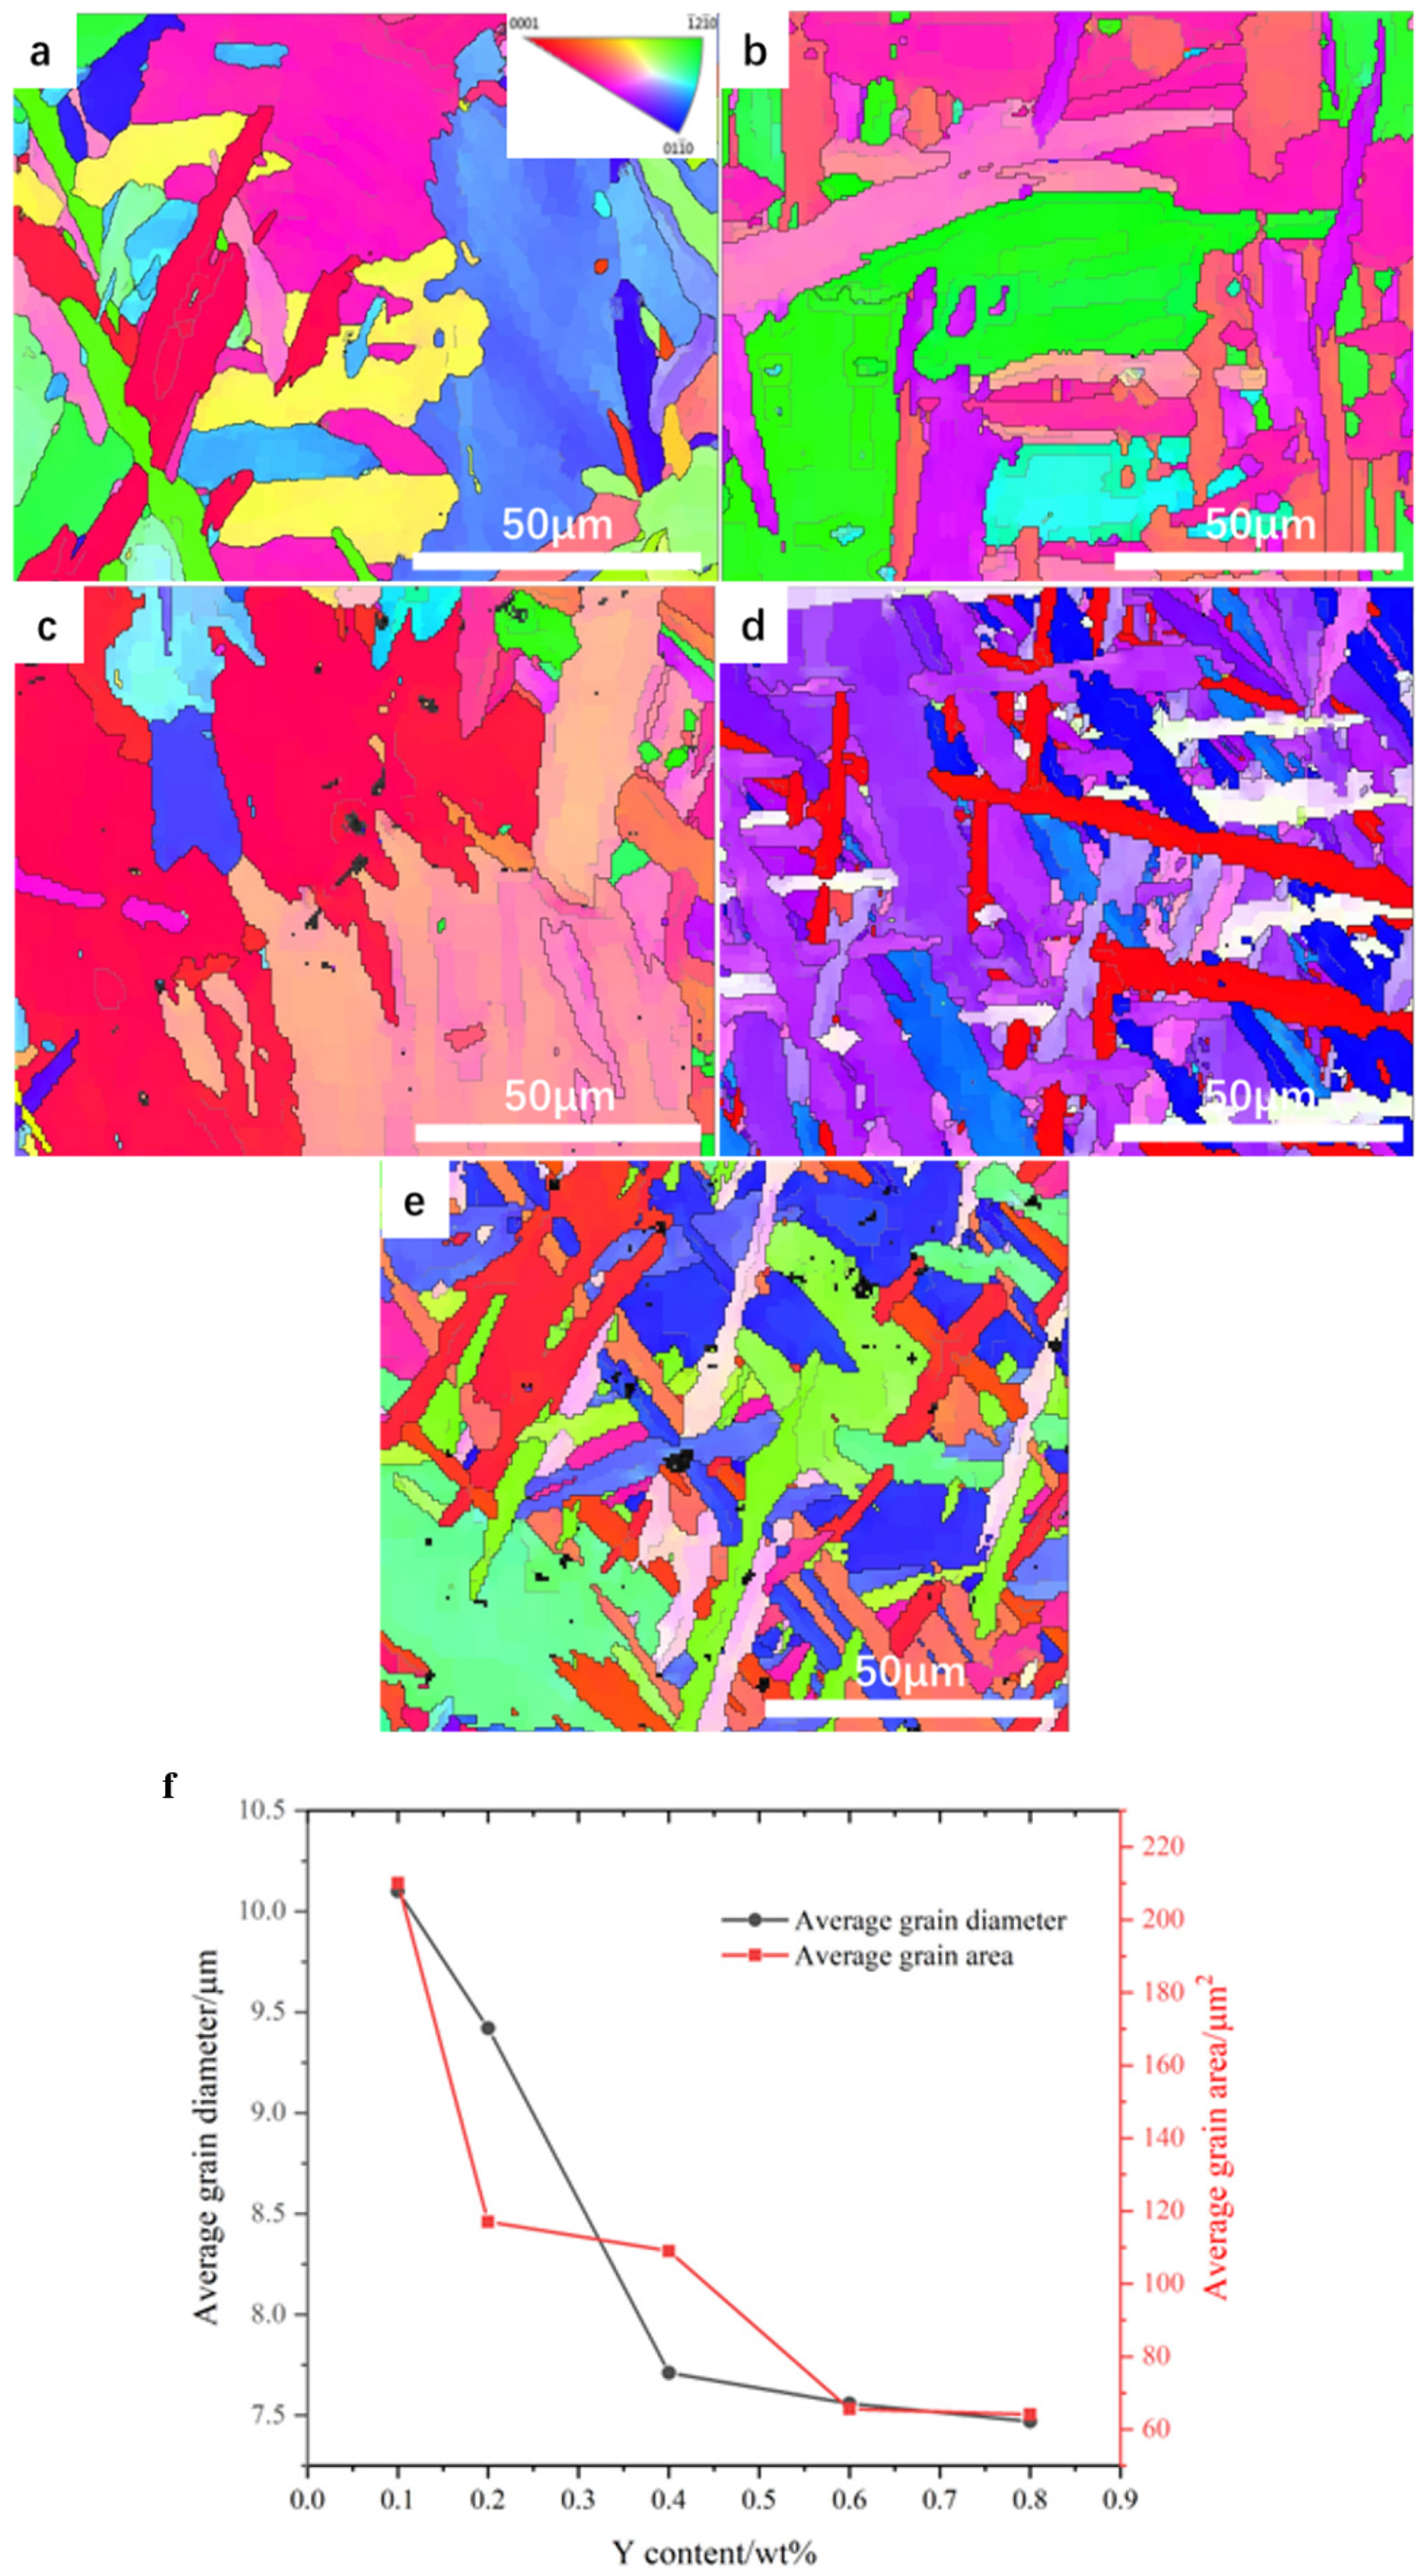
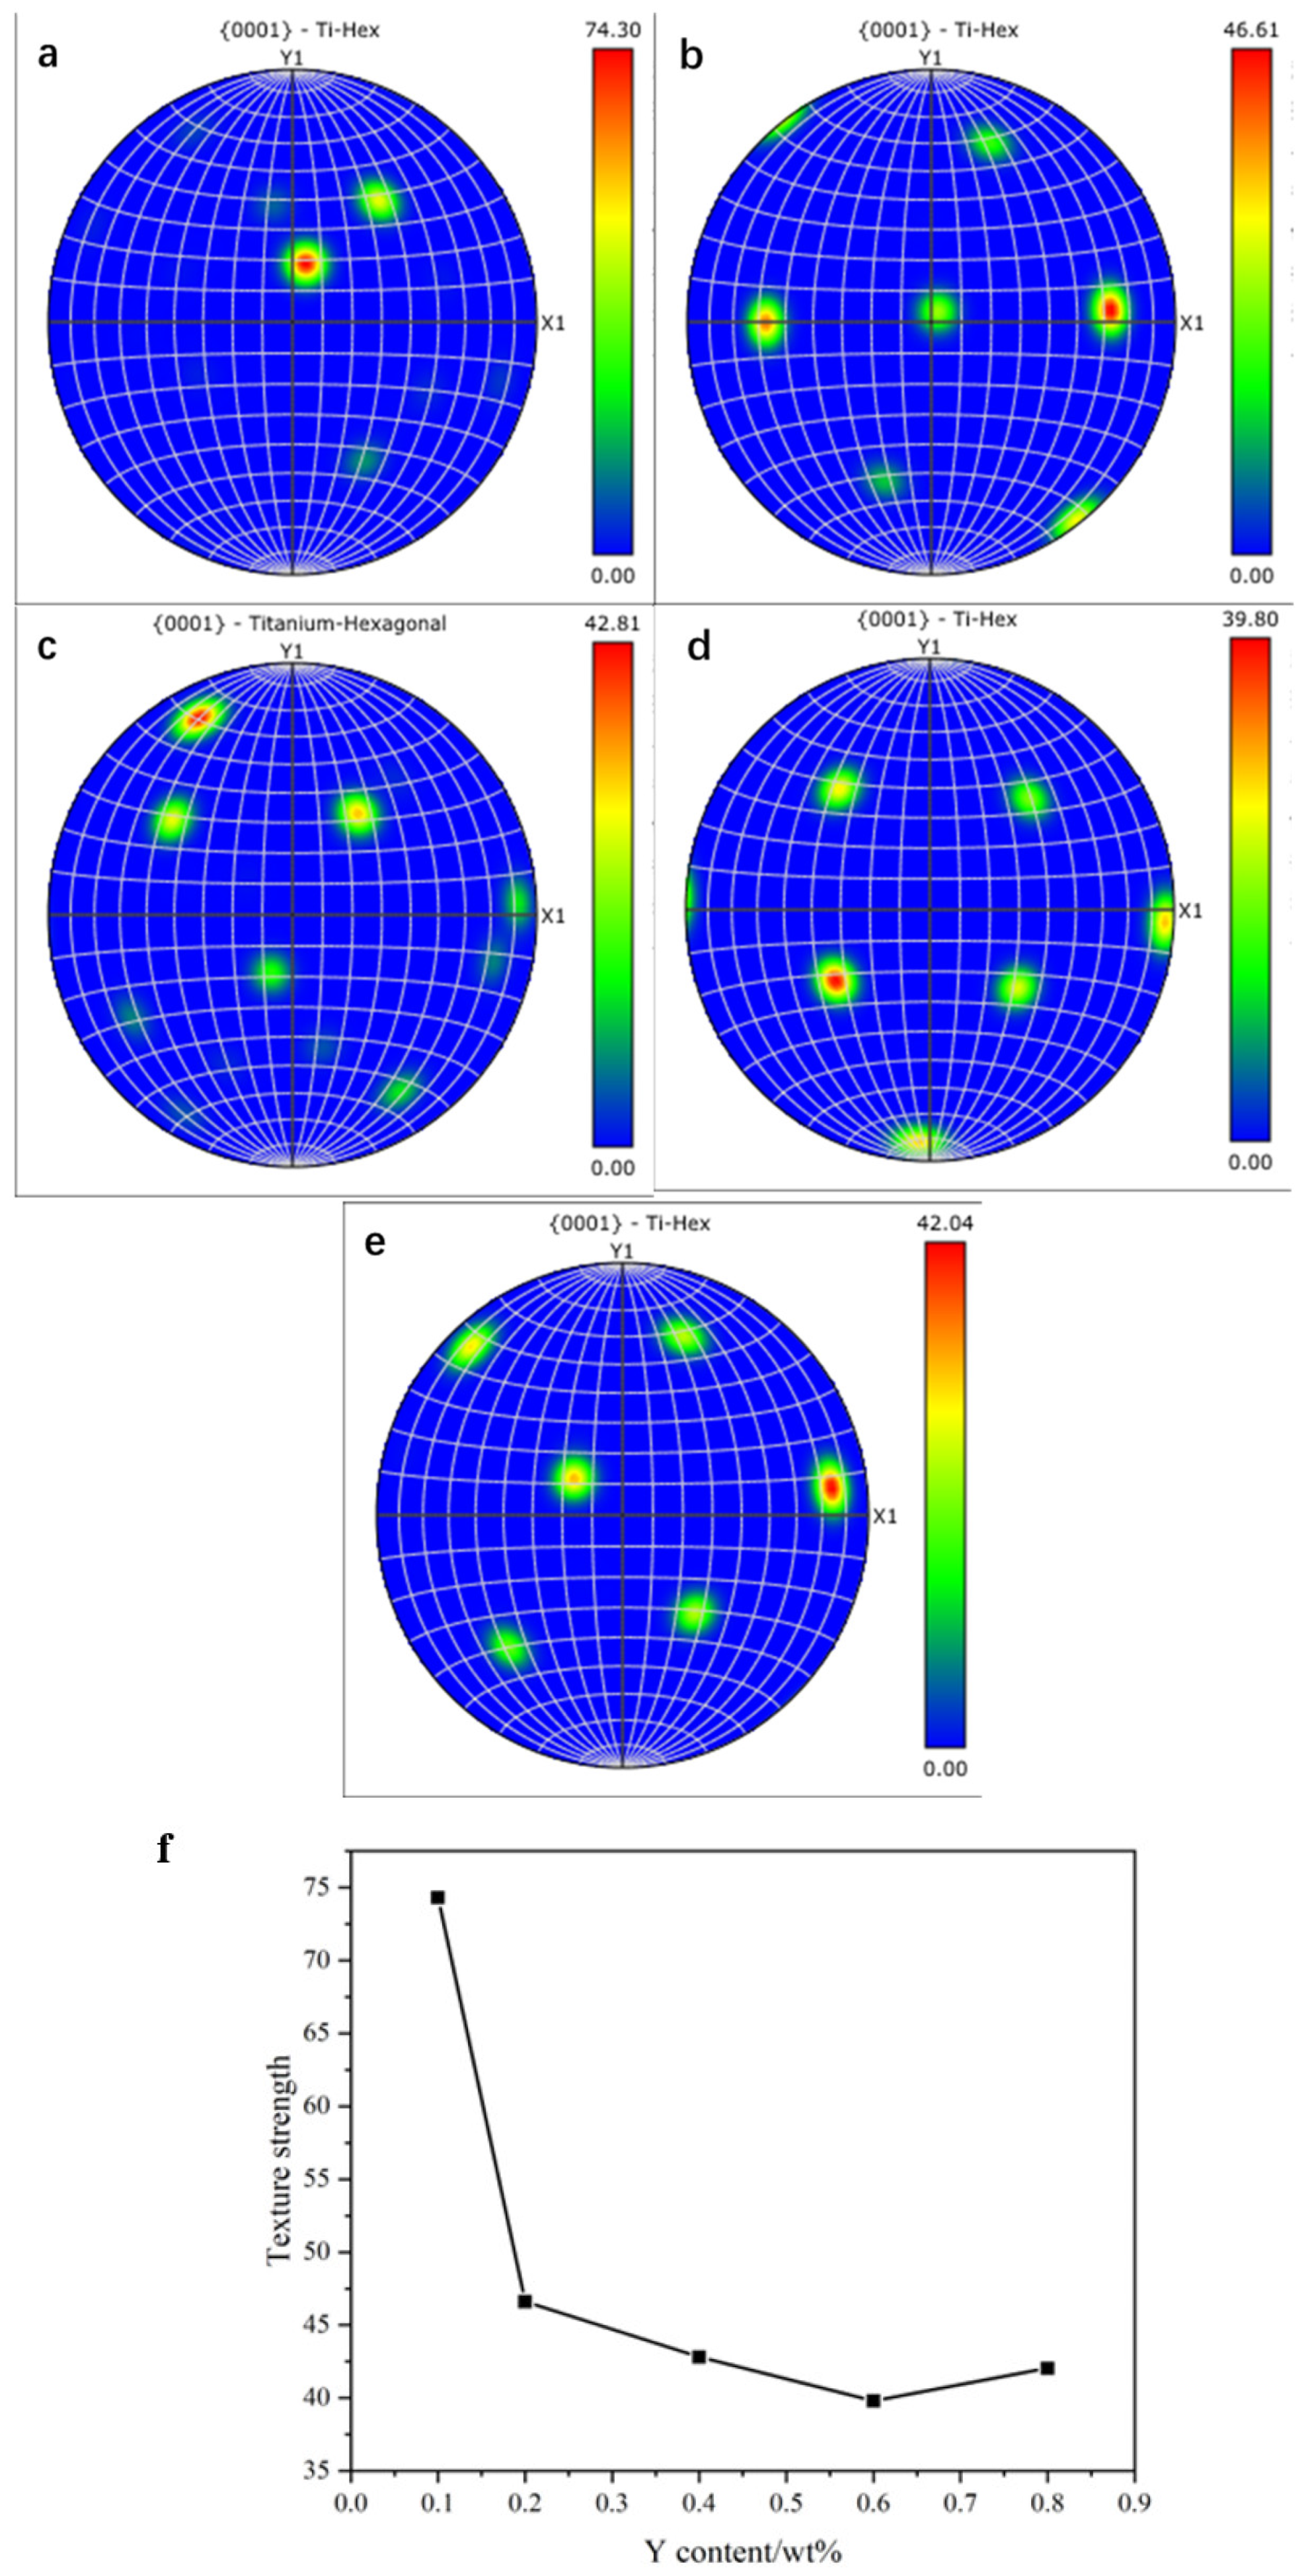
3.1. Microstructure Evolution after Y addition

The as-cast microstructures of TA5.9 and TA5.9-xY alloys are shown in SEM images (Figure 1a,b). Comparing the two images, the overall grain size decreases after the addition of Y. Additionally, the number of grains per unit area increases and they become more tortuous due to the decrease in grain size. As Y content increases, the matrix structure becomes more uniform and the grain size continues to decrease, indicating that the matrix structure is optimized within a certain range. Moreover, the local magnification images of Figure 1a,b shows that the second phase, which was originally non-uniformly distributed between α-Ti laminate (the structure of the α-Ti laminate is shown in the box’s yellow circle) in the figure, begins to distribute uniformly along the grain boundaries after the addition of Y, and the distribution of the second phase becomes more uniform and denser as the Y content increases. This phenomenon indicates that Y gradually regulates the characteristics of grain structure and the distribution of the second phase during the addition process.
According to the comparison of Figure 2b,c, it can be analyzed that the addition of the Y element has a significant aggregating effect on Mo-type neutral solid solution elements at the grain boundaries. Combined with the conclusion mentioned in the previous section, this shows that the Y element can not only aggregate neutral solid solution elements, but also promote their uniform distribution [18]. This makes it an effective organization regulator. At the same time, as shown with the EDS spectrum distribution of the oxygen element, it can be analyzed that the Y element, as a strong deoxidizer, can attract and aggregate oxygen elements in the matrix, thus purifying the oxygen elements in the matrix. This is because the large distribution of oxygen elements in the matrix can significantly impact the mechanical properties of titanium alloys. The addition of the Y element, in theory, enhances the performance of the titanium alloy matrix by purifying the oxygen elements.
According to Figure 3, the large block grain structure in the matrix gradually transforms into a strip interlaced state. The average grain size in the titanium alloy matrix decreases from 10.1 μm to 7.47 μm, while the average grain area decreases from 210.1 μm to 64.1 μm2. This indicates that the Y element has a significant refining effect on the matrix. The line chart shows that after adding 0.4 wt% of the Y element, the grain size remains relatively stable, indicating that 0.4 wt% is the threshold for achieving efficient grain refinement.
According to Figure 4, the decrease in texture strength began to slow down after adding 0.2 wt% of the Y element. When the addition amount reached 0.6 wt% (as shown in Figure 4d), the texture strength reached its minimum value of 39.8. This indicates that the uniformity of the matrix structure reached its optimal state during the stage of adding the Y element.

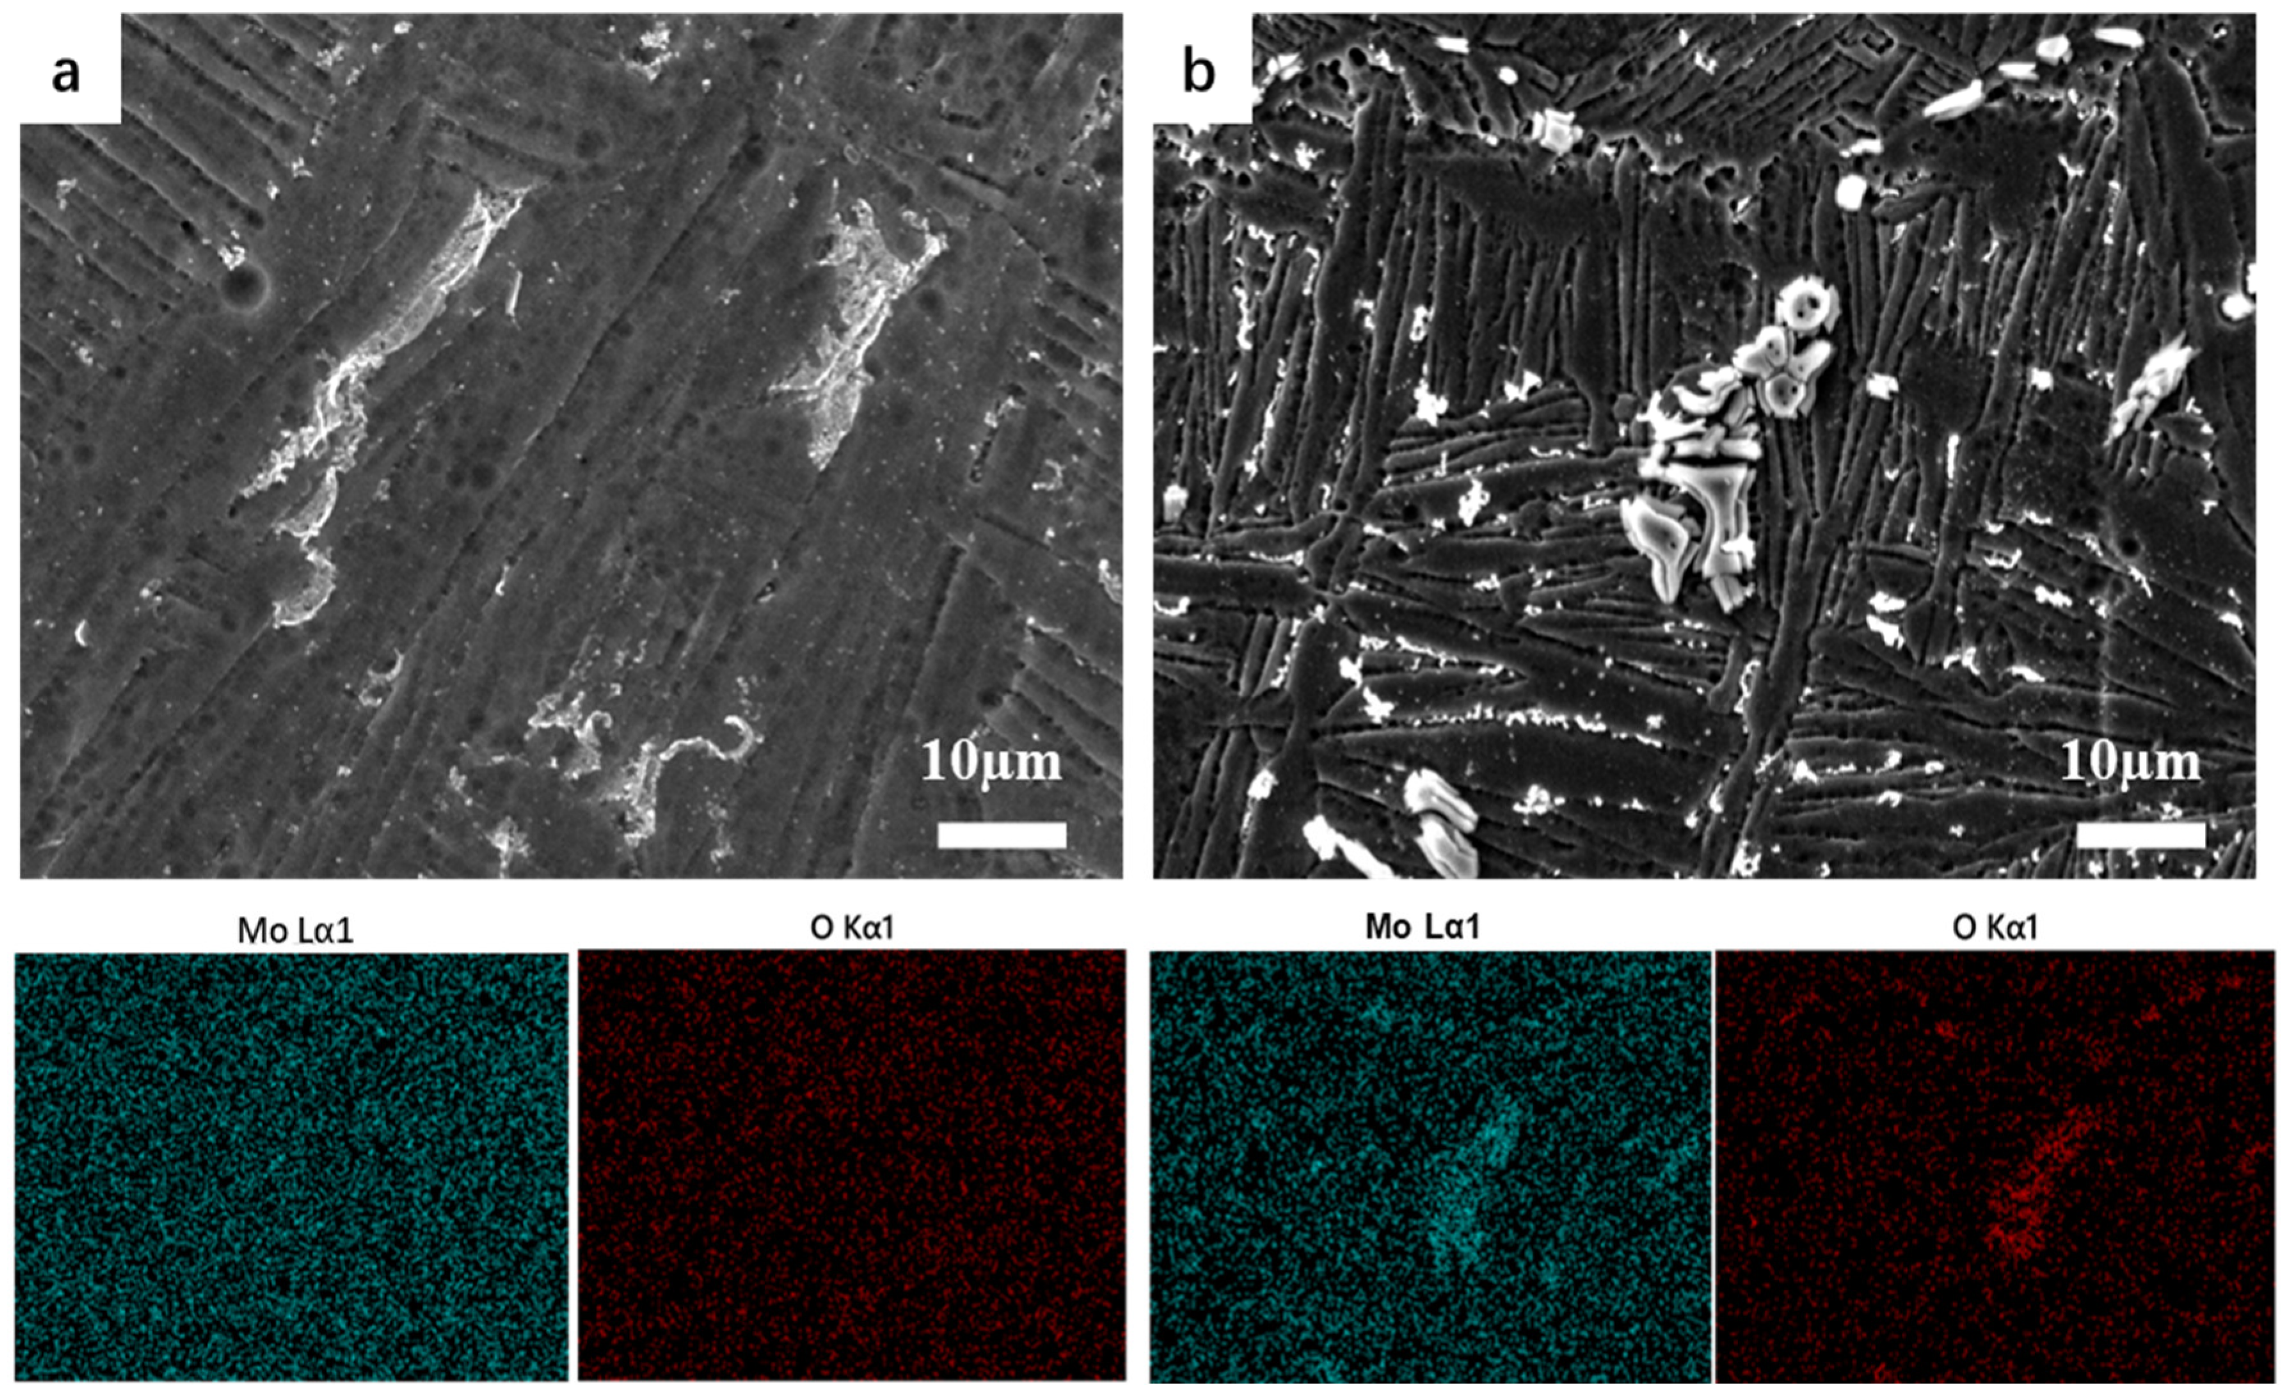
3.2. Microstructure Evolution after B Addition

Based on the previous stage of work, we selected the optimized alloy TA5.9-0.6Y for the next step of adding the boron element. Figure 5 shows the typical SEM structure of the TA5.9-0.6Y-yB cast alloy. Comparing Figure 5a,b, TiB whiskers (such as the white needle-like phase in a yellow circle) growing at the grain boundaries after adding the B element can be observed. Additionally, the α phase at the grain boundaries appears to be gradually replaced with TiB whiskers, resulting in a more distinct necklace-like arrangement. This is caused by TiB whiskers inhibiting the formation of the α phase at the grain boundaries and gradually replacing it. At this time, as the B content increases, the grain size gradually decreases, and the grain boundaries gradually become serrated. Comparing the local magnified images in Figure 5a–f, it can be observed that the grain boundaries that can be observed through the distribution of TiB whiskers gradually become blurred and the TiB whiskers begin to grow inside the grains, distributed between the α-Ti and β-Ti layer. Since TiB whiskers grow faster along the [10]] crystal plane and slower along other directions [19], the overall TiB whiskers are short rod-like ones. At this time, the average length-to-diameter ratio of whiskers was measured and compared under different amounts of B addition, and it was observed that the length-to-diameter ratio of whiskers gradually increased with the addition of boron. Table 3 shows the measurement results of the average length-to-diameter ratio of TiB, which can be seen from the data in the table; the ratio reached its upper limit of the maximum value at an addition amount of 0.8 wt%, with a value of 17.75 (l/d).
According to the analysis of Figure 6b–d, it can be observed from the EDS point scan maps of Figure 6c,d that Maps 6 and 9, respectively, display the presence of the TiB strengthening phase and yttrium-based strengthening phase. This suggests that, following the addition of the boron element, the preferred alloy in the first stage consists of TiB and Y-based strengthening phases in the matrix. The TiB strengthening phase appears as needle-shaped and the Y-based strengthening phase appears as circular particle blocks, which are independent of each other. Comparing Figure 5a,b, a large number of α bundles were found inside the original β grains. Inside a single α bundle, the α layers and residual β phases were arranged parallel to each other. After adding 0.2 wt% boron, the size of the α bundles decreased significantly, and the number of α layers within a single α bundle also decreased significantly. At the same time, the phenomenon of individual bundle descent indicates the embryonic form of the transformation from the Widmanstätten structure to the basketweave structure.
From Figure 7, it can be observed that the grain size of the titanium alloy matrix decreased even further when the boron element was added. The average grain radius decreased from 7.71 μm to 2.1 μm. At the same time, it was observed that the size of the α bundles gradually decreased, and the α-Ti mesh-like layer slices gradually differentiated and formed a chaotic interweaving structure inside a single grain. Combining the analysis results of Figure 6, it can be observed that the addition of the boron element leads to a further transformation of the titanium alloy matrix into a basketweave structure. This results in finer alloy grains and a uniform tissue structure. As shown in Figure 7f, when the addition amount reaches 0.8 wt%, both the average grain diameter and the average grain area reach a relatively stable stage, with only a slight decrease observed with further addition.
From the texture map (Figure 8), the overall texture strength of the alloy matrix decreases with the increase in the boron element. This further confirms the characteristic that the boron element will increase the uniformity of the titanium alloy tissue. A further analysis shows that when the addition amount reaches 0.8 wt%, the texture strength stabilizes at around 29 and does not show a significant decrease with further addition.

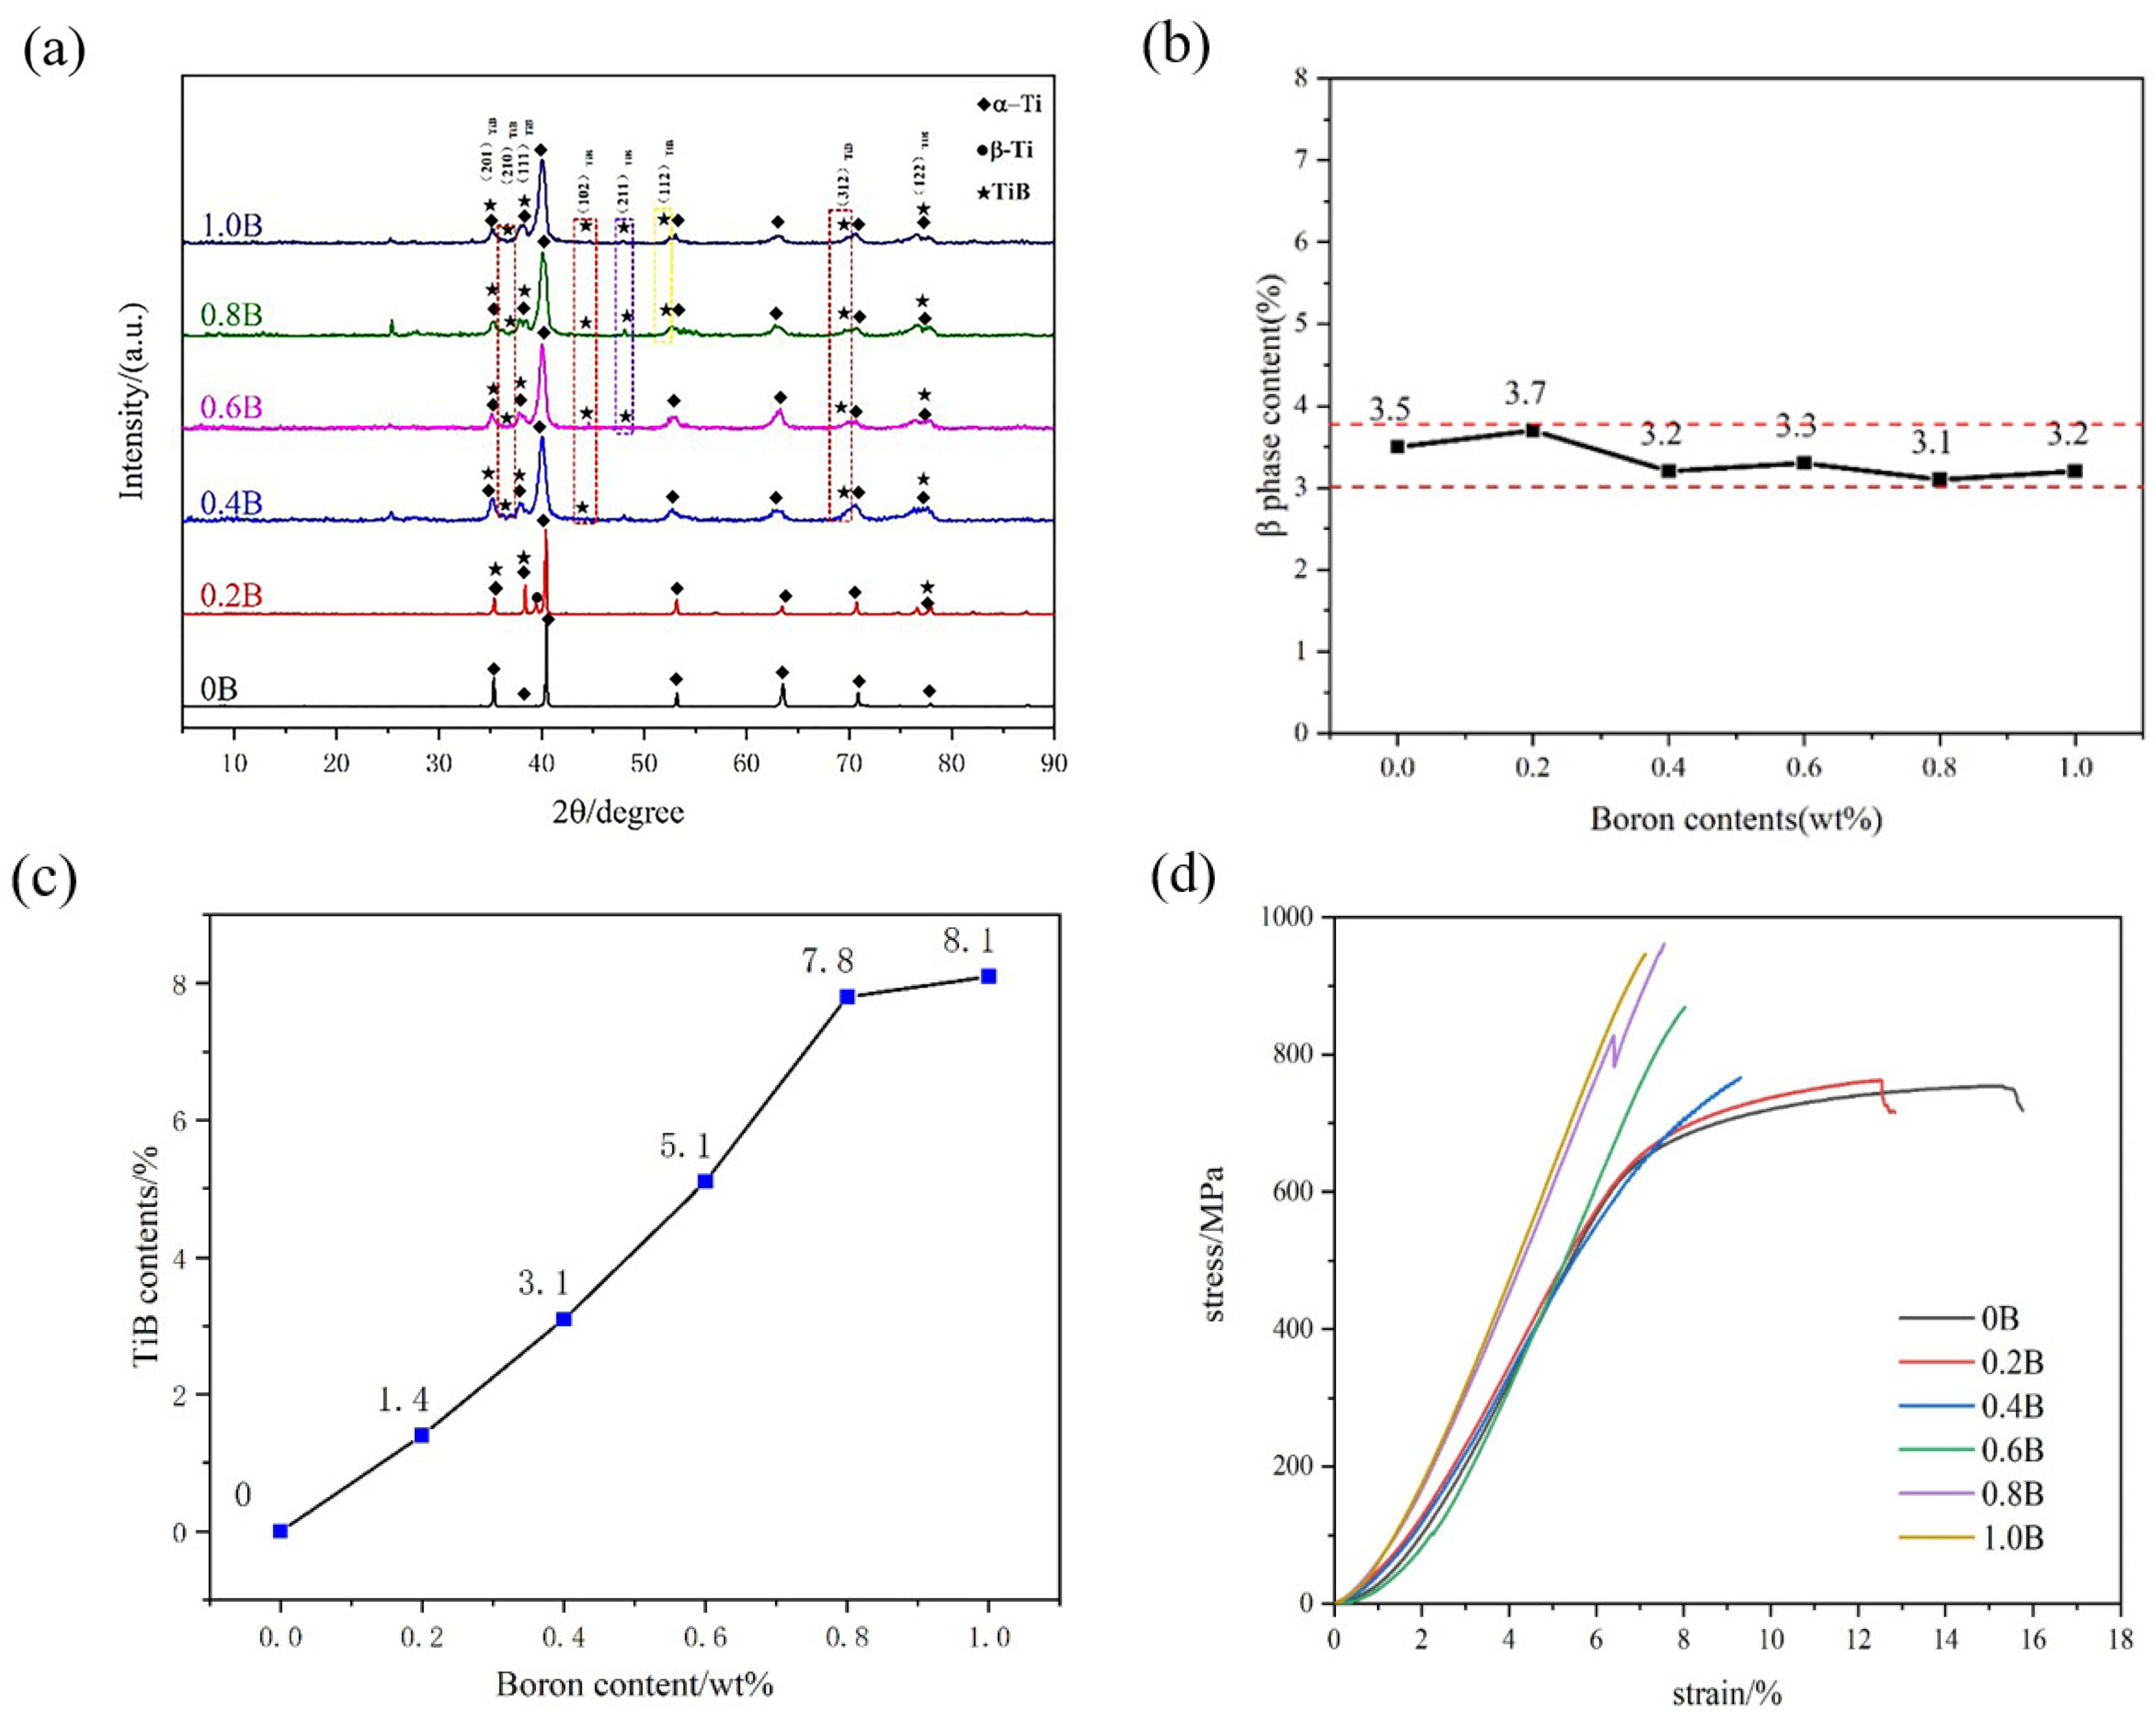
3.3. Verification of Phase and High-Temperature Tensile Mechanical Properties

Through a Jade software analysis, it was found that an increase in boron added resulted in the precipitation of more TiB phases in the alloy matrix. By comparing the data, it was found that there were no other metastable borides and intermetallic compounds in the XRD diffraction spectra of all alloys (as shown in Figure 9a). Only the TiB phase was produced, which is consistent with the thermodynamic analysis of the Ti-B reaction. In the specific statistical analysis of phase content, the β phase content in the alloy was stable between 3.0 wt% and 4.0 wt% (as shown in Figure 4b) and did not change with the increase in the boron addition amount. As shown in Figure 9c, different from most articles that use SEM scan maps to analyze the TiB phase content in small areas of the sample, this article uses an XRD data analysis to determine the overall TiB phase content measurement of the sample. (XRD scan parameters are Goniometer—Ultima IV (185 mm); Scanning Mode—2Theta/Theta; Scanning Type—Continuous Scanning; X-Ray—40 kV/40 mA; DivSlit—1/2 deg; DivH.L.Slit—10 mm; SctSlit—8.0 mm) Through the analysis, it was found that the content of the TiB phase continued to increase with the addition of boron. This finding was observed to correspond with the changes in the number and intensity of TiB diffraction peaks (as shown in Figure 10). The analysis results of TiB phase content will be used in the calculation of load transfer in the next step.
Since 600 °C is considered the “equal cohesion temperature” of near-α titanium alloys [12], it can be inferred that when the temperature exceeds 600 °C, the intergranular strength is either equal to or weaker than the intragranular strength. This leads to the corresponding mechanical test verification method for determining the optimal boron content in the matrix, which is to calculate the load transfer strength in the matrix.
ΔσLoad = σym · 0.5FVR · l/d
In the equation,
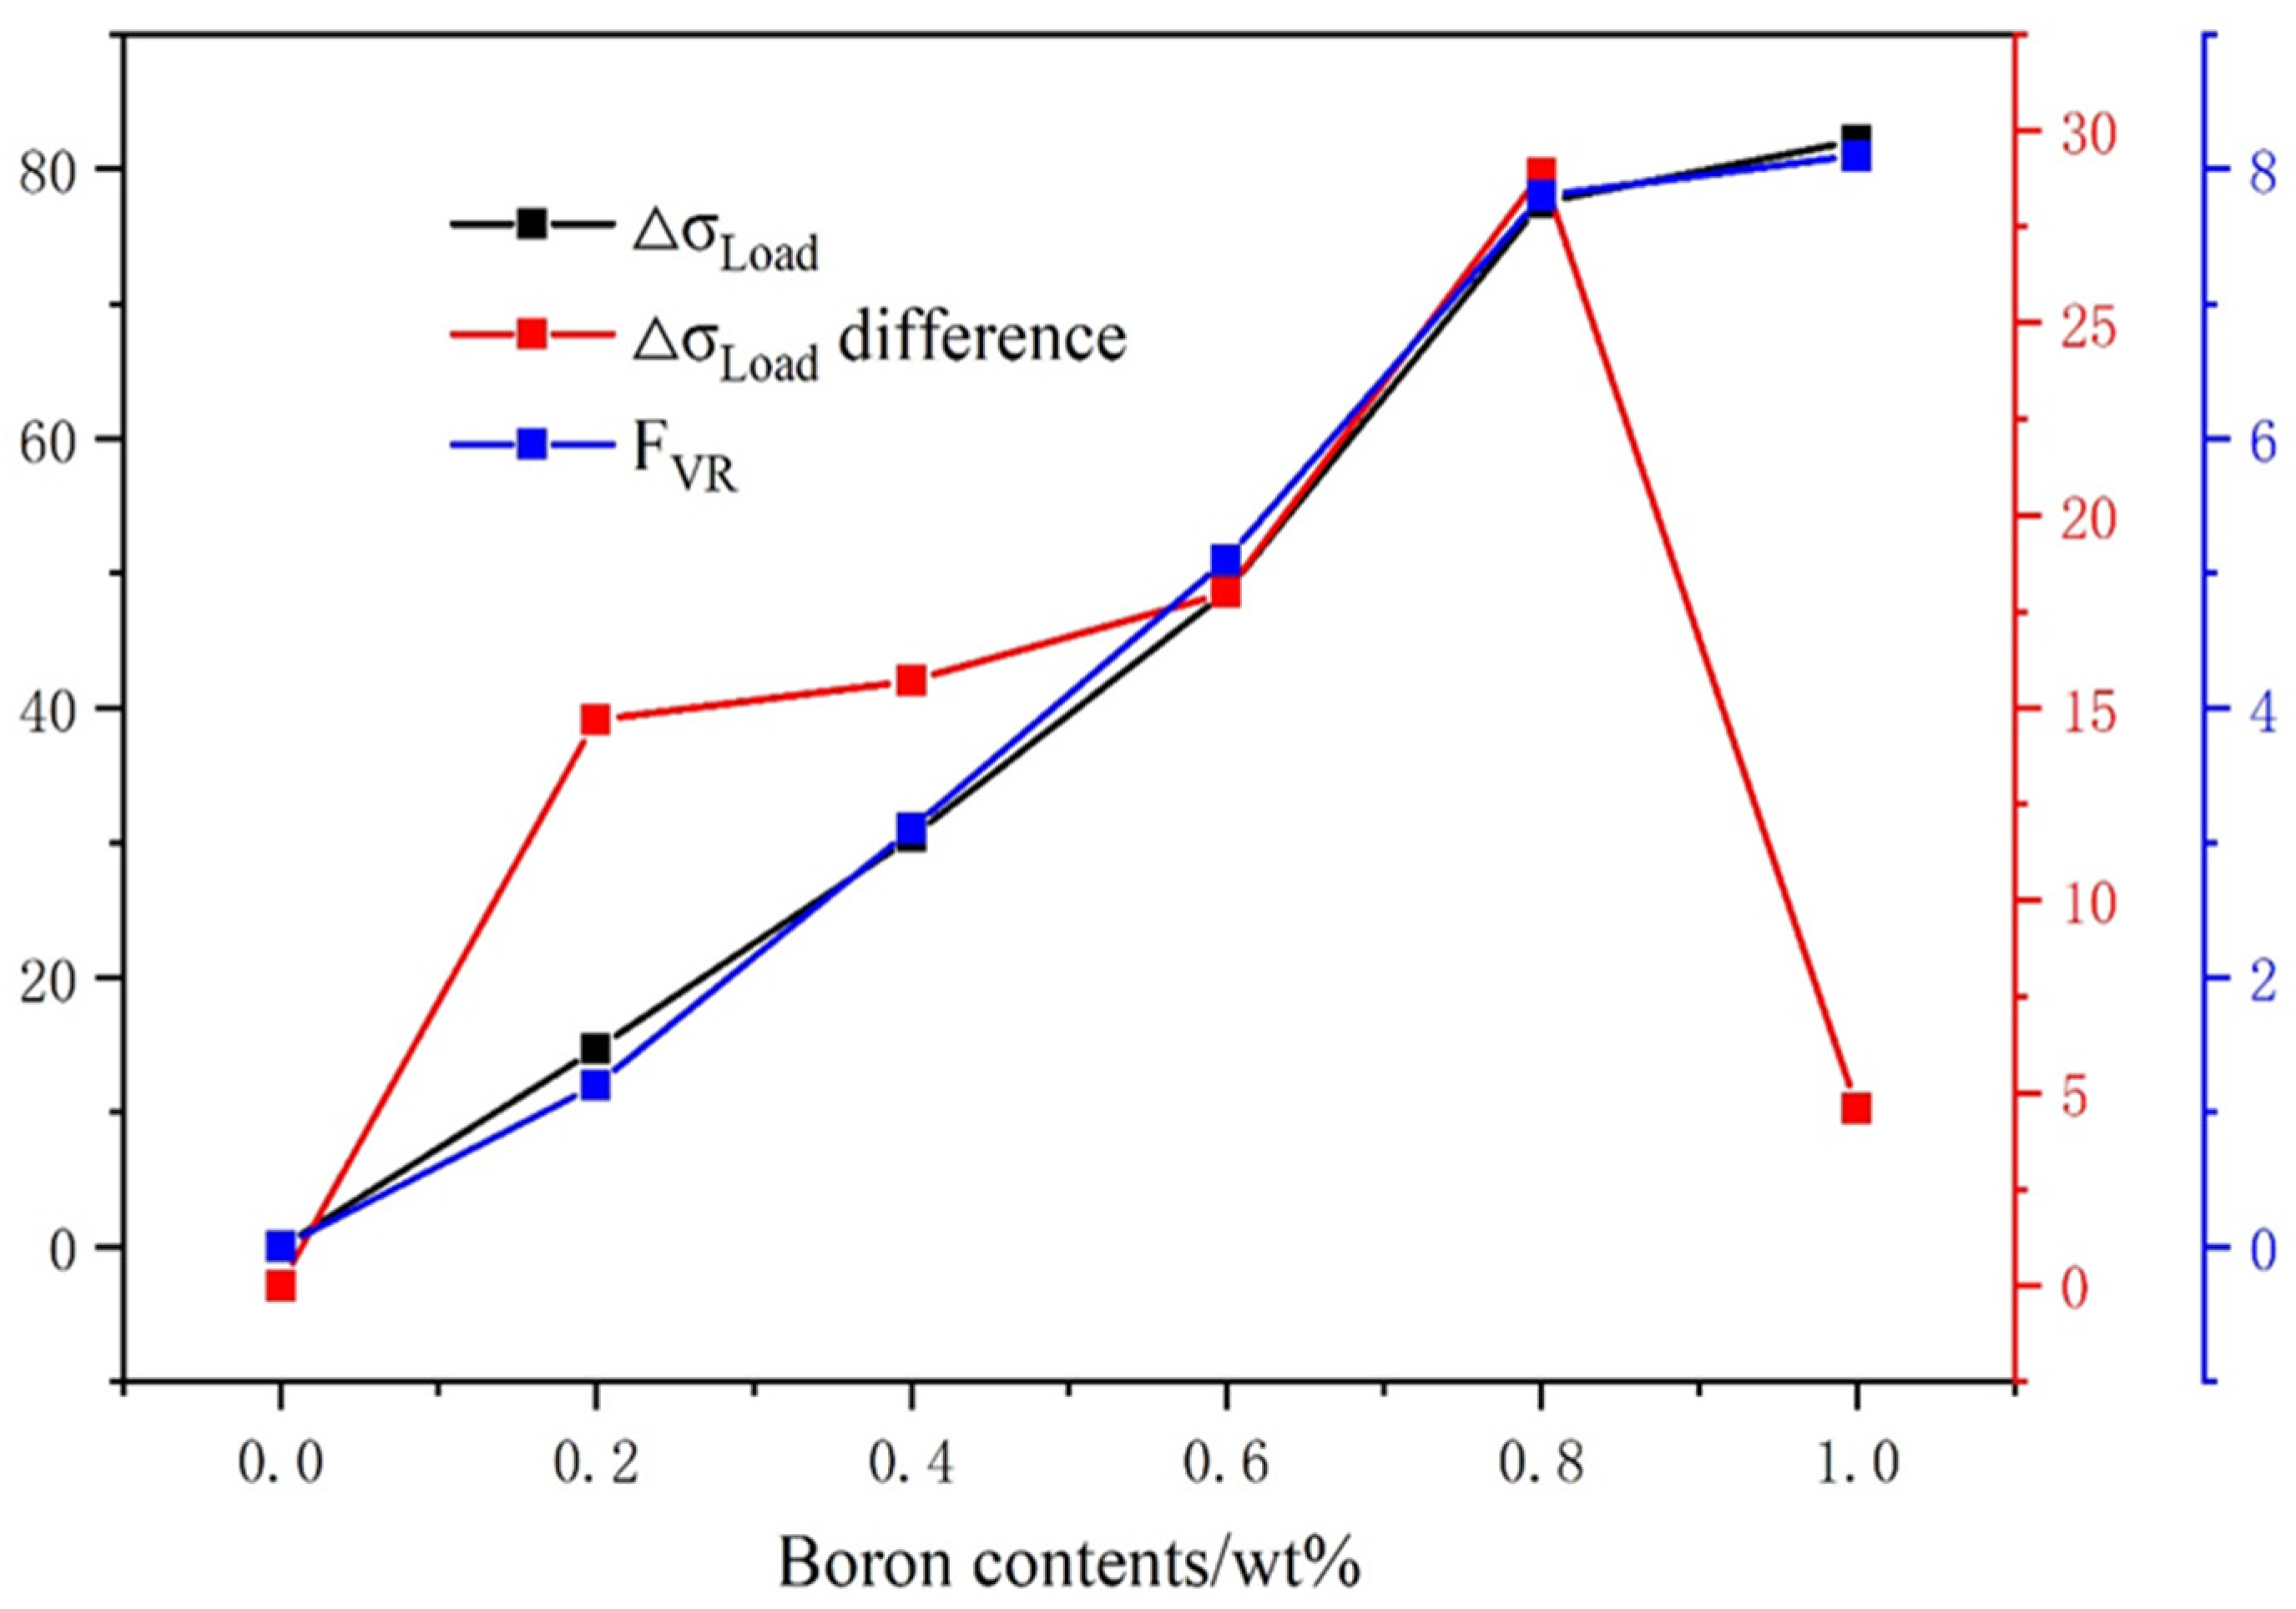
  • Δσ Load (load) bearing leads to an increase in alloy strength (MPa).
  • σym—Yield strength of matrix alloy (MPa).
  • FVR—Whisker volume fraction (vol%).
  • l/d—Whisker aspect ratio.
F VR = F W R ρ M F W R ρ R + 1 F W R ρ M
where
  • FVR is the TiB whisker volume fraction (vol%).
  • FWR—TiB whisker mass fraction (wt%).
  • ρR—Enhanced bulk density (g/cm3).
  • ρM—Matrix alloy density (g/cm3).
Combining the average length–diameter ratio of the whiskers, the mass fraction of the TiB phase, and the tensile strength results from the 500 °C tensile curve (as shown in Figure 9d), the results can be obtained by imputing them into the above formula.
This can be seen in combination with the data in Table 4, and the density of the TiB phase is about 4.54 g/cm3, while the density of the alloy matrix is close to that of the reinforced phase, which is about 4.51 g/cm3. XRD analysis data show that the FVR of 0.2–1.0 wt% is 1.2 vol%, 3.1 vol%, 5.1 vol%, 7.8 vol%, 8.1 vol%. The corresponding load 0.2–1.0 wt% values are 24.7 MPa, 30.4 Mpa, 48.6 Mpa, 87.5 Mpa, and 92.1 Mpa. From the perspective of the relative load-bearing difference, it reaches the maximum value of 28.9 Mpa when the boron addition amount reaches 0.8 wt%. The above results indicate that the load-bearing contribution value reaches its maximum when the amount of boron added reaches 0.8 wt%.

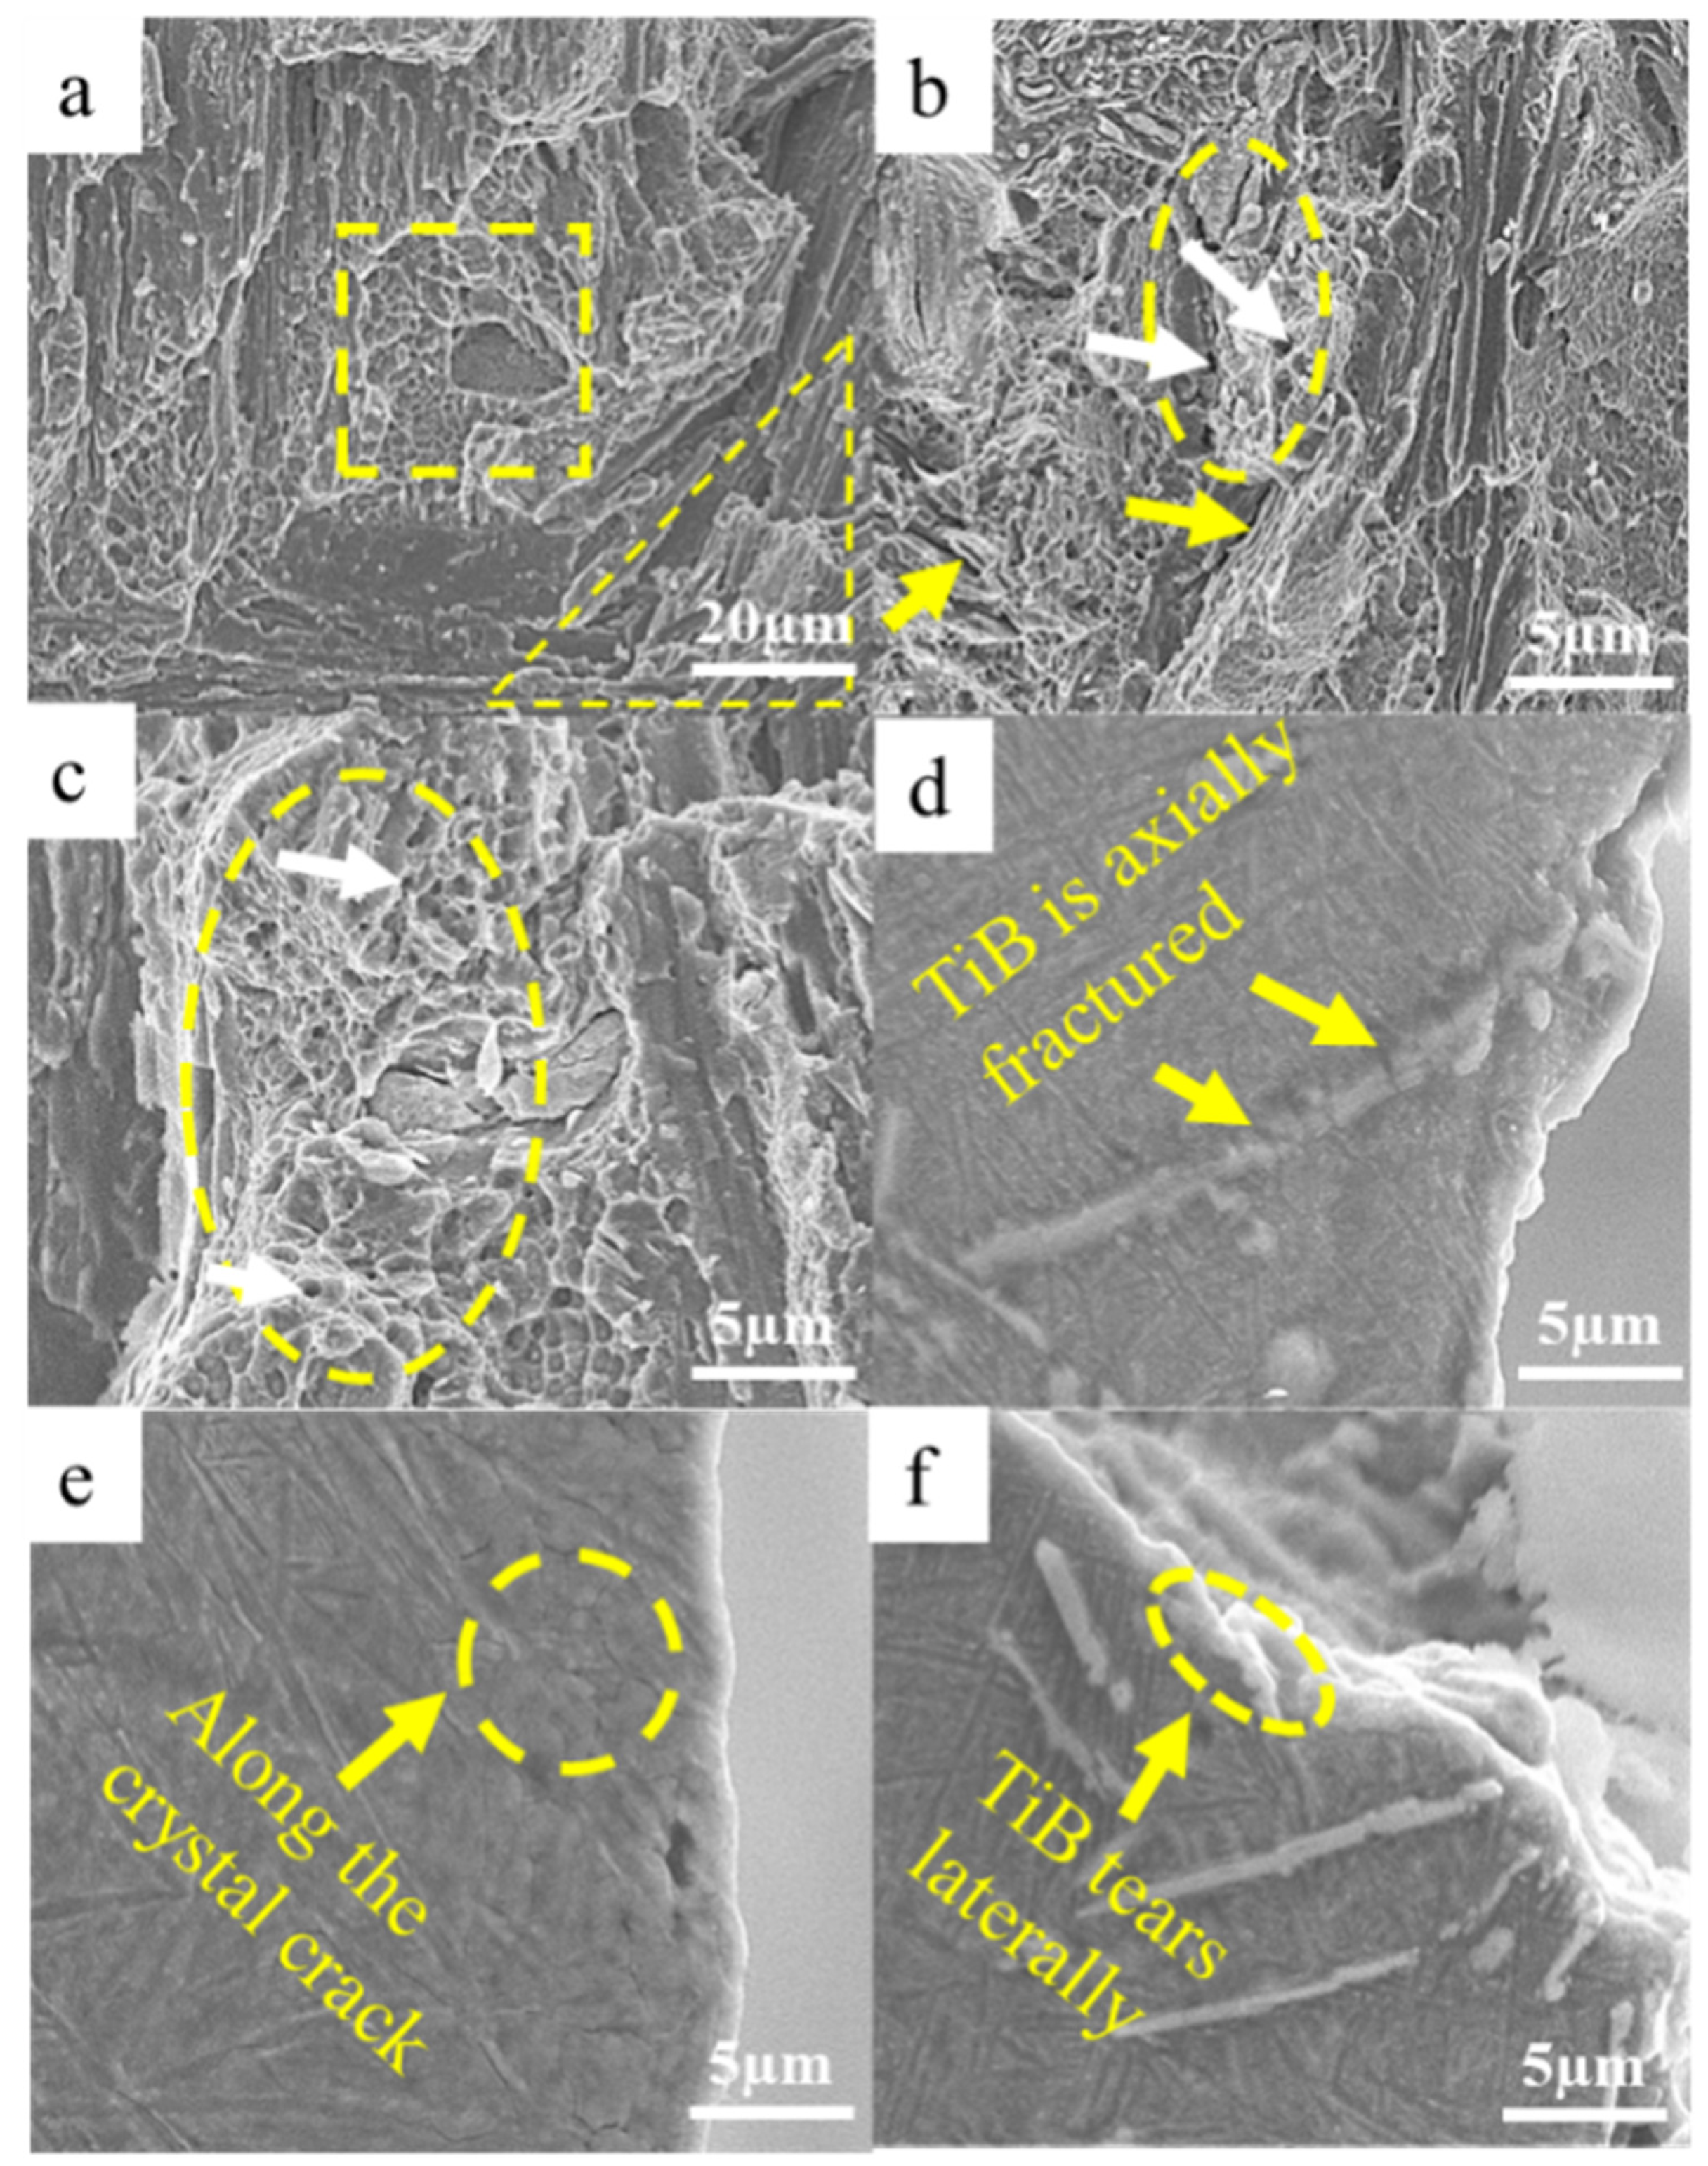
3.4. Fracture Characteristics

Figure 11 shows the fracture morphology of TA5.9-0.6Y-0.8B after tensile testing at 500 °C.
As shown in Figure 11a, the high-temperature tensile fracture diagram displays two distinct characteristic regions. One region is covered with a large number of small pits with an average size of 0.60 μm. The other region (triangle) exhibits a cleavage fracture feature. Microcracks were also found on the fracture surface of Figure 11b,c. Additionally, axial fracturing of TiB whiskers (white arrow) was found around the elliptical region. The transverse disintegration fracture feature of TiB whiskers was observed at the yellow arrow in Figure 11b. On the one hand, the fracture of TiB whiskers indicates the load-bearing effect of the reinforcement in the high-temperature tensile process. On the other hand, it also indicates that microcracks are easily generated around TiB whiskers. Therefore, although TiB whiskers improve the high-temperature strength of the matrix, they also have a significant impact on accelerating the fracture of B-containing titanium alloys. From the SEM figure of the side view of the tensile fracture in Figure 11e, there were obvious intergranular cracks in the alloy matrix during the high-temperature tensile process, indicating intergranular fracturing during the fracture process. Observing the fracture morphology of TiB whiskers in Figure 11d,f, it can be seen that TiB whiskers have two fracture modes during high-temperature tensile fracturing: axial fracture and transverse dislocation fracture. Axial fractures are visible in individual whiskers with multiple breakpoints, indicating that this fracture mode is dependent on the strength of the whiskers themselves and is caused by external force. Lateral dislocation fracturing depends more on the bonding force between TiB and the matrix. Based on the results of the second stage of the study, it can be concluded that the optimal boron content in this paper is 0.8 wt%.

4. Conclusions

With the integrated and processed experimental data, the Ti-5.9Al-4Sn-3.9Zr-3.8Mo-0.4Si-0.6Y-0.8B near-α optimized titanium alloy was successfully prepared. The following conclusions were drawn from the experimental results:
(1)
After the addition of Y, the original β grains and α grains were initially refined, resulting in an improvement in the uniformity of the matrix to some extent. Additionally, the organizational characteristics tended to shift from the as-cast Widmanstätten structure to the as-cast basketweave structure. Based on the summarized data on grain refinement and texture, it was determined that the optimal Y addition amount is 0.6 wt%.
(2)
The yttrium element can improve the mechanical properties of titanium alloys by improving the cleanliness of the matrix and making the second phase uniformly distributed in the matrix due to its strong oxygen affinity and affinity for neutral solid solution elements.
(3)
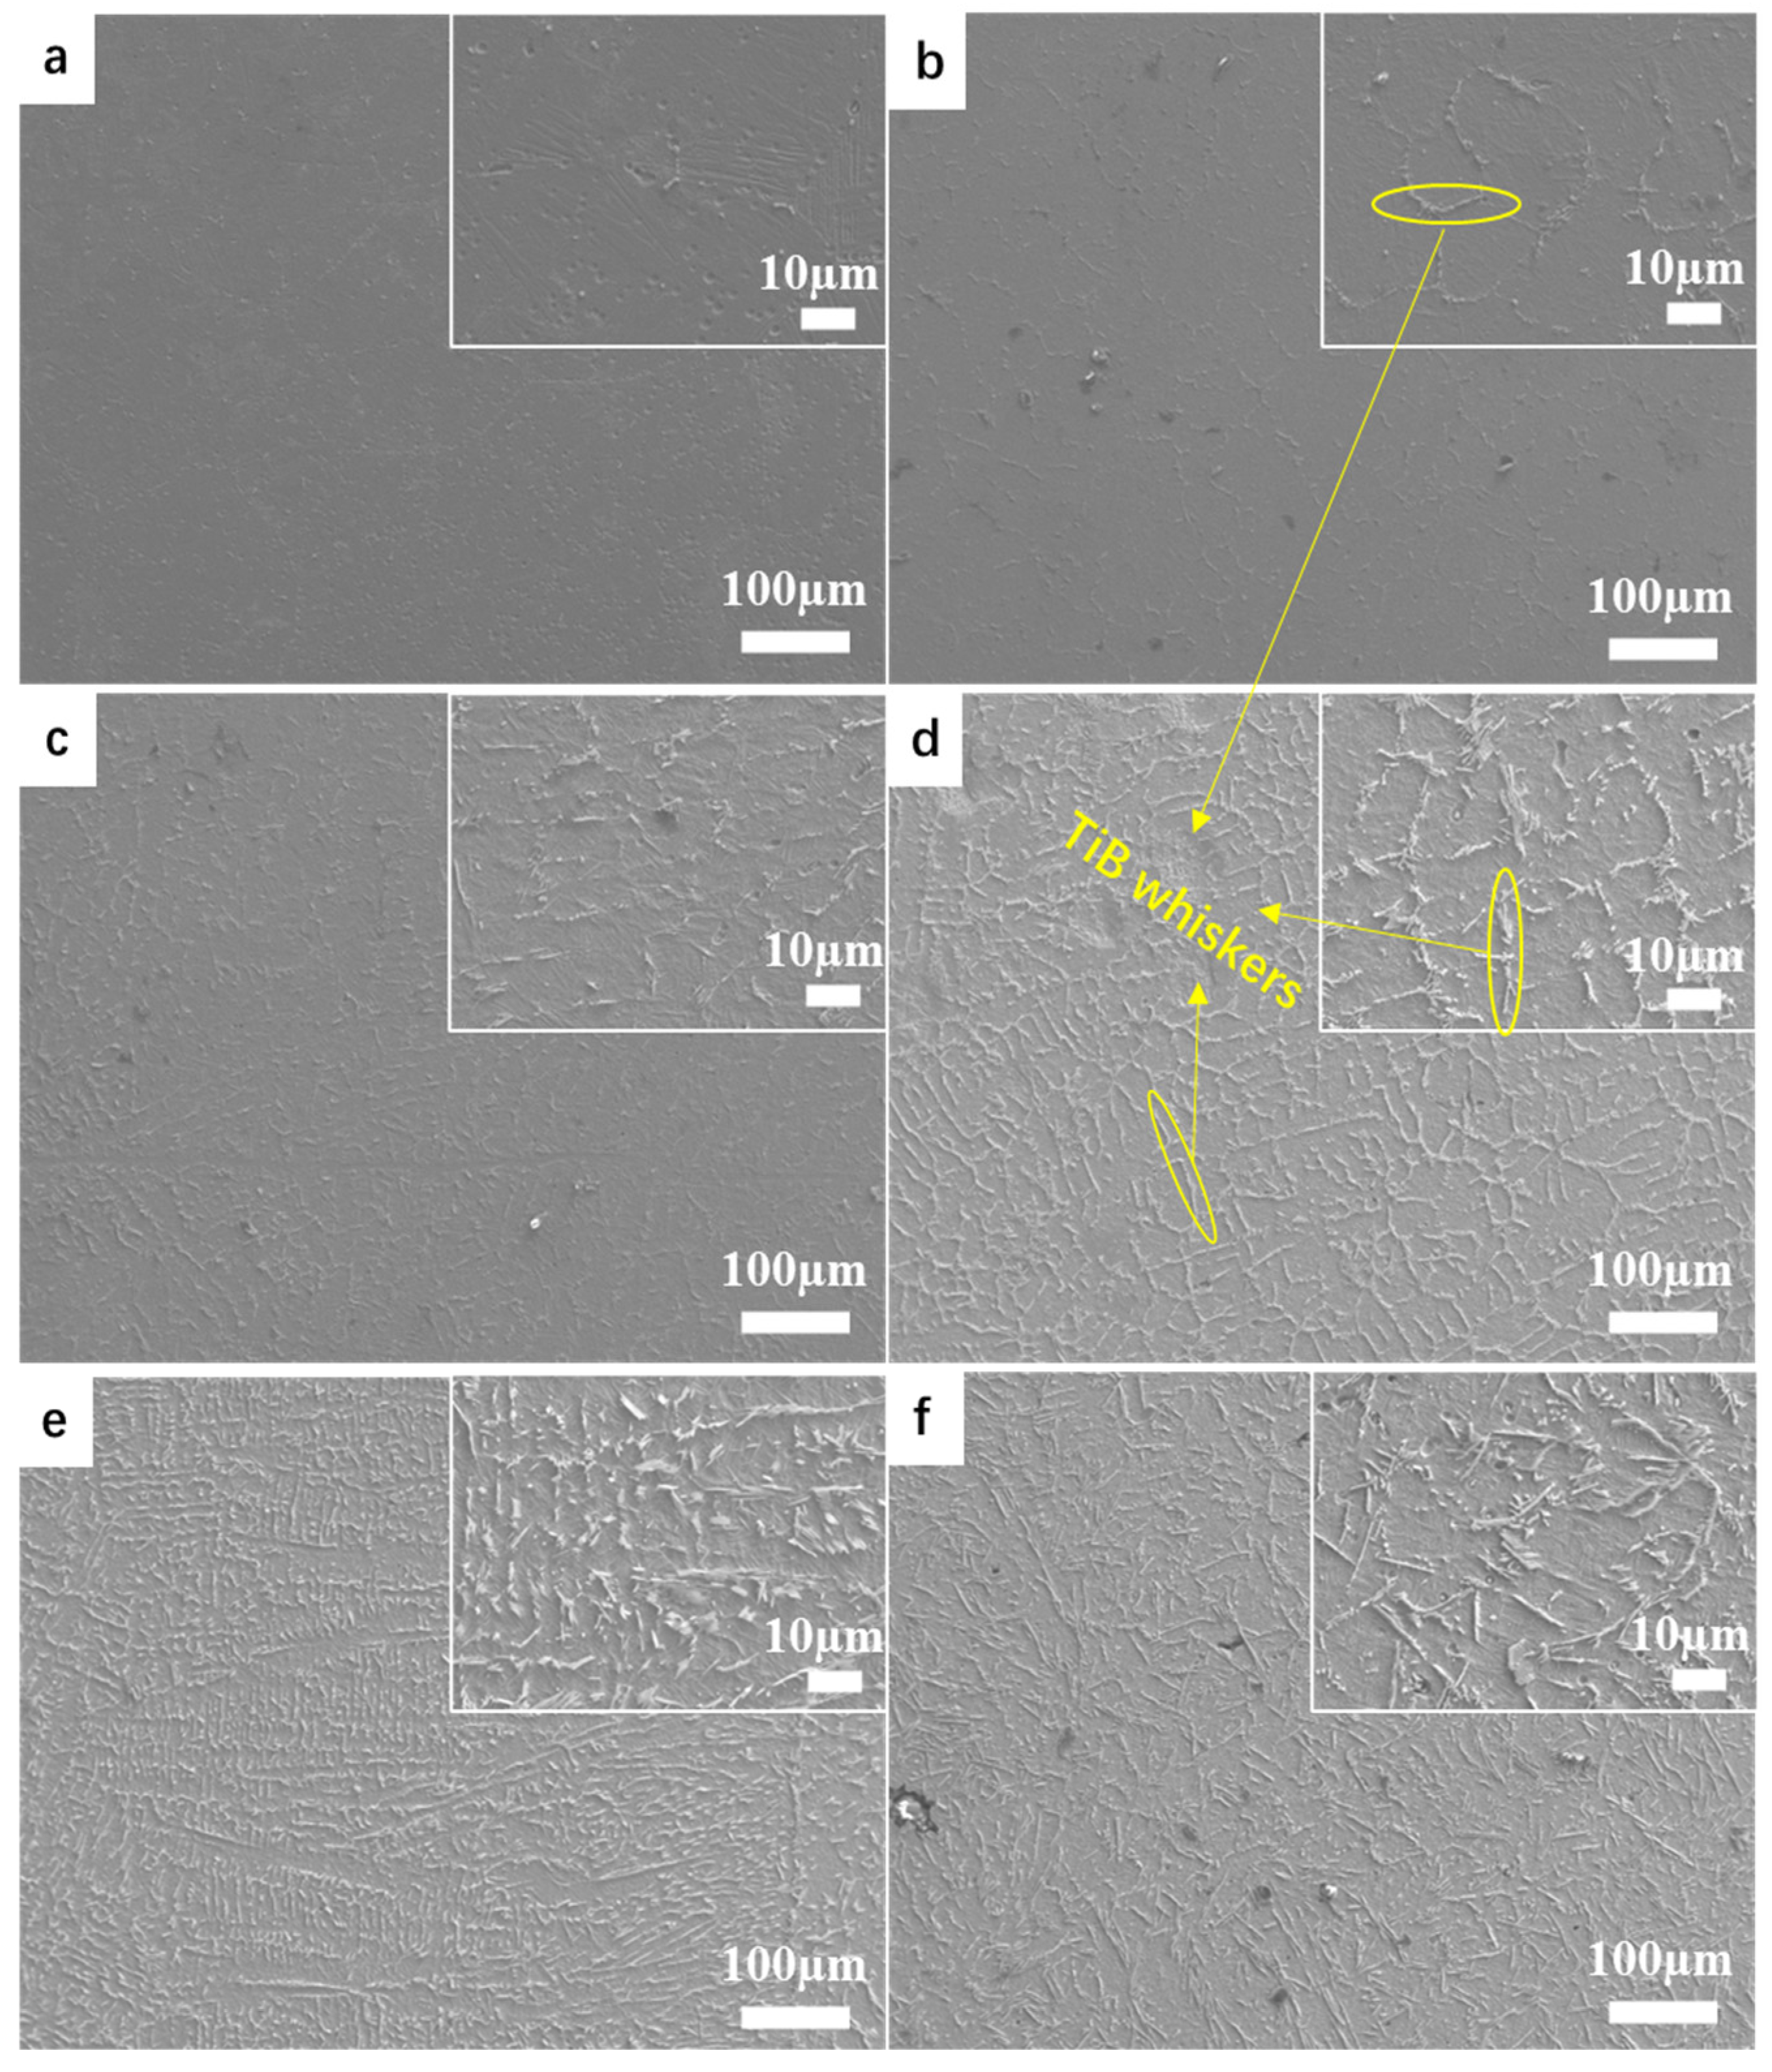
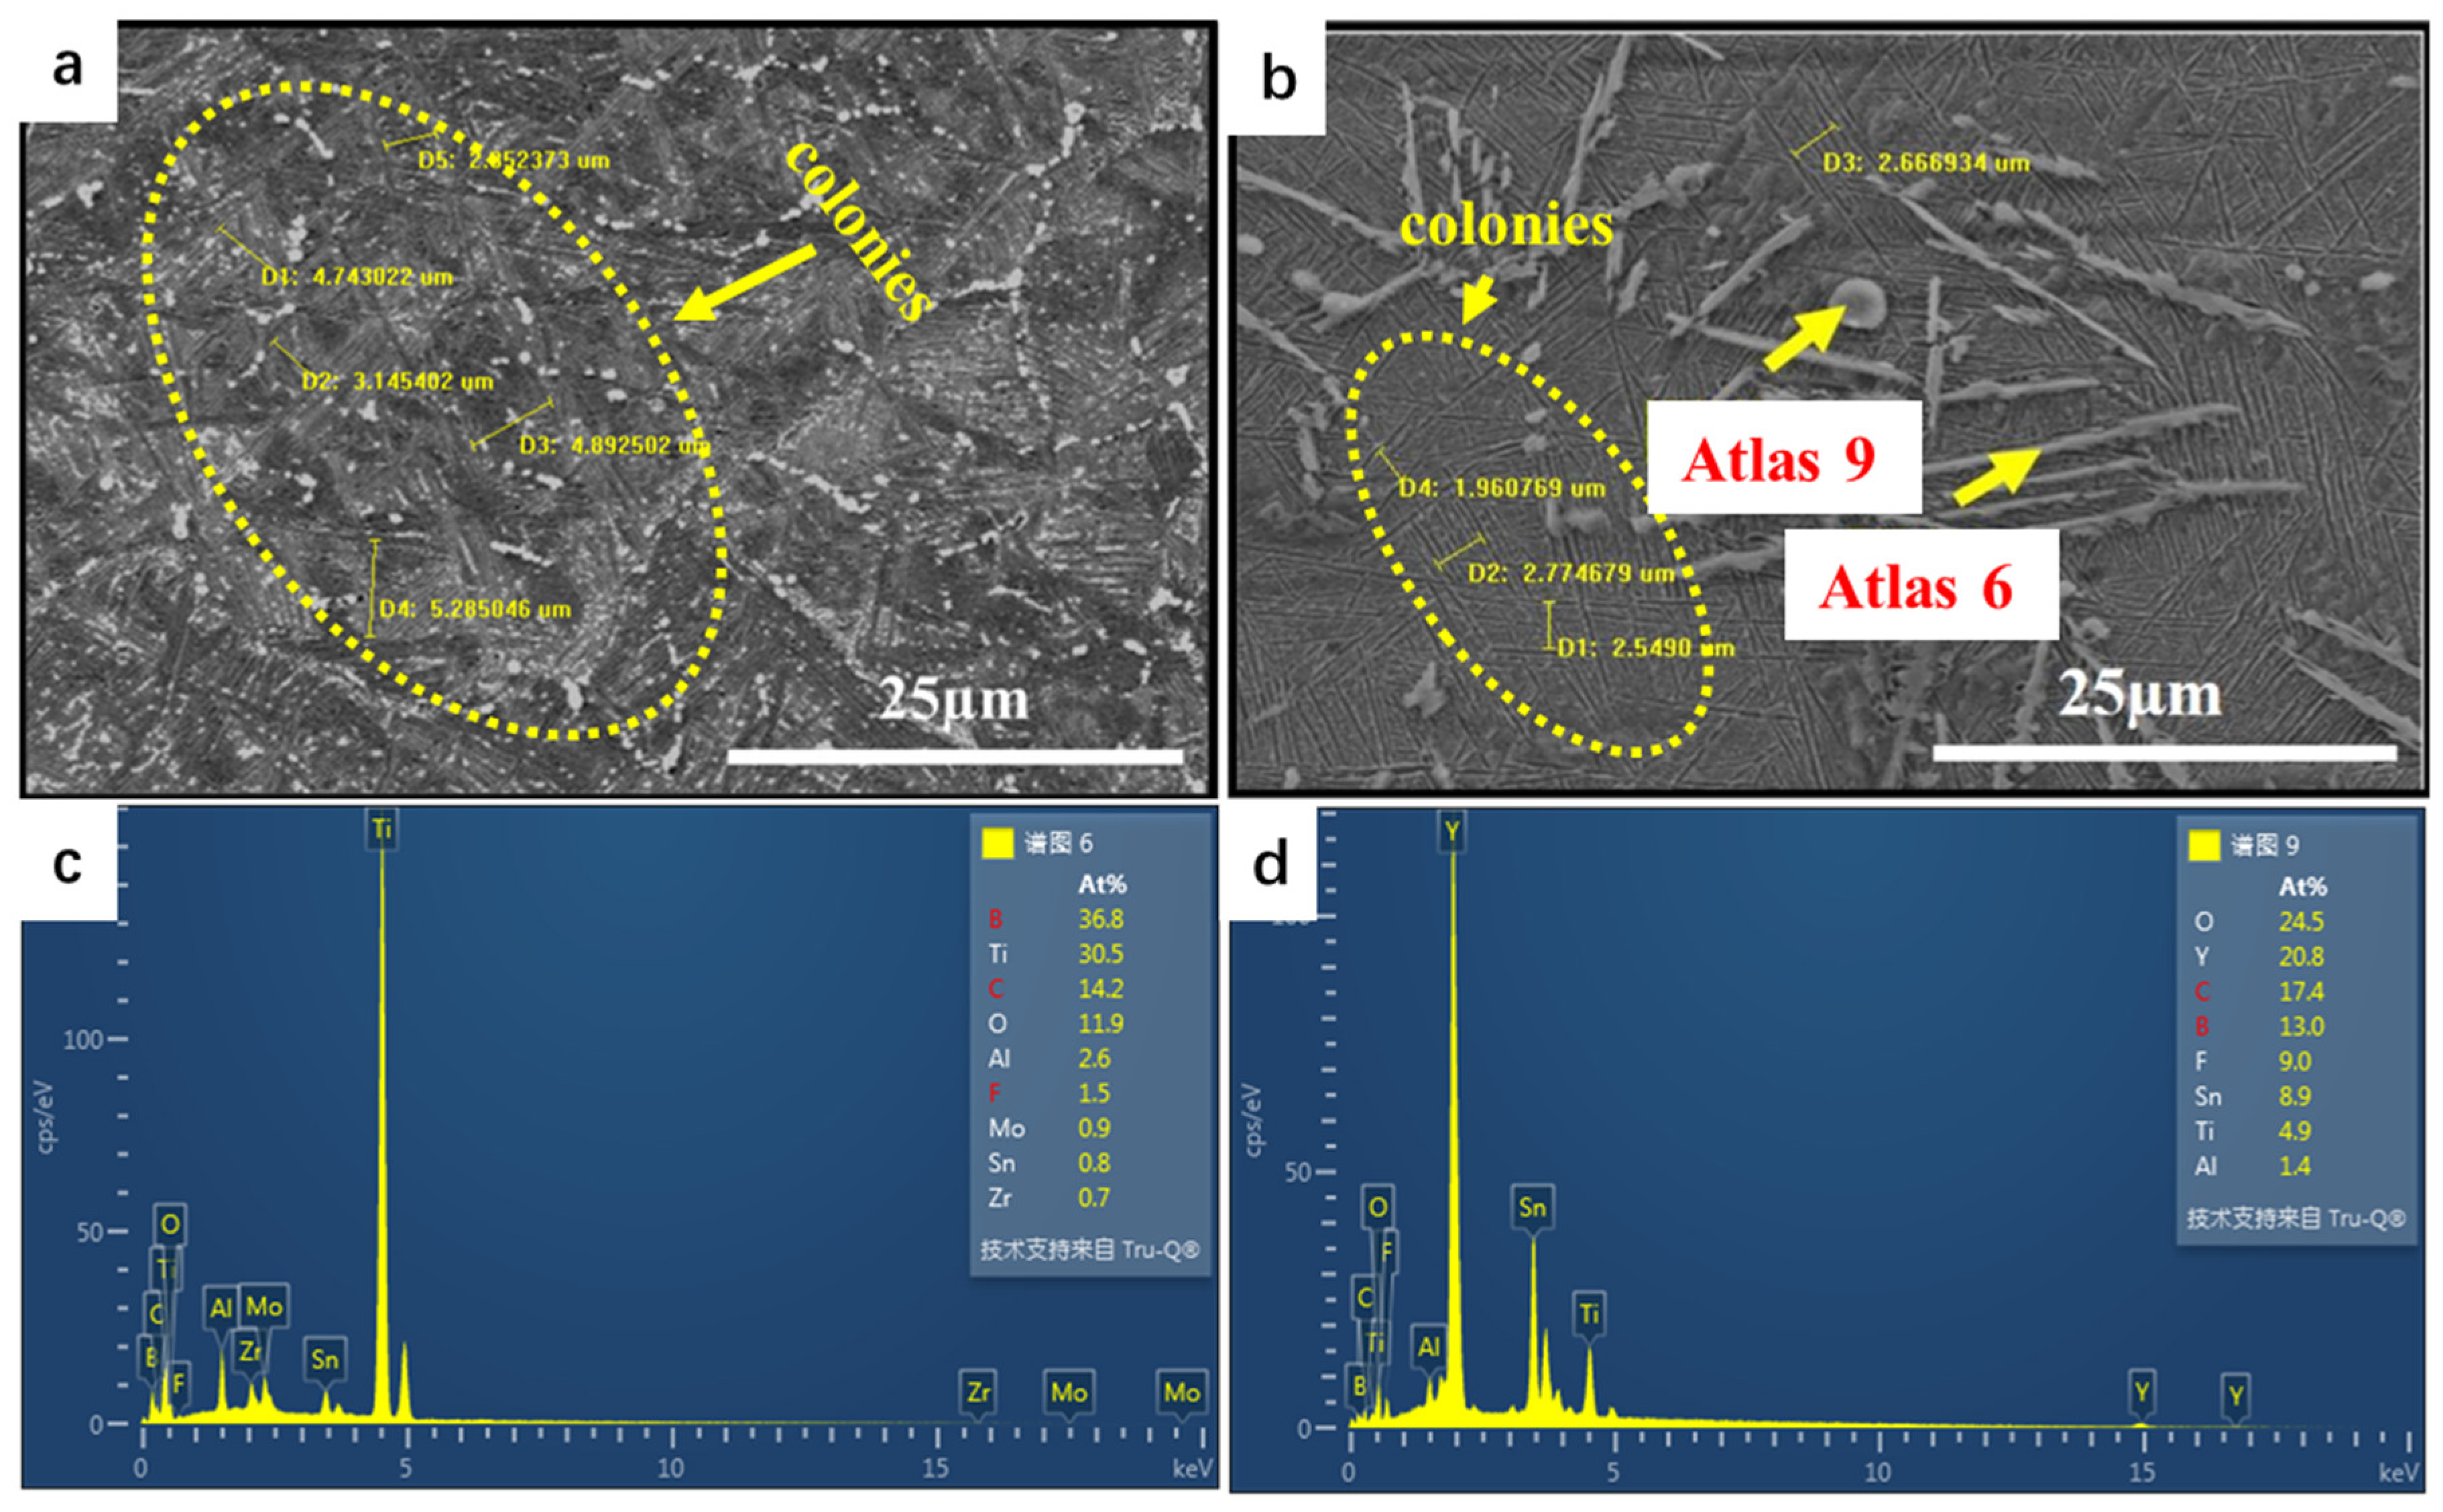
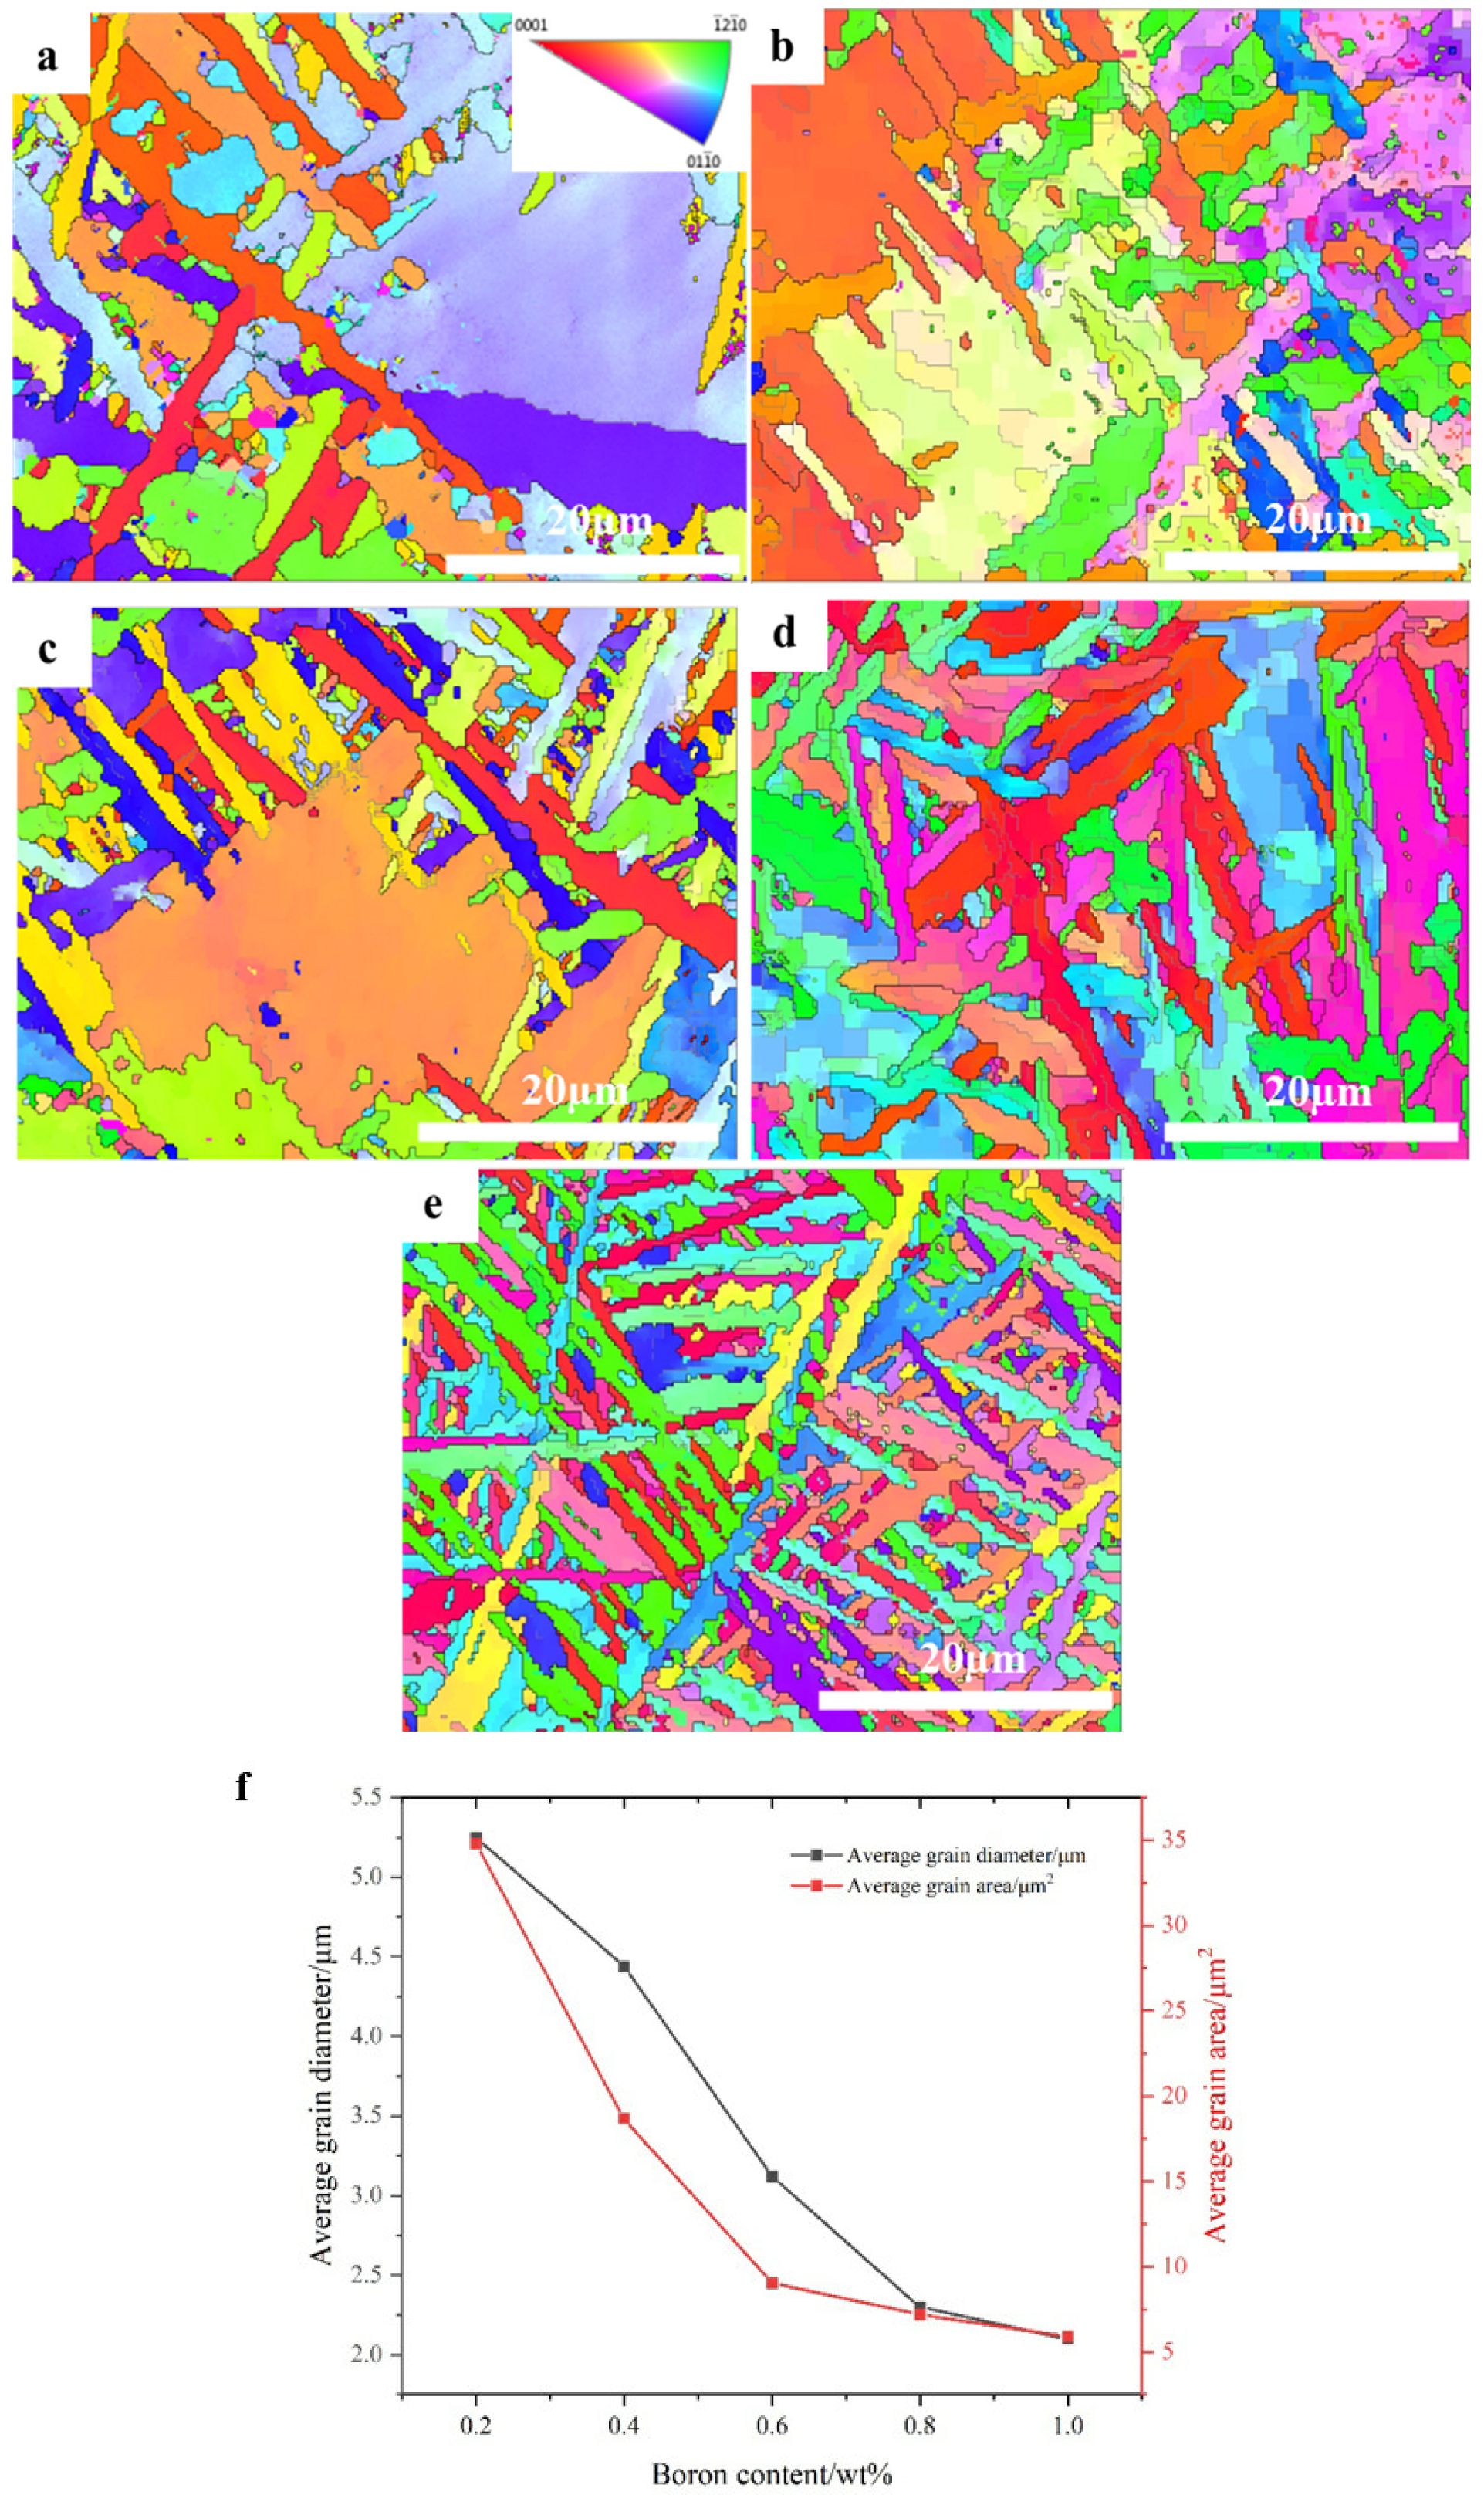
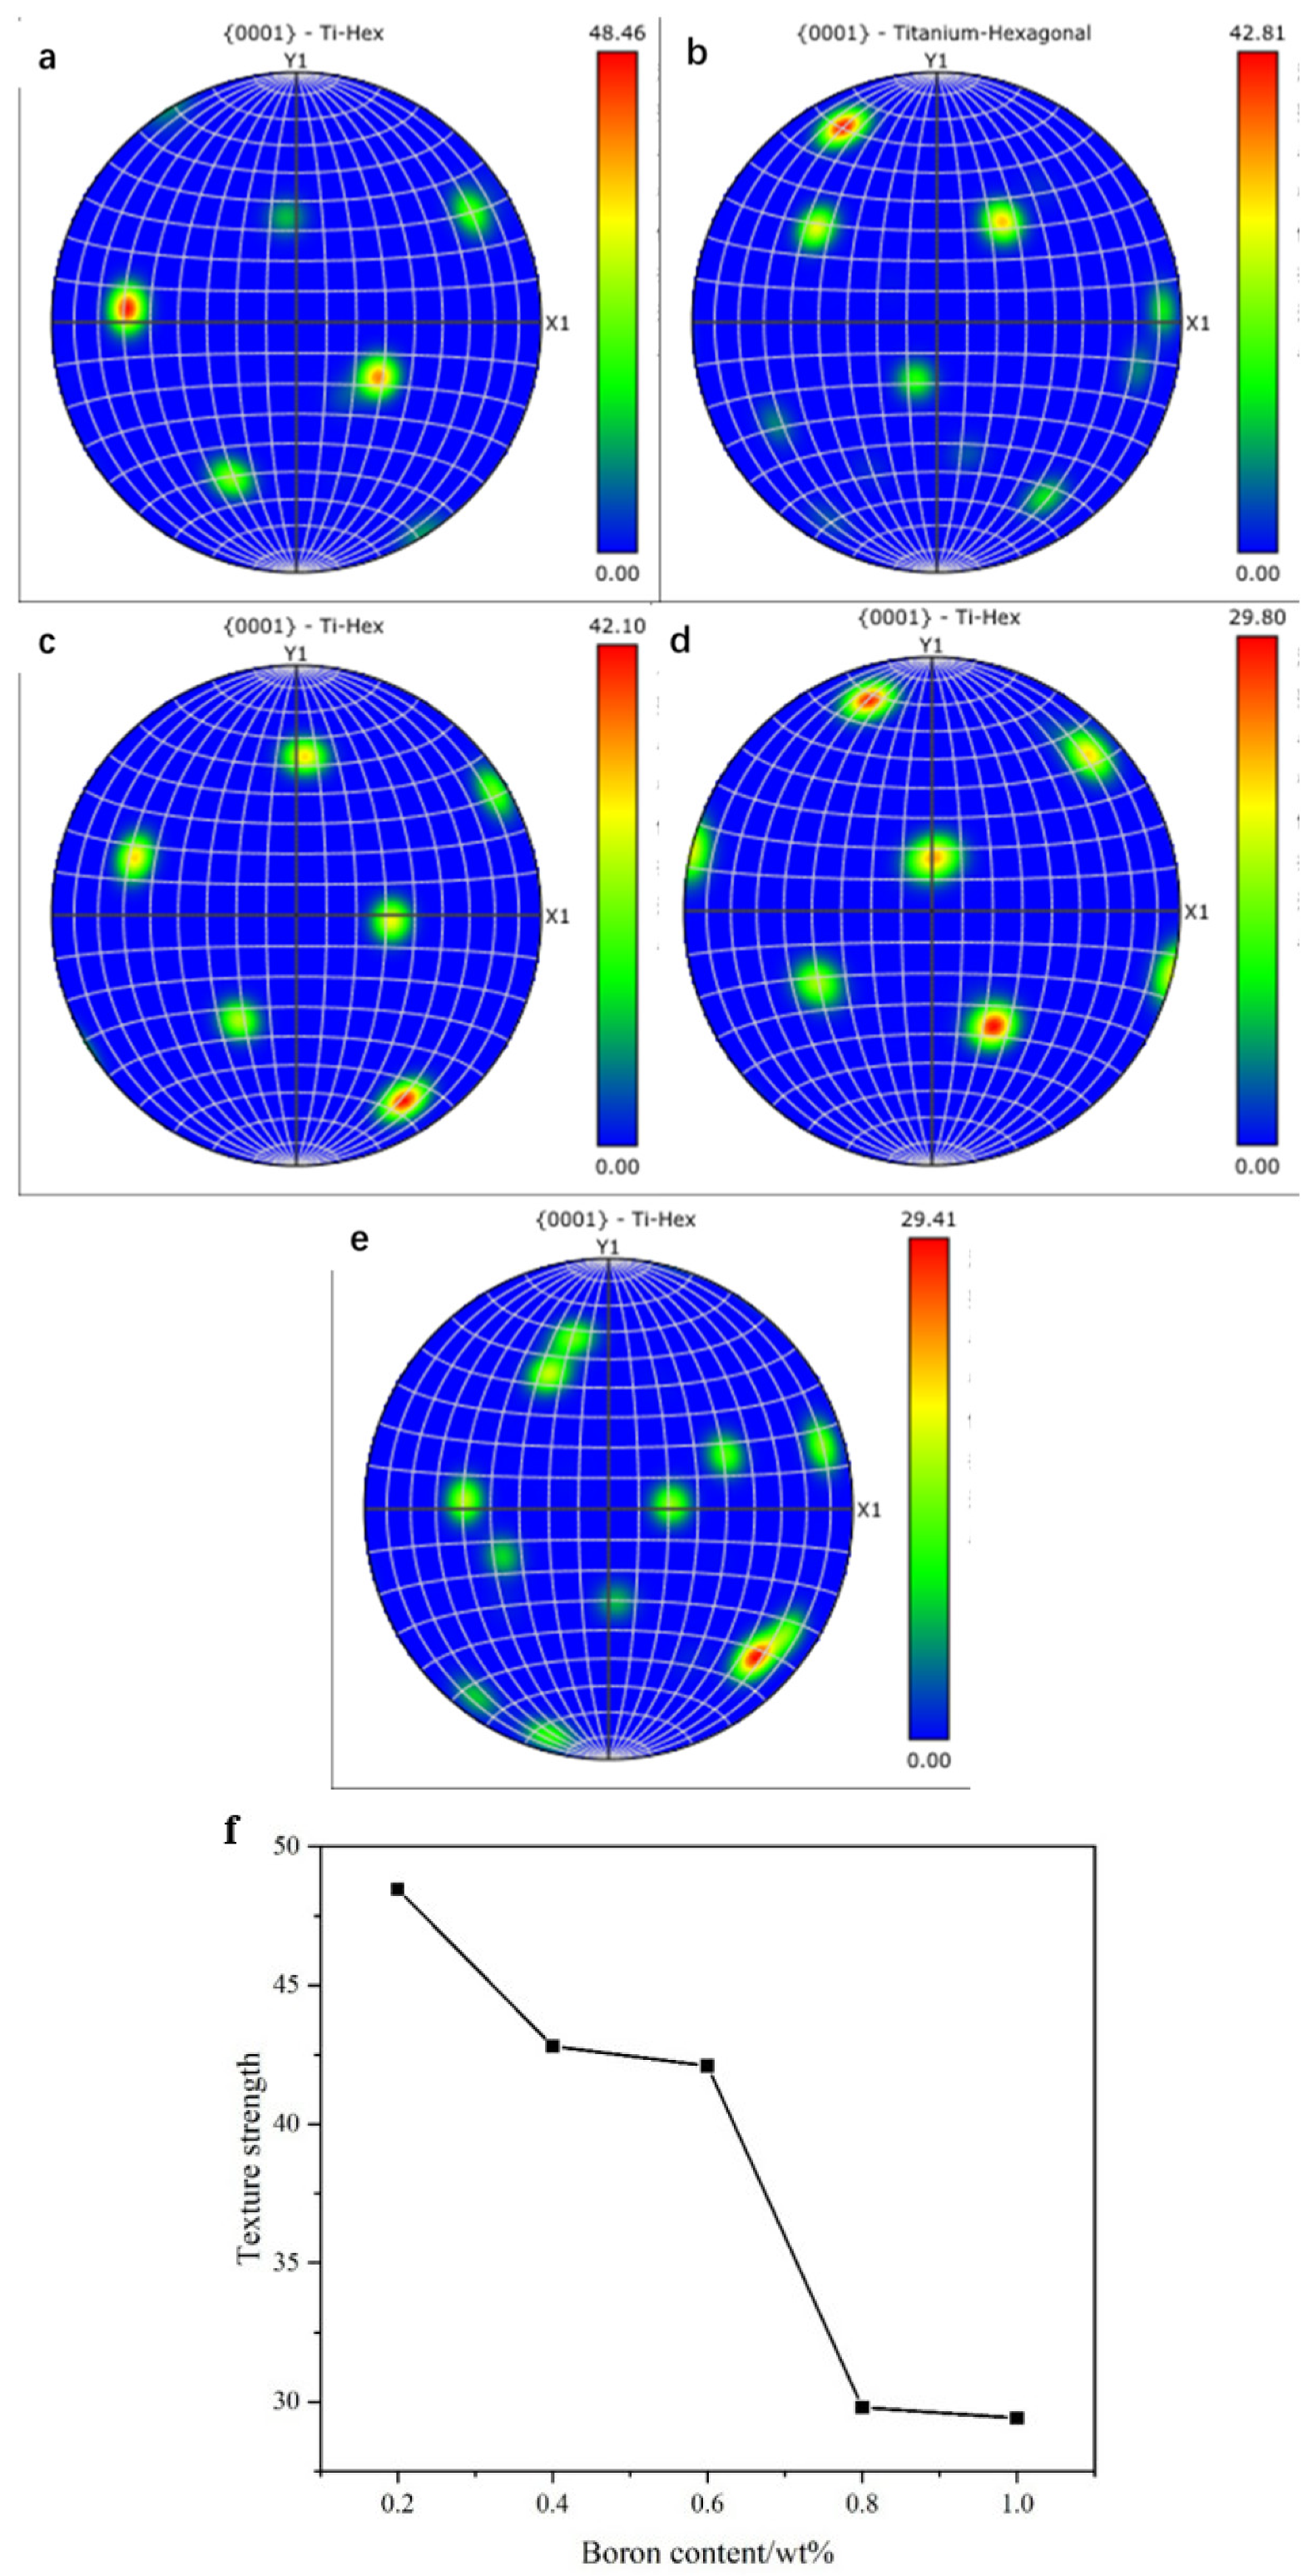
After the addition of B, the β grains and α grains in the matrix underwent further refinement. Additionally, the distribution of TiB whiskers gradually extended from the grain boundaries towards the interior of the grains. The as-cast incomplete Widmanstätten structure gradually transforms into the as-cast basketweave structure. Based on the refined grain size and texture data, the optimal boron content in the alloy matrix was found to be 0.8 wt%.
(4)
The compared results of the 500 °C tensile condition, the load-bearing calculations, and the fact that the addition of boron ceramic compounds has a significant effect on the plasticity of the matrix indicate that the contribution of the load transfer strengthening value reached its limit when the addition amount reached 0.8 wt%, providing some evidence that the optimal B addition amount is 0.8 wt%.
(5)
The analysis of the high-temperature tensile fracture reveals that the fracture characteristics of TA5.9-0.6Y-0.8B were mainly rich in toughness pits and α-layered cleavage fractures. A large number of microcracks are produced around the fracture points of TiB during the high-temperature tensile process, indicating that it accelerated the fracture rate of the matrix while improving the high-temperature strength, thereby limiting the proportion of B added to the titanium alloy matrix.
(6)
TiB whiskers of TA5.9-0.6Y-0.8B exhibit an axial fracture and transverse dislocation fracture at 500 °C. Longitudinal fracturing primarily depends on the strength of the whiskers, while transverse tearing relies more on the bonding strength between the whiskers and the matrix.
(7)
The incorporation of yttrium and boron was proven to enhance the high-temperature performance of titanium alloys. In the high-temperature tensile process, the optimized alloy exhibits an elongation rate of 8%, which is 3% higher than the boron addition quantity mentioned in the literature [18,19].
(8)
The microstructural observations combined with load transfer calculations and the fracture analysis of the logic chain confirm that the addition of 0.8 wt% boron is a reliable choice. The ultimately optimized alloy exhibits a high strength of 950 MPa in the high-temperature tensile experiment at 500 °C, positioning itself at the forefront of research on high-temperature, high-strength titanium alloys.

Author Contributions

Y.Z. and Y.P. worked on the conceptualization; P.Z. and Y.H. developed the methods and carried out the planning of the samples. Y.P. and D.W. prepared and measured the samples. Y.P. and X.T. prepared the original draft. All authors critically revised the manuscript. All authors have read and agreed to the published version of the manuscript.

Funding

This research received no external funding. The publication of this article was funded by the Open Access fund of the Southwest Jiaotong University.

Data Availability Statement

There is no publicly available support for the data.

Conflicts of Interest

The authors declare no conflict of interest.

References

  1. Williams, J.C.; Starke, E.A. Progress in structural materials for aerospace systems. Acta Mater. 2003, 51, 5775–5799. [Google Scholar] [CrossRef]
  2. Chen, R.; Hui, S.X.; Ye, W.J.; Yu, Y.; Mi, X.J.; Lee, D.G.; Lee, Y.T. High-temperature deformation behaviors of Ti-2Al-9.2Mo-2Fe alloy with boron. Rare Met. 2023, 42, 1695–1705. [Google Scholar] [CrossRef]
  3. Ma, X.; Xiang, Z.; Tan, C.; Wang, Z.; Liu, Y.; Chen, Z.; Shu, Q. Influences of boron contents on microstructures and mechanical properties of as-casted near α titanium alloy. J. Mater. Sci. Technol. 2021, 77, 1–18. [Google Scholar] [CrossRef]
  4. Narayana, P.L.; Wong, S.K.; Hong, J.-K.; Reddy, N.S.; Yeom, J.-T. Tensile properties of a newly developed high-temperature titanium alloy at room temperature and 650 °C. Mater. Sci. Eng. A 2018, 718, 287–291. [Google Scholar] [CrossRef]
  5. Cai, J.; Hao, M.; Li, X.; Ma, J.; Cao, C. Study on composition character and microstructure of BT36 high temperature Ti alloy. Mater. Eng. 2000, 2, 10–12. [Google Scholar] [CrossRef]
  6. Zhao, J.; Ding, H.; Hou, H.; Li, Z. Influence of hydrogen content on hot deformation behavior and microstructural evolution of Ti600 alloy. J. Alloys Compd. 2010, 491, 673–678. [Google Scholar] [CrossRef]
  7. Liu, Y. Effect of Microalloying on Microstructure and Properties of New 650 °C High-Temperature Titanium Alloy; Beijing University of Technology: Beijing, China, 2019. [Google Scholar] [CrossRef]
  8. Wang, Q.; Liu, J.; Yang, R. Current status and prospect of high-temperature titanium alloys. J. Aeronaut. Mater. 2014, 34, 1–26. [Google Scholar] [CrossRef]
  9. Zhang, C.J.; Li, X.; Zhang, S.Z.; Chai, L.H.; Chen, Z.Y.; Kong, F.T.; Chen, Y.Y. Effects of direct rolling deformation on the microstructure and tensile properties of the 2.5 vol% (TiBw + TiCp)/Ti composites. Mater. Sci. Eng. A 2017, 684, 645–651. [Google Scholar] [CrossRef]
  10. Li, W.Y.; Chen, Z.Y.; Liu, J.R.; Zhu, S.X.; Sui, G.X.; Wang, Q.J. Rolling texture and its effect on tensile property of a near-α titanium alloy Ti60 plate. J. Mater. Sci. Technol. 2019, 35, 790–798. [Google Scholar] [CrossRef]
  11. Boehlert, C.J.; Tamirisakandala, S.; Curtin, W.A.; Miracle, D.B. Assessment of in situ TiB whisker tensile strength and optimization of TiB-reinforced titanium alloy design. Scr. Mater. 2009, 61, 245–248. [Google Scholar] [CrossRef]
  12. Qu, J.P.; Zhang, C.J.; Zhang, S.Z.; Han, J.C.; Chai, L.H.; Chen, Z.Y.; Chen, Y.Y. Relationships among reinforcement volume fraction, microstructure and tensile properties of (TiBw/TiCp)/Ti composites after (α+β) forging. Mater. Sci. Eng. A 2017, 701, 16–23. [Google Scholar] [CrossRef]
  13. Ma, F.C.; Lu, S.Y.; Liu, P.; Li, W.; Liu, X.K.; Chen, X.L.; Zhang, K.; Pan, D. Evolution of strength and fibers orientation of a short-fibers reinforced Ti-matrix composite after extrusion. Mater. Des. 2017, 126, 297–304. [Google Scholar] [CrossRef]
  14. Tuo, X.M.; Li, N. Effect of yttrium on microstructure and properties of high temperature alloys. Rare Met. 1999, 18, 149–153. [Google Scholar] [CrossRef]
  15. Li, B.H.; Kong, F.T.; Chen, Y.Y. Effect of yttrium addition on microstructures and room temperature tensile properties of Ti-47Al alloy. J. Rare Earths 2006, 24, 352–356. [Google Scholar] [CrossRef]
  16. Ertuan, Z.; Yuyong, C.; Fantao, K.; Changjiang, Z.; Shulong, X. Effect of yttrium on microstructure and mold filling capacity of a near-α high temperature titanium alloy. China Foundry 2012, 9, 344–348. [Google Scholar] [CrossRef]
  17. Ma, X.Z.; Xiang, Z.L.; Ma, M.Z.; Tan, C.; Yang, Z.A.; Shen, G.L.; Chen, Z.Y.; Shu, Q. Effect of trace boron addition on microstructures, textures, mechanical properties and fracture behaviors of near a titanium alloy. Mater. Sci. Eng. A 2020, 772, 138749. [Google Scholar] [CrossRef]
  18. Gardner, H.M.; Gopon, P.; Magazzeni, C.M.; Radecka, A.; Fox, K.; Rugg, D.; Wade, J.; Armstrong, D.E.J.; Moody, M.P.; Bagot, P.A.J. Quantifying the effect of oxygen on micro-mechanical properties of a near-alpha titanium alloy. J. Mater. Res. 2021, 36, 2529–2544. [Google Scholar] [CrossRef]
  19. Ma, X. Study on the Synergistic Mechanism between Room Temperature and High Temperature Microstructure and Properties of Boron Containing High-Temperature Titanium Alloys; Beijing University of Technology: Beijing, China, 2021. [Google Scholar] [CrossRef]
Figure 1. SEM tissue micrography. (a) TA5.9, (b) TA5.9-0.1Y, (c) TA5.9-0.2Y, (d) TA5.9-0.4Y, (e) TA5.9-0.6Y, (f) TA5.9-0.8Y.
Alloys 02 00019 g001
Figure 2. Y element added before and after comparison. (a) TA5.9 SEM diagram and element distribution, (b) TA5.9-0.8Y SEM diagram and element distribution.
Alloys 02 00019 g002
Figure 3. TA5.9-xY EBSD map. (a) TA5.9-0.1Y, (b) TA5.9-0.2Y, (c) TA5.9-0.4Y, (d) TA5.9-0.6Y, (e) TA5.9-0.8Y, (f) grain trend chart.
Alloys 02 00019 g003
Figure 4. TA5.9-xY texture atlas. (a) TA5.9-0.1Y, (b) TA5.9-0.2Y, (c) TA5.9-0.4Y, (d) TA5.9-0.6Y, (e) TA5.9-0.8Y, (f) Texture strength trend chart.
Alloys 02 00019 g004
Figure 5. SEM tissue micrography. (a) TA5.9-0.6Y-0B, (b) TA5.9-0.6Y-0.2B, (c) TA5.9-0.6Y-0.4B, (d) TA5.9-0.6Y-0.6B, (e) TA5.9-0.6Y-0.8B, (f) TA5.9-0.6Y-1.0B.
Alloys 02 00019 g005
Figure 6. Includes before and after comparison chart of boron. (a) TA5.9-0.6Y-0.6 boron, (b) TA5.9-0.6Y-0 boron, (c,d) Element distribution diagram.
Alloys 02 00019 g006
Figure 7. TA5.9-0.6Y-xB EBSD tissue micrography. (a) TA5.9-0.6Y-0.2B, (b) TA5.9-0.6Y-0.4B, (c) TA5.9-0.6Y-0.6B, (d) TA5.9-0.6Y-0.8B, (e) TA5.9-0.6Y-1.0B, (f) grain trend chart.
Alloys 02 00019 g007
Figure 8. TA5.9-0.6Y-xB texture atlas. (a) TA5.9-0.6Y-0.2B, (b) TA5.9-0.6Y-0.4B, (c) TA5.9-0.6Y-0.6B, (d) TA5.9-0.6Y-0.8B, (e) TA5.9-0.6Y-1.0B, (f) texture strength trend chart.
Alloys 02 00019 g008
Figure 9. (a) TA5.9-0.6Y-xB XRD atlas, (b) β phase change diagram, (c) TiB phase change diagram, (d) TA5.9-0.6Y-xB 500 °C tensile graph.
Alloys 02 00019 g009
Figure 10. Load loading leads to an increase in alloy strength and a trend plot of change values.
Alloys 02 00019 g010
Figure 11. (ac) Forward SEM scan of the fracture surface, (df) SEM scan on the side of the fracture surface.
Alloys 02 00019 g011
Table 1. Chemical composition of TA5.9-xY (x = 0.1, 0.2, 0.4, 0.6, 0.8).
Measure PositionsChemical Elements
TiAlSnZrMoSiY
Element contentBal5.934.043.873.830.190.12
Bal5.914.073.893.780.170.19
Bal5.884.053.873.810.210.41
Bal5.894.033.913.790.240.64
Bal5.924.053.93.780.180.82
Table 2. Chemical composition of TA5.9-0.6Y-yB (y = 0.2, 0.4, 0.6, 0.8, 1.0).
Measure PositionsChemical Elements
TiAlSnZrMoSiYB
Element contentBal5.934.043.873.830.190.620
Bal5.914.073.893.780.170.590.19
Bal5.884.053.873.810.210.610.42
Bal5.894.033.913.790.240.640.58
Bal5.924.053.93.780.180.620.81
Bal5.944.023.893.770.220.611.01
Table 3. Table of changes in length-to-diameter ratio of TiB whiskers.
B content/wt%00.20.40.60.81.0
Length-to-diameter ratio (1/d)012.513.215.0317.7517.61
Table 4. Different boron content corresponds to FVR, ΔσLoad, and ΔσLoad difference values.
B content/wt%00.20.40.60.81
FVR/vol%01.23.15.17.88.1
ΔσLoad /MPa014.730.448.677.582.1
ΔσLoad Difference/MPa014.715.71828.94.6
Disclaimer/Publisher’s Note: The statements, opinions and data contained in all publications are solely those of the individual author(s) and contributor(s) and not of MDPI and/or the editor(s). MDPI and/or the editor(s) disclaim responsibility for any injury to people or property resulting from any ideas, methods, instructions or products referred to in the content.

