Article

Processing of Carbon Nanoparticle-Enriched AISI H11 Tool Steel Powder Mixtures in DED-LB/M for the AM of Forging Tools with Tailored Properties (Part II): Influence of Nanoscale Carbon Additives on Microstructure and Mechanical Properties

1
Institute of Photonic Technologies, Friedrich-Alexander-Universität Erlangen-Nürnberg, Konrad-Zuse-Straße 3/5, 91052 Erlangen, Germany
2
Erlangen Graduate School in Advanced Optical Technologies (SAOT), Friedrich-Alexander-Universität Erlangen-Nürnberg, Paul-Gordan-Straße 6, 91052 Erlangen, Germany
3
Department of Engineering and Physics, Karlstad University, SE-651 88 Karlstad, Sweden
*
Author to whom correspondence should be addressed.
Submission received: 20 September 2023 / Revised: 30 October 2023 / Accepted: 2 November 2023 / Published: 14 November 2023
(This article belongs to the Special Issue Design of New Metallic Alloys for AM)

Abstract

:
A promising approach for producing parts with outstanding properties in directed energy deposition (DED-LB/M) provides the application of tailored powder mixtures processed by applying in situ alloying strategies. In this work, DED-LB/M was used to manufacture multilayer specimens from AISI H11 steel powders enriched with carbon nanoparticles (C-np) in concentrations of 0.1 wt.-% and 0.2 wt.-%. The scientific aim was to investigate the impact of C-np on the microstructural (particularly retained austenite content (RA-c) and grain size) and mechanical properties (specifically hardness and compression yield strength) of the manufactured specimens. It was shown that the addition of C-np to the H11 powder leads to a stronger distortion of martensite as well as significantly enhancing the RA-c. Furthermore, the C-np seem to favor the formation of finer martensite, as can be verified with XRD and EBSD. Under as-built conditions, the mean hardness increases from 653 ± 10 HV1 for the H11 sample to 770 ± 14 HV1 for the sample reinforced with 0.2 wt.-% C-np. At the same time, Y0.2% rises up from 1839 ± 61 MPa to 2134 ± 68 MPa. The hardness- and strength-increasing effect of the added C-np is retained even after heat treatment, similarly to the industrial standard.

1. Introduction

Due to the ongoing, technological progression of the DED-LB/M process, especially the commercially available system technology and software for tool path planning, this laser-based manufacturing technology is recently no longer limited to coating applications [1] or the repair of investment goods, such as turbine blades [2,3] or worn-out tools [4,5]. Moreover, DED-LB/M becomes important for additive manufacturing (AM) of complete functional parts with integrated functionalities and outstanding and graded material properties [6,7]. For this, first, the surface of a metallic component is selectively fused using a high-power laser beam. Simultaneously, a microscale metal powder is injected into the melt pool with a powder nozzle that is aligned in a coaxial (on-axis) configuration in relation to the incoming laser beam. After rapid solidification and cooldown of the liquid metal, a weld track was formed on the surface. By depositing several parallel single weld tracks in an overlapping configuration next to each other and on top of each other, three-dimensional parts are produced using a layer-by-layer manufacturing approach. According to the state-of-the-art, pre-alloyed powders are usually applied in most of the AM applications with DED-LB/M. The metallic alloys that can processed include, among others, nickel-based super alloys, e.g., Inconel [8], aluminum alloys [9], binary shape memory alloys, e.g., NiTi [10], stainless steel [11], low-carbon maraging steels (e.g., Fe-19Ni-xAl [12] or 1.6358 [13]) and traditional tool steels, such as AISI H11 [14] or AISI H13 [15,16,17]. Additionally, this powder nozzle-based AM technology provides the potential to process several elementary or pre-alloyed powders at the same time and, in this way, to develop novel metallic alloys with outstanding and application-optimized properties using in situ alloying strategies. In this manner, multi-material parts [18], metal matrix composites (MMC) [19,20] or graded 3D structures [6,21] with spatially variable microstructural and mechanical characteristics can be manufactured in DED-LB/M.
A further promising approach to develop innovative materials in DED-LB/M provides the use of pre-mixed powders, consisting of a microscale host powder and at least one other powder material added as a microparticle or as a nanoparticle powder. In this way, compared to the starting material, the chemical composition, microstructure and mechanical properties are modified for producing parts with outstanding application-related characteristics. The laser-based AM of nanoparticle-enriched metal powder blends has been the object of several scientific investigations using varying mixing ratios between additives and microscale host powders. An overview and summary about scientific studies dealing with the processing of nanoparticle-reinforced powder blends with laser-based AM technologies, such LPBF m or DED-LB/M, can found in [22].
Most studies focus on the PBF-LB\M process by aiming to identify and subsequently analyze the impact of the nanoscale additives on their processing abilities, microstructures or resulting mechanical properties. In this context, high-melting nanoparticles are generally added to microscale host powders with lower melting temperatures. The high-melting nanoscale additives disperse in the melt of the base material and act as additional crystallization nuclei during solidification and the cooling-down phase of the laser-induced melt pool. Due to the induced grain refinement and microstructural changes, the mechanical properties of manufactured specimens (e.g., hardness, tensile strength, yield strength or wear resistance) significant improve compared to the specimens manufactured out of unmodified base materials. These phenomena were investigated for varying combinations of base materials and nanoparticle powders [23,24,25].
In DED-LB/M, there are also a few scientific studies dealing with the processing of nanoparticle-reinforced metal powder blends. However, these studies mainly focus on coating applications [26,27,28].
Gu et al. [26] investigated the generation of TiC/Inconel 625 composites, varying the concentration and particle size of TiC nanoparticles. Due to the grain refinement induced by the TiC nanoparticles that disperse in the material matrix, the hardness, tensile strength and wear resistance improve in comparison to the unmodified Inconel 625 specimens.
Furthermore, in [27], the impact of varying types of nanoparticles (e.g., Al2O3, TiC and WC) on the processing abilities and microstructural and mechanical properties of the steel 1.2365 was extensively investigated. Depending on the concentration of nanoparticles added and the applied set of process parameters, a significant increase in hardness and mechanical strength could be achieved for coatings manufactured out of the WC- and TiC-enriched powder mixtures. In particular, the wear resistance of these coatings could be significantly improved compared to the pure tool steel coatings.
This study is dedicated to the processing of AISI H11 powder mixtures enriched with C-np in DED-LB/M aiming to additively manufacture nearly fully dense tool steel specimens with modified microstructures and optimized mechanical properties. The investigations are built on a previous work [29], in which the processing abilities of C-np-enriched AISI H11 powder mixtures in DED-LB/M were successfully demonstrated. Due to the microstructural changes, the hardness of specimens manufactured using the C-np-enriched AISI H11 powder mixtures is significantly enhanced. After thermal post-processing in which a one-time tempering process is applied, the compression yield strength (Y0.2%) of the specimens manufactured out of the tool steel powder mixture containing 0.2 wt.-% increased on average by about 11% compared to pure AISI H11 specimens. The results obtained in [29] are very promising and lead us to continue investigations towards an in-depth understanding of the process and more optimal heat treatments aimed at tailored sample properties.
However, the microstructural analysis presented in [29] was limited to optical microscopy of chemically etched cross sections and a few EDS mappings. Additionally, in [29], the determination of mechanical properties was performed for specimens which were thermally post-processed by applying a one-time tempering process (at 550 °C for 2 h) only. Therefore, there are currently no results on the impact of the C-np on the mechanical properties of tool steel samples in an as-built condition or after carrying out other heat treatment strategies, e.g., a multi-stage hardening process close to industrial applications.
In order to counteract the above-mentioned deficits and knowledge gaps and thus to develop a comprehensive understanding of how C-np affect microstructural properties (particularly the phase fractions, the residual austenite (RA) content and crystallite/grain size of martensite and of retained austenite), a comprehensive microstructural analysis is carried out. These investigations include optical microscopy (OM), SEM imaging, EDS mappings and EBSD and XRD examinations. Apart from that, compression tests are carried out in order to evaluate the impact of the added C-np on the mechanical characteristics of the materials with a focus on yield strength (Y0.2%) and the maximal strain (maximal degree of deformation). Both microstructural analysis as well as mechanical testing were conducted with specimens in as-built conditions as well as samples that were thermally post-processed using two different heat treatment strategies that are similar to industrial use cases.

2. Materials

Argon-atomized AISI H11 (1.2343) powder (d10 = 31.1 µm, d50 = 46.2 µm; d90 = 61.3 µm) from TLS Technik GmbH & Co. Spezialpulver KG (Bitterfeld-Wolfen, Germany) with an almost spherical particle shape (see Figure 1b) was used as a microscale host powder. The AISI H11 powder showed a promising flowability; hence, a reproducible powder mass flow with a variation of less than 5% ( m ˙ = 2.7 ± 0.1 g/min) could be established; based on this, a stable DED-LB\M process was achieved. According to a chemical analysis of the AISI H11 powder using X-ray fluorescence (XRF) (for the measurement of the content of the metallic main alloying elements (e.g., Cr, Mo, V)) and hot gas analysis (for the determination of the carbon content of the chemical composition of the hot-work steel powder), the results within our study agree well with the material standard of AISI H11 presented in [30] (see Table 1).
The C-np powder (official notation: N550 carbon black) was purchased form Harald & Scholz Co. GmbH (Partenstein, Germany). The effective particle diameter of the C-np powder varies between 50 nm and 100 nm (see Figure 1a,b). According to the provider, the powder consists of at least 99.5 wt.-% carbon and contains a maximum of 0.5 wt.-% of non-metallic impurities, such as sulfur.
The C-np-reinforced AISI H11 powder mixtures were prepared using a multiple-stage dry-coating process. The aim was to produce homogeneous powder mixtures and to achieve a homogeneous distribution of the C-np powder on the surface of the microscale H11 particles. The adhesion of the C-np powder to the surface of the H11 particles is enabled due to the electrostatic surface forces (Van der Waals forces) that act on the C-np (see Figure 1b). The individual steps for the preparation of the C-np-enriched AISI H11 powder mixtures are outlined as follows:
-
Drying under an inert gas (Ar) atmosphere and sieving of both powder materials.
-
Weighing using a high-precision scale to adjust the desired mixing ratio between the AISI H11 powder and the C-np powder.
-
Tumbling of the powder mixture for several hours (2 h per 0.5 kg prepared power mixture) to achieve a homogenous mixing of both powder species; based on this, a homogenous distribution of the C-np onto the surface of the microscale AISI H11 particles (see Figure 1b).
-
A second sieving process is required as a last sub-process for removing larger powder agglomerations which may have formed in the dry-coating process due to the surface forces/tensions that occur between the nanoparticles and small tool steel particles.
In [29], the individual preparation steps and most relevant parameters included in the dry-coating process are described and discussed in more detail.
The prepared C-np-modified tool steel powder mixtures show an adequate flowability. Consequently, a homogeneous powder stream and constant powder mass flow can be adjusted for all investigated steel powder mixtures and, associated with this, a stable and reproducible AM process can ensure (see [29]).
For the measurement of the total carbon concentration, prior to the DED-LB/M experiments, both the unmodified AISI H11 powder and the C-np-enriched steel powders were analyzed with combustion spectroscopy using the ELEMENTRAC CS-i from Eltra GmbH (Haan, Germany). Table 2 shows the measured carbon concentrations for the pure AISI H11 powder and the two prepared powder mixtures (mixture No. 1, mixture No. 2). Following on from the measurement of values and the small standard deviations, the developed dry-coating processes seem to be applicable to adjust the total carbon content in the powder mixture and, in association with this, to prepare C-np-enriched AISI H11 powder mixtures a in reproducible manner.
Soft-annealed AISI H11 tool steel plates (L × W × H: 200 mm × 200 mm × 15 mm), pro-vided by HSM Stahl- und Metallhandel GmbH (Georgensgmünd, Germany), were applied as substrates for the DED-LB/M experiments. Table 1 shows the chemical compositions of the tool steel substrates measured with optical emission spectroscopy (OES). The values match well with the material reference defined in [30]. However, the mean carbon concentration of the tool steel substrates is 0.39 wt.-%, which is larger than the carbon concentration in the pre-alloyed AISI H11 powder (0.345 wt.-%), and consequently lies at the upper limit of the maximum allowed concentration for AISI H11 (see Table 2).

3. DED-LB/M Machinery, Process Parameters and Experimental Approach

The experiments were carried out with a commercially available five-axis DED-LB/M machine (TLC 3008) from Trumpf GmbH (Ditzingen, Germany). The machinery was equipped with a continuous wave (cw) disc laser (TruDisk 1000, maximum laser output (Pmax = 1 kW), wavelength (λ = 1030 nm)), a rotating plate powder conveyor with two powder feeding lines and a laser processing head consisting of laser optics and a coaxial three-way powder nozzle.
To view the research on the influence of the C-np powder on the microstructural and mechanical properties of all specimens manufactured by applying the same set of process parameters, see Table 3. As already shown in [29], the process parameter combination used is appropriate for the AM of nearly fully dense cubical specimens with a residual porosity equal to or smaller than 0.5% and, at the same time, promising mechanical properties.
Volumetric, cube-like specimens consisting of 30 weld track layers with an edge length of about 12 mm were manufactured onto the AISI H11 substrates using the bidirectional deposition/built-up strategy illustrated in Figure 2 (see [31]).
Firstly, the core of the samples consisting of parallel and overlapping single weld tracks were deposited. The hatch distance, which corresponds to distance of two parallel and overlapping single weld tracks, was kept constant at a value of 0.8 mm for all produced specimens. The laser beam was switched off at the reversal points for reducing the local thermal exposure at the edges and for preventing an enhanced material deposition at the starts and ends of the deposited weld tracks. Moreover, 1.5 mm long acceleration sections were applied at the beginning of each weld track in order to inhibit an overheating of the weld tracks at the starting points, which is essential for manufacturing test specimens with an acceptable dimensional accuracy. Subsequently, the core was dawned with a contour structure using a reduced laser power of 550 W instead of 600 W. As a consequence, the local thermal exposure at the outer range could be reduced, leading to an improvement of the dimensional accuracy of the cubical specimens. After the deposition of each layer, the starting position at the corner for the next layer was rotated in a clockwise direction by 90°. In this manner, the thermal load induced by the absorbed laser power was, to a great extent, symmetrically distributed into the structure during the ongoing AM process. Thus, the internal stresses and the susceptibility to cracking drops were decreased to a non-critical level; therefore, the layer-wise manufacturing of the 30-layered test specimens with a high dimensional accuracy was enabled.
In each case, 12 of the 18 specimens manufactured per powder mixture were heat-treated using the two strategies described below. Six samples still remained untreated, and were planned to be examined further under as-built conditions. Prior to the heat treatment, the substrate plates (on which the multi-layered samples were placed on) were cut into small samples consisting of the additive test specimen and a cuboid piece of a tool steel substrate (see Figure 1c). To reach almost-equal thermal boundary conditions for the thermal post-processing, all specimens had more or less the same mass and, at the same time, a very similar geometry.
The heat treatments were carried out using an ordinary chamber kiln (type N 11/HR) from Nabertherm GmbH (Lilienthal, Germany). On the one hand, the specimens were post-heat treated with one-time tempering at around 580 °C under an ambient atmosphere for 2 h (S1-HT). This corresponds to the tempering process that was already applied in [29] for thermal post-processing. Thereby, the tempering parameters used for S1-HT were recommended for the heat treatment of conventionally manufactured AISI H11 parts or hot-work tool steels with a similar chemical composition [30].
On the other hand, the specimens were subjected to a two-step heat treatment process consisting of a hardening step followed by one-time tempering using the same set of tempering parameters as for S1-HT (S2-HT). For the hardening sub-process, the specimens were re-austenitized for 12 min at an austenitization temperature of 1080 °C and subsequently quenched in an oil bath (Hardening oil: Durixol W25 [32]). S2-HT is widely equivalent to the industrially established standard for the hot-work tool steel AISI H11 powder [30]. Moreover, this type of heat treatment strategy was successfully applied in previous studies which investigated the processing of pure AISI H11 powder in DED-LB/M [14].
For the microstructural analysis, one sample of each processed powder mixture and for each heat treatment condition was prepared to a highly polished vertical cross section by applying a metallographic standard process including grinding, lapping and polishing. Afterward, the relative density of the specimens was checked via OM. Therefore, a series of individual microscope images were recorded with a magnification factor of at least 25. Then, the individual images were merged to reconstruct a highly resolved microscopic image of the complete cross section. The merged images were then analyzed with respect to the pixel brightness; based on this, the relative density was determined as the ratio of the number of bright pixels to the total number of pixels considered in the evaluation. A more detailed description of this procedure can found in [33].
Subsequently, the chemical composition of the specimens was measured with optical emission spectroscopy (OES) using the measuring device SpectroLabM10 from the company Spectro (Kleve, Germany). As illustrated in Figure 1f, to obtain a statistically reliable result, a total of three individual measurements were performed onto the prepared sample’s cross sections. The measured concentrations of metallic and non-metallic alloy elements are later required for XRD analysis and for the modelling/reconstruction of diffraction diagrams according to the Rietveld approach (see below).
For investigating the microstructure via OM and SEM imaging, the specimens were firstly chemically etched using a V2A etchant (composition: HCl, H2O, HNO3; etching parameters: Tetchant = 50 °C; tetching = 5–10 s, depending on the quality of the prepared polished cross section). This type of etchant is predestinate for investigating martensitic steels and making diffusion lines and grain boundaries visible. Additionally, EDS area mappings were carried out to examine the spatial distribution of the metallic main alloying elements, e.g., carbide formers chromium (Cr), Molybdenum (Mo), Manganese (Mn), Vanadium (V), particularly at the inter-dendritic spaces or at the grain boundaries, respectively.
Both electron backscatter diffraction (EBSD) and X-ray diffraction (XRD) measurements were conducted in order to achieve a comprehensive understanding of the effect of the added C-np on the microstructural properties of the studied materials with a focus on the occurrence of metallurgical phases, the retained austenite (RA) content, texture and domain (crystallite) size of martensite or grain size. For EBSD, the cross sections were polished using a fine acidic alumna suspension containing granules in the order of 0.1 µm. The field emission scanning electron microscope Gemini II from Carl Zeiss Microscopy GmbH (Jena, Germany) was equipped with an EDS detector from Oxford Technologies and was used for carrying out SEM imaging, EDS mappings and EBSD investigations.
While the EBSD measurements are mostly allocated to small measuring areas, XRD measurements enable the analysis of larger measuring areas with a comparably moderate amount of work. In this way, by evaluating the diffraction diagram, a reliable mean value of the RA-c and of a crystallite size (domain size) of the RA and of martensite can be determined. The XRD examinations were performed using the measuring device Philips X’Pert MRD (Amsterdam, The Netherlands). The diffraction angle (2θ) varied between 25° and 125° with a step size of 0.03°. As can be seen in Figure 1e three single measurements were performed at three characteristic locations for each specimen to investigate the RA-c with respect to the sample height. Here, each rectangular-shaped measuring surface had a length (l) of 6 mm and a width (b) of 3 mm (see Figure 1e).
The quantification of the RA content and of the domain size of the RA and of martensite was performed according to the Rietveld method. The Rietveld method enables the modeling and reconstruction of the complete diffraction diagrams and considers relevant physical material properties, the exact chemical composition as well as mathematical and physical principles. Based on the raw data, the data processing and evaluation including all mathematical and numerical operations that are required for the reconstruction of the diffraction diagrams was carried out in the software Bruker Topas.
For the reconstruction of the diffraction diagram, the full width at half maximum (FWHM) of diffraction peaks was described using pseudo-Voigt functions. The dependence of the half widths on the diffraction angle was taken into account according to [34,35]. The background in the diffraction diagram was numerically fitted with Chebyshev’s polynomials and any preferred orientations were modelled with spherical surface functions as suggested by Järvinen et al. [36]. The RA content was then obtained as the model parameter of the Rietveld approximation. In the Rietveld method, the diffraction patterns were modeled with the following structures:
  • Austenite, space group 225, face-centered cubic pattern.
  • Ferrite, space group 229, body-centered cubic pattern.
  • Martensite, space group 139, body-centered tetragonal pattern.
To determine the crystallite size (domain size) of martensite and of RA, the influence of the C-np on the half widths of the diffraction peaks had to be analyzed in detail. A broadening of the half width of the peaks occurred either due to a reduction in the size of the crystallites or due to an increase in the microstresses within the crystallites. Consequently, for an appropriate evaluation of the domain size, it is essential to eliminate the impact of the microstresses on the peak half width. This can be directly performed in the operating software by applying special algorithms. As it is the case for the RA content, the domain (crystallite) size of the RA and of martensite was obtained from the Rietveld approximation of the diffraction diagrams and was directly determined in the software.
Hardness measurements were performed with the Vickers hardness tester HP30S from the company Hegewald & Peschke (Nossen, Germany) at highly polished cross sections. The measuring device was equipped with a programmable x- and y-linear stage, which enables the determination of the hardness distribution with a high spatial resolution. The hardness measurements were carried out with both specimens under as-built conditions as well as post-heat-treated samples.
For the investigation of the effect of C-np on mechanical strength, compression tests were carried out according to DIN 50106 using the universal testing machine Quasar 100 from Galdabini (Cardano al Campo, Italy). For that purpose, as exemplarily shown in Figure 1d, the cube-like samples were machined to cylindrical compression specimens with a diameter of 6 mm and a height of 9 mm by applying different subtractive manufacturing technologies (wire erosion cutting, followed by turning and circular grinding). The maximal compression force was set to 100 kN, which was equivalent to the maximal adjustable load. The upsetting velocity was kept constant at a value of 5 mm/min, which corresponds to an experience value. On the basis of the recorded stress–strain curves, the compression yield strength Y0.2%, maximum compression stress and maximum degree of deformation (maximum strain) were determined. To ensure a statistically relevant outcome, five specimens were characterized and evaluated for each powder mixture and were subjected to each heat treatment condition (as-built conditions, S1-HT and S2-HT).

4. Results and Discussion

4.1. Influence of C-np on Relative Density and Chemical Composition

Prior to the analysis of the microstructure and the characterization of mechanical properties, the specimens were analyzed with respect to the inner defects and the relative densities that were determined, as described in the previous section. Regardless on the added C-np content and the associated total carbon content, it was possible to manufacture nearly fully dense and crack-free 30-layered test specimens with a relative density equivalent to at least 99.5%, as exemplarily illustrated in Figure 3. Consequently, the results of the previous work [29], in which the process ability of C-np-enriched AISI H11 powders for the AM of multi-layered tool steel parts were fundamentally proven, could be confirmed.
Table 4 presents the nominal chemical compositions of the manufactured 30-layered tool steel specimens measured with OES.
The content of the main alloying elements, Cr, Mo, Mn and V, agrees well with the composition of AISI H11 defined in [29]. However, as intended and expected, the total carbon content overcomes the maximum threshold allowed for AISI H11 as soon C-np are added to the H11 powder.
Comparing the total carbon content of the steel powder mixtures (Table 2) and of the solid builds (Table 4) with each other, it is discernible that there seems to be a small total loss of carbon, in the order of 3, until 4% in the DED-LB/M process.
However, the carbon loss is on a tolerable level for all investigated tool steel powder mixtures. Furthermore, the phenomenon seems to occur in a reproducible manner, which is caused by the small standard deviations of the measurement values shown in Table 3.

4.2. Influence of C-np on the Martensite Transformation Temperatures and the Position of the Phase Transitions and the Martensite Transformation Temperature Ms

For obtaining a deeper understanding of the impact of C-np on the microstructures of the manufactured tool steel samples, prior to the experimental microstructural analysis, the TTT diagrams as well as martensite transformation temperatures were calculated for the manufactured specimens based on their chemical compositions from Table 3 using JMatPro. The TTT diagrams serve as a theoretical basis for the interpretation of the experimentally obtained outcomes of the microstructural analysis (see Figure A1). In addition, they provide an initial idea of the extent to which the change in the chemical composition of the materials is caused by the nanoscale carbon additives and to what extent it fundamentally influences the transformation temperatures, particularly the martensite start temperature MS and the position of the phase transitions for austenite, martensite and ferritic phases compared to the unmodified AISI H11 hot-work tool steel.
As follows from Table 4, which summarizes the calculated transformation temperatures, and from the calculated TTT curves shown in Figure A1, a higher carbon content promotes the formation of a high-temperature austenitic phase at the expense of martensite and ferritic phases. On the one hand, this manifests itself in a decrease in the martensite transition temperatures with an increase in the carbon concentration (see Table 5). On the other hand, the phase transitions for ferritic phases, e.g., pearlite and bainite, are slightly shifted towards longer holding times with an increasing carbon content in the steel.

4.3. Influence of C-np on Microstructure: Metallurgical Phases, RESIDUAL Austenite Content, Texture and Grain Size

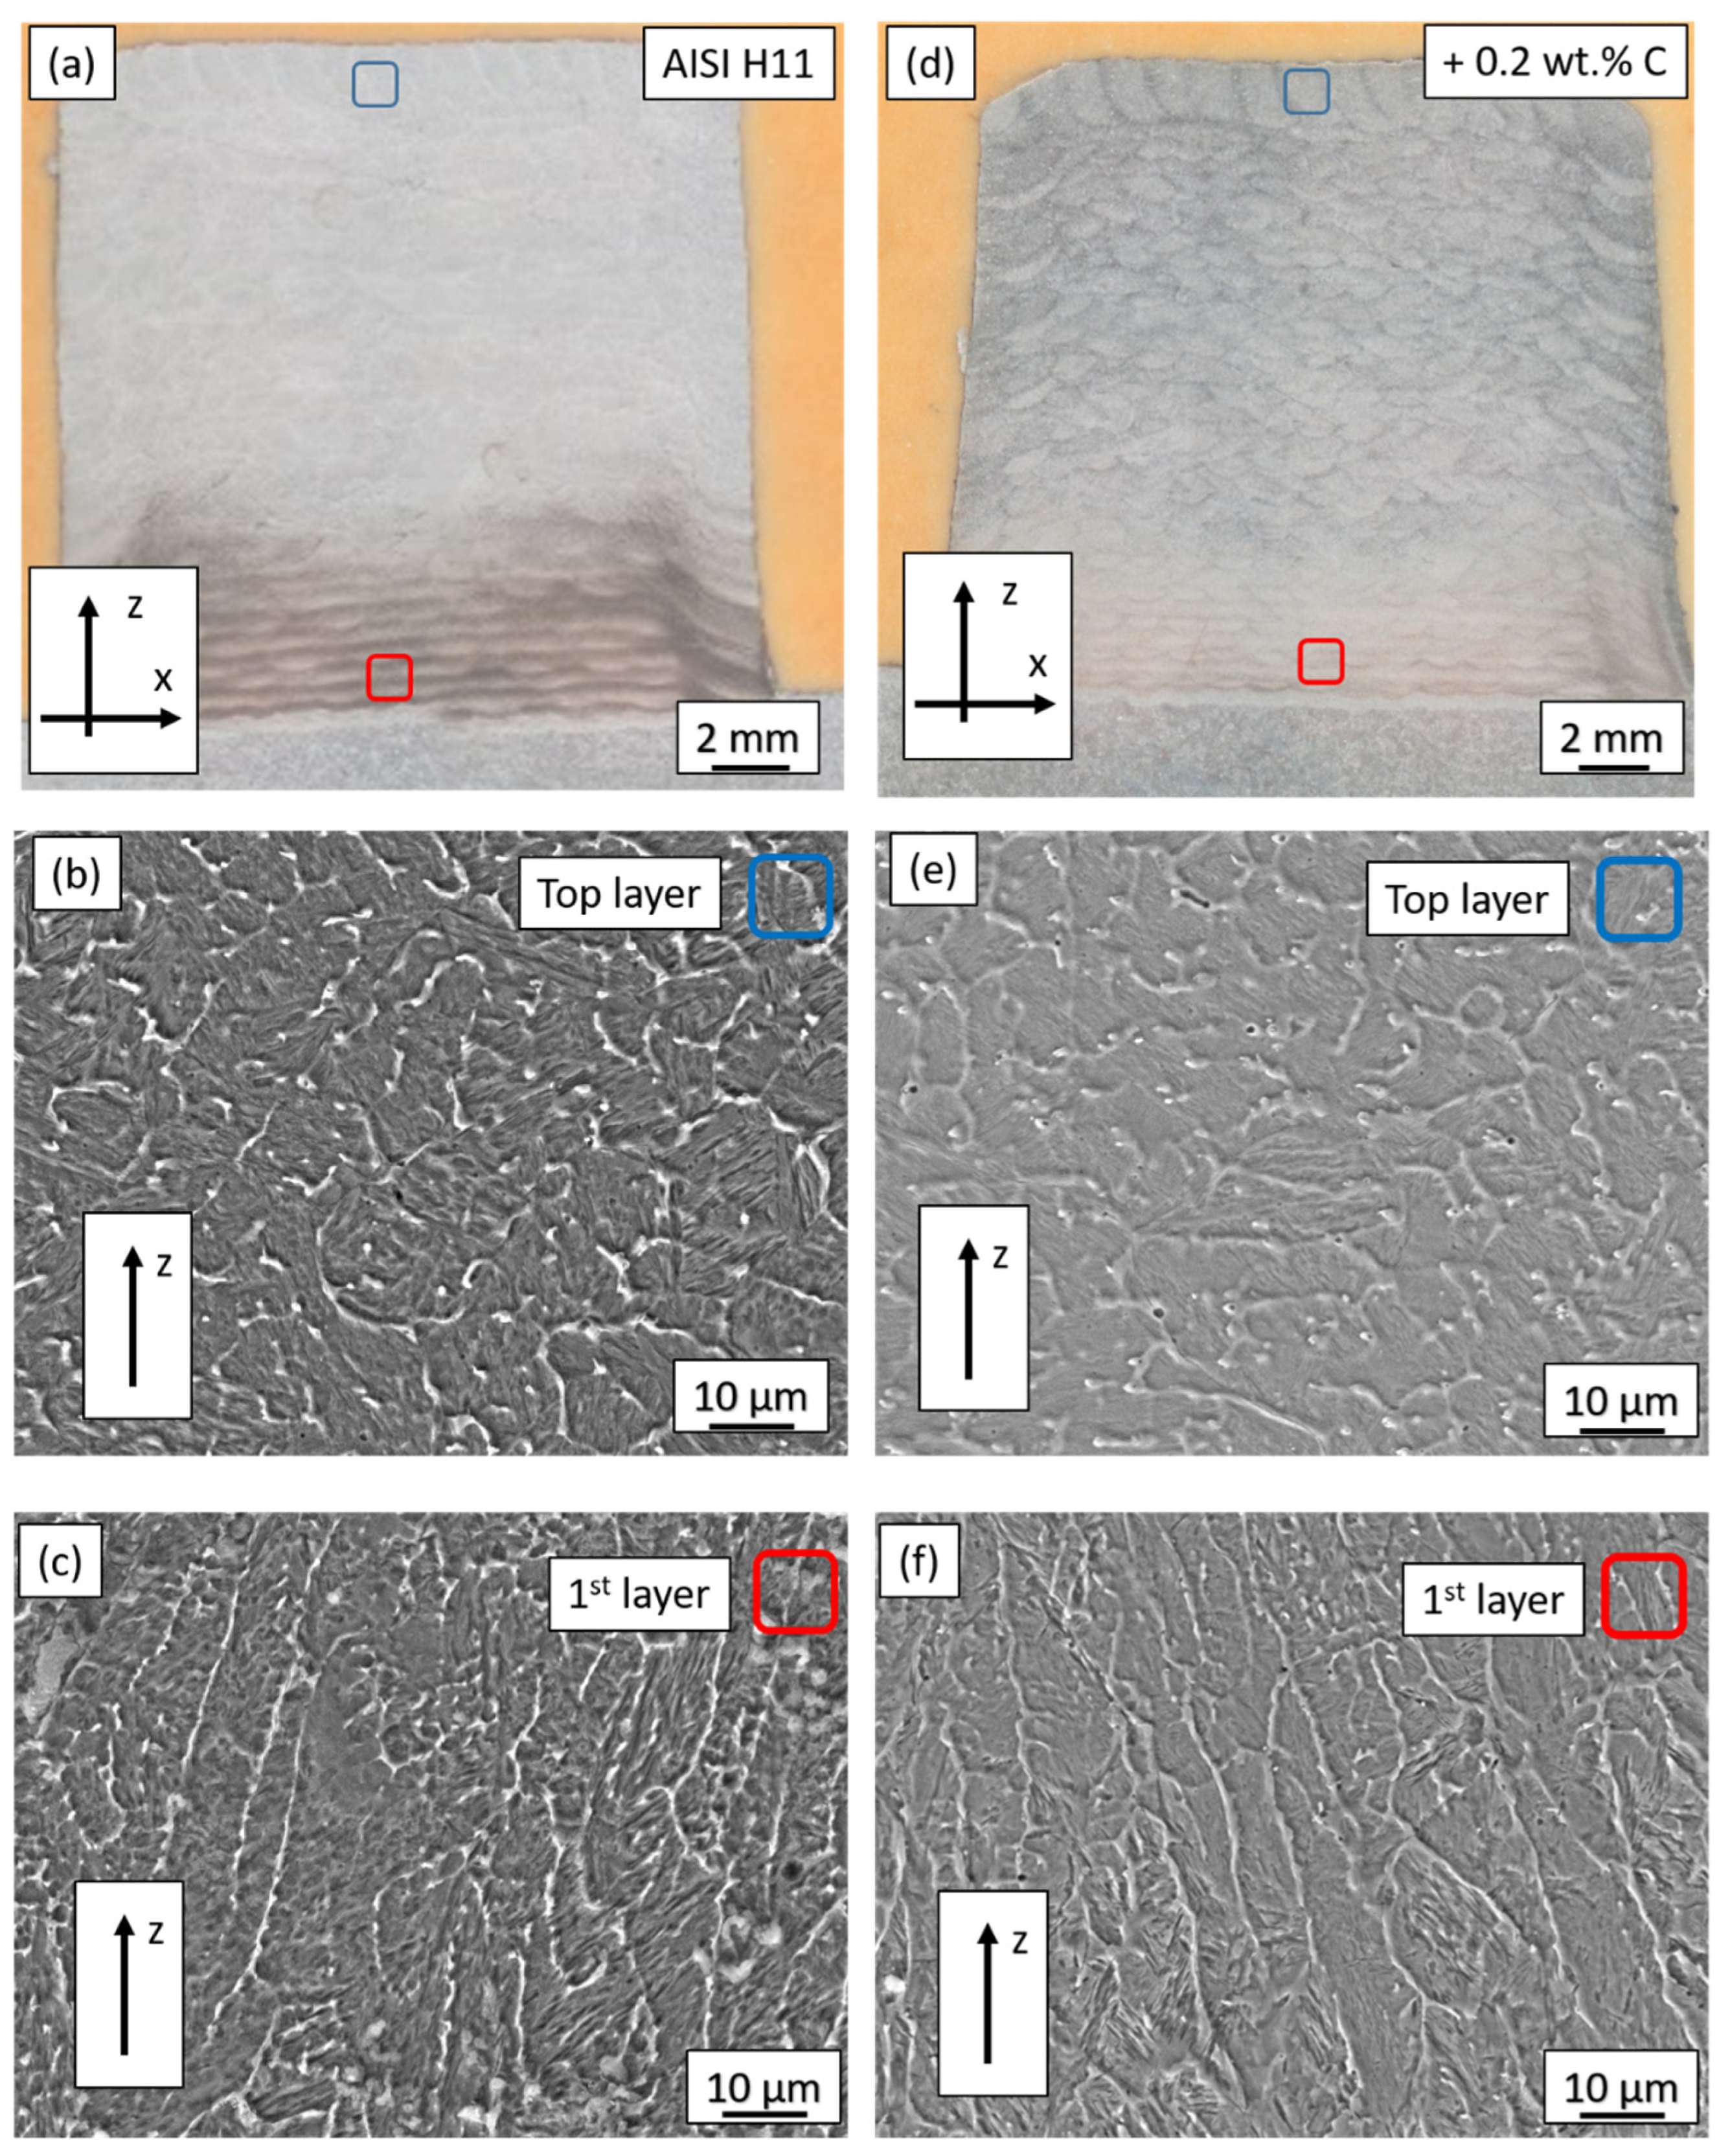
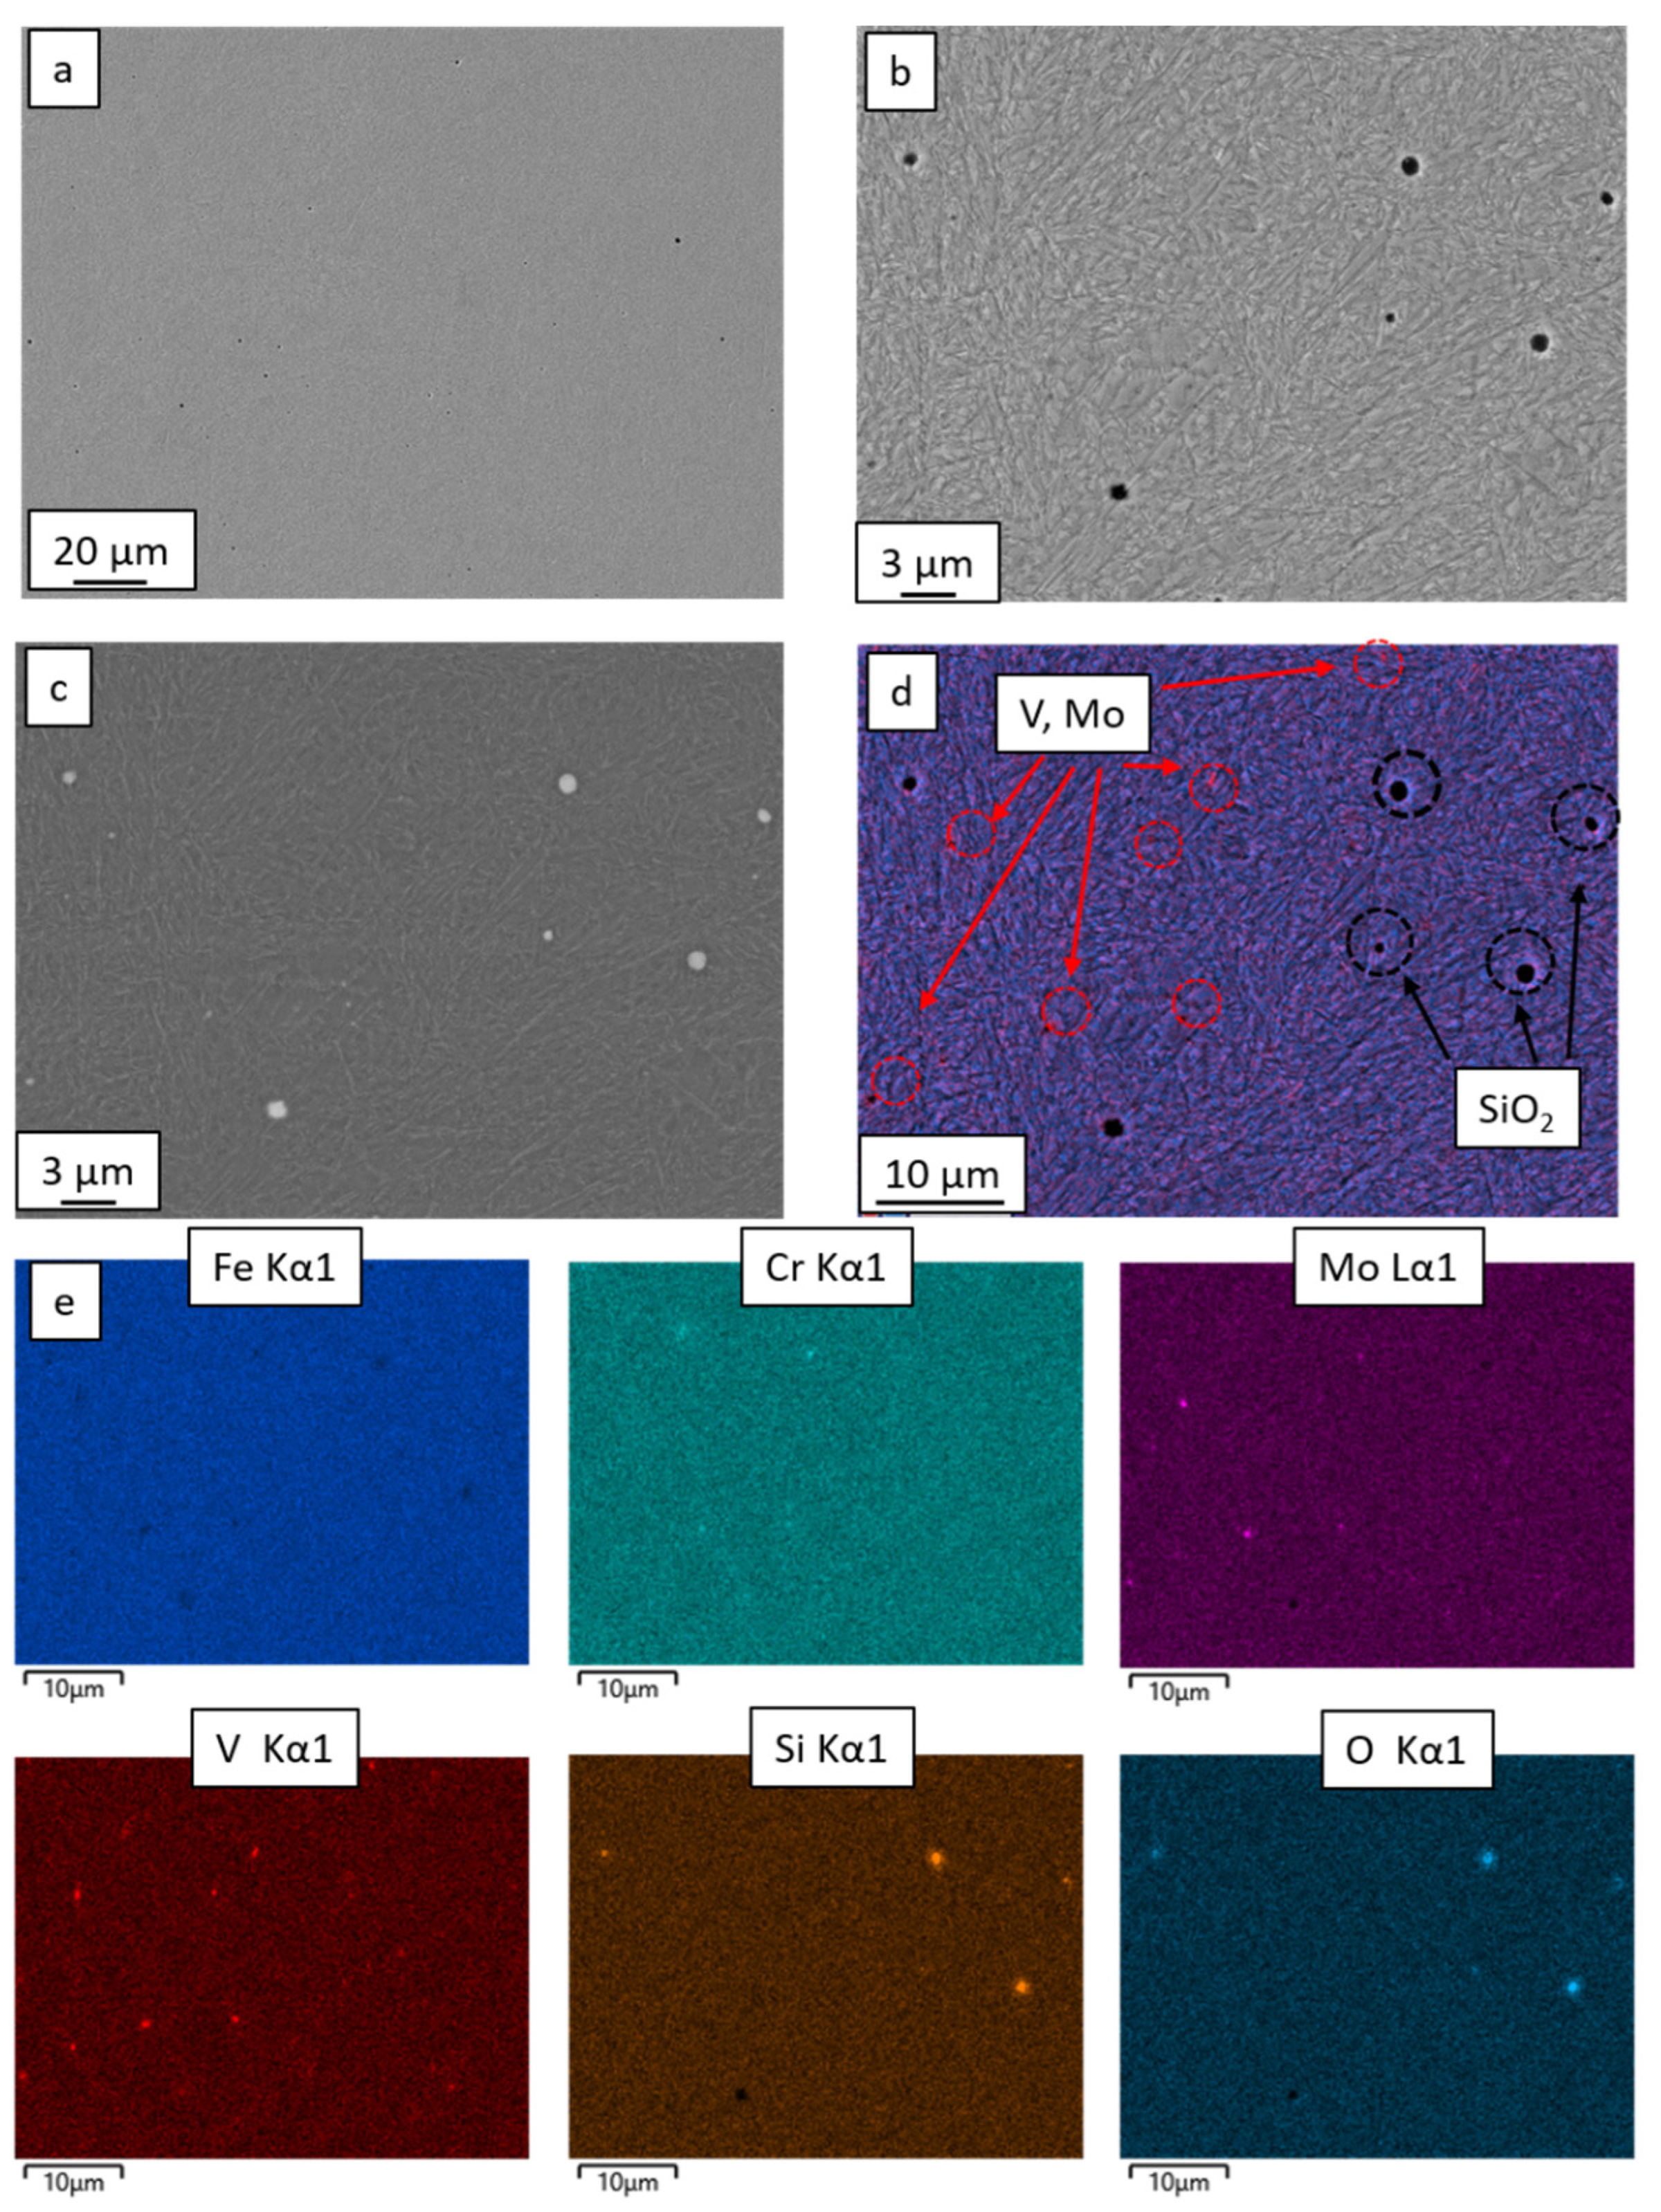
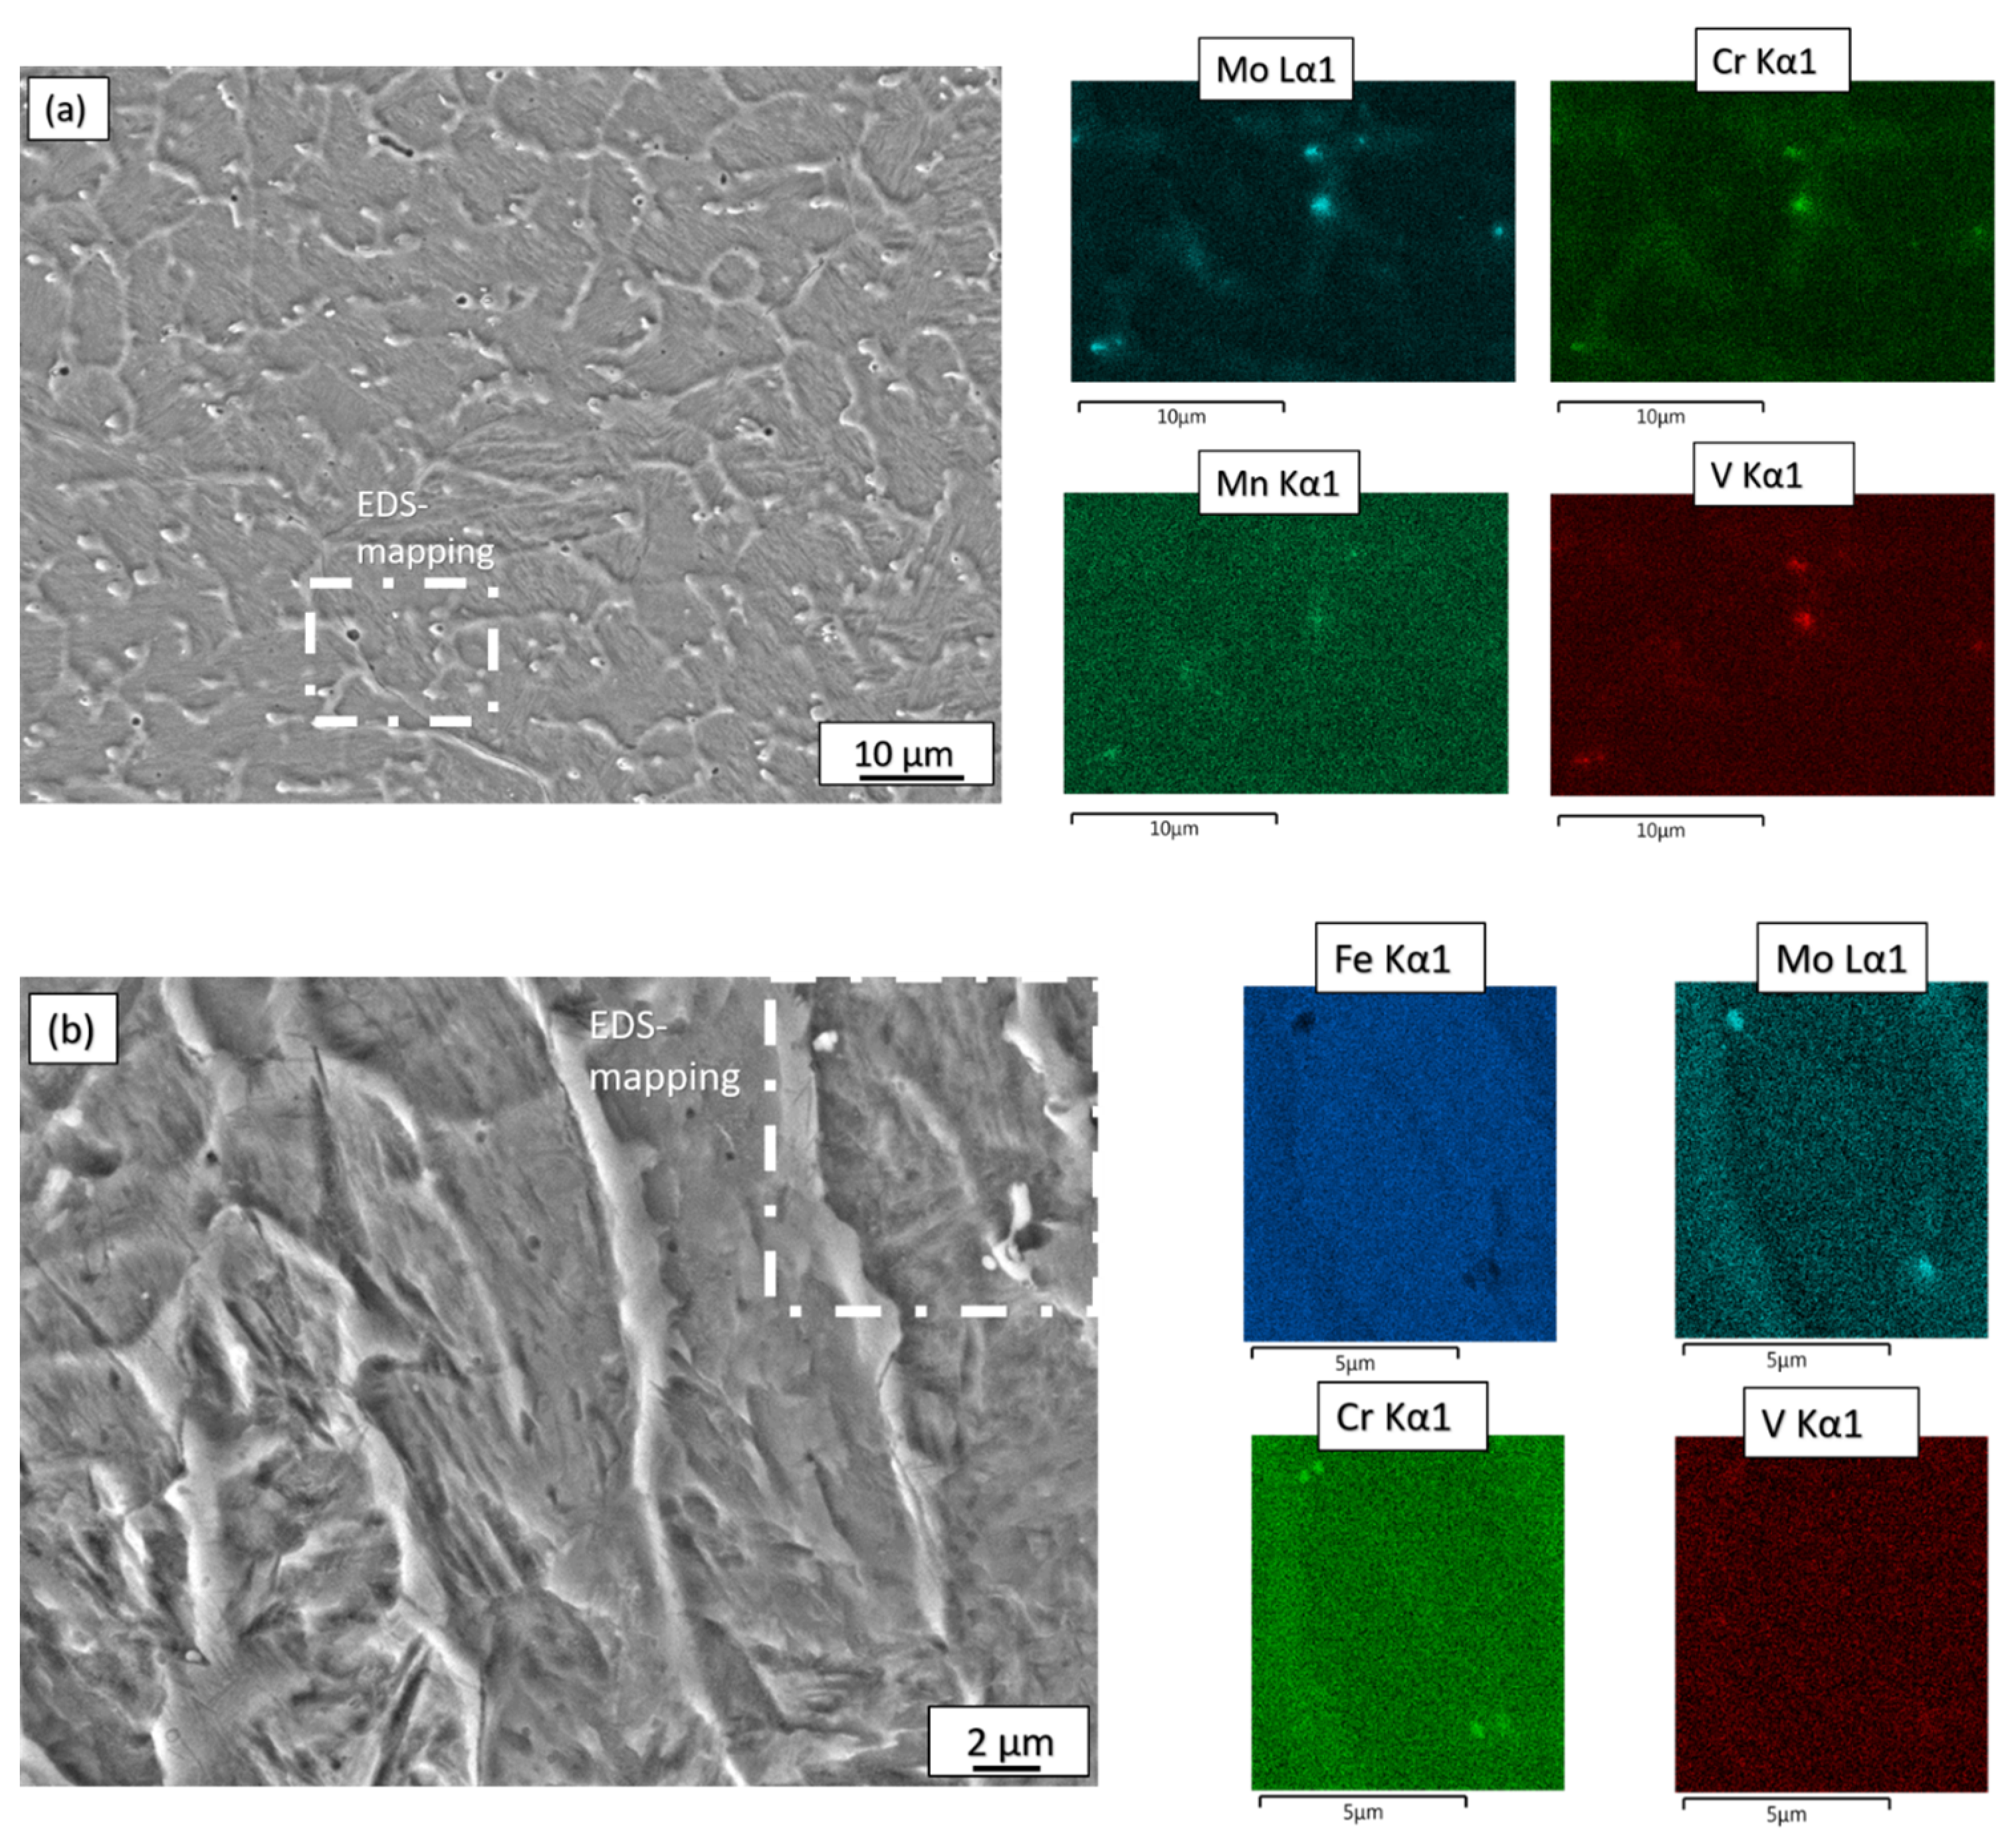
By investigating the chemically etched cross sections of the specimens via OM, SEM imaging and EDS area scanning, no obvious differences in the microstructure were detected. As a consequence of the process-inherent high cooling rates, both the pure AISI H11 sample as well as the specimens manufactured with the C-np-enriched AISI H11 powder mixtures have a fine-grained, predominately dendritic microstructure (see Figure 4b,c,e,f). As exemplarily illustrated in the SEM images presented in Figure 4b,c,e,f, a fine needle-like inner structure is discernable within the dendrites for all investigated tool steel specimens. It is most likely to be martensite, and includes amounts of ferritic phases (e.g., ferritic bainite) and a retained austenite (RA).
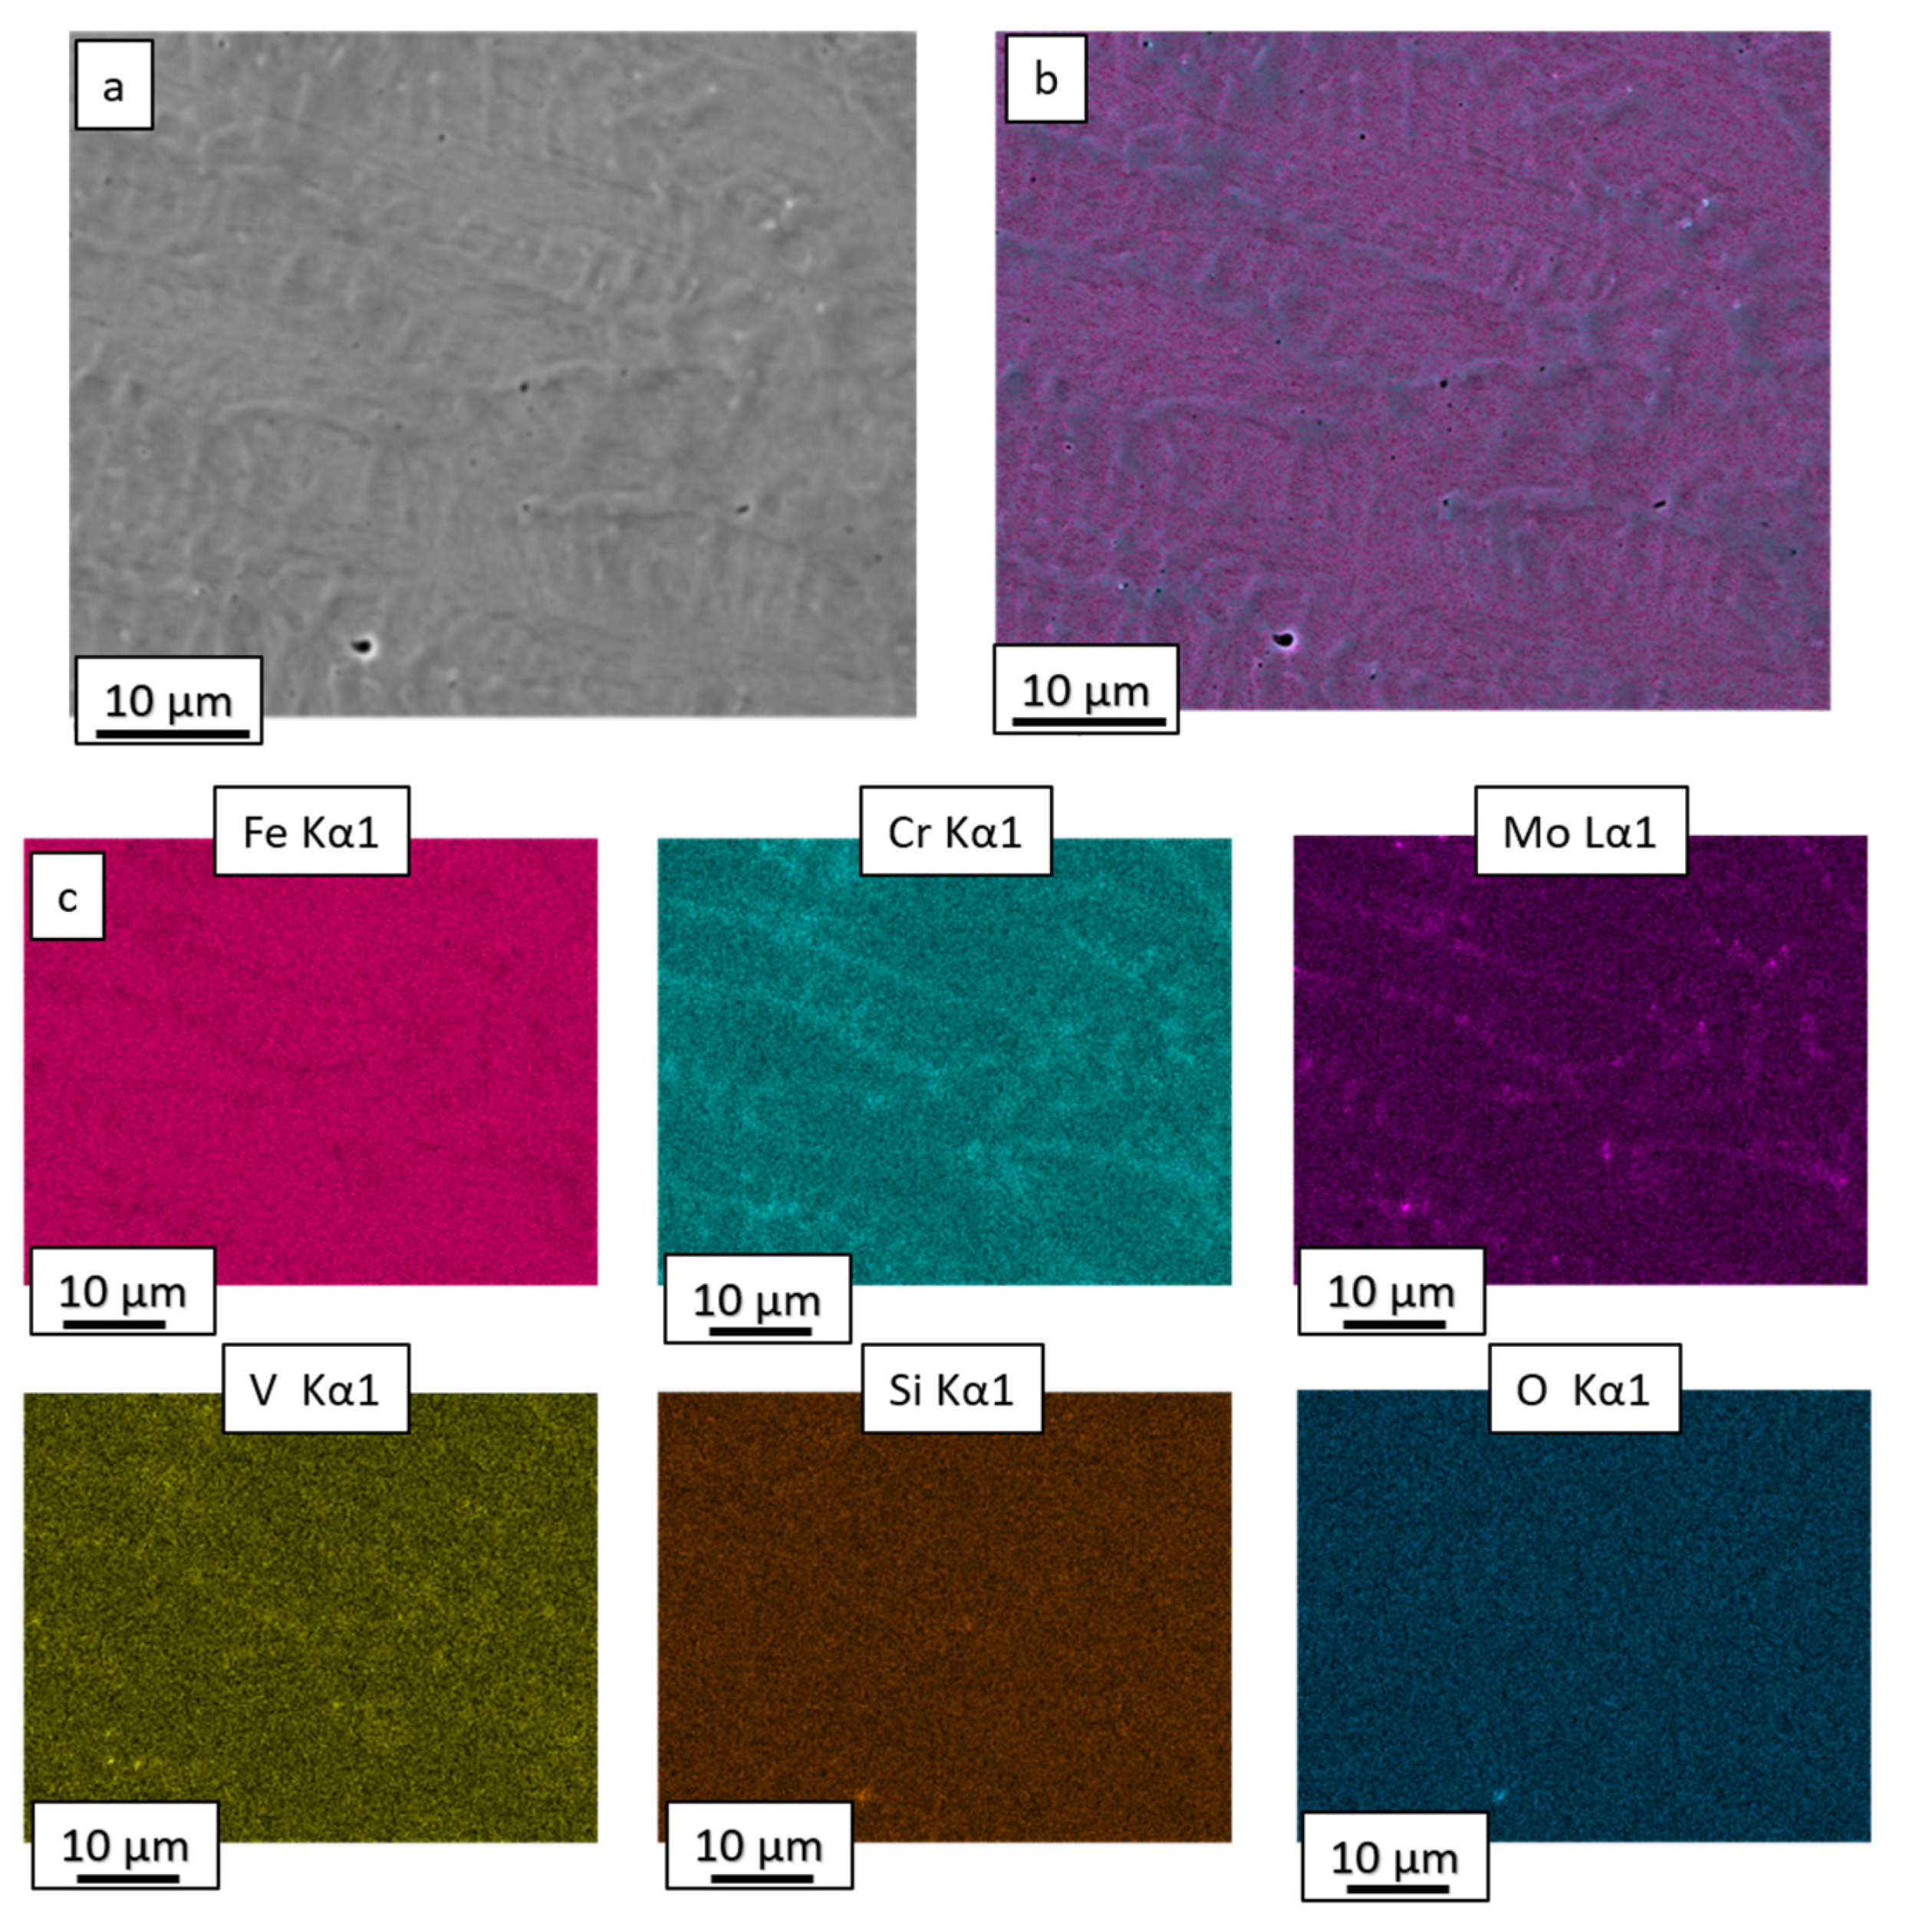
Moreover, as could be verified with EDS area mapping (see Figure 5, Figure A1 and 
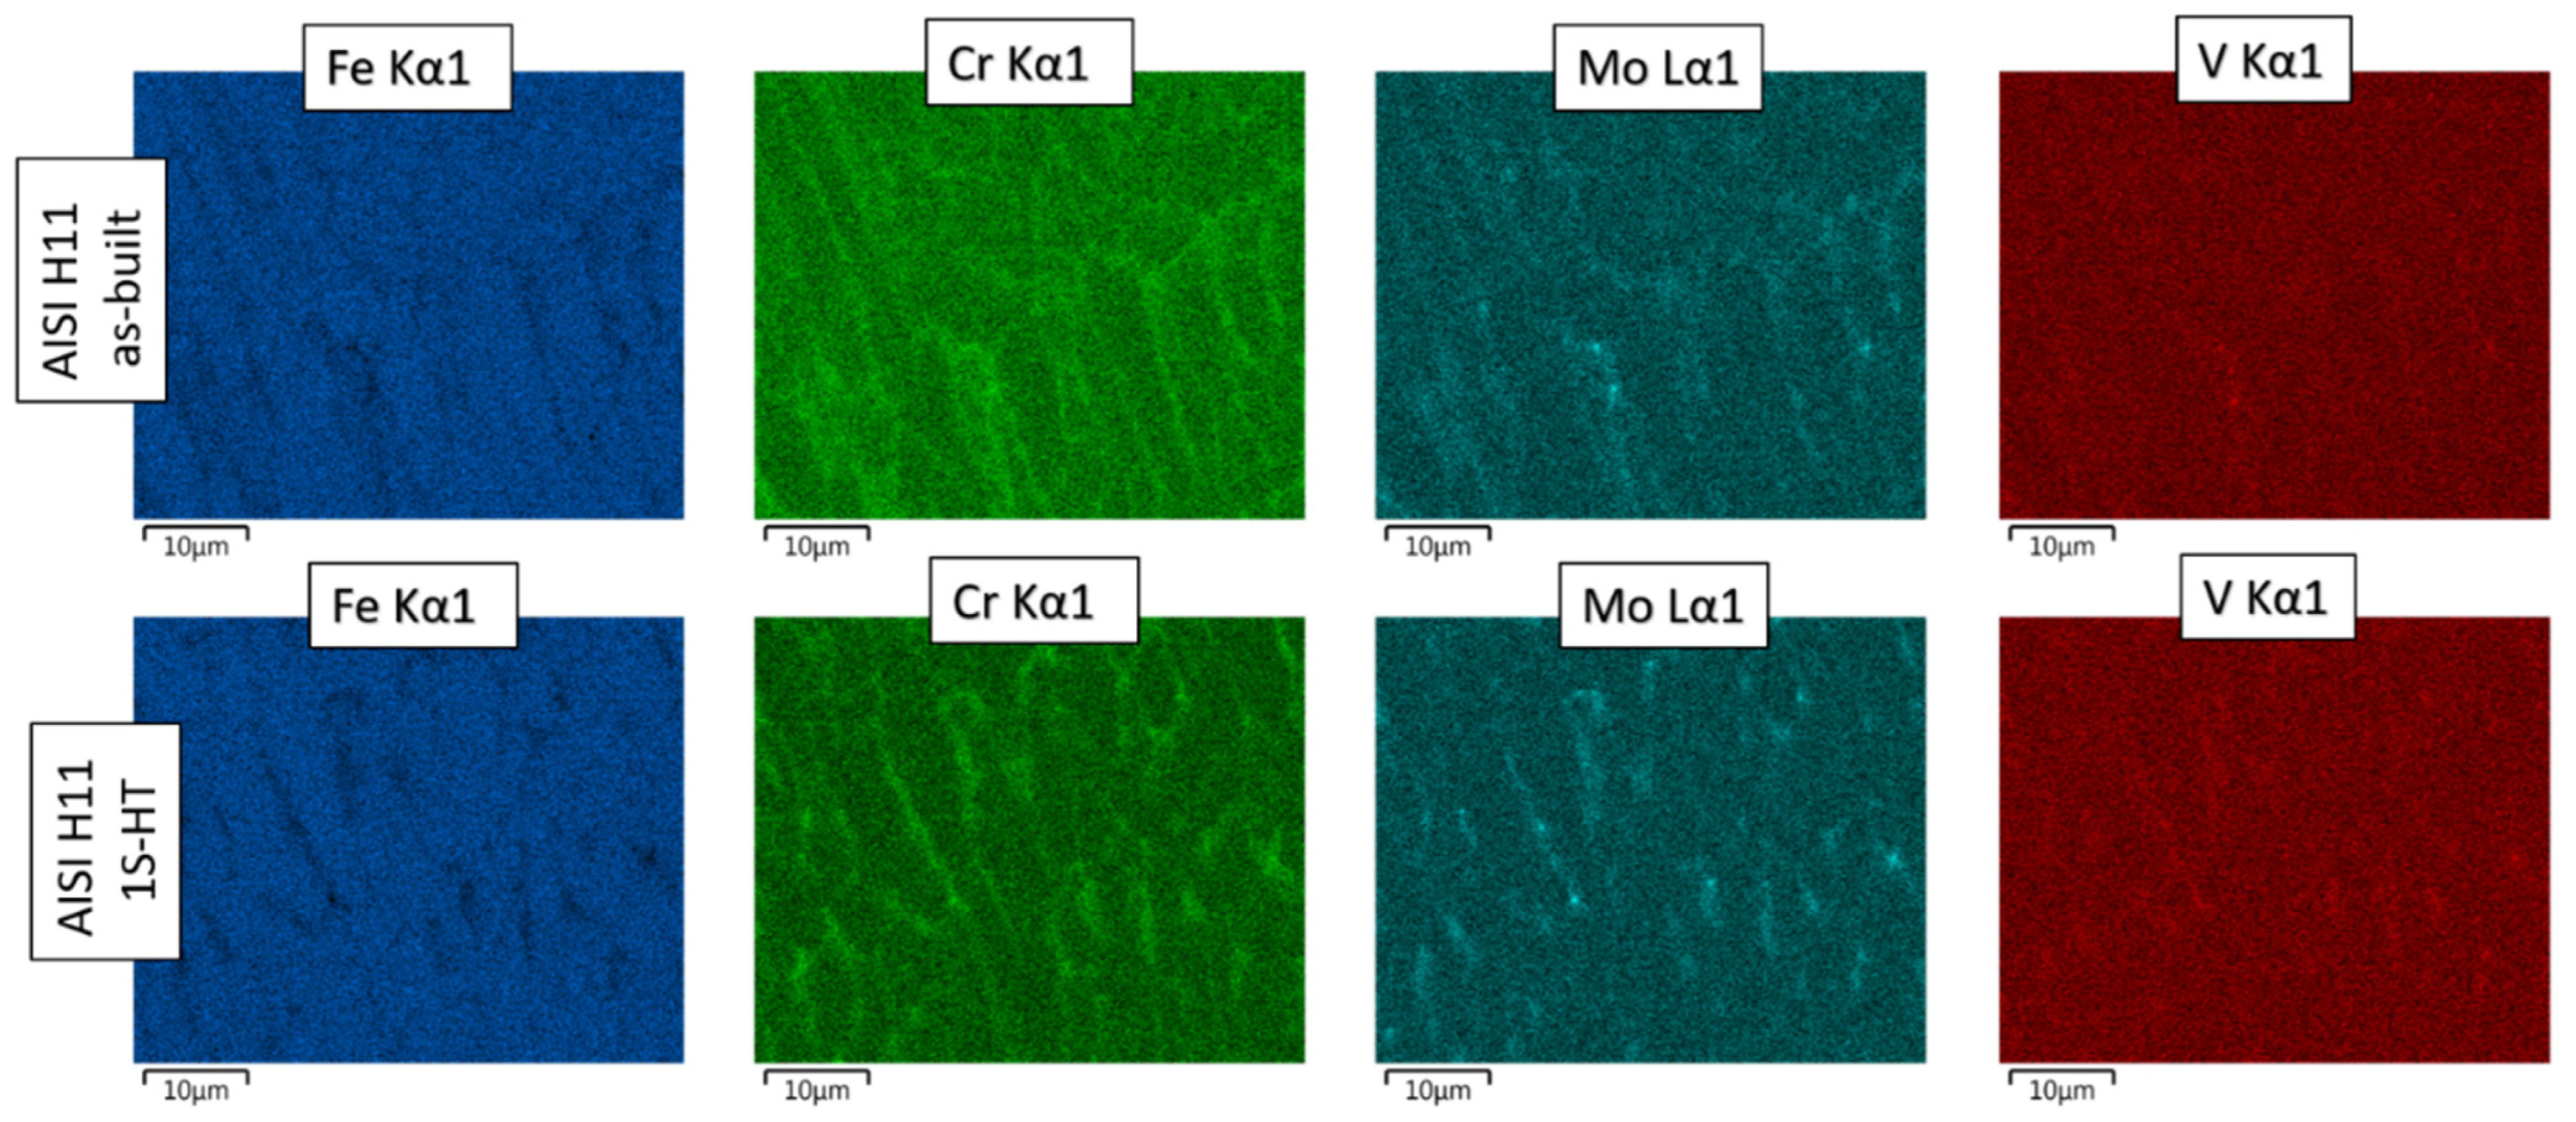
Figure A2), the metallic main alloying elements chromium (Cr), molybdenum (Mo), manganese (Mn) and vanadium (V) occur concentrated at the inter-dendritic spaces or at the grain boundaries, respectively. In contrast, the iron (Fe) content in these areas decreases noticeably (see Figure 4b,c). This points out the formation of strength- and hardness-increasing carbides, preferably Cr- and Mo-mixed carbides from type M7C3 or M23C6 as well as VC- and Mo2C-special carbides. These observations are also in good accordance with the scientific outcomes of others who reported on the formation of a dense carbide network, which mainly consists of fine Cr-mixing carbides, in AISI H11 or similar CrMo-alloyed hot-work tool steel components manufactured with PBF-LB/M [37].
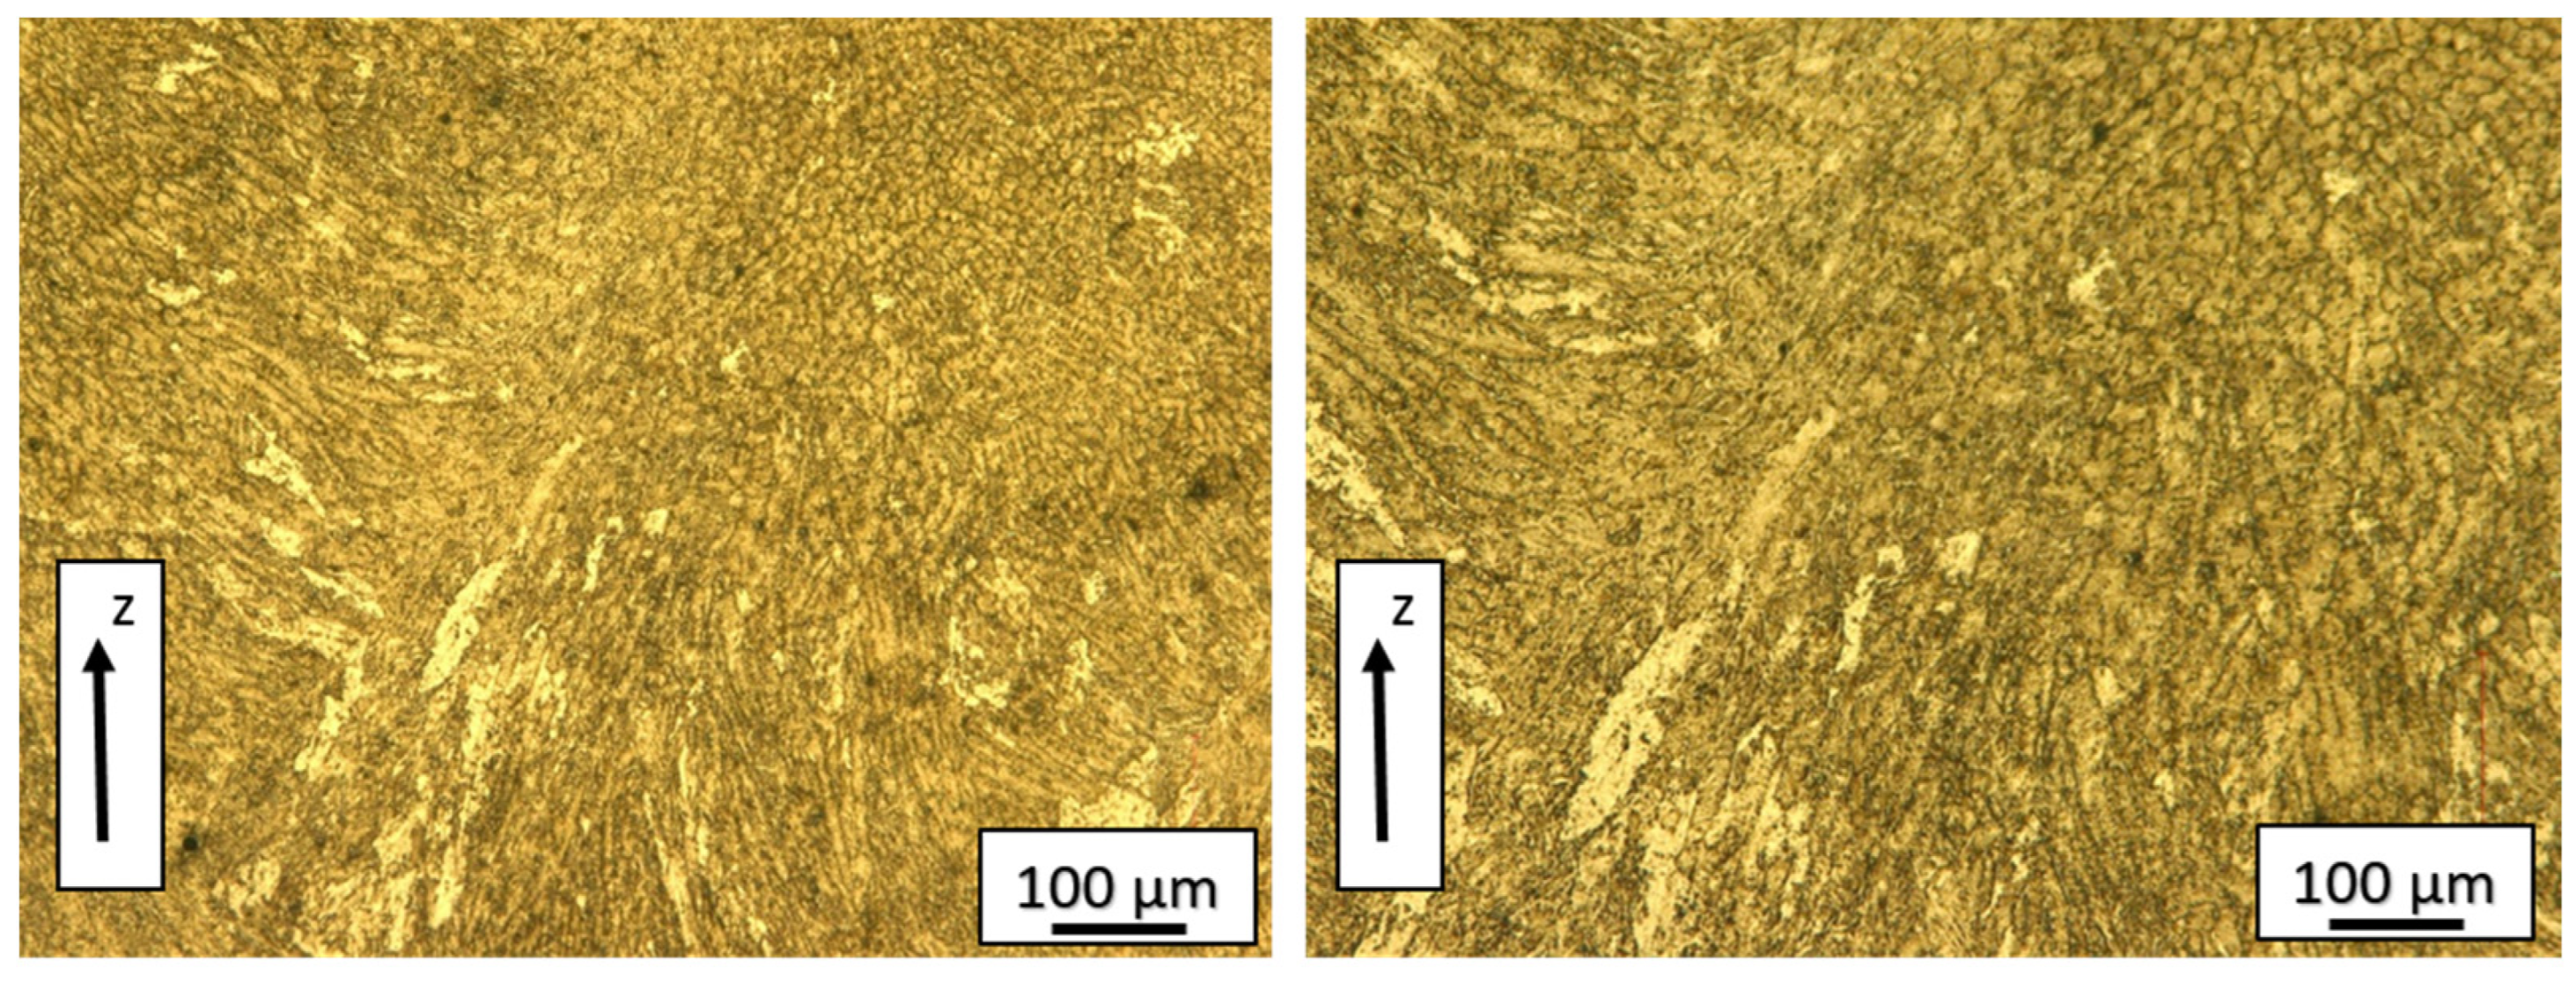
Furthermore, by investigating the microstructure with respect to the sample height, it is discernable that all specimens have differences in local or at least layer-specific inner structure. Low-magnification OM analysis of etched cross sections revealed two characteristic regions (compare to Figure 4a,d). Independently, on the processed tool steel powder mixture, the bottom part is slightly over-etched and appears darker in the microscopic images. This seems to be an indicator for the presence of multiple re-austenitized and cyclically tempered martensites. In contrast to the middle and upper section of the tool steel samples, the martensite takes on a brighter coloration, which is characteristic for freshly formed martensite when V2A Beize is used as the etchant.
As already described in [29] and also reported by others who investigated similar tool steels in DED-LB/M [17,
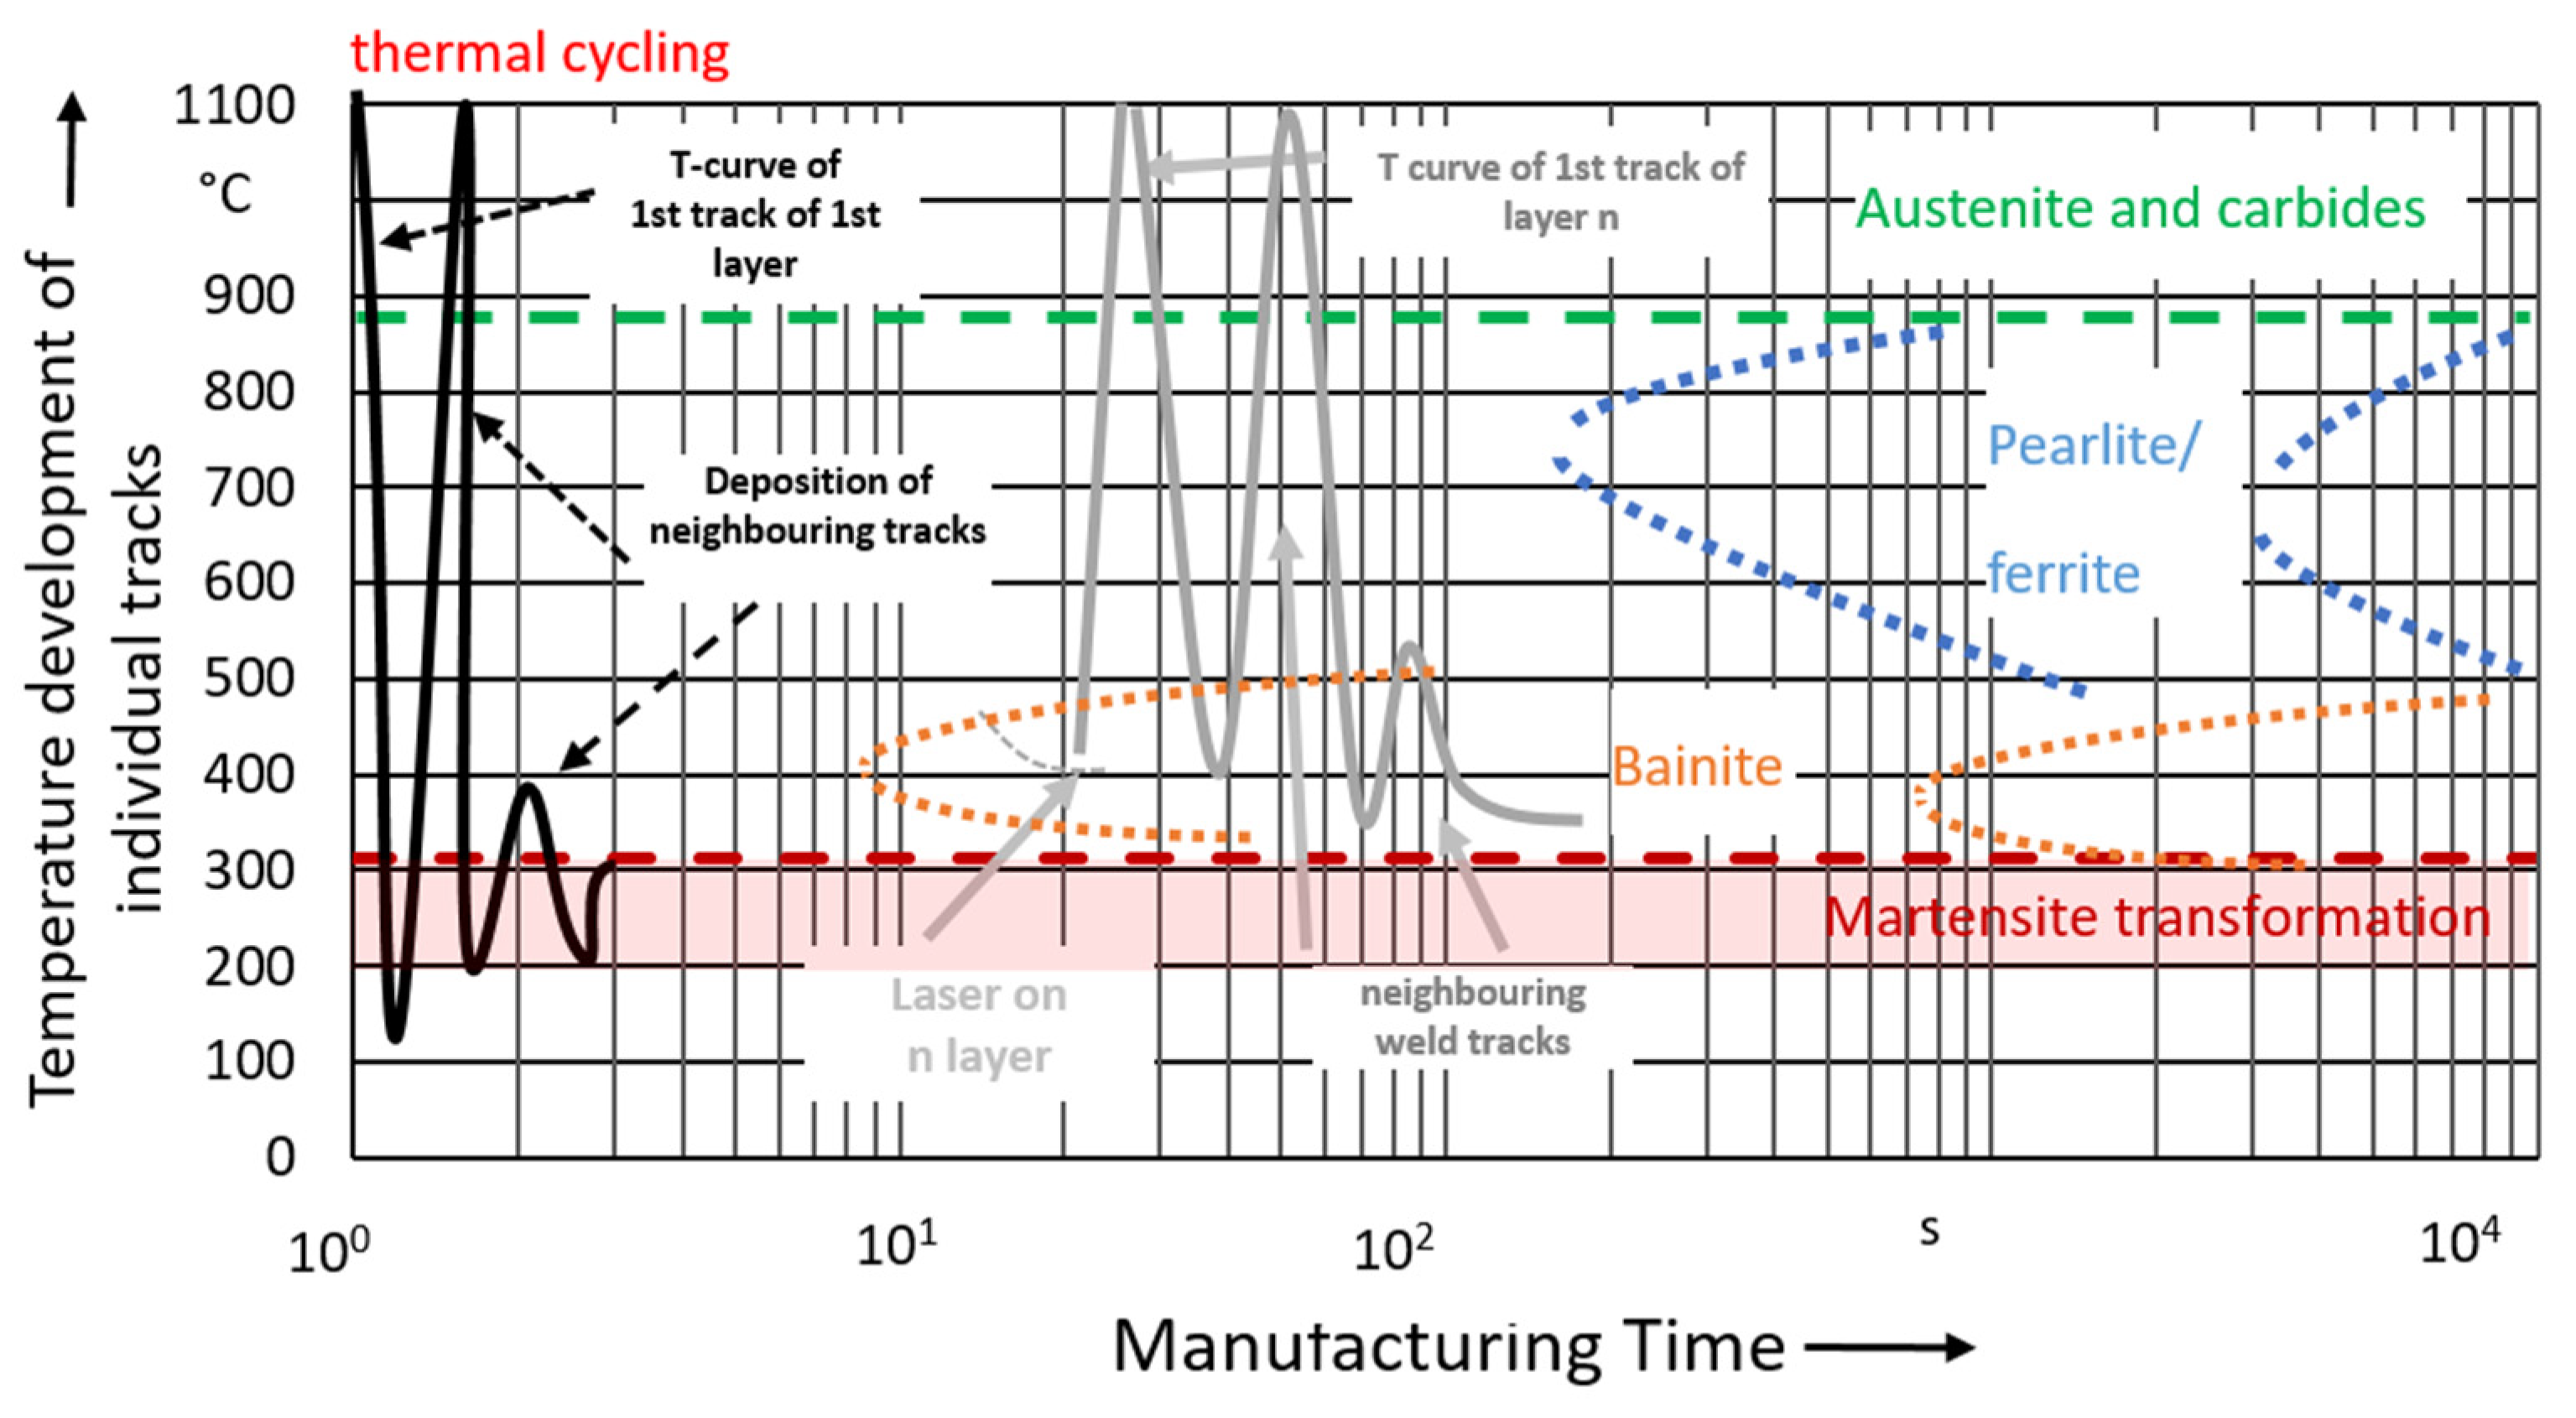
35], the layer-specific microstructural differences can be attributed to a kind of in-process heat treatment of the lower weld track layers during the layer-by-layer manufacturing process. As exemplarily illustrated in 
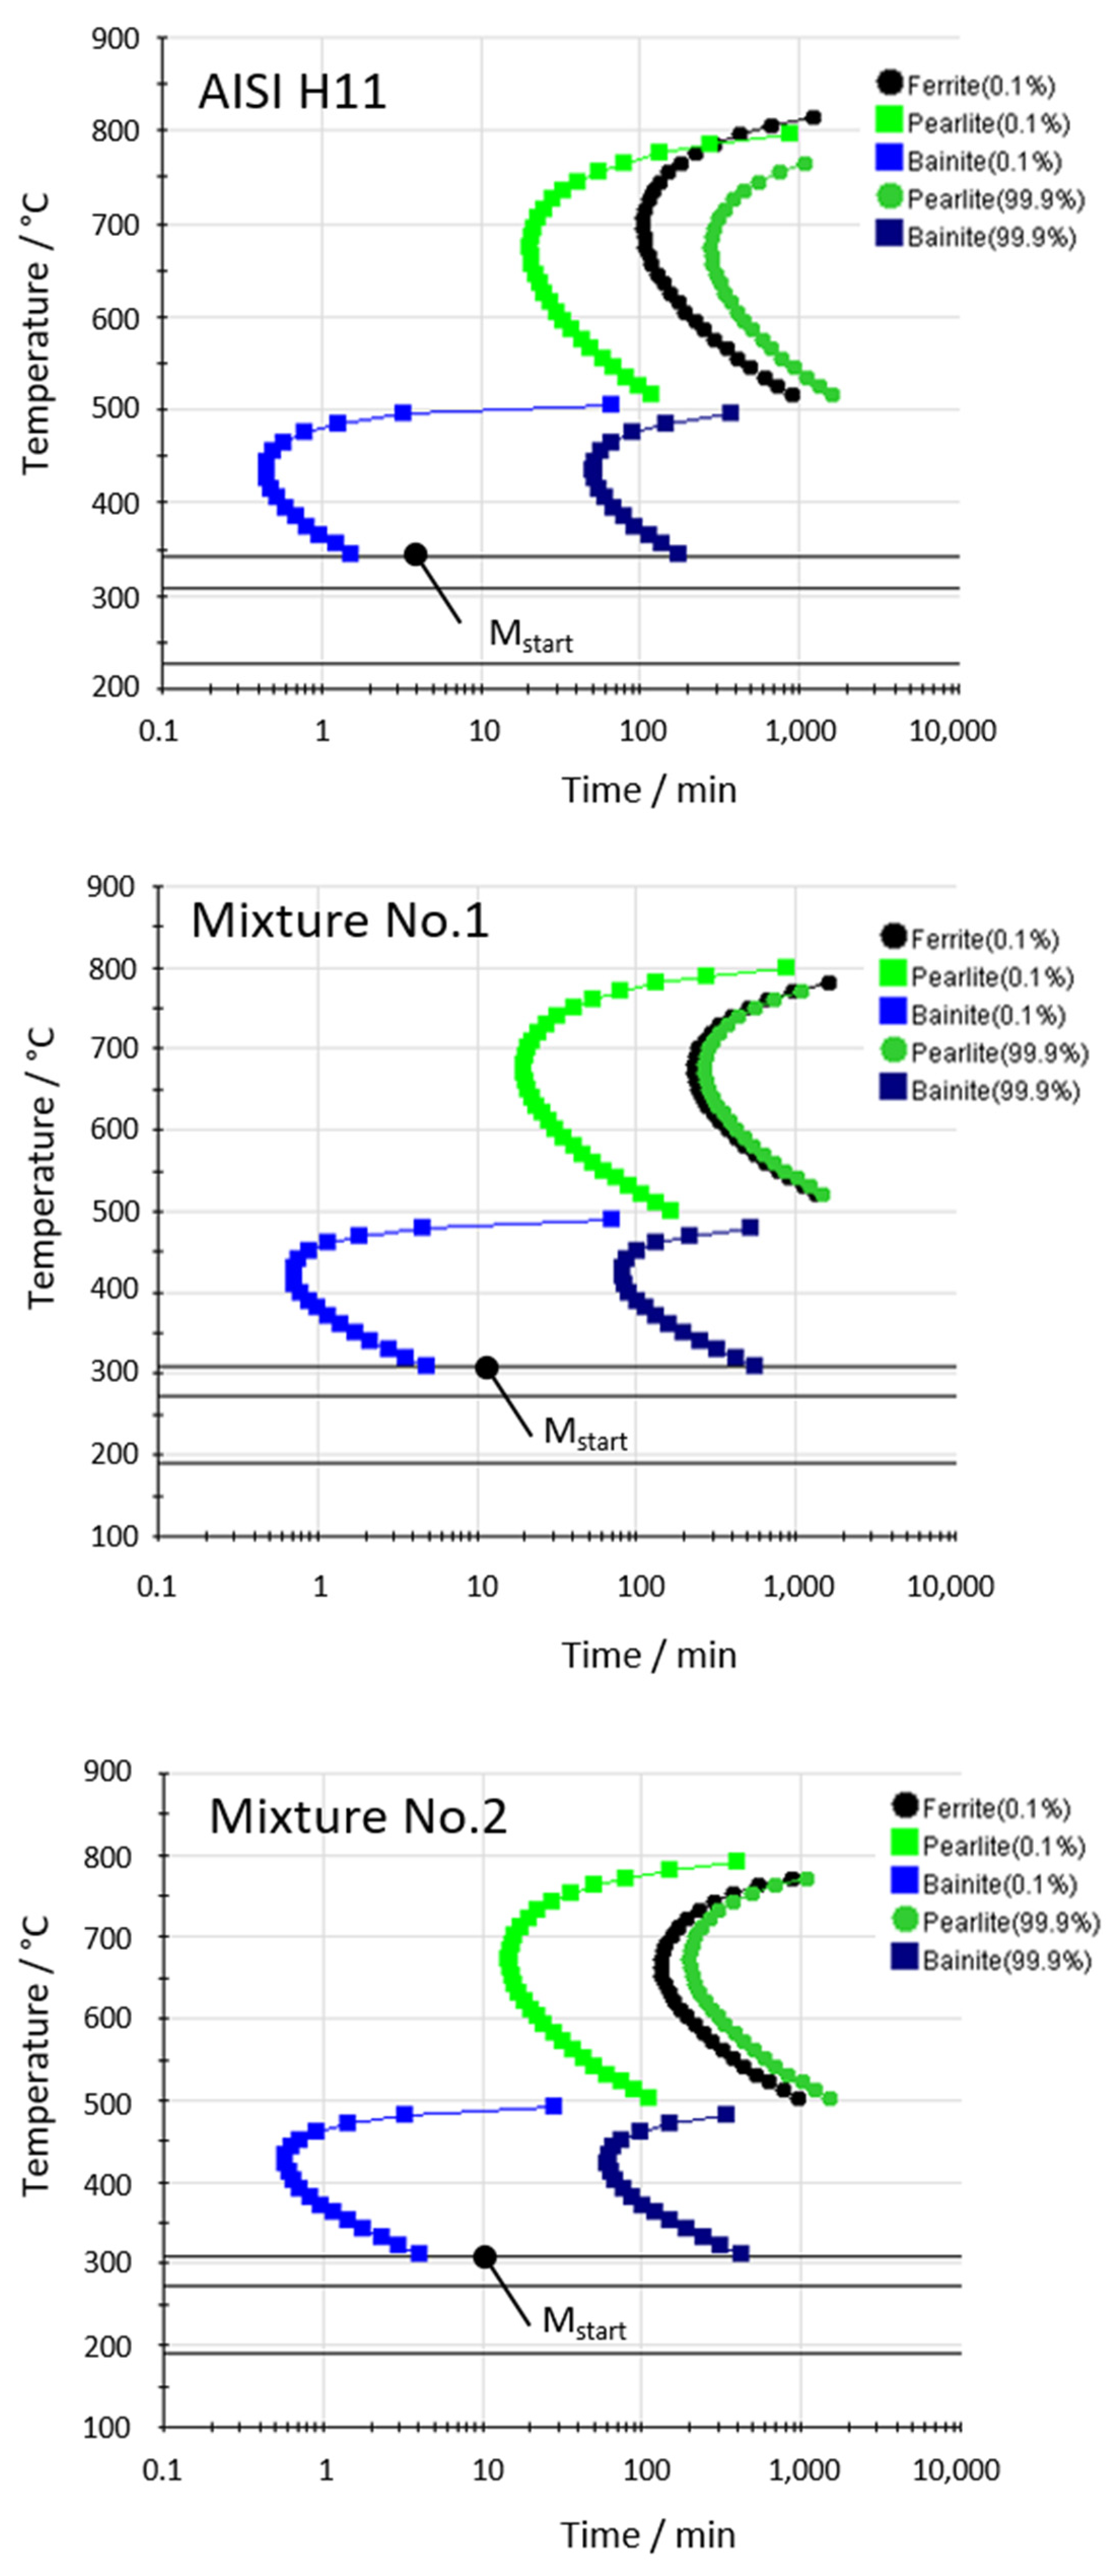
Figure 6, the first layer (black curve) and the lower layers are cyclically exposed to high thermal loads and are re-melted and re-austenitized several times at the beginning of the manufacturing process during the placement of further weld tracks next to or on top.
By continuing the deposition process, thermal energy is permanently introduced into the layer structure by the absorbed laser power, leading to a steady increase in the average interlayer temperature, and a reduction of prevailing temperature gradients and local cooling rates at the top layers. Fresh martensite, which has already formed, is cyclically exposed to a high thermal load and, depending on the prevailing temperature level, can transform itself back into a softer austenite. Depending on the exact process parameters, the deposition strategy, the sample geometry and the prevailing thermal boundary conditions, the interlayer temperature at the top of the specimen can achieve a constant level in the order of or above the martensite start temperature Ms of the processed tool steel after the deposition of a certain number of weld track layers. At this point, a conversion of austenite into martensite can no longer take place during the running DED-LB/M process (compared to the black curve in Figure 6). Rather, the phase transformation into martensite can only occur after the manufacturing process has finished and the complete specimen cools down below MS. As shown in Figure 6, taking the grey curve illustrating the temperature development of a middle weld track layer n as the example, it can be concluded that (in addition to martensite) ferrite and bainite are also proportionally contained in the microstructure with a high probability, due to the process-specific in situ heat treatment related to the layer-by-layer manufacturing approach. However, the proportion of ferritic phases should be smaller compared to martensite, particularly in the C-np-reinforced tool steel powder blends as carbon is a strong austenite former and counteracts the formation of ferritic phases in the steel samples. The TTT diagrams calculated for the processed tool steel powder mixtures in JMatPro support this assumption (see Figure A1).
Nevertheless, to obtain a comprehensive understanding of the impact of C-np on the microstructures of the materials, XRD and EBSD examinations were carried out. The target parameters of these investigations were the RA-c, the texture, the crystallite size of martensite and of the RA and the grain size of martensite.
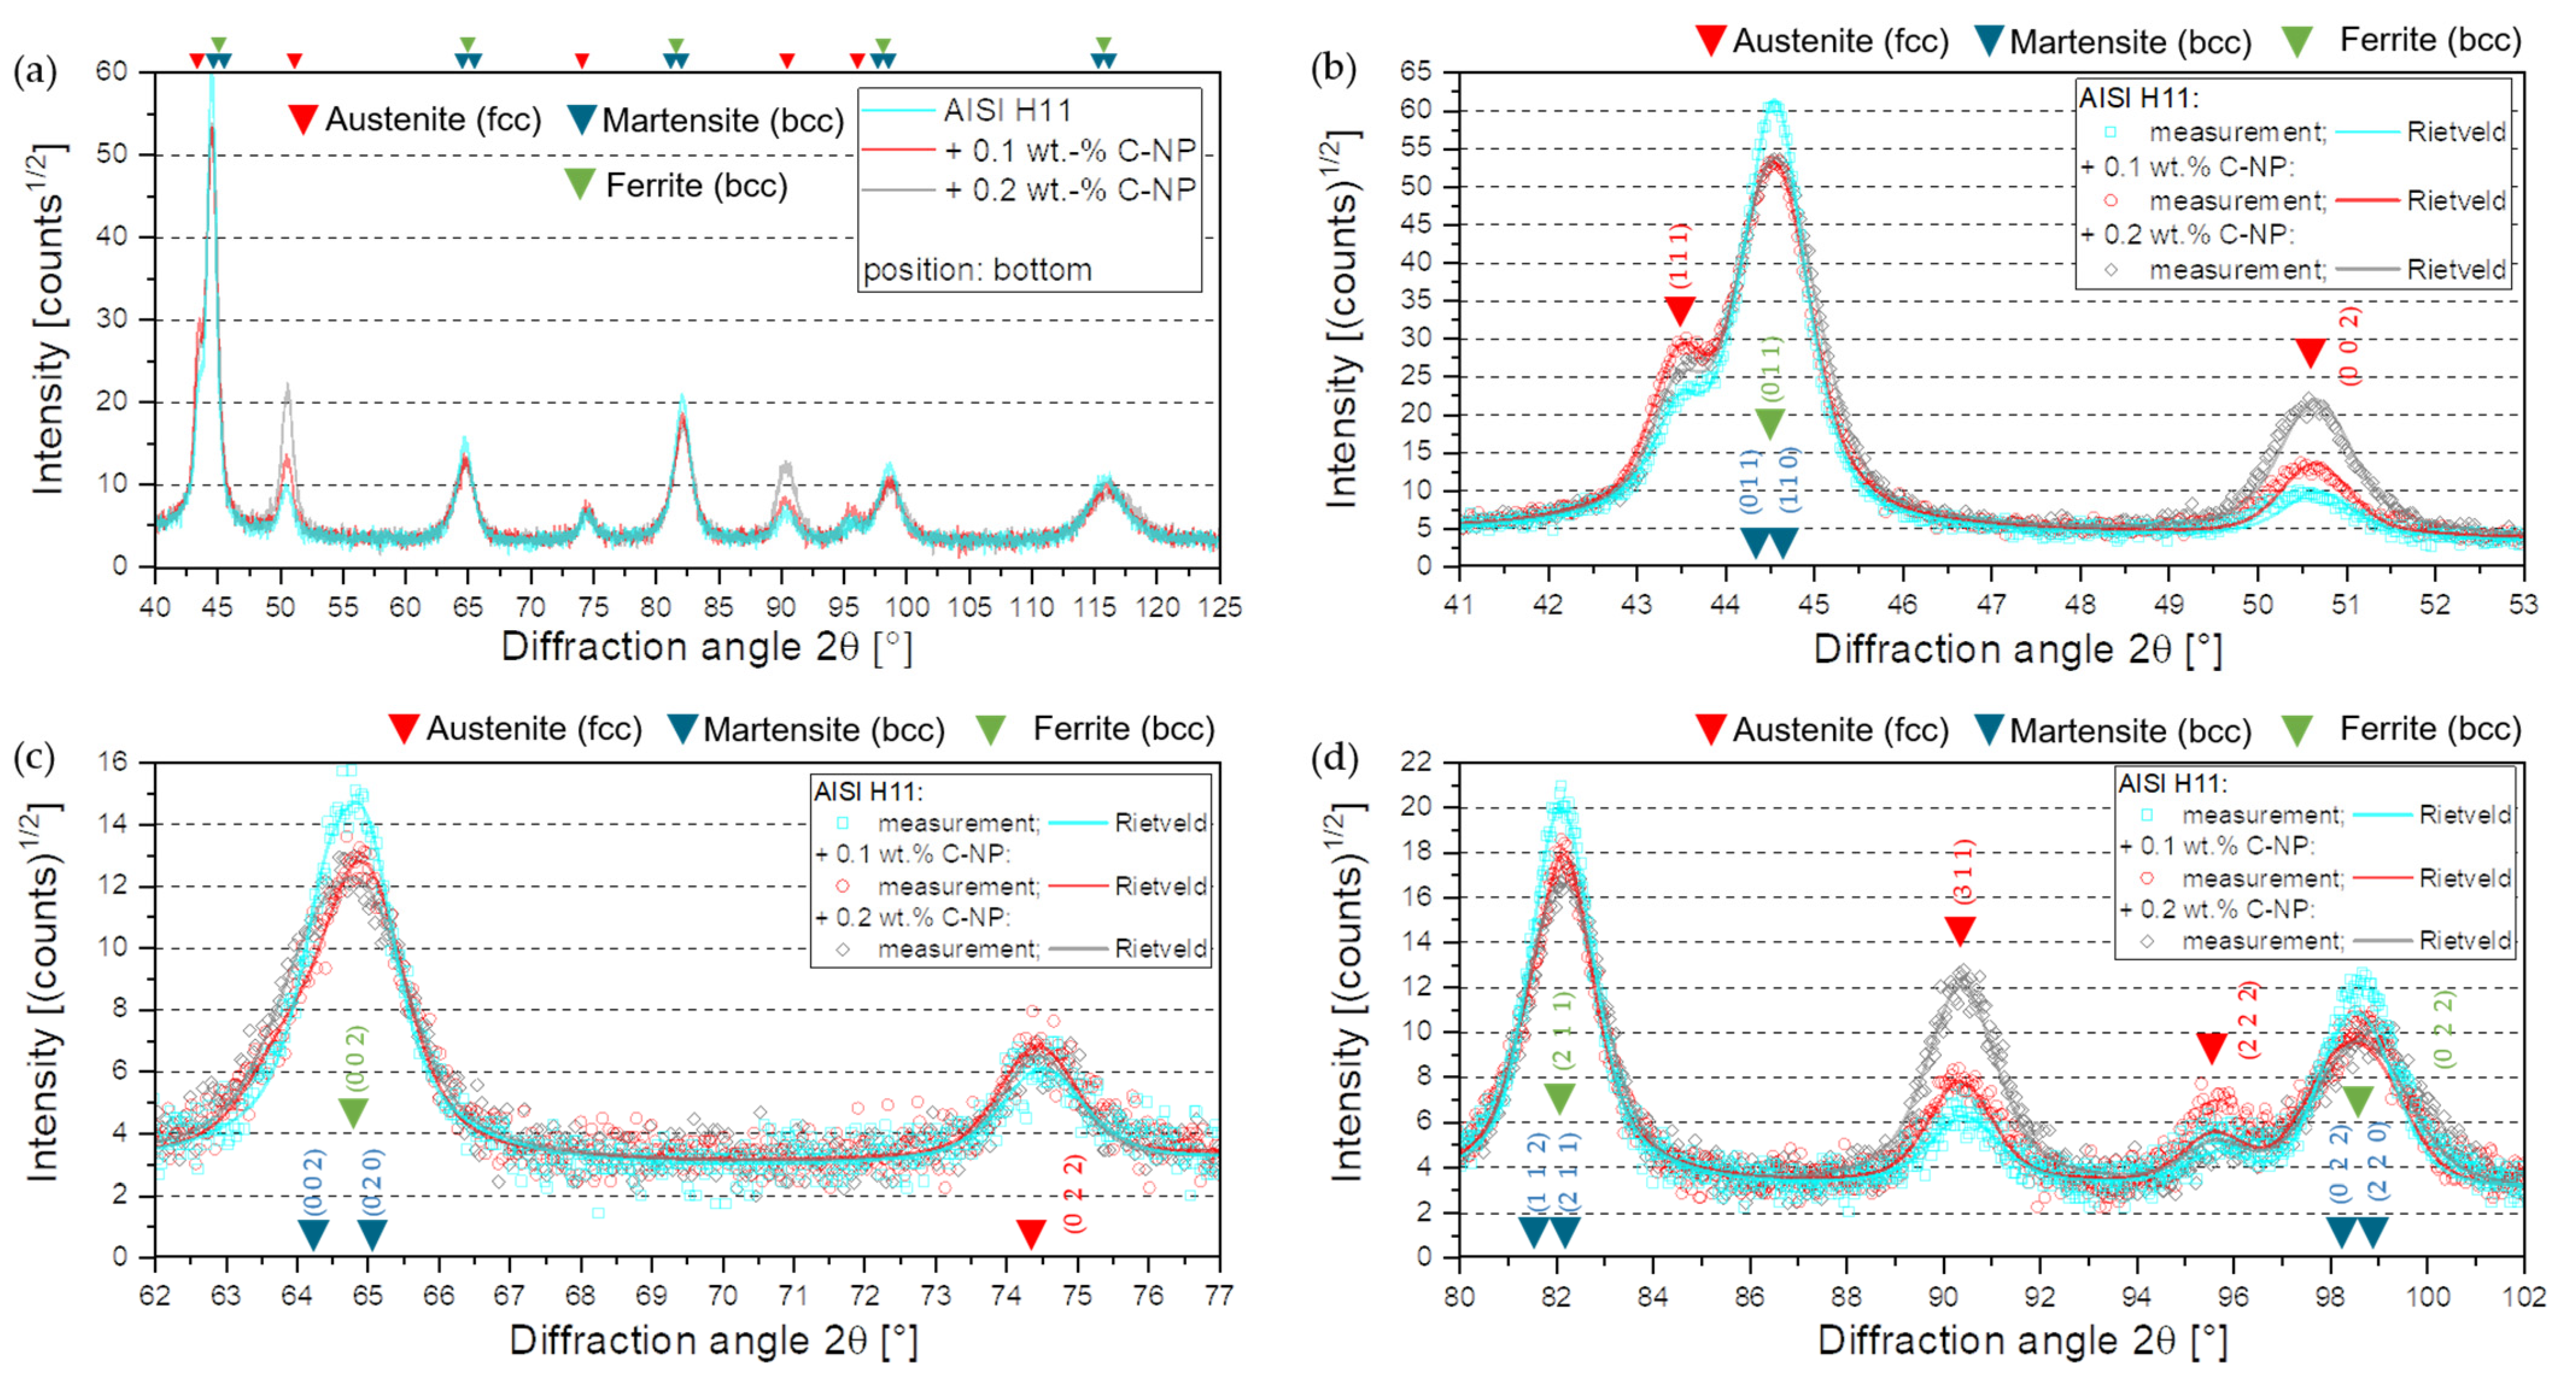
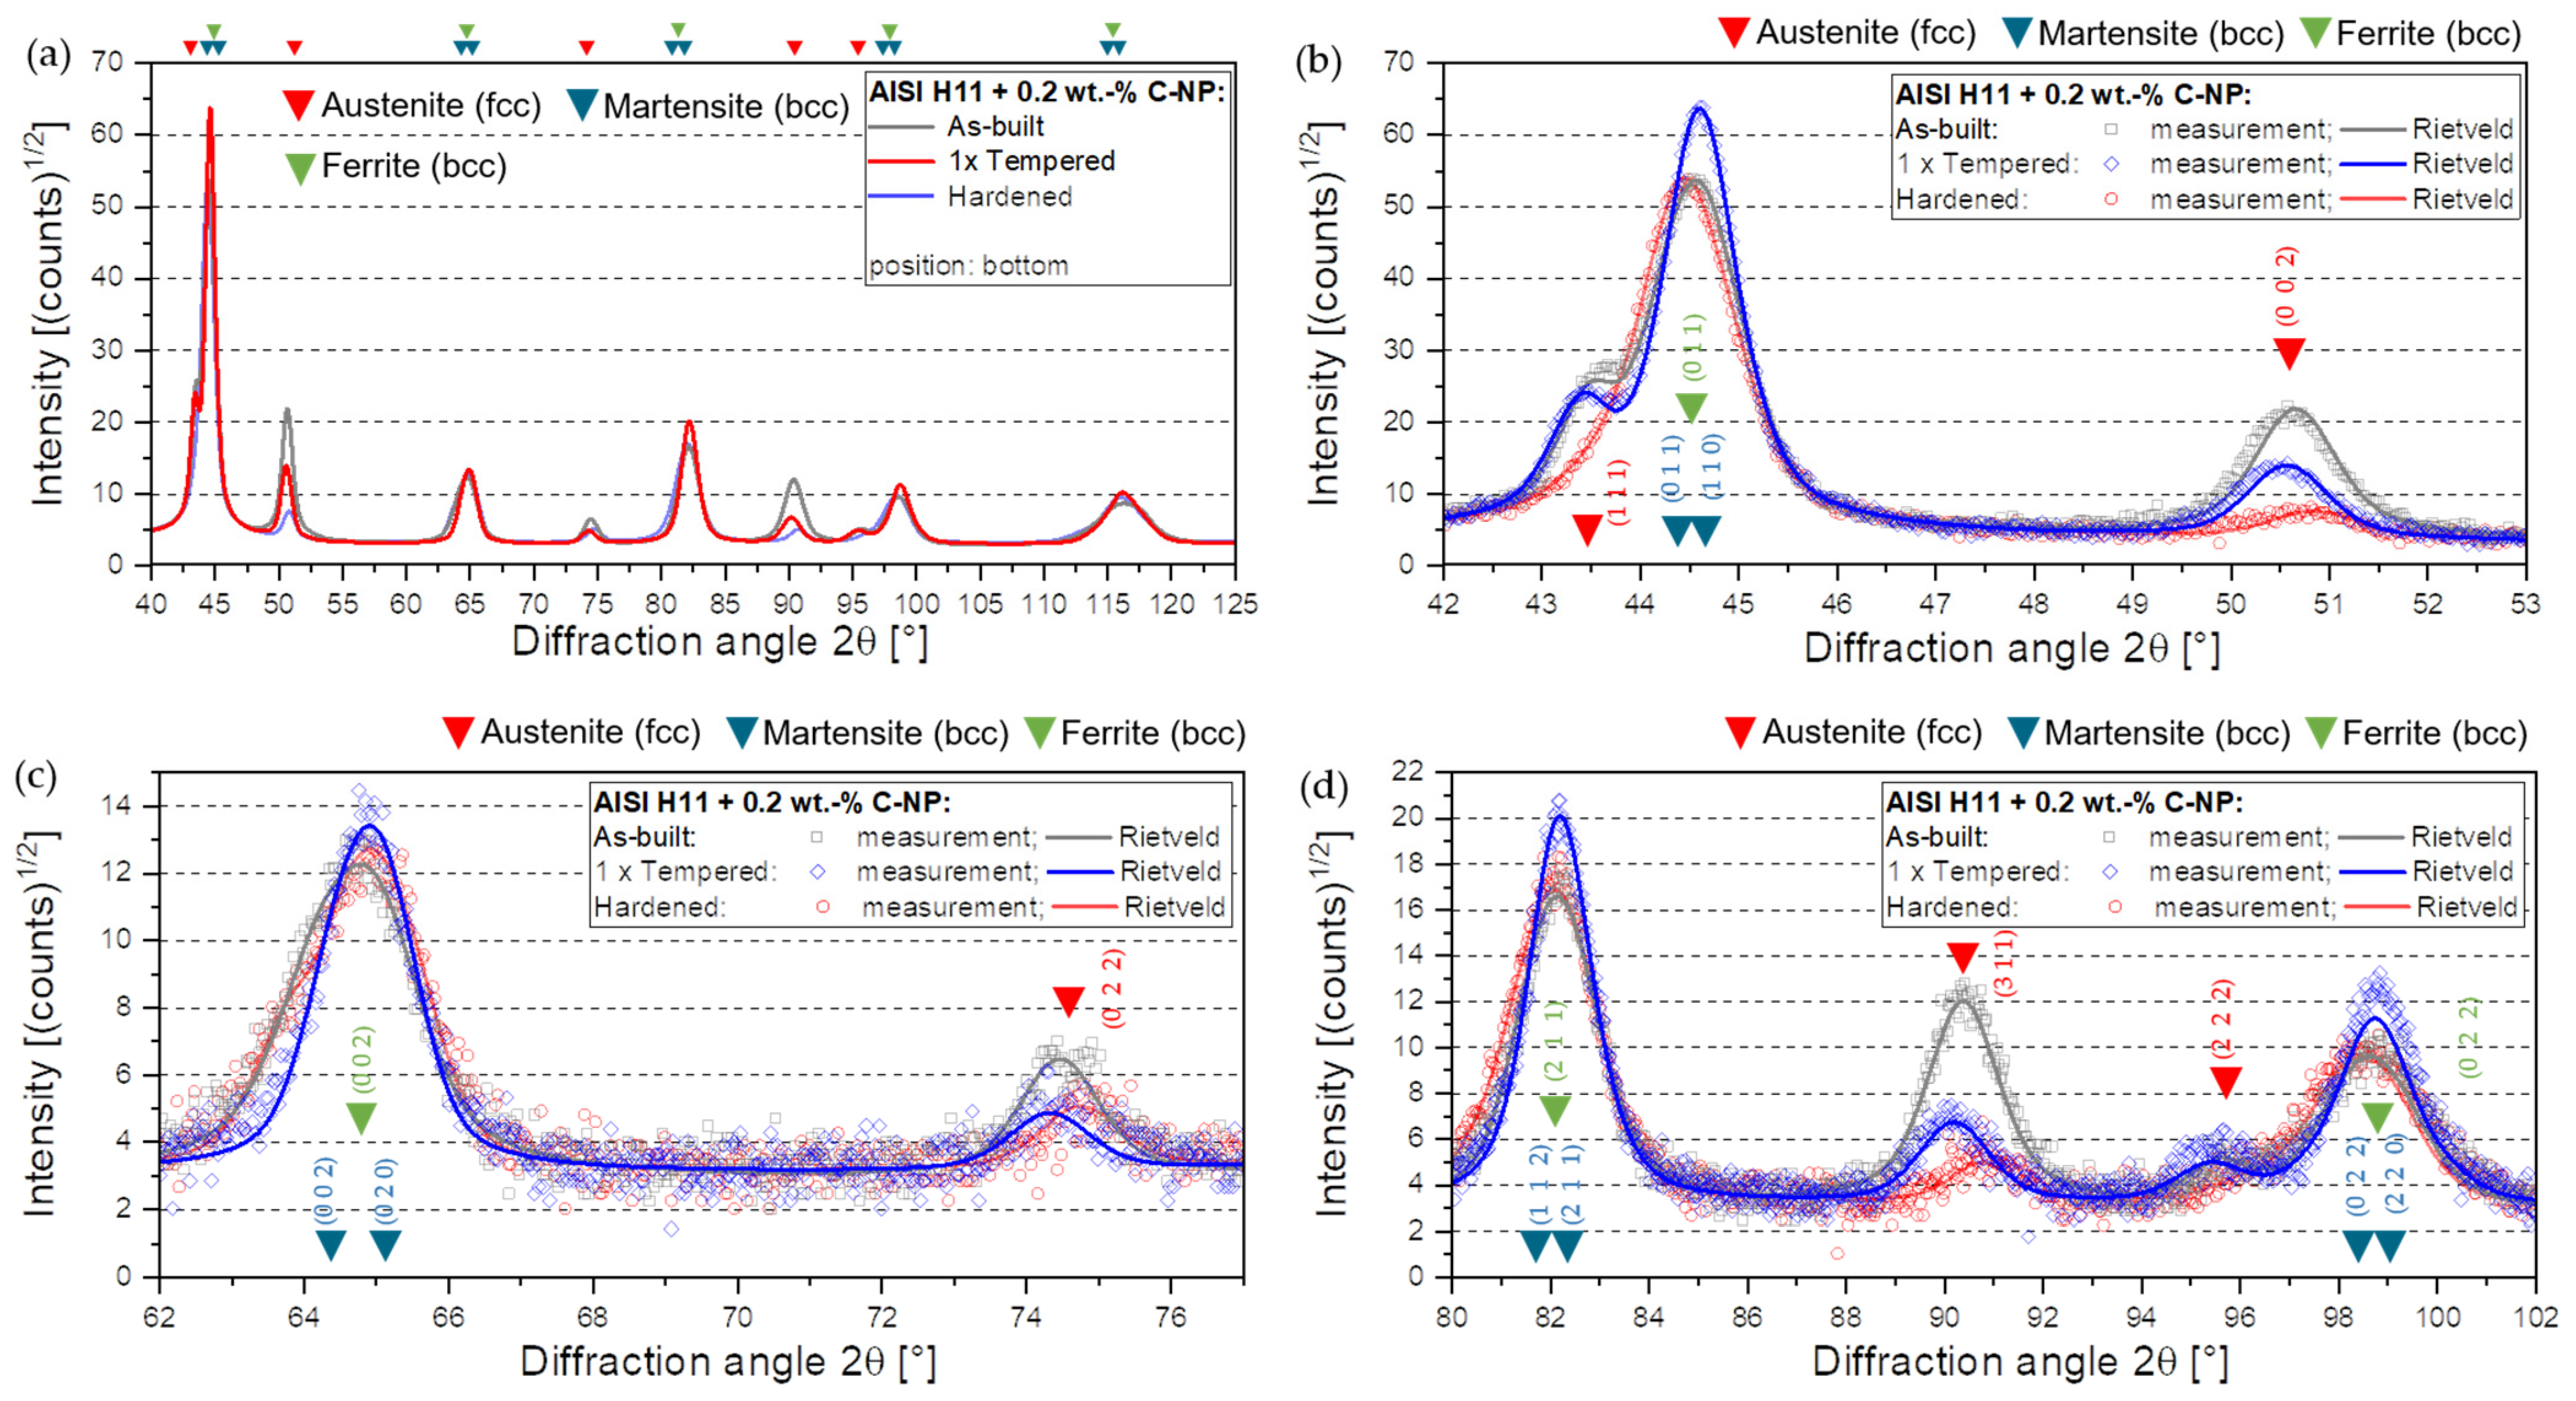
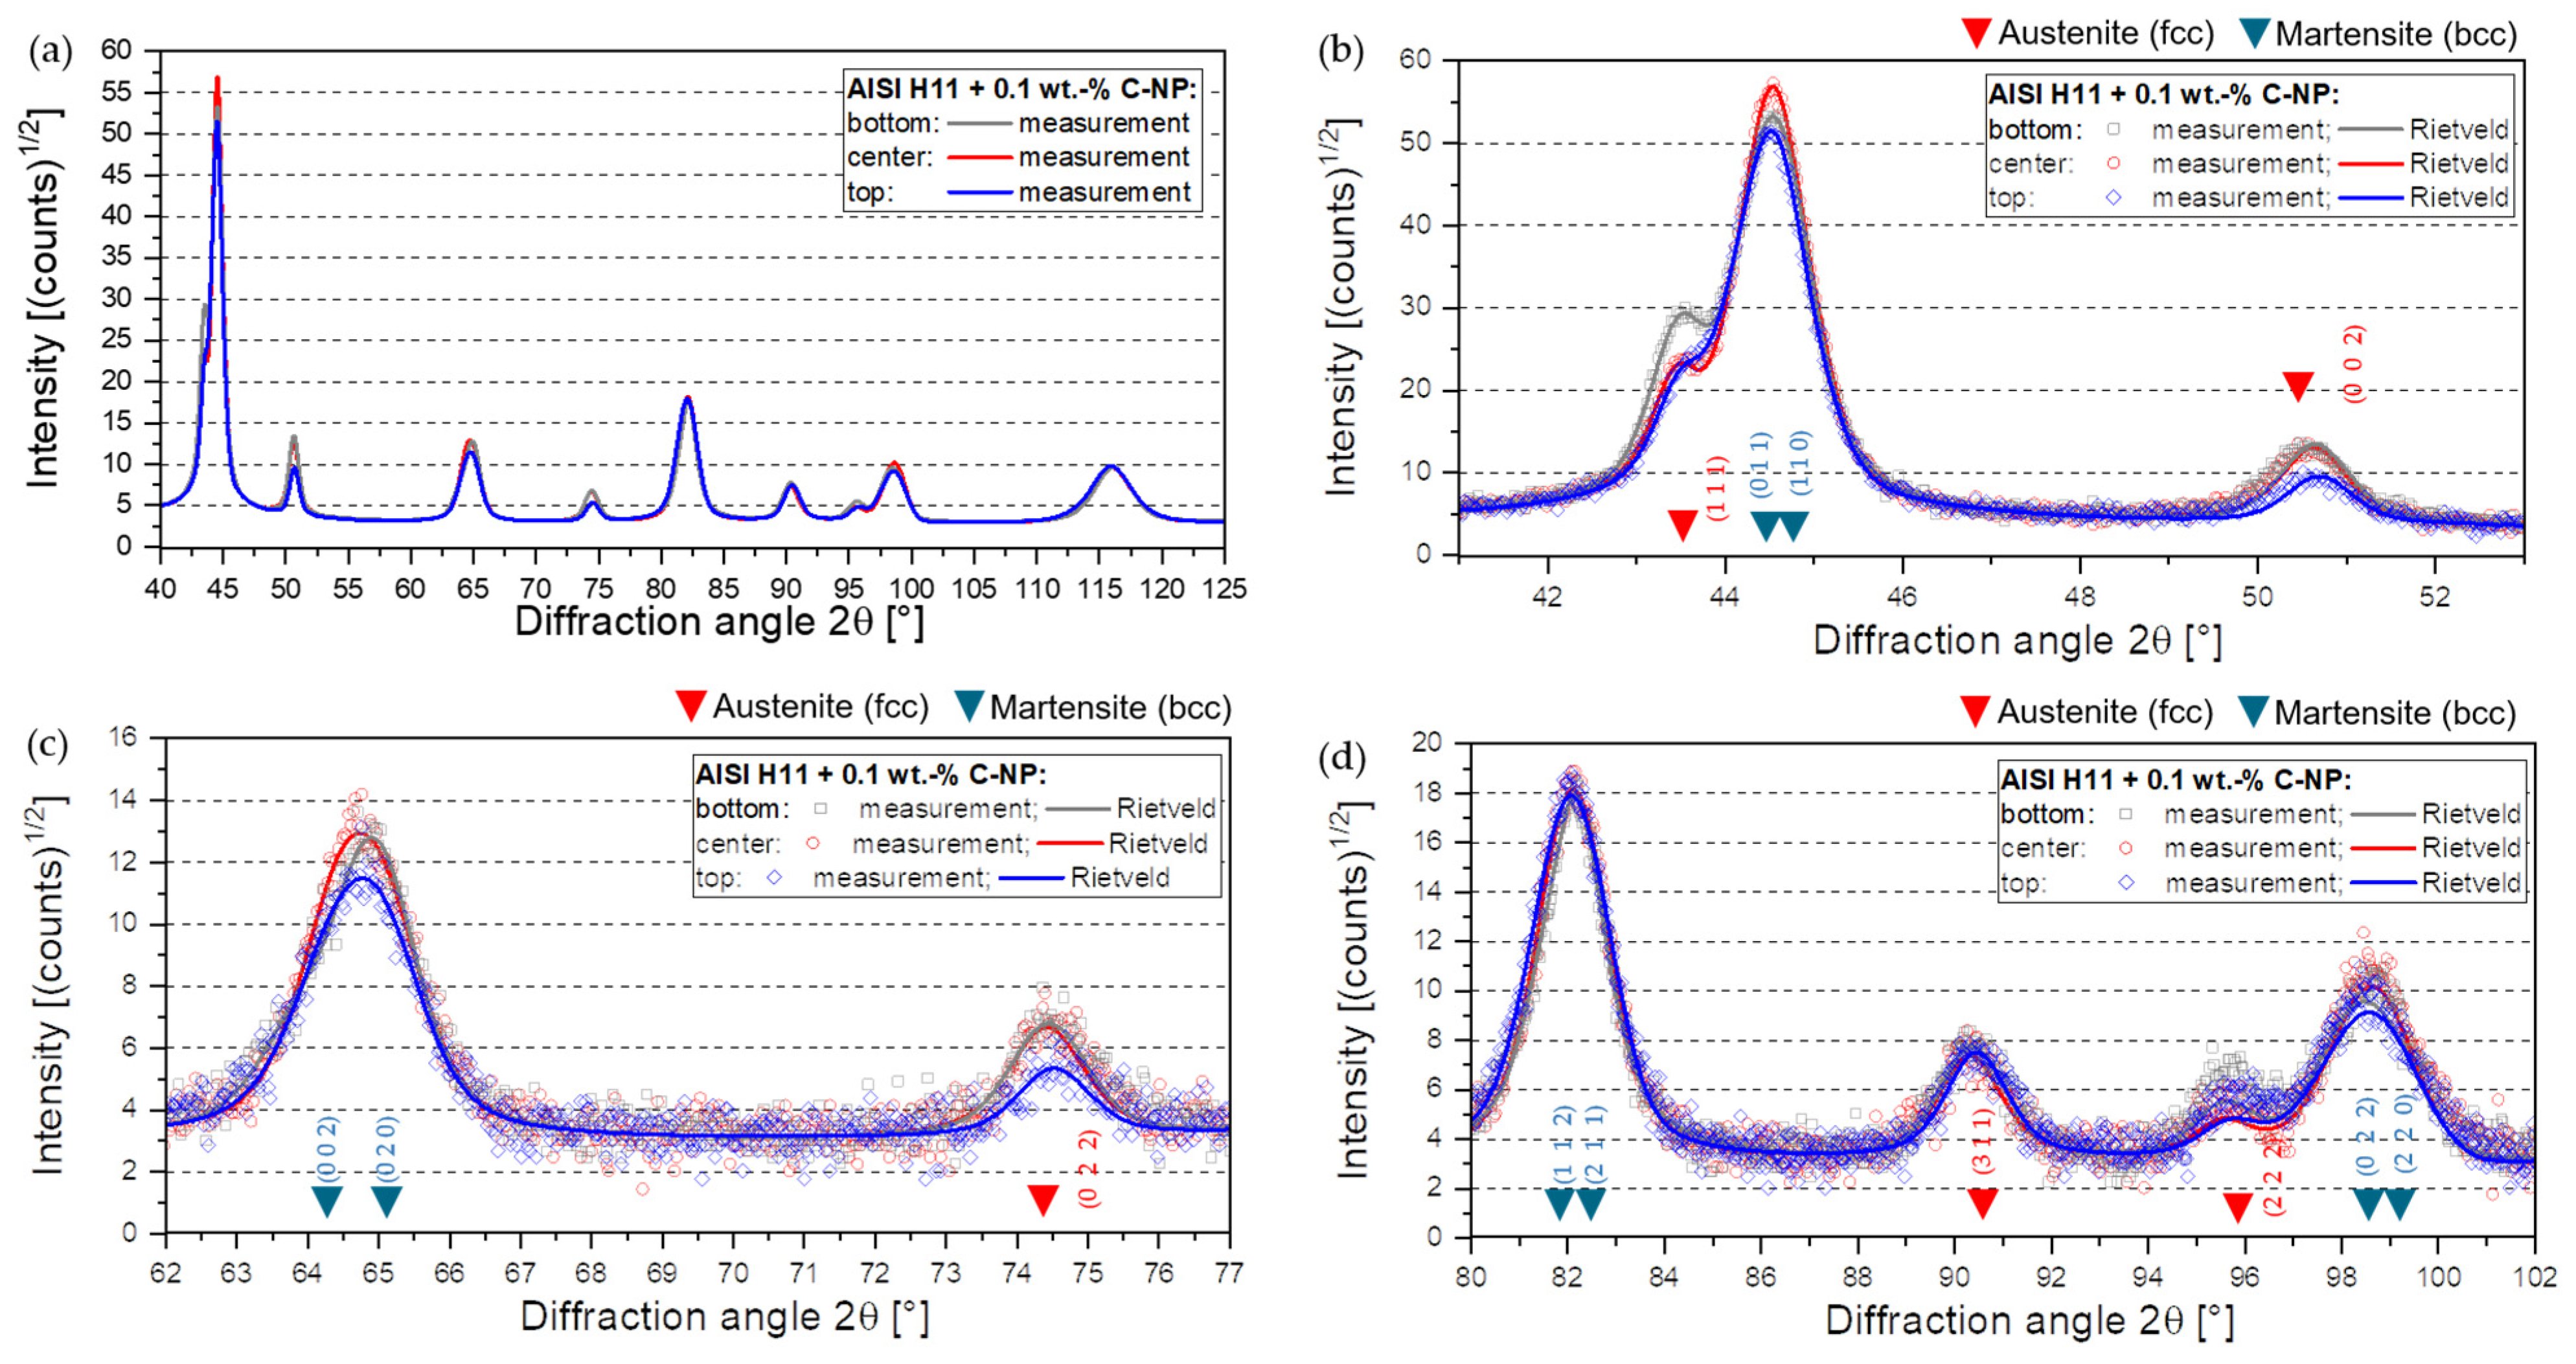
Figure 7 exemplarily presents the measured diffraction diagrams and the reconstructed curves using the Rietveld approximation for the bottom region of specimens in as-built conditions. Regardless of the samples examined, the diffraction patterns could be satisfactorily modelled and reconstructed using the Rietveld approach.
In the diffractograms, diffraction peaks mainly occurred at the reference positions of the RA and ferrite or martensite. In contrast, no diffraction peaks were observed at the reference positions of alloy-specific carbides. In particular, Cr- and Mo-mixed carbides, which (like martensite and ferrite) have a cubic lattice structure, cannot be detected uniquely in the diffraction diagram, since their peaks overlap with those of the α-Fe. On the other hand, primary carbides, e.g., VC or Mo2C, are only present in low concentrations of less than or equal to 1%, which is why they are below the detection limit/measurement sensitivity of the XRD device used. The reflections at the reference positions of ferrite and martensite could not be clearly assigned to the respective phases, due to the high peak widths in combination with the limitations in instrument resolution. Nevertheless, it was found that the diffractograms of the Rietveld method could be better described with a combination of both phases (ferrite and martensite). Without considering ferrite, the quality of the Rietveld fit obtains poor quality for all samples and the deviations between the reconstructed diffraction diagrams, and the experimental data are noticeably larger. Thus, both phases are probably present in the microstructures of the analyzed specimens. Considering that bainite consists of dislocation-rich ferrite surrounded by cementite (Fe3C, iron carbide), the detected ferrite peaks most likely indicate the presence of bainitic ferrite in the microstructure. This would also match well with the above-described theory of in-process heat treatment. A reliable determination of both phase fractions cannot take place due to the high correlation of the scaling factors of martensite and ferrite. This is also not relevant with regard to the quantification of the Ra content since the diffraction peaks of the RA occur as single peaks.
A total of 10 martensite, 5 ferrite and 5 retained austenite reflections were independently considered for the reconstruction of the experimentally determined diffraction patterns on the examined tool steel. Table A1 (Appendix C) summarizes the peaks considered with respect to the metallurgical phase and their crystallite orientation (Miller indices).
Although all specimens have the same martensite, ferrite and RA peaks, the intensities and half widths of individual reflections differ depending on the concentration of the added C-np or the total carbon content, respectively. By comparing intensities of austenite peaks of equal spatial orientations (same Miller indices) with each other (Figure 5b–d), it becomes obvious that a higher carbon content leads to higher peak intensities and a stabilization and enhanced formation of the high-temperature austenitic phase in the steel samples. In contrast to this, the intensities of the diffraction peaks of martensite and of ferrite seem to be weakened with increasing C-np content, pointing out a decrease in the concentration of these metallurgical phases (see Figure 7b–d). These observations correlate well with the outcomes of the JMatPro calculations (see Appendix A) and can be explained by the fact that carbon acts as an austenite former. Consequently, a higher total carbon content in the steel sample leads to a decrease in the martensite transformation temperatures (Ms, M50%, M90%). This leads to a stabilization and higher concentrations of the RA in the C-np-enriched tool steel specimens compared to the pure AISI H11 sample.
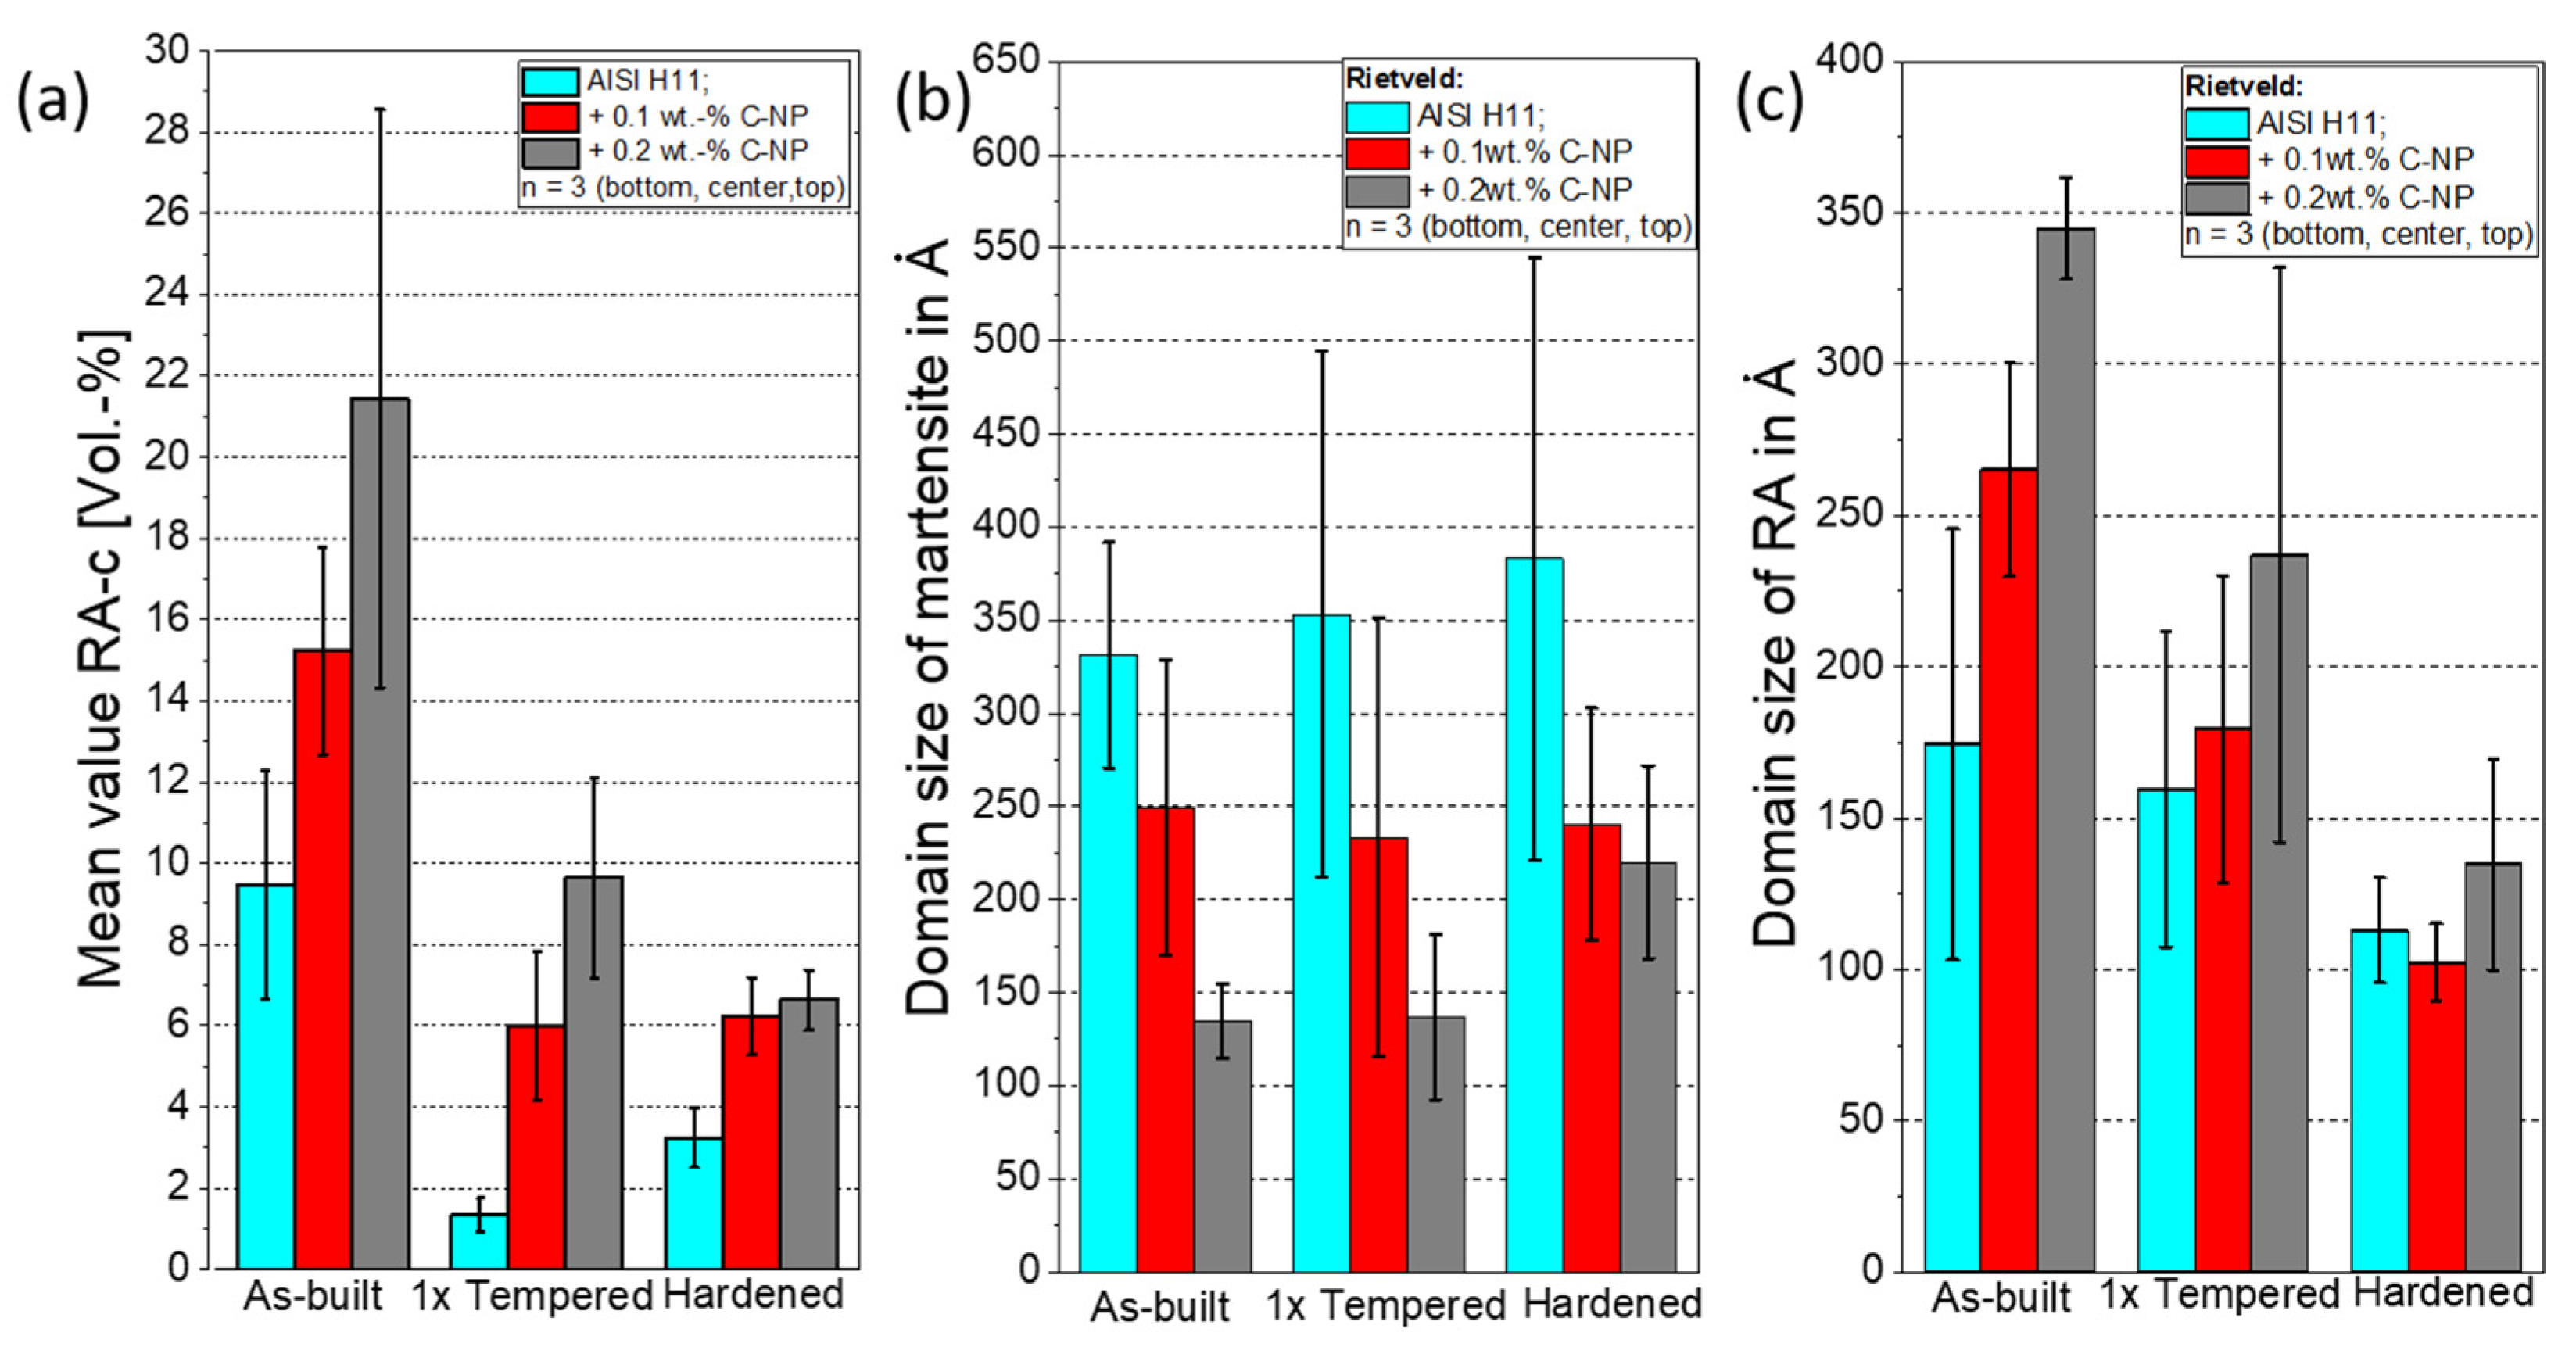
Figure 8a shows the mean values of the RA content determined using XRD for specimens under as-built conditions and post-heat-treated samples. The mean value of the RA-c of specimens in as-built conditions increases from 9.5 ± 2 vol.% for the unmodified AISI H11 sample to 15.2 ± 2.6 vol.% for the sample manufactured out of powder mixture No. 1 and to 21.4 ± 7.1 vol.% for the specimen containing a maximum C-np content of 0.2 wt.-% (powder mixture No. 2). Consequently, the addition of 0.2 wt.-% C-np more than doubled the RA-c on average. The large standard deviations of the mean values in the order of 20% or more indicate a location dependency of the RA content (see Figure 8a and Table 6).
Considering the diffraction diagrams of the local measurements carried out for the sample manufactured using the powder mixture No. 1 (see Figure A3 in Appendix D), it becomes obvious that the intensities of the peaks of the same phase and with the same orientation are dependent on the measurement position.
There seems to be a tendency for the intensities of the austenite peaks in the bottom region of the sample to be larger than in the middle or upper sample area. By comparing the individual measuring values of the RA content (listed in Table 6), with respect to the measuring position, the maximum RA content is independently detected in the bottom region on the investigated tool steel powder mixture. The RA content tends to decrease within higher weld track layers and reaches its minimum in the middle and top section of the specimens. The observed local dependency of the RA content can probably be traced back to the in-process heat treatment of the lower weld track layers using strong thermal cycling and with repeated re-melting and re-austenitizing at the beginning of the manufacturing process.
Figure 8b,c show the mean values of the domain size of martensite and of the RA for the processed tool steel powders and with respect to the heat treatment performed. As already mentioned in Section 3, the values are derived based on the Rietveld analysis. The domain size of martensite tends to decrease with increasing content of nanoscale carbon additives. In the AISI H11 sample, the measured mean value corresponds to 330 ± 61 Å, and takes on a smaller mean value of 180 ± 117 Å for the specimen produced with the powder mixture No. 1 containing 0.1 wt.-% C-np. The smallest value of 135 ± 20 Å is obtained for the specimen with a maximum C-np concentration of 0.2 wt.-%.
In contrast to this, the domain size of the RA rises up with the increasing amount of C-np added to the AISI H11 host powder. For the pure tool steel sample, the mean value of the RA domain size is equivalent to 175 ± 71 Å, and increases to 265 ± 35 Å for the specimen manufactured with 0.1 wt.-% C-np. For the specimen with a maximum C-np-content of 0.2 wt.-%, the domain size takes on a maximum mean value of 345 ± 17 Å. The increase in the austenite domain size is caused by the concentration of the RA significantly increasing with the amount of C-np in the powder or the total carbon content, respectively. In this way, the probability for the formation of the blocky RA is enhanced.
The smaller measuring values of the domain size of martensite indicate a finer martensitic (ferritic) structure in the C-np-enriched specimens. Consequently, it seems that the C-np promotes the formation of finer martensite grains within the dendrites or primary austenite grains, respectively.
However, the domain size determined with XRD cannot be equated with the grain size of martensite in the classical understanding of this matter. Rather, this quantity describes the area within a grain in which the lattice planes are oriented parallel to one another, and (associated with this) in which the reciprocal lattice vectors have the same orientation. Nevertheless, small domain size values point out a fine-grained structure with high probability, as long as there is no dominant preferential direction of the crystal orientation.
In order to verify and quantify the impact of C-np on grain size and to confirm the results of the XRD investigations, EBSD measurements were carried out with the pure tool steel sample and the sample manufactured out of the powder mixture with maximum C-np content of 0.2 wt.-%. Thereby, the focus was placed on specimens in as-built conditions. 
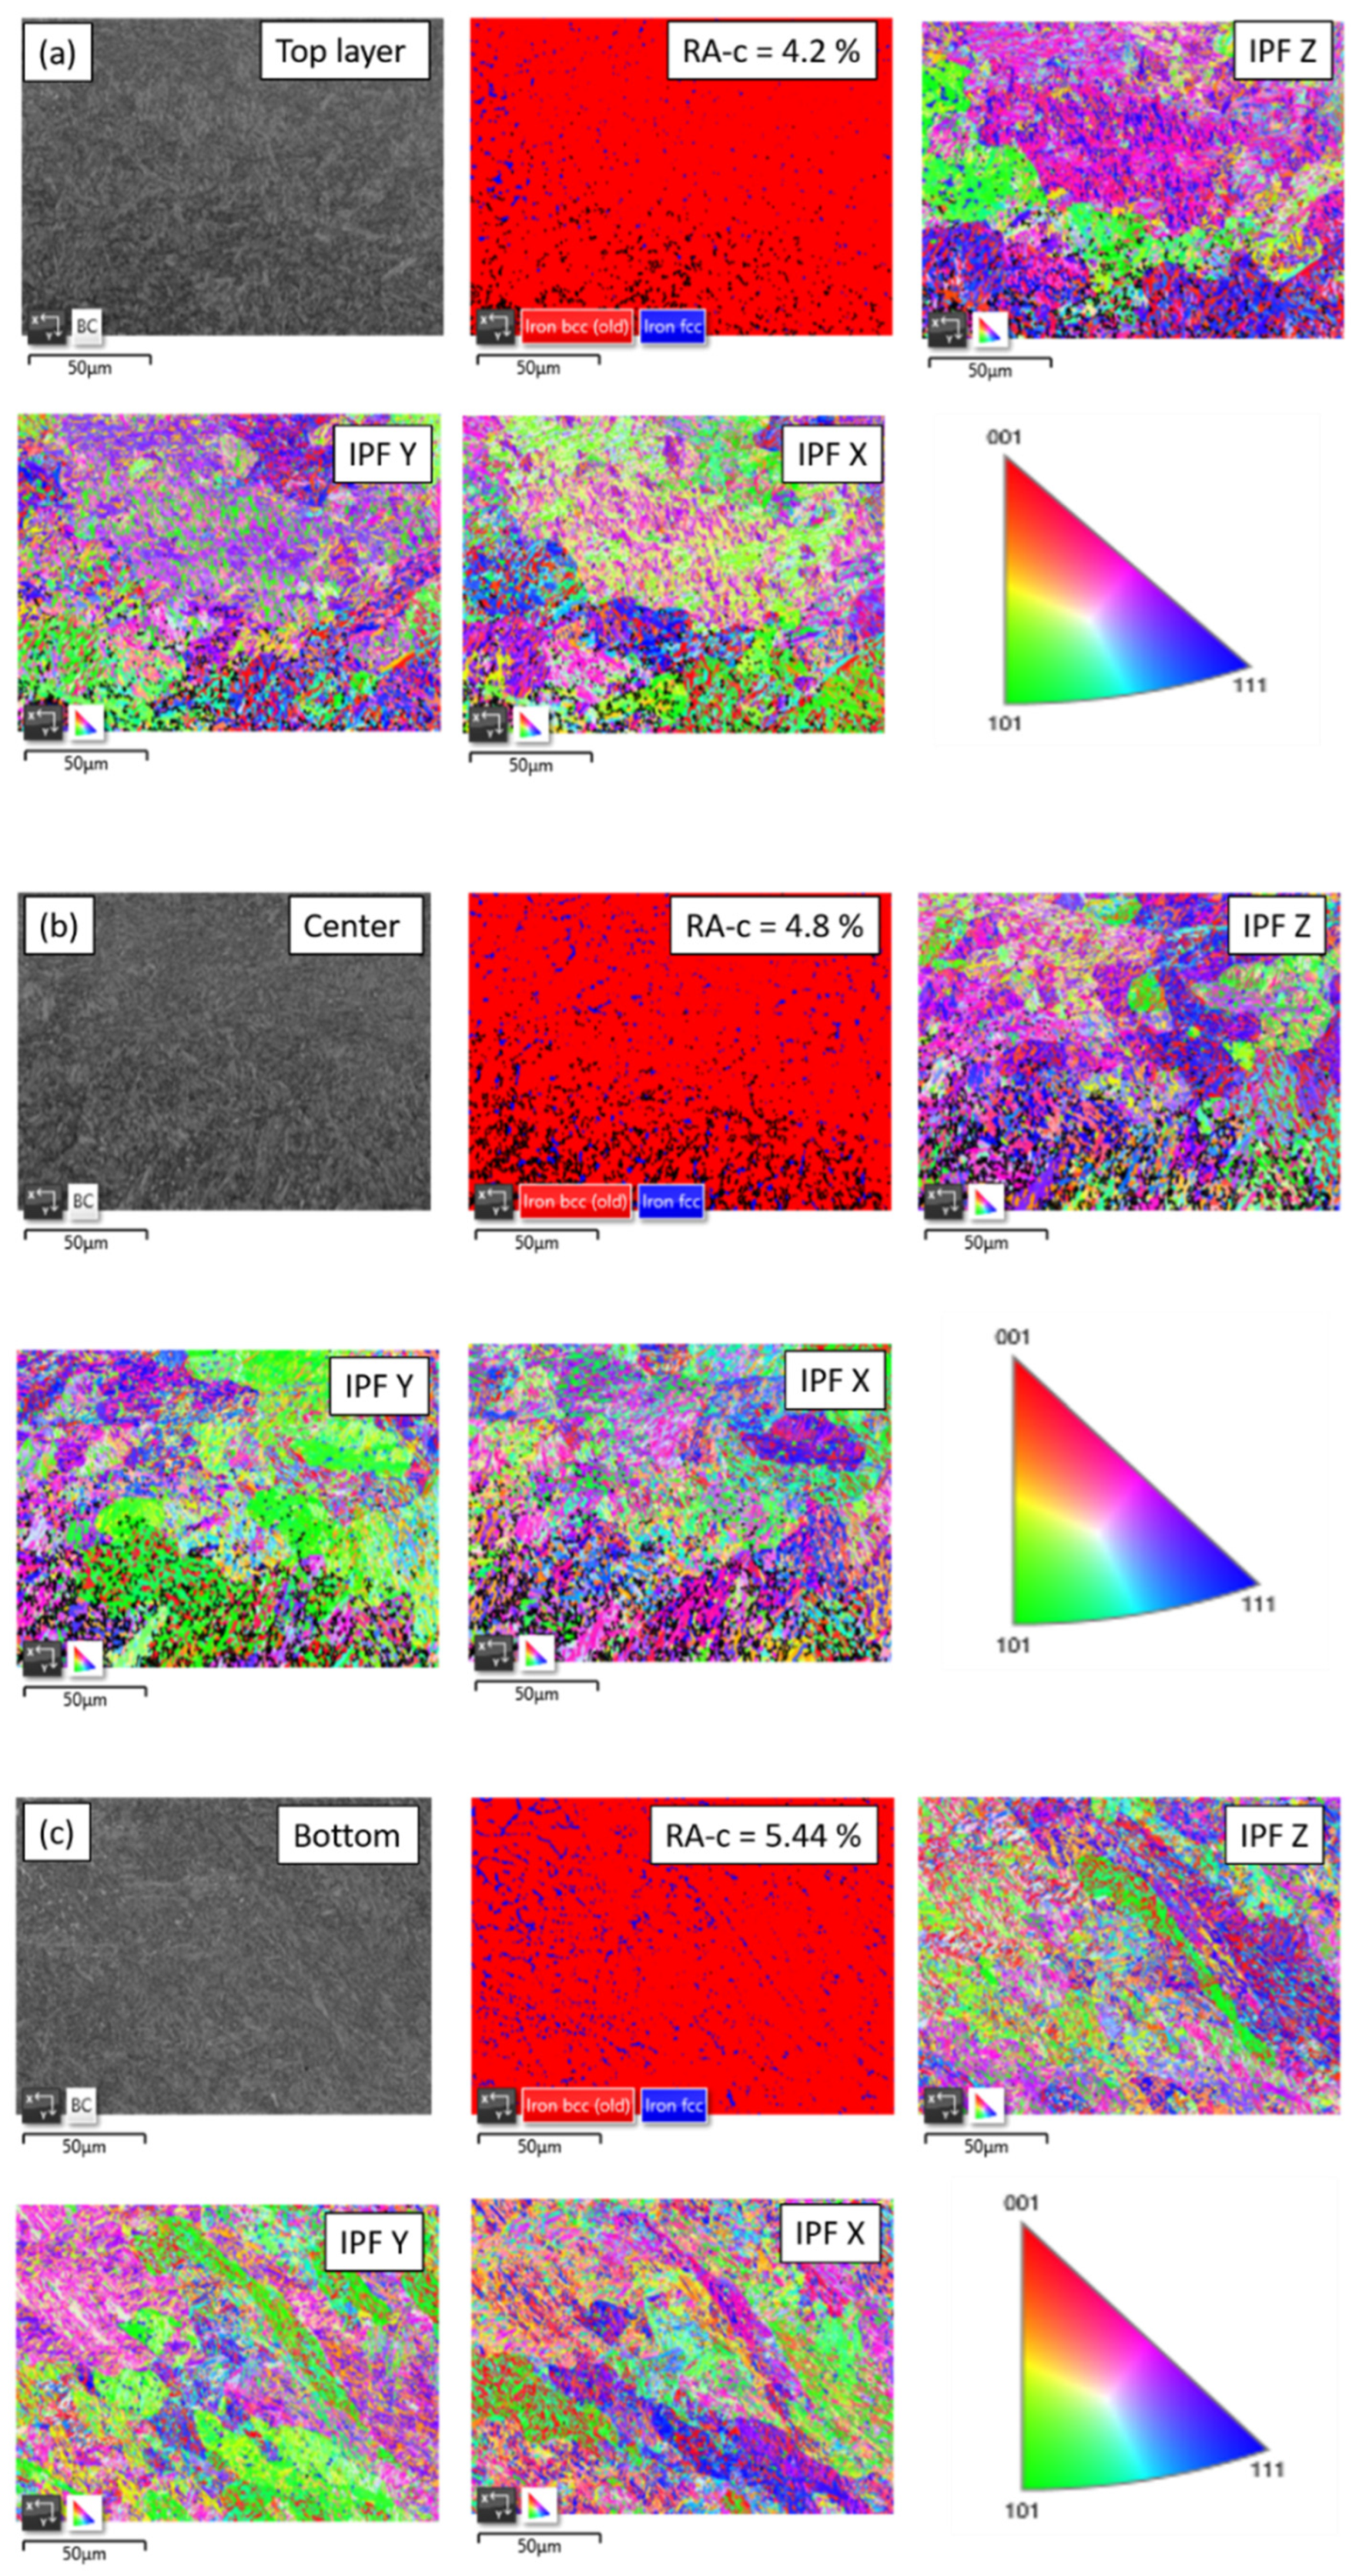
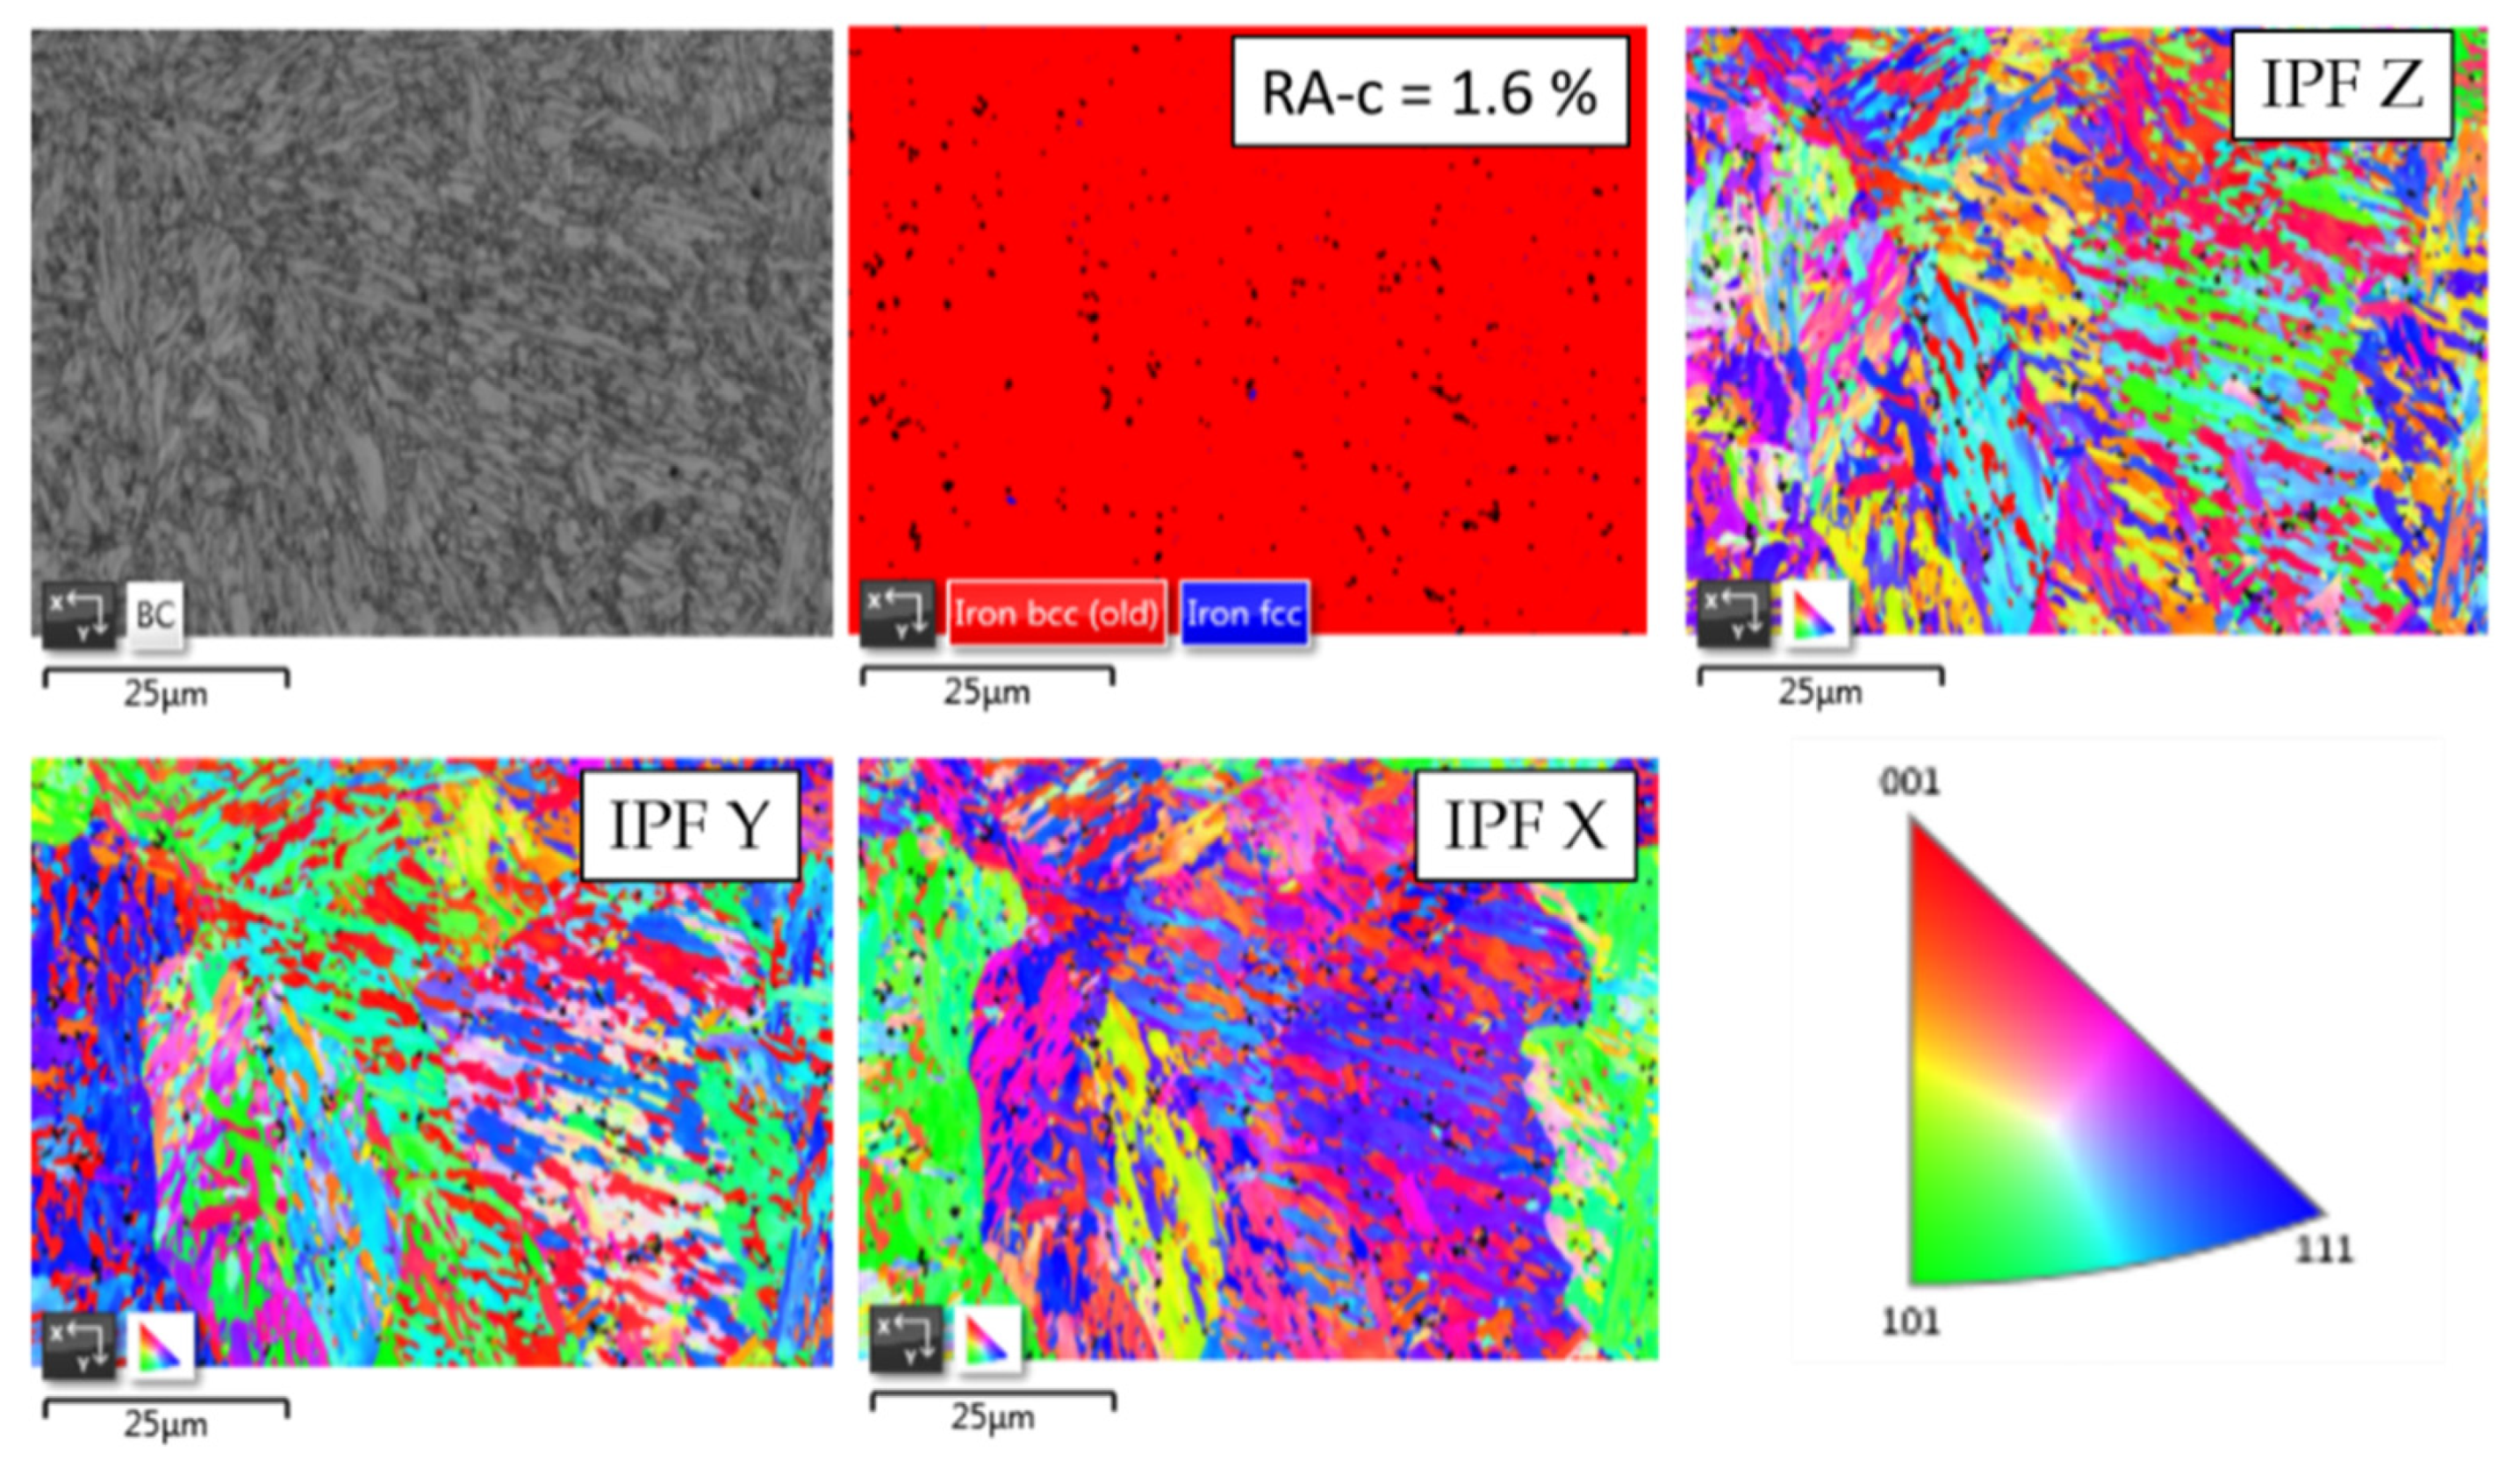
Figure 9 exemplarily shows the determined phase fractions of the RA (FCC) and martensite (BCC) and the inverse pole figures for the sample manufactured with 0.2 wt.-% C-np. The measurements were carried out at three characteristic positions: top, center and bottom.
Based on the EBSD analysis the RA content, the unmodified AISI H11 sample is determined to be 1.3% in the top layer, about 1.6% in the center region and 1.8% in the bottom section. Contrary to the value of the RA content measured, the C-np-reinforced tool steel sample is 4.3% in the top layer, 4.8% in the center and 5.4% in the bottom section, which is noticeably larger. The observed dependency of the RA content on the C-np concentration in the powder agrees well with the results of the XRD measurements; also, if the absolute values are not directly comparable due to the different measuring methods, the tendency is the same. Consequently, the EBSD analysis confirms that the added nanoscale additives act as austenite formers, stabilizing the formation of the RA. Additionally, the EBSD examinations also confirm the local dependency of the RA content.
By analyzing the inverse pole figures, presented in Figure 9 and Figure 10, no preferred direction of a C-np-concentration-dependent crystal orientation is detected. As can be seen from the inverse pole figures, the crystallites are in equal orientations, both in the pure tool steel sample and the specimen manufactured out of powder mixture No. 2 (+0.2 wt.-% C-np). This result is also in good accordance with the findings of the XRD investigations, in which a preferred orientation of crystallites could not be clearly identified.
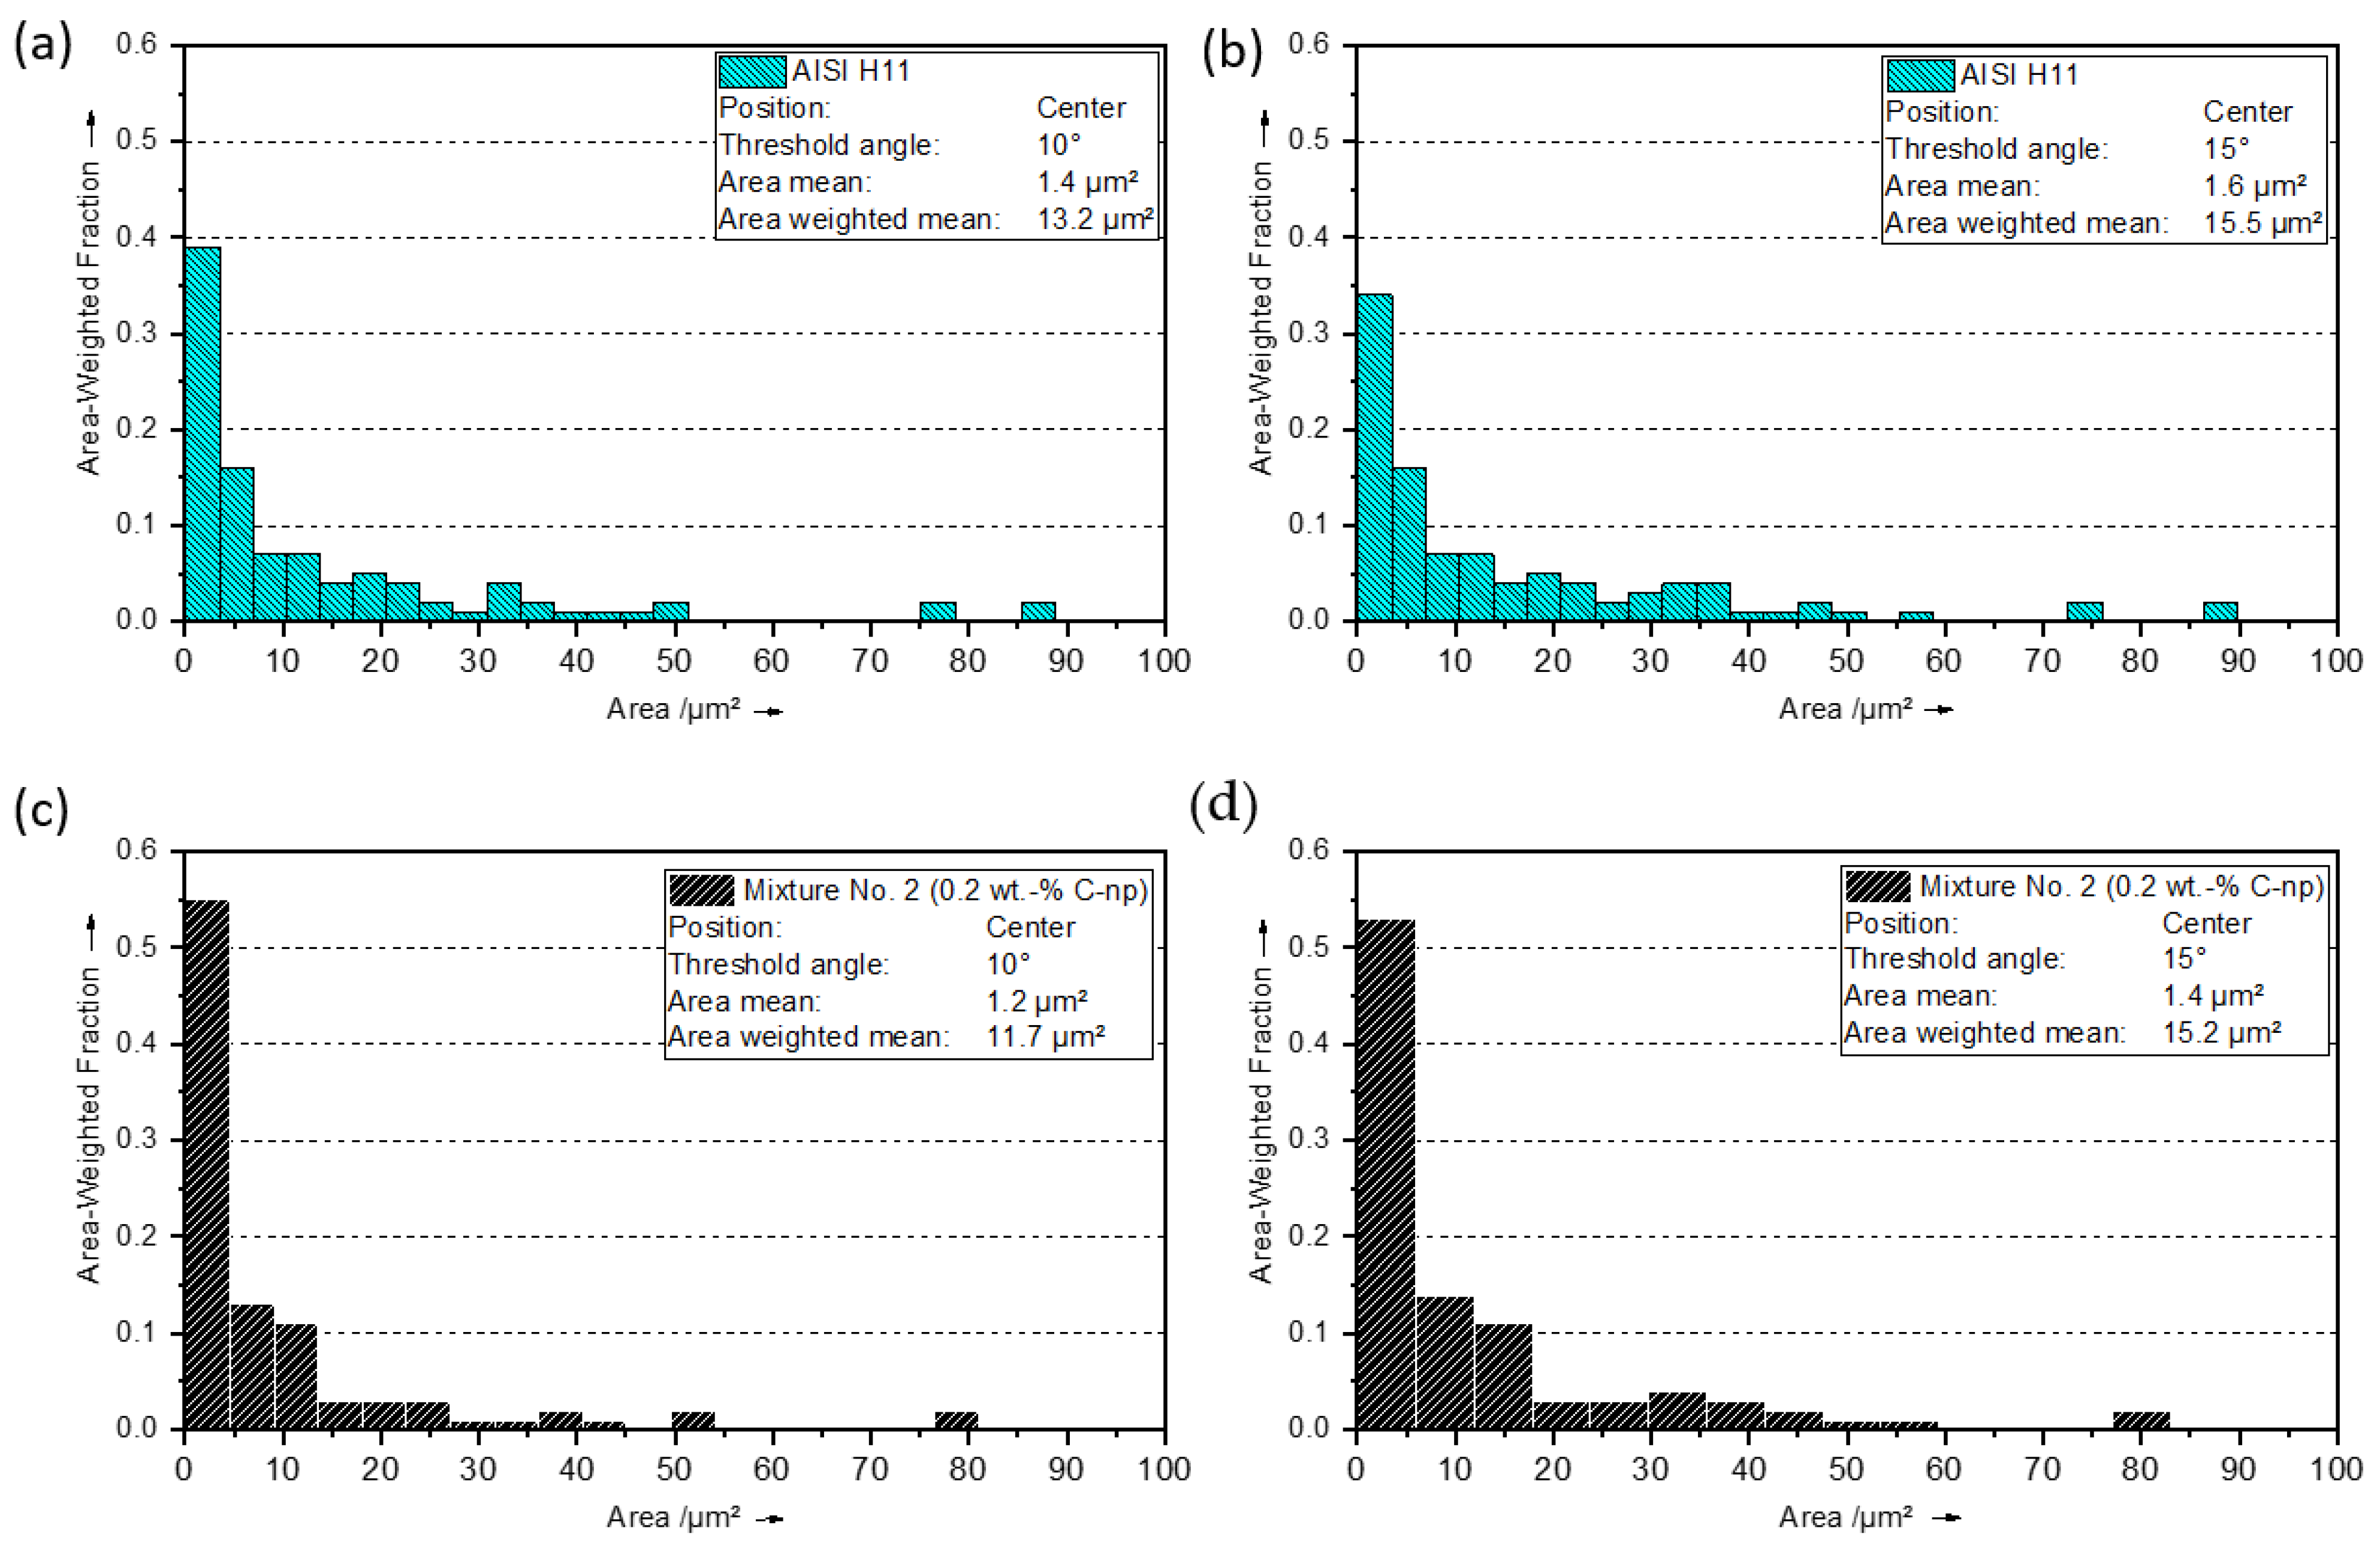
However, C-np seem to have an impact on the resulting grain size (martensite needle size). Figure 11a–d present the distribution as-area-weighted fraction of the analyzed martensite grain cross sections for the pure sample and the specimen modified by adding 0.2 wt.-% C-np for two different threshold angles (low-angle grain boundaries ≤ 10° and high-angle grain boundaries ≤ 15°). Measurements were carried out at the center position for both specimens. By analyzing the distribution of the measured grain cross sections, it is discernable that the modification of the AISI H11 powder with C-np seem to favor the formations of grains with smaller cross sections (finer martensite), which is indicated by larger values of the area-weighted fraction for small grain cross sections. This relationship was observed for both low-angle as well as high-angle grain boundaries. Table 7 summarizes the results of the grain size analysis, including the number of grains considered and the mean values of the grain cross sections. The mean values of the grain cross sections (area mean) are smaller in both the small-angle grain boundaries as well as the large-angle boundaries when C-np is added to the host powder, and the total carbon content increases. Consequently, this indicates a finer martensitic/ferritic microstructure for the specimens manufactured using the C-np-enriched tool steel powder mixtures.
One possible reason for the observed grain refinement could be that in the end, due to the addition of the C-np, more carbon is available for the precipitation of carbides from the molten phase, particularly VC and Mo2C primary carbides. These particles have high melting points and can act as additional crystallization nuclei during solidification and the cooling down of laser-induced melt pools, which leads to an increase in the crystallization rates and promotes fine grain formations. Furthermore, the precipitated carbides inhibit the growth of the primarily austenite grains during solidification and the cooling down period and ultimately result in a finer martensitic/ferritic structure within the dendrites. A further reason for the detected grain refinement could be related to a change of the martensite morphology caused by the increased total carbon content in the C-np-enriched tool steel specimens. In addition, it could be that the cooling rate increases during the solidification process due to the modification of the starting material with the carbon nanoparticles and the associated change in the thermal properties (e.g., increase in thermal conductivity). This in turn would favor the formation of finer grains.

4.4. Influence of Heat Treatments (S1-HT, S2-HT) on Microstructural Properties

Independently, on the processed tool steel powder mixture and after one-time tempering at a temperature of 580 °C for 2 h (S1-HT), the microstructure still appears very similar to the inner structure under an as-built condition. Following the EDS mappings and OM of the etched cross sections presented in Figure 12 and Figure 13, the process-specific fine-grained dendritic microstructure is still present after carrying out S1-HT.
Furthermore, EDS area mappings confirm that the carbide formers (main alloying elements), Cr, Mo, Mn and V, also accumulate at the inter-dendritic spaces, as it is the case for as-built specimens (see Figure 13).
Additionally, the fine needle-like structure (martensite, bainitic ferrite) inside the dendrites seems to be more or less unchanged. However, the effect of the tempering process on the microstructure is clearly visible in the RA content determined with XRD, which can be compared to Figure 8a and the reference peaks for RA shown in Figure 14a–d.
The RA content significantly decrease for all specimens, wherein the tempering process has the greatest effect on the pre-alloyed tool steel specimen due to the tempering parameters which were chosen according to the material standard of AISI H11 [30]. For the pure AISI H11 sample, the RA content takes on a mean value of 1.3 ± 0.4% and is lower than the as-built sample by a factor of 7.27. The specimen manufactured with powder mixture No. 1 (+0.1 wt.-% C-np) has an average RA content of 6 ± 1.8%, which is a decrease of about 9% compared to the sample in the as-built condition. For the specimen produced from powder mixture No. 2 (+0.2 wt.-% C-np), a mean value of 6.63 ± 0.8% for the RA content is obtained after carrying out S1-HT. Compared to the non-heat-treated sample, this corresponds to a decrease of about 15%.
Consequently, at this point, the following conclusion can be drawn. The RA content of the C-np-enriched tool steel samples significantly reduces with subsequent tempering using tempering parameters that are applicable for AISI H11. During this heat treatment process, the RA largely converts into ferrite and cementite, resulting in a homogenization and reconfiguration of the microstructure. By repeating the tempering step or by further adapting and successively improving the tempering parameters in consideration with the exact chemical compositions, it should be possible to achieve smaller RA contents in the C-np-reinforced specimens.
As follows from Figure 8c and Figure 14a–d, on the processed tool steel powder mixture, the domain size of the RA independently decreases after thermal post-processing using S1-HT (1× tempering). For the AISI H11 specimen, the domain size of the RA obtains a mean value of 159 ± 52 Å, which is on average 15 Å smaller than for the sample in the as-built condition. The domain size of the RA for the specimen manufactured with mixture No. 1 (+0.1 wt.-% C-np) corresponds to 179 ± 51 Å, which is a decrease of about 75 Å compared to the as-built sample. For the specimen manufactured out of mixture No. 2 (+0.2 wt.-%), the domain size of the RA lowers from 345 ± 17 Å (in as-built conditions) to 237 ± 95 Å (in a tempered state). The observed reduction of the domain size of the RA seems to be plausible, considering that the tempering causes a significant decomposition of the RA due to the transformation into ferrite and cementite. Oppositely, considering the standard deviation, the tempering process does not significantly affect the domain size of martensite in comparison to the specimens in the as-built conditions.
However, the dependency of the domain size of martensite and of the RA on the added C-np content or the total carbon content is still present in more or less the same manner as for the specimens in the as-built conditions.
After S2-HT, which consisted of hardening followed by one-time tempering, the microstructure of all samples is similar to an acicular martensitic microstructure, which is how these can also be found in conventionally machined and post-hardened AISI H11 components.
Figure 15a,b illustrate the characteristic martensitic structure for a specimen manufactured using a powder mixture with 0.2 wt.-% C-np. The process-specific dendritic microstructure and the characteristic Cr-mixing carbide network completely dissolves, and Cr tends to be homogenously distributed (see EDS mappings in Figure 15). In contrast, as could be verified by the EDS area mappings shown in Figure 15d,e, the VC- and Mo2C-special carbides remain. First, during austenitization, the complete sample transforms into a high-temperature austenitic phase. It is only through quenching in an oil bath that the austenite transforms into martensite. Due to small differences in the local thermal boundary conditions (e.g., local cooling rates) during quenching, in the end, a homogeneous structure is formed and the layer-specific differences in the microstructure more or less disappear after the subsequent tempering.
Following Table 6 and Figure 8a, it is discernable that the RA content decreases significantly compared to the values of specimens in the as-built conditions. After carrying out S2-HT, the RA content for all samples takes on mean values that are in the order of or only slightly different from the values achieved after tempering (S1-HT). However, the effect of the C-np content or the total carbon content on the RA content persists after carrying out S2-HT, as in the case of the tempered or as-built samples.
Regarding the RA, a significant decrease in the domain size is detected for all specimens. The values of the domain size of the RA vary between 100 Å and 130 Å on average. The reduction of the austenite domain size results from the decomposition of the RA into ferrite and cementite.
Contrary to this, considering the standard deviation of the mean values, shown in Figure 8b, no relevant changes in the domain size of martensite are induced in comparison to both the as-built and tempered specimens. However, the effect of the C-np on the domain size of martensite is still present after thermal post-processing is performed using 2S-HT. Consequently, the outcomes confirm that the addition of the nanoscale carbon additives favor the formation of a finer martensitic or ferritic structure in the builds, even after carrying out heat treatment strategies similar to their industrial use.

4.5. Influence of C-np on Vickers Hardness

As already reported in [29], the inhomogeneity of the microstructure resulting from the in situ heat treatment of the lower weld track layers during the AM process also affects the hardness distribution. 
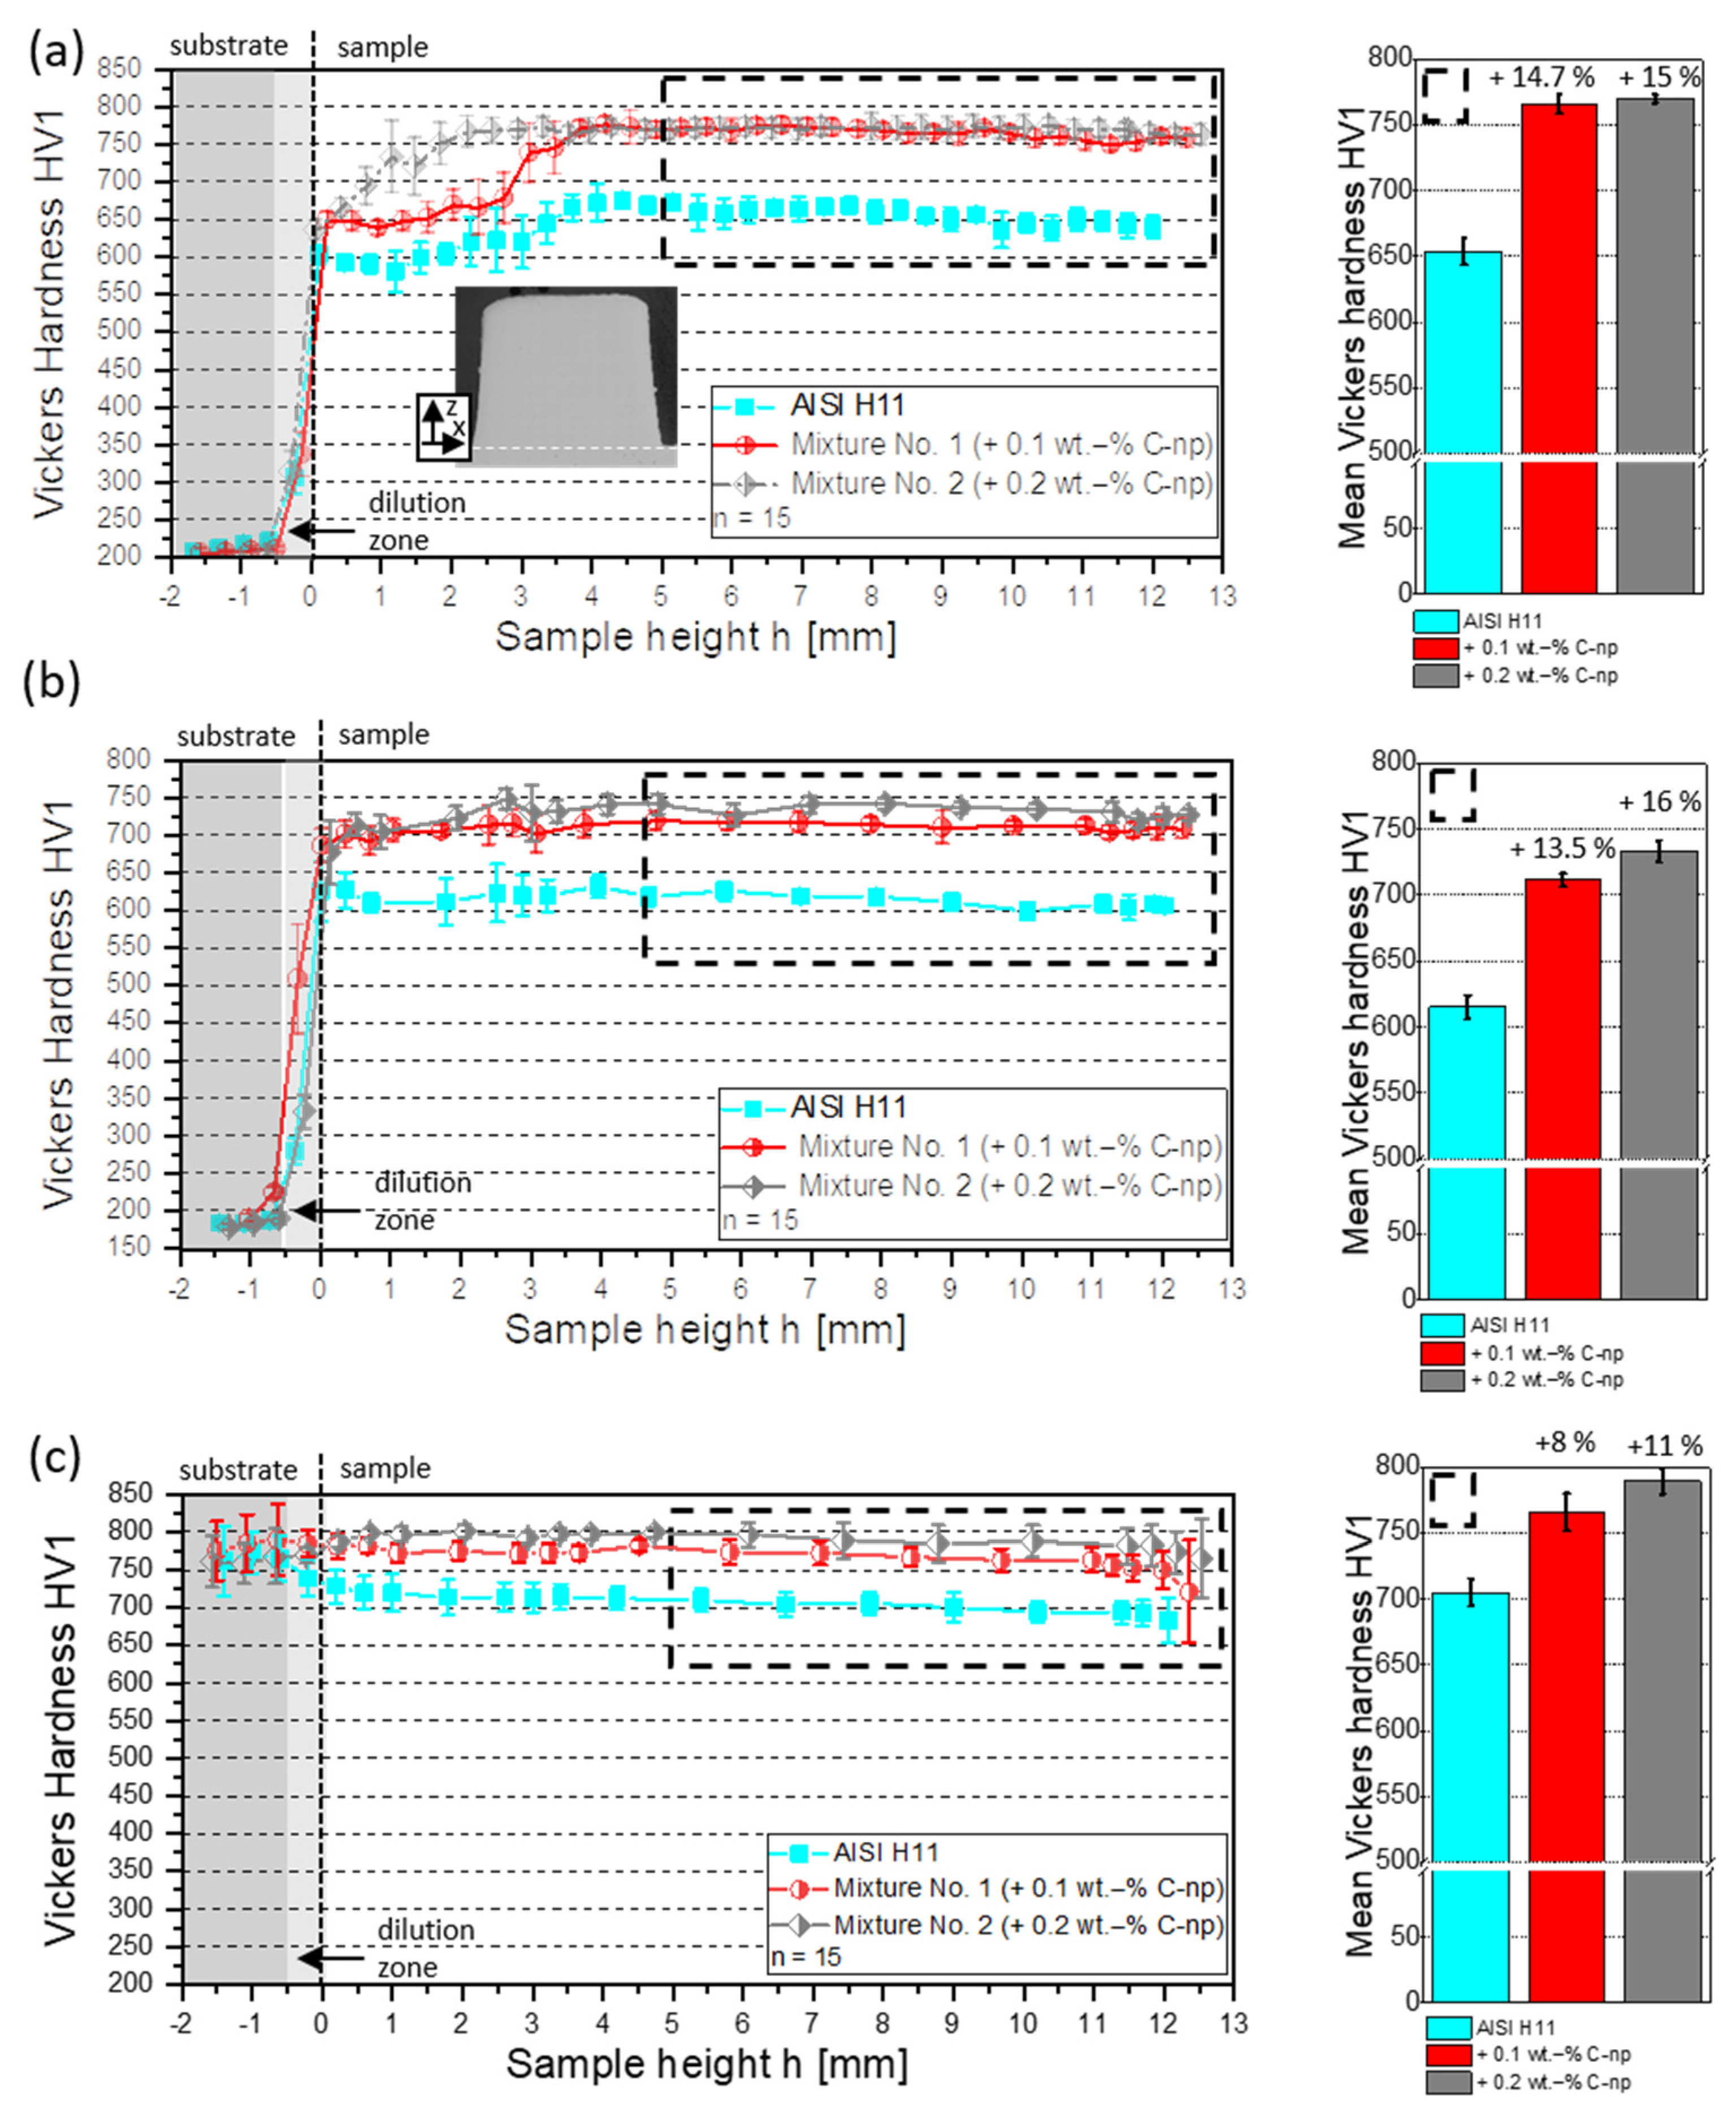
Figure 16 shows the Vickers hardness HV 1 as a function of sample height h for the specimens in as-built conditions.
On the processed tool steel powder mixture, the hardness independently takes on the lowest values in the bottom region of samples. With the increasing number of deposited weld track layers, the hardness profile follows a steady increase (hardness gradient) and reaches a more or less constant level with maximum hardness in the middle and top section of the specimens (see Figure 16). The characteristic inhomogeneous hardness profiles detected for each sample also correlate well with the local dependency of the RA content related to the in-process heat treatment, which was discussed in the previous section. Consequently, the local differences in the measured RA content deliver a plausible explanation for the inhomogeneous hardness profiles with lower hardness values in the bottom section and higher constant hardness values in the middle and upper sections of manufactured tool steel specimens. As already mentioned above, the high RA content in the lower section of the manufactured specimens results from the strong thermal cycling and multiple austenitization at the beginning of the manufacturing process.
By comparing the hardness profiles, it is obvious that the hardness noticeably increases with the increasing content of C-np added to the AISI H11 powder. While the pure tool steel sample has an average hardness of around 653 ± 10 HV1 in the upper sample area, it increases to around 767 ± 6 HV1 when just 0.1 wt.-% C-np (mixture No. 1) is added, and increases to a hardness mean value of 770 ± 14 HV1 to obtain a maximum C-np content of 0.2 wt.-% (Figure 16a (right)).
There are several overriding reasons that are responsible for the hardness increase observed for the C-np-enriched tool steel samples. On the one hand, a higher total carbon content in the steel causes a stronger distortion of the formed martensite, resulting in an enhancement of the local hardness and strength. On the other hand, by adding the nanoscale carbon additives to the H11 powder, in the end, more carbon is present for the precipitation of hardness-increasing carbides. Additionally, a further reason for the high hardness of the C-np-enriched specimens is the fact that the nanoscale additives promote grain refinement and favor a finer martensitic/ferritic structure, as was verified with the EBSD and XRD investigations. Apart from the reasons mentioned, the formation of mixed martensite of high hardness and strength is favored from a total carbon content of about 0.5 wt.-%. Considering the measured chemical composition shown in Table 3, this is the case for the specimen manufactured out of powder mixture No. 2 containing 0.2 wt.-% C-np. Nevertheless, considering the standard deviation, no substantial difference in hardness in the upper sample range can be identified between the specimens manufactured out mixture No. 1 (+0.1 wt.-% C-np) and mixture No. 2 (+0.2 wt.-% C-np) (see Figure 16a). Rather, the hardness values of the samples enriched with C-np are at a comparably high level. The reason for this can be traced back to a higher content of the soft RA counteracting the higher hardness of the martensite in the sample produced from mixture No. 2, with a maximum C-np content of 0.2 wt.-% or a total carbon content, respectively.
Figure 16b shows the hardness profiles of the manufactured tool steel samples after the tempering process (S1-HT). With regard to the C-np concentration, a noticeable reduction of the hardness gradient between the bottom layers and the middle and top part was independently achieved for all specimens. Here, the hardness increases in the bottom section of the samples, resulting from the conversion of a soft RA into a (harder) ferrite and cementite. In contrast to this, the hardness in the top section is more or less uninfluenced, or only slightly decreases, compared to the as-built conditions. In result, the local decomposition of the RA induced by the tempering process leads to a homogenization of the microstructure and to an almost complete compensation of local hardness differences.
The hardness-increasing effect of the added C-np is retained, even after carrying out the one-time tempering process. In contrast to the samples in the as-built conditions, there is a clear correlation between maximum hardness and maximum C-np content or total carbon content, respectively. The maximum hardness was detected for the specimen manufactured with mixture No. 2 containing 0.2 wt.-% C-np. The value corresponds to 733 ± 8 HV1, which is a decrease of approx. 36 HV1 in comparison to the mean sample hardness in the as-built conditions. However, this value is about 118 HV1 larger than the mean hardness of the unmodified AISI H11 sample after carrying out S1-HT (see Figure 16b (right)). For the specimen manufactured using mixture No. 1 (+0.1 wt.-% C-np), a mean value of hardness of 711 ± 11 HV1 is determined, which is a decrease of about 55 HV1 compared to the specimen in the as-built conditions.
Figure 16c illustrates the hardness profiles of the produced tool steel samples after carrying out S2-HT, consisting of a two-stage hardening process followed by one-time tempering (580 °C, 2 h). As already discussed in the scope of the microstructural analysis, the local differences in microstructure almost disappear, and the RA content is significantly lowered in specimens that are heat-treated using S2-HT. By analyzing the hardness dependently on the sample height, it becomes obvious that the homogenization of the microstructure provides a more or less constant Vickers hardness as a function of the sample height. By comparing the hardness profiles with each other, it is discernable that the hardness-increasing influence of the added C-np is still unchanged. Consequently, the maximum mean hardness is achieved with 789 ± 10 HV1 for the specimen with a maximum C-np content of 0.2 wt.-%. In comparison to the sample in the as-built conditions, this corresponds to a slight hardness increase of about 19 HV1. For the specimen built using mixture No. 1 (+0.1 wt.-% C-np), a mean hardness of 766 HV1 is measured. This value is in the same order of magnitude as the hardness achieved for the specimen in the as-built condition.

4.6. Influence of C-np on Compression Properties

As follows on from 
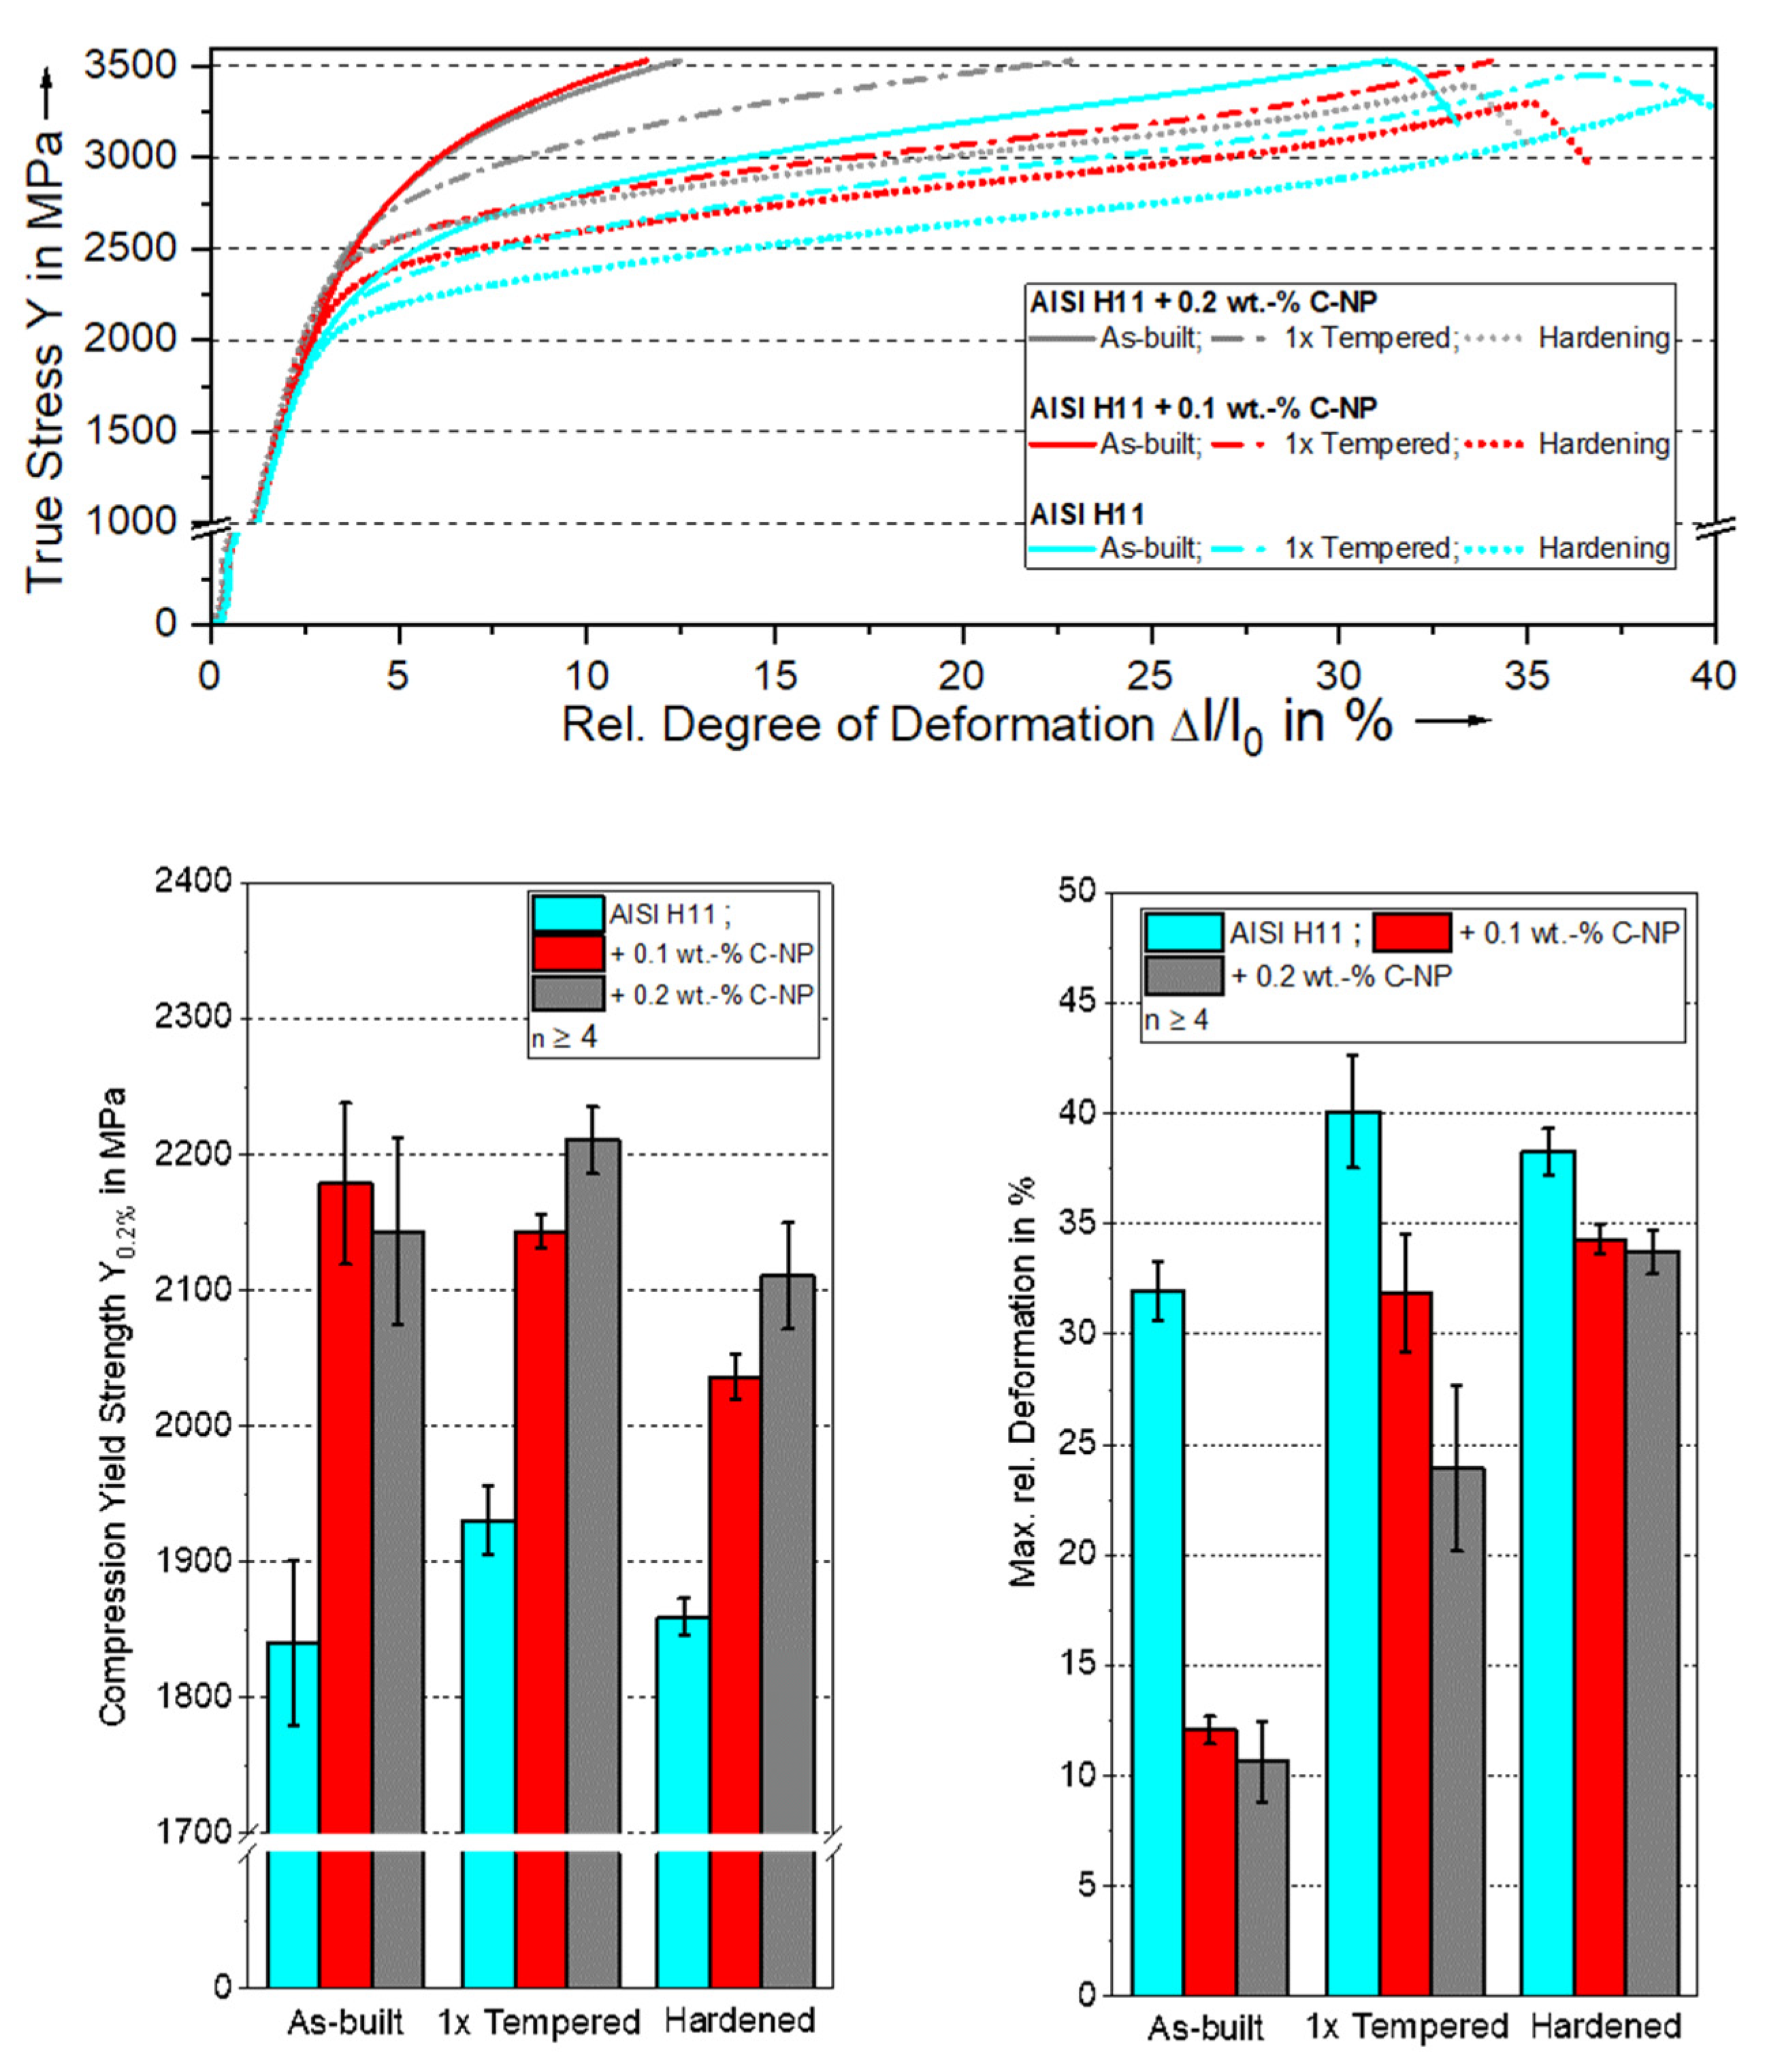
Figure 17 (lower left), regardless of the performed heat treatment strategy, the addition of C-np leads to a significant enhancement in the compression yield strength Y0.2% in comparison to the specimens manufactured out of pure AISI H11 powder. Under as-built conditions, Y0.2% increases from 1839 ± 61 MPa for the unmodified steel samples to 2178 ± 58 MPa for the specimens from mixture No. 1 (+0.1 wt.-% C-np) and to 2143 ± 68 MPa for the samples manufactured with an additional 0.2 wt.-% of C-np (mixture No. 2) (see Figure 17). By considering the standard deviations, no clear dependence of the maximum yield strength on the concentration of the nanoscale carbon additives can be derived. On the contrary, the maximum mean value of yield strength occurs when 0.1 wt% of carbon is added and not at the maximum C-np content of 0.2 wt%.
This can presumably be attributed to the increase in the RA-c with the increasing carbon concentration, as was discussed in the previous section for the hardness. Although the distortion in martensite and the associated martensite hardness enhances with a higher carbon content, a larger amount of carbon also stabilizes the softer austenitic high-temperature phase (γ-Fe). As a result, the observed phenomena are superimposed, which results in the characteristic yield strengths measured for the C-np reinforced specimens in the as-built conditions. In contrast to the increase in the mechanical strength and in hardness, however, the addition of C-np causes a deterioration in ductility. As presented in Figure 17, this leads to a decrease in the maximum achievable degree of formation (maximal strain). While the maximum degree of deformation for the pure tool steel specimens is comparatively high (32 ± 1.3%), it drops down with the increase in the C-np concentration to an average of 12 ± 0.6% for the specimens manufactured with mixture No. 1 (+0.1 wt.-%) and to 10 ± 1.8% for the samples modified by adding 0.2 wt.-% of C-np to the H11 powder.
After the specimens are one-time tempered (S1-HT) and the microstructure was homogenized with a decomposition of RA-c and a reduction of process-inherent internal stresses, the yield strength of the tool steel specimens tends to increase slightly. In this case, Y0.2% of pure H11 assumes a mean value of 1930 ± 25 MPa and increases by around 90 MPa in comparison to the samples without an additional heat treatment. The maximum Y0.2% of the tempered specimens is determined for the samples enriched with 0.2 wt.-% of C-np and corresponds to a mean value of 2210 ± 24 MPa, which is equivalent to an increase of around 14% compared to the pure AISI H11 specimens. The determined Y0.2% of the one-time tempered specimens is in a good agreement with the results presented in [29]. Additionally, the one-time tempering process seems to improve the ductility of all samples, which manifests itself in an increase of the degree of deformation (maximum strain) in comparison to the specimens under the as-built conditions (see Figure 17). The improvement in ductility can probably be correlated to the reduction of process-inherent stresses, which result from the reconfiguration of the microstructure through the tempering process. The maximum degree of deformation (maximum strain) occurs using the pure tool steel samples. It assumes a mean value of 40 ± 2.6% and is thus approx. 8% larger than in the non-heat-treated state. By adding the C-np, the degree of deformation also decreases in the tempered samples, as it has already been the case for the specimens under the as-built conditions. For the samples produced from mixture No. 1, a maximum degree of deformation of 32 ± 2.6% occurs on average and a minimum mean value of 24 ± 3.8% occurs when a maximum C-np content of 0.2 wt.-% is added.
At this stage, it can be highlighted that by performing tempering of the manufactured tool steel samples, both a high compression yield strength and an promising ductility is achieved.
After heat treating the specimens using S2-HT (two-stage hardening followed by one-time tempering at 550 °C for 2 h), the mean value of Y0.2% of the pure AISI H11 samples takes on 1859 ± 61 MPa, which is nearly equivalent to the value without an additional post-treatment. Oppositely, the value of Y0.2% of the NP-enriched tool steels decreases compared to specimens in the as-built conditions or the tempered samples. For the samples manufactured with 0.2 wt.-% C-np, the mean value of Y0.2% is determined to be 2110 ± 39 MPa, with a mean value of 2036 ± 16 MPa for the samples modified by adding 0.1 wt.-% C-np to the steel powder. A possible explanation for this could be that the relevant heat treatment parameters (e.g., the austenitizing temperature and holding time) selected for the H11 steel were not adapted to the enhanced total carbon content or changed chemical composition, respectively.
As already observed for the one-time tempered specimens, in comparison to the as-built specimens, the ductility of samples also improves after carrying out S2-HT (see Figure 17). Here, the maximal degree of deformation for the pure tool steel specimens corresponds to 38 ± 1.1%, and takes on slightly smaller values of 34.3 ± 0.7% for the samples manufactured out of mixture No. 1 (+0.1 wt.-% C-np) and to 33 ± 0.9% for the samples manufactured using mixture No. 2 and enriched with 0.2 wt.-% C-np. Consequently, it can be stated that an improvement in ductility can also be realized with S2-HT.
To evaluate and verify the impact of the C-np on the forming behavior, the strain–stress curves, which are exemplarily presented in Figure 17 (top), are extensively examined. Here, a steep increase in the compression stress, as a function of the degree of deformation (strain), is observed in the region of the plastic deformation for all specimens in the as-built conditions. This characteristic course is a direct consequence of the strain hardening effects which occurred during the deformation of the specimens. In particular, the transformation of the soft RA into a harder martensite, due to the plastic deformation-induced phase transformation, makes a decisive contribution to strain hardening. The strain hardening effect is therefore much more pronounced in the C-np-enriched samples due to their higher RA content.
After post-heat treating the specimens, the strain hardening effect is significantly weakened due to the reduction in the RA content and the homogenization of the microstructure caused by the induced metallurgical changes. This is also reflected through a significant reduction in the slopes of the strain–stress curves in the range of plastic deformation (see Figure 17 (top)).

5. Conclusions

In this study, the influence of C-np on the microstructural and mechanical properties of AISI H11 is extensively investigated. The examinations that are carried out are built on the results of a previous work, in which the processability of the C-np-enriched AISI H11 powder mixtures for the AM of nearly dense volumetric specimens could be successfully demonstrated. The most important scientific outcomes related to this work are summarized in bullet points below.
In relation to the amount of added C-np, the produced tool steel samples independently show a fine-grained, dendritic inner structure, as it is the case for the pure AISI H11 sample.
Due to the process-specific high cooling rates, the formation of a needle-like martensite and a smaller proportion of ferrite (presumably bainitic ferrite) and retained austenite (Ra) is detected within the dendrites.
The metallic main alloying elements (Cr, Mo, Mn, V) form a carbide network in the pure AISI H11 specimen as well as in the C-np-enriched specimens.
As proven with the XRD and EBSD examinations, due to C-np being strong austenite formers, which stabilize the high-temperature austenitic phase, the RA content significantly increases with an increasing concentration of C-np.
In addition, a spatial dependence of the RA content could be measured, with the maximum local RA concentration independently occurring in the lower sample area on the processed tool steel powder mixture. The local differences in the RA content also provide a plausible reason for the characteristic, inhomogeneous hardness profile measured for each sample in the as-built conditions.
It could be shown with XRD and EBSD investigations that the addition of C-np to the AISI H11 powder lead to grain refinement and that their addition favors the formation of finer martensite and ferrite inside the dendrites or primary austenite grains, respectively.
Due the induced microstructural changes (e.g., stronger distortion of martensite, higher concentration of hardening increasing carbides, finer microstructure, etc.), a significant increase in hardness and compression yield strength is observed when a higher amount of C-np is added. By adding 0.2 wt.-% C-np, an average hardness increase from 653 HV1 to 770 HV1 in the top layer could be achieved, which is a percentage increase of about 15%. At the same time, the Y0.2% increases from about 1839 MPa for the AISI H11 samples to 2143 MPa for the samples enriched with 0.2 wt.-% C-np.
In contrast to the enhancement of hardness and compression yield strength, the ductility of the samples becomes poor with an increasing amount of C-np.
After the heat treatment of samples and the application of strategies similar to the industrial applications, hardness and compression yield strength decrease only slightly, if at all, while the ductility of all samples is significantly improved.
Irrespective of the subsequent heat treatment carried out, the hardness- and strength-increasing effect, caused by the added C-np, is retained.
At this point, it can be concluded that the addition of C-np to the AISI H11 powder provides the potential to significantly improve mechanical properties of materials, compared to the starting materials, and to adjust them in a targeted manner.
In future works, the heat treatment strategy will be further developed and optimized, considering the exact chemical composition of each tool steel powder mixture. In this manner, we expect that by improving parameters, such as the tempering and holding temperature, the RA content can be reduced further. Associated with this, the hardness and compression yield strength should increase and improve correspondingly. Apart from that, investigations with other types of np (e.g., tungsten carbide (WC), Titanium Boride (TiB2)) will be carried out.
Lastly, the overall aim (vision) is to manufacture (in DED-LB/M) completely tailored forging tools manufactured out of np-enriched tool steel powder mixtures with outstanding microstructural and mechanical properties that overcome the performance of traditionally fabricated tools thus far.

Author Contributions

O.H. prepared the design of the experiments and is responsible for the scientific content and the applied experimental procedures and presented results; O.H. and J.K. manufactured the samples; O.H. coordinated and supervised the metallographic preparation and analysis of the manufactured samples; O.H. was mainly responsible for organizing and writing the manuscript; J.K. supported the manufacturing of the samples and prepared the metallographic cross sections; J.K. supported O.H. in the experimental characterization of the prepared cross sections (microscope investigations, hardness measurements, compression testing); P.K. and D.N. contributed to the microstructural analysis, particularly the EBSD investigations; P.K. was involved in the proof-reading process of the manuscript; M.S. supervised the investigations that were carried out. All authors have read and agreed to the published version of the manuscript.

Funding

This work was performed with the kind support of the School of Advanced Optical Technology (SAOT) of the University Erlangen-Nürnberg.

Data Availability Statement

The data that support the findings of this study are available from the corresponding author upon reasonable request.

Conflicts of Interest

The authors declare no conflict of interest.

Appendix A

Figure A1. TTT curves calculated in JMAtPro for the investigated tool steel powder blends: AISI H11 (top); specimen produced from mixture No. 1 (+0.1 wt.-% C-np) (middle) and from mixture No. 2 (+0.2 wt.-% C-np) (bottom).
Alloys 02 00020 g0a1

Appendix B

Figure A2. SEM images and EDS mappings carried out for a specimen produced from mixture No. 2 (+0.2 wt.-% C-np) in as-built conditions. (a) Top layer and (b) bottom part.
Alloys 02 00020 g0a2

Appendix C

Table A1. Martensite, retained austenite and ferrite peaks considered in the reconstruction/fitting of the experimentally determined XRD spectra using the Rietveld approach.
Martensite (bcc)
No.hklm2θ [°]
1011844.43
2110444.67
3002264.26
4020465.03
5112881.64
62111682.17
7022898.26
8220498.96
90138114.67
100318116.21
Retained Austenite (fcc)
No.hklm2θ [°]
1111843.4
2002650.54
30221274.28
43112490.14
5222895.37
Ferrite (bcc)
No.hklm2θ [°]
10111244.53
2002664.81
32112482.04
40221298.56
503124115.85

Appendix D

Figure A3. (ad) Experimental and reconstructed XRD diffractograms at three characteristic measuring positions for a specimen produced from mixture No. 1 (+0.1 wt.-% C-np).
Alloys 02 00020 g0a3

References

  1. Lu, K.; Zhu, J.; Guo, D.; Yang, M.; Sun, H.; Wang, Z.; Hui, X.; Wu, Y. Microstructures, Corrosion Resistance and Wear Resistance of High-Entropy Alloys Coatings with Various Compositions Prepared by Laser Cladding: A Review. Coatings 2022, 12, 1023. [Google Scholar] [CrossRef]
  2. Sinha, A.; Swain, B.; Behera, A.; Mallick, P.; Samal, S.K.; Vishwanatha, H.M.; Behera, A. A Review on the Processing of Aero-Turbine Blade Using 3D Print Techniques. J. Manuf. Mater. Process. 2022, 6, 16. [Google Scholar] [CrossRef]
  3. Rittinghaus, S.K.; Schmelzer, J.; Rackel, M.W.; Hemes, S.; Vogelpoth, A.; Hecht, U.; Weisheit, A. Direct Energy Deposition of TiAl for Hybrid Manufacturing and Repair of Turbine Blades. Materials 2020, 13, 4392. [Google Scholar] [CrossRef] [PubMed]
  4. Ahn, D.G. Directed Energy Deposition (DED) Process: State of the Art. Int. J. Precis. Eng. Manuf. Green Technol. 2021, 8, 703–742. [Google Scholar] [CrossRef]
  5. Saboori, A.; Aversa, A.; Marchese, G.; Biamino, S.; Lombardi, M.; Fino, P. Application of Directed Energy Deposition-Based Additive Manufacturing in Repair. Appl. Sci. 2019, 9, 3316. [Google Scholar] [CrossRef]
  6. Ostolaza, M.; Arrizubieta, J.I.; Lamikiz, A.; Cortina, M. Functionally Graded AISI 316L and AISI H13 Manufactured by L-DED for Die and Mould Applications. Appl. Sci. 2021, 11, 771. [Google Scholar] [CrossRef]
  7. Li, Z.; Sui, S.; Ma, X.; Tan, H.; Zhong, C.; Bi, G.; Clare, A.T.; Gasser, A.; Chen, J. High Deposition Rate Powder- and Wire-Based Laser Directed Energy Deposition of Metallic Materials: A Review. Int. J. Mach. Tools Manuf. 2022, 181, 103942. [Google Scholar] [CrossRef]
  8. Pratheesh Kumar, S.; Elangovan, S.; Mohanraj, R.; Ramakrishna, J.R. A Review on Properties of Inconel 625 and Inconel 718 Fabricated Using Direct Energy Deposition. Mater. Today Proc. 2021, 46, 7892–7906. [Google Scholar] [CrossRef]
  9. Su, Y.; Wang, Y.; Shi, J. Microstructure and Mechanical Properties of Laser DED Produced Crack-Free Al 7075 Alloy: Effect of Process Parameters and Heat Treatment. Mater. Sci. Eng. A 2022, 857, 144075. [Google Scholar] [CrossRef]
  10. Scheitler, C.; Hentschel, O.; Krebs, T.; Nagulin, K.Y.; Schmidt, M. Laser Metal Deposition of NiTi Shape Memory Alloy on Ti Sheet Metal: Influence of Preheating on Dissimilar Build-Up. J. Laser Appl. 2017, 29, 022309. [Google Scholar] [CrossRef]
  11. Alam, M.K.; Edrisy, A.; Urbanic, J.; Pineault, J. Microhardness and Stress Analysis of Laser-Cladded AISI 420 Martensitic Stainless Steel. J. Mater. Eng. Perform. 2017, 26, 1076–1084. [Google Scholar] [CrossRef]
  12. Kürnsteiner, P.; Wilms, M.B.; Weisheit, A.; Barriobero-Vila, P.; Jägle, E.A.; Raabe, D. Massive Nanoprecipitation in an Fe-19Ni-XAl Maraging Steel Triggered by the Intrinsic Heat Treatment during Laser Metal Deposition. Acta Mater. 2017, 129, 52–60. [Google Scholar] [CrossRef]
  13. Jägle, E.; Sheng, Z.; Kürnsteiner, P.; Ocylok, S.; Weisheit, A.; Raabe, D. Comparison of Maraging Steel Micro- and Nanostructure Produced Conventionally and by Laser Additive Manufacturing. Materials 2016, 10, 8. [Google Scholar] [CrossRef]
  14. Junker, D.; Hentschel, O.; Schmidt, M.; Merklein, M. Investigation of Heat Treatment Strategies for Additively-Manufactured Tools of X37CrMoV5-1. Metals 2018, 8, 854. [Google Scholar] [CrossRef]
  15. Bohlen, A.; Freiße, H.; Hunkel, M.; Vollertsen, F. Additive Manufacturing of Tool Steel by Laser Metal Deposition. Procedia CIRP 2018, 74, 192–195. [Google Scholar] [CrossRef]
  16. Pinkerton, A.J.; Li, L. Direct Additive Laser Manufacturing Using Gas- and Water-Atomised H13 Tool Steel Powders. Int. J. Adv. Manuf. Technol. 2005, 25, 471–479. [Google Scholar] [CrossRef]
  17. Telasang, G.; Dutta Majumdar, J.; Padmanabham, G.; Tak, M.; Manna, I. Effect of Laser Parameters on Microstructure and Hardness of Laser Clad and Tempered AISI H13 Tool Steel. Surf. Coat. Technol. 2014, 258, 1108–1118. [Google Scholar] [CrossRef]
  18. Svetlizky, D.; Zheng, B.; Vyatskikh, A.; Das, M.; Bose, S.; Bandyopadhyay, A.; Schoenung, J.M.; Lavernia, E.J.; Eliaz, N. Laser-Based Directed Energy Deposition (DED-LB) of Advanced Materials. Mater. Sci. Eng. A 2022, 840, 142967. [Google Scholar] [CrossRef]
  19. Nurminen, J.; Näkki, J.; Vuoristo, P. Microstructure and Properties of Hard and Wear Resistant MMC Coatings Deposited by Laser Cladding. Int. J. Refract. Met. Hard Mater. 2009, 27, 472–478. [Google Scholar] [CrossRef]
  20. Dubourg, L.; Ursescu, D.; Hlawka, F.; Cornet, A. Laser Cladding of MMC Coatings on Aluminium Substrate: Influence of Composition and Microstructure on Mechanical Properties. Wear 2005, 258, 1745–1754. [Google Scholar] [CrossRef]
  21. Melzer, D.; Džugan, J.; Koukolíková, M.; Rzepa, S.; Vavřík, J. Structural Integrity and Mechanical Properties of the Functionally Graded Material Based on 316L/IN718 Processed by DED Technology. Mater. Sci. Eng. A 2021, 811, 141038. [Google Scholar] [CrossRef]
  22. Gu, D. Laser Additive Manufacturing of High-Performance Materials; Springer: New York, NY, USA, 2015. [Google Scholar]
  23. Gu, D.; Wang, H.; Chang, F.; Dai, D.; Yuan, P.; Hagedorn, Y.C.; Meiners, W. Selective Laser Melting Additive Manufacturing of TiC/AlSi10Mg Bulk-Form Nanocomposites with Tailored Microstructures and Properties. Phys. Procedia 2014, 56, 108–116. [Google Scholar] [CrossRef]
  24. Martin, J.H.; Yahata, B.D.; Hundley, J.M.; Mayer, J.A.; Schaedler, T.A.; Pollock, T.M. 3D Printing of High-Strength Aluminium Alloys. Nature 2017, 549, 365–369. [Google Scholar] [CrossRef] [PubMed]
  25. Bartels, D.; Novotny, T.; Hentschel, O.; Huber, F.; Mys, R.; Merklein, C.; Schmidt, M. In Situ Modification of Case-Hardening Steel 16MnCr5 by C and WC Addition by Means of Powder Bed Fusion with Laser Beam of Metals (PBF-LB/M). Int. J. Adv. Manuf. Technol. 2022, 120, 1729–1745. [Google Scholar] [CrossRef]
  26. Gu, D.; Cao, S.; Lin, K. Laser Metal Deposition Additive Manufacturing of TiC Reinforced Inconel 625 Composites: Influence of the Additive TiC Particle and Its Starting Size. J. Manuf. Sci. Eng. Trans. ASME 2017, 139, 041014. [Google Scholar] [CrossRef]
  27. Ocylok, S. Herstellung und Eigenschaften Nanopartikulär Verstärkter Beschichtungen Durch Laserauftragschweißen Zum Verschleißschutz von Schmiedegesenkene; Wissenschaftsverlag des Instituts für Industriekommunikation und Fachmedien an der RWTH Aachen: Aachen, Germany, 2016; ISBN 978-3-86359-417-6. Available online: https://publications.rwth-aachen.de/record/573622/files/573622.pdf (accessed on 10 November 2023). (In German)
  28. Ocylok, S.; Weisheit, A.; Kelbassa, I. Functionally Graded Multi-Layers by Laser Cladding for Increased Wear and Corrosion Protection. Phys. Procedia 2010, 5, 359–367. [Google Scholar] [CrossRef]
  29. Hentschel, O.; Siegel, L.; Scheitler, C.; Huber, F.; Junker, D.; Gorunow, A.; Schmidt, M. Processing of AISI H11 Tool Steel Powder Modified with Carbon Black Nanoparticles for the Additive Manufacturing of Forging Tools with Tailored Mechanical Properties by Means of Laser Metal Deposition (LMD). Metals 2018, 8, 659. [Google Scholar] [CrossRef]
  30. Wegst, M.; Wegst, C. Stahlschlüssel—Key to Steel 2016: Nachschlagewerk; Stahlschlüssel-Verlag Marbach: Neckar, Germany, 2016. [Google Scholar]
  31. Hentschel, O.; Krakhmalev, P.; Fredriksson, G.; Olsèn, J.; Selte, A.; Schmidt, M. Influence of the In-Situ Heat Treatment during Manufacturing on the Microstructure and Properties of DED-LB/M Manufactured Maraging Tool Steel. J. Mater. Process. Technol. 2023, 315, 117928. [Google Scholar] [CrossRef]
  32. Angele, F. Härteöl Durixol W25 (Datenblatt); Angele Technik oHG: Ochsenhausen, Germany, 2017; Available online: https://www.angele-shop.com/media/pdf/e1/1e/ca/00621300-data-d-haerteoel.pdf (accessed on 10 November 2023). (In German)
  33. Hentschel, O.; Scheitler, C.; Fedorov, A.; Junker, D.; Gorunov, A.; Haimerl, A.; Merklein, M.; Schmidt, M. Experimental Investigations of Processing the High Carbon Cold-Work Tool Steel 1.2358 by Laser Metal Deposition for the Additive Manufacturing of Cold Forging Tools. J. Laser Appl. 2017, 29, 022307. [Google Scholar] [CrossRef]
  34. Thompson, P.; Cox, E.; Hastings, J.B. Rietveld Refinement of Debye-Scherrer Synchrotron X-Ray Data from A1203. J. Appl. Cryst. 1987, 20, 79–80. [Google Scholar] [CrossRef]
  35. Niu, L.; Hojamberdiev, M.; Xu, Y. Preparation of in Situ-Formed WC/Fe Composite on Gray Cast Iron Substrate by a Centrifugal Casting Process. J. Mater. Process. Technol. 2010, 210, 1986–1990. [Google Scholar] [CrossRef]
  36. Jarvinen, M. Application of Symmetrized Harmonics Expansion to Correction of the Preferred Orientation Effect. J. Appl. Crystallogr. 1993, 26, 525–531. [Google Scholar] [CrossRef]
  37. Over, C. Generative Fertigung von Bauteilen aus Werkzeugstahl X38CrMoV5-1 und Titan TiAl6V4 Mit Selective Laser Melting; RWTH Aachen: Aachen, Germany, 2003. [Google Scholar]
Figure 1. SEM image (a) of C-np powder agglomeration in different magnifications (measuring positions indicated by the red boxes) and (b) of the steel powder mixture No. 1 modified by adding 0.1 wt.-% C-np to the AISI H11 powder in different magnifications (measuring positions indicated by the red boxes), (c) manufactured specimens, (d) machined compression specimens. Experimental alignment for (e) local XRD measurements and for (f) chemical analysis using OES.
Alloys 02 00020 g001
Figure 2. Schematic illustration of the bidirectional deposition used for manufacturing 30-layered specimens. Reprinted from Ref. [31].
Alloys 02 00020 g002
Figure 3. Cross sections of polished sample used for density assessment of (a) pure AISI H11 and (b) sample comprising mixture No. 2 (+0.2 wt.-% C-np) [31].
Alloys 02 00020 g003
Figure 4. (a) Merged microscopic images of the etched cross section of the AISI H11 sample in as-built conditions and SEM images of microstructure (b) in the top layer and (c) in the first layer. (d) Merged microscopic images of the etched cross section of sample comprising mixture No. 2 (+0.2 wt.-% C.-np) in as-built conditions and SEM images of microstructure (e) in the top layer and (f) in the first layer.
Alloys 02 00020 g004
Figure 5. Dendritic microstructure of the specimen manufactured with powder mixture No. 2 in the top layer. (a) SEM image (5000× magnification), (b) EDS layered image and (c) EDS elemental mappings for Fe, Cr, Mo, V, Si and O.
Alloys 02 00020 g005
Figure 6. Illustration of the in situ heat treatment thermal cycling of lower weld track layers according to the time–temperature–transformation (TTT) curve of AISI H11.
Alloys 02 00020 g006
Figure 7. (ad) Measured diffraction diagrams and Rietveld approximations of manufactured specimens in as-built conditions.
Alloys 02 00020 g007
Figure 8. Mean values of (a) RA content and the domain size of (b) martensite and of (c) RA.
Alloys 02 00020 g008
Figure 9. EBSD analysis including the phase fraction of Ra and martensite and the inverse pole figures of the specimen manufactured out of the mixture No. 2 (+0.2 wt.-% C-np) at different measuring positions: (a) top layer, (b) center and (c) bottom area.
Alloys 02 00020 g009
Figure 10. EBSD analysis including the phase fraction of Ra and martensite and the inverse pole figures of the AISI H11 specimen in as-built conditions (measuring position: center).
Alloys 02 00020 g010
Figure 11. Outcomes of grain size analysis performed with EBSD (a,b) AISI H11 and (c,d) powder mixture No. 2 (+0.2 wt.-% C-np).
Alloys 02 00020 g011
Figure 12. Microscopic images of a sample from mixture No. 2 (+0.2 wt.-% C-np) after carrying out S1-HT: bottom area (left) and middle part (right).
Alloys 02 00020 g012
Figure 13. EDS elemental area mappings of specimens manufactured out of pure AISI H11 powder as-built conditions (top) and after carrying out thermal post-processing using 1S-HT (below) (measuring position: center).
Alloys 02 00020 g013
Figure 14. (ad) Measured diffraction diagrams and Rietveld approximations for specimens manufactured out mixture No. 2 (+0.2 wt.-% C-np) in as-built conditions and after carrying out S1-HT and S2-HT.
Alloys 02 00020 g014
Figure 15. (a,b) Microstructure of the sample manufactured using mixture No. 2 (+0.2 wt.-% C-np) after carrying out S2-HT. (a,b) SEM images at different magnifications. (c) Back-scattered electron (BSE) image, (d) EDS layered image and (e) EDS elemental mapping.
Alloys 02 00020 g015
Figure 16. Vickers hardness profiles of 30-layered tool steel samples as function of the sample height h in (a) as-built conditions and after carrying out (b) 1S-HT (one-time tempering at 550 °C for 2 h) and (c) 2S-HT (two-step hardening followed by one-time tempering at 550 °C for 2 h).
Alloys 02 00020 g016
Figure 17. Outcomes of compression testing: stress–strain curves of investigated specimens (top), and mean values of compression yield strength (bottom left) and of max. degree of deformation (max strain) (bottom right) for both specimens in as-built conditions as well as samples thermally post-processed using S1-HT and S2-HT.
Alloys 02 00020 g017
Table 1. Chemical composition of the AISI H11 powder and the AISI H11 substrate plates measured using X-ray fluorescence (XRF) and ELEMENTRAC CS-i measurements (hot gas analysis).
Material
(AISI H11)
C [wt.-%]Si [wt.-%]Cr [wt.-%]Mo [wt.-%]V [wt.-%]
Powder (n = 5)0.35 ± 0.010.98 ± 0.035.23 ± 0.061.31 ± 0.040.31 ± 0.07
Substrate0.390.95.091.290.33
Ref. [30]0.33–0.410.9–1.24.8–5.51.1–1.40.25–0.5
Table 2. Nominal carbon content of the AISI H11 powder and of C-np-enriched steel powder mixtures measured using the ELEMENTRAC CS-i from Eltra GmbH and percentage loss of carbon during the powder mixture preparation.
AISI H11
Reference [30]
Pure AISI H11
Powder
(n = 5)
Mixture No. 1
+0.1 wt.-% C-np
(n = 5)
Mixture No. 2
+0.2 wt.-% C-np
(n = 5)
Cpowder [wt.-%]0.33–0.410.345 ± 0.0050.443 ± 0.0030.536 ± 0.003
Carbon loss during dry coating [%] --0.5%1.7%
Table 3. Set of process parameters used for the AM of 30-layered cube-like tool steel specimens.
Laser Power
Pcore
[W]
Beam Diameter
2wlaser
[mm]
Feed Rate
frate
[mm/min]
Powder   Mass
flow   m ˙
[g/min]
Transport Gas
V ˙ H e
[L/min]
Protection Gas
V ˙ A r
[L/min]
6001.5 4002.7± 0.1820
Table 4. Chemical composition of manufactured 30-layered specimens measured with OES.
ElementsReference [30] AISI H11AISI H11
(n = 9)
Mixture No. 1
+0.1 wt.-% C-np
(n = 9)
Mixture No. 2
+0.2 wt.-% C-np
(n = 9)
C [wt.-%]0.33–0.410.336 ± 0.0030.431 ± 0.0040.520 ± 0.004
Si [wt.-%]0.80–1.200.933 ± 0.0090.932 ± 0.0060.940 ± 0.005
Mn [wt.-%]]0.25–0.500.382 ± 0.0050.393 ± 0.0040.387 ± 0.005
Cr [wt.-%]4.80–5.505.100 ± 0.0265.097 ± 0.0055.113 ± 0.004
Mo [wt.-%]1.10–1.501.177 ± 0.0151.187 ± 0.0191.180 ± 0.014
V [wt.-%]0.30–0.500.378 ± 0.0030.379 ± 0.0020.376 ± 0.001
Table 5. Martensite transformation temperatures, Ms, M50% and M90%, calculated in JMatPro, considering the measured chemical compositions presented in Table 4.
AISI H11+0.1 wt.-% C-np+0.2 wt.-% C-np
Ms [°C]343.3309308.8
M50% [°C]308.4273.3272.9
M90% [°C]227.4190189.9
Table 6. Local RA content determined using XRD and Rietveld approximation (measuring positions: bottom, middle and top).
AISI H11Mixture No. 1
(+0.1 wt.-% C-np)
Mixture No. 2
(+0.2 wt.-% C-np)
RA-c in vol.-%RA-c in vol.-%RA-c in vol.-%
As-builtTop7.512.616.5
Center8.215.418.2
Bottom12.717.729.6
S1-HTTop1.25.17.4
Center1.44.89.2
Bottom1.88.112.3
S2-HTTop2.45.35.5
Center3.56.25.5
Bottom3.87.28.9
Table 7. Outcomes of grain size analysis: Area mean and area weighted for the pure H11 sample and the sample manufactured using mixture No. 2 (as-built conditions).
MaterialThreshold Angle [°]Grains
Count
Area Mean
[µm²]
Area Weighted
[µm²]
AISI H115–10°31021.413.2
5–15°27771.615.5
Powder mixture No. 25–10°43791.211.7
5–15°37081.415.3
Disclaimer/Publisher’s Note: The statements, opinions and data contained in all publications are solely those of the individual author(s) and contributor(s) and not of MDPI and/or the editor(s). MDPI and/or the editor(s) disclaim responsibility for any injury to people or property resulting from any ideas, methods, instructions or products referred to in the content.

