
Optical Properties of AgAu Alloy Clusters: Effect of Chemical Configuration along a Rearrangement Pathway


1
Aix-Marseille University, CNRS, CINAM, 13288 Marseille, France
2
European Theoretical Spectroscopy Facility (ETSF); www.etsf.eu
3
Université Grenoble Alpes, CNRS, LiPhy, 38000 Grenoble, France
*
Author to whom correspondence should be addressed.
Alloys 2024, 3(1), 31-42; https://0-doi-org.brum.beds.ac.uk/10.3390/alloys3010003
Submission received: 20 December 2023
/
Revised: 30 January 2024
/
Accepted: 5 February 2024
/
Published: 20 February 2024
(This article belongs to the Collection Feature Paper Collection of Advanced Research on Alloys)
Abstract
:Gold and silver are, for all their chemical similarities, optically very different. Small Ag clusters show a localized surface-plasmon resonance (LSPR), whereas in Au clusters smaller than about 300 atoms, the resonance is absent due to the coupling with the interband transitions from the d electrons. This opens the possibility of tuning the cluster properties depending on their composition and chemical configuration. Earlier work on AgAu alloy clusters has shown that the outermost shell of atoms is crucial to their overall optical properties. In the present contribution, we consider the optical spectroscopic properties associated with the structural rearrangement in 55-atom AgAu alloy clusters in which the core transforms from pure silver to pure gold. Calculations using time-dependent density-functional theory are complemented by an in-depth study of the subtle effects that the chemical configuration has on the details of the materials’ d bands. Although the cluster surface remains alloyed, the geometrical changes translate into strong variations in the optical properties.
1. Introduction
Noble-metal nanoparticles (NPs) and clusters are employed in a large number of applications, often making use of the localized surface-plasmon resonance (LSPR) that dominates the optical response in the VIS and the UV ranges. Applications include surface-enhanced Raman spectroscopy (SERS) [1], biomolecular sensing [2] and labeling [3], cancer therapy by rapid local heating [4], and the plasmonic enhancement of light absorption in solar cells [5]. AuAg nanoalloys have been proposed for applications owing to their antibacterial activity [6]. A wide variety of methods have been developed for their production [7,8,9], with green synthesis procedures having been developed recently [10,11].
The LSPR is influenced by the composition [12], the size [13,14], the shape, as well as the environment of the nanoparticles [14,15]. In nanoalloys—nanometric pieces of alloy materials such as bi- or multimetallic clusters—the LSPR is also strongly affected by the chemical ordering, i.e., by the arrangement of the various chemical elements within the nanostructure. This adds yet another parameter through which the desired properties for applications can be further engineered [16,17,18,19,20,21]. Unfortunately, this parameter is also more difficult to control because of the great variety of possible chemical orderings within nanoparticles, ranging from fully alloyed clusters (either randomly or as intermetallics) to fully phase-segregated structures (either as core-shell or as so-called Janus-like with a planar interface). Moreover, experimentally accessing the three-dimensional structure of nanoalloys has remained very difficult, although progress in element-resolved imaging techniques has been reported in recent years. In Refs. [22,23], detailed information regarding gold–silver nanoparticles was thus experimentally obtained.
Gold and silver are electronically relatively similar; they have very similar lattice constants and they are miscible at all compositions in the bulk alloy. However, their optical properties at the nanoscale differ strongly. This makes them particularly suitable for the study of alloying effects on the LSPR.
The main reason for the different optical behaviors of gold and silver lies in the different energetic positions of the filled d band in the two metals: interband transitions from the d electrons into empty states above the Fermi energy start at about 4 eV in bulk silver, and at about 2 eV in bulk gold [24]. Consequently, the energy of the d band edge, which is directly connected to the threshold of interband transitions in the spectra, is of particular importance. The LSPR in silver lies below the onset of the interband transitions, whereas in gold it lies on top of a broad, dense set of interband transitions, the coupling to which broadens and damps the LSPR. This explains why silver clusters exhibit a strong LSPR down to very small sizes [14,25,26]. In contrast, small gold clusters do not normally exhibit an LSPR [27,28], which emerges only for sizes of about 300 atoms for spherical clusters [29,30].
The effects of alloying between Ag and Au on the optical response of the bimetallic clusters that these elements form together has been investigated by many authors [12,31,32,33,34,35,36,37]. An approximately linear red-shift in LSPR peak energies is observed with the increase in the gold composition of alloy nanoparticles, along with an increased damping of the LSPR [12,31,38,39,40]. Earlier calculations using time-dependent density-functional theory (TDDFT) based on a structureless jellium model obtained results in satisfactory agreement with the experimental trends. However, in these cases, the dielectric function of the corresponding bulk alloy was a needed ingredient [12] to account phenomenologically for the screening due to the d electrons. Similarly, the dielectric functions calculated for bulk materials have been used to calculate the optical response of large nanoparticles using classical electrodynamics (Mie theory, in the case of spherical particles) [41].
In the aforementioned examples, the AgAu bimetallic clusters obtained through physical synthesis methods were found to be mostly alloyed, as in the respective bulk materials. However, AgAu clusters can also be produced as core-shell structures, conventionally through stepwise chemical methods [15,22,42]. In this case, the optical response is complex, and a particular importance was found for the outer shell [15,33,43]. Similar complexity was reported in a computational study of clusters, showing a non-trivial dependence of their chemical structure on their composition [44]. In general, for small clusters or nanoparticles below 2–3 nm in diameter, very far from the bulk limit, the atomic structure and the precise chemical ordering become very important but are also intertwined. Previous TDDFT calculations on core-shell clusters have notably shown the paramount importance of the outermost atomic shell, leading to a plasmonic silver-like or a non-plasmonic gold-like optical response depending on the detailed atomic structure [33]. These results can be rationalized by considering the induced electron densities of the delocalized electrons at the LSPR, which are largest at the surfaces [45,46,47], whereas the localized d electrons are polarized so as to oppose the field created by the collective electron oscillation. However, in these earlier calculations, the changing core-shell character (gold or silver at the surface layer) went along with a strong change in the composition because, in the largest clusters treated there (147 atoms), there are about twice as many surface atoms as there are interior atoms [33]. Therefore, the different perfect core-shell structures did not permit the study of different configurations at a constant composition.
The preference for alloyed or phase-segregated structures depends on their size and shape, but also on external parameters such as the temperature, the environment, and time itself since the preparation method can produce nanoparticles that are far from their thermodynamically most stable structure. The competition between these many factors makes it generally difficult to evaluate the kinetic stability of nanoalloy particles. However, in simplified models, this issue could be directly addressed at the atomistic level [48]. The rearrangement between small AgAu nanoparticles of the core-shell type with either metal as the core (and a remaining mixed surface) was found to be a multi-step process, mostly involving local deformations and the progressive motion of atoms via successive vacancy formation processes [48].
In the present study, we specifically address the optical signature of the rearrangement pathway identified in Ref. [48] for the cluster, in which both size and composition are kept fixed but both the core and the surface undergo major changes in terms of their chemical ordering. We find strong changes in the optical spectra, which are discussed in connection with the configuration-induced changes in the d-band edge and the contributions of the surface atoms to the electronic density of states (DOS).
The article is organized as follows. In the next section, we briefly describe how the pathway was obtained using a semi-empirical force field and how this information could be exploited using electronic structure methods, before the optical spectra themselves could be determined. The results are presented and discussed in Section 3, before some concluding remarks are provided in Section 4.
2. Methods
At the size of 55 atoms, AgAu nanoclusters tend to form icosahedral structures at all compositions, but for this highly miscible alloy, there are numerous non-equivalent ways to distribute gold and silver atoms among the so-called homotops (different chemical configurations). Here, we consider the specific composition and the two subsets of homotops with the 13 core atoms of the same metal element, which, for brevity, we denote as and clusters, respectively. As discussed in an earlier publication [48], the rearrangement pathways that connect these two families were determined using the discrete path sampling (DPS) method [49]. The DPS approach explores the pathways connecting minima to each other through a series of transition states ending in prescribed regions of the energy landscape by successive random perturbations, new pathways being accepted through a Monte Carlo acceptance probability. The doubly-nudged elastic band method [50] was used to generate the initial pathway.
As statistically converged DPS simulations are rather computer-intensive, an efficient semiempirical potential was needed to treat systems with as many degrees of freedom as a 55-atom cluster, and in the present work, the many-body potential based on second-moment approximation (SMA) to tight-binding theory, parametrized for silver and gold by Rossi and coworkers [51], was employed to mimic the structural dependence of the electronic structure of Ag-Au nanoalloys. This approach is not expected to be quantitative against methods that explicitly account for electronic structure, such as DFT, or even density-functional-based tight-binding, although the difficulty of correctly describing noble metal clusters with DFT is also documented [52,53,54].
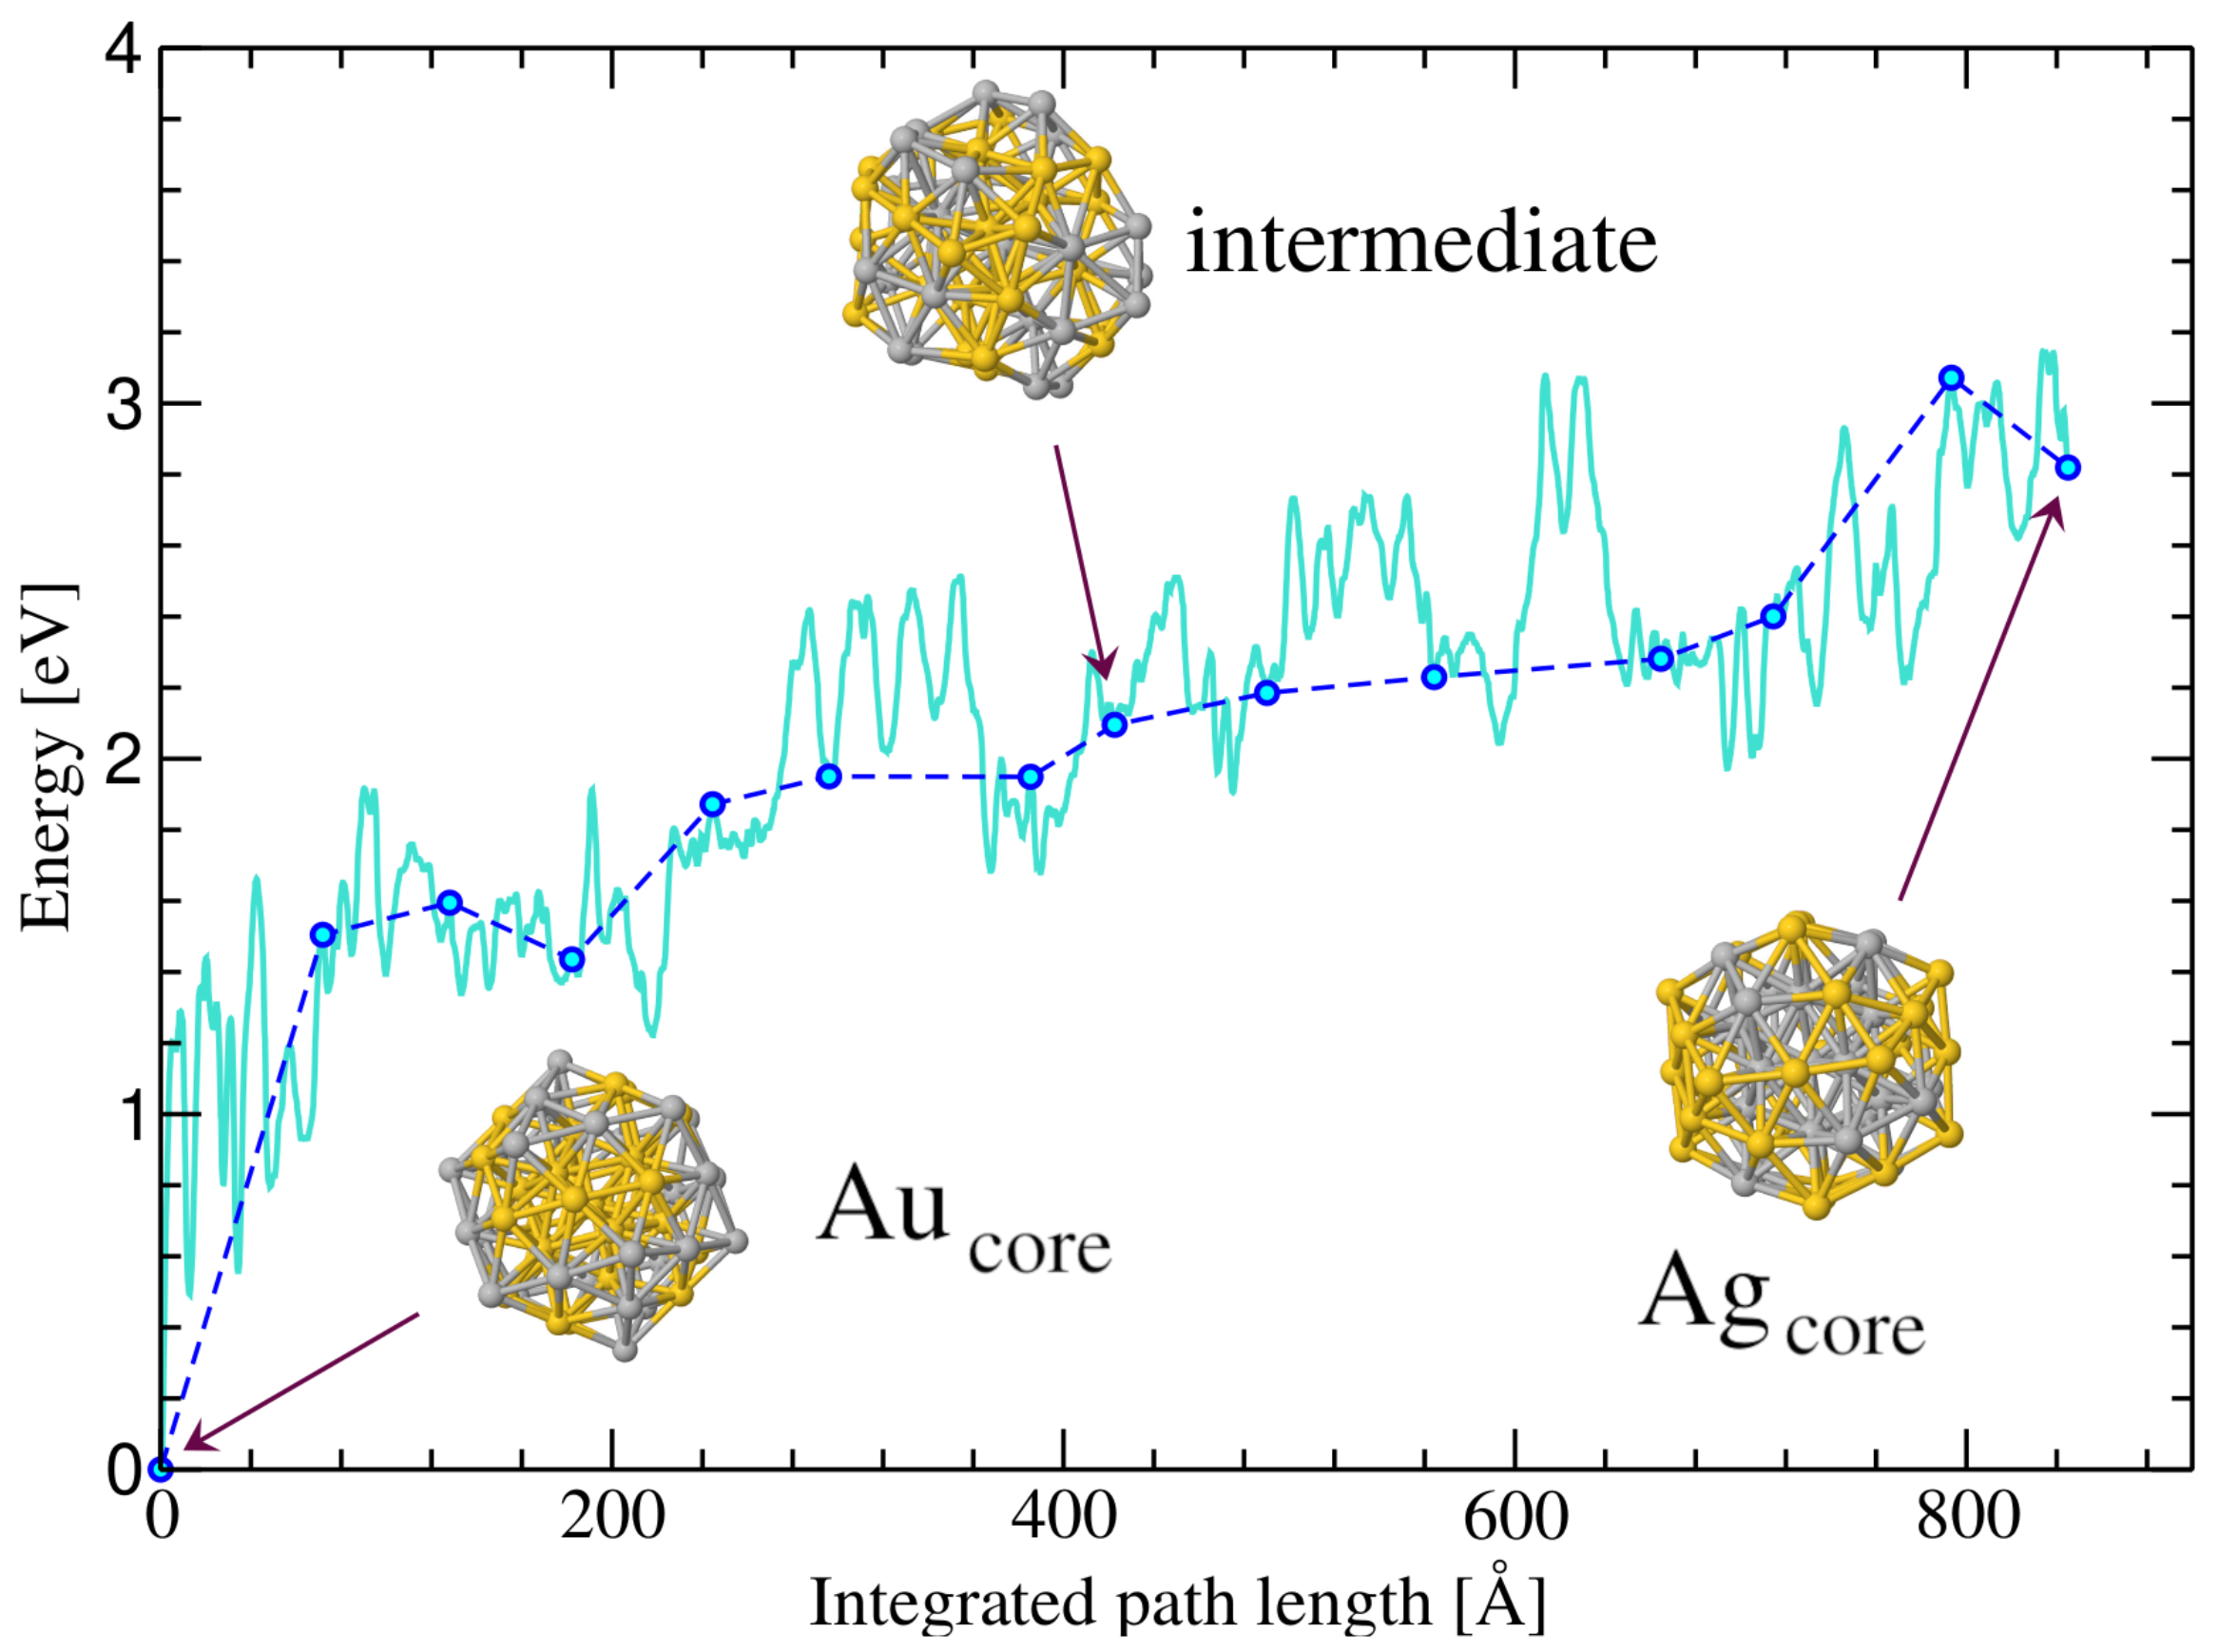
Among the numerous pathways that were thus obtained, the one contributing the most to the kinetic rate constant of the (favorable) ⟶ transformation is depicted in Figure 1.
This pathway contains 117 local minima and 116 intermediate state-to-state transition states, or a total of 233 stationary states for the SMA potential. With the energy model used at present, the gold-core clusters are the lowest in energy; they correspond to the reference configuration in Figure 1 above which all energies are measured. At the other extremity of the path, the configuration with all silver atoms in the core is higher in energy by about 3 eV and distant by more than 800 Å in accumulated atomic displacement from the reference configuration. Structures along the pathway usually deviate from the icosahedral shape owing to the need to displace atoms to form vacancies and to fill atoms of the other element instead. The local minimum chosen as the intermediate structure in Figure 1 displays an example of a clearly deformed (here prolate) nanoalloy approximately midway along the rearrangement trajectory.
We next discuss the influence of such a geometrical transformation along the pathway on the optical properties of the alloy nanocluster, independently of the synthesis method that would produce either of the endpoints as the starting configuration. The ground state and the optical absorption spectra of all selected structures were calculated using density-functional theory with the PBE functional to approximate the exchange-correlation functional [55]. The interactions between the electrons and the ions were described using norm-conserving Troullier–Martins pseudopotentials [56] treating 11 valence electrons corresponding to 10 4d (5d) electrons and one s electron per Ag (Au) atom explicitly. A grid spacing of 0.18 Å and a simulation radius of 5 Å were employed (radium of spheres around each atom, the superposition of which defines the computation domain).
Absorption spectra were obtained using time-dependent DFT with the Yabana–Bertsch time-evolution formalism [57], which involves the real-time propagation of the wavefunctions after a delta kick at . We used the approximated enforced time-reversal symmetry (AETRS) propagator. All DFT and TDDFT calculations were performed using the real-space code Octopus [58]. The so-called superatom analysis of the electronic structure was performed following Ref. [59]. In this approach, the Kohn–Sham wave-functions are projected onto spherical harmonics, which allows for a determination of their angular-momentum character and, in particular, identification of the jellium-like delocalized states that follow the super-atom or super-atom-complex (SAC) model. The same homemade code was used for the atomistic projected density of states (PDOS) so that the two quantities can be directly compared. Since the atomistic projection onto spherical harmonics is carried out inside the spheres around each atom, an appropriate summation yields an approximate angular-momentum-resolved local density of states, which also provides the possibility of producing sums over the surface or the interior atoms.
3. Results and Discussion
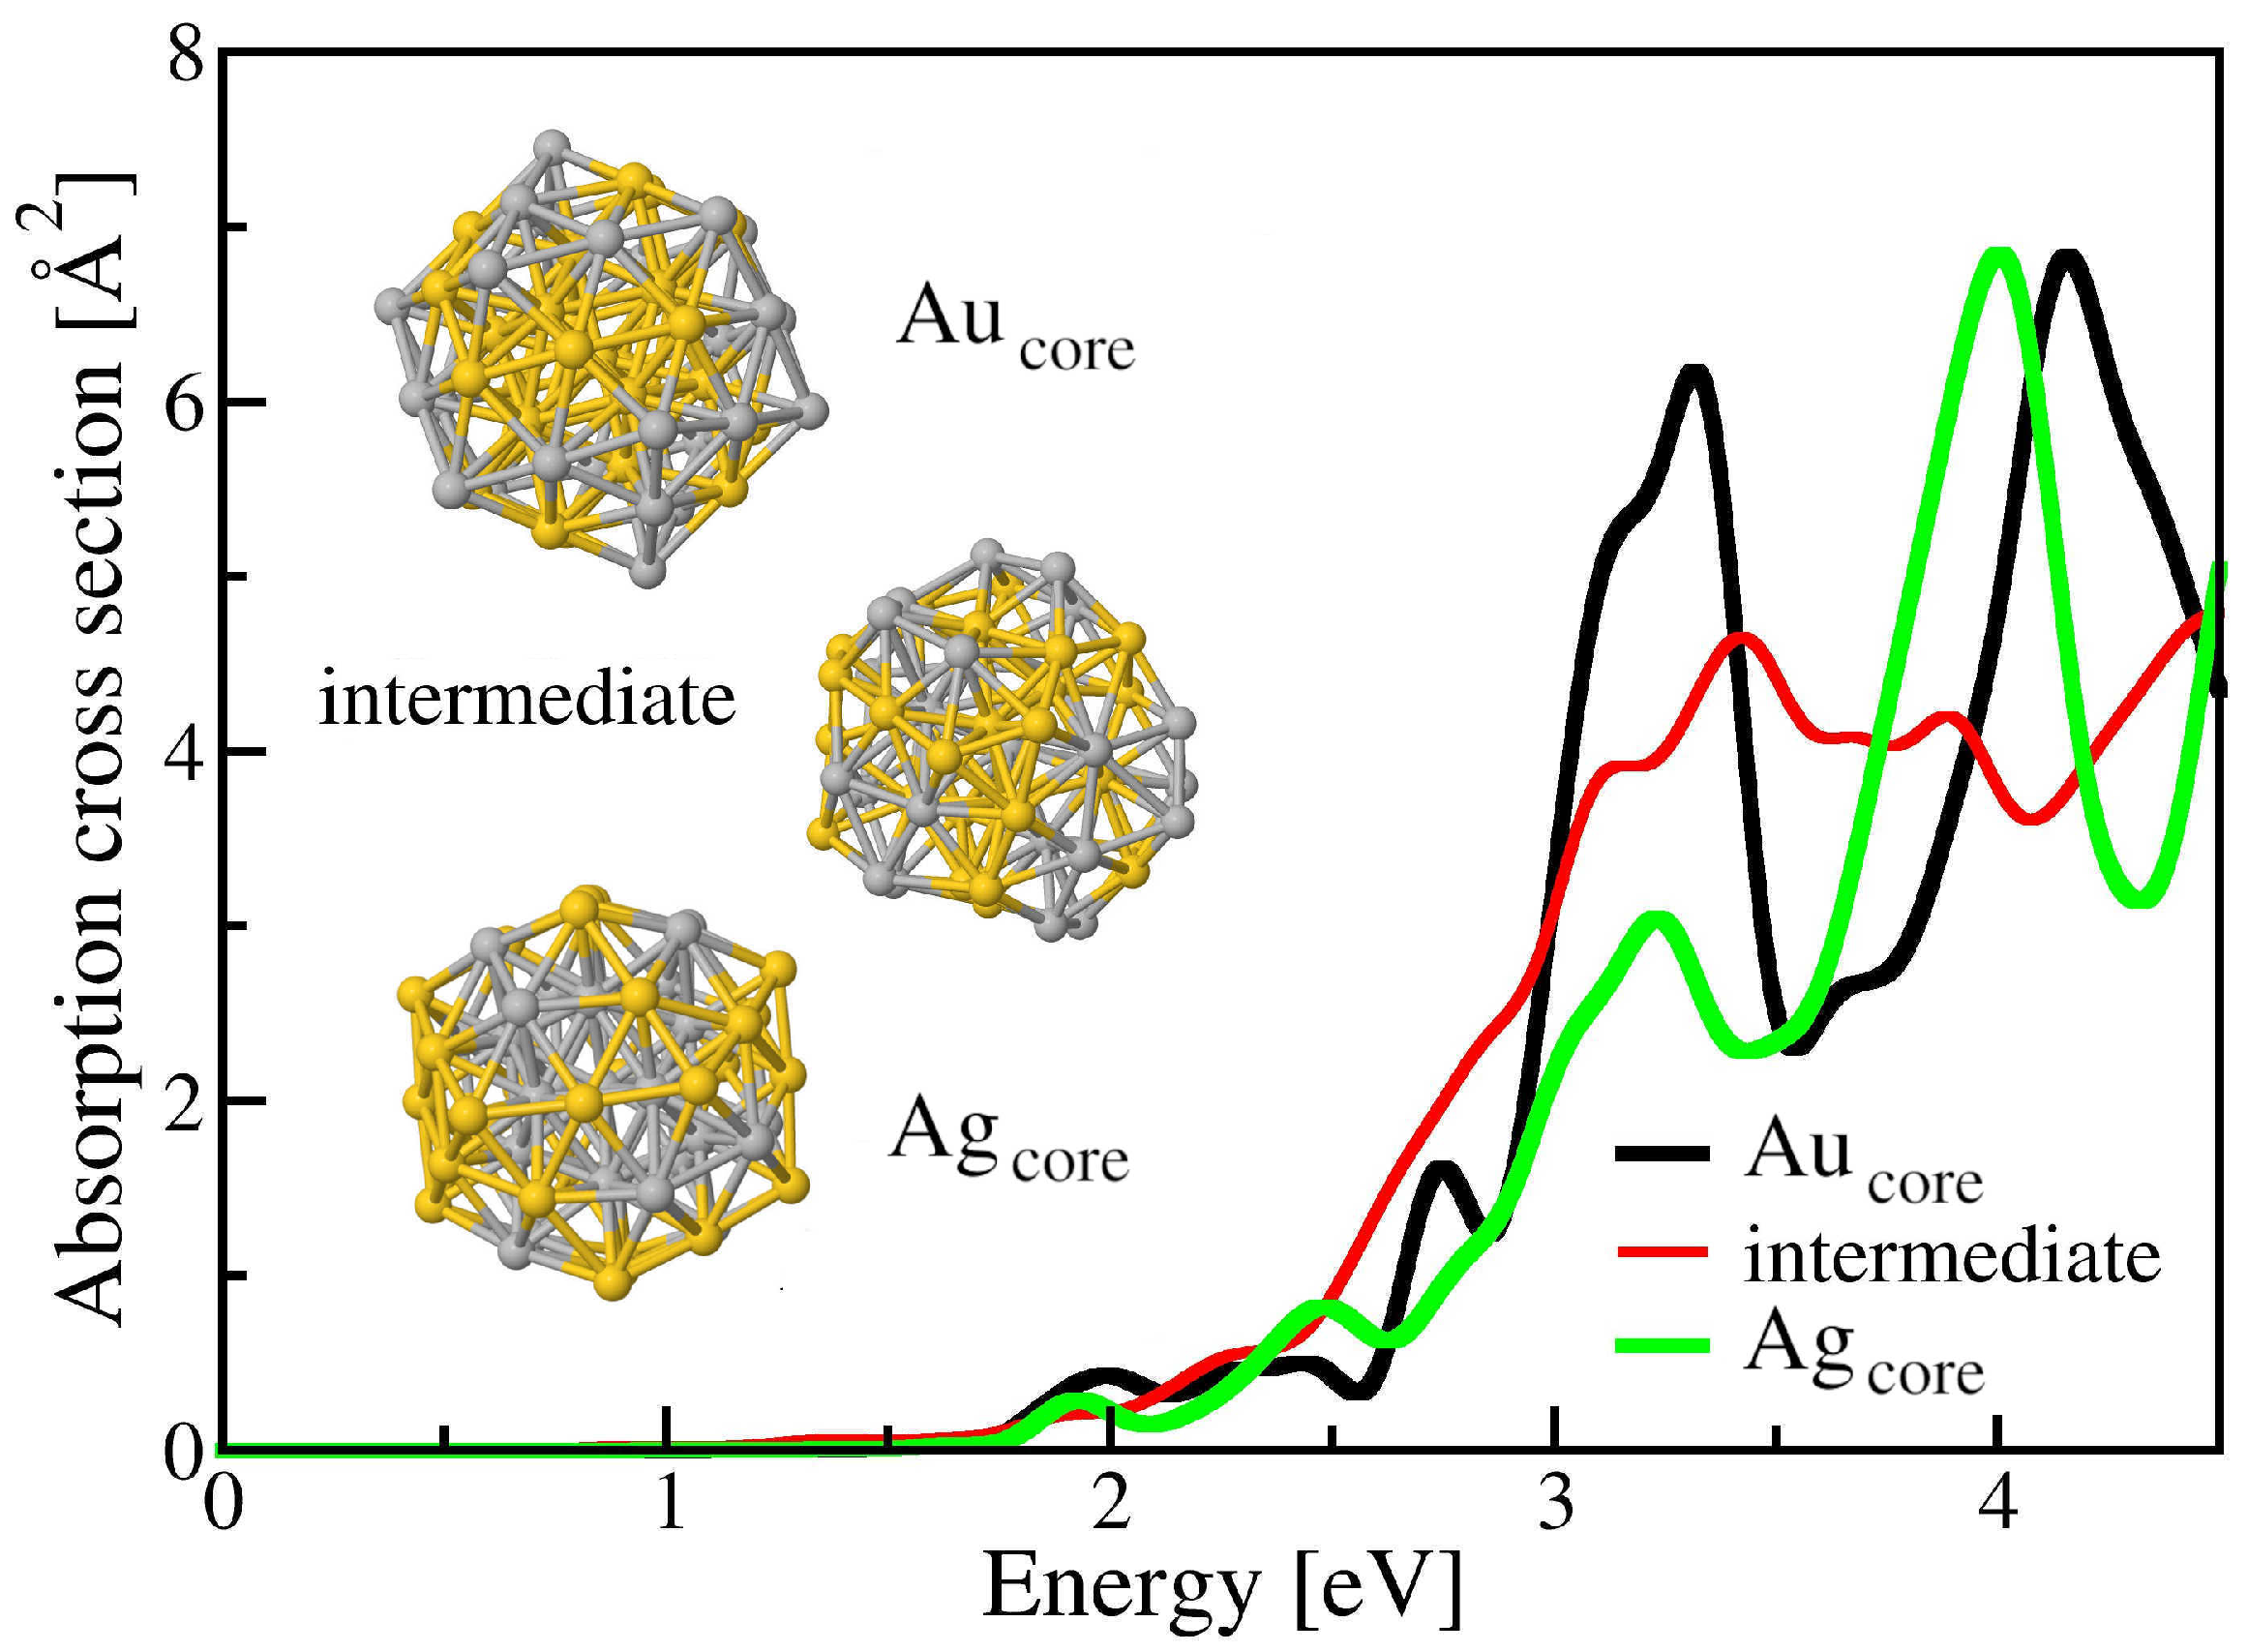
The optical response of the , , and intermediate configurations along the pathway of Figure 1 are shown in Figure 2. A more complete set of spectra for the remaining configurations, in which the progressive changes are better visualized, is provided as an animation in the Supplementary Material.
The configuration with all silver atoms at the surface is energetically the more stable endpoint. It has an optical spectrum exhibiting a strong peak at about 3.3 eV, which corresponds to the LSPR. The strong contributions at higher energies of about 4.2 eV presumably originate from the complex interplay of the plasmon with the respective d states of the gold and silver atoms. The main effect of the reordering of the cluster towards the configuration is the clear decrease in the peak at 3.3 eV, indicating the increase in the damping of the LSPR. This is reminiscent of the disappearance of the LSPR in ideal gold-silver core-shell structures with a pure gold surface layer [33], although, in the aforementioned work, the effect could not be identified as clearly because the relative number of atoms necessarily changed between the and clusters. In the Supplementary Information, we reproduce the spectra of the pure and of the perfect core-shell 55-atom structures [33].
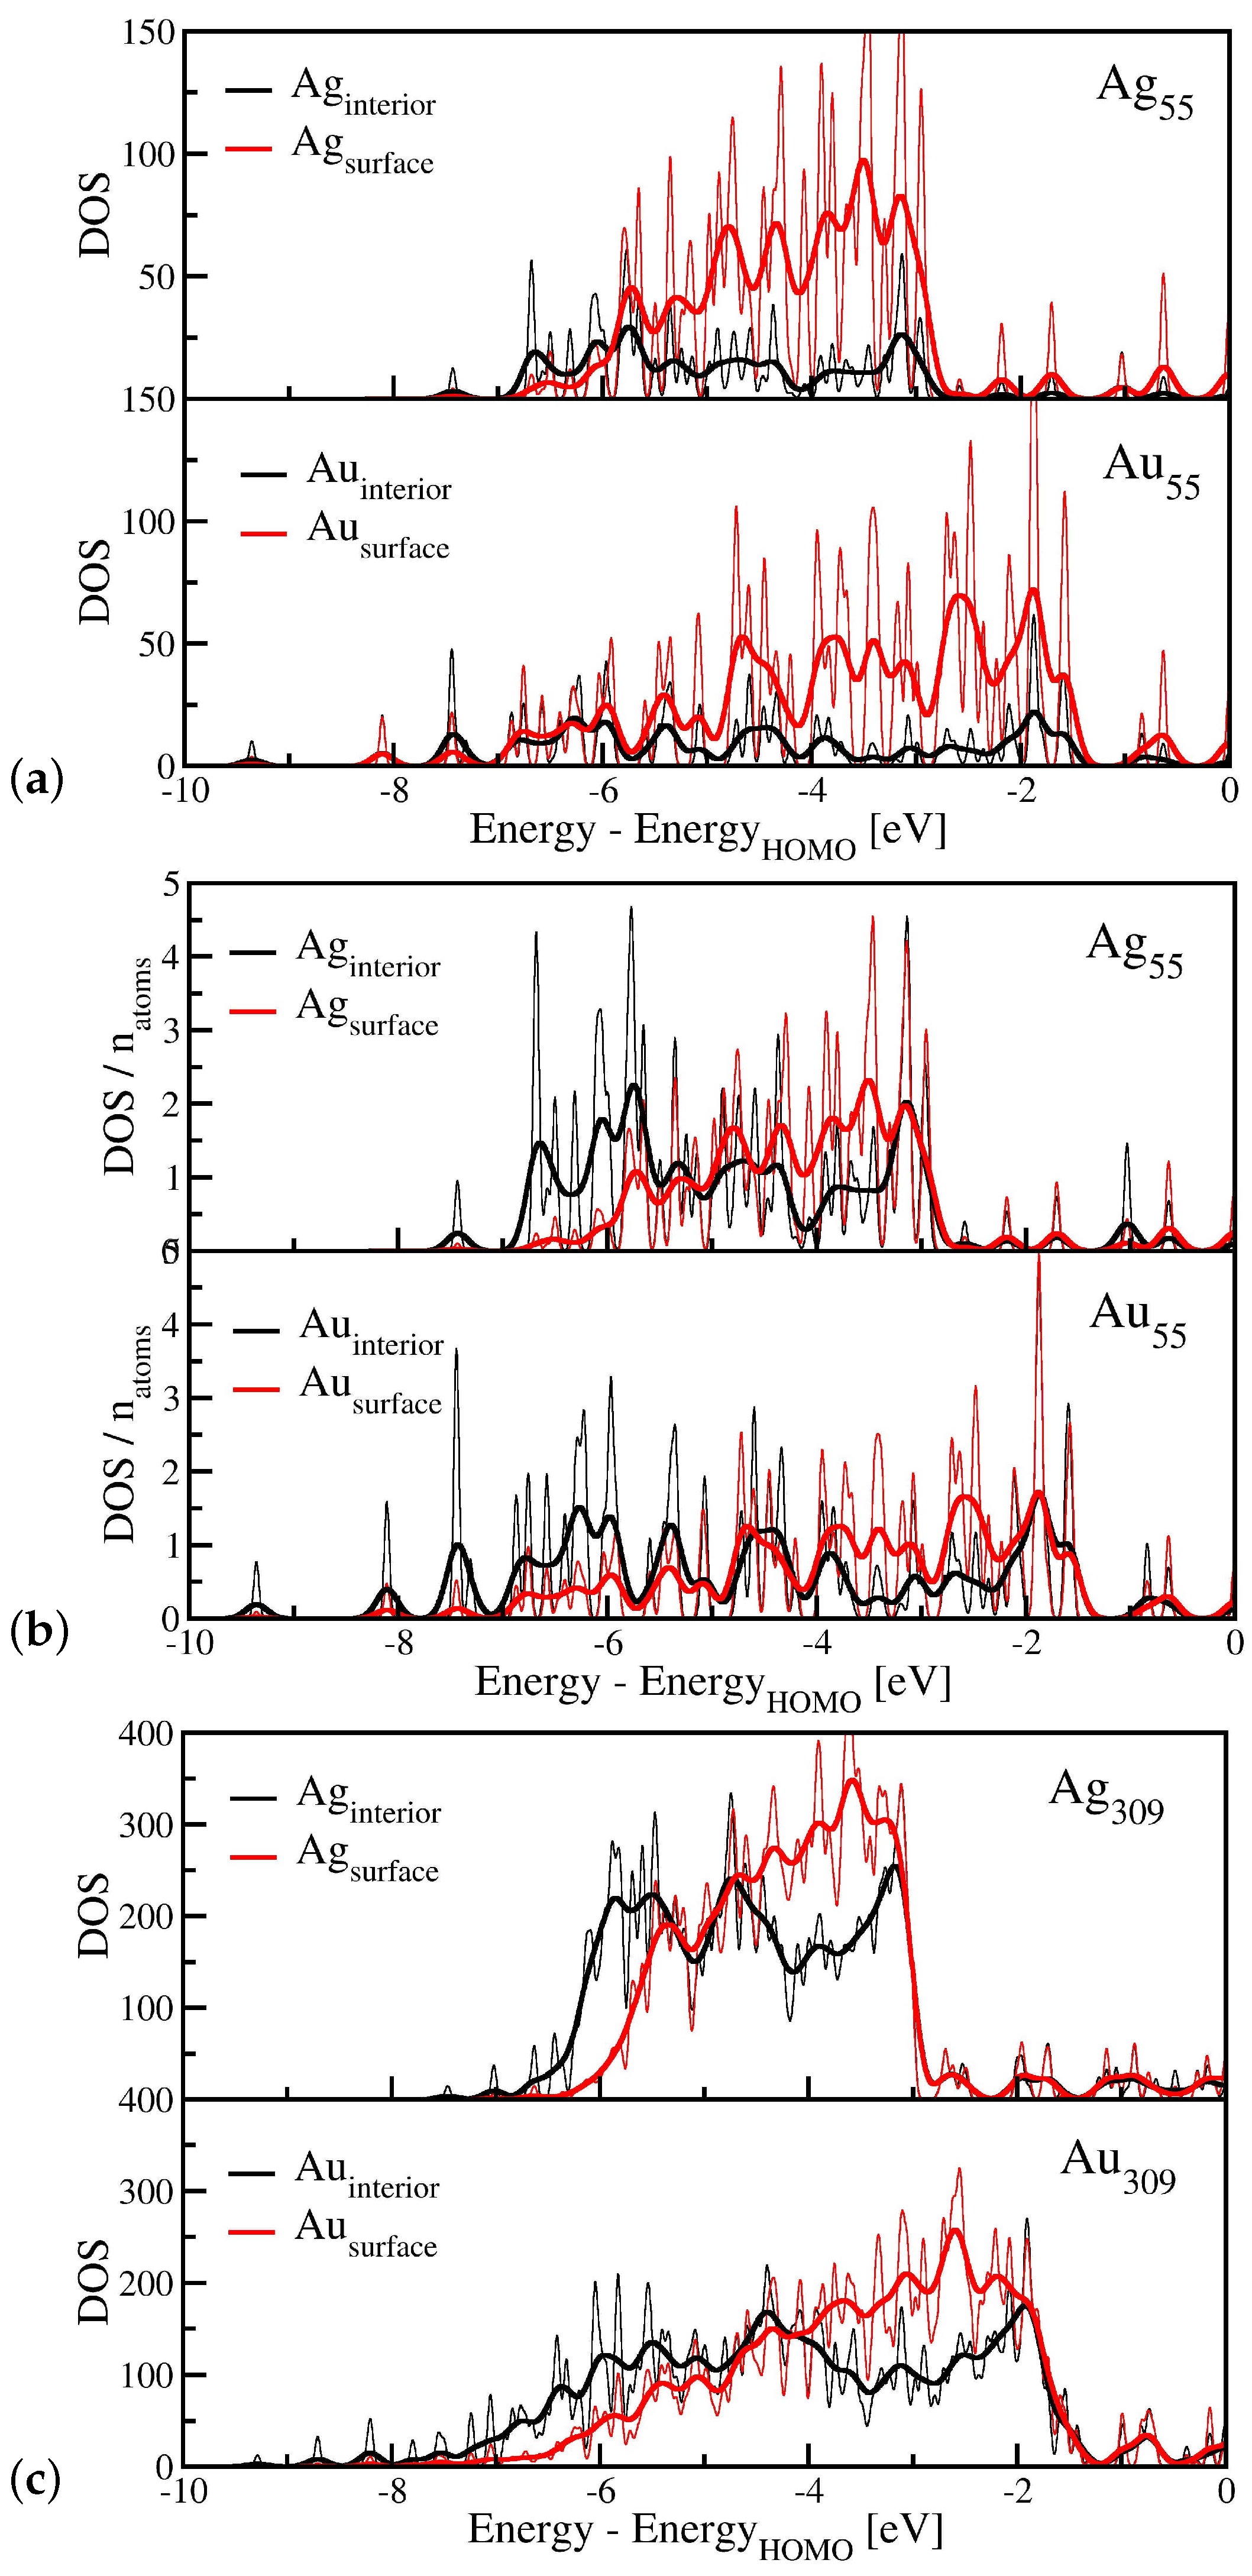
In order to separate the different effects that influence the changes seen in Figure 2, it is instructive to consider the limiting cases of pure gold and silver clusters. Figure 3 shows the densities of states of the 55-atom and 309-atom icosahedral clusters, with the latter size being chosen as it has a similar number of atoms in the core (147) and in the outer shell (162). In the 55-atom nanoalloys, the number of surface atoms is much larger than that of interior atoms (42 vs. 13). When comparing the contribution of the two on the overall DOS, this fact can lead to a partially misleading impression because the differences are due to two effects: the different nature of the states and the different numbers of atoms. For this reason, in Figure 3b, we present the same DOS but divided by the respective numbers of surface (42) or interior (13) atoms.
Although the DOS is rough and peaked due to the relatively low number of electrons, the d band is clearly seen for both metals, with the edge of the Ag d band lower in energy than for Au and the overall d band narrower in the silver cluster. The interior contributions to the d band are spread over a larger energy range than those of the surface atoms. This reflects the lower coordination number of the surface atoms and corresponds to the well-known result of the local density of states. In addition, the edge of both d-band contributions lies at roughly the same energy [60,61].
The DOSs of the larger nanoparticles of 309 atoms, shown in Figure 3c, are smoother due to the much larger number of states, but the overall findings are the same as in the 55-atom clusters. It is instructive to see these effects for the pure clusters, as they will appear in a less clear form in the results for the alloy clusters. What remains to be determined is the respective importance of the overall differences in the DOS and of the different natures of the surface and interior contributions.
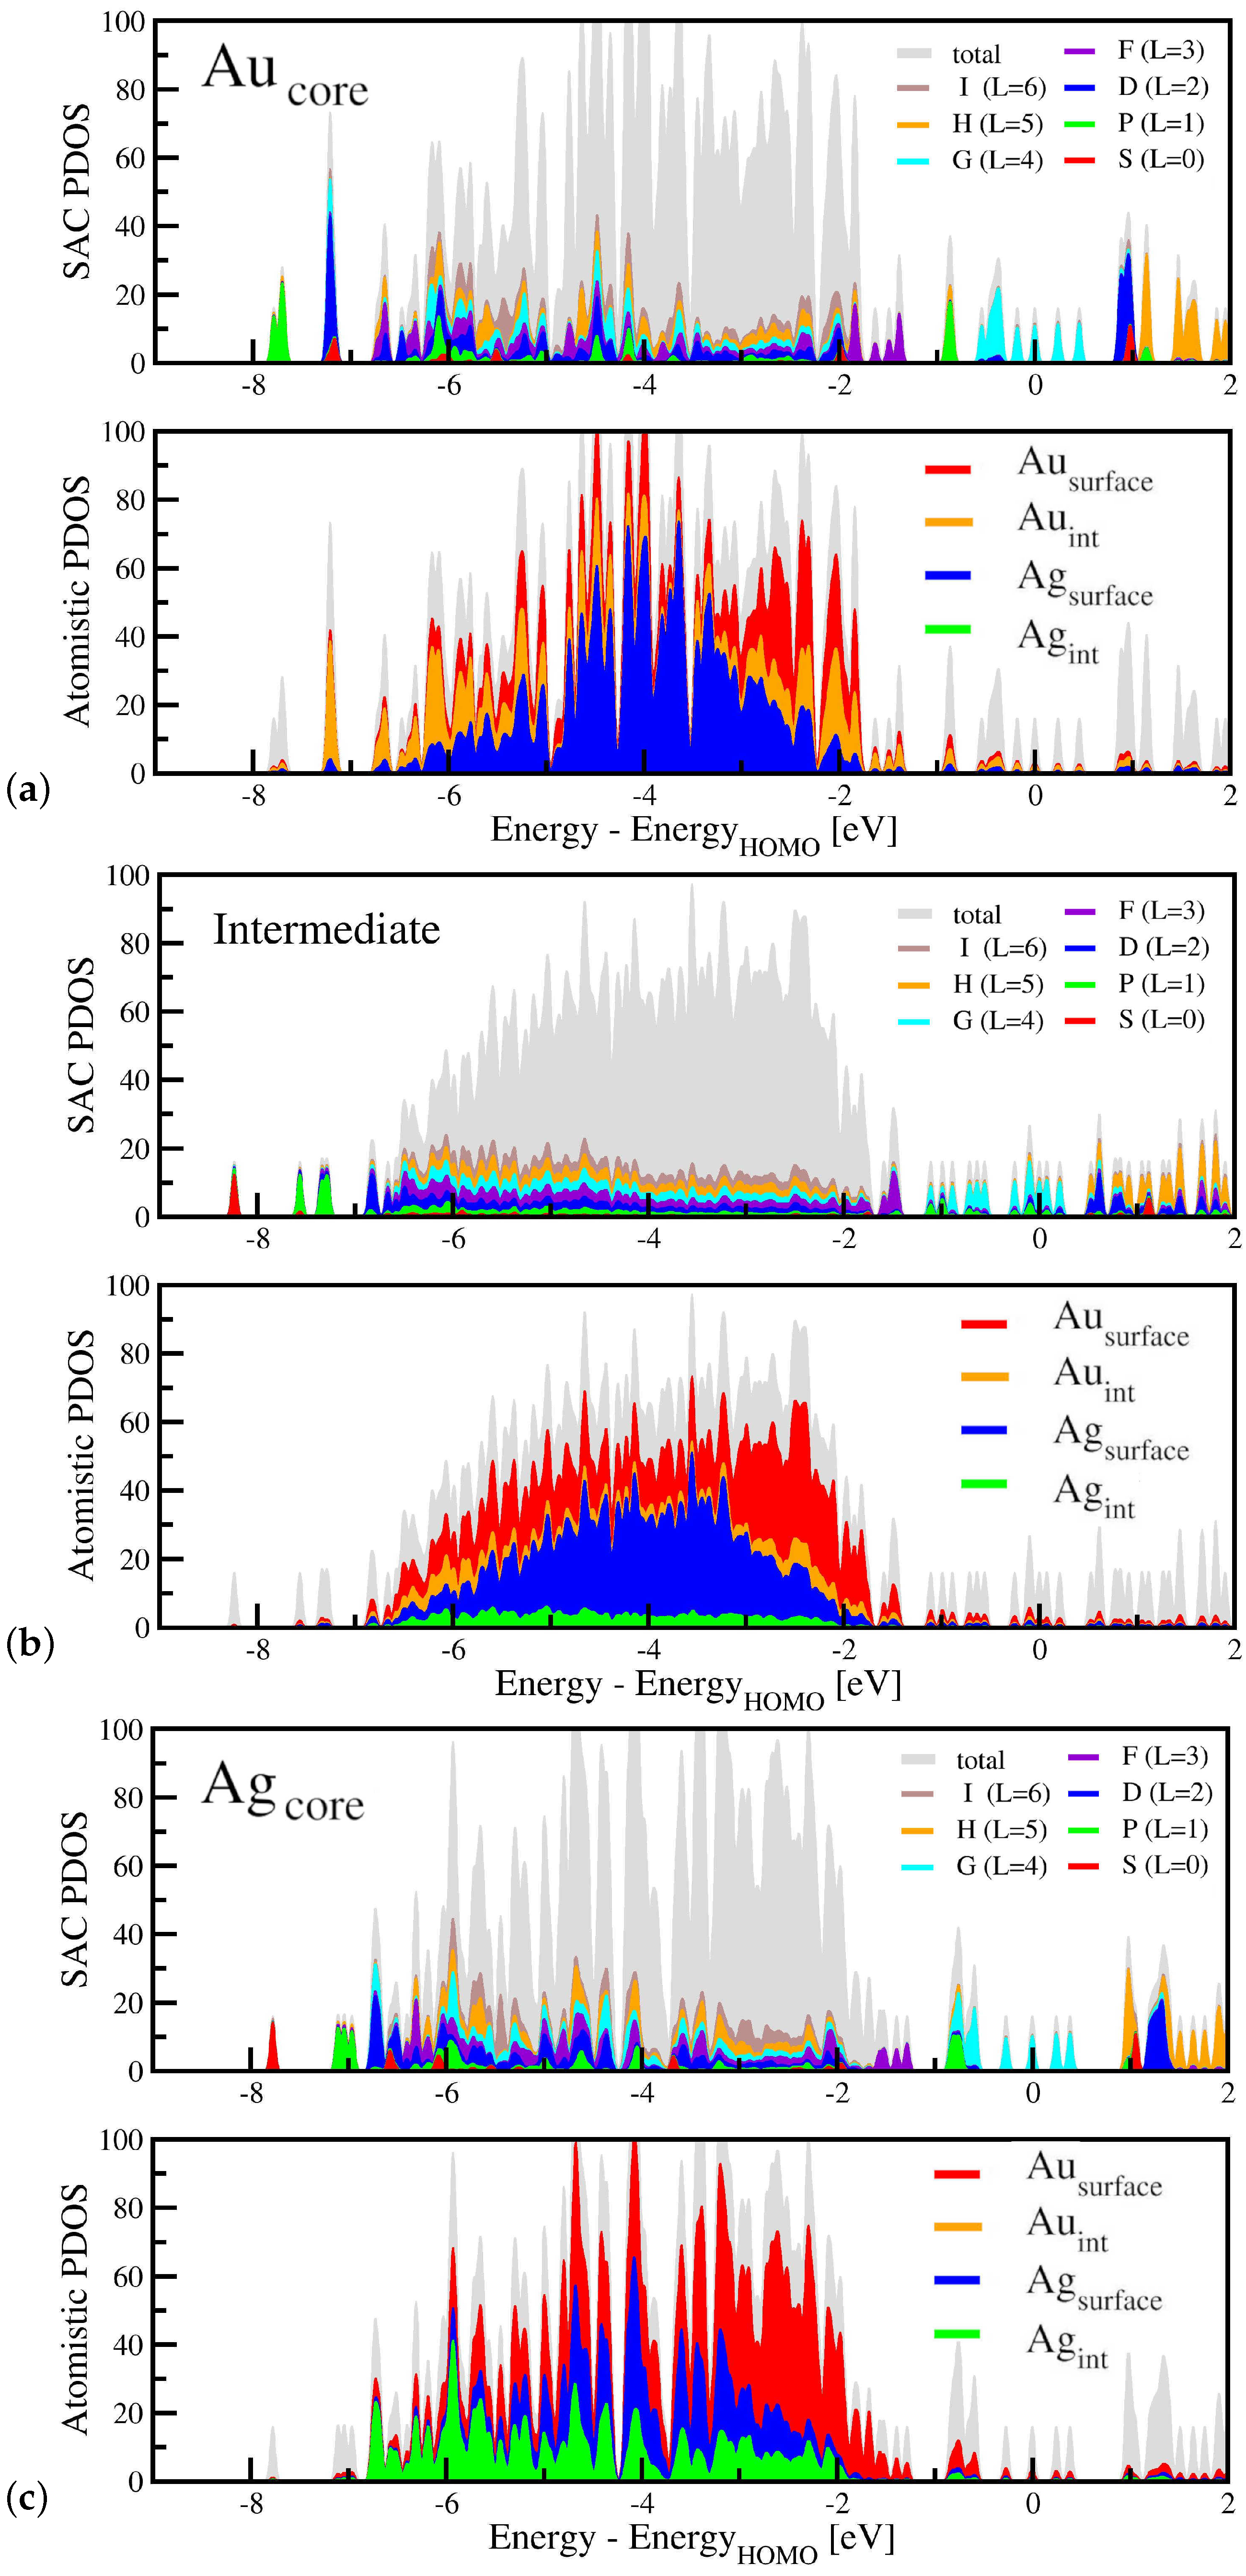
We turn to an analysis of the electronic structure of the 55-atom alloy clusters. A mere consideration of the (total) densities of these states does not show significant changes in the d-band edge, unlike in the above comparison between pure silver and gold clusters. The total DOSs are included as an animation in the Supplementary Material to show the continuous changes, which are rather small. Consequently, in Figure 4, we present the projected densities of states (PDOS) for the same three configurations, the spectra of which are shown in Figure 2. In each case, we show the superatom projection where the wavefunctions are projected onto spherical harmonics over the full clusters with the center of mass at the origin. This projection, which corresponds to the SAC model [59], provides the angular momentum character of the delocalized (“jellium”) states.
In the cases where one angular-momentum character is dominant, the corresponding peak in the PDOS carries one color and represents one (sub-)shell of superatom states. In contrast, when a wild mixture of contributions is indicated by the different colors, no clear SAC character is found. This is the case for the d band, for which the general position of the electrons is dictated by the position of the atoms rather than the arrangement of the delocalized electronic states. The two cases can clearly be distinguished from one another, e.g., in the SAC panel for the configuration: in the region between −6.5 and −2.0 eV, the d band does not show any particular SAC state. Conversely, below −6.5 eV and above −2.0 eV, the SAC character is clearly identified. Interestingly, the lowest S state with lies slightly above the P and the D states, unlike in the other two configurations shown here, where the normal S-P-D order is found. Further insight can be obtained from the SAC states around the HOMO-LUMO gaps. The states around the HOMO are (G) states; their splitting and exact energies change somewhat along the trajectory but their nature does not. The same applies to the P and F states above the d band. While these characters are determined by the overall count of delocalized electrons, they are not qualitatively changed by the alloying and reordering effects.
For each configuration, Figure 4 also shows the d components of the atomistic PDOS. This information is complementary to the SAC PDOS and helps to identify the different characters of the wavefunctions. In the case of the clear SAC states, the atomistic d character is vanishingly small, as can be seen, e.g., in the lowest states of each configuration.
Along the rearrangement trajectory, there is a small increase in the total DOS around and slightly above −2 eV. This change is much smaller than the difference between the pure gold and silver clusters, c.f. Figure 3. Looking at the projected densities of states, we see that while in the configuration, any states above −2 eV are rather clear SAC F states (), there is an increase in (atomistic) d contributions at this energy along the trajectory and especially in the configuration. Separating the contributions from interior and surface atoms, we see in Figure 4 that the upper edge of the d band in the configuration is comprised of contributions from both the surface and the inner Au atoms. Both contributions are of similar importance. Along the trajectory, the contribution of surface gold atoms increases until it largely dominates the edge states for the configuration. This increase, together with the aforementioned particular influence of the surface atoms, causes the strong effect on the optical properties in general and, in particular, the LSPR.
For comparison, we show the equivalent of Figure 4 for the pure clusters and perfect core-shell structures in the Supplementary Material. In this case, the changes in the d band are much stronger than the ones shown in Figure 4. This strong effect is due to the changing composition between the systems and would render any of the subtle changes discussed for the rearrangement trajectory indiscernible.
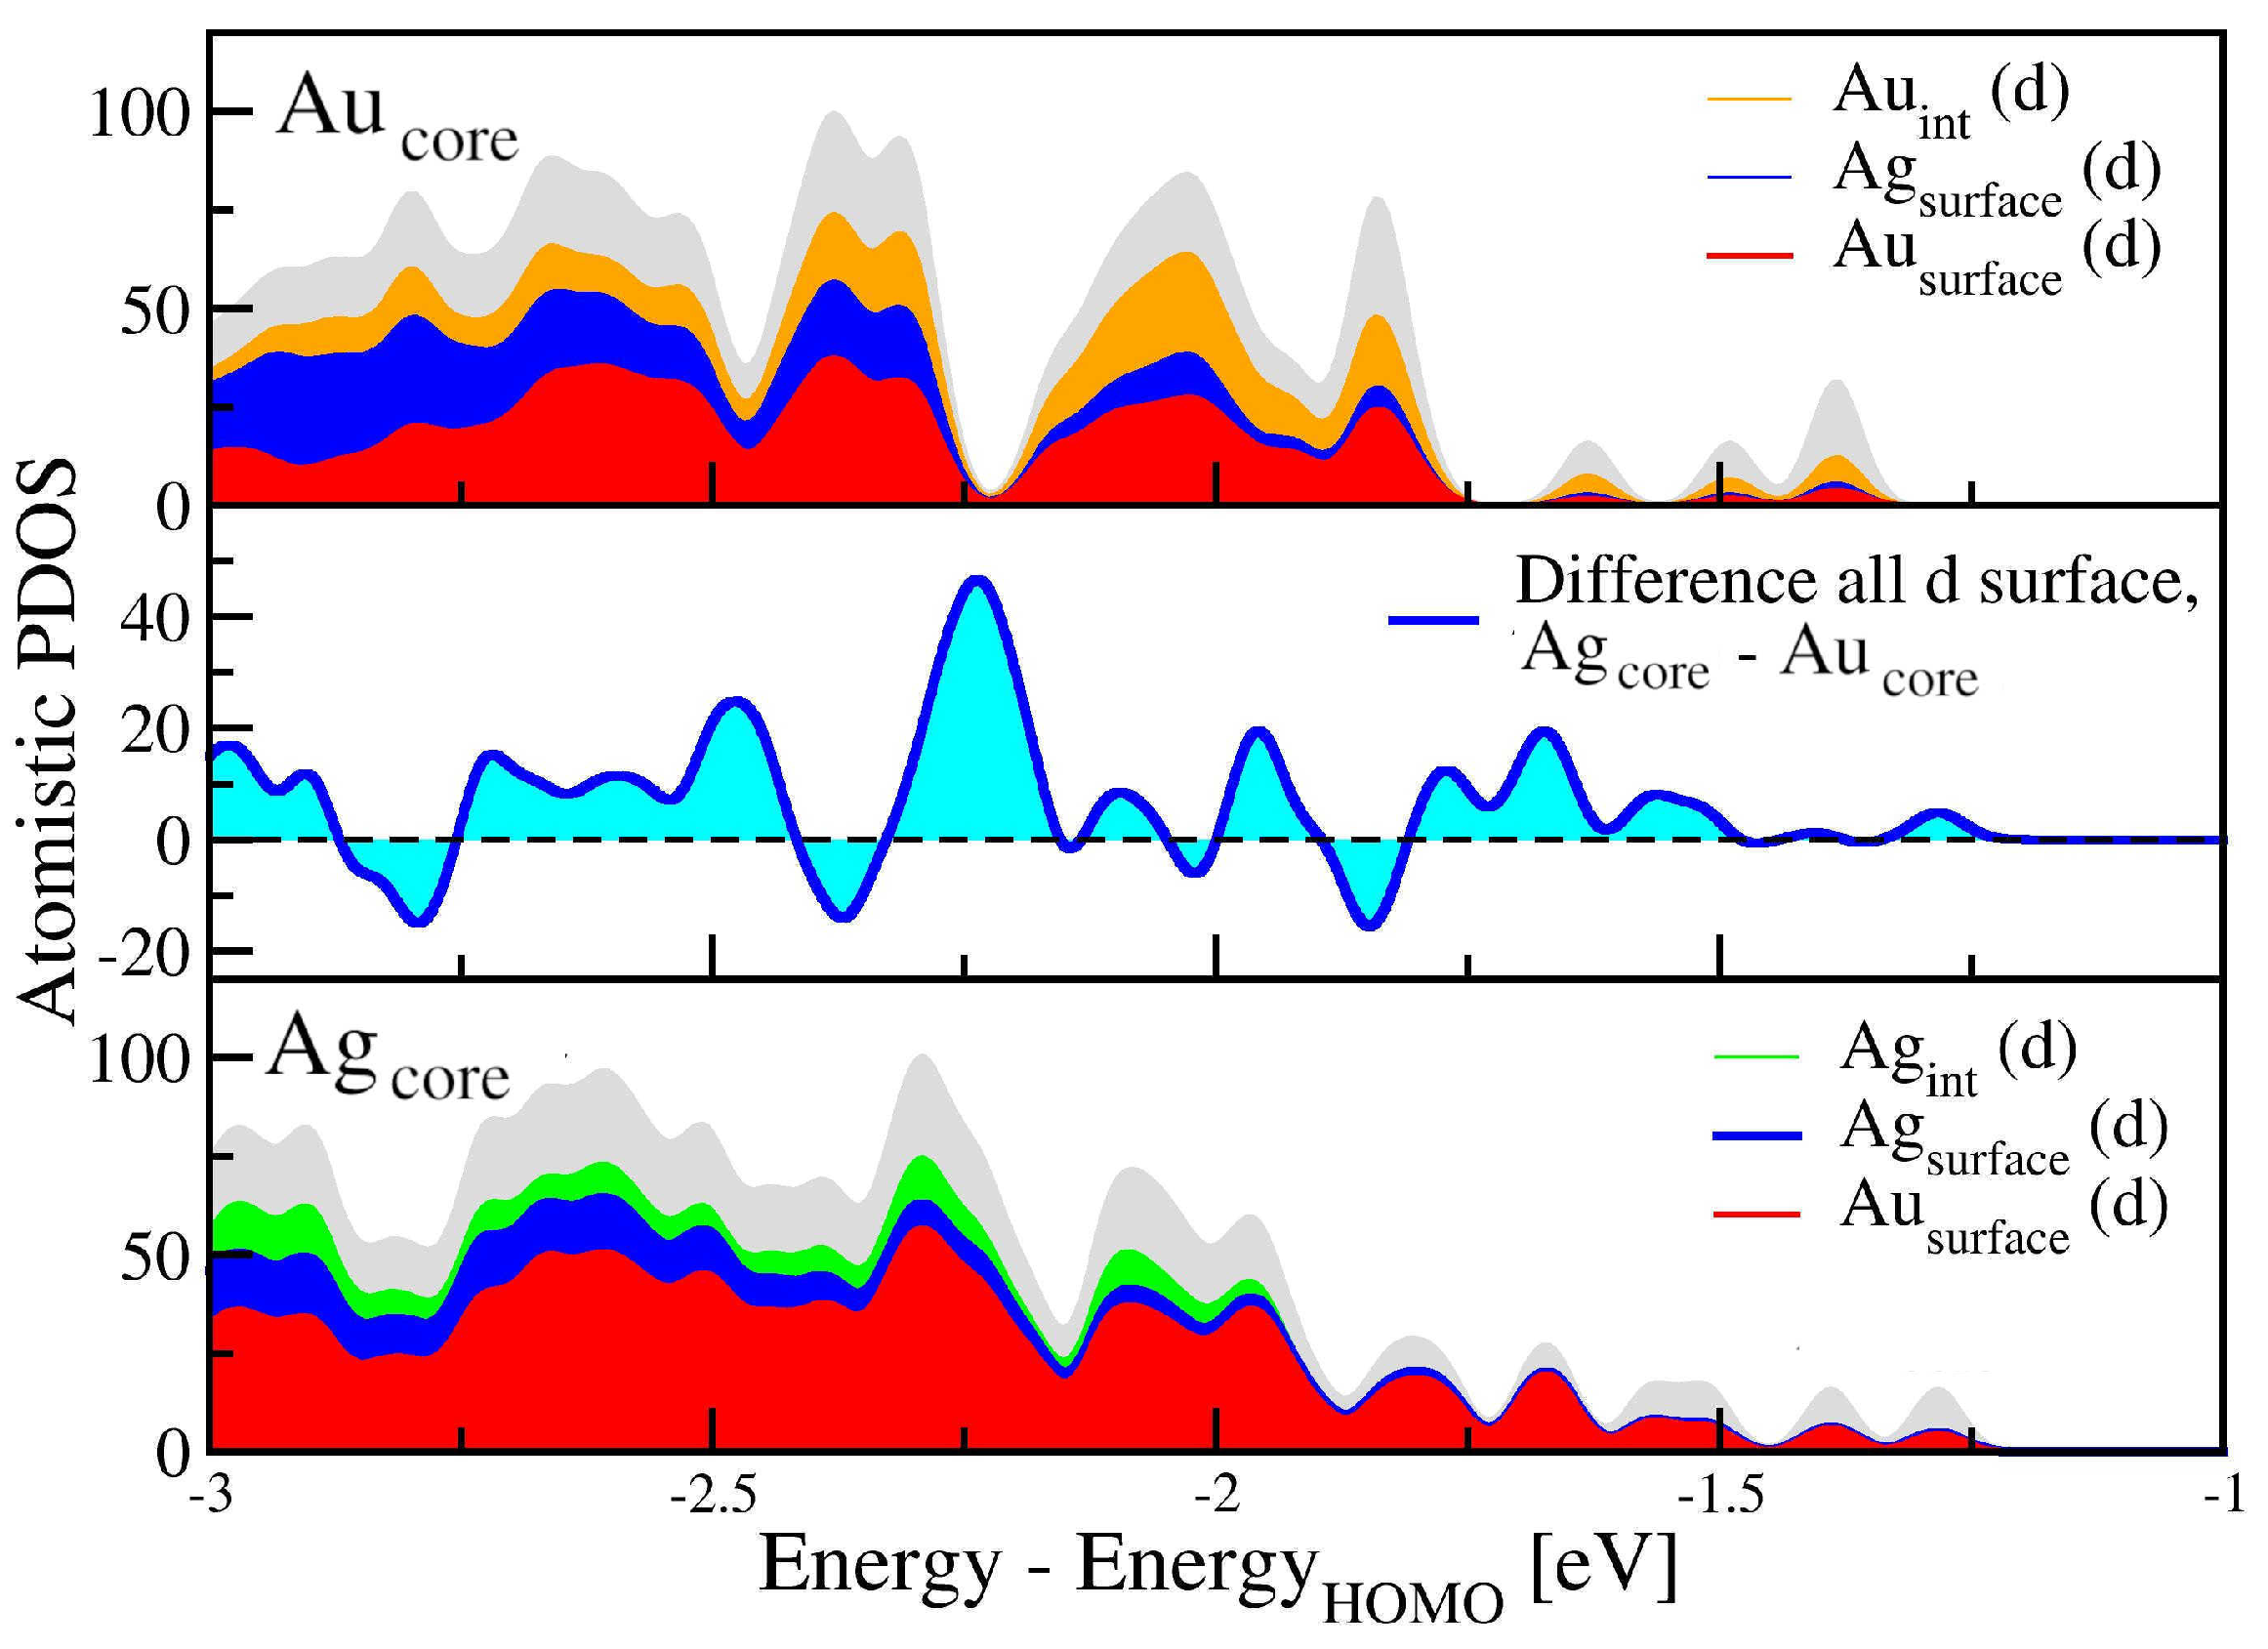
To represent the relevant changes along the trajectory more clearly, an enlarged view of the d band edges is shown in Figure 5. The increase in the surface Au contributions is clearly seen. In addition, the difference in the total d contributions between the first and the last configurations is almost always positive, as is shown in the middle panel. This concerns particularly the energy range between roughly −1.5 and −2.5 eV. However, this increase remains relatively subtle, even though its effect on the optical spectra, via the change in the interband transitions, is strong, as seen in Figure 2.
4. Conclusions
The optical signature associated with the complex structural rearrangement in AgAu nanoalloys over a rearrangement trajectory connecting the to the clusters was theoretically investigated. Our approach paves the way for studies on the influence of the chemical configuration on the optical properties based on non-ideal structures, under the constraint that both the overall composition and the size are kept fixed.
The calculated spectra exhibit strong variations along the trajectory, with the clear LSPR in the configuration with all silver atoms at the surface becoming increasingly damped as the gold atoms gradually replace them at the surface. This finding agrees with earlier studies that showed a strong influence of the outermost atomic layer [33]. These changes are clearly related to the interband transitions from the filled d shells. A detailed analysis of the overall density of states shows that it does not change strongly. The DOS at the d-band edges increases as more gold atoms fill the surface, but this increase is subtle and does not appear to induce alone the strong observed changes in the optical spectra.
An analysis of the projected densities of states, differentiating between contributions from the surface atoms and the interior atoms, indicates that it is the contribution of the surface gold atoms to the d band edge which induces the strong changes in the optical spectra, viz., the strong damping and decrease in the LSPR. The precise chemical configuration thus has a strong influence on the optical properties, even though the changes in the d band edge that mediate this influence on the optical properties via the interband transitions remain relatively small. Our results further confirm the possibility of engineering the optical properties of plasmonic nanoalloys by designing the appropriate chemical configurations.
In straightforward extensions of the present work, other compositions could be considered, with the cases of 25%:75% and 75%:25% being particularly interesting at the size of 55 atoms as they approximately correspond to the perfect core-shell nanostructures. Larger clusters, however, would definitely pose a challenge to both the statistical exploration of connecting pathways and to the subsequent electronic structure calculation. In this respect, it would be particularly relevant to employ alternative methodologies, e.g., based on machine learning [62,63,64], to address both aspects.
Supplementary Materials
The following supporting information can be downloaded at: https://0-www-mdpi-com.brum.beds.ac.uk/article/10.3390/alloys3010003/s1, In the electronic supplementary material we show a series of optical spectra including many of the intermediate configurations (animation); the changes of the total DOS for the same configurations; spectra of the pure and perfect core-shell 55-atom AgAu clusters; the PDOS of these clusters.
Author Contributions
Conceptualization, H.-C.W. and F.C.; methodology, H.-C.W. and F.C.; software, H.-C.W.; validation, H.-C.W.; formal analysis, H.-C.W.; investigation, H.-C.W.; resources, H.-C.W.; data curation, H.-C.W.; writing—original draft preparation, H.-C.W.; writing—review and editing, H.-C.W. and F.C.; visualization, H.-C.W.; supervision, H.-C.W.; project administration, H.-C.W.; funding acquisition, H.-C.W. and F.C. All authors have read and agreed to the published version of the manuscript.
Funding
We acknowledge support from the French National Research Agency (Agence Nationale de Recherche, ANR) in the frame of the project “SchNAPSS”, ANR-21-CE09-0021. The work has used HPC resources from GENCI-IDRIS (Grant 2022-0906829). Moreover, the authors acknowledge the contribution of the International Research Network IRN Nanoalloys (CNRS).
Data Availability Statement
The original contributions presented in the study are included in the article and supplementary materials, further inquiries can be directed to the corresponding author.
Conflicts of Interest
The authors declare no conflicts of interest.
References
- Seney, C.S.; Gutzman, B.M.; Goddard, R.H. Correlation of Size and Surface-Enhanced Raman Scattering Activity of Optical and Spectroscopic Properties for Silver Nanoparticles. J. Phys. Chem. C 2009, 113, 74–80. [Google Scholar] [CrossRef]
- Zheng, Y.B.; Jensen, L.; Yan, W.; Walker, T.R.; Juluri, B.K.; Jensen, L.; Huang, T.J. Chemically Tuning the Localized Surface Plasmon Resonances of Gold Nanostructure Arrays. J. Phys. Chem. C 2009, 113, 7019–7024. [Google Scholar] [CrossRef]
- Murray, W.A.; Auguié, B.; Barnes, W.L. Sensitivity of Localized Surface Plasmon Resonances to Bulk and Local Changes in the Optical Environment. J. Phys. Chem. C 2009, 113, 5120–5125. [Google Scholar] [CrossRef]
- Zhang, J.Z. Biomedical Applications of Shape-Controlled Plasmonic Nanostructures: A Case Study of Hollow Gold Nanospheres for Photothermal Ablation Therapy of Cancer. J. Phys. Chem. Lett. 2010, 1, 686–695. [Google Scholar] [CrossRef]
- Atwater, H.; Albert, P. Plasmonics for improved photovoltaic devices. Nat. Mater. 2010, 9, 205–213. [Google Scholar] [CrossRef] [PubMed]
- Lin, Z.; Luo, Y.; Liu, P.; Li, Y.; Yue, J.; Jiang, L. Atomic-engineering Au-Ag nanoalloys for screening antimicrobial agents with low toxicity towards mammalian cells. Colloids Surfaces Biointerfaces 2021, 204, 111831. [Google Scholar] [CrossRef] [PubMed]
- Nguyen, C.M.; Frias Batista, L.M.; John, M.G.; Rodrigues, C.J.; Tibbetts, K.M. Mechanism of Gold–Silver Alloy Nanoparticle Formation by Laser Coreduction of Gold and Silver Ions in Solution. J. Phys. Chem. B 2021, 125, 907–917. [Google Scholar] [CrossRef]
- Alheshibri, M. Fabrication of Au-Ag Bimetallic Nanoparticles Using Pulsed Laser Ablation for Medical Applications: A Review. Nanomaterials 2023, 13, 2940. [Google Scholar] [CrossRef]
- Kohut, A.; Villy, L.P.; Kéri, A.; Bélteki, Á.; Megyeri, D.; Hopp, B.; Galbács, G.; Geretovszky, Z. Full range tuning of the composition of Au/Ag binary nanoparticles by spark discharge generation. Sci. Rep. 2021, 11, 5117. [Google Scholar] [CrossRef]
- Traoré, N.E.; Uttinger, M.J.; Cardenas Lopez, P.; Drobek, D.; Gromotka, L.; Schmidt, J.; Walter, J.; Apeleo Zubiri, B.; Spiecker, E.; Peukert, W. Green room temperature synthesis of silver–gold alloy nanoparticles. Nanoscale Adv. 2023, 5, 1450–1464. [Google Scholar] [CrossRef]
- García-Serrano, J.; Rodríguez-Cisneros, C.B.; Hernández-Rodríguez, Y.M. Green synthesis of polymer stabilized polyhedral Au, Au–Ag and Au–Cu nanoparticles and their catalytic activity for the reduction of 2-nitrophenol. Chem. Pap. 2023, 77, 5079–5090. [Google Scholar] [CrossRef]
- Cottancin, E.; Celep, G.; Lermé, J.; Pellarin, M.; Huntzinger, J.; Vialle, J.; Broyer, M. Optical Properties of Noble Metal Clusters as a Function of the Size: Comparison between Experiments and a Semi-Quantal Theory. Theor. Chem. Accounts Theory Comput. Model. (Theoretica Chim. Acta) 2006, 116, 514. [Google Scholar] [CrossRef]
- Haberland, H. Looking from both sides. Nature 2013, 494, E1–E2. [Google Scholar] [CrossRef] [PubMed]
- Campos, A.; Troc, N.; Cottancin, E.; Pellarin, M.; Weissker, H.C.; Lermé, J.; Kociak, M.; Hillenkamp, M. Plasmonic quantum size effects in silver nanoparticles are dominated by interfaces and local environments. Nat. Phys. 2019, 15, 275–280. [Google Scholar] [CrossRef]
- Cortie, M.B.; McDonagh, A.M. Synthesis and Optical Properties of Hybrid and Alloy Plasmonic Nanoparticles. Chem. Rev. 2011, 111, 3713–3735. [Google Scholar] [CrossRef]
- Johnston, R.L.; Ferrando, R. Nanoalloys: From theory to applications. Faraday Discuss. 2008, 138, 1–433. [Google Scholar]
- Alloyeau, D.; Mottet, C.; Ricolleau, C. Nanoalloys: Synthesis, Structure and Properties, Engineering Materials; Springer: London, UK, 2012. [Google Scholar]
- Johnston, R.L.; Wilcoxon, J.P. Metal Nanoparticles and Nanoalloys, Frontiers of Nanoscience; Elsevier: Oxford, UK, 2012. [Google Scholar]
- Mariscal, M.M.; Oviedo, O.; Lieva, E.P.M. Metal Clusters and Nanoalloys; Springer: New York, NY, USA, 2013. [Google Scholar]
- Calvo, F. Nanoalloys: From Fundamentals to Emergent Applications, 2nd ed.; Elsevier: Oxford, UK, 2020. [Google Scholar]
- Janssens, E. Nanoalloys: Recent developments and future perspectives. Faraday Discuss. 2022, 242, 1–550. [Google Scholar]
- Moreira, M.H.; Cottancin, E.; Pellarin, M.; Boisron, O.; Rodrigues, V.; Lermé, J.; Hillenkamp, M. Stable Surface-Plasmon Resonances in Small Alumina-Embedded Silver Clusters. J. Phys. Chem. C 2023, 127, 17828–17835. [Google Scholar] [CrossRef]
- Camus, E.; Pellarin, M.; Blanchard, N.; Boisron, O.; Hillenkamp, M.; Roiban, L.; Andreazza, P.; Cottancin, E. Structural and optical characterization of nanoalloys mixing gold or silver with aluminium or indium: Evolution under various reactive environments. Faraday Discuss. 2023, 242, 478–498. [Google Scholar] [CrossRef]
- Johnson, P.B.; Christy, R.W. Optical Constants of the Noble Metals. Phys. Rev. B 1972, 6, 4370–4379. [Google Scholar] [CrossRef]
- Fedrigo, S.; Harbich, W.; Buttet, J. Collective dipole oscillations in small silver clusters embedded in rare-gas matrices. Phys. Rev. B 1993, 47, 10706–10715. [Google Scholar] [CrossRef]
- Yu, C.; Schira, R.; Brune, H.; von Issendorff, B.; Rabilloud, F.; Harbich, W. Optical properties of size selected neutral Ag clusters: Electronic shell structures and the surface plasmon resonance. Nanoscale 2018, 10, 20821–20827. [Google Scholar] [CrossRef]
- Li, Z.Y.; Wilcoxon, J.P.; Yin, F.; Chen, Y.; Palmer, R.E.; Johnston, R.L. Structures and optical properties of 4-5 nm bimetallic AgAu nanoparticles. Faraday Discuss. 2008, 138, 363–373. [Google Scholar] [CrossRef] [PubMed]
- Gilb, S.; Hartl, K.; Kartouzian, A.; Peter, J.; Heiz, U.; Boyen, H.-G.; Ziemann, P. Cavity ring-down spectroscopy of metallic gold nanoparticles. Eur. Phys. J. D 2007, 45, 501–506. [Google Scholar] [CrossRef]
- Malola, S.; Lehtovaara, L.; Enkovaara, J.; Häkkinen, H. Birth of the Localized Surface Plasmon Resonance in Monolayer-Protected Gold Nanoclusters. ACS Nano 2013, 7, 10263–10270. [Google Scholar] [CrossRef] [PubMed]
- Qian, H.; Zhu, Y.; Jin, R. Atomically precise gold nanocrystal molecules with surface plasmon resonance. Proc. Natl. Acad. Sci. USA 2012, 109, 696–700. [Google Scholar] [CrossRef]
- Link, S.; Wang, Z.L.; El-Sayed, M.A. Alloy Formation of Gold-Silver Nanoparticles and the Dependence of the Plasmon Absorption on Their Composition. J. Phys. Chem. B 1999, 103, 3529–3533. [Google Scholar] [CrossRef]
- Barcaro, G.; Broyer, M.; Durante, N.; Fortunelli, A.; Stener, M. Alloying Effects on the Optical Properties of Ag-Au Nanoclusters from TDDFT Calculations. J. Phys. Chem. C 2011, 115, 24085–24091. [Google Scholar] [CrossRef]
- López-Lozano, X.; Mottet, C.; Weissker, H.C. Effect of Alloying on the Optical Properties of Ag/Au Nanoparticles. J. Phys. Chem. C 2013, 117, 3062–3068. [Google Scholar] [CrossRef]
- Chinnabathini, V.C.; Dingenen, F.; Borah, R.; Abbas, I.; van der Tol, J.; Zarkua, Z.; D’Acapito, F.; Nguyen, T.H.T.; Lievens, P.; Grandjean, D.; et al. Gas phase deposition of well-defined bimetallic gold-silver clusters for photocatalytic applications. Nanoscale 2023, 15, 6696–6708. [Google Scholar] [CrossRef]
- Weerawardene, K.D.M.; Häkkinen, H.; Aikens, C.M. Connections Between Theory and Experiment for Gold and Silver Nanoclusters. Annu. Rev. Phys. Chem. 2018, 69, 205–229. [Google Scholar] [CrossRef]
- Theivendran, S.; Chang, L.; Mukherjee, A.; Sementa, L.; Stener, M.; Fortunelli, A.; Dass, A. Principles of Optical Spectroscopy of Aromatic Alloy Nanomolecules: Au36−xAgx(SPh-tBu)24. J. Phys. Chem. C 2018, 122, 4524–4531. [Google Scholar] [CrossRef]
- Yang, H.; Wang, Y.; Huang, H.; Gell, L.; Lehtovaara, L.; Malola, S.; Häkkinen, H.; Zheng, N. All-thiol-stabilized Ag44 and Au12Ag32 nanoparticles with single-crystal structures. Nat. Commun. 2013, 4, 2422. [Google Scholar] [CrossRef]
- Gaudry, M.; Lermé, J.; Cottancin, E.; Pellarin, M.; Vialle, J.L.; Broyer, M.; Prével, B.; Treilleux, M.; Mélinon, P. Optical properties of (AuxAg1−x)n clusters embedded in alumina: Evolution with size and stoichiometry. Phys. Rev. B 2001, 64, 085407. [Google Scholar] [CrossRef]
- Mallin, M.P.; Murphy, C.J. Solution-Phase Synthesis of Sub-10 nm Au-Ag Alloy Nanoparticles. Nano Lett. 2002, 2, 1235–1237. [Google Scholar] [CrossRef]
- Shi, H.; Zhang, L.; Cai, W. Composition modulation of optical absorption in AgxAu1−x alloy nanocrystals in situ formed within pores of mesoporous silica. J. Appl. Phys. 2000, 87, 1572–1574. [Google Scholar] [CrossRef]
- Avakyan, L.; Durimanov, V.; Nemesh, D.; Srabionyan, V.; Ihlemann, J.; Bugaev, L. Theoretical approach for calculation of dielectric functions of plasmonic nanoparticles of noble metals, magnesium and their alloys. Opt. Mater. 2020, 109, 110264. [Google Scholar] [CrossRef]
- Ferrando, R.; Jellinek, J.; Johnston, R.L. Nanoalloys: From Theory to Applications of Alloys Clusters and Nanoparticles. Chem. Rev. 2008, 108, 845–910. [Google Scholar] [CrossRef]
- Mulvaney, P.; Giersig, M.; Henglein, A. Electrochemistry of multilayer colloids: Preparation and absorption spectrum of gold-coated silver particles. J. Phys. Chem. 1993, 97, 7061–7064. [Google Scholar] [CrossRef]
- Barron, H.; Fernández-Seivane, L.; Weissker, H.C.; López-Lozano, X. Trends and Properties of 13-Atom Ag-Au Nanoalloys I: Structure and Electronic Properties. J. Phys. Chem. C 2013, 117, 21450–21459. [Google Scholar] [CrossRef]
- Liebsch, A. Surface-plasmon dispersion and size dependence of Mie resonance: Silver versus simple metals. Phys. Rev. B 1993, 48, 11317–11328. [Google Scholar] [CrossRef]
- Liebsch, A. Surface plasmon dispersion of Ag. Phys. Rev. Lett. 1993, 71, 145–148. [Google Scholar] [CrossRef]
- Sinha-Roy, R.; García-González, P.; López-Lozano, X.; Weissker, H.C. Visualizing screening in noble-metal clusters: Static vs. dynamic. Phys. Chem. Chem. Phys. 2023, 25, 2075–2083. [Google Scholar] [CrossRef]
- Calvo, F.; Fortunelli, A.; Negreiros, F.; Wales, D.J. Kinetics of chemical ordering in Ag-Au and Ag-Ni nanoalloys. J. Chem. Phys. 2013, 139, 111102. [Google Scholar] [CrossRef]
- Wales, D.J. Discrete path sampling. Mol. Phys. 2002, 100, 3285–3306. [Google Scholar] [CrossRef]
- Wales, D.J. Energy landscapes: Calculating pathways and rates. Int. Rev. Phys. Chem. 2006, 25, 237–282. [Google Scholar] [CrossRef]
- Rossi, G.; Ferrando, R.; Rapallo, A.; Fortunelli, A.; Curley, B.C.; Lloyd, L.D.; Johnston, R.L. Global optimization of bimetallic cluster structures. II. Size-matched Ag-Pd, Ag-Au, and Pd-Pt systems. J. Chem. Phys. 2005, 122, 194309. [Google Scholar] [CrossRef]
- Baek, H.; Moon, J.; Kim, J. Benchmark Study of Density Functional Theory for Neutral Gold Clusters, Aun (n = 2–8). J. Phys. Chem. A 2017, 121, 2410–2419. [Google Scholar] [CrossRef]
- Ferrari, P.; Hansen, K. Computing gold cluster energies with density functional theory: The importance of correlation. Phys. Chem. Chem. Phys. 2021, 23, 14830–14835. [Google Scholar] [CrossRef]
- Seveur, P.; Boubekeur-Lecaque, L.; Maurel, F.; Brémond, E. Modeling the Photo-Absorption Properties of Noble Metal Nanoclusters: A Challenge for Density-Functional Theory. J. Phys. Chem. C 2023, 127, 7718–7729. [Google Scholar] [CrossRef]
- Perdew, J.P.; Burke, K.; Ernzerhof, M. Generalized gradient approximation made simple. Phys. Rev. Lett. 1996, 77, 3865. [Google Scholar] [CrossRef]
- Troullier, N.; Martins, J.L. Efficient pseudopotentials for plane-wave calculations. Phys. Rev. B 1991, 43, 1993. [Google Scholar] [CrossRef]
- Yabana, K.; Bertsch, G. Time-dependent local-density approximation in real time. Phys. Rev. B 1996, 54, 4484. [Google Scholar] [CrossRef] [PubMed]
- Tancogne-Dejean, N.; Oliveira, M.J.; Andrade, X.; Appel, H.; Borca, C.H.; Le Breton, G.; Buchholz, F.; Castro, A.; Corni, S.; Correa, A.A.; et al. Octopus, a computational framework for exploring light-driven phenomena and quantum dynamics in extended and finite systems. J. Chem. Phys. 2020, 152, 124119. [Google Scholar] [CrossRef] [PubMed]
- Walter, M.; Akola, J.; Lopez-Acevedo, O.; Jadzinsky, P.D.; Calero, G.; Ackerson, C.J.; Whetten, R.L.; Grönbeck, H.; Häkkinen, H. A unified view of ligand-protected gold clusters as superatom complexes. Proc. Natl. Acad. Sci. USA 2008, 105, 9157–9162. [Google Scholar] [CrossRef] [PubMed]
- Spanjaard, D.; Guillot, C.; Desjonquères, M.C.; Tréglia, G.; Lecante, J. Surface core level spectroscopy of transition metals: A new tool for the determination of their surface structure. Surf. Sci. Rep. 1985, 5, 1–85. [Google Scholar] [CrossRef]
- Sawaya, S.; Goniakowski, J.; Mottet, C.; Saúl, A.; Tréglia, G. Charge redistribution at Pd surfaces: Ab initio grounds for tight-binding interatomic potentials. Phys. Rev. B 1997, 56, 12161–12166. [Google Scholar] [CrossRef]
- Gromoff, Q.; Benzo, P.; Saidi, W.A.; Andolina, C.M.; Casanove, M.J.; Hungria, T.; Barre, S.; Benoit, M.; Lam, J. Exploring the formation of gold/silver nanoalloys with gas-phase synthesis and machine-learning assisted simulations. Nanoscale 2024, 16, 384–393. [Google Scholar] [CrossRef]
- Andolina, C.M.; Bon, M.; Passerone, D.; Saidi, W.A. Robust, Multi-Length-Scale, Machine Learning Potential for Ag–Au Bimetallic Alloys from Clusters to Bulk Materials. J. Phys. Chem. C 2021, 125, 17438–17447. [Google Scholar] [CrossRef]
- Kozioł, R.; Łapiński, M.; Syty, P.; Sadowski, W.; Sienkiewicz, J.E.; Nurek, B.; Adrian Maraloiu, V.; Kościelska, B. Experimental tuning of AuAg nanoalloy plasmon resonances assisted by machine learning method. Appl. Surf. Sci. 2021, 567, 150802. [Google Scholar] [CrossRef]
Figure 1.
Rearrangement pathway connecting the two lowest-energy core-shell Ag-Au nanoalloys with either metal at the core, as obtained from a discrete path-sampling simulation employing a semiempirical many-body potential. Among the 233 stationary points it contains, only a subset of states, roughly equidistant along this pathway, was selected for further investigation of their electronic and optical properties.

Figure 2.
Calculated optical spectra of relevant configurations along the path connecting the and the nanoalloys: the two endpoints and one configuration midway between them (c.f. Figure 1).
Figure 2.
Calculated optical spectra of relevant configurations along the path connecting the and the nanoalloys: the two endpoints and one configuration midway between them (c.f. Figure 1).

Figure 3.
Total densities of states of the pure icosahedral clusters and , with broadenings of 0.100 eV (thick solid lines) and 0.025 eV (thin solid lines, to obtain a better view of fine details). The picture is complicated by the fact that the number of surface atoms and of interior atoms are very different (42 vs. 13) for the 55-atom clusters, which partially hides the relevant differences in panel (a). Therefore, in panel (b), we show the same densities of states, each divided by the respective numbers of atoms. This shows more clearly the respective nature of the bands: the d band in the local DOS of the interior part is broader than that of the surface atoms. In addition, the upper edges of the d-band contributions coincide. For comparison, in panel (c), we show the result for the larger 309-atom Ag and Au clusters, which have comparable numbers of surface (162) and interior (147) atoms. In this case, the higher number of states (electrons) produces naturally a smoother, clearer picture. It is interesting to see that, nonetheless, the general behavior of the two contributions remains unchanged between the small 55-atom clusters and the 309-atom nanoparticle.

Figure 4.
Projected densities of states of the three configurations depicted in Figure 1. (a) , (b) intermediate, and (c) . In each case, the SAC projection (upper panels) along with the d contributions of the atomistic PDOS (lower panels) are shown. The latter are resolved into groups corresponding to the interior and surface atoms of each element.

Figure 5.
Projected density of states (d contributions) of the (upper panel) and (lower panel) configurations. While the increase in the contributions of the surface gold atoms appears clearly, the overall change is more easily discerned in the middle panel, which shows that the subtle difference between the two PDOSs is almost always positive.

Disclaimer/Publisher’s Note: The statements, opinions and data contained in all publications are solely those of the individual author(s) and contributor(s) and not of MDPI and/or the editor(s). MDPI and/or the editor(s) disclaim responsibility for any injury to people or property resulting from any ideas, methods, instructions or products referred to in the content. |
© 2024 by the authors. Licensee MDPI, Basel, Switzerland. This article is an open access article distributed under the terms and conditions of the Creative Commons Attribution (CC BY) license (https://creativecommons.org/licenses/by/4.0/).
Share and Cite
MDPI and ACS Style
Weissker, H.-C.; Calvo, F. Optical Properties of AgAu Alloy Clusters: Effect of Chemical Configuration along a Rearrangement Pathway. Alloys 2024, 3, 31-42. https://0-doi-org.brum.beds.ac.uk/10.3390/alloys3010003
AMA Style
Weissker H-C, Calvo F. Optical Properties of AgAu Alloy Clusters: Effect of Chemical Configuration along a Rearrangement Pathway. Alloys. 2024; 3(1):31-42. https://0-doi-org.brum.beds.ac.uk/10.3390/alloys3010003
Chicago/Turabian StyleWeissker, Hans-Christian, and Florent Calvo. 2024. "Optical Properties of AgAu Alloy Clusters: Effect of Chemical Configuration along a Rearrangement Pathway" Alloys 3, no. 1: 31-42. https://0-doi-org.brum.beds.ac.uk/10.3390/alloys3010003