
Differential Rotational Movement of the Thoracolumbosacral Spine in High-Level Dressage Horses Ridden in a Straight Line, in Sitting Trot and Seated Canter Compared to In-Hand Trot


Abstract
:Simple Summary
Abstract
1. Introduction
2. Materials and Methods
2.1. Horses
2.2. Riders
2.3. Saddles, Girths and Bridles
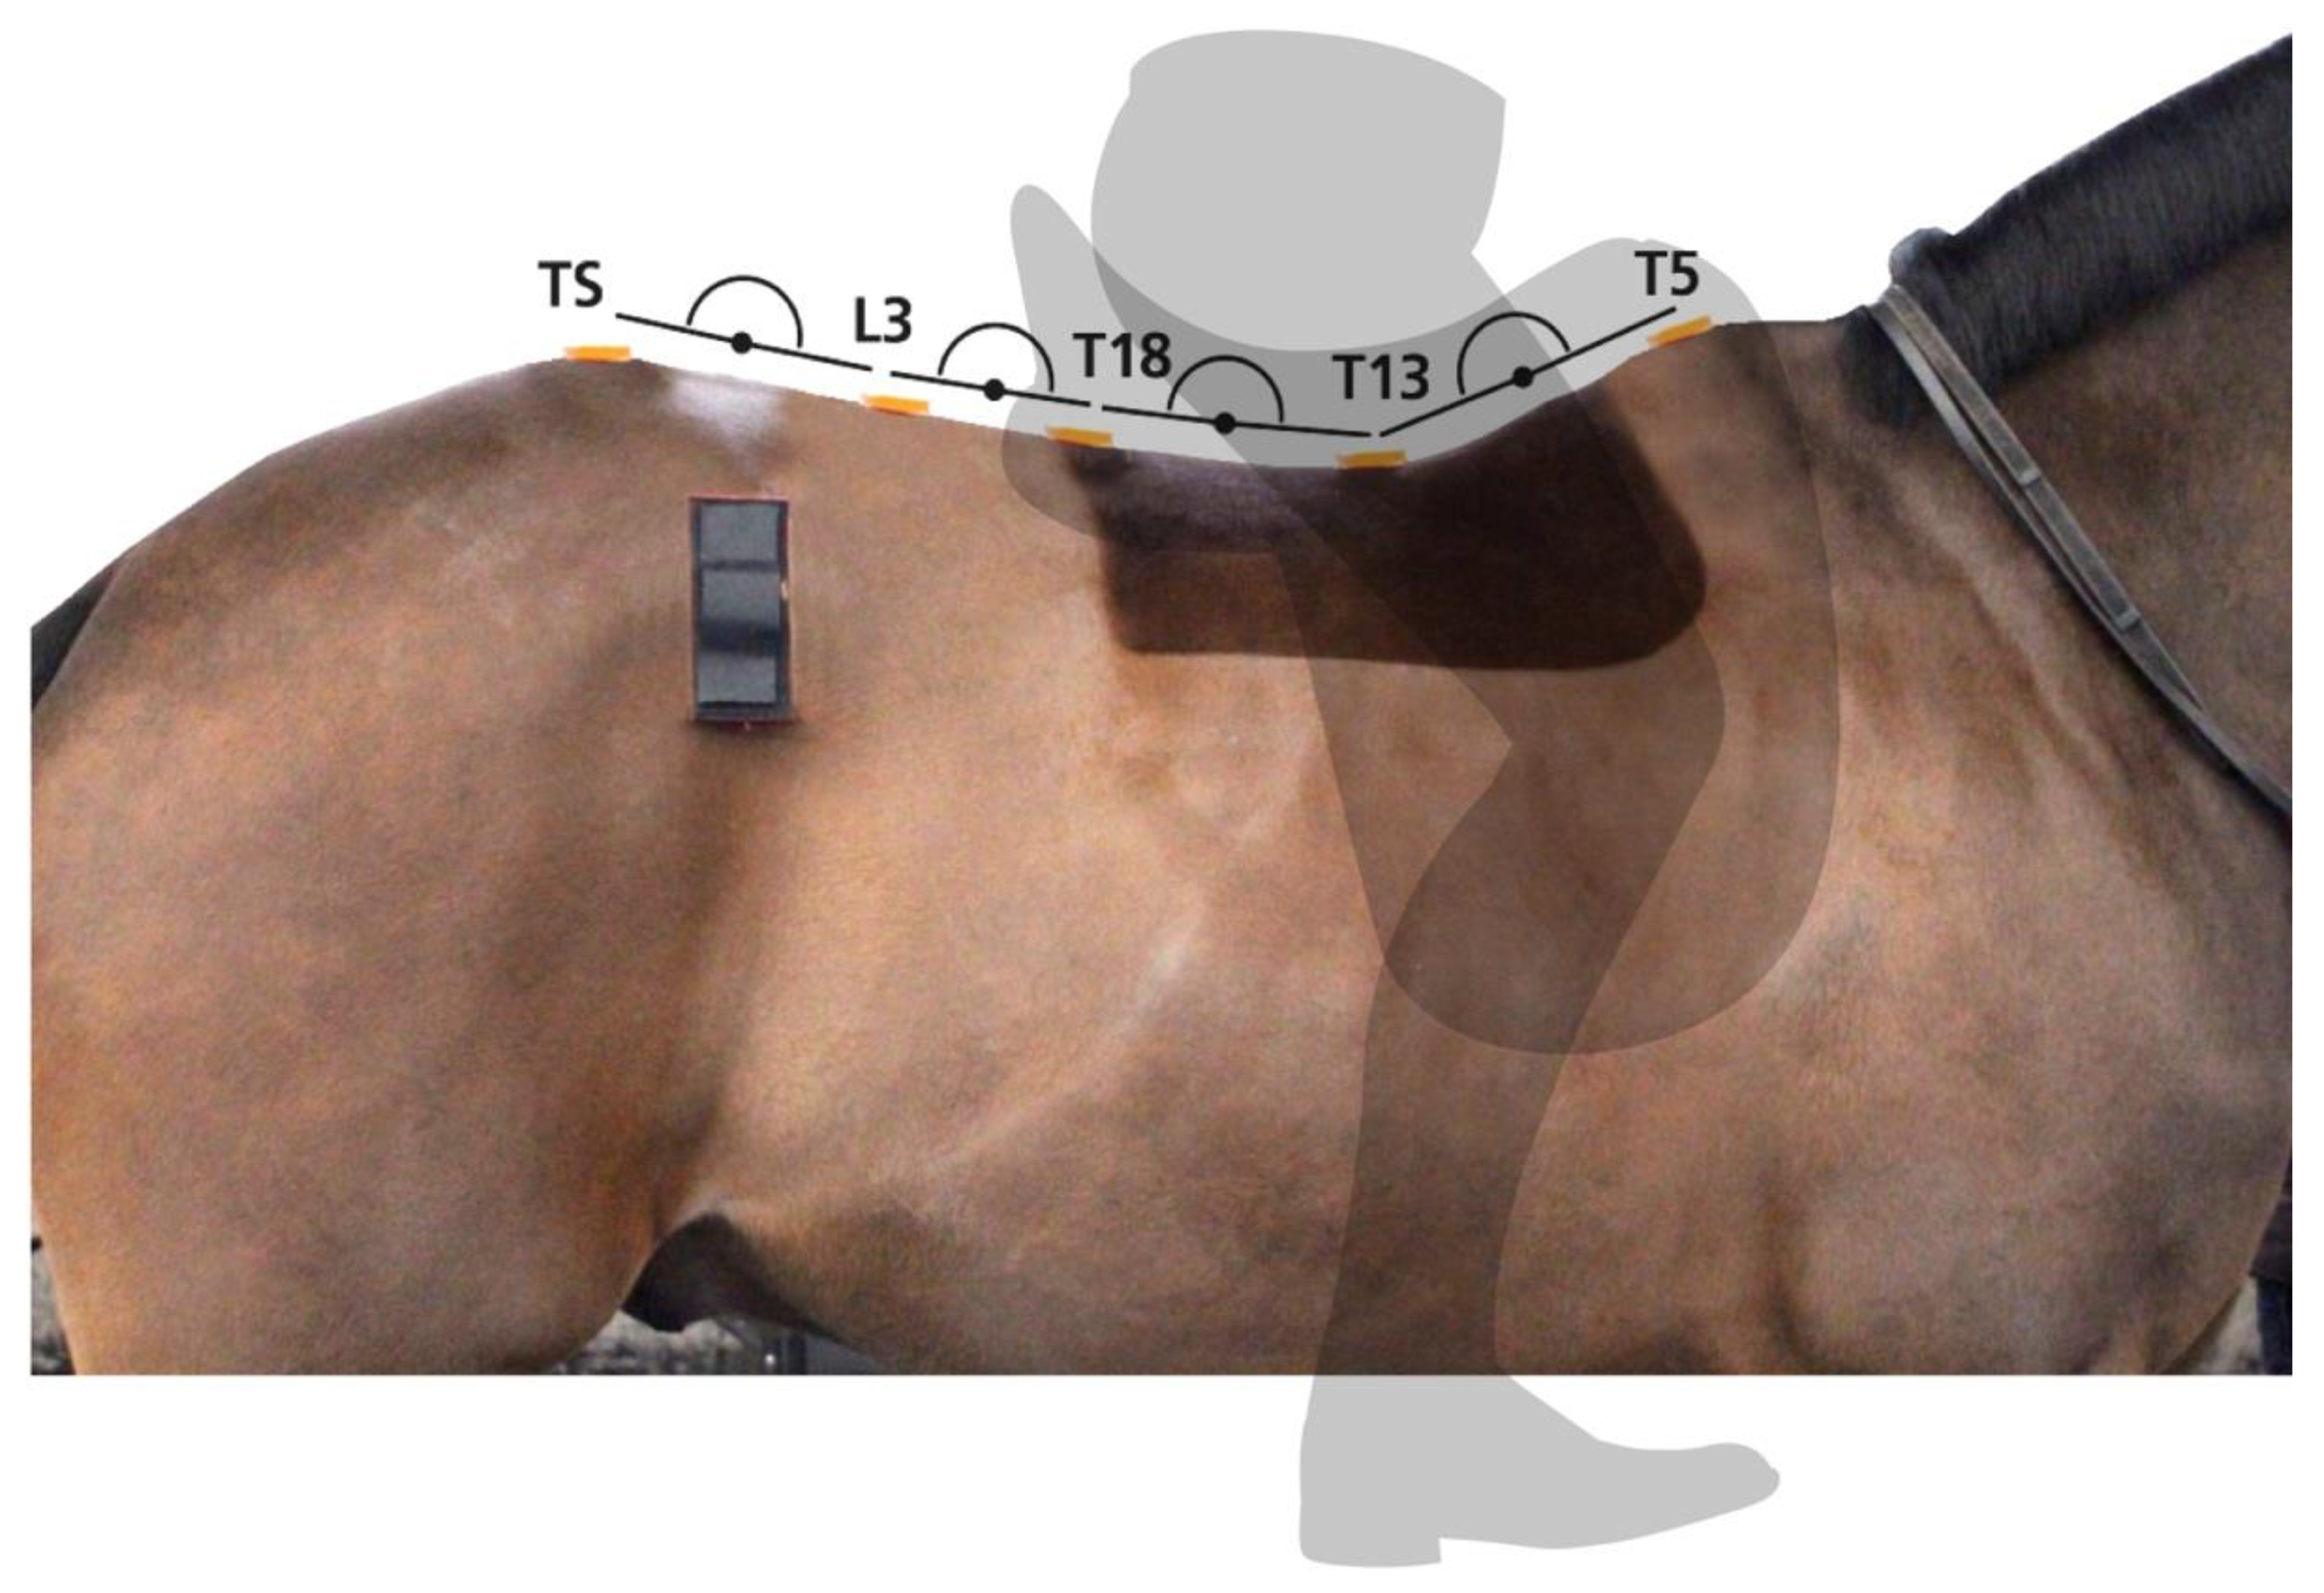
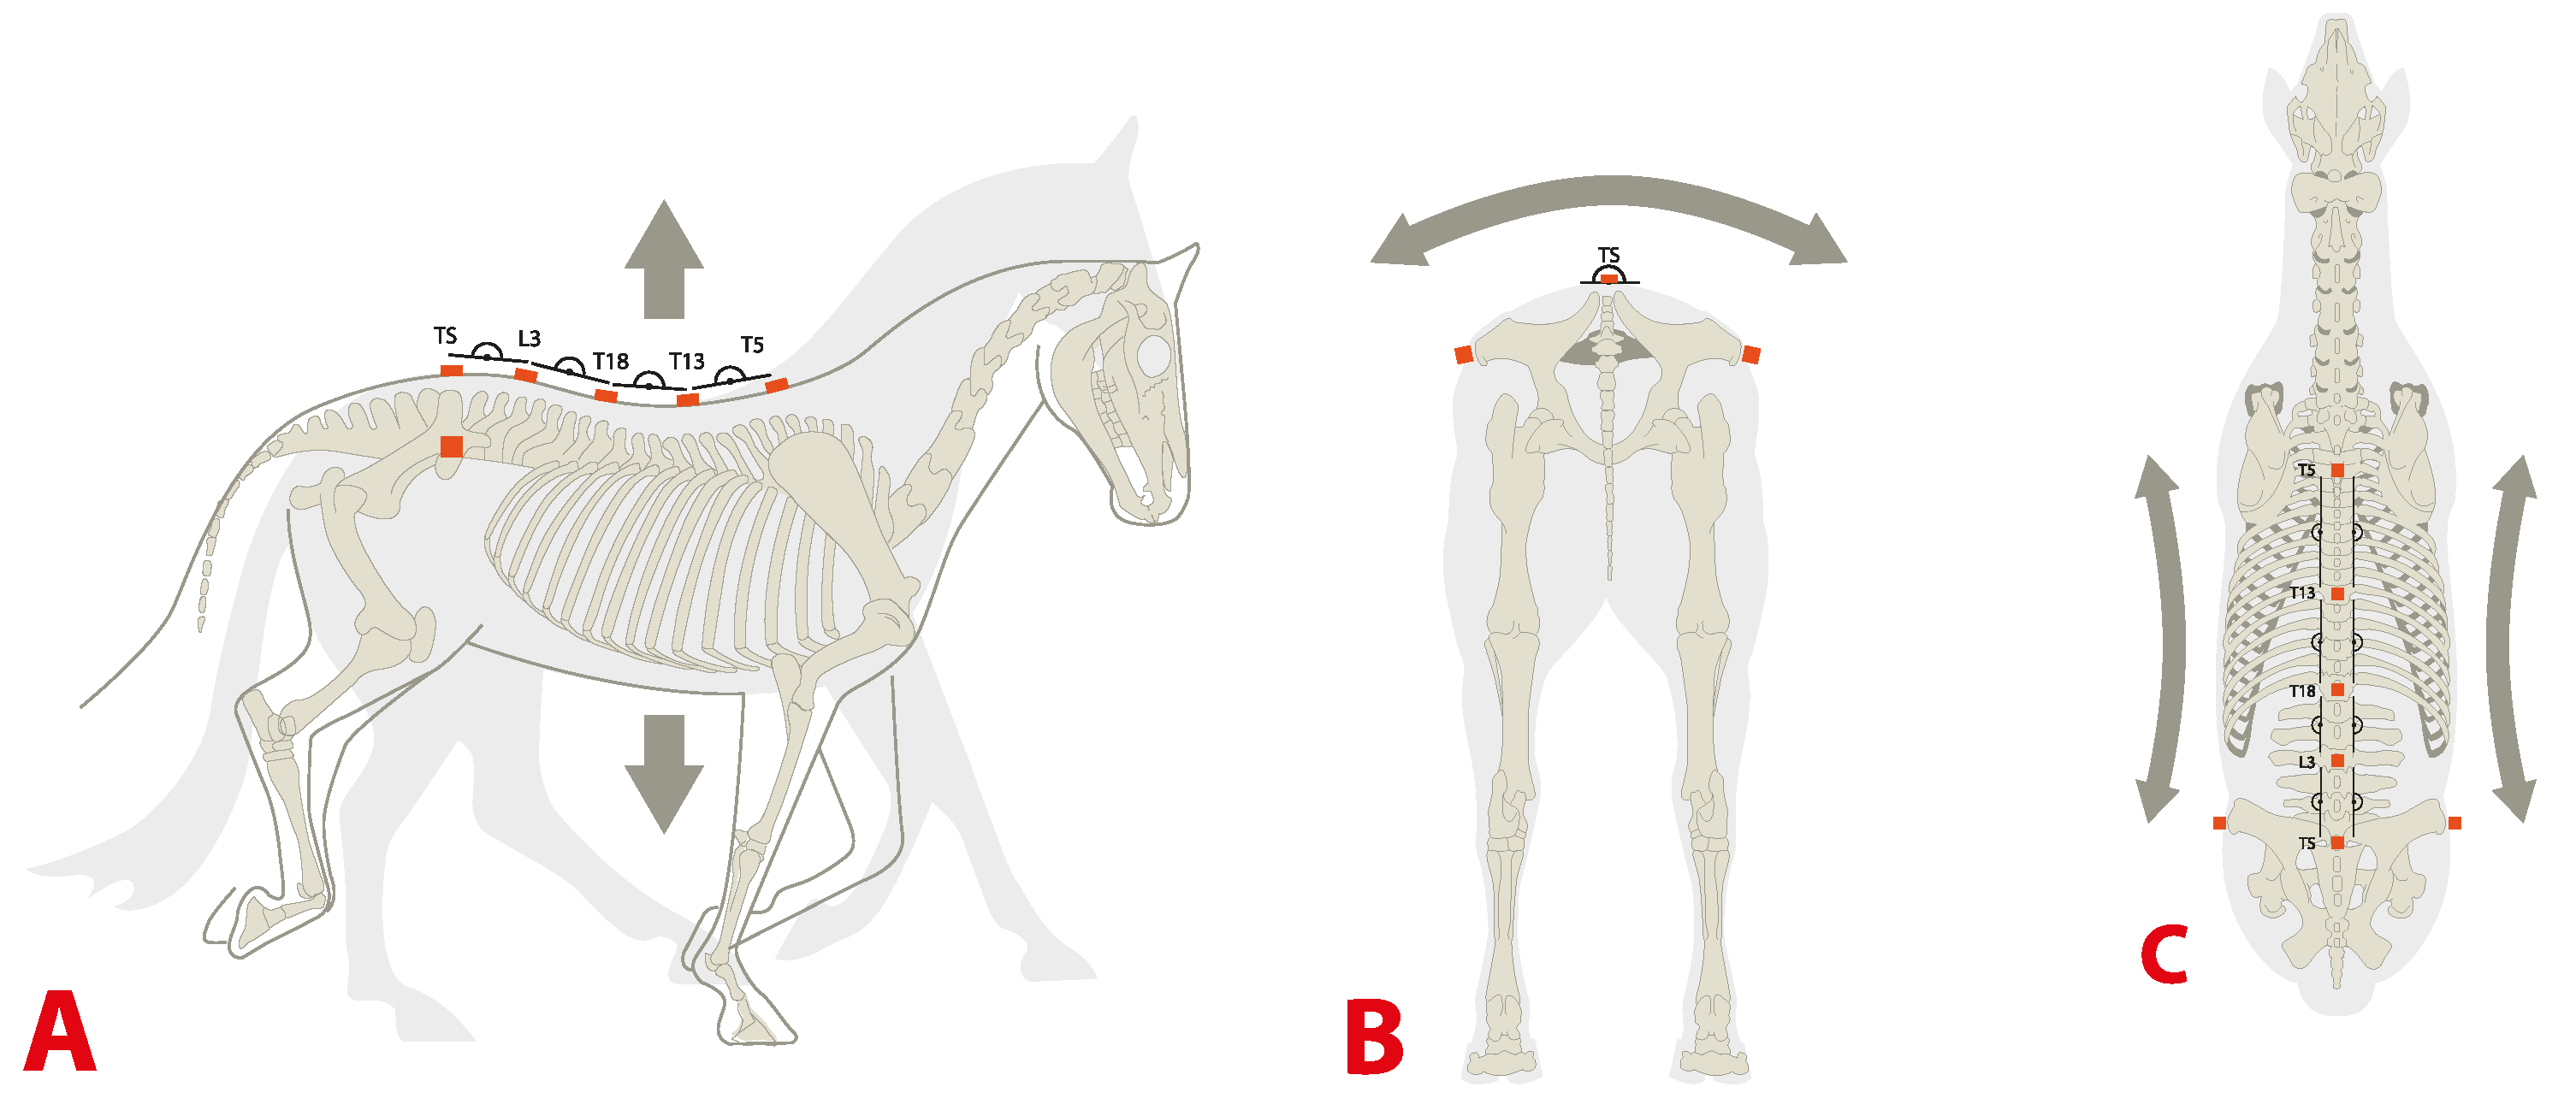
2.4. Kinematics—Inertial Measurement Units
2.5. Study Protocol
2.5.1. In-Hand Trot Data Collection
2.5.2. Ridden Data Collection
2.6. Statistical Analysis
3. Results
3.1. Horse Inclusion
3.2. Differential Rotational Movement of the Thoracolumbosacral Spine
3.2.1. T5–T13
3.2.2. T13–T18
3.2.3. T18–L3
3.2.4. L3–TS
4. Discussion
5. Conclusions
Author Contributions
Funding
Institutional Review Board Statement
Data Availability Statement
Acknowledgments
Conflicts of Interest
References
- Denoix, J.-M.; Dyson, S.J. Thoracolumbar Spine. In Diagnosis and Management of Lameness in the Horse; Elsevier: Amsterdam, The Netherlands, 2011; pp. 592–605. [Google Scholar]
- Jeffcott, L.B. Back Problems in the Horse-A look at past, present and future progress. Equine Vet. J. 1979, 11, 129–136. [Google Scholar] [CrossRef]
- Johnston, C.; Holm, K.R.; Erichsen, C.; Eksell, P.; Drevemo, S. Kinematic evaluation of the back in fully functioning riding horses. Equine Vet. J. 2004, 36, 495–498. [Google Scholar] [CrossRef]
- Landman, M.A.A.M.; De Blaauw, J.A.; Hofland, L.J.; Van Weeren, P.R. Field study of the prevalence of lameness in horses with back problems. Vet. Rec. 2004, 155, 165–168. [Google Scholar] [CrossRef]
- Audigié, F.; Pourcelot, P.; Degueurce, C.; Denoix, J.M.; Geiger, D. Kinematics of the equine back: Flexion-extension movements in sound trotting horses. Equine Vet. J. 1999, 31, 210–213. [Google Scholar] [CrossRef] [PubMed]
- Faber, M.; Johnston, C.; Schamhardt, H.; Van Weeren, R.; Roepstorff, L.; Barneveld, A. Basic three-dimensional kinematics of the vertebral column of horses trotting on a treadmill. Am. J. Vet. Res. 2001, 62, 757–764. [Google Scholar] [CrossRef] [PubMed]
- Faber, M.; Johnston, C.; Schamhardt, H.C.; Van Weeren, P.R.; Roepstorff, L.; Barneveld, A. Three-dimensional kinematics of the equine spine during canter. Equine Vet. J. 2001, 33, 145–149. [Google Scholar] [CrossRef]
- Faber, M.; Schamhardt, H.; Van Weeren, R.; Johnston, C.; Roepstorff, L.; Barneveld, A. Basic three-dimensional kinematics of the vertebral column of horses walking on a treadmill. Am. J. Vet. Res. 2000, 61, 399–406. [Google Scholar] [CrossRef] [Green Version]
- Denoix, J.-M.D. Spinal Biomechanics and Functional Anatomy. Vet. Clin. N. Am. Equine Pr. 1999, 15, 27–60. [Google Scholar] [CrossRef]
- Jeffcott, L.B. Disorders of the thoracolumbar spine of the horse—A survey of 443 cases. Equine Vet. J. 1980, 12, 197–210. [Google Scholar] [CrossRef]
- Townsend, H. LDaFP. Kinematics of the equine thoracolumbar spine. Equine Vet. J. 1983, 15, 117–222. [Google Scholar] [CrossRef]
- Townsend, H.G.G.; Leach, D.H. Relationship between intervertebral joint morphology and mobility in the equine thoracolumbar spine. Equine Vet. J. 1984, 16, 461. [Google Scholar] [CrossRef]
- Faber, M.; Johnston, C.; Van Weeren, P.R.; Barneveld, A. Repeatability of back kinematics in horses during treadmill locomotion. Equien Vet. J. 2002, 34, 235–241. [Google Scholar] [CrossRef] [PubMed]
- Van Weeren, P.R.; Bogert, A.J.V.D. Quantification of skin displacement in the proximal parts of the limbs of the walking horse. Equine Vet. J. 1990, 9, 110–118. [Google Scholar] [CrossRef]
- Van Weeren, P.R.; Bogert, A.J.V.D.; Barneveld, A. A quantitative analysis of skin displacement in the trotting horse. Equine Vet. J. 2010, 22, 101–109. [Google Scholar] [CrossRef] [PubMed]
- Schamhardt, M.F.H.; Van Weeren, P.R.; Barneveld, A. Methodology and validity of assessing kinematics of the thora-columbar vertebral column in horses on the basis of skin-fixated markers. Am. J. Vet. Res. 2001, 62, 301–306. [Google Scholar]
- Licka, T.; Kapaun, M.; Peham, C. Influence of rider on lameness in trotting horses. Equine Vet. J. 2010, 36, 734–736. [Google Scholar] [CrossRef]
- Peham, C.; Licka, T.; Schobesberger, H.; Meschan, E. Influence of the rider on the variability of the equine gait. Hum. Mov. Sci. 2004, 23, 663–671. [Google Scholar] [CrossRef]
- Heim, C.; Pfau, T.; Gerber, V.; Schweizer, C.; Doherr, M.; Schüpbach-Regula, G.; Witte, S. Determination of vertebral range of motion using inertial measurement units in 27 Franches-Montagnes stallions and comparison between conditions and with a mixed population. Equine Vet. J. 2015, 48, 509–516. [Google Scholar] [CrossRef] [Green Version]
- Persson-Sjodin, E.; Hernlund, E.; Pfau, T.; Andersen, P.H.; Rhodin, M. Influence of seating styles on head and pelvic vertical movement symmetry in horses ridden at trot. PLoS ONE 2018, 13, e0195341. [Google Scholar] [CrossRef] [Green Version]
- De Cocq, P.; Van Weeren, P.R. Effects of girth, saddle and weight on movements of the horse. Equine Vet. J. 2004, 36, 758–763. [Google Scholar] [CrossRef] [PubMed]
- De Cocq, P.; Prinsen, H.; Springer, N.C.N.; Van Weeren, P.R.; Schreuder, M.; Muller, M.; Van Leeuwen, J.L. The effect of rising and sitting trot on back movements and head-neck position of the horse. Equine Vet. J. 2009, 41, 423–427. [Google Scholar] [CrossRef] [PubMed]
- Byström, A.; Roepstorff, L.; Rhodin, M.; Bragança, F.S.; Engell, M.T.; Hernlund, E.; Persson-Sjödin, E.; Van Weeren, R.; Weishaupt, M.A.; Egenvall, A. Lateral movement of the saddle relative to the equine spine in rising and sitting trot on a treadmill. PLoS ONE 2018, 13, e0200534. [Google Scholar] [CrossRef]
- Mackechnie-Guire, R.; Mackechnie-Guire, E.; Fairfax, V.; Fisher, D.; Fisher, M.; Pfau, T. The Effect of Tree Width on Thoracolumbar and Limb Kinematics, Saddle Pressure Distribution, and Thoracolumbar Dimensions in Sports Horses in Trot and Canter. Animals 2019, 9, 842. [Google Scholar] [CrossRef] [PubMed] [Green Version]
- Martin, P.; Cheze, L.; Pourcelot, P.; Desquilbet, L.; Duray, L.; Chateau, H. Effect of the rider position during rising trot on the horse’s biomechanics (back and trunk kinematics and pressure under the saddle). J. Biomech. 2016, 49, 1027–1033. [Google Scholar] [CrossRef] [PubMed]
- Martin, P.; Cheze, L.; Pourcelot, P.; Desquilbet, L.; Duray, L.; Chateau, H. Effects of the rider on the kinematics of the equine spine under the saddle during the trot using inertial measurement units: Methodological study and preliminary results. Vet. J. 2017, 221, 6–10. [Google Scholar] [CrossRef] [PubMed]
- Pfau, T.; Witte, T.H.; Wilson, A.M. A method for deriving displacement data during cyclical movement using an inertial sensor. J. Exp. Biol. 2005, 208, 2503–2514. [Google Scholar] [CrossRef] [Green Version]
- Murray, R.; Guire, R.; Fisher, M.; Fairfax, V. Reducing Peak Pressures under the Saddle Panel at the Level of the 10–13th Thoracic Vertebrae may be Associated with Improved Gait Features, even when Saddles are Fitted to Published Guidelines. J. Equine Vet. Sci. 2017, 54, 60–69. [Google Scholar] [CrossRef]
- Murray, R.; Guire, R.; Fisher, M.; Fairfax, V. Girth pressure measurements reveal high peak pressures that can be avoided using an alternative girth design that also results in increased limb protraction and flexion in the swing phase. Vet. J. 2013, 198, 92–97. [Google Scholar] [CrossRef]
- Warner, S.M.; Koch, T.O.; Pfau, T. Inertial sensors for assessment of back movement in horses during locomotion over ground. Equine Vet. J. 2010, 42, 417–424. [Google Scholar] [CrossRef]
- Pfau, T.; Reilly, P. How low can we go? Influence of sample rate on equine pelvic displacement calculated from inertial sensor data. Equine Vet. J. 2020. [Google Scholar] [CrossRef] [PubMed]
- Starke, S.D.; Witte, T.H.; May, S.A.; Pfau, T. Accuracy and precision of hindlimb foot contact timings of horses determined using a pelvis-mounted inertial measurement unit. J. Biomech. 2012, 45, 1522–1528. [Google Scholar] [CrossRef] [PubMed]
- Martin, P.; Chateau, H.; Pourcelot, P.; Duray, L.; Cheze, L. Comparison between Inertial Sensors and Motion Capture System to Quantify Flexion-Extension Motion in the Back of a Horse. Equine Vet. J. 2014, 46, 43. [Google Scholar] [CrossRef] [Green Version]
- Pfau, T.; Jennings, C.; Mitchell, H.; Olsen, E.; Walker, A.; Egenvall, A.; Tröster, S.; Weller, R.; Rhodin, M. Lungeing on hard and soft surfaces: Movement symmetry of trotting horses considered sound by their owners. Equine Vet. J. 2016, 48, 83–89. [Google Scholar] [CrossRef] [Green Version]
- Pfau, T.; Robilliard, J.J.; Weller, R.; Jespers, K.; Eliashar, E.; Wilson, A.M. Assessment of mild hindlimb lameness during over ground locomotion using linear discriminant analysis of inertial sensor data. Equine Vet. J. 2007, 39, 407–413. [Google Scholar] [CrossRef]
- Pfau, T.; Spicer-Jenkins, C.; Smith, R.K.; Bolt, D.M.; Fiske-Jackson, A.; Witte, T.H. Identifying optimal parameters for quantification of changes in pelvic movement symmetry as a response to diagnostic analgesia in the hindlimbs of horses. Equine Vet. J. 2014, 46, 759–763. [Google Scholar] [CrossRef]
- Greve, L.; Dyson, S.; Pfau, T. Alterations in thoracolumbosacral movement when pain causing lameness has been improved by diagnostic analgesia. Vet. J. 2017, 224, 55–63. [Google Scholar] [CrossRef] [PubMed] [Green Version]
- Pfau, T.; Fiske-Jackson, A.; Rhodin, M. Quantitative assessment of gait parameters in horses: Useful for aiding clinical decision making? Equine Vet. Educ. 2016, 28, 209–215. [Google Scholar] [CrossRef]
- Rhodin, M.; Roepstorff, L.; French, A.; Keegan, K.G.; Pfau, T.; Egenvall, A. Head and pelvic movement asymmetry during lungeing in horses with symmetrical movement on the straight. Equine Vet. J. 2016, 48, 315–320. [Google Scholar] [CrossRef]
- Mackechnie-Guire, R.; Mackechnie-Guire, E.; Bush, R.; Wyatt Fisher, D.; Fisher, M. A controlled, blinded study investigating the effect that a twenty minute Cycloidal vibration has on whole horse locomotion and thoracolumbar profiles. J. Equine Vet. Sci. 2018, 71, 84–89. [Google Scholar] [CrossRef]
- Greve, L.; Pfau, T.; Dyson, S. Thoracolumbar movement in sound horses trotting in straight lines in hand and on the lunge and the relationship with hindlimb symmetry or asymmetry. Vet. J. 2017, 220, 95–104. [Google Scholar] [CrossRef] [PubMed] [Green Version]
- Wennerstrand, J.; Johnston, C.; Roethlisberger-Holm, K.; Erichsen, C.; Eksell, P.; Drevemo, S. Kinematic evaluation of the back in the sport horse with back pain. Equine Vet. J. 2010, 36, 707–711. [Google Scholar] [CrossRef]
- Goff, L.; Van Weeren, P.R.; Jeffcott, L.; Condie, P.; McGowan, C. Quantification of equine sacral and iliac motion during gait: A comparison between motion capture with skin-mounted and bone-fixated sensors. Equine Vet. J. 2010, 42, 468–474. [Google Scholar] [CrossRef] [PubMed]
- Pfau, T.; Starke, S.D.; Tröster, S.; Roepstorff, L. Estimation of vertical tuber coxae movement in the horse from a single inertial measurement unit. Vet. J. 2013, 198, 498–503. [Google Scholar] [CrossRef]
- May, S.A.; Wyn-Jones, G. Identification of hindleg lameness. Equine Vet. J. 1987, 19, 185–188. [Google Scholar] [CrossRef] [PubMed]
- Baxter, G.M. Examination for Lameness. In Adams and Stashak’s Lameness in Horses; John Wiley & Sons: Hoboken, NJ, USA, 2020; pp. 67–188. [Google Scholar]
- Keegan, K.G.A.; Wilson, D.; Wilson, D.J.; Smith, B.; Gaughan, E.M.; Pleasant, R.S.; Lillich, J.D.; Kramer, J.; Howard, R.D.; Bacon-Miller, C.; et al. Evaluation of mild lameness in horses trotting on a treadmill by clinicians and interns or residents and correlation of their assessments with kinematic gait analysis. Am. J. Vet. Res. 1998, 59, 1370–1377. [Google Scholar]
- Keegan, K.G.; Yonezawa, Y.; Pai, P.F.; Wilson, D.A.; Kramer, J. Evaluation of a sensor-based system of motion analysis for detection and quantification of forelimb and hindlimb. Am. J. Vet. Res. 2004, 65, 665–670. [Google Scholar] [CrossRef] [PubMed]
- Pfau, T.; Boultbee, H.; Davis, H.; Walker, A.; Rhodin, M. Agreement between two inertial sensor gait analysis systems for lameness examinations in horses. Equine Vet. Educ. 2016, 28, 203–208. [Google Scholar] [CrossRef] [Green Version]
- Pfau, T.; Weller, R. Comparison of a standalone consumer grade smartphone to a specialist inertial measurement unit for quantification of movement symmetry in the trotting horse. Equine Vet. J. 2015, 49, 124–129. [Google Scholar] [CrossRef]
- Rhodin, M.; Persson-Sjodin, E.; Egenvall, A.; Bragança, F.M.S.; Pfau, T.; Roepstorff, L.; Weishaupt, M.A.; Thomsen, M.H.; Van Weeren, P.R.; Hernlund, E. Vertical movement symmetry of the withers in horses with induced forelimb and hindlimb lameness at trot. Equine Vet. J. 2018, 50, 818–824. [Google Scholar] [CrossRef]
- Rhodin, M.; Pfau, T.; Roepstorff, L.; Egenvall, A. Effect of lungeing on head and pelvic movement asymmetry in horses with induced lameness. Vet. J. 2013, 198, e39–e45. [Google Scholar] [CrossRef] [Green Version]
- Maliye, S.; Voute, L.; Lund, D.; Marshall, J.F. An inertial sensor-based system can objectively assess diagnostic anaesthesia of the equine foot. Equine Vet. J. 2013, 45, 26–30. [Google Scholar] [CrossRef] [PubMed]
- Marshall, J.F.; Lund, D.G.; Voute, L.C. Use of a wireless, inertial sensor-based system to objectively evaluate flexion tests in the horse. Equine Vet. J. 2012, 44, 8–11. [Google Scholar] [CrossRef]
- Starke, S.D.; Willems, E.; Head, M.; May, S.; Pfau, T. Proximal hindlimb flexion in the horse: Effect on movement symmetry and implications for defining soundness. Equine Vet. J. 2012, 44, 657–663. [Google Scholar] [CrossRef]
- Rhodin, M.; Egenvall, A.; Andersen, P.H.; Pfau, T. Head and pelvic movement asymmetries at trot in riding horses in training and perceived as free from lameness by the owner. PLoS ONE 2017, 12, e0176253. [Google Scholar] [CrossRef]
- Álvarez, C.B.G.; Meulenbelt, R.; Johnston, C.; Van Weeren, P.R.; Roethlisberger-Holm, K.; Drevemo, S.; Wennerstrand, J. Spinal kinematics in horses with induced back pain. Vet. Comp. Orthop. Traumatol. 2009, 22, 448–454. [Google Scholar] [CrossRef] [Green Version]
- Johnston, C.H.K.; Faber, M.; Erichsen, C.; Eksell, P.; Drevemo, S. Effect of conformational aspects on the movement of the equine back. Vet. Clin. N. Am. Equine Pract. 2002, 34, 314–318. [Google Scholar] [CrossRef]
- Clayton, H.M.; Lanovaz, J.L.; Schamhardt, H.C.; Wessum, R. The effects of a rider’s mass on ground reaction forces and fetlock kinematics at the trot. Equine Vet. J. 2010, 31, 218–221. [Google Scholar] [CrossRef] [PubMed]
- Roepstorff, L.; Egenvall, A.; Rhodin, M.; Byström, A.; Johnston, C.; Van Weeren, P.R.; Weishaupt, M. Kinetics and kinematics of the horse comparing left and right rising trot. Equine Vet. J. 2009, 41, 292–296. [Google Scholar] [CrossRef] [PubMed]
- McCracken, M.J.; Kramer, J.; Keegan, K.G.; Lopes, M.; Wilson, D.A.; Reed, S.K.; Lacarrubba, A.; Rasch, M. Comparison of an inertial sensor system of lameness quantification with subjective lameness evaluation. Equine Vet. J. 2012, 44, 652–656. [Google Scholar] [CrossRef] [PubMed]
- Pfau, T.; Caviedes, M.F.S.; McCarthy, R.; Cheetham, L.; Forbes, B.; Rhodin, M. Comparison of visual lameness scores to gait asymmetry in racing Thoroughbreds during trot in-hand. Equine Vet. Educ. 2020, 32, 191–198. [Google Scholar] [CrossRef]
- Caviedes, M.F.S.; Forbes, B.S.; Pfau, T. Repeatability of gait analysis measurements in Thoroughbreds in training. Equine Vet. J. 2018, 50, 513–518. [Google Scholar] [CrossRef] [PubMed] [Green Version]
- Alvarez, C.G.; Rhodin, M.; Bobbert, M.F.; Meyer, H.; Weishaupt, M.A.; Johnston, C.; Van Weeren, P.R. The effect of head and neck position on the thoracolumbar kinematics in the unridden horse. Equine Vet. J. 2006, 36, 445–451. [Google Scholar] [CrossRef] [PubMed]
- Rhodin, M.; Álvarez, C.B.G.; Byström, A.; Johnston, C.; Weeren, P.R.; Roepstorff, L.; Weishaupt, M.A. The effect of different head and neck positions on the caudal back and hindlimb kinematics in the elite dressage horse at trot. Equine Vet. J. 2009, 41, 274–279. [Google Scholar] [CrossRef] [PubMed]


| Segment | In-Hand (Unloaded) Trot Straight EMM SE (±) | Sitting Trot Pooled EMM SE (±) | Canter Pooled EMM SE (±) | Gait Effect p Value | Bonferroni Post Hoc | |
|---|---|---|---|---|---|---|
| Differential Pitch Rotation | T5-T13 (°) | 9.2 (0.8) | 8.3 (0.8) | 8.7 (0.6) | 0.23 | - |
| T13-T18 (°) | 9.0 (0.7) | 10.2 (0.5) | 9.4 (0.5) | 0.27 | - | |
| T18-L3 (°) | 3.4 (0.4) | 7.5 (0.3) | 6.3 (0.3) | 0.01 | IH < CT, p < 0.0001 IH < CC, p < 0.0001 CT > CC, p = 0.05 | |
| L3-TS (°) | 4.3 (0.6) | 4.9 (0.6) | 6.5 (0.5) | 0.005 | IH < CC, p = 0.006 CT < CC, p = 0.01 | |
| Differential Roll Rotation | T5-T13 (°) | 23.5 (1.7) | 18.7 (1.3) | 16.6 (1.4) | 0.04 | CT < IH, p = 0.09 CC < IH, p = 0.005 |
| T13-T18 (°) | 13.2 (1.2) | 15.3 (0.9) | 13.2 (0.9) | 0.07 | - | |
| T18-L3 (°) | 7.1 (1.0) | 11.9 (0.8) | 12.8 (0.8) | 0.24 | - | |
| L3-TS (°) | 17.4 (1.5) | 18.7 (1.5) | 16.9 (1.5) | 0.05 | - | |
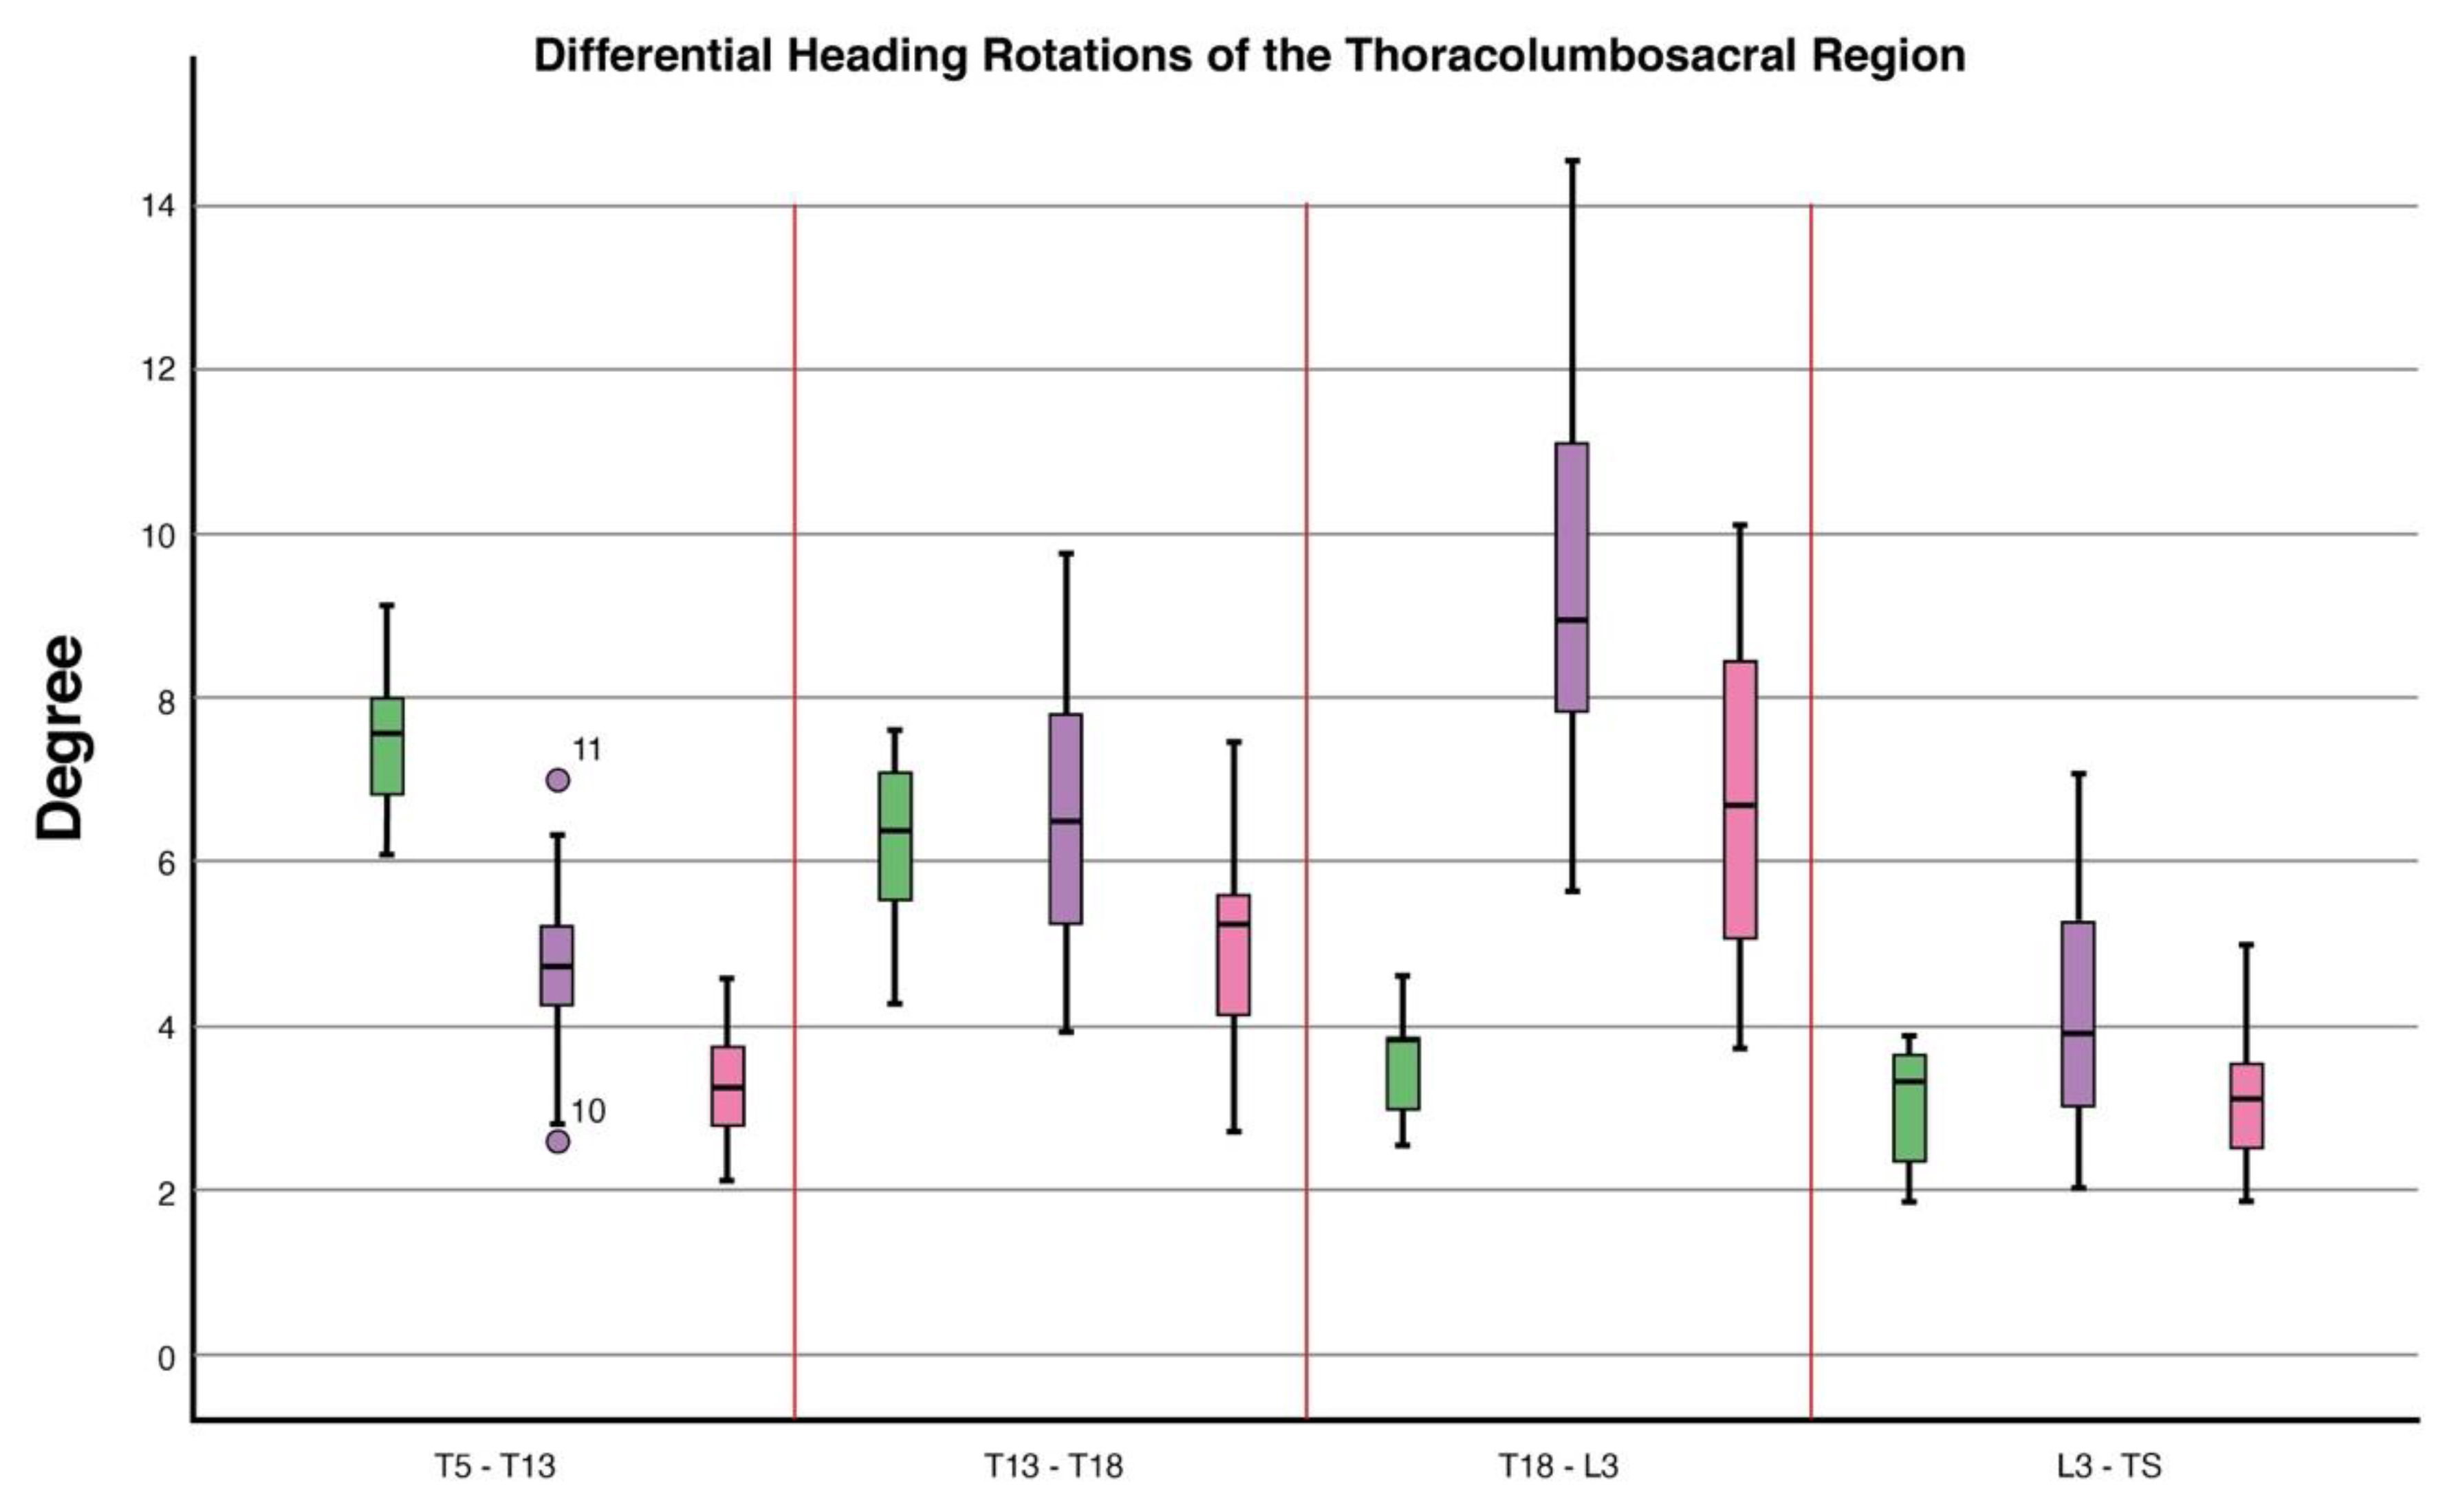
| Differential Heading Rotation | T5-T13 (°) | 7.4 (0.4) | 5.1 (0.2) | 3.2 (0.2) | <0.0001 | IH > CT, p ≤ 0.0001 IH > CC, p ≤ 0.0001 |
| T13-T18 (°) | 6.3 (0.5) | 6.4 (0.4) | 4.9 (0.4) | <0.0001 | IH > CC, p = 0.02 CT > CC, p = 0.001 | |
| T18-L3 (°) | 3.5 (0.7) | 9.6 (0.4) | 6.7 (0.4) | <0.0001 | IH < CT, p ≤ 0.0001 IH < CC, p = 0.002 CT > CC, p ≤ 0.0001 | |
| L3-TS (°) | 3.0 (0.4) | 4.0 (0.2) | 2.9 (0.3) | 0.01 | CT > CC, p = 0.02 |
Publisher’s Note: MDPI stays neutral with regard to jurisdictional claims in published maps and institutional affiliations. |
© 2021 by the authors. Licensee MDPI, Basel, Switzerland. This article is an open access article distributed under the terms and conditions of the Creative Commons Attribution (CC BY) license (http://creativecommons.org/licenses/by/4.0/).
Share and Cite
MacKechnie-Guire, R.; Pfau, T. Differential Rotational Movement of the Thoracolumbosacral Spine in High-Level Dressage Horses Ridden in a Straight Line, in Sitting Trot and Seated Canter Compared to In-Hand Trot. Animals 2021, 11, 888. https://0-doi-org.brum.beds.ac.uk/10.3390/ani11030888
MacKechnie-Guire R, Pfau T. Differential Rotational Movement of the Thoracolumbosacral Spine in High-Level Dressage Horses Ridden in a Straight Line, in Sitting Trot and Seated Canter Compared to In-Hand Trot. Animals. 2021; 11(3):888. https://0-doi-org.brum.beds.ac.uk/10.3390/ani11030888
Chicago/Turabian StyleMacKechnie-Guire, Russell, and Thilo Pfau. 2021. "Differential Rotational Movement of the Thoracolumbosacral Spine in High-Level Dressage Horses Ridden in a Straight Line, in Sitting Trot and Seated Canter Compared to In-Hand Trot" Animals 11, no. 3: 888. https://0-doi-org.brum.beds.ac.uk/10.3390/ani11030888