Effect of Encapsulated Nitrate and Microencapsulated Blend of Essential Oils on Growth Performance and Methane Emissions from Beef Steers Fed Backgrounding Diets


Abstract
:Simple Summary
Abstract
1. Introduction
2. Materials and Methods
2.1. Animals and Experimental Design
2.2. Sample Collection
2.3. Emission Measurements
2.4. Sample Analyses
2.5. Statistical Analysis
3. Results
4. Discussion
4.1. Nitrate
4.2. Essential Oils
5. Conclusions
Author Contributions
Funding
Acknowledgments
Conflicts of Interest
References
- Hristov, A.N.; Oh, J.; Lee, C.; Meinen, R.; Montes, F.; Ott, T.; Firkins, J.; Rotz, A.; Dell, C.; Adesogan, A.; et al. Mitigation of Greenhouse Gas Emissions in Livestock Production—A Review of Technical Options for non-CO2 Emissions; Gerber, P.J., Henderson, B., Makkar, H.P.S., Eds.; FAO Animal Production and Health Paper No. 177; FAO: Rome, Italy, 2013. [Google Scholar]
- Hulshof, R.B.A.; Berndt, A.; Gerrits, W.J.J.; Dijkstra, J.; van Zijderveld, S.M.; Newbold, J.R.; Perdok, H.B. Dietary nitrate supplementation reduces methane emission in beef cattle fed sugarcane-based diets. J. Anim. Sci. 2012, 90, 2317–2323. [Google Scholar] [CrossRef]
- Van Zijderveld, S.M.; Gerrits, W.J.J.; Apajalahti, J.A.; Newbold, J.R.; Dijkstra, J.; Leng, R.A.; Perdok, H.B. Nitrate and sulfate: Effective alternative hydrogen sinks for mitigation of ruminal methane production in sheep. J. Dairy Sci. 2010, 93, 5856–5866. [Google Scholar] [CrossRef] [PubMed]
- Van Zijderveld, S.M.; Gerrits, W.J.J.; Dijkstra, J.; Newbold, J.R.; Hulshof, R.B.A.; Perdok, H.B. Persistency of methane mitigation by dietary nitrate supplementation in dairy cows. J. Dairy Sci. 2011, 94, 4028–4038. [Google Scholar] [CrossRef] [PubMed]
- Guyader, J.; Eugene, M.; Meunier, B.; Doreau, M.; Morgavi, D.P.; Silberberg, M.; Rochette, Y.; Gerard, C.; Loncke, C.; Martin, C. Additive methane-mitigating effect between linseed oil and nitrate fed to cattle. J. Anim. Sci. 2015, 93, 3564–3577. [Google Scholar] [CrossRef] [PubMed]
- Nolan, J.V.; Hegarty, R.S.; Hegarty, J.; Godwin, I.R.; Woodgate, R. Effects of dietary nitrate on fermentation, methane production and digesta kinetics in sheep. Anim. Prod. Sci. 2010, 50, 801–806. [Google Scholar] [CrossRef]
- El-Zaiat, H.M.; Araujo, R.C.; Soltan, Y.A.; Morsy, A.S.; Louvandini, H.; Pires, A.V.; Patino, H.O.; Correa, P.S.; Abdalla, A.L. Encapsulated nitrate and cashew nut shell liquid on blood and rumen constituents, methane emission, and growth performance of lambs. J. Anim. Sci. 2014, 92, 2214–2224. [Google Scholar] [CrossRef] [PubMed]
- Lee, C.; Araujo, R.C.; Koenig, K.M.; Beauchemin, K.A. In situ and in vitro evaluations of a slow release form of nitrate for ruminants: Nitrate release rate, rumen nitrate metabolism and the production of methane, hydrogen, and nitrous oxide. Anim. Feed Sci. Technol. 2017, 231, 97–106. [Google Scholar] [CrossRef]
- Lee, C.; Araujo, R.C.; Koenig, K.M.; Beauchemin, K.A. Effects of encapsulated nitrate on enteric methane production and nitrogen and energy utilization in beef heifers. J. Anim. Sci. 2015, 93, 2391–2404. [Google Scholar] [CrossRef] [PubMed]
- Lee, C.; Araujo, R.C.; Koenig, K.M.; Beauchemin, K.A. Effects of encapsulated nitrate on growth performance, nitrate toxicity, and enteric methane emissions in beef steers: Backgrounding phase. J. Anim. Sci. 2017, 95, 3700–3711. [Google Scholar] [CrossRef]
- Lee, C.; Araujo, R.C.; Koenig, K.M.; Beauchemin, K.A. Effects of encapsulated nitrate on growth performance, carcass characteristics, nitrate residues in tissues, and enteric methane emissions in beef steers: Finishing phase. J. Anim. Sci. 2017, 95, 3712–3726. [Google Scholar] [CrossRef]
- Bruning-Fann, C.S.; Kaneene, J.B. The effects of nitrate, nitrite and N-nitroso compounds on human health—A review. Vet. Hum. Toxicol. 1993, 35, 521–538. [Google Scholar] [PubMed]
- European Commission (EC). Regulation EC No 1831/2003 of the European Parliament and Council of 22 September 2003 on additives for use in animal nutrition. Off. J. Eur. Commun. 2003, L268, 29–43. [Google Scholar]
- Calsamiglia, S.; Busquet, M.; Cardozo, P.W.; Castillejos, L.; Ferret, A. Invited review: Essential oils as modifiers of rumen microbial fermentation. J. Dairy Sci. 2007, 90, 2580–2595. [Google Scholar] [CrossRef]
- Benchaar, C.; McAllister, T.A.; Chouinard, P.Y. Digestion, ruminal fermentation, ciliate protozoal populations, and milk production from dairy cows fed cinnamaldehyde, quebracho condensed tannin, or Yucca schidigera saponin extracts. J. Dairy Sci. 2008, 91, 4765–4777. [Google Scholar] [CrossRef] [PubMed]
- Patra, A.K. Effects of essential oils on rumen fermentation, microbial ecology and ruminant production. Asian J. Anim. Vet. Adv. 2011, 6, 416–428. [Google Scholar] [CrossRef]
- Cobellis, G.; Trabalza-Marinucci, M.; Yu, Z. Critical evaluation of essential oils as rumen modifiers in ruminant nutrition: A review. Sci. Total Environ. 2016, 545–546, 556–568. [Google Scholar] [CrossRef] [PubMed]
- Oh, J.; Wall, E.H.; Bravo, D.M.; Hristov, A.N. Host-mediated effects of phytonutrients in ruminants: A review. J. Dairy Sci. 2017, 100, 5974–5983. [Google Scholar] [CrossRef] [PubMed]
- Silva, R.B.; Pereira, R.A.N.; Araujo, R.C.; Pereira, M.N. Response of lactating cows to a blend of essential oils and pepper extract. J. Anim. Sci. 2015, 93, 45, (abstract). [Google Scholar]
- Yang, W.Z.; Ametaj, B.N.; Benchaar, C.; Beauchemin, K.A. Dose response to cinnamaldehyde supplementation in growing beef heifers: Ruminal and intestinal digestion. J. Anim. Sci. 2010, 88, 680–688. [Google Scholar] [CrossRef]
- Hori, T. Capsaicin and central control of thermoregulation. Pharmacol. Ther. 1984, 26, 389–416. [Google Scholar] [CrossRef]
- Silva, R.B.; Silva, W.R.; Oliveira, C.D.S.; Lacreta Junior, A.C.C.; Chalfun, L.H.L.; Araujo, R.C.; Pereira, R.A.N.; Pereira, M.N. Supplementation of lactating cows with a blend of essential oils and capsaicin or monensin: Thermoregulation and blood variables. J. Dairy Sci. 2017, 100 (Suppl. 2), 321–322. [Google Scholar]
- Soltan, Y.A.; Natel, A.S.; Araujo, R.C.; Morsy, A.S.; Abdalla, A.L. Progressive adaptation of sheep to a microencapsulated blend of essential oils: Ruminal fermentation, methane emission, nutrient digestibility, and microbial protein synthesis. Anim. Feed Sci. Technol. 2018, 237, 8–18. [Google Scholar] [CrossRef]
- Araujo, R.C.; Daley, D.R.; Goodall, S.R.; Jalali, S.; Guimarães Bisneto, O.A.; Budde, A.M.; Wagner, J.J.; Engle, T.E. The effects of a microencapsulated blend of essential oils supplemented alone or in combination with monensin on performance and carcass characteristics of growing and finishing beef steers. Prof. Anim. Sci. 2019. under review. [Google Scholar]
- Canadian Council on Animal Care. CCAC Guidelines on: The Care and Use of Farm Animals in Research, Teaching and Testing; Canadian Council on Animal Care: Ottawa, ON, Canada, 2009. [Google Scholar]
- Manafiazar, G.; Zimmerman, S.; Basarab, J.A. Repeatability and variability of short-term spot measurement of methane and carbon dioxide emissions from beef cattle using GreenFeed emissions monitoring system. Can. J. Anim. Sci. 2016, 97, 118–126. [Google Scholar] [CrossRef]
- Kononoff, P.J.; Heinrichs, A.J.; Buckmaster, D.R. Modification of the Penn State forage and total mixed ration particle separator and the effects of moisture content on its measurements. J. Dairy Sci. 2003, 86, 1858–1863. [Google Scholar] [CrossRef]
- Van Soest, P.J.; Robertson, J.B.; Lewis, B.A. Methods for dietary fiber, neutral detergent fiber, and nonstarch polysaccharides in relation to animal nutrition. J. Dairy Sci. 1991, 74, 3583–3597. [Google Scholar] [CrossRef]
- AOAC. Official Methods of Analysis, 18th ed.; AOAC Int.: Gaithersburg, MD, USA, 2005. [Google Scholar]
- Lee, C.; Beauchemin, K.A. A review of feeding supplementary nitrate to ruminant animals: Nitrate toxicity, methane emissions, and production performance. Can. J. Anim. Sci. 2014, 94, 557–570. [Google Scholar] [CrossRef]
- Lund, P.; Dahl, R.; Yang, H.J.; Hellwing, A.L.; Cao, B.B.; Weisbjerg, M.R. The acute effect of addition of nitrate on in vitro and in vivo methane emission in dairy cows. Anim. Prod. Sci. 2014, 54, 1432–1435. [Google Scholar] [CrossRef]
- Lee, C.; Araujo, R.C.; Koenig, K.M.; Beauchemin, K.A. Effects of encapsulated nitrate on eating behavior, rumen fermentation, and blood profile of beef heifers fed restrictively or ad libitum. J. Anim. Sci. 2015, 93, 2405–2418. [Google Scholar] [CrossRef]
- Lee, C.; Araujo, R.C.; Koenig, K.M.; Beauchemin, K.A. Effects of feed consumption rate of beef cattle offered a diet supplemented with nitrate ad libitum or restrictively on potential toxicity of nitrate. J. Anim. Sci. 2015, 93, 4956–4966. [Google Scholar] [CrossRef]
- Velazco, J.I.; Cottle, D.J.; Hegarty, R.S. Methane emissions and feeding behaviour of feedlot cattle supplemented with nitrate or urea. Anim. Prod. Sci. 2014, 54, 1737–1740. [Google Scholar] [CrossRef]
- Leng, R.A. The Potential of Feeding Nitrate to Reduce Enteric Methane Production in Ruminants. A Report to Department of Climate Change. Commonwealth Government of Australia, Canberra. 2008. Available online: https://pdfs.semanticscholar.org/2c17/65afdfff583c9d72aec94d3a4facc894e064.pdf (accessed on 20 August 2018).
- Moate, P.J.; Jacobs, J.L.; Hannah, M.C.; Morris, G.L.; Beauchemin, K.A.; Hess, P.S.; Eckard, R.J.; Liu, Z.; Rochfort, S.; Wales, W.J.; et al. Adaptation responses in milk fat yield and methane emissions of dairy cows when wheat was included in their diet for 16 weeks. J. Dairy Sci. 2018, 101, 7117–7132. [Google Scholar] [CrossRef] [PubMed]
- Ungerfeld, E.M. A theoretical comparison between two ruminal electron sinks. Front. Microbiol. 2013, 4, 1–15. [Google Scholar] [CrossRef] [PubMed]
- Afeefy, H.Y.; Liebman, J.F.; Stein, S.E. Neutral thermochemical data. In NIST Chemistry WebBook, NIST Standard Reference Database; Linstrom, P.J., Mallard, W.G., Eds.; National Institute of Standards and Technology: Gaithersburg, MD, USA, 1998; Volume 69. [Google Scholar]
- Shi, C.X.; Meng, Q.X.; Hou, X.Z.; Ren, L.P.; Zhou, Z.M. Response of ruminal fermentation, methane production and dry matter digestibility to microbial source and nitrate addition level in an in vitro incubation with rumen microbes obtained from wethers. J. Anim. Vet. Adv. 2012, 11, 3334–3341. [Google Scholar] [CrossRef]
- Nolan, J.V.; Godwin, I.R.; de Raphélis-Soissan, V.; Hegarty, R.S. Managing the rumen to limit the incidence and severity of nitrite poisoning in nitrate-supplemented ruminants. Anim. Prod. Sci. 2016, 56, 1317–1329. [Google Scholar] [CrossRef]
- Beauchemin, K.A.; McGinn, S.M. Methane emissions from beef cattle: Effects of fumaric acid, essential oil, and canola oil. J. Anim. Sci. 2006, 84, 1489–1496. [Google Scholar] [CrossRef] [PubMed]
- Meyer, N.F.; Erickson, G.E.; Klopfenstein, T.J.; Greenquist, M.A.; Luebbe, M.K.; Williams, P.; Engstrom, M.A. Effect of essential oils, tylosin, and monensin on finishing steer performance, carcass characteristics, liver abscesses, ruminal fermentation, and digestibility. J. Anim. Sci. 2009, 87, 2346–2354. [Google Scholar] [CrossRef] [PubMed]
- Rivaroli, D.C.; do Prado, R.M.; Ornaghi, M.G.; Mottin, C.; Ramos, T.R.; Barrado, A.G.; Jorge, A.M.; do Prado, I.N. Essential oils in the diet of crossbred (½ Angus vs. ½ Nellore) bulls finished in feedlot on animal performance, feed efficiency and carcass characteristics. J. Agric. Sci. 2017, 9, 205–2015. [Google Scholar] [CrossRef]
- Wang, C.J.; Wang, S.P.; Zhou, H. Influences of flavomycin, ropadiar, and saponin on nutrient digestibility, rumen fermentation, and methane emission from sheep. Anim. Feed Sci. Technol. 2009, 148, 157–166. [Google Scholar] [CrossRef]
- Yatoo, M.A.; Chaudhary, L.C.; Agarwal, N.; Chaturvedi, V.B.; Kamra, D.N. Effect of feeding of blend of essential oils on methane production, growth, and nutrient utilization in growing buffaloes. Asian-Aust. J. Anim. Sci. 2018, 31, 672–676. [Google Scholar] [CrossRef]
- Tomkins, N.W.; Denman, S.E.; Pilajun, R.; Wanapat, M.; McSweeney, C.S.; Elliott, R. Manipulating rumen fermentation and methanogenesis using an essential oil and monensin in beef cattle fed a tropical grass hay. Anim. Feed Sci. Technol. 2015, 200, 25–34. [Google Scholar] [CrossRef]
- Benchaar, C. Diet supplementation with cinnamon oil, cinnamaldehyde, or monensin does not reduce enteric methane production of dairy cows. Animal 2016, 10, 418–425. [Google Scholar] [CrossRef] [PubMed]
- Yang, W.Z.; Benchaar, C.; Ametaj, B.N.; Chaves, A.V.; He, M.L.; McAllister, T.A. Effects of garlic and juniper berry essential oils on ruminal fermentation and on the site and extent of digestion in lactating cows. J. Dairy Sci. 2007, 90, 5671–5681. [Google Scholar] [CrossRef]
- Szumacher-Strabel, M.; Cieślak, A. Potential of phytofactors to mitigate rumen ammonia and methane production. J. Anim. Feed Sci. 2010, 19, 319–337. [Google Scholar] [CrossRef] [Green Version]
- Patra, A.K.; Saxena, J. A new perspective on the use of plant secondary metabolites to inhibit methanogenesis in the rumen. Phytochemistry 2010, 71, 1198–1222. [Google Scholar] [CrossRef] [PubMed]
- Khiaosa-ard, R.; Zebeli, Q. Meta-analysis of the effects of essential oils and their bioactive compounds on rumen fermentation characteristics and feed efficiency in ruminants. J. Anim. Sci. 2013, 91, 1819–1830. [Google Scholar] [CrossRef]
- Burt, S. Essential oils: Their antibacterial properties and potential applications in foods—A review. Int. J. Food Microbiol. 2004, 94, 223–253. [Google Scholar] [CrossRef] [PubMed]
- Patra, A.K.; Yu, Z. Essential oils affect populations of some rumen bacteria in vitro as revealed by microarray (RumenBactArray) analysis. Front. Microbiol. 2015, 6, 297. [Google Scholar] [CrossRef] [PubMed]
- Lambert, R.; Skandamis, P.N.; Coote, P.J.; Nychas, G.J. A study of the minimum inhibitory concentration and mode of action of oregano essential oil, thymol and carvacrol. J. Appl. Microbiol. 2001, 91, 453–462. [Google Scholar] [CrossRef] [Green Version]
- Benchaar, C.; Greathead, H. Essential oils and opportunities to mitigate enteric methane emissions from ruminants. Anim. Feed Sci. Technol. 2011, 166, 338–355. [Google Scholar] [CrossRef]
- Benchaar, C.; Petit, H.V.; Berthiaume, R.; Ouellet, D.R.; Chiquette, J.; Chouinard, P.Y. Effects of essential oils on digestion, ruminal fermentation, rumen microbial populations, milk production, and milk composition in dairy cows fed alfalfa silage or corn silage. J. Dairy Sci. 2007, 90, 886–897. [Google Scholar] [CrossRef]
- Vriens, J.; Nilius, B.; Vennekens, R. Herbal compounds and toxins modulating TRP channels. Curr. Neuropharmacol. 2008, 6, 79–96. [Google Scholar] [CrossRef] [PubMed]


| Item | −EN 1 | +EN | ||
|---|---|---|---|---|
| −MBEO 1 | +MBEO | −MBEO | +MBEO | |
| Ingredients, % of dry matter (DM) | ||||
| Corn silage 2 | 80 | 80 | 80 | 80 |
| Barley grain, dry rolled 3 | 10 | 10 | 10 | 10 |
| Supplement | 10 | 9.99 | 7.5 | 7.48 |
| Canola meal | 3.70 | 3.70 | 3.70 | 3.70 |
| Limestone | 1.55 | 1.55 | 0.43 | 0.43 |
| Salt (NaCl) | 0.11 | 0.11 | 0.11 | 0.11 |
| Urea | 1.17 | 1.17 | 0.24 | 0.24 |
| LeRDC beef feedlot premix 4 | 0.05 | 0.05 | 0.05 | 0.05 |
| Molasses, dried | 0.05 | 0.05 | 0.05 | 0.05 |
| Barley ground | 3.31 | 3.31 | 2.85 | 2.85 |
| Canola oil | 0.07 | 0.05 | 0.07 | 0.06 |
| EN | 0.0 | 0.0 | 2.5 | 2.5 |
| MBEO | 0.0 | 0.015 | 0.0 | 0.015 |
| Chemical composition (% of DM) | ||||
| DM (as-is) | 44.0 | 44.0 | 43.8 | 43.8 |
| OM | 93.9 | 93.9 | 92.5 | 92.5 |
| CP | 14.3 | 14.3 | 13.1 | 13.1 |
| NDF | 42.0 | 42.0 | 41.2 | 41.1 |
| ADF | 28.1 | 28.1 | 27.9 | 27.9 |
| Starch | 29.8 | 29.8 | 29.3 | 29.3 |
| NO3− | 0.12 | 0.16 | 1.66 | 1.68 |
| GE (Mcal/kg DM) 5 | 5.39 | 5.39 | 5.32 | 5.29 |
| Item 2 | −EN 1 | +EN 1 | SEM | p-Value | |||||
|---|---|---|---|---|---|---|---|---|---|
| −MBEO | +MBEO | −MBEO | +MBEO | EN | MBEO | EN × MBEO | Period | ||
| Number of animals | 22 | 22 | 22 | 22 | --- | --- | --- | --- | --- |
| Body weight, kg | |||||||||
| Initial | 332 | 331 | 331 | 331 | 5.03 | 0.939 | 0.953 | 0.989 | --- |
| day 28 | 371 | 363 | 359 | 356 | 5.59 | 0.088 | 0.348 | 0.604 | --- |
| day 56 | 397 | 395 | 387 | 382 | 6.12 | 0.060 | 0.541 | 0.839 | --- |
| day 84 | 439 | 426 | 413 | 407 | 6.92 | 0.002 | 0.184 | 0.561 | --- |
| Final (d 112) | 467 | 458 | 446 | 441 | 7.60 | 0.012 | 0.336 | 0.835 | --- |
| ADG (kg/day) | |||||||||
| day 1 to 28 | 1.417 | 1.137 | 0.986 | 0.910 | 0.060 | <0.0001 | 0.004 | 0.093 | --- |
| day 29 to 56 | 0.934 b | 1.136 a | 1.010 a,b | 0.916 b | 0.050 | 0.153 | 0.281 | 0.004 | --- |
| day 57 to 84 | 1.497 a | 1.110 b | 0.917 b | 0.909 b | 0.055 | <0.0001 | 0.001 | 0.001 | --- |
| day 85 to 112 | 0.998 | 1.153 | 1.190 | 1.173 | 0.053 | 0.049 | 0.200 | 0.111 | --- |
| DMI (kg/day) 3 | |||||||||
| day 1 to 28 | 7.71 | 7.53 | 7.05 | 7.12 | 0.180 | 0.004 | 0.768 | 0.489 | --- |
| day 29 to 56 | 7.85 | 8.31 | 7.82 | 7.69 | 0.180 | 0.072 | 0.359 | 0.100 | --- |
| day 57 to 84 | 9.35 | 8.81 | 8.67 | 8.47 | 0.197 | 0.011 | 0.063 | 0.388 | --- |
| day 85 to 112 | 9.47 | 9.53 | 8.95 | 8.73 | 0.180 | 0.001 | 0.673 | 0.447 | --- |
| G:F | |||||||||
| day 1 to 28 | 0.184 | 0.150 | 0.139 | 0.127 | 0.007 | <0.0001 | 0.002 | 0.123 | --- |
| day 29 to 56 | 0.118 b | 0.136 a | 0.129 a,b | 0.118 b | 0.006 | 0.504 | 0.571 | 0.009 | --- |
| day 57 to 84 | 0.160 a | 0.126 b | 0.106 c | 0.105 c | 0.005 | <0.0001 | 0.002 | 0.002 | --- |
| day 85 to 112 | 0.105 | 0.121 | 0.132 | 0.134 | 0.005 | 0.0001 | 0.088 | 0.182 | --- |
| Average (day 29 to 112) | |||||||||
| DMI (kg/day) 3 | 8.93 | 8.87 | 8.47 | 8.28 | 0.176 | 0.003 | 0.479 | 0.713 | <0.0001 |
| ADG (kg/day) | 1.065 | 1.157 | 1.073 | 1.018 | 0.042 | 0.119 | 0.657 | 0.080 | 0.0001 |
| G:F | 0.123 | 0.128 | 0.125 | 0.121 | 0.004 | 0.432 | 0.921 | 0.240 | 0.811 |
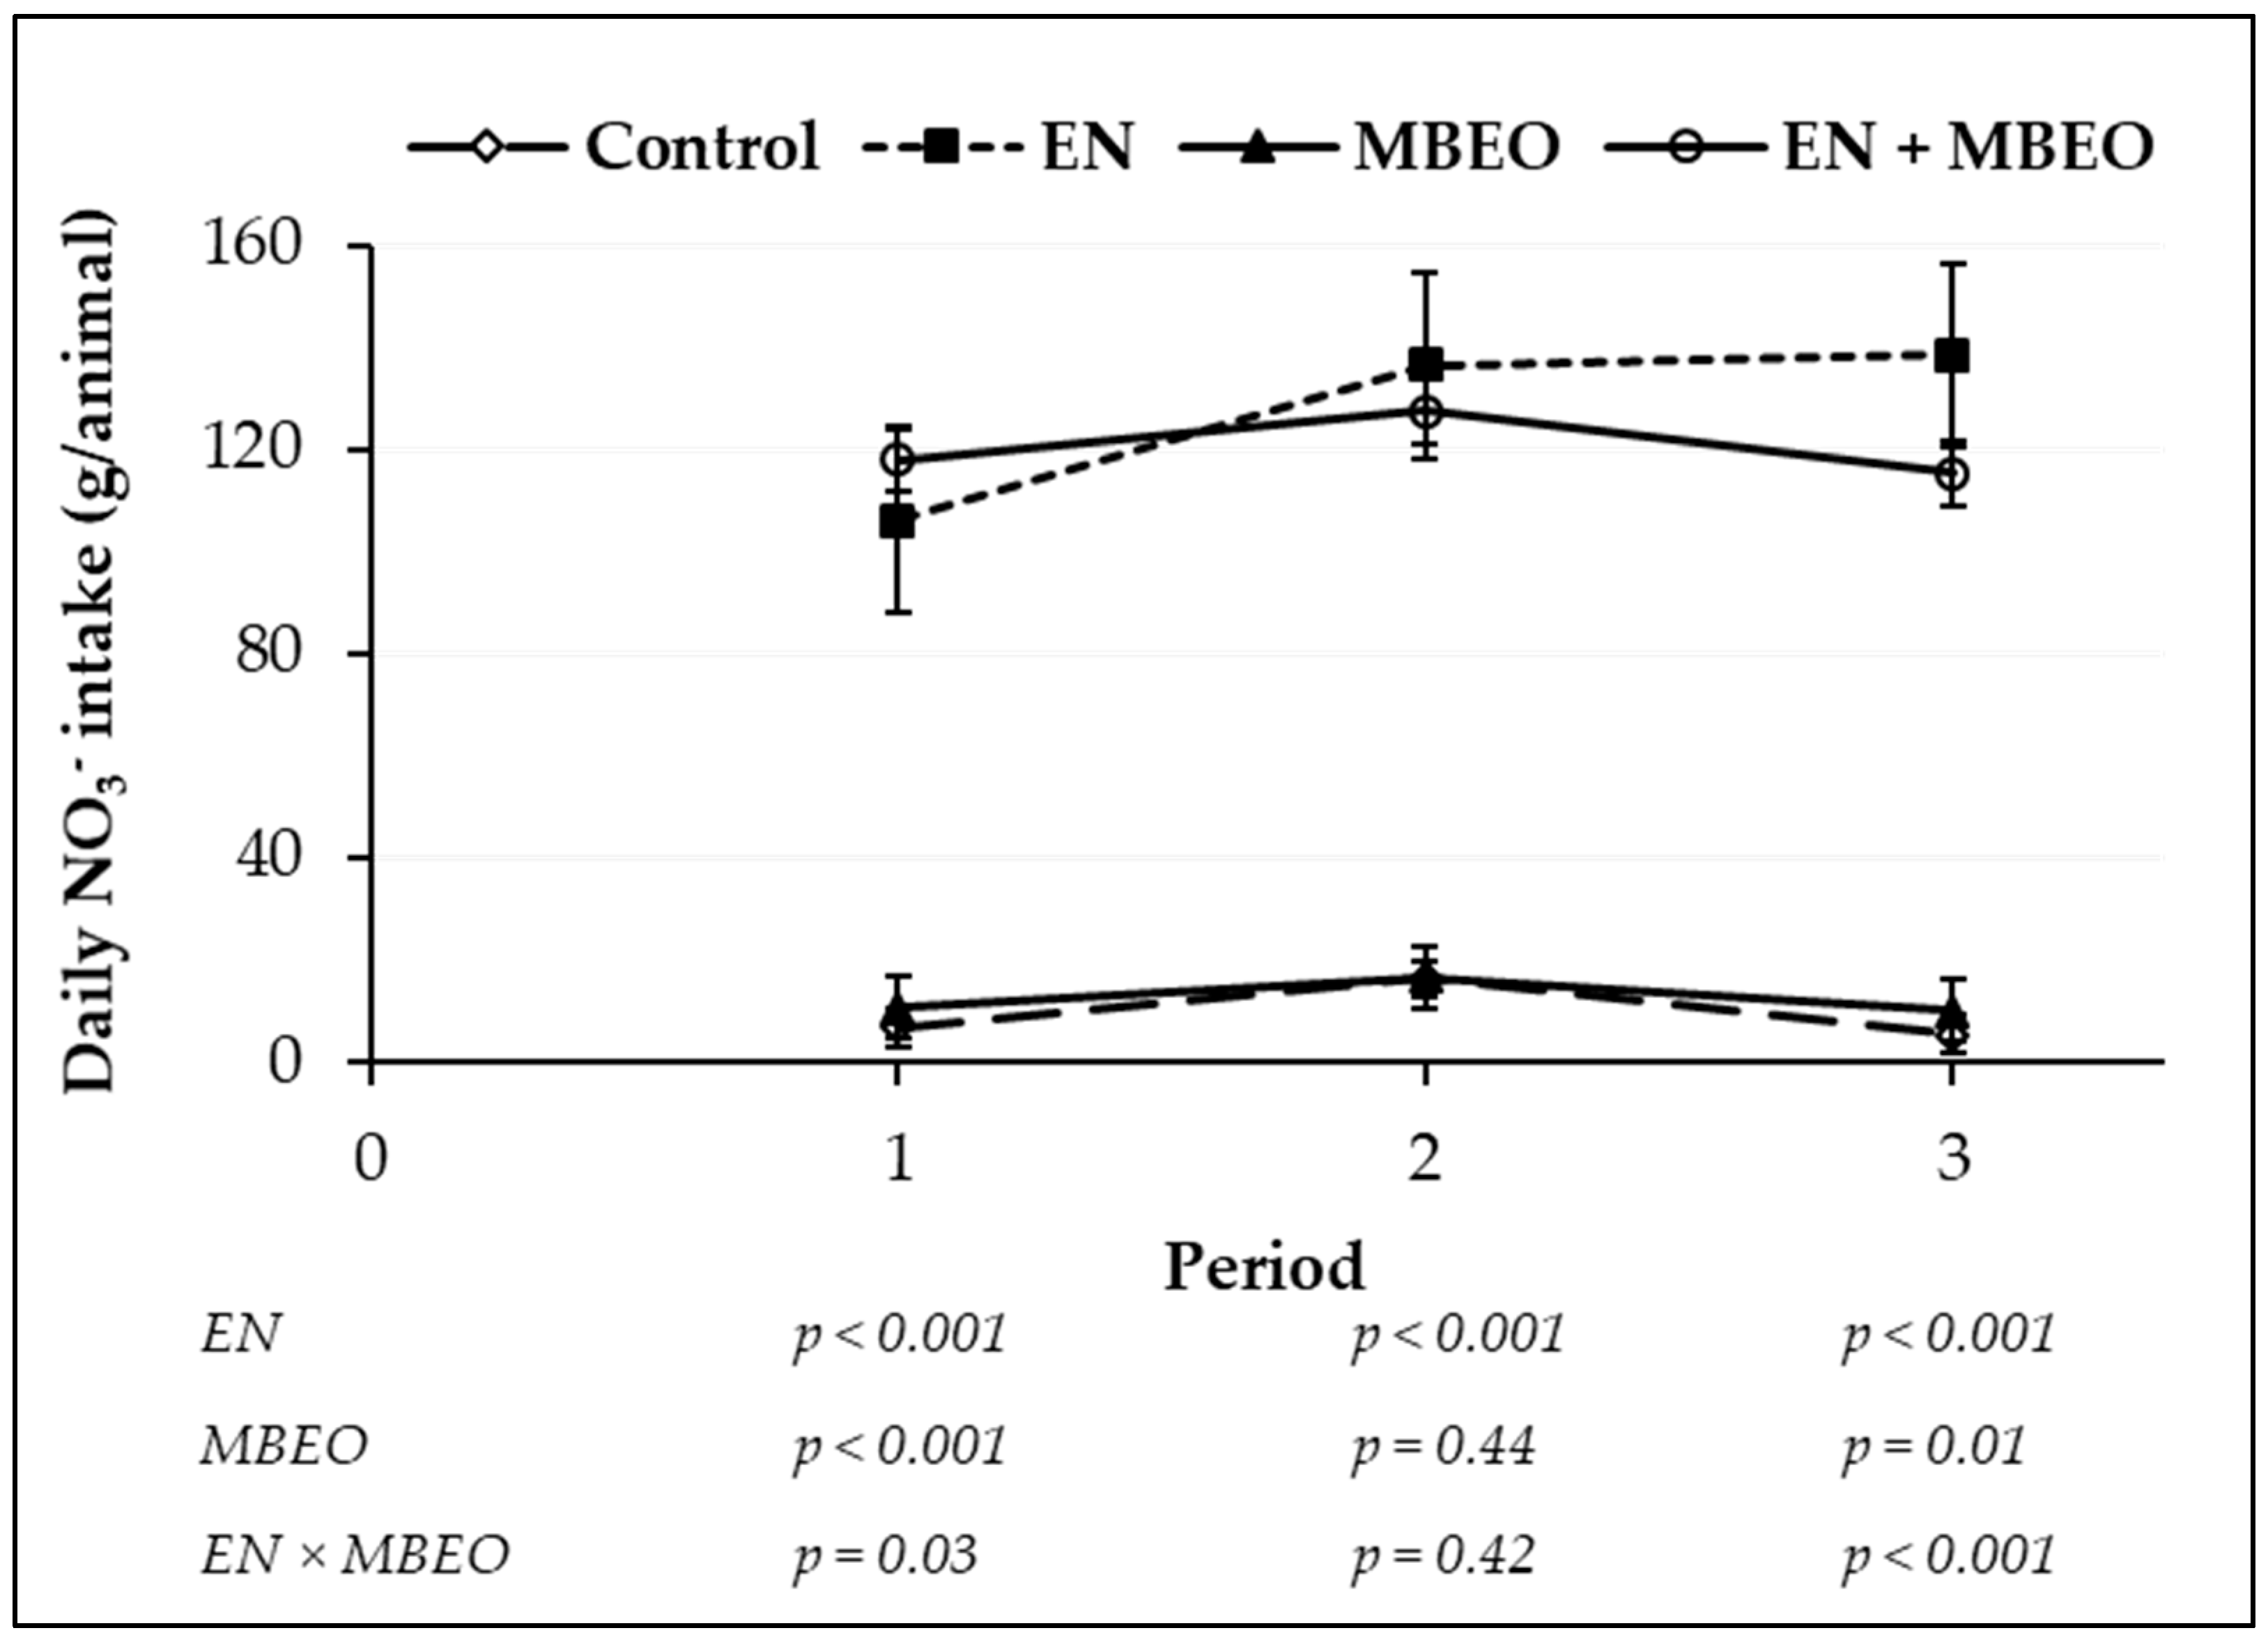
| Average daily NO3– consumed (g/animal) 4 | 9.43 | 12.43 | 127.20 | 120.37 | 5.030 | <0.001 | 0.723 | 0.370 | 0.160 |
| Feeding behavior 5 | |||||||||
| Total meal duration, min/day | 183.6 | 183.4 | 188.2 | 186.6 | 4.71 | 0.410 | 0.849 | 0.883 | <0.0001 |
| Head down duration per meal, min/meal | 9.6 | 9.3 | 10.2 | 9.6 | 0.68 | 0.572 | 0.519 | 0.793 | 0.323 |
| Head down duration, min/day | 80.9 | 84.0 | 97.1 | 91.6 | 4.83 | 0.016 | 0.810 | 0.377 | <0.0001 |
| Feeding/meal frequency, events/day | 9.2 | 9.6 | 10.4 | 10.4 | 0.30 | 0.002 | 0.495 | 0.440 | <0.0001 |
| Feeding rate, g DM/min | 46.2 | 46.1 | 42.7 | 41.1 | 1.29 | 0.001 | 0.514 | 0.553 | <0.0001 |
| Item | −EN 1 | +EN 1 | SEM | p-Value | |||||
|---|---|---|---|---|---|---|---|---|---|
| −MBEO | +MBEO | −MBEO | +MBEO | EN | MBEO | EN × MBEO | Period | ||
| TMR, % (as-is basis) | |||||||||
| Large (≥18 mm) | 2.57 | 3.93 | 3.43 | 3.23 | 0.331 | 0.817 | 0.128 | 0.056 | 0.020 |
| Medium (8 to 18 mm) | 61.58 | 66.65 | 65.19 | 66.61 | 1.917 | 0.462 | 0.219 | 0.451 | 0.413 |
| Small (1.2 to 8 mm) | 31.99 | 28.13 | 29.63 | 28.89 | 1.430 | 0.706 | 0.388 | 0.510 | 0.707 |
| Bottom (<1.2 mm) | 2.92 | 1.83 | 1.41 | 2.02 | 0.554 | 0.479 | 0.766 | 0.401 | 0.269 |
| Orts, % (as-is basis) | |||||||||
| Large (≥18 mm) | 11.48 | 14.27 | 12.65 | 9.52 | 3.886 | 0.732 | 0.973 | 0.586 | 0.115 |
| Medium (8 to 18 mm) | 57.26 | 62.71 | 61.01 | 58.86 | 2.211 | 0.982 | 0.483 | 0.136 | 0.111 |
| Small (1.2 to 8 mm) | 29.65 a | 24.11 b | 24.02 b | 30.70 a | 0.775 | 0.564 | 0.49 | 0.0001 | 0.001 |
| Bottom (<1.2 mm) | 1.71 a | 0.79 a,b | 0.49 b | 0.78 a,b | 0.232 | 0.039 | 0.225 | 0.04 | 0.017 |
| Orts, % of total offered (DM basis) | 1.08 | 1.01 | 1.36 | 2.62 | 0.477 | 0.096 | 0.259 | 0.215 | 0.037 |
| Item | −EN 1 | +EN 1 | SEM | p-Value | |||||
|---|---|---|---|---|---|---|---|---|---|
| −MBEO | +MBEO | −MBEO | +MBEO | EN | MBEO | EN × MBEO | Period | ||
| GEM system visitation | |||||||||
| Number of animals that visited | 18 a | 16 b | 17 a,b | 18 a | 0.5 | 0.741 | 0.339 | 0.021 | 0.010 |
| Good visits per animal per period 2 | 33.0 | 33.1 | 33.3 | 34.3 | 1.66 | 0.647 | 0.743 | 0.807 | 0.210 |
| Visit duration (min:s) | 4:06 | 4:07 | 4:39 | 4:18 | 0.12 | 0.089 | 0.210 | 0.389 | <0.0001 |
| Pellet consumed, kg DM/day | 0.79 | 0.84 | 0.82 | 0.88 | 0.030 | 0.262 | 0.065 | 0.911 | <0.0001 |
| DMI 3, kg/day | 9.02 | 8.89 | 8.56 | 8.30 | 0.207 | 0.010 | 0.322 | 0.713 | <0.0001 |
| GE intake, Mcal/day | 46.64 | 47.30 | 44.83 | 43.56 | 1.075 | 0.009 | 0.766 | 0.353 | <0.0001 |
| CH4 | |||||||||
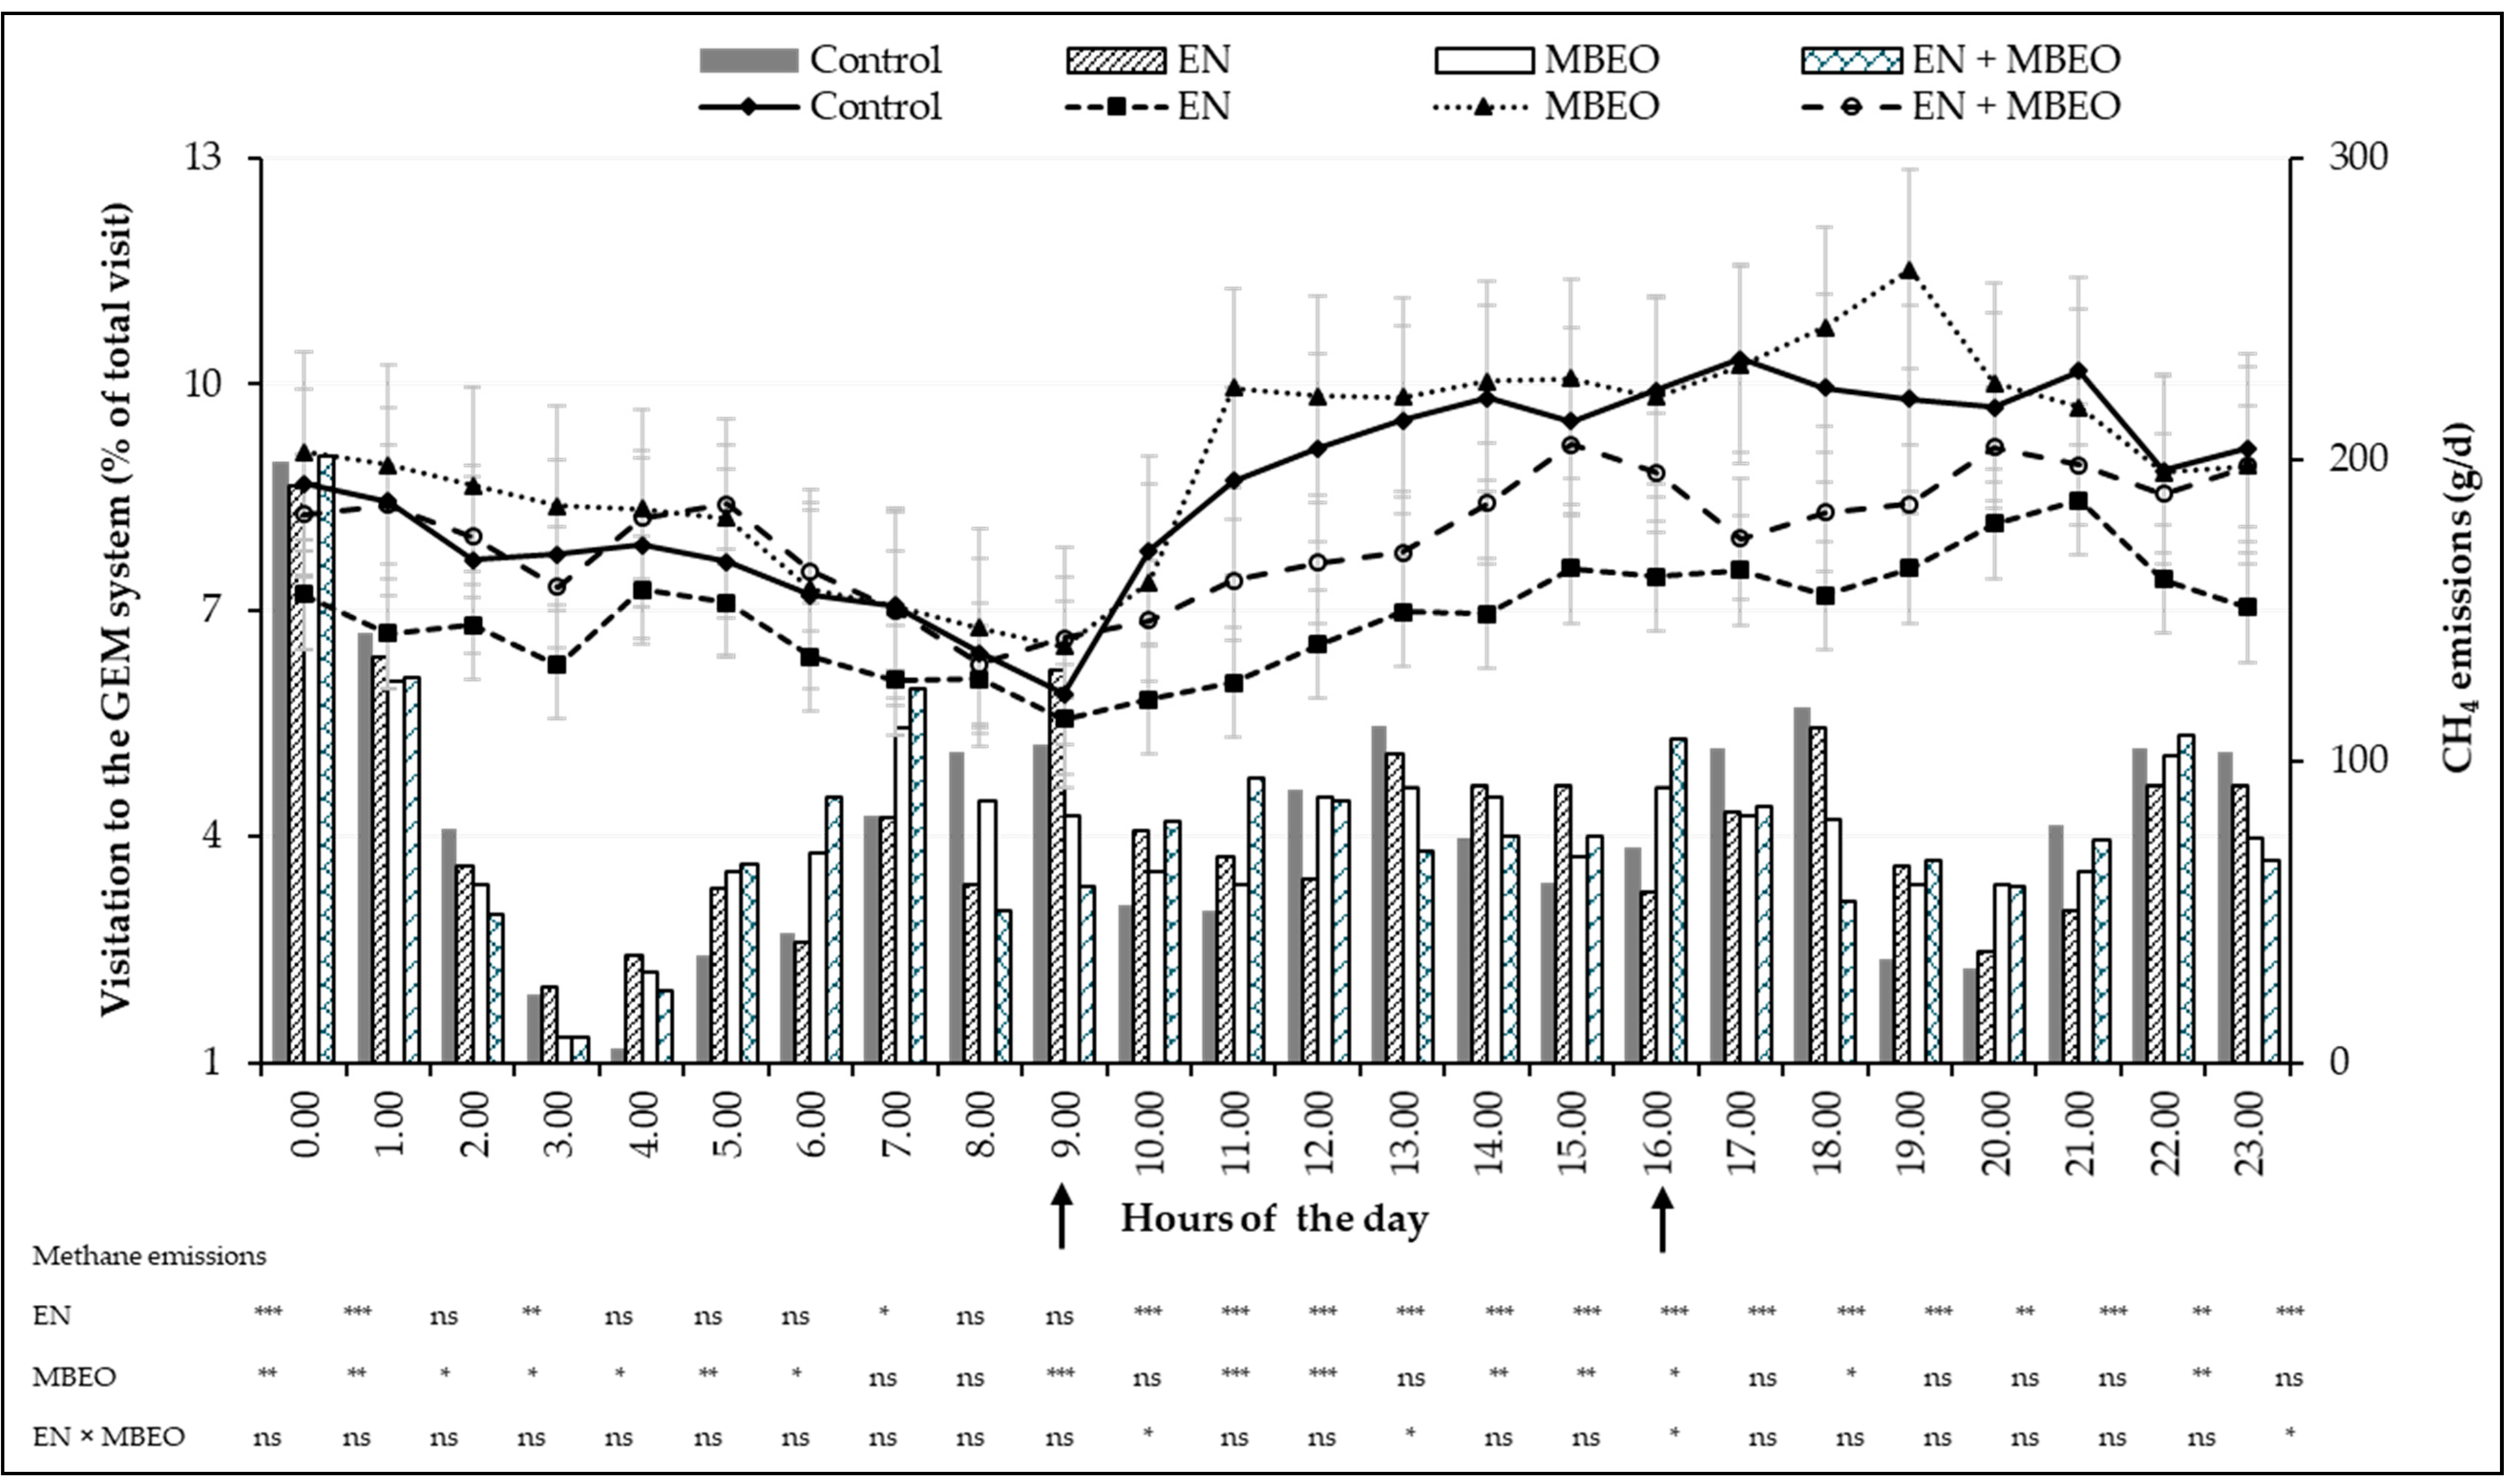
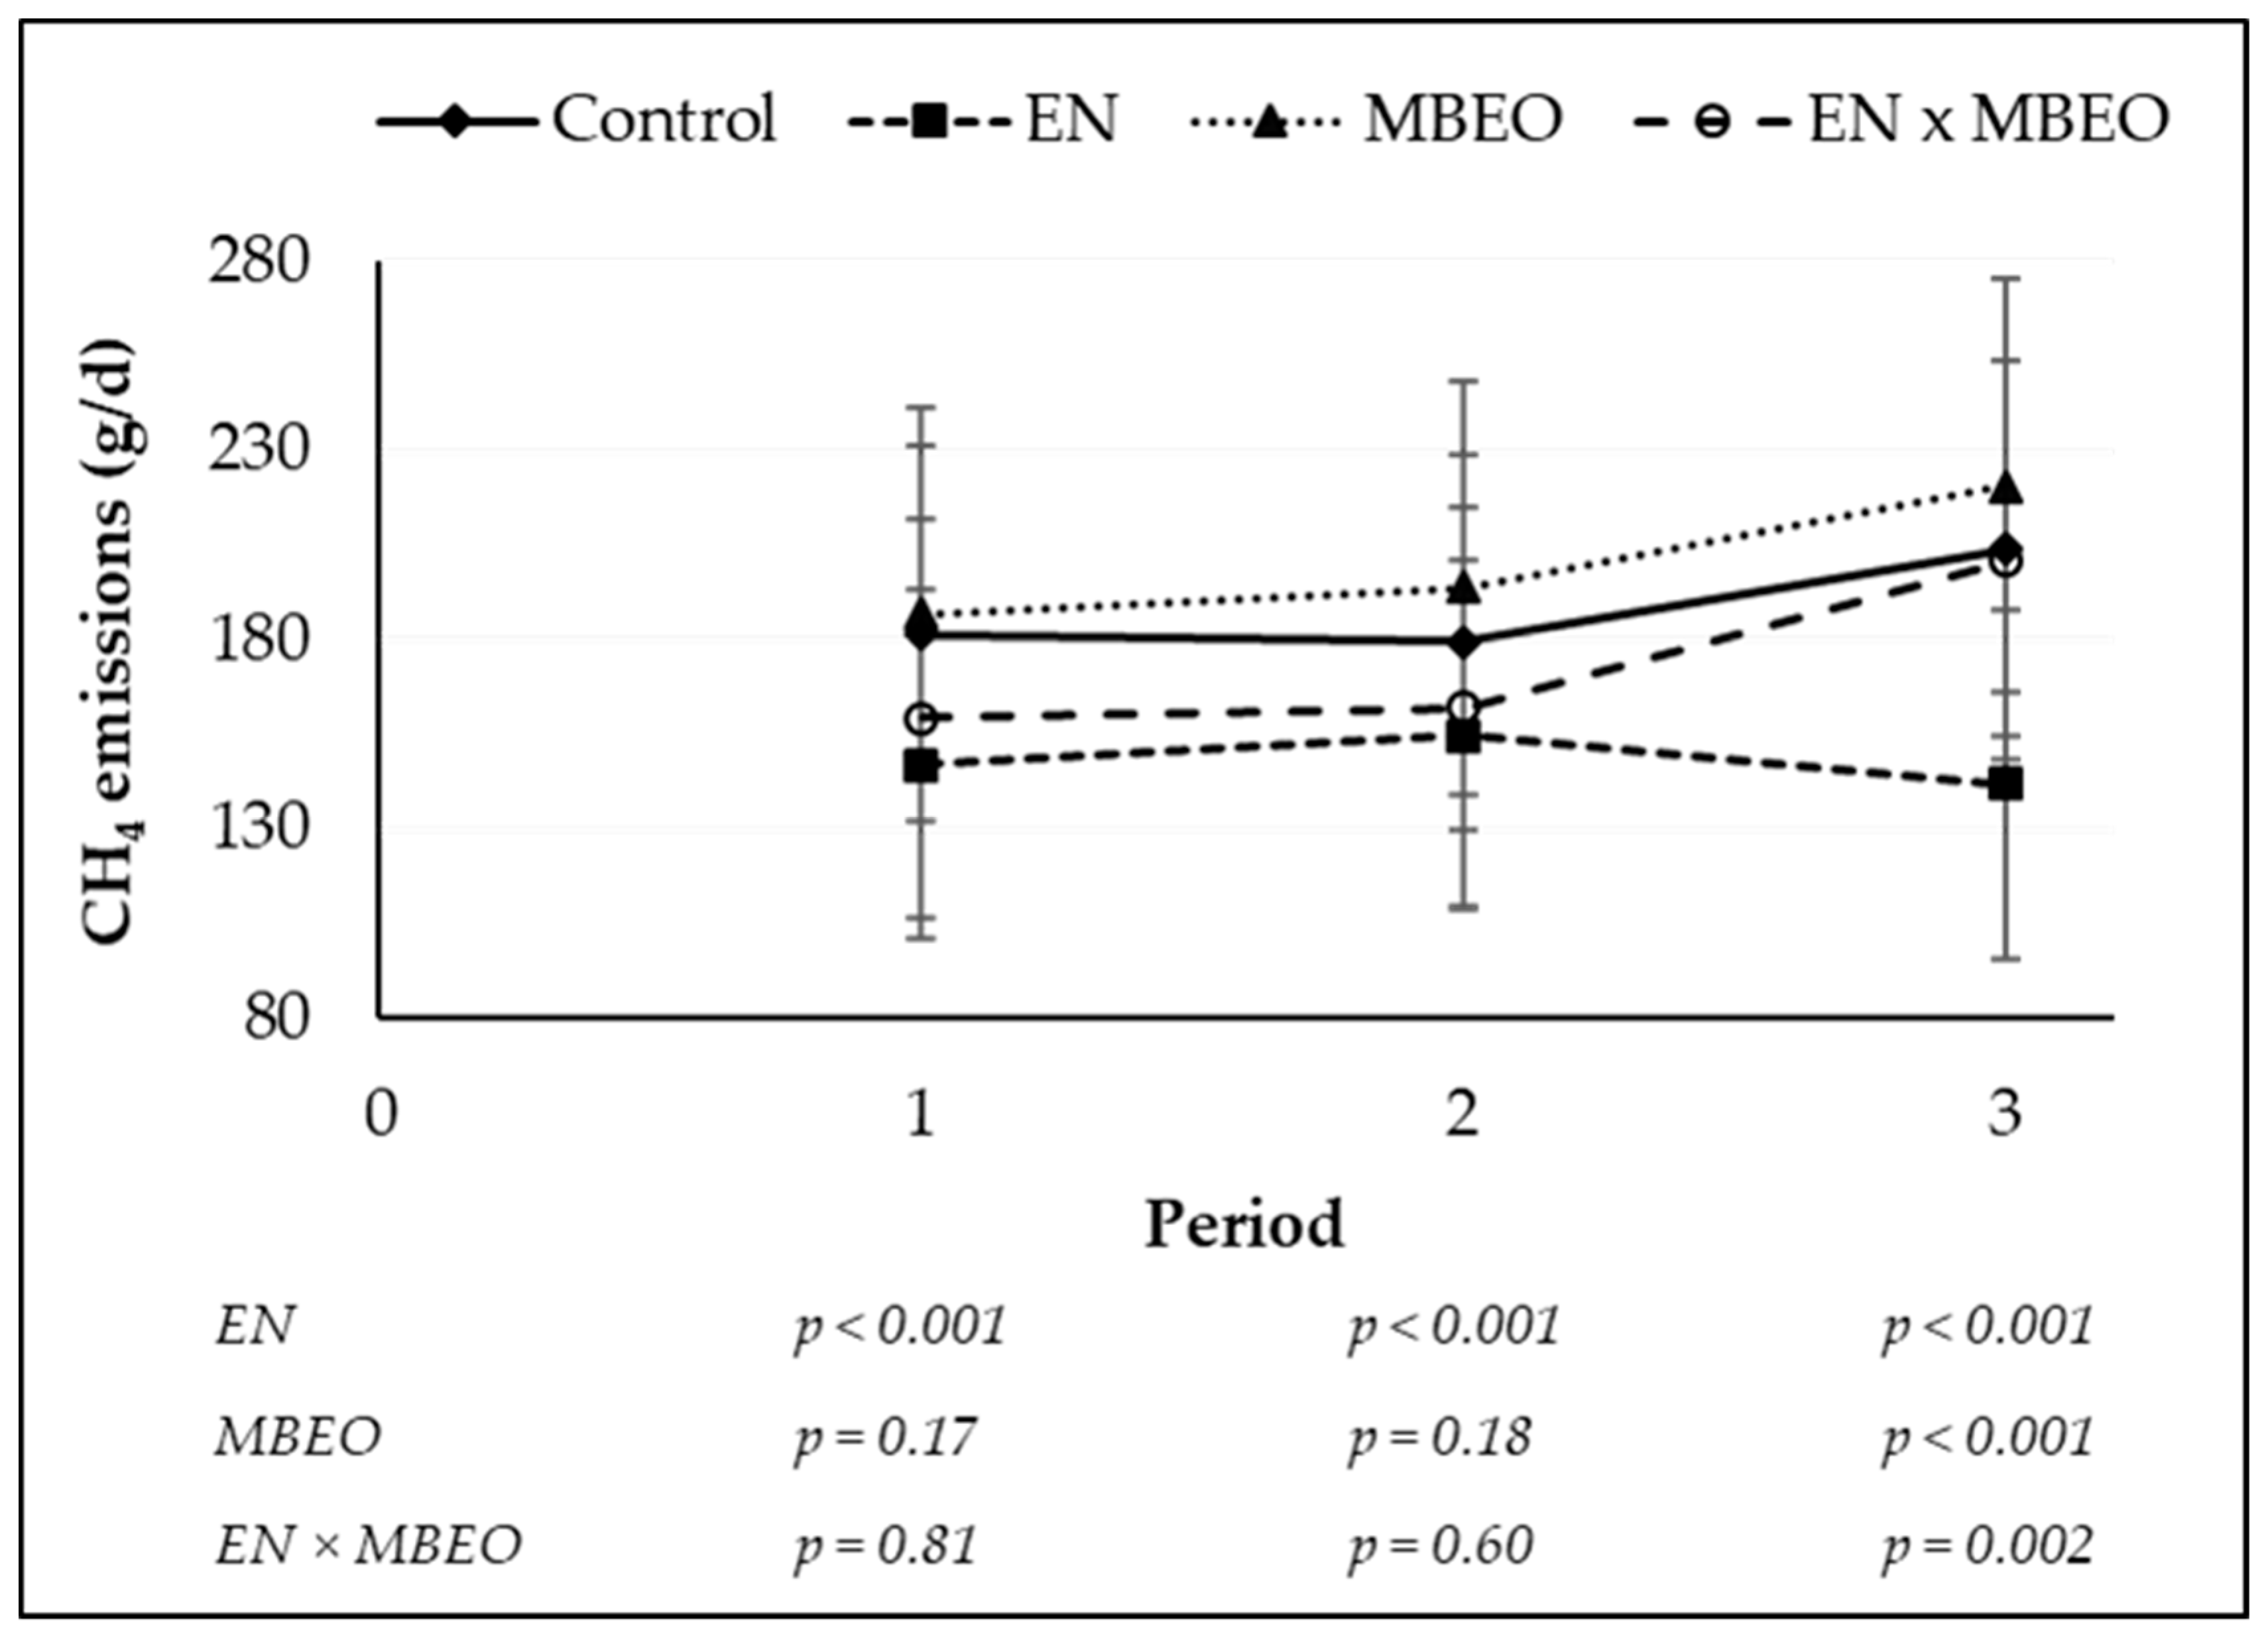
| g/day | 184.14 | 197.69 | 145.89 | 168.78 | 6.533 | <0.0001 | 0.005 | 0.458 | <0.0001 |
| g/kg of DMI | 20.69 | 22.35 | 17.00 | 20.46 | 0.683 | <0.0001 | 0.0002 | 0.174 | <0.0001 |
| % of GE intake | 5.19 | 5.55 | 4.46 | 5.12 | 0.169 | 0.001 | 0.002 | 0.350 | 0.0002 |
| Hydrogen 4 | |||||||||
| g/day | 0.428 c | 0.455 c | 0.734 a | 0.639 b | 0.0265 | <0.0001 | 0.192 | 0.022 | <0.0001 |
| g/kg of DMI | 0.050 | 0.053 | 0.084 | 0.078 | 0.0031 | <0.0001 | 0.571 | 0.123 | <0.0001 |
| Item 2 | −EN 1 | +EN 1 | SEM | p-Value | |||||
|---|---|---|---|---|---|---|---|---|---|
| −MBEO | +MBEO | −MBEO | +MBEO | EN | MBEO | EN × MBEO | Period | ||
| pCO2, mmHg | 40.91 | 39.55 | 41.39 | 41.82 | 0.974 | 0.165 | 0.632 | 0.364 | <0.0001 |
| tCO2, mmol/L 3 | 29.30 | 29.55 | 30.43 | 30.49 | 0.506 | 0.048 | 0.762 | 0.844 | <0.0001 |
| HCO3−, mmol/L 3 | 28.06 | 28.34 | 29.15 | 29.20 | 0.486 | 0.051 | 0.724 | 0.813 | <0.0001 |
| BE, mmol/L 3 | 4.82 | 5.28 | 5.49 | 5.65 | 0.380 | 0.180 | 0.424 | 0.691 | 0.209 |
| pH | 7.48 | 7.50 | 7.48 | 7.49 | 0.008 | 0.857 | 0.334 | 0.200 | 0.0001 |
| pO2, mmHg | 42.79 | 43.03 | 41.88 | 44.03 | 1.127 | 0.968 | 0.294 | 0.402 | 0.0077 |
| SatO2, % total Hb | 78.00 | 79.15 | 77.27 | 78.91 | 1.223 | 0.694 | 0.261 | 0.844 | <0.001 |
| PCV, % | 43.03 | 43.40 | 43.49 | 43.83 | 0.571 | 0.444 | 0.539 | 0.979 | 0.0001 |
| Total Hb, g/dL | 16.15 | 15.98 | 16.42 | 16.29 | 0.210 | 0.170 | 0.479 | 0.934 | <0.0001 |
| MetHb, g/100 g Hb | 0.70 b | 0.87 b | 1.45 a | 1.22 a | 0.053 | <0.0001 | 0.710 | 0.008 | 0.0003 |
| Min., g/100 g Hb | 0.00 | 0.25 | 0.20 | 0.55 | --- | --- | --- | --- | --- |
| Max., g/100 g Hb | 1.95 | 2.53 | 3.40 | 4.10 | --- | --- | --- | --- | --- |
| Plasma | |||||||||
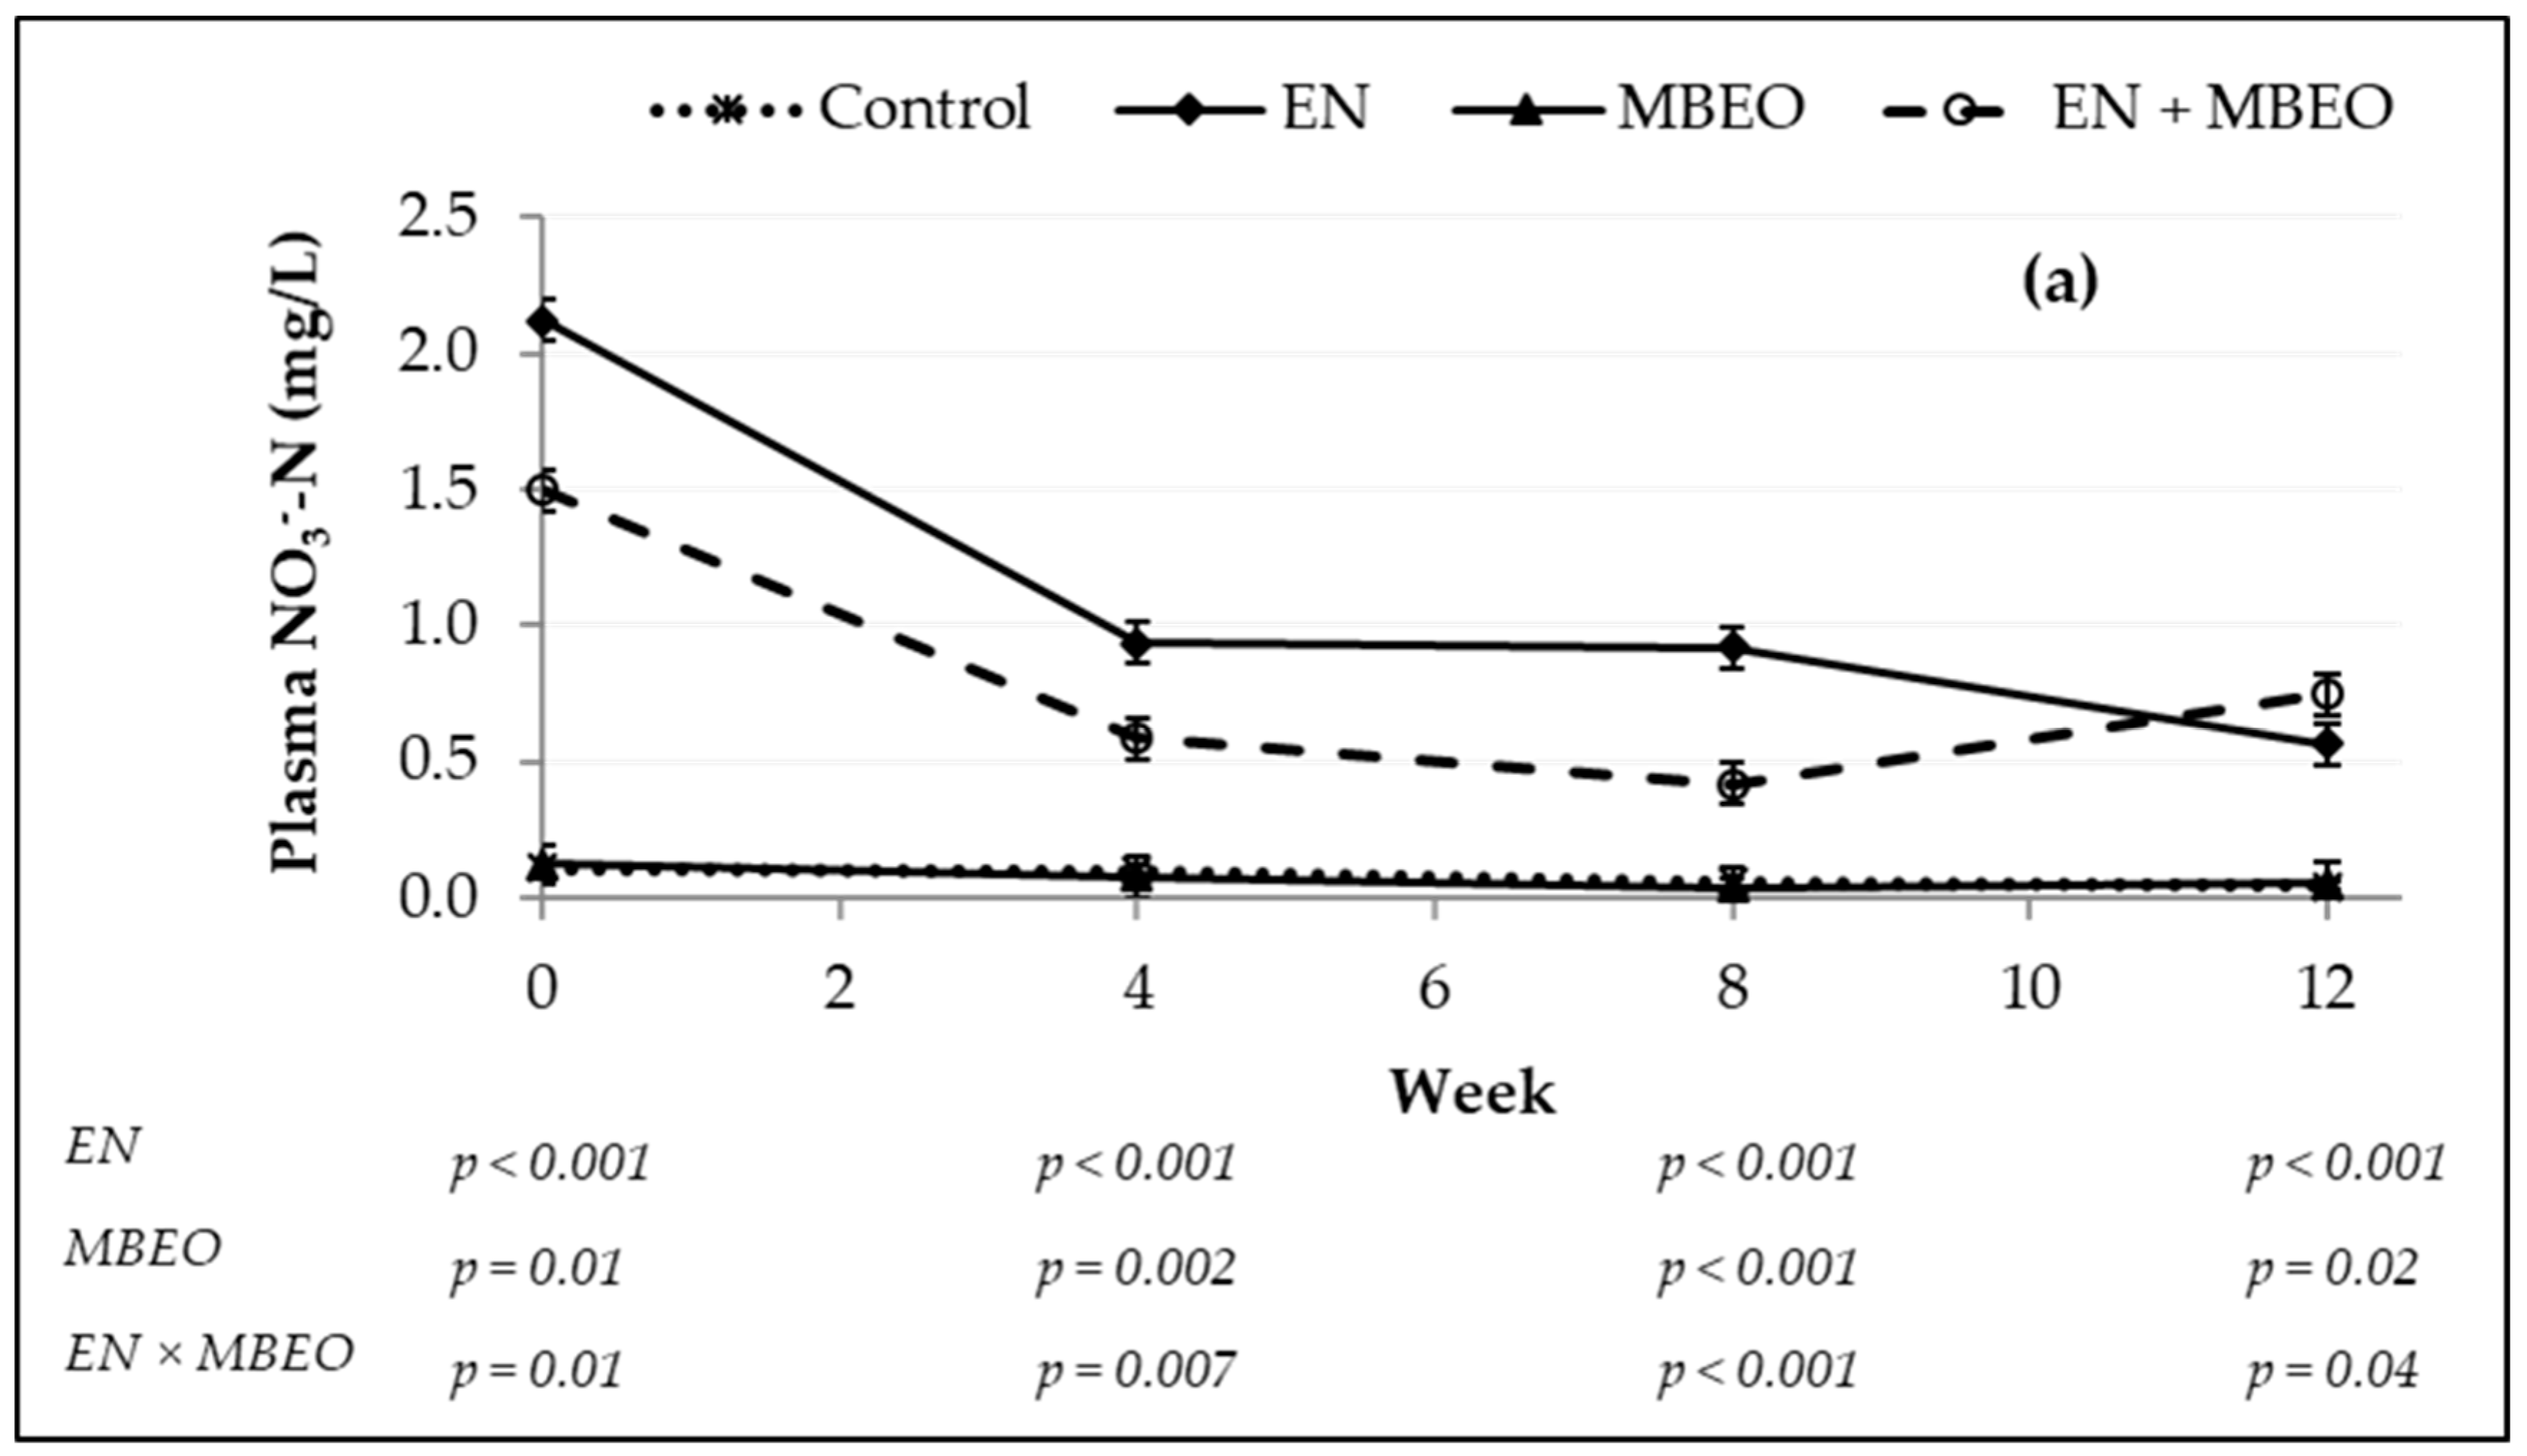
| NO3−-N, mg/L | 0.082 c | 0.076 c | 1.135 a | 0.812 b | 0.052 | <0.0001 | 0.002 | 0.003 | <0.0001 |
| NO2−-N, µg/L | 2.536 | 2.621 | 2.178 | 1.971 | 0.129 | 0.0002 | 0.636 | 0.260 | <0.0001 |
© 2019 by the authors. Licensee MDPI, Basel, Switzerland. This article is an open access article distributed under the terms and conditions of the Creative Commons Attribution (CC BY) license (http://creativecommons.org/licenses/by/4.0/).
Share and Cite
Alemu, A.W.; Romero-Pérez, A.; Araujo, R.C.; Beauchemin, K.A. Effect of Encapsulated Nitrate and Microencapsulated Blend of Essential Oils on Growth Performance and Methane Emissions from Beef Steers Fed Backgrounding Diets. Animals 2019, 9, 21. https://0-doi-org.brum.beds.ac.uk/10.3390/ani9010021
Alemu AW, Romero-Pérez A, Araujo RC, Beauchemin KA. Effect of Encapsulated Nitrate and Microencapsulated Blend of Essential Oils on Growth Performance and Methane Emissions from Beef Steers Fed Backgrounding Diets. Animals. 2019; 9(1):21. https://0-doi-org.brum.beds.ac.uk/10.3390/ani9010021
Chicago/Turabian StyleAlemu, Aklilu W., Atmir Romero-Pérez, Rafael C. Araujo, and Karen A. Beauchemin. 2019. "Effect of Encapsulated Nitrate and Microencapsulated Blend of Essential Oils on Growth Performance and Methane Emissions from Beef Steers Fed Backgrounding Diets" Animals 9, no. 1: 21. https://0-doi-org.brum.beds.ac.uk/10.3390/ani9010021