Article

Genome-Wide Association Study for Milk Fatty Acids in Holstein Cattle Accounting for the DGAT1 Gene Effect

1
Centre for Genetic Improvement of Livestock, Department of Animal Biosciences, University of Guelph, Guelph, Ontario, ON N1G 2W1, Canada
2
Department of Animal Sciences, Purdue University, West Lafayette, IN 47907, USA
3
Lactanet Canada, Guelph, Ontario, ON N1K 1E5, Canada
4
Ontario Genomics, Toronto, Ontario, ON M5G 1M1, Canada
*
Author to whom correspondence should be addressed.
Submission received: 26 October 2019 / Revised: 11 November 2019 / Accepted: 17 November 2019 / Published: 19 November 2019
(This article belongs to the Section Animal Genetics and Genomics)

Abstract

:

Simple Summary

Milk fat content and fatty acid composition are key traits for the dairy industry, as they directly influence consumer acceptance of dairy products and are associated with the chemical-physical characteristics of milk. In order to genetically improve milk fat composition, it is important to understand the biological mechanisms behind the phenotypic variability observed in these traits. In this study, we used a genomic dataset for 6692 animals and over 770,000 genetic markers distributed across the genome. We compared different statistical approaches to better identify the genes associated with milk fatty acid composition in Holstein cattle. Our results suggest that the DGAT1 gene accounts for most of the variability in milk fatty acid composition, and that the PLBD1 and MGST1 genes are important additional candidate genes in Holstein cattle.

Abstract

The identification of genomic regions and candidate genes associated with milk fatty acids contributes to better understand the underlying biology of these traits and enables breeders to modify milk fat composition through genetic selection. The main objectives of this study were: (1) to perform genome-wide association analyses for five groups of milk fatty acids in Holstein cattle using a high-density (777K) SNP panel; and (2) to compare the results of GWAS accounting (or not) for the DGAT1 gene effect as a covariate in the statistical model. The five groups of milk fatty acids analyzed were: (1) saturated (SFA); (2) unsaturated (UFA); (3) short-chain (SCFA); (4) medium-chain (MCFA); and (5) long-chain (LCFA) fatty acids. When DGAT1 was not fitted as a covariate in the model, significant SNPs and candidate genes were identified on BTA5, BTA6, BTA14, BTA16, and BTA19. When fitting the DGAT1 gene in the model, only the MGST1 and PLBD1 genes were identified. Thus, this study suggests that the DGAT1 gene accounts for most of the variability in milk fatty acid composition and the PLBD1 and MGST1 genes are important additional candidate genes in Holstein cattle.

1. Introduction

Milk fat composition is directly related to nutritional aspects of milk and dairy products, which account for up to 30% of the total fat intake in the human diet [1]. Several studies have documented the potential effects of dietary fatty acids on human nutrition, as well as the recommended limit of dietary fat intake [2,3,4]. Milk fat is composed of a complex mixture of lipids, which contains approximately 70% saturated (SFA) and 30% unsaturated (UFA) fatty acids [5,6]. Some fatty acids are essential nutrients for human health, such as phospholipids, that are important constituents of cell membranes [7]. Nonetheless, the high SFA content in milk is often undesirable, as it has been associated with several diseases, including elevated blood cholesterol, obesity, and cardiovascular problems [2,8,9].
Saturated fatty acids and UFA of different chain lengths have ranging heritability estimates. For instance, short- (SCFA) and medium-chain (MCFA) fatty acids have shown moderate to high heritability estimates, while long-chain fatty acids (LCFA) are usually low to moderately heritable [10,11,12]. In addition to genetic parameters, a better understanding of the milk fatty acid synthesis through the identification of important genomic regions and candidate genes can contribute to faster genetic progress for such traits. This can be done by incorporating this information into the genomic prediction of breeding values through methods that account for differential influences of specific genomic regions.
Genome-wide association analysis (GWAS) is the gold-standard method by which to identify genetic variants and genomic regions that are significantly associated with complex traits. It then contributes to the understanding of the genetic architecture and underlying biology of milk fatty acid synthesis. In GWAS, thousands of single nucleotide polymorphisms (SNPs) are tested for association with the trait(s) of interest by exploiting the linkage disequilibrium that exists between the causative mutation and one or more genetic markers [13]. Recent studies have reported that genes located on BTA5, BTA14, and BTA20 are significantly associated with milk fatty acids [8,13,14]. However, except for major genes such as the Diacylglycerol O-acyltransferase 1 (DGAT1), there is a limited consensus on which genes are involved in milk fatty acid composition. This may be related to the fact that major genes can be in linkage disequilibrium with several SNPs, and thus, can hinder the identification of additional genes with minor effects [15]. In this context, fitting the effect of major genes in the statistical model could be an alternative approach to identify additional candidate genes with smaller effects on the trait(s) of interest [16]. Therefore, the objectives of this study were: (1) to perform GWAS for five groups of milk fatty acids in a North American Holstein population using a high-density SNP panel; and (2) to compare the results of GWAS when fitting (or not) the DGAT1 gene effect as a covariate in the GWAS models.

2. Materials and Methods

2.1. Datasets

Five groups of predicted milk fatty acids were analyzed in this study: (1) saturated fatty acids (SFA); (2) unsaturated fatty acids (UFA); (3) short-chain fatty acids (SCFA), which include fatty acids with 4 to 10 Carbons; (4) medium-chain fatty acids (MCFA), which include fatty acids with 12 to 16 Carbons; and (5) long-chain fatty acids (LCFA), which include fatty acids with 17 to 22 Carbons. The fatty acid composition, in g/dL of milk, were predicted based on milk mid-infrared spectroscopy. Details about the prediction equations and phenotypic quality control are fully described in Fleming et al. [17] and Narayana et al. [11]. For all groups of milk fatty acids, 52,592 records from the first lactation of 14,129 Holstein cows were available. A total of 215,233 animals were included in the pedigree.
A total of 3121 animals were genotyped using low- or medium-density SNP panels (7K, 8K, 15K, 20K, or 30K), 3676 animals using a 50K SNP panel, and 1115 animals using a high-density (HD; 777K) SNP panel. Animals genotyped with the low- or medium-density panels were initially imputed to the 50K panel and, thereafter, all 50K genotypes were imputed to 777K. Genotype imputation was performed using the FImpute software (Guelph, ON, Canada) [18]. Imputation accuracy from 50K to 777K in this population is greater than 0.95, as reported in Larmer et al. [19]. After the genotype imputation process, SNPs with a call rate less than 0.95, a minor allele frequency (MAF) less than 0.01, significant deviation of the expected Hardy-Weinberg equilibrium (p < 10−6), and SNPs in high linkage disequilibrium (r2 > 0.90) were removed. A total of 6692 genotyped animals and 610,272 SNPs distributed across the 29 bovine autosomes (BTA) remained for further analyses.

2.2. Variance Components, Breeding Value Estimation and Deregression Analyses

Preliminary analyses (including descriptive statistics, normality test, and test of fixed effects to be included in the statistical model) were performed using the UNIVARIATE and GLM procedures in the Statistical Analysis System (SAS) software (version 9.2, SAS Institute, Inc. 2011, Cary, NC, USA). Variance components and estimated breeding values (EBVs) were calculated using the ASReml v3.0 software (Hemel Hempstead, UK) [20]. The statistical model used can be described as follows:
y = Xb + Za + Wpe + Qhy + e
where y is the vector of phenotypic records, b is the vector of fixed effects, a is the vector of random animal additive genetic effects, pe is a vector of random permanent environment effects, hy is a vector of random herd-year effects, and e is a vector of random residual effects. X, Z, W, and Q are the corresponding incidence matrices. The significant (p < 0.05) fixed effects that were included in the final statistical model are herd-test day, season of calving, and days in milk (DIM; split into 12 equidistant classes). It was assumed that E(y) = Xb, a ~ N(0, A σ a 2 ), pe ~ N(0, I σ p 2 ), hy ~ N(0, I σ hy 2 ), and e ~ N(0, I σ e 2 ), where A is the pedigree-based relationship matrix, I is an identity matrix, and σ a 2 , σ p 2 , σ hy 2 , and σ e 2 are the additive genetic, permanent environment, herd-year, and residual variances, respectively.
Estimated breeding values were deregressed using the VanRaden and Wiggans method [21] in order to avoid the double-counting of information and to increase the variability of EBVs [22]. Thereafter, deregressed EBVs were used as pseudophenotypes in the GWAS. Pseudophenotypes were used, as not all phenotyped animals were genotyped.

2.3. Genome-Wide Association Analyses

The GWAS were carried out based on single-SNP regression, using the allele substitution model implemented in the SNP1101 software [23]. In order to contrast the results of GWAS fitting (or not) the DGAT1 gene as covariate in the GWAS model, two approaches were compared for each milk fatty acid trait. The first model is described as follows:
y = 1μ + Sm + Zu + e
where y is the vector of deregressed EBVs, µ is the population mean, m is the fixed effect of the SNP genotype, u is the vector of random genomic effects (in order to account for the polygenic effect), 1 is a vector of ones, S and Z are the incidence matrices related to m and u, respectively, and e is the vector of residuals. It was assumed that u ~ N(0, G σ u 2 ), where G is the genomic relationship matrix, and σ u 2 is the genomic variance (i.e., the genetic variance estimated based on the G matrix). The same G matrix was used in all analyses performed in this study (i.e., markers located in the genomic regions under examination were not removed when constructing the G matrix), due to the small impact that it would have in the GWAS analyses [24]. Therefore, G was created as proposed by [25]:
G = 0.95 WW 2 K = 1 K p K ( 1 p K ) + 0.05 A
where W = MP, in which M contains the centered genotypes (i.e., −1, 0 and 1 to represent AA, AB and BB, respectively), P contains the allele frequency for SNP k (pk) in its kth column, expressed as 2(pK − 0.5), and 2 K = 1 K p K ( 1 p K ) is a scaling parameter.
The second GWAS model considered the SNP with the highest allele substitution effect in the DGAT1 gene region as a fixed effect. The top SNP was determined based on the first model. The DGAT1 gene was previously reported as the major gene for milk fat yield and milk fatty acids in Italian Simmental and Holstein [8]. Therefore, the top SNP was fitted as a covariate in the second model as follows:
y = 1μ + DGAT1 + Sm + Zu + e
where DGAT1 is the fixed effect that accounts for the allele substitution effect of the SNP related to the DGAT1 gene. All the other terms in the model were previously defined above. In order to account for multiple testing, a genome-wide false discovered rate (FDR) was applied to indicate significant association between SNP and each fatty acid group. The SNPs were considered for further analyses when the q-value of the genome-wise FDR was lower than 1, 5, or 10%. The markers above the 5% threshold were interpreted as suggestive SNPs.

2.4. Candidate Genes, Enrichment and Biology Pathway Analysis

Significant SNPs were used to identify candidate genes, using the NGS-SNP collection of command-line scripts [26]. Thereafter, gene networks and biological pathways were identified using the KEGG (www.genome.jp/kegg/genes.html) and Gene Cards (https://www.genecards.org) tools.

3. Results

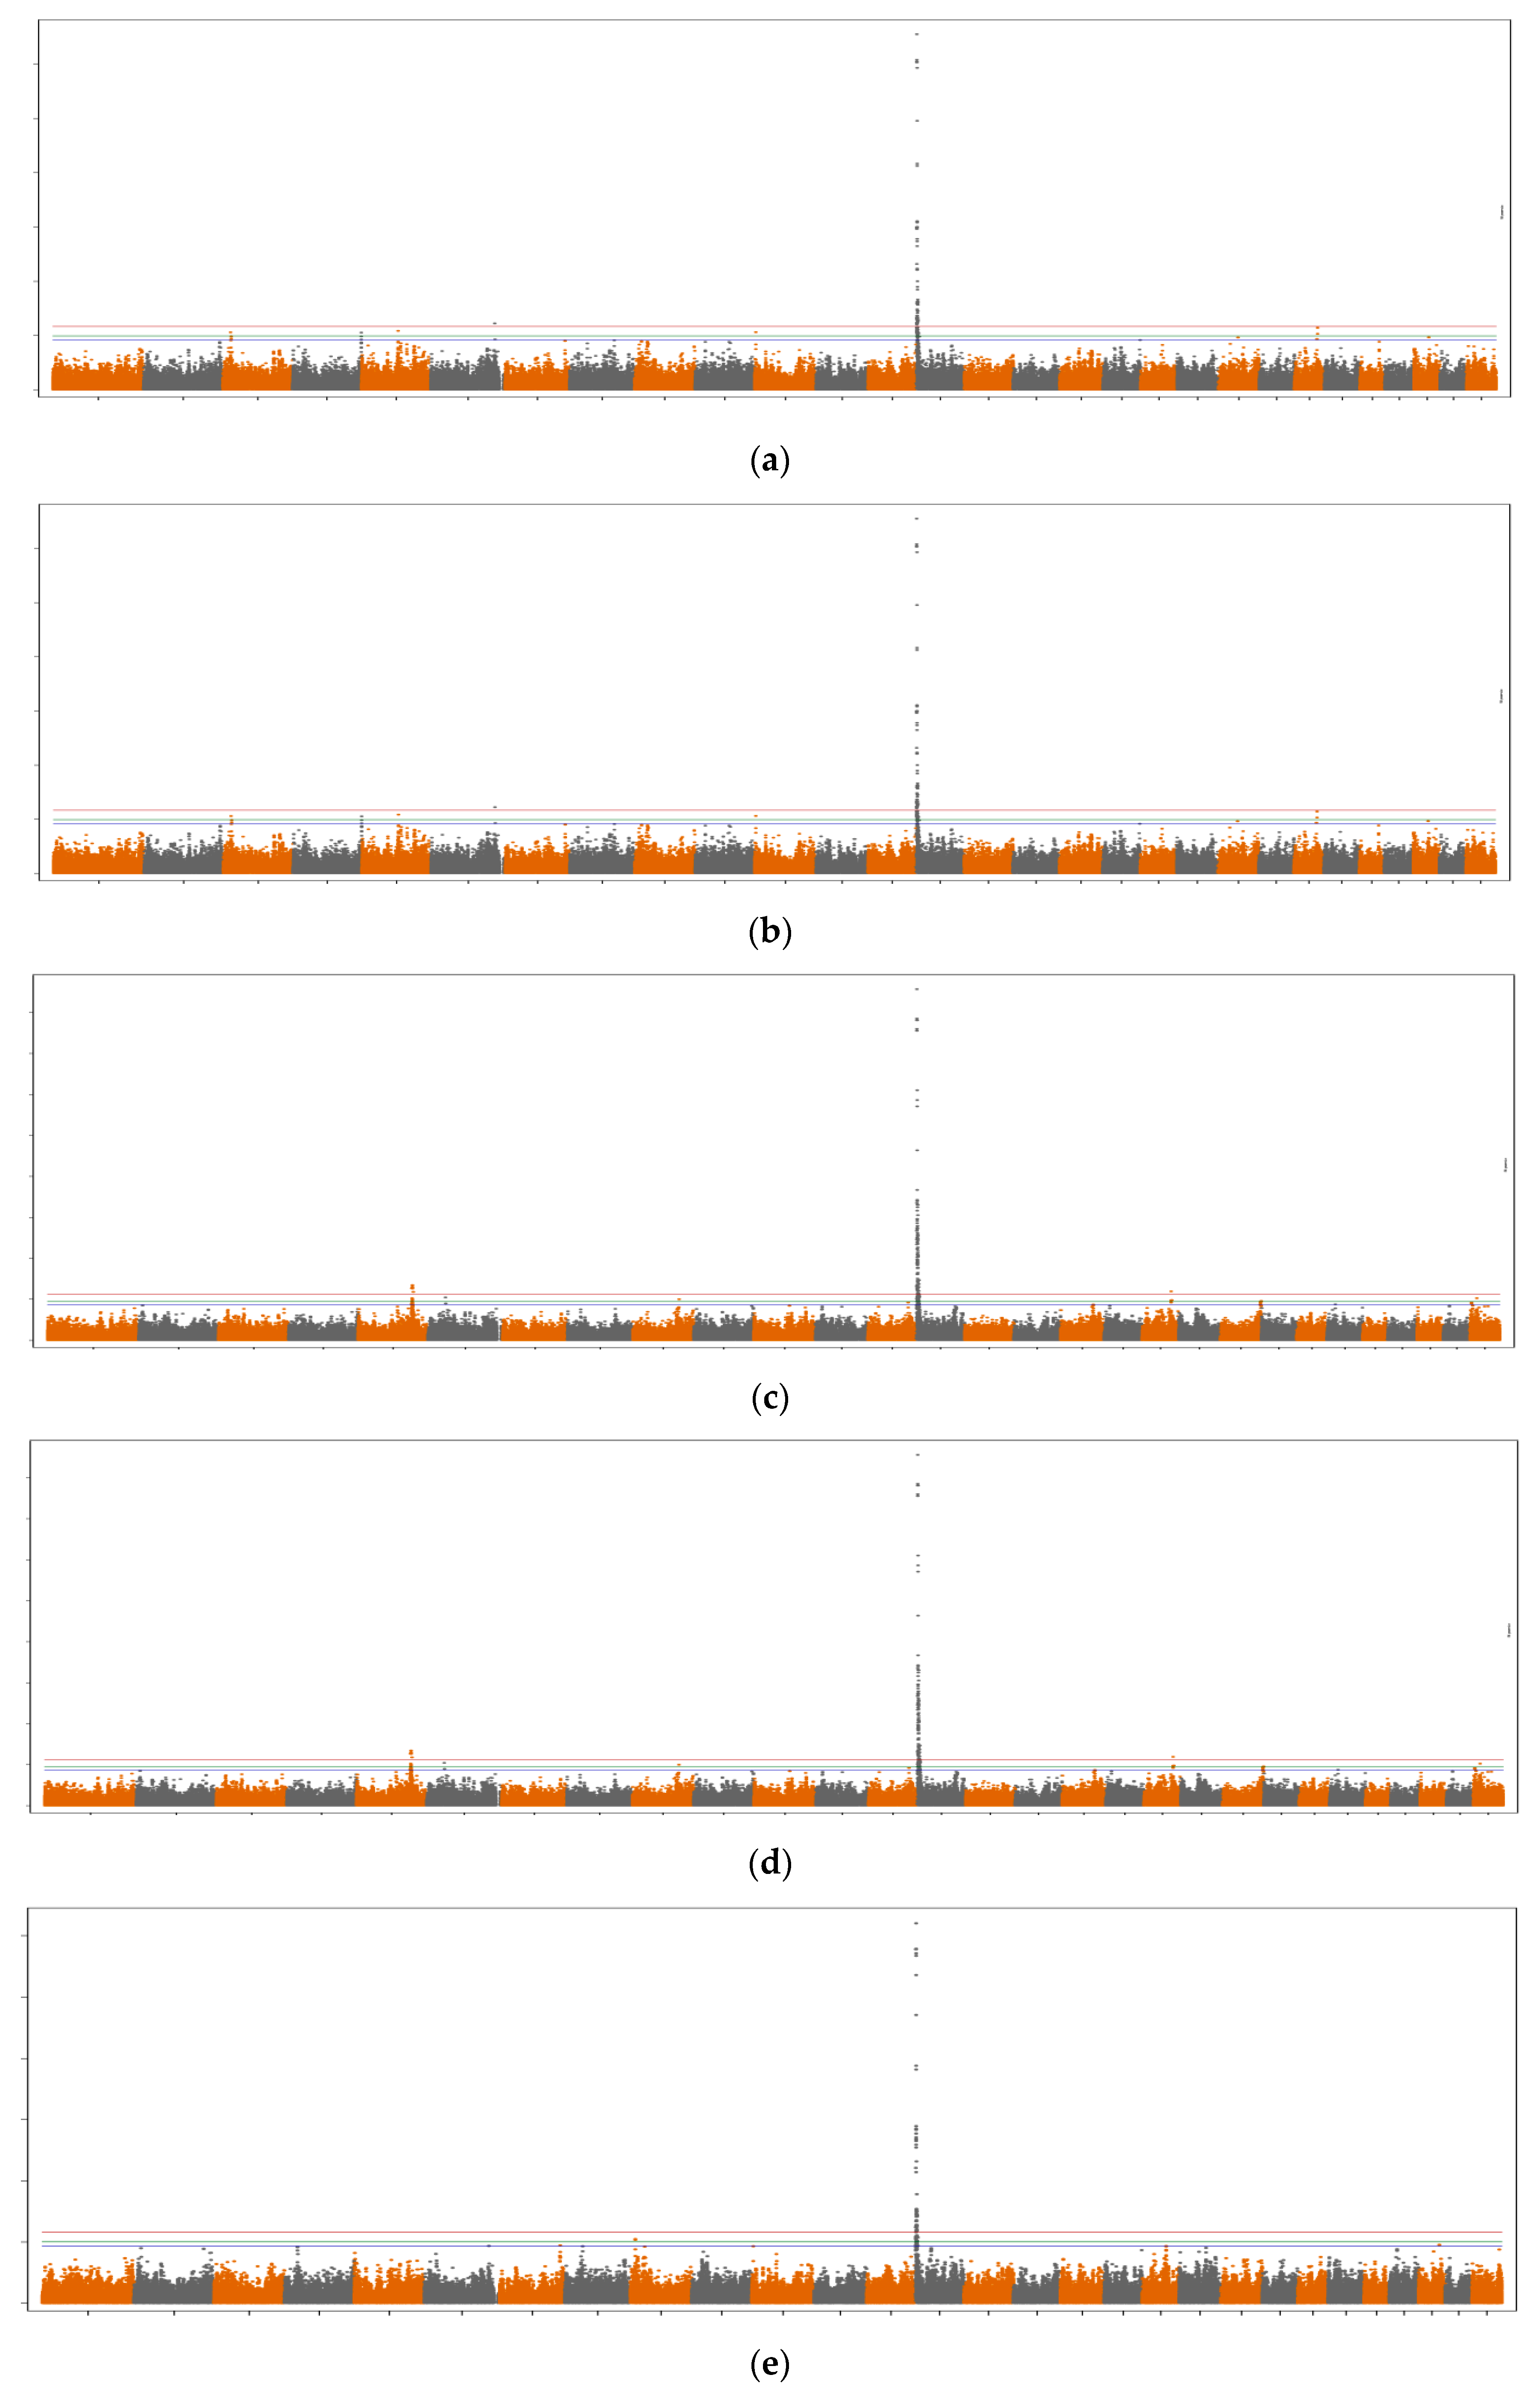
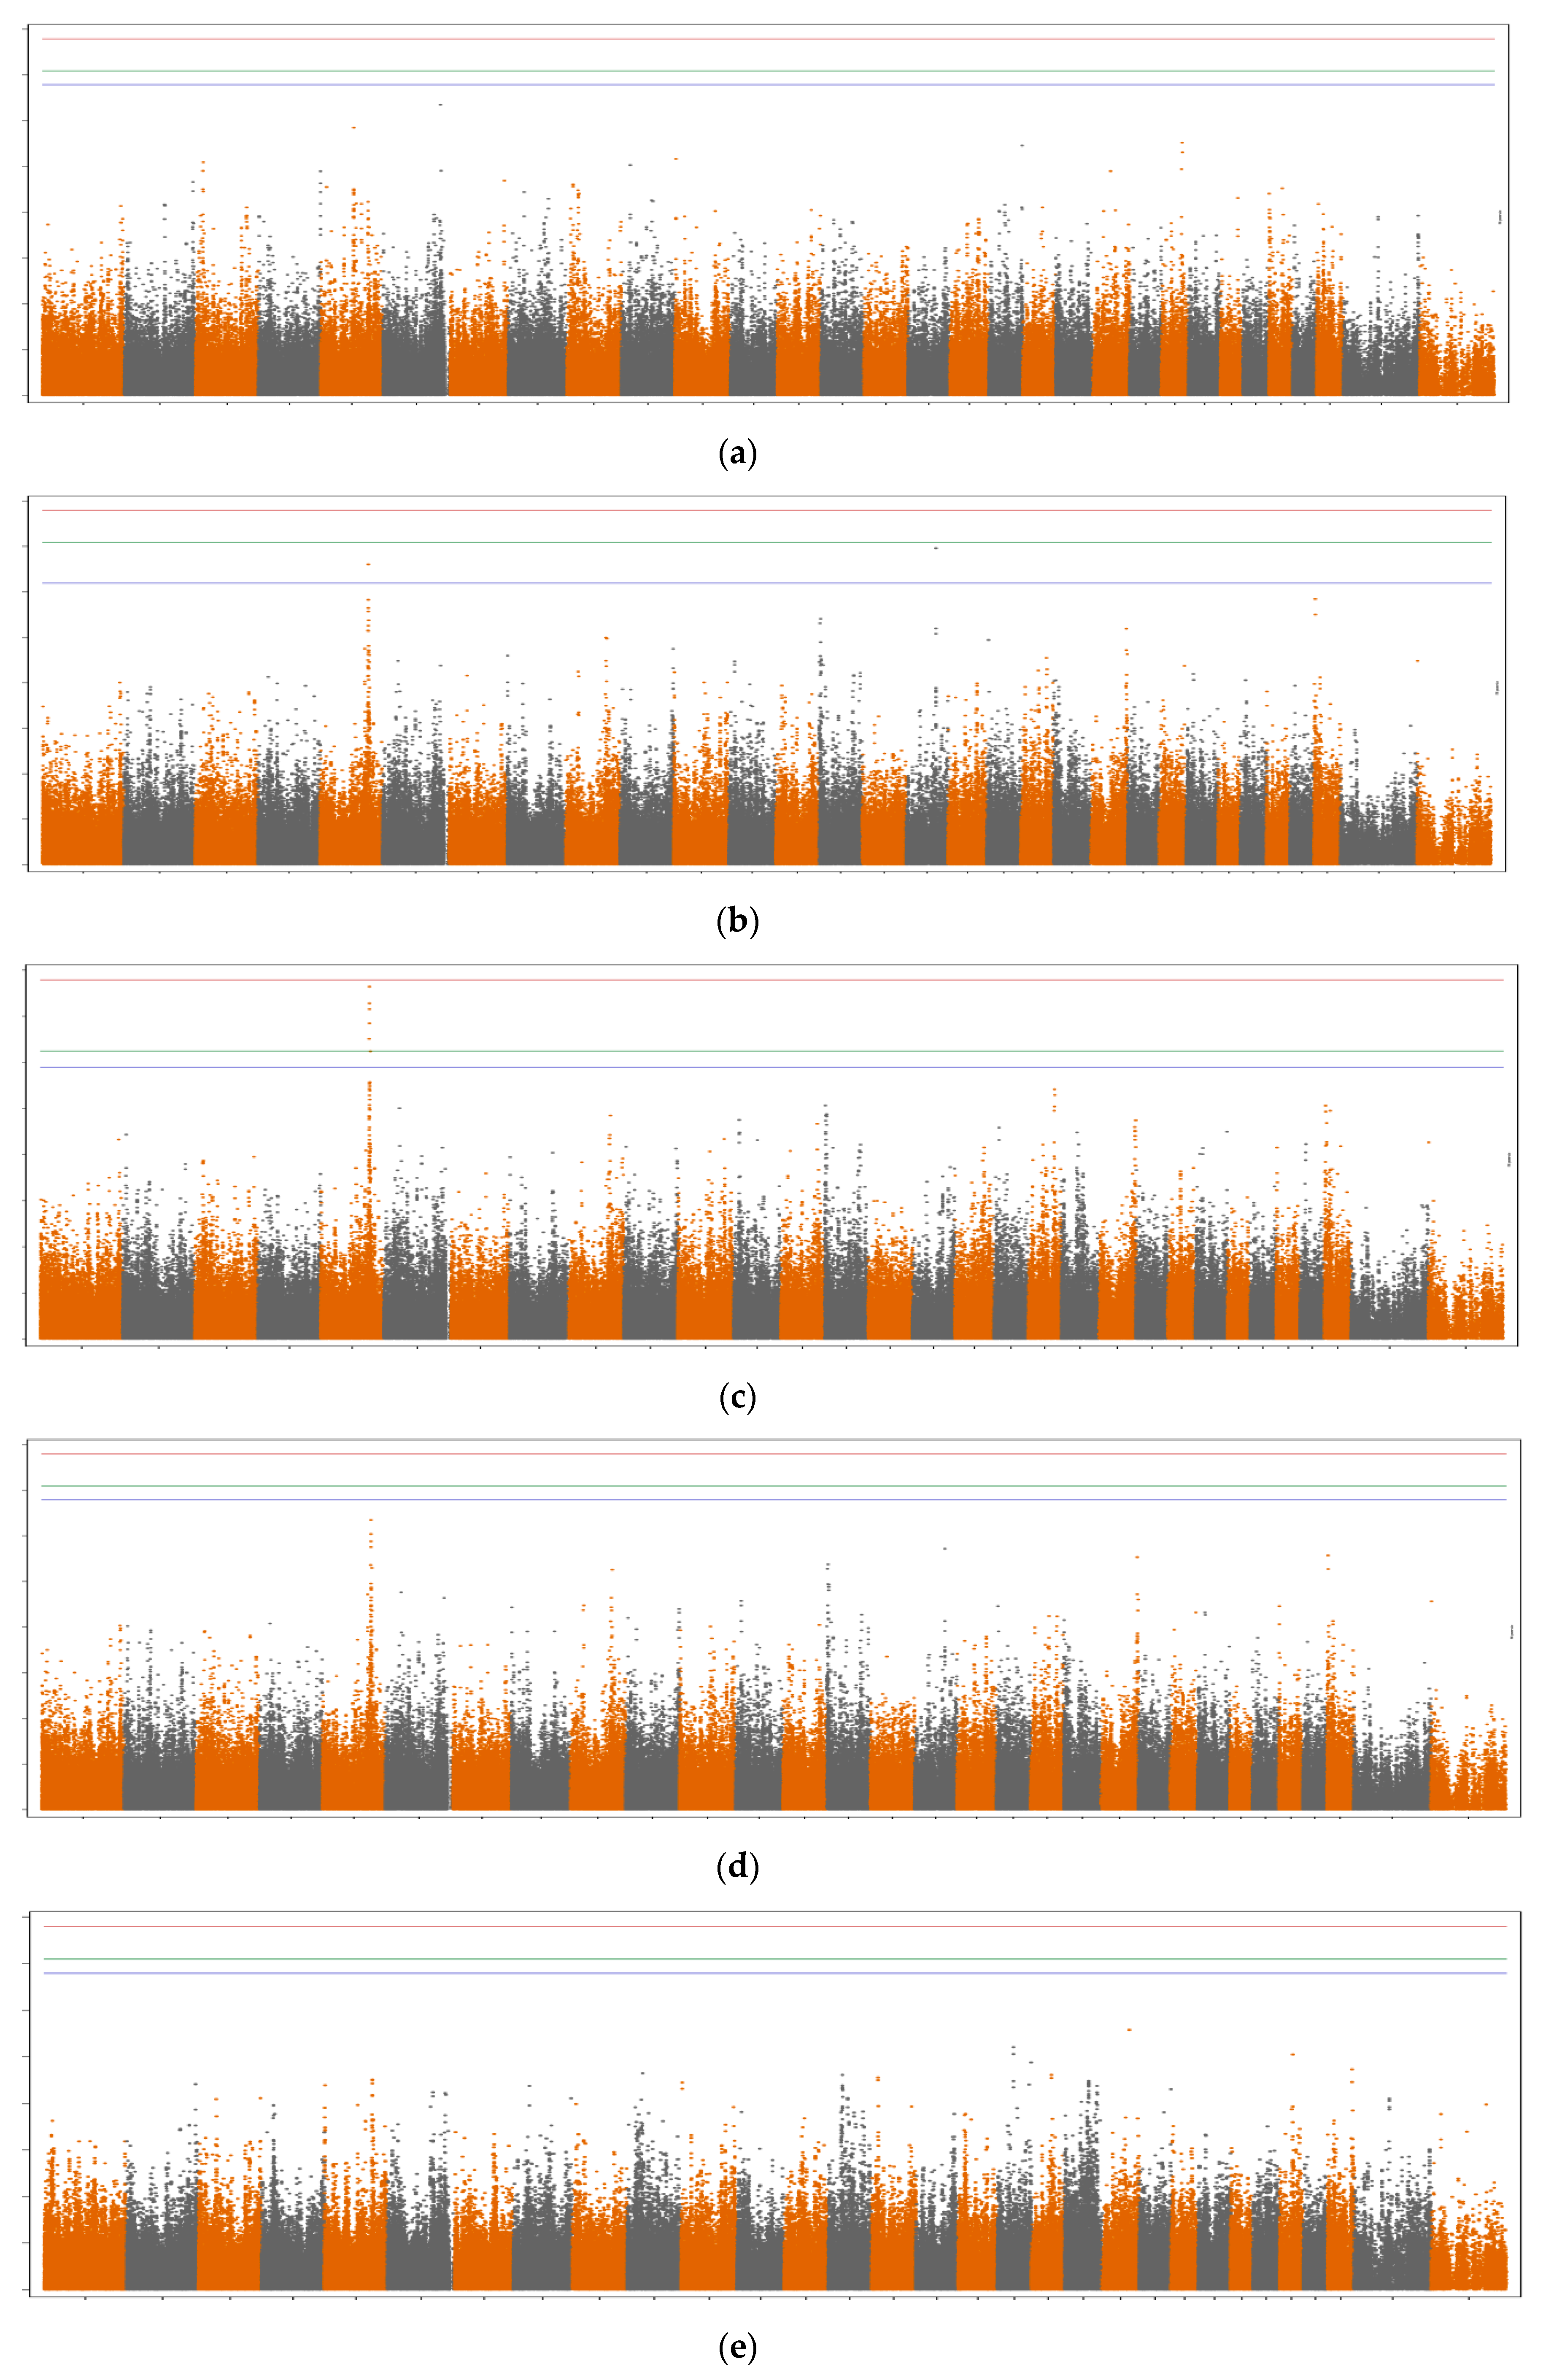
3.1. SNP Variances and Number of Significant SNPs

The numbers of significant SNPs for the different groups of milk fatty acids, either fitting or not the DGAT1 gene in the statistical model, are shown in Table 1. A higher number of SNPs was significant when the DGAT1 gene was not fitted independently in the model, for all groups of milk fatty acids. When fitting the DGAT1 gene as a covariate in the model, only a few significant SNPs were identified, especially for MCFA and SCFA. A ranking of SNP variances when not fitting (model 1) or fitting (model 2) the DGAT1 gene as a covariate in the statistical model is presented in the Supplementary File 1. In general, large differences in rank were observed between the two models, and larger variances for the significant SNPs were estimated by model 1 compared to model 2.

3.2. Genomic Regions and Candidate Genes

Manhattan plots for the different groups of fatty acids are shown in Figure 1 and Figure 2, when not fitting and fitting the DGAT1 gene as a covariate in the GWAS model, respectively. A similar pattern was observed between the different Manhattan plots, even though the majority of SNPs were not significant when DGAT1 was fitted as a covariate in the model (Figure 2).
When not fitting the DGAT1 gene as a fixed effect in the model, significant SNPs were found on BTA5, BTA6, BTA14, BTA16, and BTA19. This is likely due to the fact that the candidate genes located in these regions are involved in similar pathways as the DGAT1 gene. A high proportion of overlapping regions was observed among the different groups of fatty acids. For instance, an important region on BTA14, which includes the DGAT1, FOXH1, and CYHR1 genes, was associated with all fatty acid groups. Moreover, an important region was detected on BTA5 for the majority of fatty acid groups, which includes the MGST1 and PLBD1 genes. In addition, not fitting the DGAT1 gene as a covariate in the statistical model allowed us to identify new, significant regions on BTA16 (unknown protein) and BTA19 (including the LOC101909618 gene). However, when the DGAT1 gene was fitted in the model, significant genomic regions were found only on BTA5 and BTA16 for specific groups of milk fatty acids.
LCFA: As shown in Table 1 and Figure 1a, several significant SNPs were found for LCFA when the DGAT1 gene effect was not fitted in the statistical model. In summary, significant SNPs were located on BTA14, close to the DGAT1, FOXH1, and CYHR1 genes. In addition, a small significant region on BTA6 was found around position 111,458,055 bp, but no annotated genes were retrieved. No significant SNPs were found for LCFA when fitting the DGAT1 gene in the statistical model (Table 1 and Figure 2a).
MCFA: Several significant SNPs were found for MCFA when the DGAT1 gene was not fitted in the statistical model (Table 1 and Figure 1b). The significant SNPs were located on BTA14 (close to the DGAT1, FOXH1, and CYHR1 genes), BTA5 (close to the MGST1 gene), and BTA16 (unknown protein). SNPs located in similar regions on BTA5 and BTA16 were significant or suggestive (FDR=10%) when fitting the DGAT1 gene effect as a covariate in the model (Table 1 and Figure 2b).
SCFA: When not fitting the DGAT1 gene in the model, several SNPs located on BTA14 were significant (Table 1 and Figure 1c). These SNPs were located in a region similar to that found for LCFA and MCFA, and were within or close to the DGAT1, FOXH1, and CYHR1 genes. In addition, five SNPs on BTA5 were significant, which were within or harbored the MGST1 and PLBD1 genes. One significant SNP was also identified on BTA19, within the LOC101909618 gene, when not fitting the DGAT1 gene in the model. When fitting the DGAT1 gene in the model, four SNPs on BTA5 were significant (FDR = 5%), within or close to the MGST1 gene (Table 1 and Figure 2c).
SFA: Similar to LCFA, SCFA, and MCFA, several SNPs located on BTA14 were significant (Table 1 and Figure 1d) when the DGAT1 gene was not fitted as a covariate in the statistical model. In addition, three significant SNPs were located on BTA5 (within or close to the MGST1 gene), and one significant SNP was located on BTA16, around the region 93,945,655 bp (unknown protein). No significant SNPs were found for SFA when fitting the DGAT1 gene in the model (Table 1 and Figure 2d).
UFA: A lower number of significant SNPs distributed across a smaller region was found for UFA when compared to the other groups of milk fatty acids. These significant SNPs were located on BTA14, in a region close to the DGAT1, FOXH1, and CYHR1 genes (Table 1 and Figure 1e) when the DGAT1 gene effect was not fitted as a covariate in the model. No significant SNPs were found for UFA when fitting the DGAT1 gene in the model (Table 1 and Figure 2e).

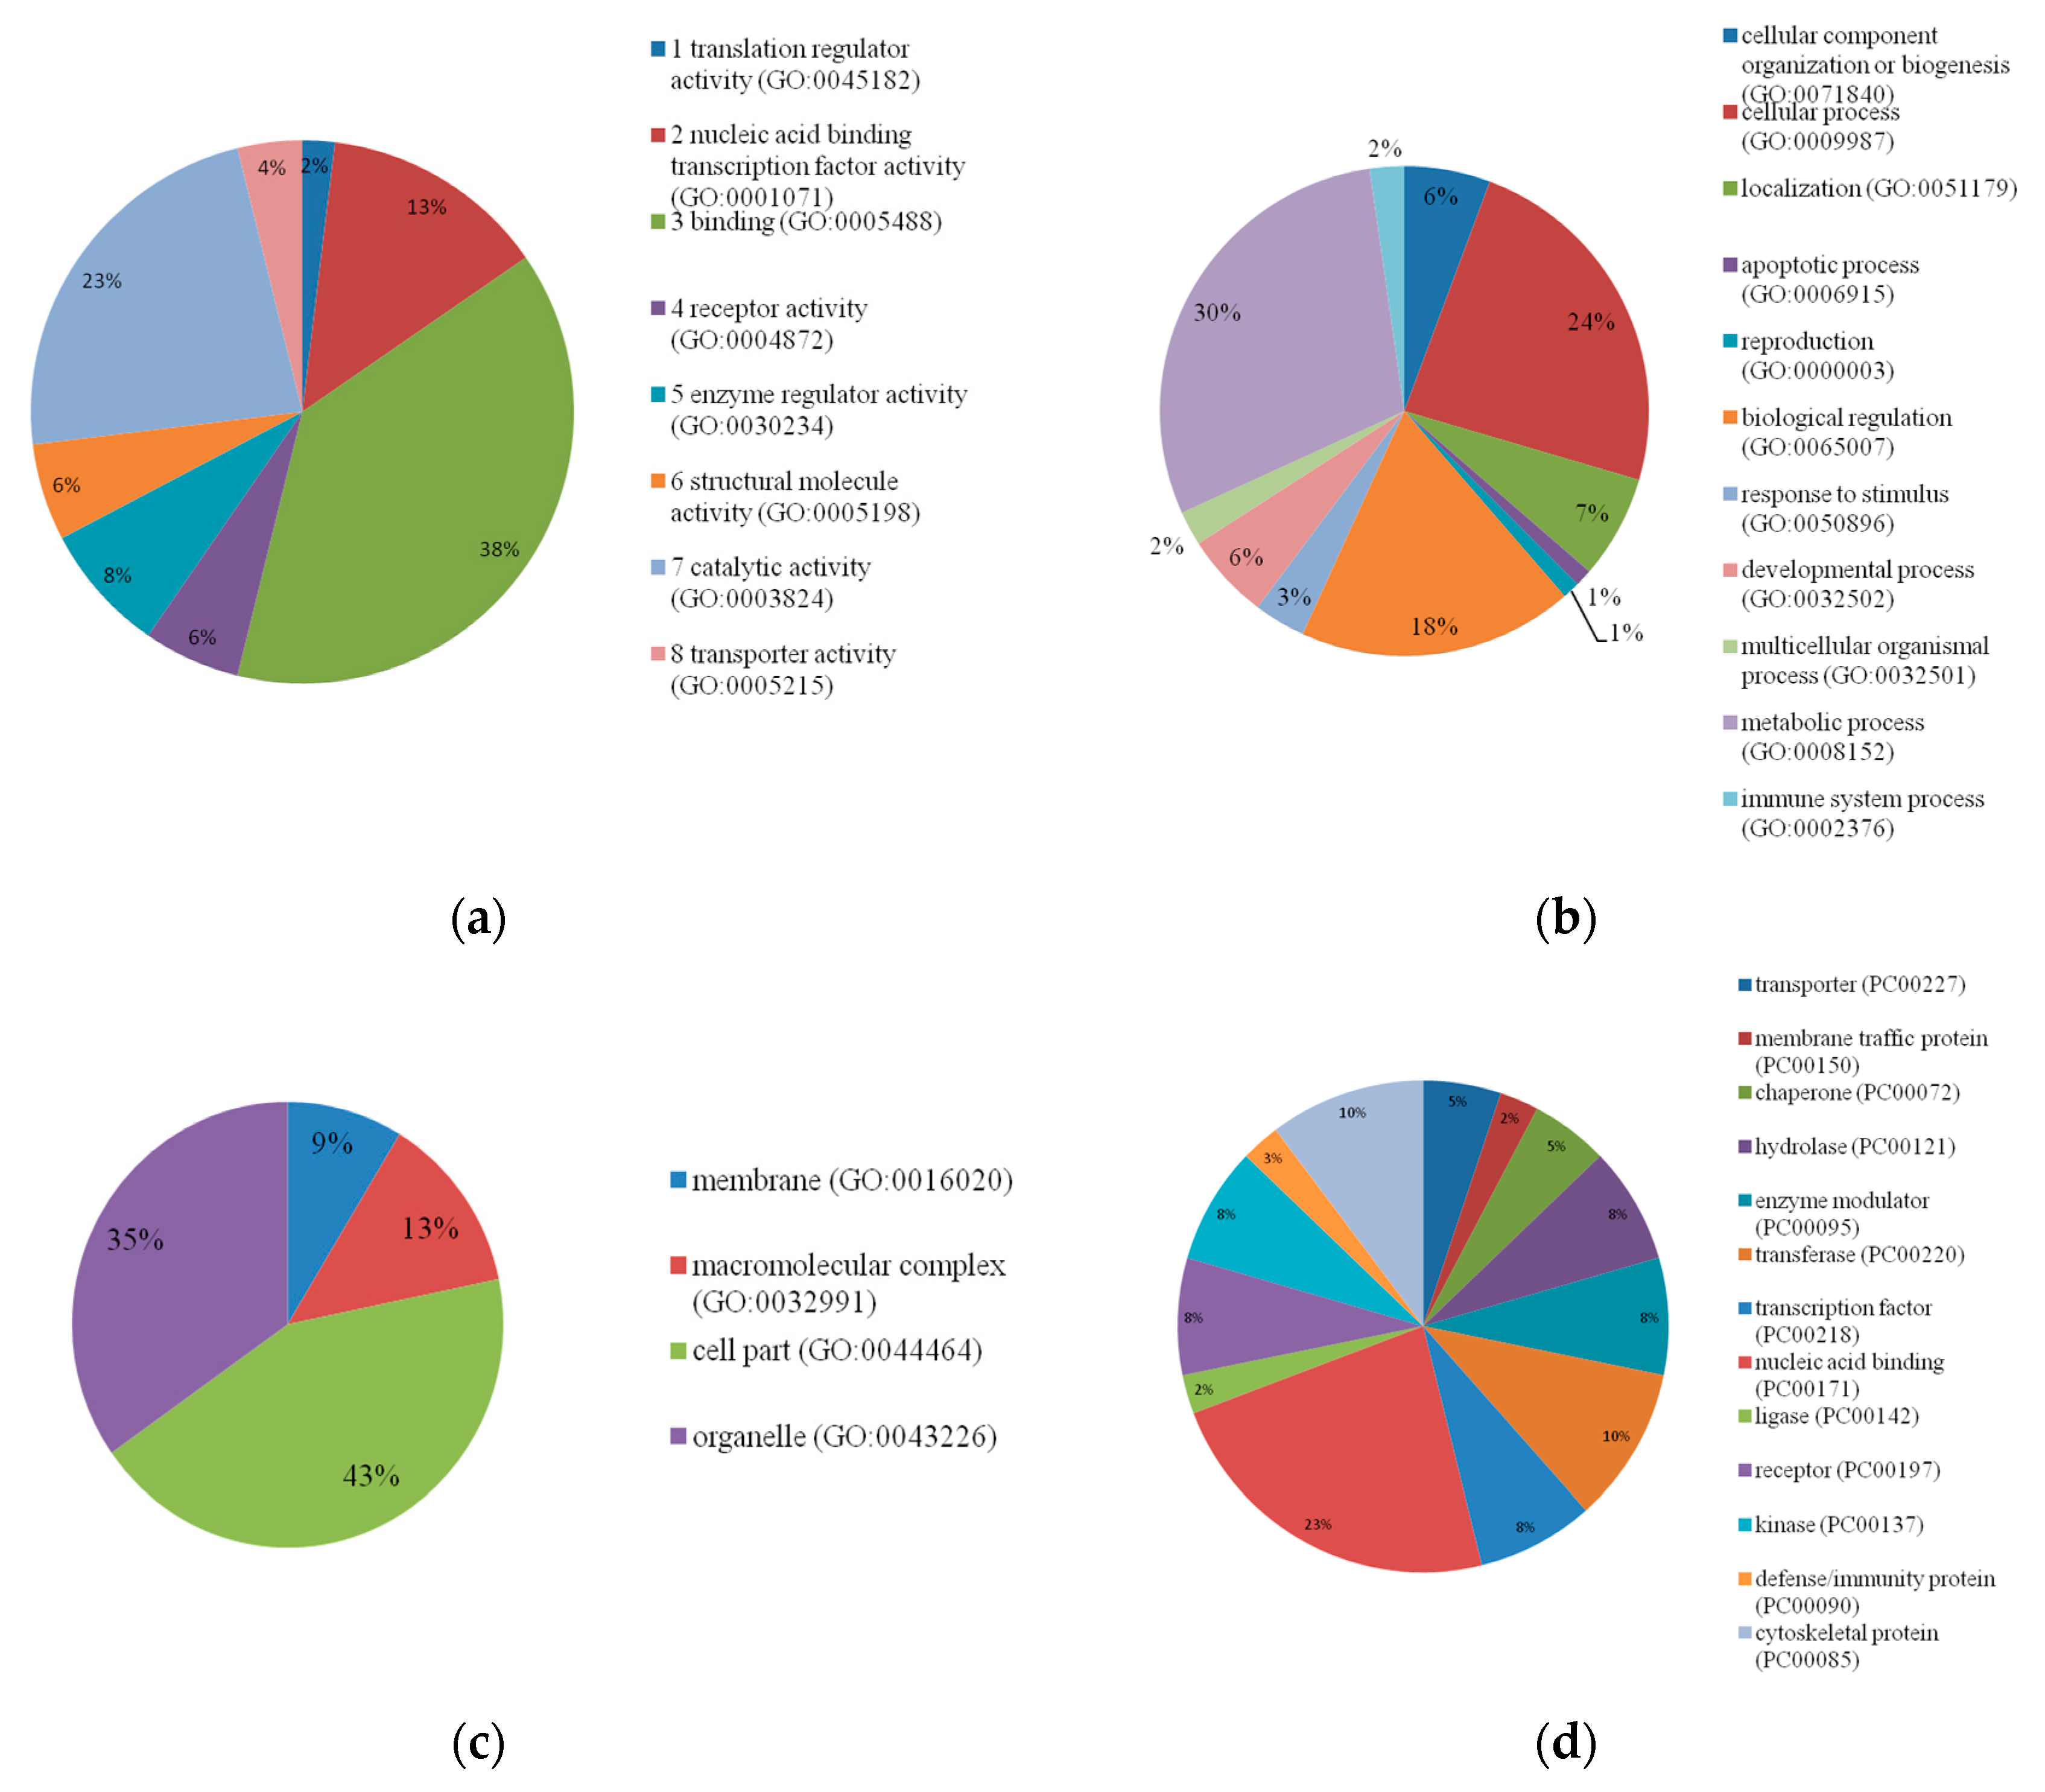
3.3. Candidate Genes and Functional Analyses

Figure 3 shows the functional analyses for the candidate genes. In summary, the candidate genes were clustered into four different functional categories: molecular function, biological process, cellular component, and protein class. The categorization related to molecular function showed that the majority of profiles (38%) are involved in cellular binding. With regards to the activities related to biological process, three clusters were more evident: biological regulation (18%), cellular process (24%), and metabolic process (30%). For the cellular component, two main clusters were detected: organelle (35%) and membrane component (43%). The functional profiles related to protein class resulted in several small clusters. The largest one was involved in nucleic acid binding (23%).

4. Discussion

Genome-wide association analyses were performed for five groups of milk fatty acids in Holstein cattle. The majority of candidate genes identified are located on BTA14, which is in agreement with Li et al. [27] and Palombo et al. [8], who studied milk fatty acids in Chinese and Italian Holstein cattle, respectively. Most of the significant genomic regions found in this study are located on BTA14 within or harboring the DGAT1, FOXH1, and CYHR1 genes. The DGAT1 gene is well known due to its strong association with milk production traits, especially milk fat [27,28,29]. The CYP11B1 gene, which is a CYHR1 paralogous [30], has been reported to be associated with milk fat in buffalo [31]. Also, Boleckova et al. [32] reported that CYP11B1 is a functional gene for milk production traits in cattle. However, the authors suggested that the effect of this gene may be affected by a strong linkage disequilibrium with polymorphisms in the DGAT1 gene, which has been well described in the literature [33].
Even though the FOXH1 gene is involved in lipid metabolism, FOXO1 (FOX family gene) is an insulin-sensitive DNA binding transcription factor that can alter the synthesis or stability of the MAF1 protein. The MAF1 gene (MAF1 homolog, negative regulator of RNA polymerase III) is a protein coding that is important to the regulation of mammalian intracellular lipids [34,35]. The MAF family member proteins regulate tissue-specific gene expression and cell differentiation in a wide variety of tissues. For instance, it has been shown that the MAFA gene (V-maf avian musculoaponeurotic fibrosarcoma oncogene homolog) may be involved in adipocyte differentiation and lipid metabolism regulation [36].
Including the DGAT1 gene in the GWAS model confirmed important genomic regions associated with milk fatty acids. In addition, this approach highlighted the importance of accounting for major genes in GWAS, as the majority of significant effects were found for genes located in the BTA14, close to the DGAT1 gene. Therefore, these results suggest that the FOXH1 and CYHR1 genes may be redundant signals of the DGAT1 gene. These findings are in agreement with those of Capomaccio et al. [16], who also reported redundant signals of the DGAT1 gene while studying milk production traits in three Italian cattle breeds.
Among the significant overlapping genomic regions found while fitting or not the DGAT1 gene in the statistical model are the regions on BTA5, which are associated with the MGST1 and PLBD1 genes. In humans, the MGST1 gene (Microsomal glutathione transferase) metabolizes hydrophobic substrates, such as phospholipid hydroperoxides and halogenated hydrocarbons [37], i.e., lipid and fatty acid hydroperoxides, lipid peroxidation products, and oxidized phospholipids are MGST1 substrates [38]. In addition, rat liver microsomal glutathione transferase has the capacity to inhibit lipid peroxidation [39], and MGST1 can detoxify several lipid peroxidation products as well as fatty acids [40]. However, the potential impact on milk lipid synthesis and/or secretion is still unknown. Previous studies have reported that the PLBD1 gene (Bos taurus phospholipase B domain containing 1) is related to milk fat percentage in cattle [41]. Hayes et al. [33] also identified a region on BTA5 as significant while analyzing milk production traits including the SNP related to the DGAT1 in the statistical model. Our findings indicate that PLBD1 and MGST1 may be important additional genes affecting milk fat composition in Holstein cattle. These candidate genes should be sequenced and further validated in independent populations. In addition to the genetic component influencing milk fatty acid composition, it is worth highlighting the fact that there are complementary alternatives to further alter milk fatty acid components, including through dietary changes [42,43,44].

5. Conclusions

Fitting the DGAT1 gene effect as a covariate in the GWAS model confirmed some candidate genes previously associated with milk fatty acids in Holstein cattle, and allowed us to identify candidate genes in addition to the DGAT1 gene, by removing redundant signals. The PLBD1 and MGST1 genes located on BTA5 are additional candidate genes affecting some groups of milk fatty acids, especially short- and medium-chain milk fatty acids. This study provides essential information on candidate genes and genomic regions affecting milk fatty acids in Holstein dairy cattle, and will serve as a basis for future studies on this regard.

Supplementary Materials

The following are available online at https://0-www-mdpi-com.brum.beds.ac.uk/2076-2615/9/11/997/s1, Table S1: Ranking of SNP variances when not fitting (model 1) or fitting (model 2) the DGAT1 gene as a covariate in the genome-wide association analyses.

Author Contributions

Conceptualization, F.M. and F.S.S.; Methodology, V.A.R.C. and F.S.S.; formal analysis, V.A.R.C., H.R.O., L.B., A.F. and S.L.; resources, A.F., F.S.S.; data curation, V.A.R.C., A.F., and S.L.; writing—original draft preparation, V.A.R.C., H.R.O., and L.F.B.; writing—review and editing, H.R.O., L.F.B., F.M., A.F., F.S.S.; supervision, F.S.S. and F.M.; project administration, F.M. and F.S.S.; funding acquisition, F.M. and F.S.S.

Funding

Funding for the collection of milk spectra was provided by Agriculture and Agri-Food Canada and by additional contributions from Dairy Farmers of Canada, the Canadian Dairy Network (Ottawa, ON, Canada), and the Canadian Dairy Commission under the Agri-Science Clusters Initiative (Dairy Farmers of Canada, Agriculture and Agri-Food Canada, the Canadian Dairy Network, and the Canadian Dairy Commission). The first author also acknowledges the financial support (post-doctoral scholarship) received from the National Council for Scientific and Technological Development (CNPq).

Conflicts of Interest

The authors declare no conflict of interest. The funders had no role in the design of the study; in the collection, analyses, or interpretation of data; in the writing of the manuscript, or in the decision to publish the results.

Data Availability Statement

The data that support the findings of this study are presented in the paper and in the Supplementary file. The raw data cannot be made available, as it is property of the North American Holstein cattle producers and this information is commercially sensitive.

References

  1. Mansbridge, R.J.; Blake, J.S. Nutritional factors affecting the fatty acid composition of bovine milk. Br. J. Nutr. 1997, 78, S37–S47. [Google Scholar] [CrossRef]
  2. Brouwer, I.A.; Wanders, A.J.; Katan, M.B. Trans fatty acids and cardiovascular health: Research completed? Eur. J. Clin. Nutr. 2013, 67, 541. [Google Scholar] [CrossRef]
  3. Connor, W.E. Importance of n-3 fatty acids in health and disease. Am. J. Clin. Nutr. 2000, 71, 171S–175S. [Google Scholar] [CrossRef]
  4. FAO-WHO, Fats and Fatty Acids in Human Nutrition, Report of an Expert Consultation. FAO Food Nutrition Paper. # 91. 2008. Available online: http://www.fao.org/3/a-i1953e.pdf (accessed on 14 January 2019).
  5. Grummer, R.R. Effect of Feed on the Composition of Milk Fat. J. Dairy Sci. 1991, 74, 3244–3257. [Google Scholar] [CrossRef]
  6. Pereira, P.C. Milk nutritional composition and its role in human health. Nutrition 2014, 30, 619–627. [Google Scholar] [CrossRef] [PubMed]
  7. Spector, A.A.; Yorek, M.A. Membrane lipid composition and cellular function. J. Lipid Res. 1985, 26, 1015–1035. [Google Scholar] [PubMed]
  8. Palombo, V.; Milanesi, M.; Sgorlon, S.; Capomaccio, S.; Mele, M.; Nicolazzi, E.; Ajmone-Marsan, P.; Pilla, F.; Stefanon, B.; D’Andrea, M. Genome-wide association study of milk fatty acid composition in Italian Simmental and Italian Holstein cows using single nucleotide polymorphism arrays. J. Dairy Sci. 2018, 101, 11004–11019. [Google Scholar] [CrossRef]
  9. Pulina, G.; Francesconi, A.H.D.; Stefanon, B.; Sevi, A.; Calamari, L.; Lacetera, N.; Dell’Orto, V.; Pilla, F.; Marsan, P.A.; Mele, M.; et al. Sustainable ruminant production to help feed the planet. Ital. J. Anim. Sci. 2017, 16, 140–171. [Google Scholar] [CrossRef]
  10. Buitenhuis, B.; Janss, L.L.; Poulsen, N.A.; Larsen, L.B.; Larsen, M.K.; Sørensen, P. Genome-wide association and biological pathway analysis for milk-fat composition in Danish Holstein and Danish Jersey cattle. BMC Genom. 2014, 15, 1112. [Google Scholar] [CrossRef]
  11. Narayana, S.G.; Schenkel, F.S.; Fleming, A.; Koeck, A.; Malchiodi, F.; Jamrozik, J.; Johnston, J.; Sargolzaei, M.; Miglior, F. Genetic analysis of groups of mid-infrared predicted fatty acids in milk. J. Dairy Sci. 2017, 100, 4731–4744. [Google Scholar] [CrossRef]
  12. Tullo, E.; Frigo, E.; Rossoni, A.; Finocchiaro, R.; Serra, M.; Rizzi, N.; Samorè, A.B.; Canavesi, F.; Strillacci, M.G.; Maria Prinsen, R.T.M.; et al. Genetic parameters of fatty acids in Italian Brown Swiss and Holstein cows. Ital. J. Anim. Sci. 2014, 13, 3208. [Google Scholar] [CrossRef]
  13. Bouwman, A.C.; Visker, M.H.P.W.; van Arendonk, J.A.M.; Bovenhuis, H. Genomic regions associated with bovine milk fatty acids in both summer and winter milk samples. BMC Genet. 2012, 13, 93. [Google Scholar] [CrossRef] [PubMed]
  14. Hayes, B.; Goddard, M. Genome-wide association and genomic selection in animal breeding. Genome 2010, 53, 876–883. [Google Scholar] [CrossRef] [PubMed]
  15. Marques, E.; Schnabel, R.D.; Stothard, P.; Kolbehdari, D.; Wang, Z.; Taylor, J.F.; Moore, S.S. High density linkage disequilibrium maps of chromosome 14 in Holstein and Angus cattle. BMC Genet. 2008, 9, 45. [Google Scholar] [CrossRef] [PubMed]
  16. Capomaccio, S.; Milanesi, M.; Bomba, L.; Cappelli, K.; Nicolazzi, E.L.; Williams, J.L.; Ajmone-Marsan, P.; Stefanon, B. Searching new signals for production traits through gene-based association analysis in three Italian cattle breeds. Anim. Genet. 2015, 46, 361–370. [Google Scholar] [CrossRef] [PubMed]
  17. Fleming, A.; Schenkel, F.S.; Chen, J.; Malchiodi, F.; Bonfatti, V.; Ali, R.A.; Mallard, B.; Corredig, M.; Miglior, F. Prediction of milk fatty acid content with mid-infrared spectroscopy in Canadian dairy cattle using differently distributed model development sets. J. Dairy Sci. 2017, 100, 5073–5081. [Google Scholar] [CrossRef]
  18. Sargolzaei, M.; Chesnais, J.P.; Schenkel, F.S. FImpute—An efficient imputation algorithm for dairy cattle populations. J. Dairy Sci. 2011, 94, 421. [Google Scholar]
  19. Larmer, S.; Sargolzaei, M.; Schenkel, F. Extent of linkage disequilibrium, consistency of gametic phase, and imputation accuracy within and across Canadian dairy breeds. J. Dairy Sci. 2014, 97, 3128–3141. [Google Scholar] [CrossRef]
  20. Gilmour, A.R.; Gogel, B.J.; Cullis, B.R.; Thompson, R. ASReml User Guide Release 3.0; VSN Int. Ltd.: Hemel Hempstead, UK, 2009. [Google Scholar] [CrossRef]
  21. VanRaden, P.M.; Wiggans, G.R. Derivation, Calculation, and Use of National Animal Model Information. J. Dairy Sci. 1991, 74, 2737–2746. [Google Scholar] [CrossRef]
  22. Oliveira, H.R.; Silva, F.F.; Brito, L.F.; Guarini, A.R.; Jamrozik, J.; Schenkel, F.S. Comparing deregression methods for genomic prediction of test-day traits in dairy cattle. J. Anim. Breed. Genet. 2018, 135, 97–106. [Google Scholar] [CrossRef]
  23. Sargolzaei, M. SNP1101 User’s Guide. Version 1.0; HiggsGene Solutions Inc.: Guelph, ON, Canada, 2014. [Google Scholar]
  24. Gianola, D.; Fariello, M.I.; Naya, H.; Schön, C.C. Genome-wide association studies with a genomic relationship matrix: A case study with wheat and arabidopsis. G3: Genes, Genomes, Genet. 2016, 6, 3241–3256. [Google Scholar] [CrossRef] [PubMed]
  25. VanRaden, P.M. Efficient Methods to Compute Genomic Predictions. J. Dairy Sci. 2008, 91, 4414–4423. [Google Scholar] [CrossRef] [PubMed]
  26. Li, C.; Sun, D.; Zhang, S.; Wang, S.; Wu, X.; Zhang, Q.; Liu, L.; Li, Y.; Qiao, L. Genome wide association study identifies 20 novel promising genes associated with milk fatty acid traits in Chinese Holstein. PLoS ONE 2014, 9, e96186. [Google Scholar] [CrossRef] [PubMed]
  27. Nayeri, S.; Sargolzaei, M.; Abo-Ismail, M.K.; May, N.; Miller, S.P.; Schenkel, F.; Moore, S.S.; Stothard, P. Genome-wide association for milk production and female fertility traits in Canadian dairy Holstein cattle. BMC Genet. 2016, 17, 75. [Google Scholar] [CrossRef]
  28. Oliveira, H.R.; Cant, J.P.; Brito, L.F.; Feitosa, F.L.B.; Chud, T.C.S.; Fonseca, P.A.S.; Jamrozik, J.; Silva, F.F.; Lourenco, D.A.L.; Schenkel, F.S. Genome-wide association for milk production traits and somatic cell score in different lactation stages of Ayrshire, Holstein, and Jersey dairy cattle. J. Dairy Sci. 2019, 102, 8159–8174. [Google Scholar] [CrossRef]
  29. Oliveira, H.R.; Lourenco, D.A.L.; Masuda, Y.; Misztal, I.; Tsuruta, S.; Jamrozik, J.; Brito, L.F.; Silva, F.F.; Cant, J.P.; Schenkel, F.S. Single-step genome-wide association for longitudinal traits of Canadian Ayrshire, Holstein, and Jersey dairy cattle. J. Dairy Sci. 2019, 102, 9995–10011. [Google Scholar] [CrossRef]
  30. Kaupe, B.; Kollers, S.; Fries, R.; Erhardt, G. Mapping of CYP11B and a putative CYHR1 paralogous gene to bovine chromosome 14 by FISH. Anim. Genet. 2004, 35, 478–479. [Google Scholar] [CrossRef]
  31. Maryam, J.; Babar, M.E.; Nadeem, A.; Yaqub, T.; Hashmi, A.S. Identification of functional consequence of a novel selection signature in CYP11b1 gene for milk fat content in Bubalus bubalis. Meta Gene 2015, 6, 85–90. [Google Scholar] [CrossRef]
  32. Boleckova, J.; Matejickova, J.; Stipkova, M.; Kyselova, J.; Barton, L. The association of five polymorphisms with milk production traits in Czech Fleckvieh cattle. Czech. J. Anim. Sci. 2012, 57, 45–53. [Google Scholar] [CrossRef]
  33. Hayes, B.J.; Pryce, J.; Chamberlain, A.J.; Bowman, P.J.; Goddard, M.E. Genetic architecture of complex traits and accuracy of genomic Prediction: Coat colour, Milk-fat percentage, and type in Holstein cattle as contrasting model traits. PLoS Genet. 2010, 6, e1001139. [Google Scholar] [CrossRef]
  34. Moir, R.D.; Willis, I.M. Regulating Maf1 Expression and Its Expanding Biological Functions. PLoS Genet. 2015, 11, e1004896. [Google Scholar] [CrossRef] [PubMed] [Green Version]
  35. Palian, B.M.; Rohira, A.D.; Johnson, S.A.S.; He, L.; Zheng, N.; Dubeau, L.; Stiles, B.L.; Johnson, D.L. Maf1 Is a Novel Target of PTEN and PI3K Signaling That Negatively Regulates Oncogenesis and Lipid Metabolism. PLoS Genet. 2014, 14, e1004789. [Google Scholar] [CrossRef] [PubMed] [Green Version]
  36. Tsuchiya, M.; Yoshida, T.; Taniguchi, S.; Yasuda, K.; Maeda, A.; Hayashi, A.; Tanaka, J.; Shigemoto, M.; Nitta, K.; Tsuchiya, K. In vivo suppression of mafA mRNA with siRNA and analysis of the resulting alteration of the gene expression profile in mouse pancreas by the microarray method. Biochem. Biophys. Res. Commun. 2007, 356, 129–135. [Google Scholar] [CrossRef] [PubMed]
  37. Morgenstern, R.; Zhang, J.; Johansson, K. Microsomal glutathione transferase 1: Mechanism and functional roles. Drug Metab. Rev. 2011, 43, 300–306. [Google Scholar] [CrossRef]
  38. Mosialou, E.; Morgenstern, R. Activity of rat liver microsomal glutathione transferase toward products of lipid peroxidation and studies of the effect of inhibitors on glutathione-dependent protection against lipid peroxidation. Arch. Biochem. Biophys. 1989, 275, 289–294. [Google Scholar] [CrossRef]
  39. Mosialou, E.; Ekström, G.; Adang, A.E.P.; Morgenstern, R. Evidence that rat liver microsomal glutathione transferase is responsible for glutathione-dependent protection against lipid peroxidation. Biochem. Pharmacol. 1993, 45, 1645–1651. [Google Scholar] [CrossRef]
  40. Mosialou, E.; Piemonte, F.; Andersson, C.; Vos, R.M.E.; van Bladeren, P.J.; Morgenstern, R. Microsomal glutathione transferase: Lipid-derived substrates and lipid dependence. Arch. Biochem. Biophys. 1995, 320, 210–216. [Google Scholar] [CrossRef]
  41. Repo, H.; Kuokkanen, E.; Oksanen, E.; Goldman, A.; Heikinheimo, P. Is the bovine lysosomal phospholipase B-like protein an amidase? Proteins Struct. Funct. Bioinform. 2014, 82, 300–311. [Google Scholar] [CrossRef]
  42. Buccioni, A.; Pauselli, M.; Viti, C.; Minieri, S.; Pallara, G.; Roscini, V.; Rapaccini, S.; Marinucci, M.T.; Lupi, P.; Conte, G.; et al. Milk fatty acid composition, rumen microbial population, and animal performances in response to diets rich in linoleic acid supplemented with chestnut or quebracho tannins in dairy ewes. J. Dairy Sci. 2015, 98, 1145–1156. [Google Scholar] [CrossRef] [Green Version]
  43. Kliem, K.E.; Shingfield, K.J. Manipulation of milk fatty acid composition in lactating cows: Opportunities and challenges. Eur. J. Lipid Sci. Technol. 2016, 118, 1661–1683. [Google Scholar] [CrossRef]
  44. Meignan, T.; Lechartier, C.; Chesneau, G.; Bareille, N. Effects of feeding extruded linseed on production performance and milk fatty acid profile in dairy cows: A meta-analysis. J. Dairy Sci. 2017, 100, 4394–4408. [Google Scholar] [CrossRef] [PubMed] [Green Version]
Figure 1. Manhattan plots for the different fatty acid groups [i.e., long-chain (a), medium-chain (b), short-chain (c), saturated (d), and unsaturated (e) fatty acids], when the DGAT1 gene was not fitted as a covariate in the statistical model. Genome-wide plots have the -log10 (I-values) in the y-axis and the chromosome number in the x-axis. Lines represent chromosome-wise FDR thresholds of 10% (blue), 5% (green), and 1% (red).
Animals 09 00997 g001
Figure 2. Manhattan plots for the different fatty acid groups (i.e., long-chain (a), medium-chain (b), short-chain (c), saturated (d), and unsaturated (e) fatty acids), when fitting the DGAT1 gene as a covariate in the statistical model. Genome-wide plots show the -log10 (I-values) in the y-axis and the chromosome number in the x-axis. Lines represent chromosome-wise FDR thresholds of 10% (blue), 5% (green), and 1% (red).
Animals 09 00997 g002
Figure 3. Functional analyses for the candidate genes found to be associated with milk fatty acids. Candidate genes were clustered based on four different potential expression profiles: molecular function (a), biological process (b), cellular component (c), and protein class (d).
Animals 09 00997 g003
Table 1. Number of significant single nucleotide polymorphisms (chromosome-wide FDR = 1%, 5% and 10%) for the different groups of milk fatty acids, fitting or not the DGAT1 gene in the statistical model.
Traits 1Not Fitting DGAT1 Gene EffectFitting DGAT1 Gene Effect
1%5%10%1%5%10%
LCFA89134157000
MCFA204252338003
SCFA156233273067
SFA204251334000
UFA90119132000
1 Groups of milk fatty acids: long-chain (LCFA), medium-chain (MCFA), short-chain (SCFA), saturated (SFA), and unsaturated (UFA) fatty acids.

