Article

Protective Effects of Fucoidan against Hydrogen Peroxide-Induced Oxidative Damage in Porcine Intestinal Epithelial Cells

1
Institute of Animal Science, Jiangsu Academy of Agricultural Sciences, Nanjing 210014, China
2
College of Animal Science & Technology, Nanjing Agricultural University, Nanjing 210095, China
*
Author to whom correspondence should be addressed.
Submission received: 5 November 2019 / Revised: 30 November 2019 / Accepted: 3 December 2019 / Published: 10 December 2019
(This article belongs to the Section Animal Nutrition)

Abstract

:

Simple Summary

High levels of production in intensive farming systems make domestic animals like piglets particularly susceptible to oxidative stress, which is detrimental to intestinal homeostasis and function. It is of paramount importance to identify effective and reliable nutrients to counteract oxidative damage to the porcine intestinal epithelium, especially with the recent phasing out of the use of antibiotics in China. This study indicates that fucoidan could ameliorate hydrogen peroxide-induced oxidative stress in porcine intestinal epithelial cells, primarily owing to the action of fucoidan to facilitate nuclear factor-erythroid 2-related factor-2 signals and cellular antioxidant responses. These findings may provide useful implications for practical swine production.

Abstract

This study was conducted to evaluate the effectiveness of fucoidan in ameliorating hydrogen peroxide (H2O2)-induced oxidative stress to porcine intestinal epithelial cell line (IPEC-1). The cell viability test was initially performed to screen out appropriate concentrations of H2O2 and fucoidan. After that, cells were exposed to H2O2 in the presence or absence of pre-incubation with fucoidan. Hydrogen peroxide increased the apoptotic and necrotic rate, boosted reactive oxygen species (ROS) generation, and disturbed the transcriptional expression of genes associated with antioxidant defense and apoptosis in IPEC-1 cells. Pre-incubation with fucoidan inhibited the increases in necrosis and ROS accumulation induced by H2O2. Consistently, in the H2O2-treated IPEC-1 cells, fucoidan normalized the content of reduced glutathione as well as the mRNA abundance of NAD(P)H quinone dehydrogenase 1 and superoxide dismutase 1 while it prevented the overproduction of malondialdehyde. Moreover, H2O2 stimulated the translocation of nuclear factor-erythroid 2-related factor-2 to the nucleus of IPEC-1 cells, but this increase was further promoted by fucoidan pre-treatment. The results suggest that fucoidan is effective in protecting IPEC-1 cells against oxidative damage induced by H2O2, which may help in developing appropriate strategies for maintaining the intestinal health of young piglets.

1. Introduction

The intestinal mucosa is a complex and dynamic tissue that consists of a single layer of epithelial cells (intestinal epithelium) and the underlying lamina propria [1]. Its primary function is to digest and absorb essential nutrients and to act as a natural barrier defense between the gut lumen and the rest of the body [2]. Aside from being exposed to luminal nutrients, the complex intestinal epithelium is in fact continuously challenged by various diet-derived oxidants as well as by endogenous reactive species or oxidants generated during oxidative metabolism [3]. Oxidative stress is defined as an imbalance between the excessive production of reactive oxygen species (ROS) and their elimination by antioxidants [4]. The intestinal tract is actually a major site of antioxidant action, rendering the intestinal epithelium sensitive and vulnerable to oxidative stress [5,6]. The renewal and destruction of intestinal epithelium is a tightly controlled process in adult mammals, and its rapid self-renewal is crucial for regulating intestinal homeostasis, maintaining mucosal integrity, and repairing mucosal injury [7]. However, disruption of intestinal cellular homeostasis by redox signaling during oxidative stress can break the balance between renewal and death of intestinal epithelial cells and impair mucosal integrity, resulting in various intestinal diseases, such as inflammatory bowel diseases and enteric infections [8]. The prevalent oxidative stress occurring in swine production is a common mechanism by which various stress stimulators damage intestinal homeostasis and function, ultimately leading to compromised growth performance and inferior health outcomes of pigs, as well as economic losses of farmers [9,10]. An in vitro model of the porcine gastrointestinal tract has been established using porcine intestinal epithelial cell lines, and the available literature has shown that oxidative stress causes detrimental damage to porcine intestinal epithelial cells by disturbing cellular antioxidant homeostasis, accelerating enterocyte apoptosis, impairing cell permeability, and altering cellular signal transduction pathways, such as the classic nuclear factor-erythroid 2-related factor-2 (NRF2) signal pathway [11,12,13,14].
It is imperative that effective and reliable antioxidants are sought to counteract oxidative damage to porcine intestinal epithelial cells, especially with the recent phasing out of the use of in-feed antibiotics in China, which are able to maintain the gut health of susceptive animals, such as swine and poultry. Algal polysaccharides have received growing attention in recent years due to their diverse biological functions, including antioxidant, anti-inflammation, anti-infection, and cancer prevention and therapy activities [15]. Fucoidan is composed of a group of fucose-rich sulfated polysaccharides containing variable amounts of galactose, xylose, and glucuronic acid, and is widely available in brown seaweeds, such as Sargassum sp. and Fucus sp. [16]. Numerous studies have demonstrated that fucoidan isolated from different sources possesses excellent antioxidant activity in vitro by employing a series of assays, including α, α-diphenyl-β-picrylhydrazyl free radical scavenging assay, superoxide assay, and total antioxidant and reducing power assay [17,18]. In a cell culture study, Gao et al. [19] showed that fucoidan administration prevents hydrogen peroxide (H2O2)-induced apoptosis in PC12 cells (the rat adrenal pheochromocytoma line) by decreasing ROS accumulation. Likewise, Roy Chowdhury et al. [20] found that a bacterial fucose-rich polysaccharide protects human lung fibroblast cells against H2O2-induced apoptosis and necrosis by directly scavenging ROS. The biological function of fucoidan against oxidative stress has also been reported in mesenchymal stem cells [21], normal human hepatocytes [22], and mouse adipocytes [23]. Michel et al. [24] initially showed that fucoidan is totally excreted after oral administration, since it cannot be fermented by intestinal bacterial flora in humans. In contrast, later findings indicated that fucoidan can be absorbed in the intestinal tract by determining serum fucoidan concentrations, with its absorption rate in the intestine being around 0.6% [25,26]. These aforementioned findings, although inconsistent, together suggest that intestine is the major active of fucoidan. However, little is known about the biological effects of fucoidan in intestinal epithelial cells, irrespective of their sources and species. According to its biological function, we therefore hypothesized that fucoidan could exhibit protective effects in porcine intestinal epithelial cells subjected to oxidative stress, and then investigated the effectiveness of fucoidan administration in alleviating H2O2-induced oxidative damage to porcine intestinal epithelial cell line (IPEC-1).

2. Materials and Methods

2.1. Cell Culture

The IPEC-1 used in this study was derived from small intestinal epithelium isolated from a neonatal unsuckled piglet, and was kindly gifted by Dr. Jing Zhang (School of Animal Science and Nutritional Engineering, Wuhan Polytechnic University, Wuhan, Hubei, China). The IPEC-1 cells were cultured in Dulbecco’s modified eagle’s medium/nutrient mixture F-12 supplemented with 10% fetal bovine serum, 1% streptomycin-penicillin (100 U/mL), and 1% insulin-transferrin-selenium. The cell culture was grown and maintained at 37 °C in a 90% humidified atmosphere containing 5% carbon dioxide. The culture medium was changed daily and passaged every 2 days. All reagents used in the cell culture experiment were purchased from Gibco (Thermo Fisher Scientific Inc., Waltham, MA, USA).

2.2. Establishment of Oxidative Stress

Hydrogen peroxide (Sigma-Aldrich, St. Louis, MO, USA) was employed to induce oxidative stress to IPEC-1 cells in this study. The IPEC-1 cells were placed into a 96-well plate at a density of 1 × 10⁴ cells per well in 100 μL of culture medium and allowed to adhere overnight. The seeding medium was then removed and replaced with fresh medium containing varying concentrations of H2O2 (0, 0.1, 0.25, 0.5, 1.0, and 1.5 mM), which was incubated at 37 °C for 1 h according to a previous finding [27]. Each concentration was repeated six times in parallel. After that, 10 μL of Cell Counting Kit-8 (CCK-8) was added to each well to determine cell viability by measuring absorbance at 450 nm using a microplate reader (Thermo Fisher Scientific Inc., NY, USA) according to the instructions provided by the manufacturer (Dojindo, Tokyo, Japan). The result of the cell viability was expressed as the percentage of optical density of treated wells against vehicle-treated control wells, which were assigned a viability of 100%. The appropriate H2O2 concentration was then screened out for a later experiment according to the cell viability data.

2.3. Fucoidan Treatment

After selecting the concentration of H2O2, IPEC-1 cells (1 × 10⁴ cells/well in 96-well plate) were co-cultured with 0, 25, 50, 100, and 200 μg/mL fucoidan (Undaria pinnatifida fucoidan extract, purity ≥95%; Sigma-Aldrich, St. Louis, MO, USA) that was dissolved in phosphate-buffered saline (PBS) for 24 h before treatment with the above selected H2O2 solution for 1 h. The control wells were maintained with medium supplemented with an equivalent volume of PBS alone. Each treatment was performed in six replicate wells. The cell viability was determined as mentioned above, and the optimal administration level of fucoidan was then selected for subsequent use. According to the selected concentration of H2O2 and fucoidan, IPEC-1 cells were then treated with H2O2 solution for 1 h in the presence or absence of a 24-h pre-incubation with fucoidan. The control cells were treated with an equivalent volume of PBS vehicle alone. The cells were sampled for the determination of apoptosis and necrosis, intracellular ROS production, antioxidant-related parameters, gene expression, and nuclear NRF2 translocation.

2.4. Assay of Apoptosis and Necrosis

Cell apoptosis and necrosis were measured on a BD FACSCalibur flow cytometry system (BD Biosciences, San Jose, CA, USA) using the Alexa Fluor® 488 Annexin V/Dead Cell Apoptosis Kit (Invitrogen Life Technologies, Gaithersburg, MD, USA) as described previously [28]. The IPEC-1 cells were placed into six-well plates. After the corresponding treatment, cells were harvested, washed twice with pre-cold PBS, and re-suspended in binding buffer containing Annexin V-fluorescein isothiocyanate and prodiumkono iodide, which was subsequently incubated in dark conditions for 15 min at 4 °C. The cell suspension was then ready for detection by flow cytometry assay.

2.5. Measurement of Intracellular ROS

The intracellular ROS level in IPEC-1 cells was determined using a ROS assay kit (Beyotime Institute of Biotechnology, Nantong, Jiangsu, China) according to the manufacturer’s instructions. Following each specific treatment, cells cultured in a 12-well plate were washed twice with PBS and incubated with the ROS dye (2′,7′-dichloro-dihydro-fluorescein diacetate) for 30 min. The ROS-positive cells labeled with green fluorescence were visualized with an Eclipse 80i inverted fluorescence microscope (Nikon Instruments, Tokyo, Japan), and fluorescence intensity was measured and quantified using Image J software (National Institute of Health, Bethesda, MD, USA) and normalized to the control value.

2.6. Determination of Antioxidant-Related Parameters

The IPEC-1 cells were cultured in six-well plates. After the corresponding treatment, cells were carefully scraped, re-suspended in 0.86% sterile saline, and disrupted by ultrasonication in an ice-cold water bath. The cell debris was removed by centrifugation and the clear supernatant was collected for subsequent determination. The activities of superoxide dismutase (SOD) and glutathione peroxidase (GPX) as well as the levels of the reduced form of glutathione (GSH) and malonaldehyde (MDA) in the supernatant were quantified using colorimetric kits in accordance with the manufacturer’s guidelines (Nanjing Jiancheng Bioengineering Institute, Nanjing, Jiangsu, China). Briefly, SOD activity was determined using the hydroxylamine method [29], and one unit of SOD was defined as the amount of enzyme that can produce a 50% inhibition of the rate of nitrite generation at 37 °C. The 5,5′-dithiobis (2-nitrobenzoic acid) (DTNB) method [30] was employed to determine GPX activity, one unit of which was calculated as the amount of enzyme that was required to deplete 1 μmol of GSH at 37 °C. The DTNB method [31] and thiobarbituric acid method [32] were used to determine the GSH and MDA concentrations, respectively. All acquired results were normalized against the total protein concentration in each sample for inter-sample comparison, and the total protein concentration was determined by the Bradford method [33], using crystalline bovine serum albumin (Sigma-Aldrich, St Louis, MO, USA) as the standard protein.

2.7. RNA Isolation and Reverse Transcription

Total RNA was isolated from fresh IPEC-1 cells using the TRIzol reagent kit (TaKaRa Biotechnology, Dalian, Liaoning, China) following the protocol provided by the manufacturer. The integrity of extracted RNA was verified by electrophoresis on 1.5% agarose gel, and its purity and concentration were quantified according to A260/280 readings using a NanoDrop ND-3000 UV-spectrophotometer (Nano Drop Technologies, Wilmington, DE, USA). The RNA samples were diluted with nuclease-free water to a concentration of 0.5 μg/μL. After that, 1 μg of total RNA was reverse transcribed into complementary DNA using a PrimeScriptTM RT reagent kit (TaKaRa Biotechnology, Dalian, Liaoning, China) in accordance with the manufacturer’s guidelines. The reverse transcription condition was set as 15 min at 37 °C and 5 s at 85 °C.

2.8. Quantitative Real-Time PCR Analysis

The mRNA expression of target and reference genes NRF2, heme oxygenase 1 (HO1), NAD(P)H quinone dehydrogenase 1 (NQO1), superoxide dismutase 1 (SOD1), superoxide dismutase 2 (SOD2), glutathione peroxidase 1 (GPX1), glutathione S-transferase alpha 1 (GSTA1), catalase (CAT), proliferating cell nuclear antigen (PCNA), caspase 3 (CASP3), caspase 9 (CASP9), myeloid cell leukemia-1 (MCL1), B cell lymphoma 2 (BCL2), BCL2-associated X protein (BAX), glyceraldehyde-3-phosphate dehydrogenase (GAPDH), and beta actin (ACTB) were analyzed on an ABI StepOnePlus Real-Time PCR System (Applied Biosystems, Life Technologies, CA, USA). The primer sequences of the target and reference genes are presented in Table 1. The PCR mixture contained 2 μL of complementary DNA, 0.4 μL each of the forward and reverse primers, 10 μL of SYBR Premix Ex Taq (TaKaRa Biotechnology, Dalian, Liaoning, China), 0.4 μL of ROX reference dye (TaKaRa Biotechnology, Dalian, Liaoning, China), and 6.8 μL of nuclease-free water. The PCR procedures consisted of a pre-run at 95 °C for 30 s, 40 cycles of denaturation at 95 °C for 5 s, followed by a 60 °C annealing step for 30 s. The melting curve conditions were set up as follows: One cycle of denaturation at 95 °C for 10 s, followed by an increase in temperature from 65 to 95 °C with a temperature change rate of 0.5 °C/s. The 2-ΔΔCT method [34] was employed to calculate the relative mRNA expression of the target genes (fold changes) after normalization against the reference gene, ACTB. The mRNA abundance of each target gene in the control cells was assigned an arbitrary value of 1.

2.9. Immunofluorescence Assay of NRF2

Nuclear NRF2 translocation was determined by the immunofluorescence assay as previously described by Zhang et al. [35], with minor modifications. Briefly, IPEC-1 cells were fixed in 4% paraformaldehyde solution in 0.1 M PBS at room temperature for 30 min after washing twice with PBS. The fixed cells were further permeabilized with 0.5% Triton X-100 for an additional 30 min. Following the washing with PBS, cells were incubated with the blocking buffer (5% bovine serum albumin in PBS) for 1 h at 4 °C before incubation with a rabbit anti-NRF2 antibody (1: 100, Proteintech Group, Inc., Chicago, IL, USA) in PBS at 4 °C overnight. After washing with PBS with 0.1% Tween 20, cells were incubated with a secondary antibody, Alexa Fluor 488-conjugated goat anti-rabbit immunoglobulin G (1: 100, Invitrogen, Carlsbad, CA, USA), in dark conditions for 1 h at 4 °C. The 5 µg/mL 4,6-diamidino-2-phenylindole was adopted for nuclear staining. Images were visualized with an Eclipse 80i inverted fluorescence microscope (Nikon Instruments, Tokyo, Japan), and nuclear NRF2 fluorescence intensity was calculated using the Image J software (National Institute of Health, Bethesda, MD, USA) and normalized against control cells.

2.10. Statistical Analysis

Data were analyzed by using SPSS 22.0 statistical software. Statistical differences between mean values were determined one-way analysis of variance (ANOVA) and Tukey’s post hoc test for multiple or pairwise comparison. A p value less than 0.05 was considered as statistically significant. Results are presented as mean ± standard error (SE) of at least three parallel measurements.

3. Results

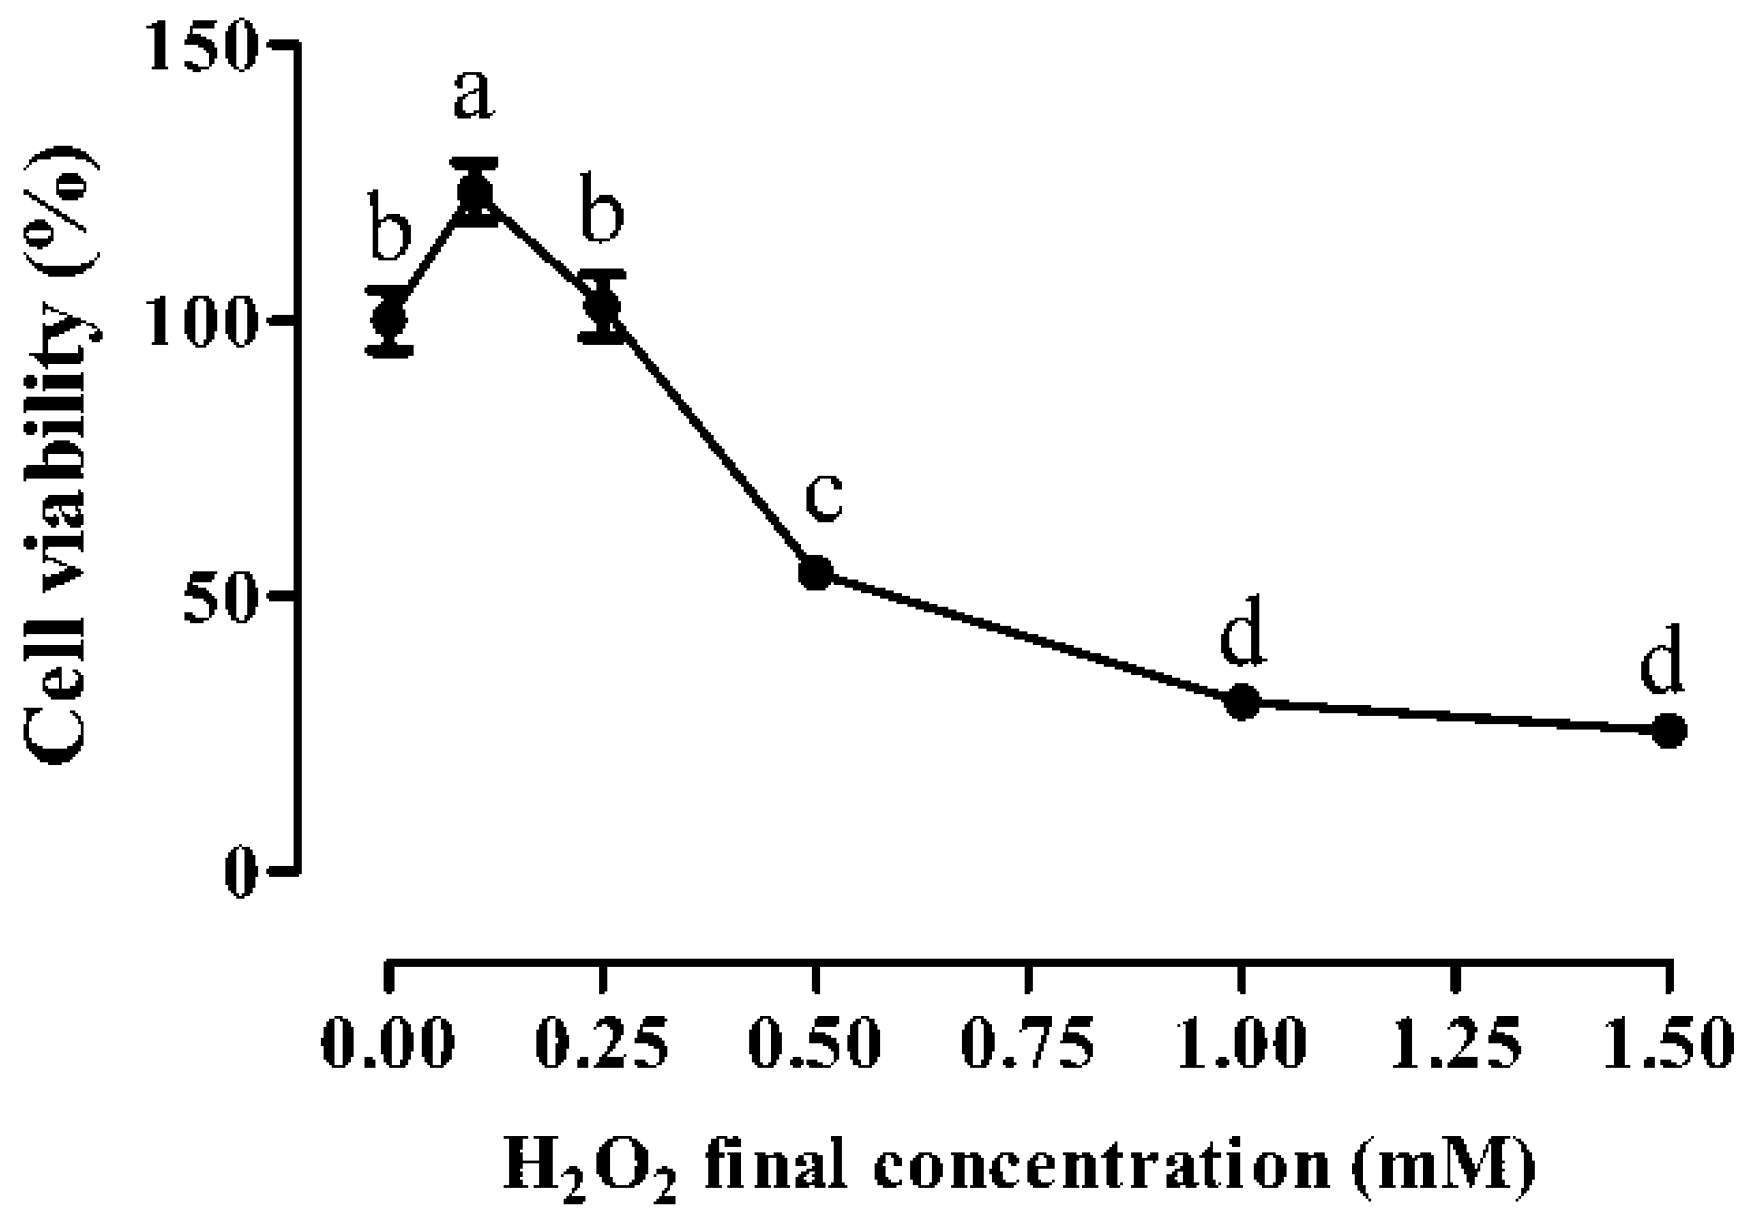
3.1. Cytotoxic Effects of H2O2

Compared with the vehicle-treated control cells, low concentrations of H2O2 (0.1 and 0.25 mM) treatment for 1 h did not impair IPEC-1 cell growth (Figure 1), and actually the lowest concentration of H2O2 (0.1 mM) even stimulated cell growth (p < 0.05). In contrast, high levels of H2O2 exposure (from 0.5 to 1.5 mM) exhibited a dose-dependent inhibitory effect on IPEC-1 cell viability. In detail, cell viability was decreased by nearly 50% when exposed to 0.5 mM H2O2 for 1 h (p < 0.05), and dropped to around 25% when treated with 1.0 and 1.5 mM H2O2 for 1 h (p < 0.05). According to the median lethal dose, the 1-h exposure to 0.5 mM H2O2 was therefore selected as stress conditions in order to investigate the cytoprotective effect of fucoidan in IPEC-1 cells subjected to oxidative stress.

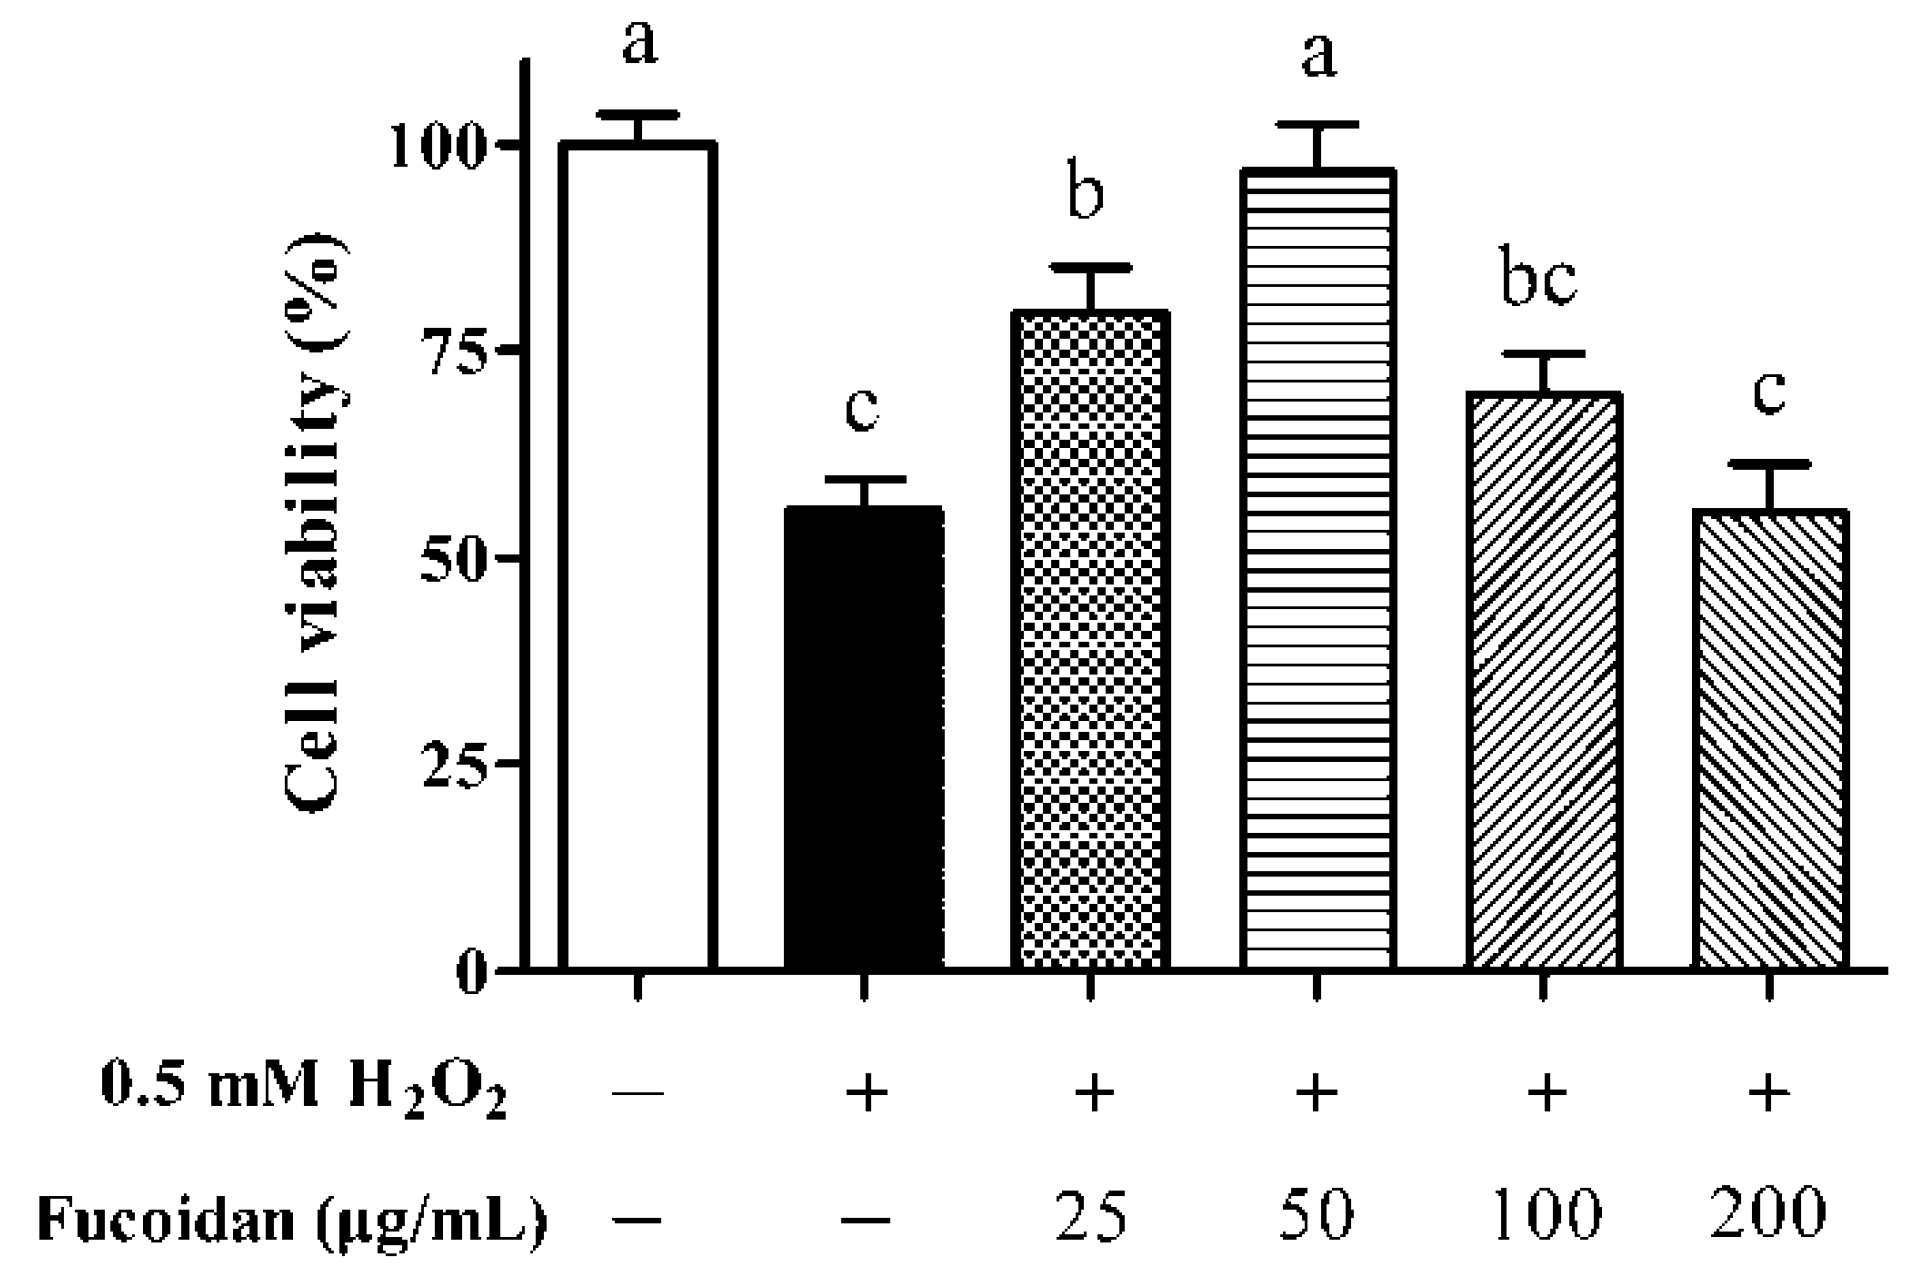
3.2. IPEC-1 Cell Viability in the Presence of Fucoidan

Compared with untreated cells, cell viability was decreased by approximately 50% after exposure to 0.5 mM H2O2 for 1 h (Figure 2, p < 0.05). The lowest concentration of fucoidan (25 μg/mL) administration increased the viability of IPEC-1 cells exposed to H2O2 (p < 0.05) but still did not reach the value observed in untreated cells (p < 0.05). The decrease in cell viability resulting from H2O2 treatment was totally reversed by 50 μg/mL fucoidan (p < 0.05), and its level was comparable with that in the control cells (p > 0.05). However, high concentrations of fucoidan treatment (100 and 200 μg/mL) did not exert protective effects on cell viability (p > 0.05). According to these results, 50 μg/mL fucoidan was therefore selected to investigate its effectiveness in relieving H2O2-induced oxidative damage to IPEC-1 cells.

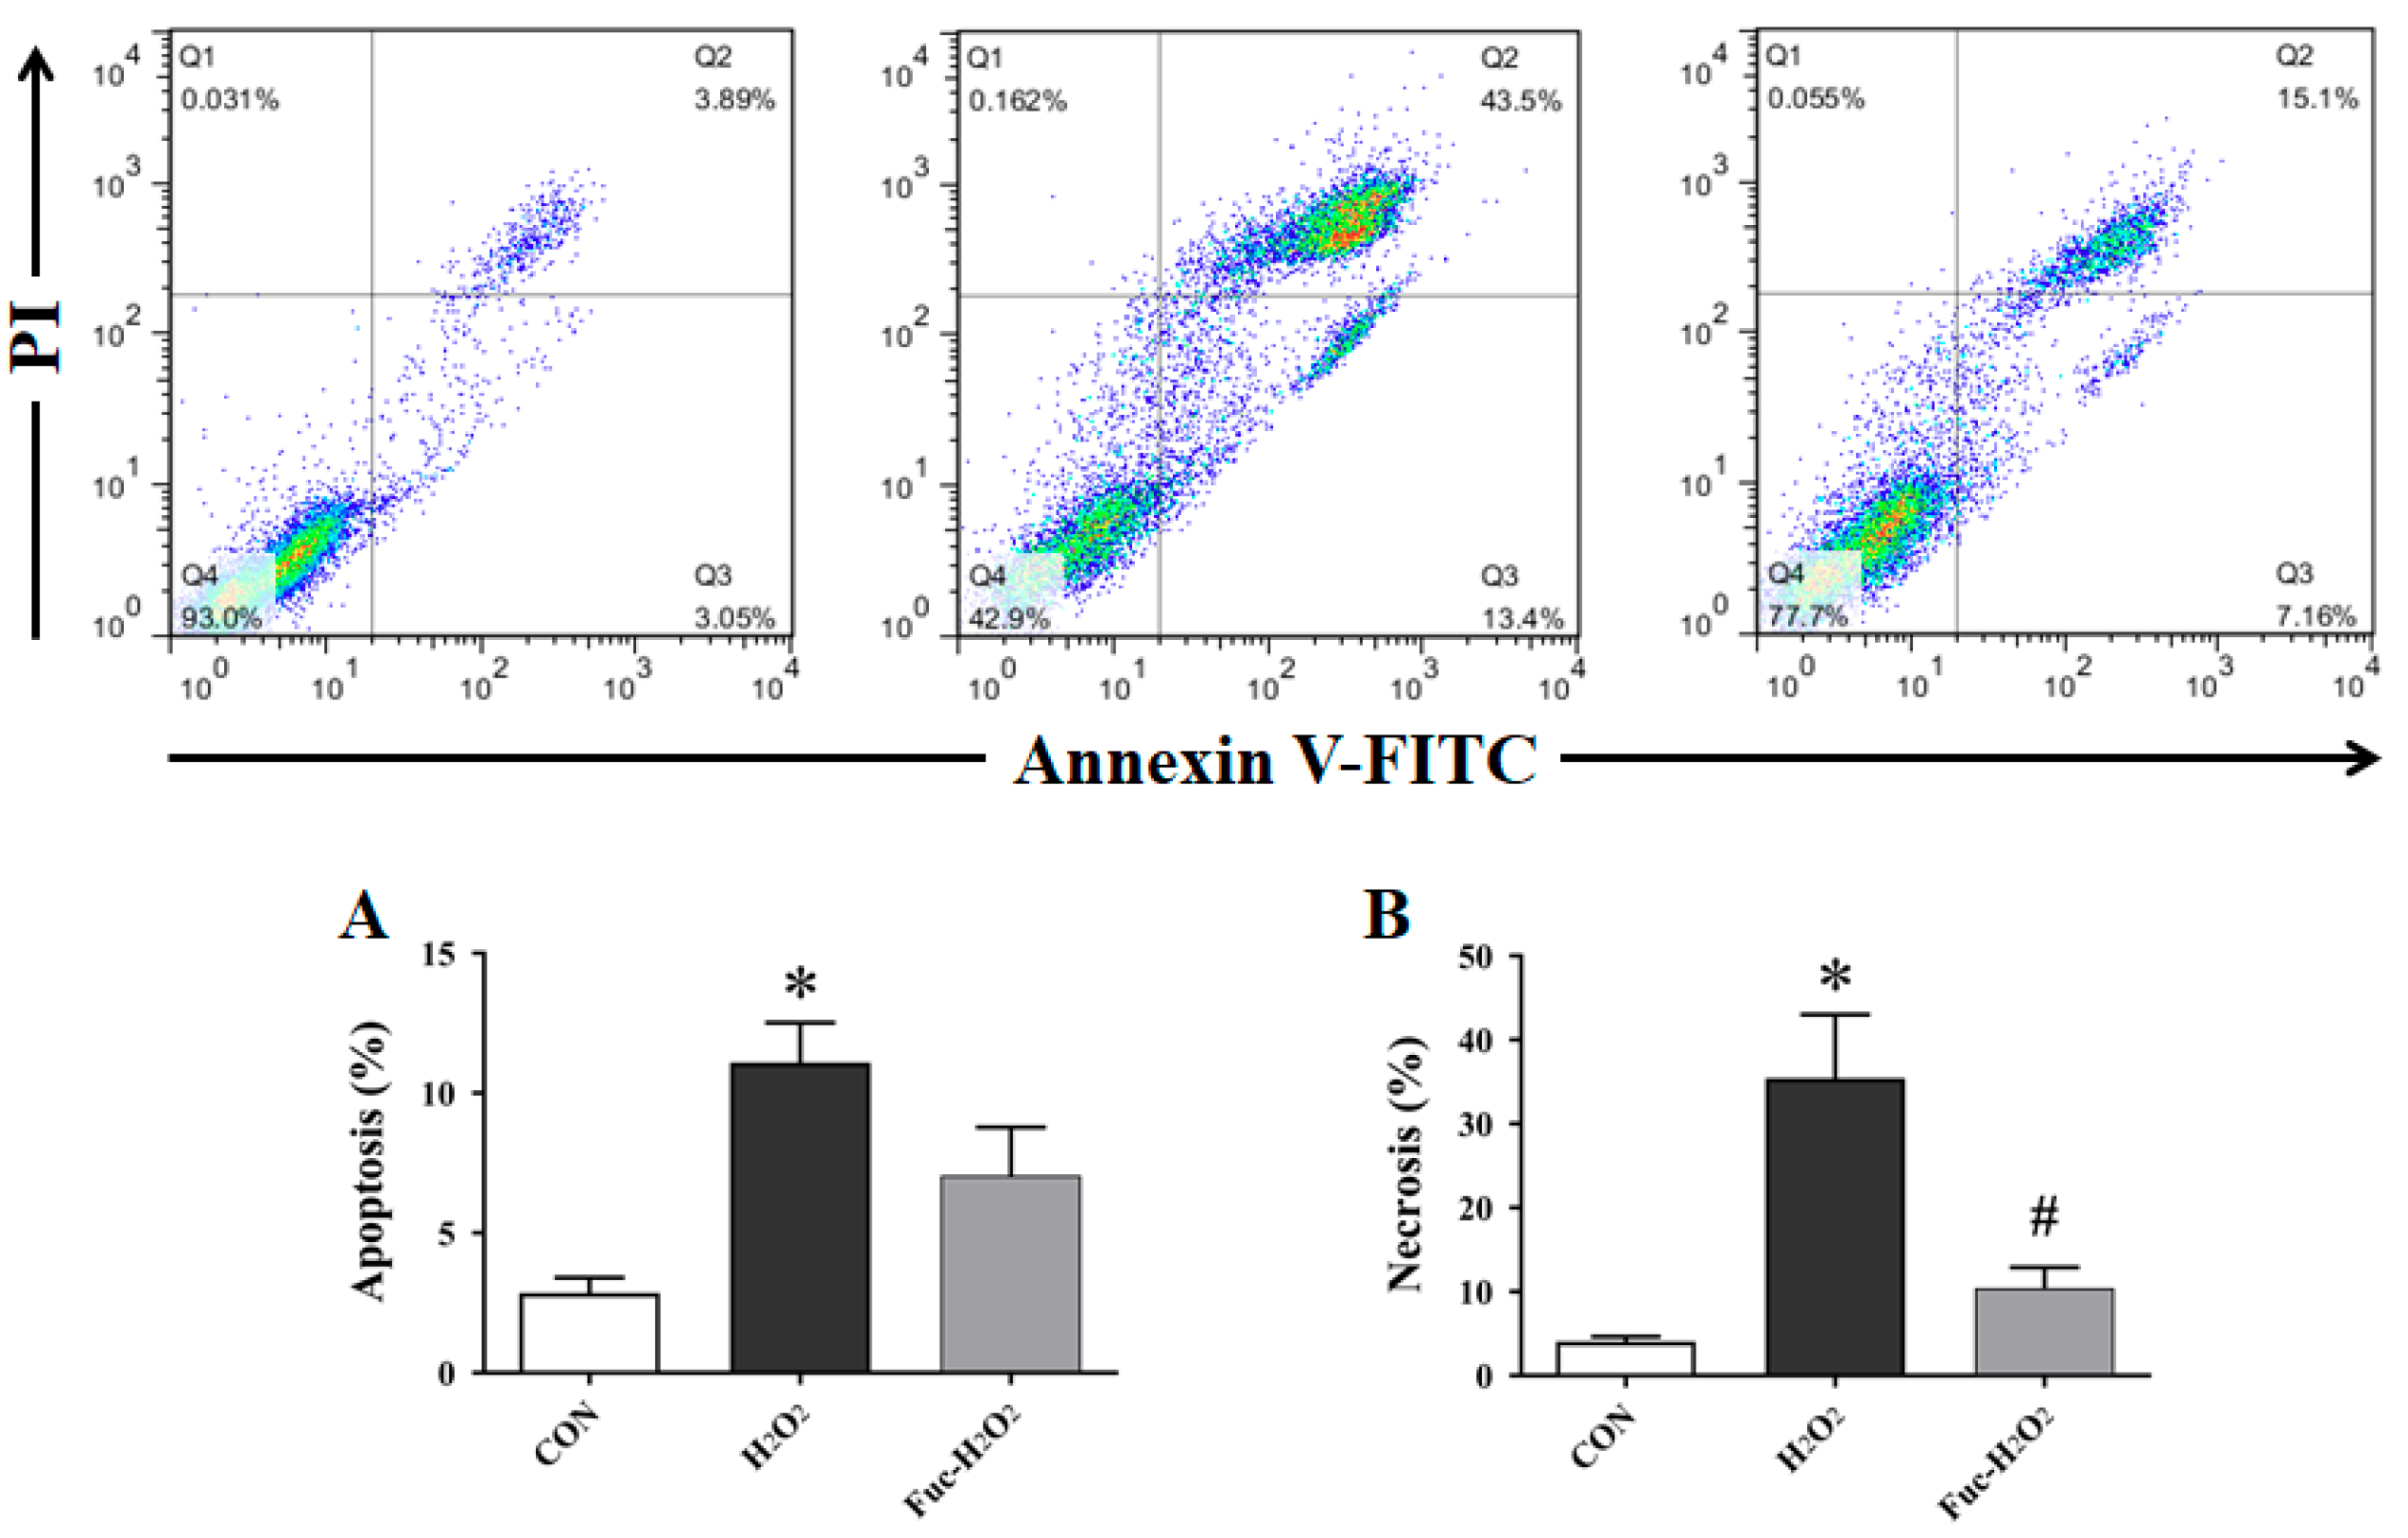
3.3. Cell Apoptosis and Necrosis

As shown in the Figure 3, the exposure to 0.5 mM H2O2 for 1 h markedly increased the apoptotic and necrotic rate in IPEC-1 cells when compared with the untreated cells (p < 0.05). On the contrary, the pre-incubation with 50 μg/mL fucoidan for 24 h significantly counteracted the increased necrosis induced by H2O2 stimulation (p < 0.05). However, a similar protective effect was not observed in IPEC-1 cell apoptosis (p > 0.05), even though it was numerically decreased by fucoidan administration.

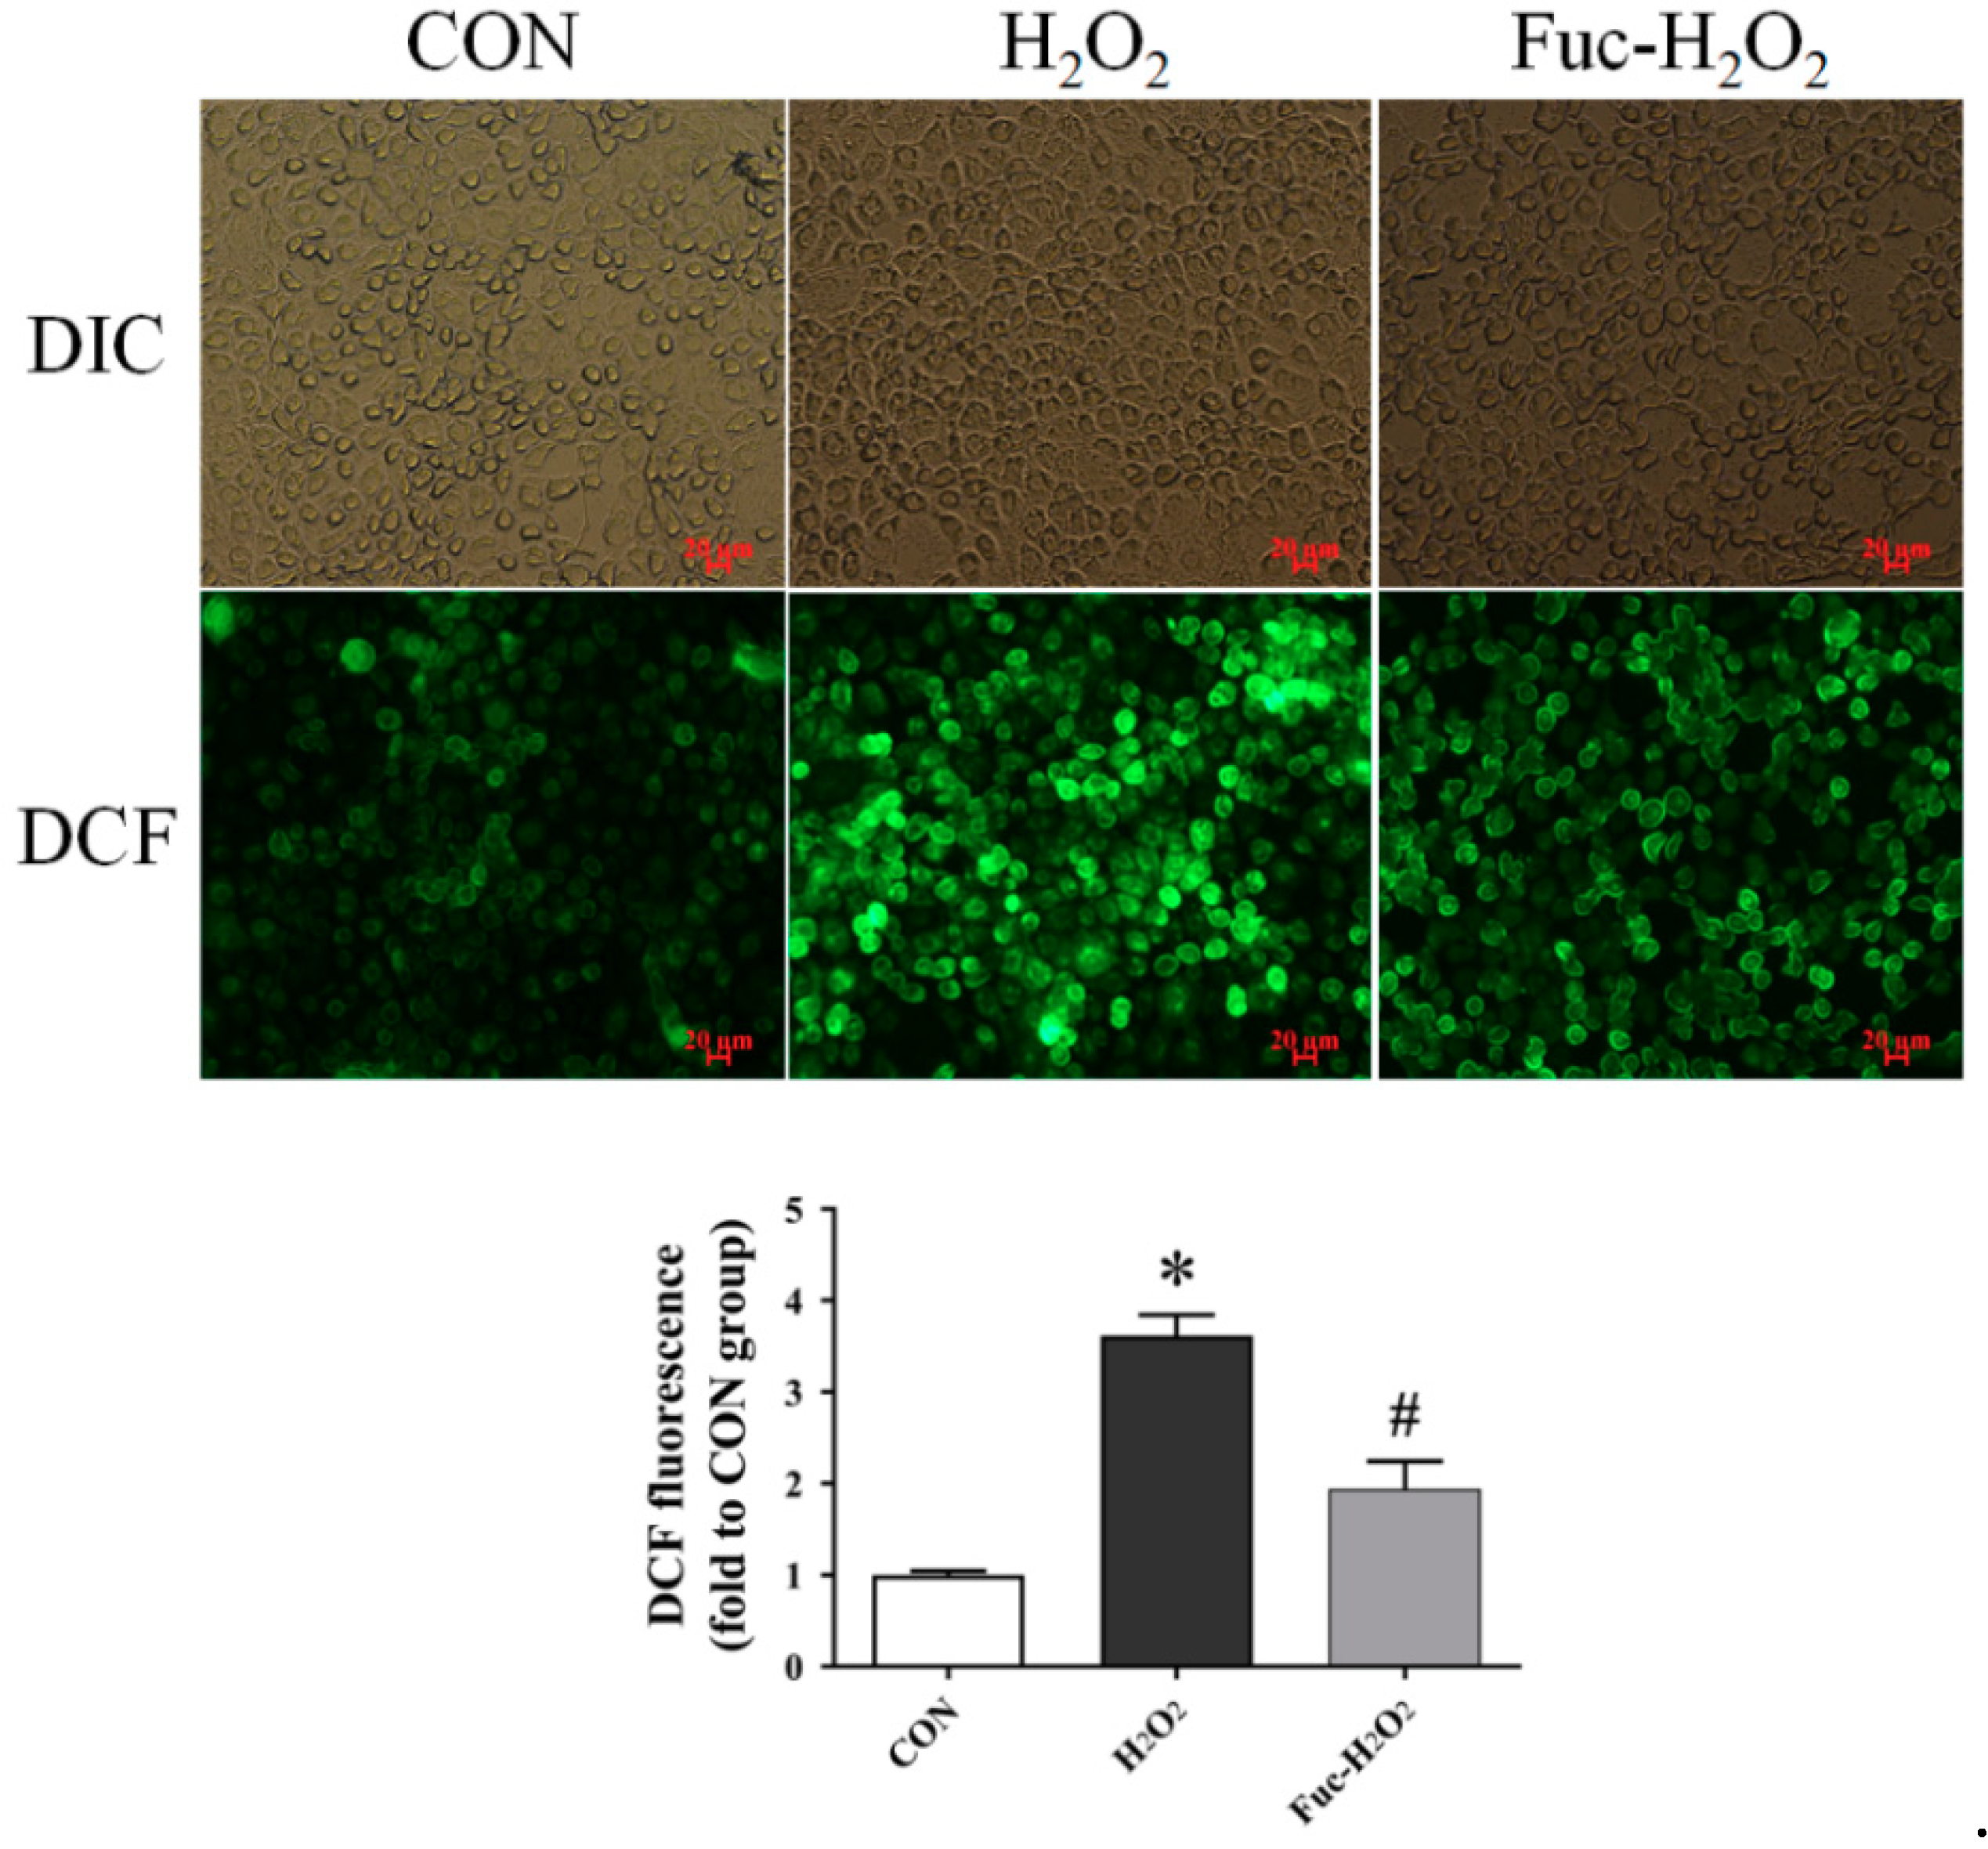
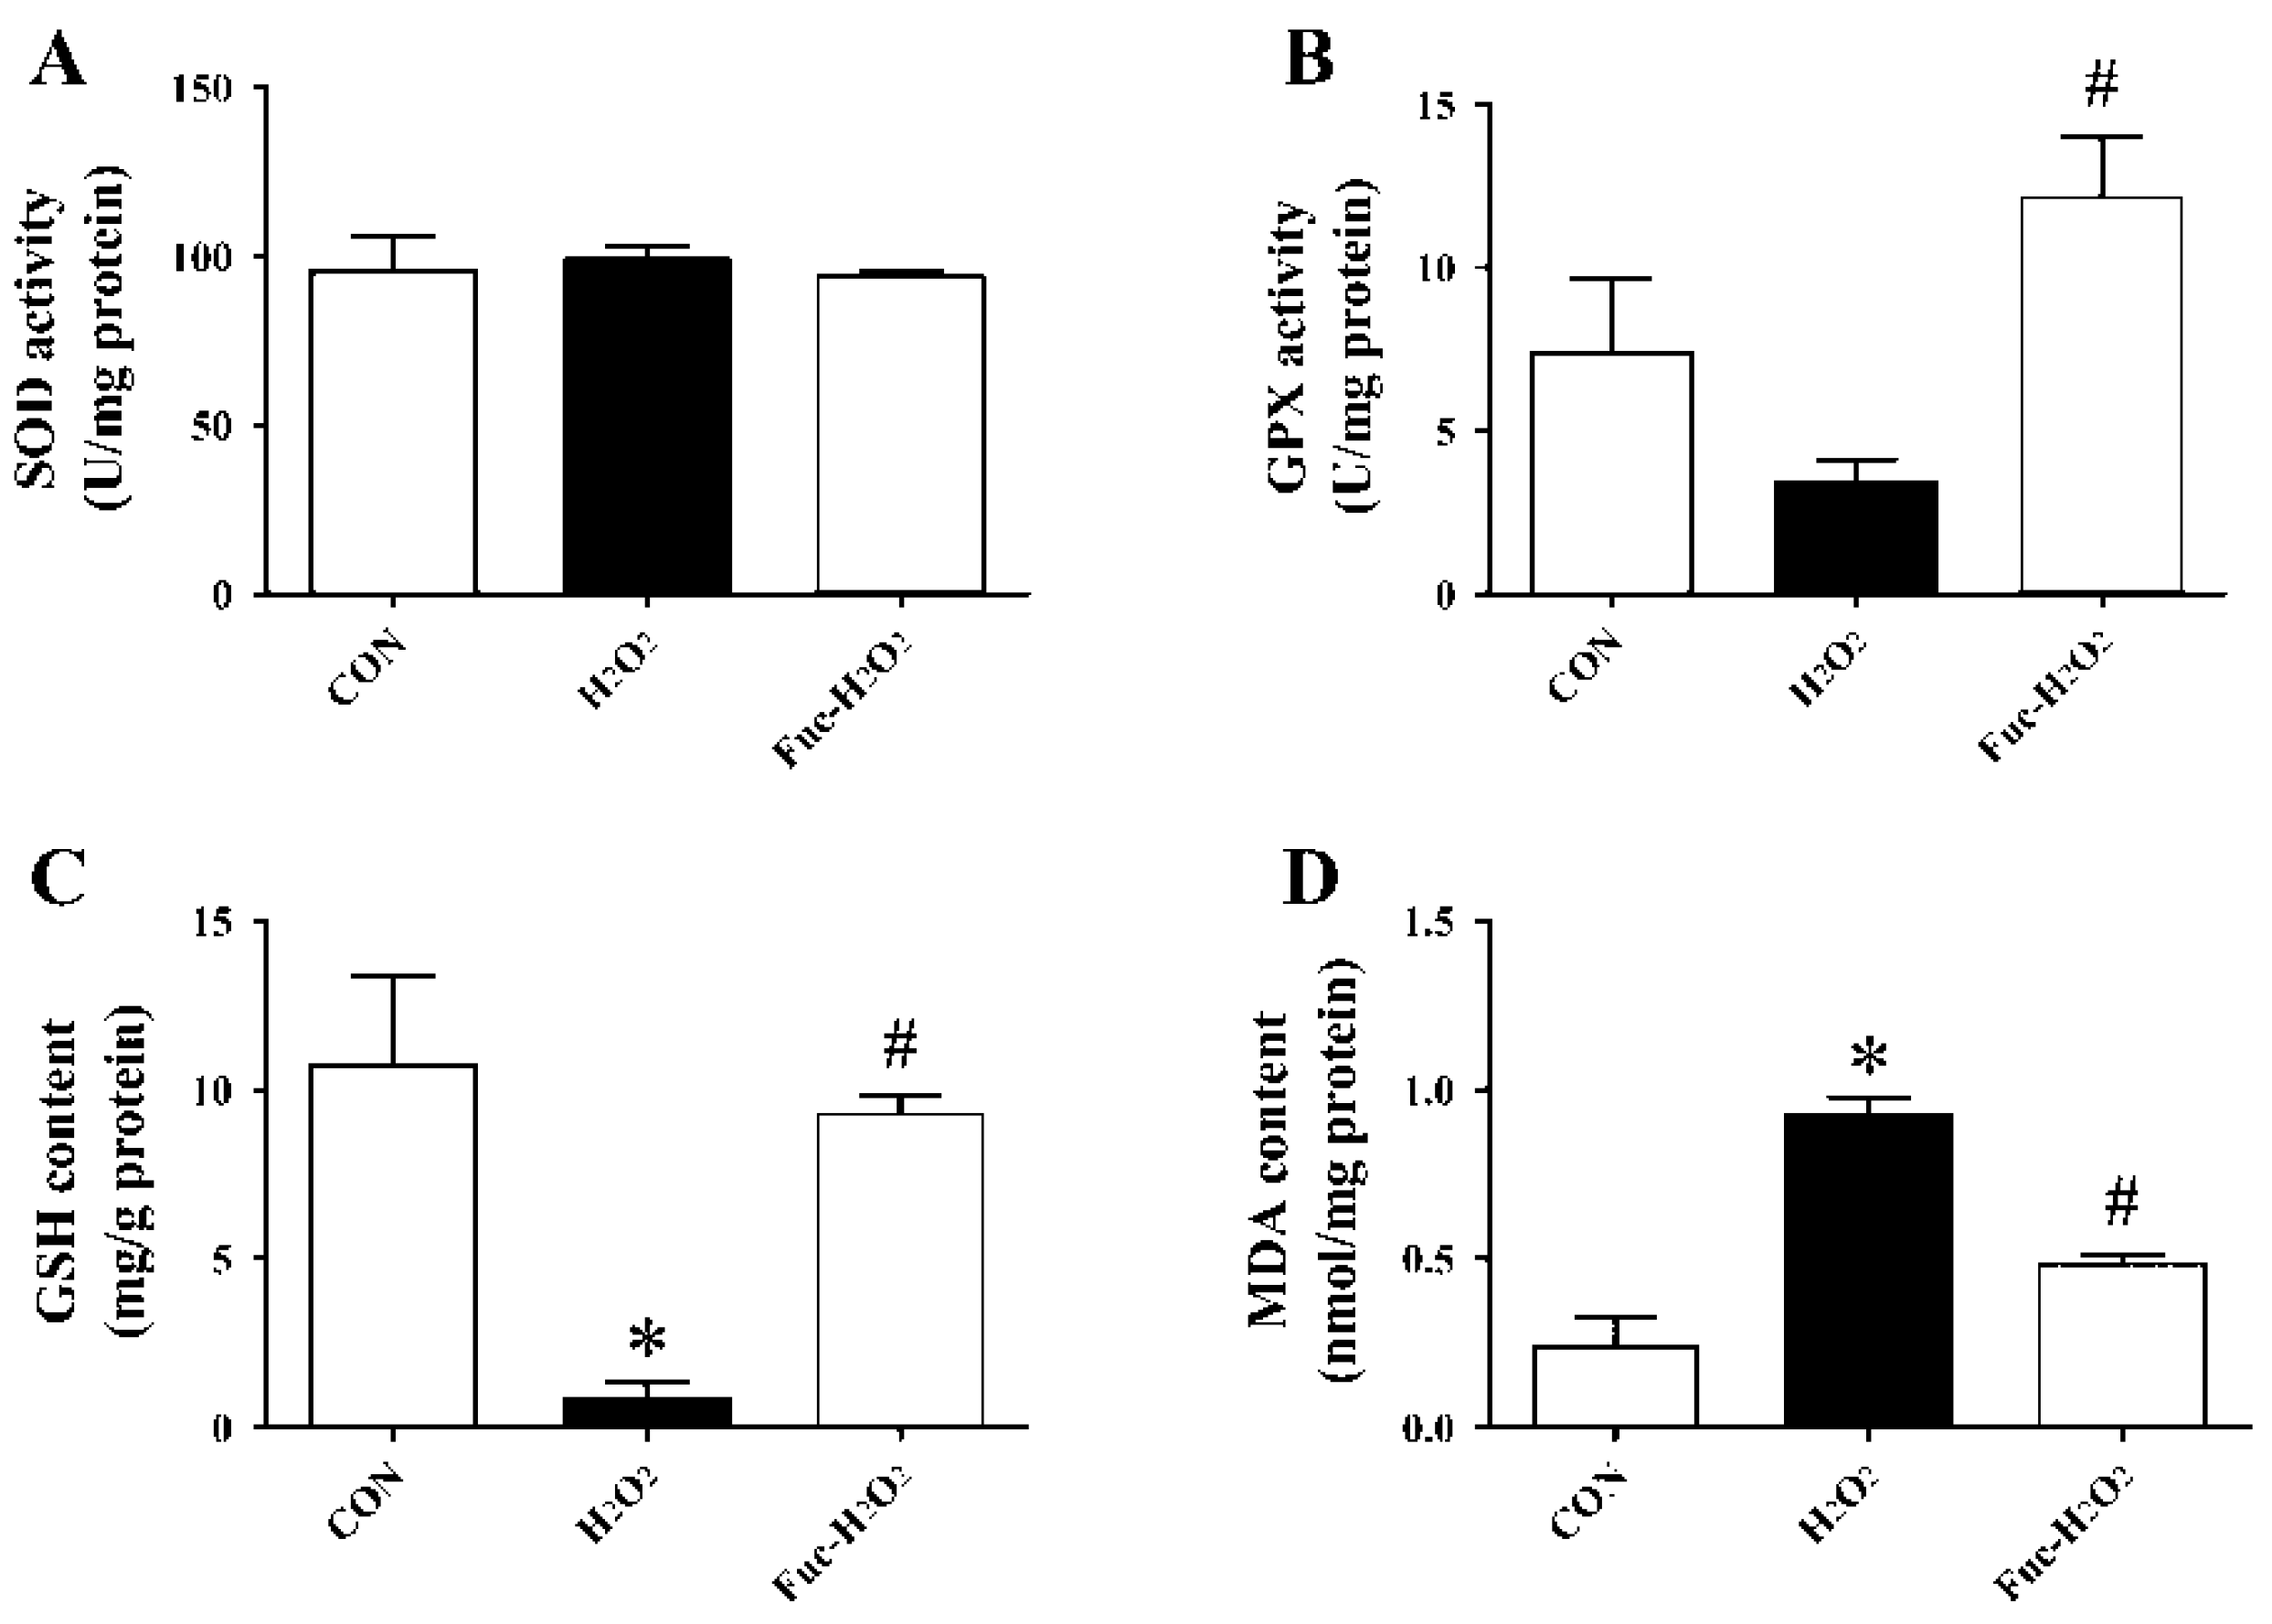
3.4. ROS Level and Antioxidant Capacity

The treatment of 0.5 mM H2O2 for 1 h increased intracellular ROS production in the IPEC-1 cells as shown by an increase in fluorescence intensity (Figure 4, p < 0.05), and it was vastly decreased by pre-incubation with 50 μg/mL fucoidan for 24 h (p < 0.05). As indicated in Figure 5, exposure to H2O2 increased MDA accumulation but decreased GSH concentration in IPEC-1 cells (p < 0.05). In contrast, an elevated GSH concentration and decreased MDA content in IPEC-1cells subjected to H2O2 were observed when supplementing culture medium with 50 μg/mL fucoidan (p < 0.05). Moreover, the GPX activity of IPEC-1 cells cultured in medium containing fucoidan prior to H2O2 treatment was higher than those cells cultured with H2O2 alone (p < 0.05). The SOD activity was, however, similar among the three treatments (p > 0.05).

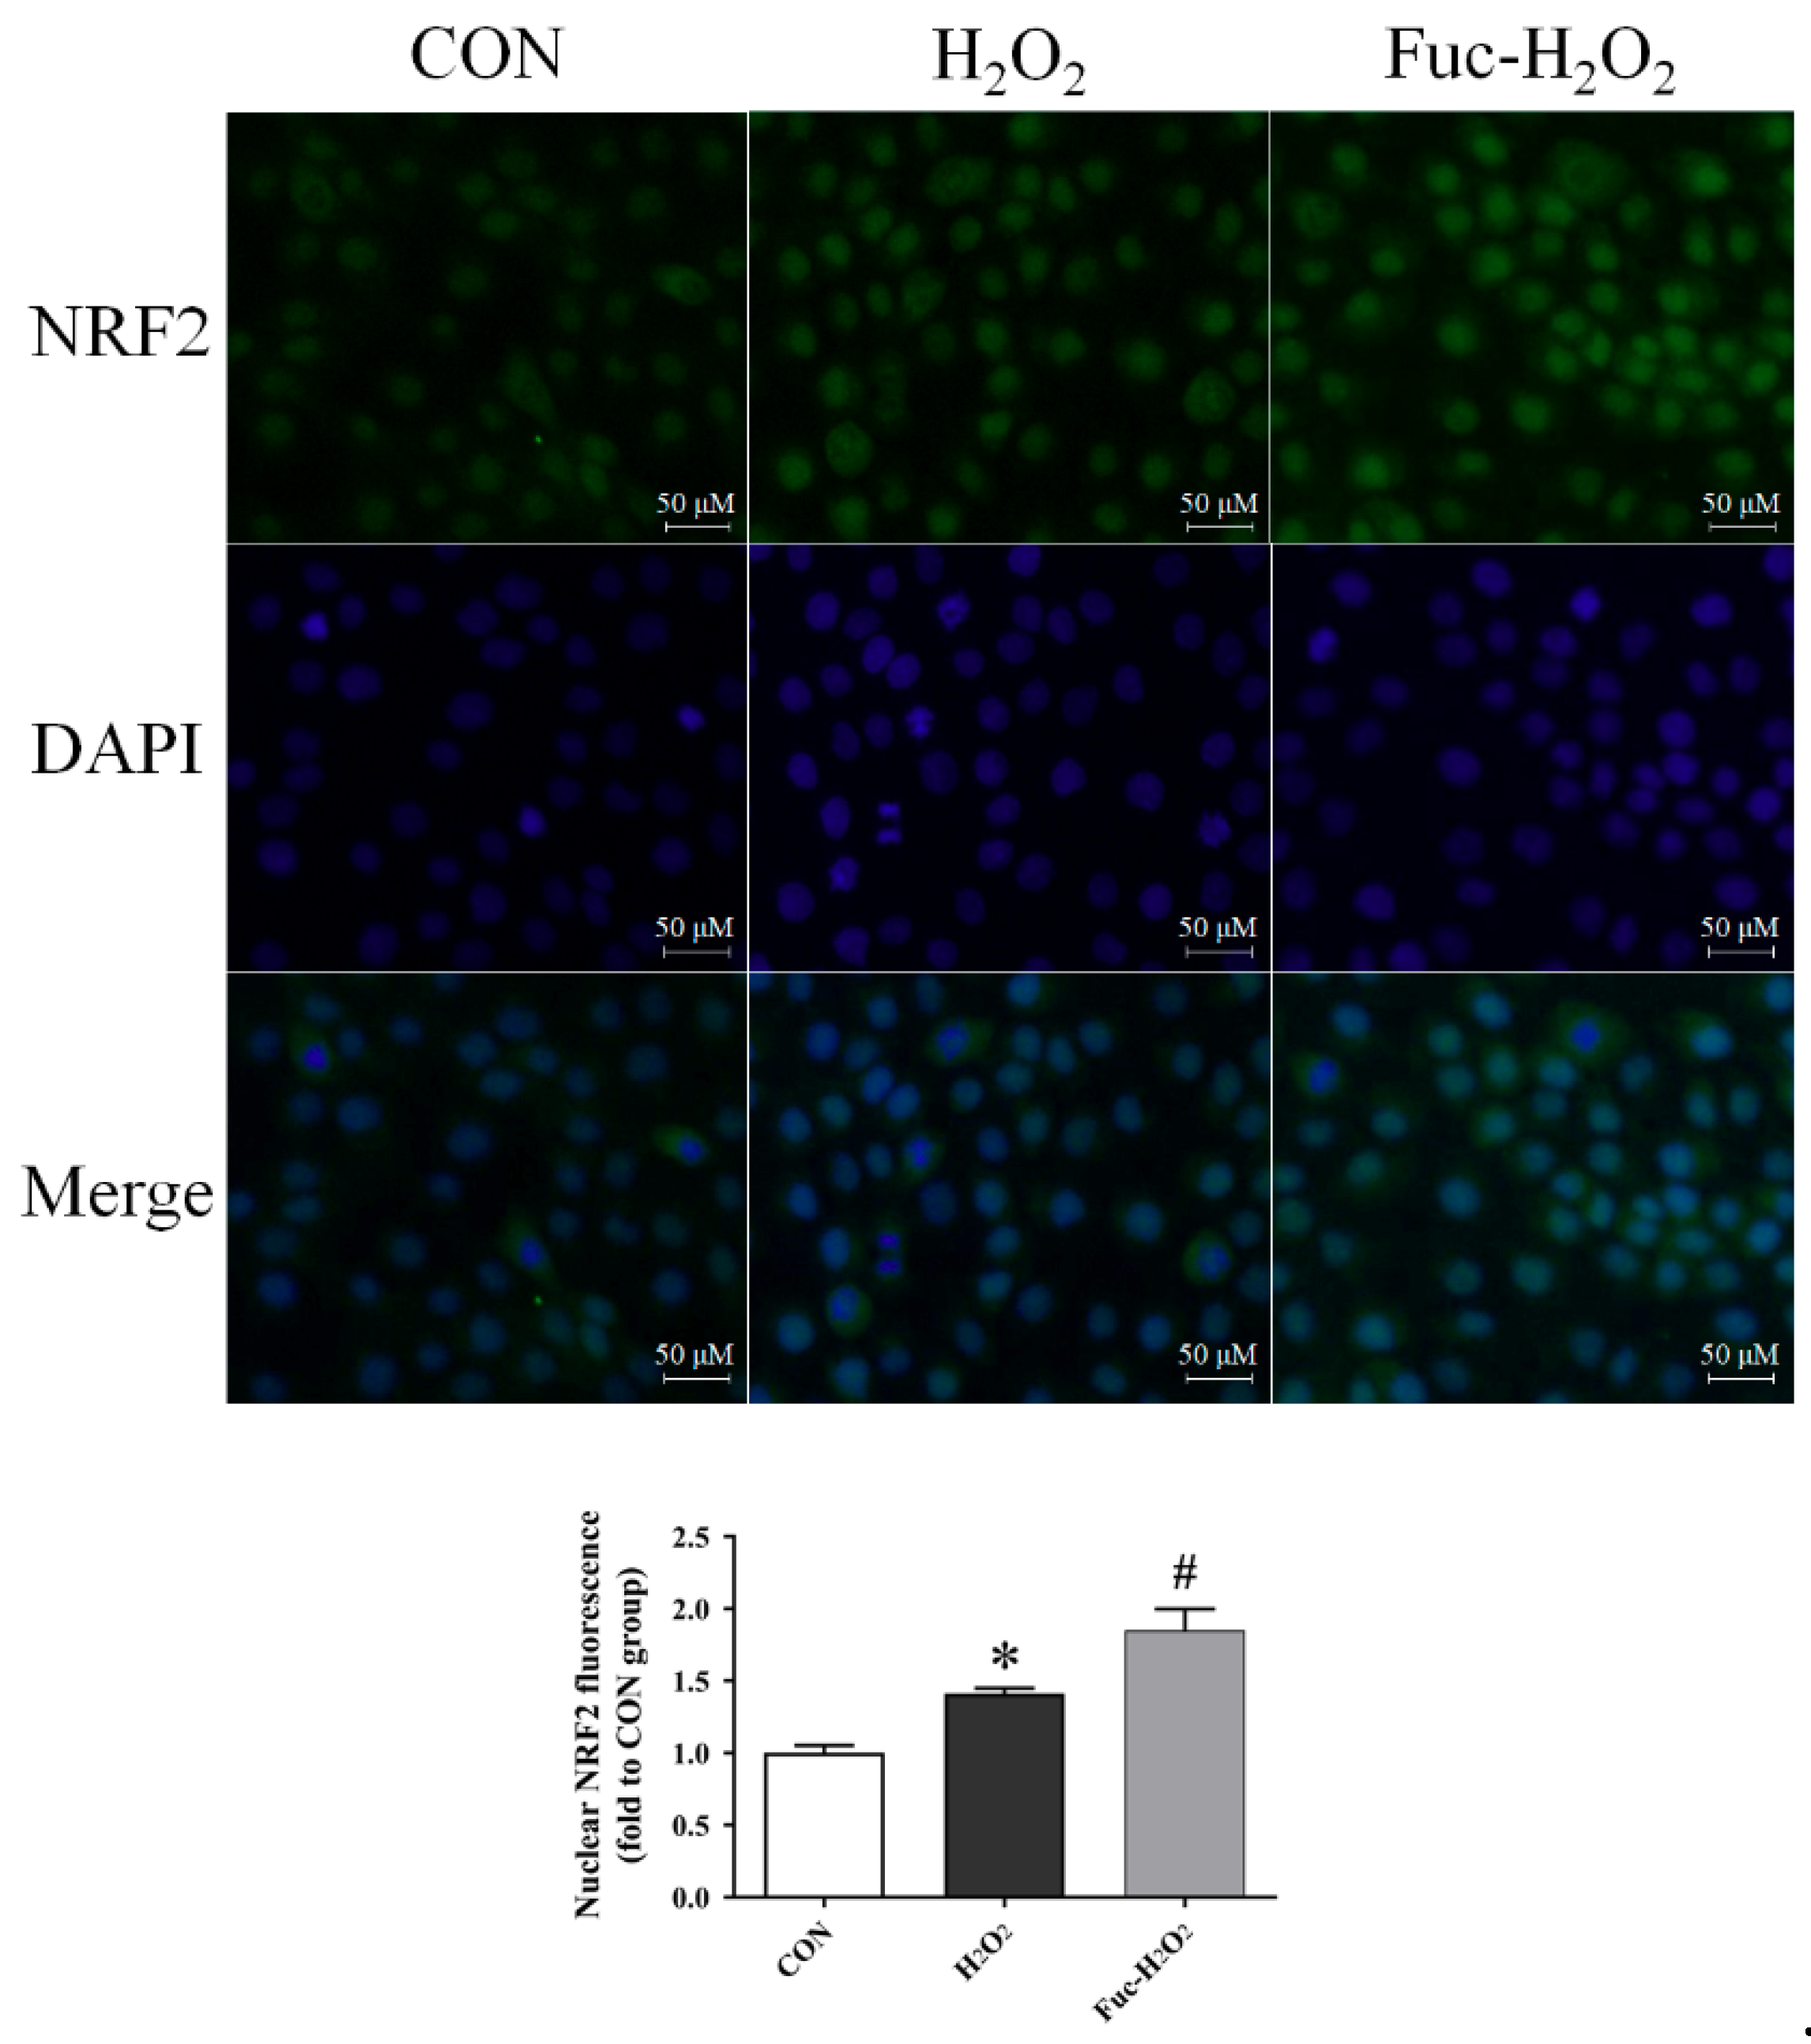
3.5. Gene Expression and the Nuclear Translocation of NRF2

As indicated in Table 2, the exposure to 0.5 mM H2O2 for 1 h downregulated mRNA expression of NQO1, SOD1, and MCL1 in IPEC-1 cells (p < 0.05). The H2O2 treatment also numerically increased NRF2 mRNA expression level but did not reach a significant level (p = 0.056). The pre-treatment with fucoidan increased the mRNA abundance of NQO1 and SOD1 (p < 0.05), but a similar effect was not observed in MCL1 mRNA expression (p > 0.05). Moreover, the mRNA level of GPX1 was increased by pre-inoculation with fucoidan when compared with those cells subjected to H2O2 only (p < 0.05). Treatment did not affect the mRNA abundance of HO1, SOD2, GSTA1, CAT, PCNA, CASP3, CASP9, BCL2, or BAX (p > 0.05). Compared with the control cells, H2O2 stimulated the translocation of NRF2 to the nucleus of IPEC-1 cells (p < 0.05), according to the fluorescence intensity data presented in Figure 6. The increase in the translocation of NRF2 to the nucleus in the IPEC-1 cells exposed to H2O2 was further promoted by fucoidan administration (p < 0.05).

4. Discussion

Hydrogen peroxide, a source of ROS, can rapidly penetrate the cell membrane and generate highly toxic hydroxyl radicals by reacting with intracellular transition metals, and the exposure to H2O2 is a well-established method to induce oxidative stress in both cell cultures and animal tissues [36]. Cai et al. [12] showed that treatment with 0.5 to 1.0 mM H2O2 for 1 h is suitable to induce oxidative stress in IPEC-J2 cells, according to the results of intracellular free radical production and cell viability. Similarly, Vergauwen et al. [11] also reported that incubating IPEC-J2 cells with 0.5 mM H2O2 for 1 h induces intracellular oxidative stress. In this study, the exposure to 0.5 to 1.5 mM H2O2 for 1 h resulted in oxidative stress in IPEC-1 cells, as shown by a sharp decrease in cell viability. The viability of IPEC-1 cells exposed to 0.5 mM H2O2 was downgraded by nearly 50%; therefore, this concentration was selected to establish an in vitro oxidative stress model in the current research. The exposure to 0.5 mM H2O2 induced increases in intracellular ROS production as well as cell apoptosis and necrosis in our study, further indicating that an oxidative stress model was successfully established. It is necessary to mention, however, that the lowest concentration of H2O2 (0.1 mM) actually stimulated cell growth in this study. Results in a variety of cultured mammalian cells have, in fact, demonstrated that low levels of ROS, such as superoxide and H2O2, stimulate cell growth and growth response by activating and/or inactivating the transcription of specific genes involved in cell cycle progression [37,38].
The highly sulfated structure endows fucoidan with prominent hydroxyl radical and superoxide anion scavenging activities, enabling its potential use as a natural antioxidant in the food industry especially in terms of a secondary antioxidant [39,40,41]. The pre-incubation with 25 and 50 μg/mL fucoidan for 24 h prevented H2O2-induced inferior cell viability in our study, and the protective effect was more pronounced when its concentration was 50 μg/mL. In agreement with our finding, a reduced viability in rat adrenal pheochromocytoma cells subjected to H2O2 was attenuated, when treating cells with 30 and 60 μg/mL fucoidan [19]. In the current research, however, the treatment of IPEC-1 cells that suffered oxidative stress with 100 or 200 μg/mL fucoidan actually did not exert a protective effect, which may be pertinent to the cytotoxicity of fucoidan at higher doses [23]. Likewise, Jeong et al. [42] observed that the administration of 50 μg/mL fucoidan alleviates 5-fluorouracil-induced cell growth inhibition in dendritic cells, but a high level of fucoidan (100 μg/mL) exhibits a slight cytotoxicity.
The intracellular ROS level is a sensitive biomarker to reflect the oxidative stress status. The increase in intracellular ROS production observed currently after exposure to H2O2 is associated with the toxic hydroxyl radicals generated from H2O2 [36]. Similar results have also been reported by Cai et al. [43] and Kahlert et al. [44] in porcine intestinal epithelial cells. The overproduction of ROS also impaired the antioxidant system in IPEC-1 cells, as supported by the simultaneously increased MDA accumulation (an end product of lipid peroxidation) and decreased GSH concentration (an important antioxidative substance). In this study, the pre-inoculation with 50 μg/mL fucoidan effectively reduced ROS production in IPEC-1 cells, and it preserved cellular antioxidant status by decreasing MDA accumulation and increasing GSH levels. The ability of fucoidan to protect the antioxidant system of IPEC-1 cells subjected to oxidative stress is correlated with its sulfated chemical structure that could directly scavenge ROS as well as its regulation of redox signals, such as the NRF2 signaling pathway, as summarized by Phull and Kim [18]. Of note, Wang et al. [39] also reported that fucoidan improves antioxidant capacity and reduces the levels of MDA and ROS in human hepatocytes under oxidative stress.
Usually, uncontrolled and/or prolonged oxidative stress is detrimental to lipids, protein, and DNA, and results in cell cycle interruption and arrest, which can ultimately cause apoptosis and necrosis in intestinal epithelial cells via various signaling pathways [6]. In this study, we once again confirmed that oxidative stress induced by H2O2 caused serious apoptosis and necrosis in porcine intestinal epithelial cells, accompanied by a simultaneous decrease in the mRNA expression of MCL1, an important anti-apoptotic protein, which may be directly associated with the increased ROS generation resulting from the exposure to H2O2 [45]. In an in vitro study, Gao et al. [19] showed that fucoidan treatment inhibits apoptosis in H2O2-induced PC12 cells by increasing the BCL2/BAX ratio, decreasing active CASP3 expression, and facilitating protein kinase B phosphorylation. A similar study conducted on human lung fibroblast cells also revealed that fucoidan inhibits H2O2-induced cell apoptosis and necrosis, and the underlying mechanism includes inhibition of caspase activity, a decrease in the BAX/BCL2 ratio, relocalization of BAX and cytochrome c, upregulation of anti-apoptotic members of the BCL2 family, and a decline in the phosphorylation of mitogen-activated protein kinases [20]. In this study, fucoidan protected the IPEC-1 cells against H2O2-induced necrosis, but the expression levels of key genes involved in the apoptotic pathway (e.g., CASP3, CASP9, BCL2, and BAX) were almost similar among treatments. Despite this, we cannot exclude the participation of these apoptosis-associated regulators in the protective action of fucoidan to prevent the excessive necrosis of IPEC-1 cells induced by H2O2, since gene expression patterns do not always reflect their enzymatic or signal activities. Thus, additional work is required to determine the potential mechanisms by which fucoidan preserves cellular homeostasis under stressful conditions.
Nuclear factor erythroid 2-related factor 2 is a key nuclear transcription factor, which is ubiquitously expressed in a wide range of cell types, and it regulates a series of defensive genes that encode detoxifying enzymes and antioxidant proteins [46]. Inside the nucleus, NRF2 heterodimerizes with a cofactor molecule, musculo-aponeurotic fibrosarcoma, and then binds the antioxidant response element sequences to activate various target genes, such as NQO1, HO1, SOD, GPX, and CAT [47]. Under normal physical conditions, the inhibitor of NRF2 retains NRF2 in the cytoplasm and cytoplasmic NRF2 is continuously degraded, which in turn results in a relatively low accumulation of nuclear NRF2; however, NRF2 will translocate to nuclei to activate defensive genes under the conditions of oxidative stress [48]. The increased nuclear NRF2 fluorescence intensity in IPEC-1 cells subjected to H2O2 in the current study was therefore a cellular defense response. Recently, Zhuang et al. [49] also reported that H2O2 induces a translocation of NRF2 to the nuclei in rat small intestine epithelial cells. Contradictory with the increase in the nuclear NRF2 accumulation, the mRNA expression of NQO1 and SOD1 was downregulated in IPEC-1 cells during oxidative stress, and this may be due to cell antioxidant system failure. A similar result has also been reported recently, in which H2O2 upregulates cellular NRF2 protein levels but downregulates the mRNA expression of SOD1 in IPEC-1 cells [50]. Studies have demonstrated that fucoidan prevents oxidative damage by activating the NRF2 signaling pathway in human hepatocytes [22] and human lung fibroblast cells [20]. In the present study, fucoidan also promoted the translocation of NRF2 to nuclei in IPEC-1 cells exposed to oxidative stress, as supported by its significantly high nuclear fluorescence intensity. The increase in nuclear NRF2 accumulation resulting from fucoidan is consistent with the reduced intracellular ROS production and improved antioxidant status of porcine intestinal epithelial cells subjected to oxidative stress induced by H2O2. Moreover, the mRNA levels of NQO1, SOD1, and GPX1, the downstream target genes of NRF2, were upregulated when treating cells with fucoidan under oxidative stress. These results together suggest that activation of NRF2 signals may be an underlying mechanism responsible for the antioxidant biological function of fucoidan in porcine intestinal epithelial cells facing oxidative stress.

5. Conclusions

In conclusion, our findings demonstrate that fucoidan could ameliorate H2O2-induced oxidative stress in porcine intestinal epithelial cells, and the mechanisms responsible for its protective effects may be associated with the activation of the NRF2 signaling pathway.

Author Contributions

Conceptualization, Y.L. and X.F.; data curation, Y.L. and H.Z.; formal analysis, Y.L. and H.Z.; funding acquisition, Y.L. and X.F.; investigation, Y.L., W.Z., L.W., X.Y. and F.X.; methodology, Y.L. and W.Z.; supervision, J.Y. and X.F.; writing—original draft, Y.L.; writing—review and editing, Y.C., H.Z. and T.W.

Funding

This research was funded by the National Natural Science Foundation of China (grant number 31902197) and the National Modern Porcine Industrial-Technology System (grant number CARS-35).

Conflicts of Interest

The authors declare no conflict of interest.

References

  1. Jones, R.M.; Neish, A.S. Redox signaling mediated by the gut microbiota. Free Radic. Biol. Med. 2017, 105, 41–47. [Google Scholar] [CrossRef] [PubMed] [Green Version]
  2. van der Flier, L.G.; Clevers, H. Stem cells, self-renewal, and differentiation in the intestinal epithelium. Annu. Rev. Physiol. 2009, 71, 241–260. [Google Scholar] [CrossRef] [PubMed]
  3. Aw, T.Y. Molecular and cellular responses to oxidative stress and changes in oxidation-reduction imbalance in the intestine. Am. J. Clin. Nutr. 1999, 70, 557–565. [Google Scholar] [CrossRef] [PubMed] [Green Version]
  4. Pisoschi, A.M.; Pop, A. The role of antioxidants in the chemistry of oxidative stress: A review. Eur. J. Med. Chem. 2015, 97, 55–74. [Google Scholar] [CrossRef] [PubMed]
  5. Halliwell, B.; Zhao, K.; Whiteman, M. The gastrointestinal tract: A major site of antioxidant action? Free Radic. Res. 2000, 33, 819–830. [Google Scholar] [CrossRef] [PubMed]
  6. Pérez, S.; Taléns-Visconti, R.; Rius-Pérez, S.; Finamor, I.; Sastre, J. Redox signaling in the gastrointestinal tract. Free Radic. Biol. Med. 2017, 104, 75–103. [Google Scholar] [CrossRef] [PubMed]
  7. Blander, J.M. Death in the intestinal epithelium-basic biology and implications for inflammatory bowel disease. FEBS J. 2016, 283, 2720–2730. [Google Scholar] [CrossRef] [PubMed]
  8. Bhattacharyya, A.; Chattopadhyay, R.; Mitra, S.; Crowe, S.E. Oxidative stress: An essential factor in the pathogenesis of gastrointestinal mucosal diseases. Physiol. Rev. 2014, 94, 329–354. [Google Scholar] [CrossRef] [Green Version]
  9. Lykkesfeldt, J.; Svendsen, O. Oxidants and antioxidants in disease: Oxidative stress in farm animals. Vet. J. 2007, 173, 502–511. [Google Scholar] [CrossRef]
  10. Gessner, D.K.; Ringseis, R.; Eder, K. Potential of plant polyphenols to combat oxidative stress and inflammatory processes in farm animals. J. Anim. Physiol. Anim. Nutr. 2017, 101, 605–628. [Google Scholar] [CrossRef]
  11. Vergauwen, H.; Tambuyzer, B.; Jennes, K.; Degroote, J.; Wang, W.; De Smet, S.; Michiels, J.; Van Ginneken, C. Trolox and ascorbic acid reduce direct and indirect oxidative stress in the IPEC-J2 cells, an in vitro model for the porcine gastrointestinal tract. PLoS ONE 2015, 10, 0120485. [Google Scholar] [CrossRef] [PubMed] [Green Version]
  12. Cai, X.; Zhu, L.H.; Chen, X.L.; Sheng, Y.S.; Guo, Q.; Bao, J.; Xu, J.X. X/XO or H2O2 induced IPEC-J2 cell as a new in vitro model for studying apoptosis in post-weaning piglets. Cytotechnology 2016, 68, 713–724. [Google Scholar] [CrossRef] [PubMed] [Green Version]
  13. Zou, Y.; Wang, J.; Peng, J.; Wei, H.K. Oregano essential oil induces SOD1 and GSH expression through Nrf2 activation and alleviates hydrogen peroxide-induced oxidative damage in IPEC-J2 cells. Oxid. Med. Cell. Longev. 2016, 2016, 5987183. [Google Scholar] [CrossRef] [PubMed]
  14. Zheng, L.F.; Wei, H.K.; Yu, H.C.; Xing, Q.; Zou, Y.; Zhou, Y.F.; Peng, J. Fish skin gelatin hydrolysate production by ginger powder induces glutathione synthesis to prevent hydrogen peroxide induced intestinal oxidative stress via the Pept1-p62-Nrf2 cascade. J. Agric. Food Chem. 2018, 66, 11601–11611. [Google Scholar] [CrossRef] [PubMed]
  15. Yu, Y.; Shen, M.Y.; Song, Q.Q.; Xie, J.H. Biological activities and pharmaceutical applications of polysaccharide from natural resources: A review. Carbohydr. Polym. 2018, 183, 91–101. [Google Scholar] [CrossRef] [PubMed]
  16. Vo, T.S.; Kim, S.K. Fucoidans as a natural bioactive ingredient for functional foods. J. Funct. Foods 2013, 5, 16–27. [Google Scholar] [CrossRef]
  17. Li, B.; Lu, F.; Wei, X.J.; Zhao, R.X. Fucoidan: Structure and bioactivity. Molecules 2008, 13, 1671–1695. [Google Scholar] [CrossRef] [Green Version]
  18. Phull, A.R.; Kim, S.J. Fucoidan as bio-functional molecule: Insights into the anti-inflammatory potential and associated molecular mechanisms. J. Funct. Foods 2017, 38, 415–426. [Google Scholar] [CrossRef]
  19. Gao, Y.L.; Dong, C.H.; Yin, J.G.; Shen, J.Y.; Tian, J.W.; Li, C.M. Neuroprotective effect of fucoidan on H2O2-induced apoptosis in PC12 cells via activation of PI3K/Akt pathway. Cell. Mol. Neurobiol. 2012, 32, 523–529. [Google Scholar] [CrossRef]
  20. Roy Chowdhury, S.; Sengupta, S.; Biswas, S.; Sinha, T.K.; Sen, R.; Basak, R.K.; Adhikari, B.; Bhattacharyya, A. Bacterial fucose-rich polysaccharide stabilizes MAPK-mediated Nrf2/Keap1 signaling by directly scavenging reactive oxygen species during hydrogen peroxide-induced apoptosis of human lung fibroblast cells. PLoS ONE 2014, 9, 113663. [Google Scholar] [CrossRef] [Green Version]
  21. Han, Y.S.; Lee, J.H.; Jung, J.S.; Noh, H.; Baek, M.J.; Ryu, J.M.; Yoon, Y.M.; Han, H.J.; Lee, S.H. Fucoidan protects mesenchymal stem cells against oxidative stress and enhances vascular regeneration in a murine hindlimb ischemia model. Int. J. Cardiol. 2015, 198, 187–195. [Google Scholar] [CrossRef] [PubMed]
  22. Wang, Y.Q.; Wei, J.G.; Tu, M.J.; Gu, J.G.; Zhang, W. Fucoidan alleviates acetaminophen-induced hepatotoxicity via oxidative stress inhibition and Nrf2 translocation. Int. J. Mol. Sci. 2018, 19, 4050. [Google Scholar] [CrossRef] [PubMed] [Green Version]
  23. Huang, C.Y.; Kuo, C.H.; Lee, C.H. Antibacterial and antioxidant capacities and attenuation of lipid accumulation in 3T3-L1 adipocytes by low-molecular-weight fucoidans prepared from compressional-puffing-pretreated Sargassum Crassifolium. Mar. Drugs 2018, 16, 24. [Google Scholar] [CrossRef] [PubMed] [Green Version]
  24. Michel, C.; Lahaye, M.; Bonnet, C.; Mabeau, S.; Barry, J.L. In vitro fermentation by human faecal bacteria of total and purified dietary fibres from brown seaweeds. Br. J. Nutr. 1996, 75, 263–280. [Google Scholar] [CrossRef] [PubMed]
  25. Irhimeh, M.R.; Fitton, J.H.; Lowenthal, R.M.; Kongtawelert, P. A quantitative method to detect fucoidan in human plasma using a novel antibody. Methods Find. Exp. Clin. Pharmacol. 2005, 27, 705–710. [Google Scholar] [CrossRef] [PubMed]
  26. Tokita, Y.; Nakajima, K.; Mochida, H.; Iha, M.; Nagamine, T. Development of a fucoidan-specific antibody and measurement of fucoidan in serum and urine by sandwich ELISA. Biosci. Biotechnol. Biochem. 2010, 74, 350–357. [Google Scholar] [CrossRef]
  27. Paszti-Gere, E.; Csibrik-Nemeth, E.; Szeker, K.; Csizinszky, R.; Jakab, C.; Galfi, P. Acute oxidative stress affects IL-8 and TNF-α expression in IPEC-J2 porcine epithelial cells. Inflammation 2012, 35, 994–1004. [Google Scholar] [CrossRef]
  28. Zhang, H.; Su, W.P.; Ying, Z.X.; Chen, Y.P.; Zhou, L.; Li, Y.; Zhang, J.F.; Zhang, L.L.; Wang, T. N-acetylcysteine attenuates intrauterine growth retardation-induced hepatic damage in suckling piglets by improving glutathione synthesis and cellular homeostasis. Eur. J. Nutr. 2018, 57, 327–338. [Google Scholar] [CrossRef]
  29. Kono, Y. Generation of superoxide radical during autoxidation of hydroxylamine and an assay for superoxide dismutase. Arch. Biochem. Biophys. 1978, 186, 189–195. [Google Scholar] [CrossRef]
  30. Hafeman, D.G.; Sunde, R.A.; Hoekstra, W.G. Effect of dietary selenium on erythrocyte and liver glutathione peroxidase in the rat. J. Nutr. 1974, 104, 580–587. [Google Scholar] [CrossRef]
  31. Owens, C.W.I.; Belcher, R.V. A colorimetric micro-method for the determination of glutathione. Biochem. J. 1965, 94, 705–711. [Google Scholar] [CrossRef] [PubMed]
  32. Placer, Z.A.; Cushman, L.L.; Johnson, B.C. Estimation of product of lipid peroxidation (malonyl dialdehyde) in biochemical systems. Anal. Biochem. 1966, 16, 359–364. [Google Scholar] [CrossRef]
  33. Kruger, N.J. The Bradford method for protein quantitation. Methods Mol. Biol. 1994, 32, 9–15. [Google Scholar] [PubMed]
  34. Livak, K.J.; Schmittgen, T.D. Analysis of relative gene expression data using real-time quantitative pcr and the 2−ΔΔCT method. Methods 2001, 25, 402–408. [Google Scholar] [CrossRef] [PubMed]
  35. Zhang, X.J.; He, C.; Tian, K.; Li, P.; Su, H.; Wan, J.B. Ginsenoside Rb1 attenuates angiotensin II-induced abdominal aortic aneurysm through inactivation of the JNK and p38 signaling pathways. Vasc. Pharmacol. 2015, 73, 86–95. [Google Scholar] [CrossRef] [PubMed]
  36. Wang, Z.J.; Xie, J.H.; Nie, S.P.; Xie, M.Y. Review on cell models to evaluate the potential antioxidant activity of polysaccharides. Food Funct. 2017, 8, 915–926. [Google Scholar] [CrossRef]
  37. Martindale, J.L.; Holbrook, N.J. Cellular response to oxidative stress: Signaling for suicide and survival. J. Cell. Physiol. 2002, 192, 1–15. [Google Scholar] [CrossRef]
  38. Burch, P.M.; Heintz, N.H. Redox regulation of cell-cycle re-entry: Cyclin D1 as a primary target for the mitogenic effects of reactive oxygen and nitrogen species. Antioxid. Redox Signal 2005, 7, 741–751. [Google Scholar] [CrossRef]
  39. Wang, J.; Liu, L.; Zhang, Q.B.; Zhang, Z.S.; Qi, H.M.; Li, P.C. Synthesized oversulphated, acetylated and benzoylated derivatives of fucoidan extracted from Laminaria japonica and their potential antioxidant activity in vitro. Food Chem. 2009, 114, 1285–1290. [Google Scholar] [CrossRef]
  40. Lim, S.J.; Aida, W.M.W.; Maskat, M.Y.; Mamot, S.; Ropien, J.; Mohd, D.M. Isolation and antioxidant capacity of fucoidan from selected Malaysian seaweeds. Food Hydrocoll. 2014, 42, 280–288. [Google Scholar] [CrossRef]
  41. Phull, A.R.; Majid, M.; Haq, I.U.; Khan, M.R.; Kim, S.J. In vitro and in vivo evaluation of anti-arthritic, antioxidant efficacy of fucoidan from Undaria pinnatifida (Harvey) Suringar. Int. J. Biol. Macromol. 2017, 97, 468–480. [Google Scholar] [CrossRef] [PubMed]
  42. Jeong, B.E.; Ko, E.J.; Joo, H.G. Cytoprotective effects of fucoidan, an algae-derived polysaccharide on 5-fluorouracil-treated dendritic cells. Food Chem. Toxicol. 2012, 50, 1480–1484. [Google Scholar] [CrossRef] [PubMed]
  43. Cai, X.; Chen, X.L.; Wang, X.C.; Xu, C.C.; Guo, Q.; Zhu, L.H.; Zhu, S.W.; Xu, J.X. Pre-protective effect of lipoic acid on injury induced by H2O2 in IPEC-J2 cells. Mol. Cell. Biochem. 2013, 378, 73–81. [Google Scholar] [CrossRef] [PubMed]
  44. Kahlert, S.; Junnikkala, S.; Renner, L.; Hynönen, U.; Hartig, R.; Nossol, C.; Barta-Böszörményi, A.; Dänicke, S.; Souffrant, W.B.; Palva, A.; et al. Physiological concentration of exogenous lactate reduces antimycin a triggered oxidative stress in intestinal epithelial cell line IPEC-1 and IPEC-J2 in vitro. PLoS ONE 2016, 11, 0153135. [Google Scholar] [CrossRef]
  45. Thomas, L.W.; Lam, C.; Edwards, S.W. Mcl-1; the molecular regulation of protein function. FEBS Lett. 2010, 584, 2981–2989. [Google Scholar] [CrossRef] [Green Version]
  46. Kaspar, J.W.; Niture, S.K.; Jaiswal, A.K. Nrf2: INrf2 (Keap1) signaling in oxidative stress. Free Radic. Biol. Med. 2009, 47, 1304–1309. [Google Scholar] [CrossRef] [Green Version]
  47. Vriend, J.; Reiter, R.J. The Keap1-Nrf2-antioxidant response element pathway: A review of its regulation by melatonin and the proteasome. Mol. Cell. Endocrinol. 2015, 401, 213–220. [Google Scholar] [CrossRef]
  48. Suzuki, T.; Motohashi, H.; Yamamoto, M. Toward clinical application of the Keap1-Nrf2 pathway. Trends Pharmacol. Sci. 2013, 34, 340–346. [Google Scholar] [CrossRef]
  49. Zhuang, S.; Yu, R.Y.; Zhong, J.; Liu, P.; Liu, Z.J. Rhein from Rheum rhabarbarum inhibits hydrogen-peroxide-induced oxidative stress in intestinal epithelial cells partly through PI3K/Akt-mediated Nrf2/HO-1 pathways. J. Agric. Food Chem. 2019, 67, 2519–2529. [Google Scholar] [CrossRef]
  50. Wen, Z.S.; Xue, R.; Du, M.; Tang, Z.; Xiang, X.W.; Zheng, B.; Qu, Y.L. Hemp seed polysaccharides protect intestinal epithelial cells from hydrogen peroxide-induced oxidative stress. Int. J. Biol. Macromol. 2019, 135, 203–211. [Google Scholar] [CrossRef]
Figure 1. Cell viability of IPEC-1 cells as tested by CCK-8 dye after the treatments of different H2O2 concentrations. The data were calculated as a percentage of the control cells. Statistical differences between mean values were analyzed by ANOVA and Tukey’s post hoc test for multiple comparison. Values are means ± SE, n = 6. Different lowercase letters indicate statistically significant differences (p < 0.05).
Animals 09 01108 g001
Figure 2. Effect of different fucoidan concentrations on the cell viability of IPEC-1 cells under the conditions of oxidative stress. The data were calculated as a percentage of the control cells. Statistical differences between mean values were analyzed by ANOVA and Tukey’s post hoc test for multiple comparison. Values are means ± SE, n = 6. Different lowercase letters indicate statistically significant differences (p < 0.05).
Animals 09 01108 g002
Figure 3. Effect of fucoidan on the rate of apoptosis (A) and necrosis (B) of IPEC-1 cells under the conditions of oxidative stress. In each plot, Q1 quadrant represents naked nucleus cells; Q2 quadrant represents necrotic cells; Q3 quadrant represents apoptotic cells; and Q4 quadrant represents viable cells. CON, cells were kept in culture medium; H2O2, cells were kept in culture medium and treated with 0.5 mM H2O2; Fuc-H2O2, cells were incubated in culture medium containing 50 μg/mL fucoidan and then treated with 0.5 mM H2O2. Statistical differences between mean values were analyzed by ANOVA and Tukey’s post hoc test for pairwise comparison. Values are means ± SE, n = 3. * Significant difference (p < 0.05) from the CON group. # Significant difference (p < 0.05) from the H2O2 group.
Animals 09 01108 g003
Figure 4. Effect of fucoidan on the ROS accumulation of IPEC-1 cells under the conditions of oxidative stress. The fluorescence intensity of 2′,7′-dichlorofluorescein (DCF) in IPEC-1 cells represented the intracellular accumulation of ROS measured using a fluorescence microscope. CON, cells were kept in culture medium; H2O2, cells were kept in culture medium and treated with 0.5 mM H2O2; Fuc-H2O2, cells were incubated in culture medium containing 50 μg/mL fucoidan and then treated with 0.5 mM H2O2. Statistical differences between mean values were analyzed by ANOVA and Tukey’s post hoc test for pairwise comparison. Values are means ± SE, n = 3. * Significant difference (p < 0.05) from the CON group. # Significant difference (p < 0.05) from the H2O2 group.
Animals 09 01108 g004
Figure 5. Effect of fucoidan on the activities of SOD (A) and GPX (B) and the contents of GSH (C) and MDA (D) of IPEC-1 cells under the conditions of oxidative stress. CON, cells were kept in culture medium; H2O2, cells were kept in culture medium and treated with 0.5 mM H2O2; Fuc-H2O2, cells were incubated in culture medium containing 50 μg/mL fucoidan and then treated with 0.5 mM H2O2. Statistical differences between mean values were analyzed by ANOVA and Tukey’s post hoc test for pairwise comparison. Values are means ± SE, n = 3. * Significant difference (p < 0.05) from the CON group. # Significant difference (p < 0.05) from the H2O2 group.
Animals 09 01108 g005
Figure 6. Effect of fucoidan on the level of nuclear NRF2 translocation of IPEC-1 cells under the conditions of oxidative stress. CON, cells were kept in culture medium; H2O2, cells were kept in culture medium and treated with 0.5 mM H2O2; Fuc-H2O2, cells were incubated in culture medium containing 50 μg/mL fucoidan and then treated with 0.5 mM H2O2. Statistical differences between mean values were analyzed by ANOVA and Tukey’s post hoc test for pairwise comparison. Values are means ± SE, n = 3. * Significant difference (p < 0.05) from the CON group. # Significant difference (p < 0.05) from the H2O2 group.
Animals 09 01108 g006
Table 1. Primer sequences used for real-time PCR assay.
NameGenbank 1Sequence (5′→3′) 2Length
NRF2NM_001185152.1GGACAGCAGAAGTGATCCCC97
CAAAACCGTATCACTGGCCG
HO1NM_001004027.1TGATGGCGTCCTTGTACCAC71
GACCGGGTTCTCCTTGTTGT
NQO1NM_001159613.1CATGGCGGTCAGAAAAGCAC135
ATGGCATACAGGTCCGACAC
SOD1NM_001190422.1AAGGCCGTGTGTGTGCTGAA118
GATCACCTTCAGCCAGTCCTTT
SOD2NM_214127.2GGCCTACGTGAACAACCTGA126
TGATTGATGTGGCCTCCACC
GPX1NM_214201.1CCTCAAGTACGTCCGACCAG85
GTGAGCATTTGCGCCATTCA
GSTA1NM_214389.2ACACCCAGGACCAATCTTCTG199
AGTCTCAGGTACATTCCGGG
CATNM_214301.2TCCAGCCAGTGACCAGATGA182
CCCGGTCAAAGTGAGCCATT
PCNANM_001291925.1TAGCCGCGTCGTTGTGATTC105
GGCCTCGTTGATGAGGTCTT
CASP3NM_214131.1GGATTGAGACGGACAGTGGG124
CCGTCCTTTGAATTTCGCCA
CASP9XM_003127618.4CTGCCAAGCAAATGGTCCAG151
ACAGGACATCCATCTGTGCC
MCL1NM_001348806.1CGGAGTAACAAACTGGGGCA177
AACCCATCCCAGCCTCTTTG
BCL2XM_021099593.1GAGTTCGGTGGGGTCATGTG152
TACAGCTCCACAAAGGCATCC
BAXXM_003127290.5GGCCCTTTTGCTTCAGGGTTT119
GACACTCGCTCAACTTCTTGG
GAPDHNM_001206359.1CCAAGGAGTAAGAGCCCCTG125
AAGTCAGGAGATGCTCGGTG
ACTBXM_003124280.5TGGAACGGTGAAGGTGACAG176
CTTTTGGGAAGGCAGGGACT
NRF2, nuclear factor, erythroid 2-related factor 2; HO1, heme oxygenase 1; NQO1, NAD(P)H quinone dehydrogenase 1; SOD1, superoxide dismutase 1; SOD2, superoxide dismutase 2; GPX1, glutathione peroxidase 1; GSTA1, glutathione S-transferase alpha 1; CAT, catalase; PCNA, proliferating cell nuclear antigen; CASP3, caspase 3; CASP9, caspase 9; MCL1, myeloid cell leukemia-1; BCL2, B cell lymphoma 2; BAX, BCL2-associated X protein; GAPDH, glyceraldehyde-3-phosphate dehydrogenase; ACTB, beta actin. 1 GenBank Accession Number. 2 Shown as the forward primer followed by the reverse primer.
Table 2. Effects of fucoidan pretreatment on the relative gene expression levels of IPEC-1 cells under the conditions of oxidative stress.
Items 1CONH2O2Fuc-H2O2Contrast
CON vs. H2O2H2O2 vs. Fuc-H2O2
NRF21.00 ± 0.148.10 ± 1.998.97 ± 2.140.0560.931
HO11.00 ± 0.041.01 ± 0.091.08 ± 0.120.9970.821
NQO11.00 ± 0.070.22 ± 0.02 *0.52 ± 0.07 #<0.0010.024
SOD11.00 ± 0.080.58 ± 0.04 *0.91 ± 0.08 #0.0140.037
SOD21.00 ± 0.080.63 ± 0.071.06 ± 0.220.2360.163
GPX11.00 ± 0.021.11 ± 0.101.86 ± 0.18 #0.7970.011
GSTA11.00 ± 0.251.82 ± 0.421.75 ± 0.260.2470.986
CAT1.00 ± 0.030.93 ± 0.060.97 ± 0.080.7290.892
PCNA1.00 ± 0.060.97 ± 0.131.10 ± 0.180.9880.784
CASP31.00 ± 0.281.04 ± 0.410.97 ± 0.370.9970.991
CASP91.00 ± 0.081.04 ± 0.050.89 ± 0.070.9200.341
MCL11.00 ± 0.090.60 ± 0.08 *0.69 ± 0.040.0200.668
BCL21.00 ± 0.120.68 ± 0.120.77 ± 0.150.2800.867
BAX1.00 ± 0.160.99 ± 0.171.09 ± 0.230.9990.919
NRF2, nuclear factor erythroid 2-related factor 2; NQO1, NAD(P)H quinone dehydrogenase 1; HO1, heme oxygenase 1; SOD1, superoxide dismutase 1; SOD2, superoxide dismutase 2; GPX1, glutathione peroxidase; GSTA1, glutathione S-transferase alpha 1; CAT, catalase; PCNA, proliferating cell nuclear antigen; CASP3, caspase 3; CASP9, caspase 9; MCL1, myeloid cell leukemia-1; BCL2, B cell lymphoma 2; BAX, BCL2-associated X protein. 1 CON, cells were kept in culture medium; H2O2, cells were kept in culture medium and treated with 0.5 mM H2O2; Fuc-H2O2, cells were incubated in culture medium containing 50 μg/mL fucoidan and then treated with 0.5 mM H2O2. Values are means ± SE, n = 3. * Significant difference (p < 0.05) from the CON group. # Significant difference (p < 0.05) from the H2O2 group.

