
Effect of Moderate Consumption of Different Phenolic-Content Beers on the Human Gut Microbiota Composition: A Randomized Crossover Trial

 , , , ,
Abstract
:1. Introduction
2. Materials and Methods
2.1. Study Design and Participants
2.2. Study Intervention
2.3. Sample Processing and Biochemical Evaluation
2.4. Gut Microbiome Analysis
2.5. Ethics
2.6. Statistical Analysis
3. Results
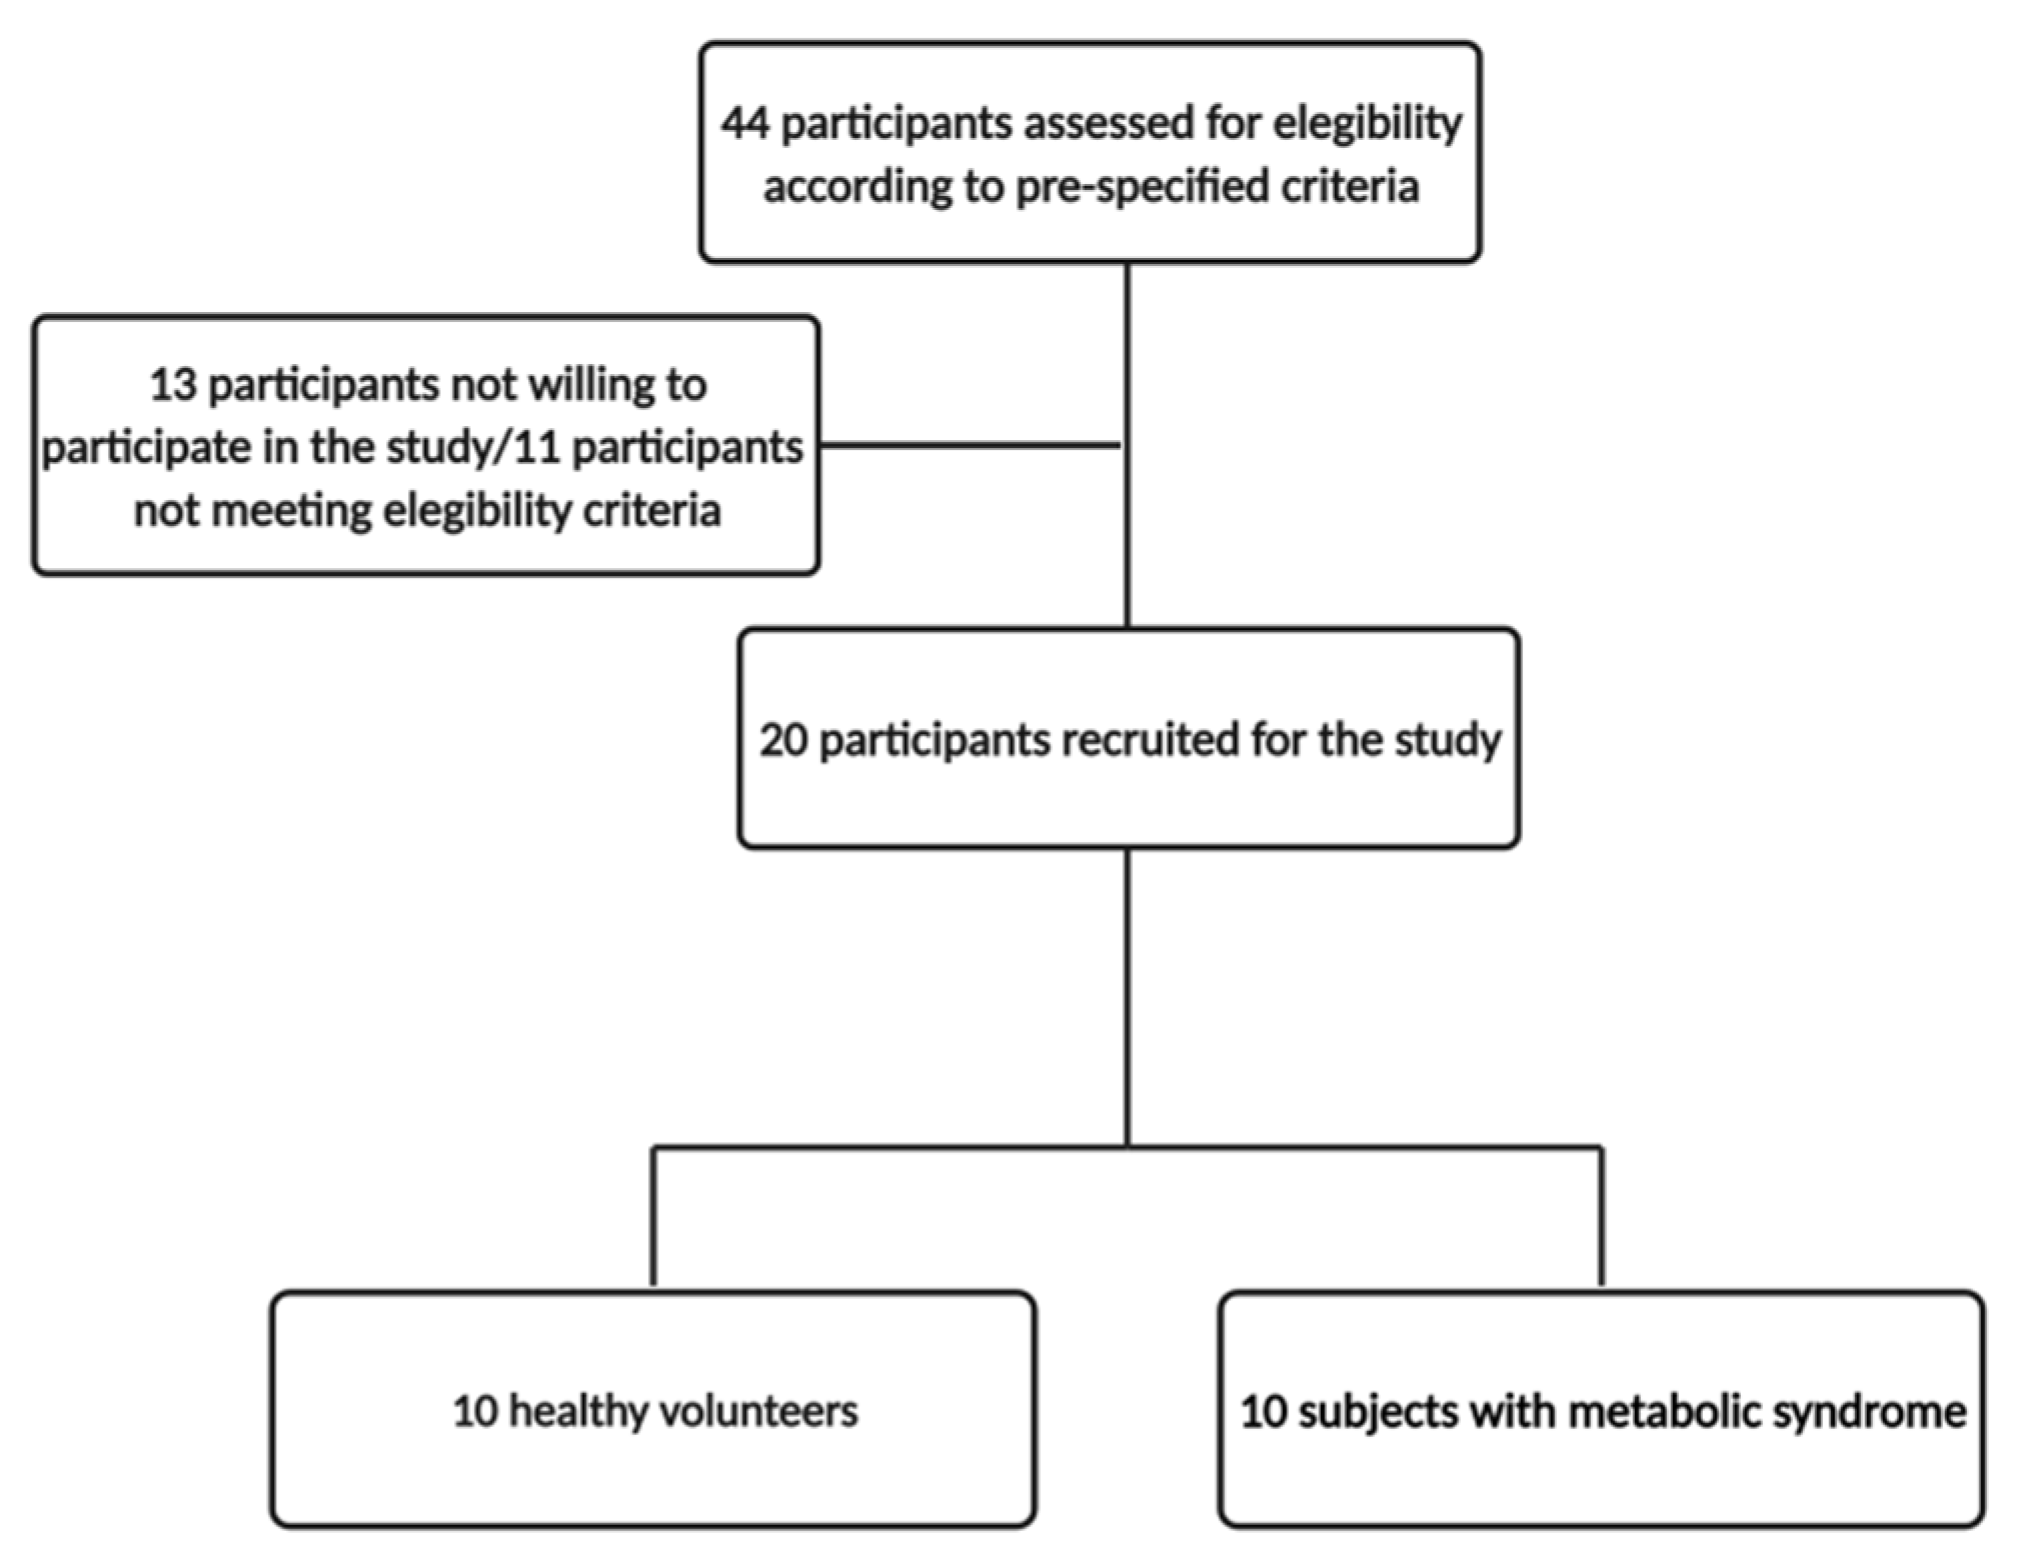
3.1. Study Population
3.2. Dietary Assessment
3.3. Clinical, Anthropometric and Biochemical Parameters
3.4. Gut Microbiota
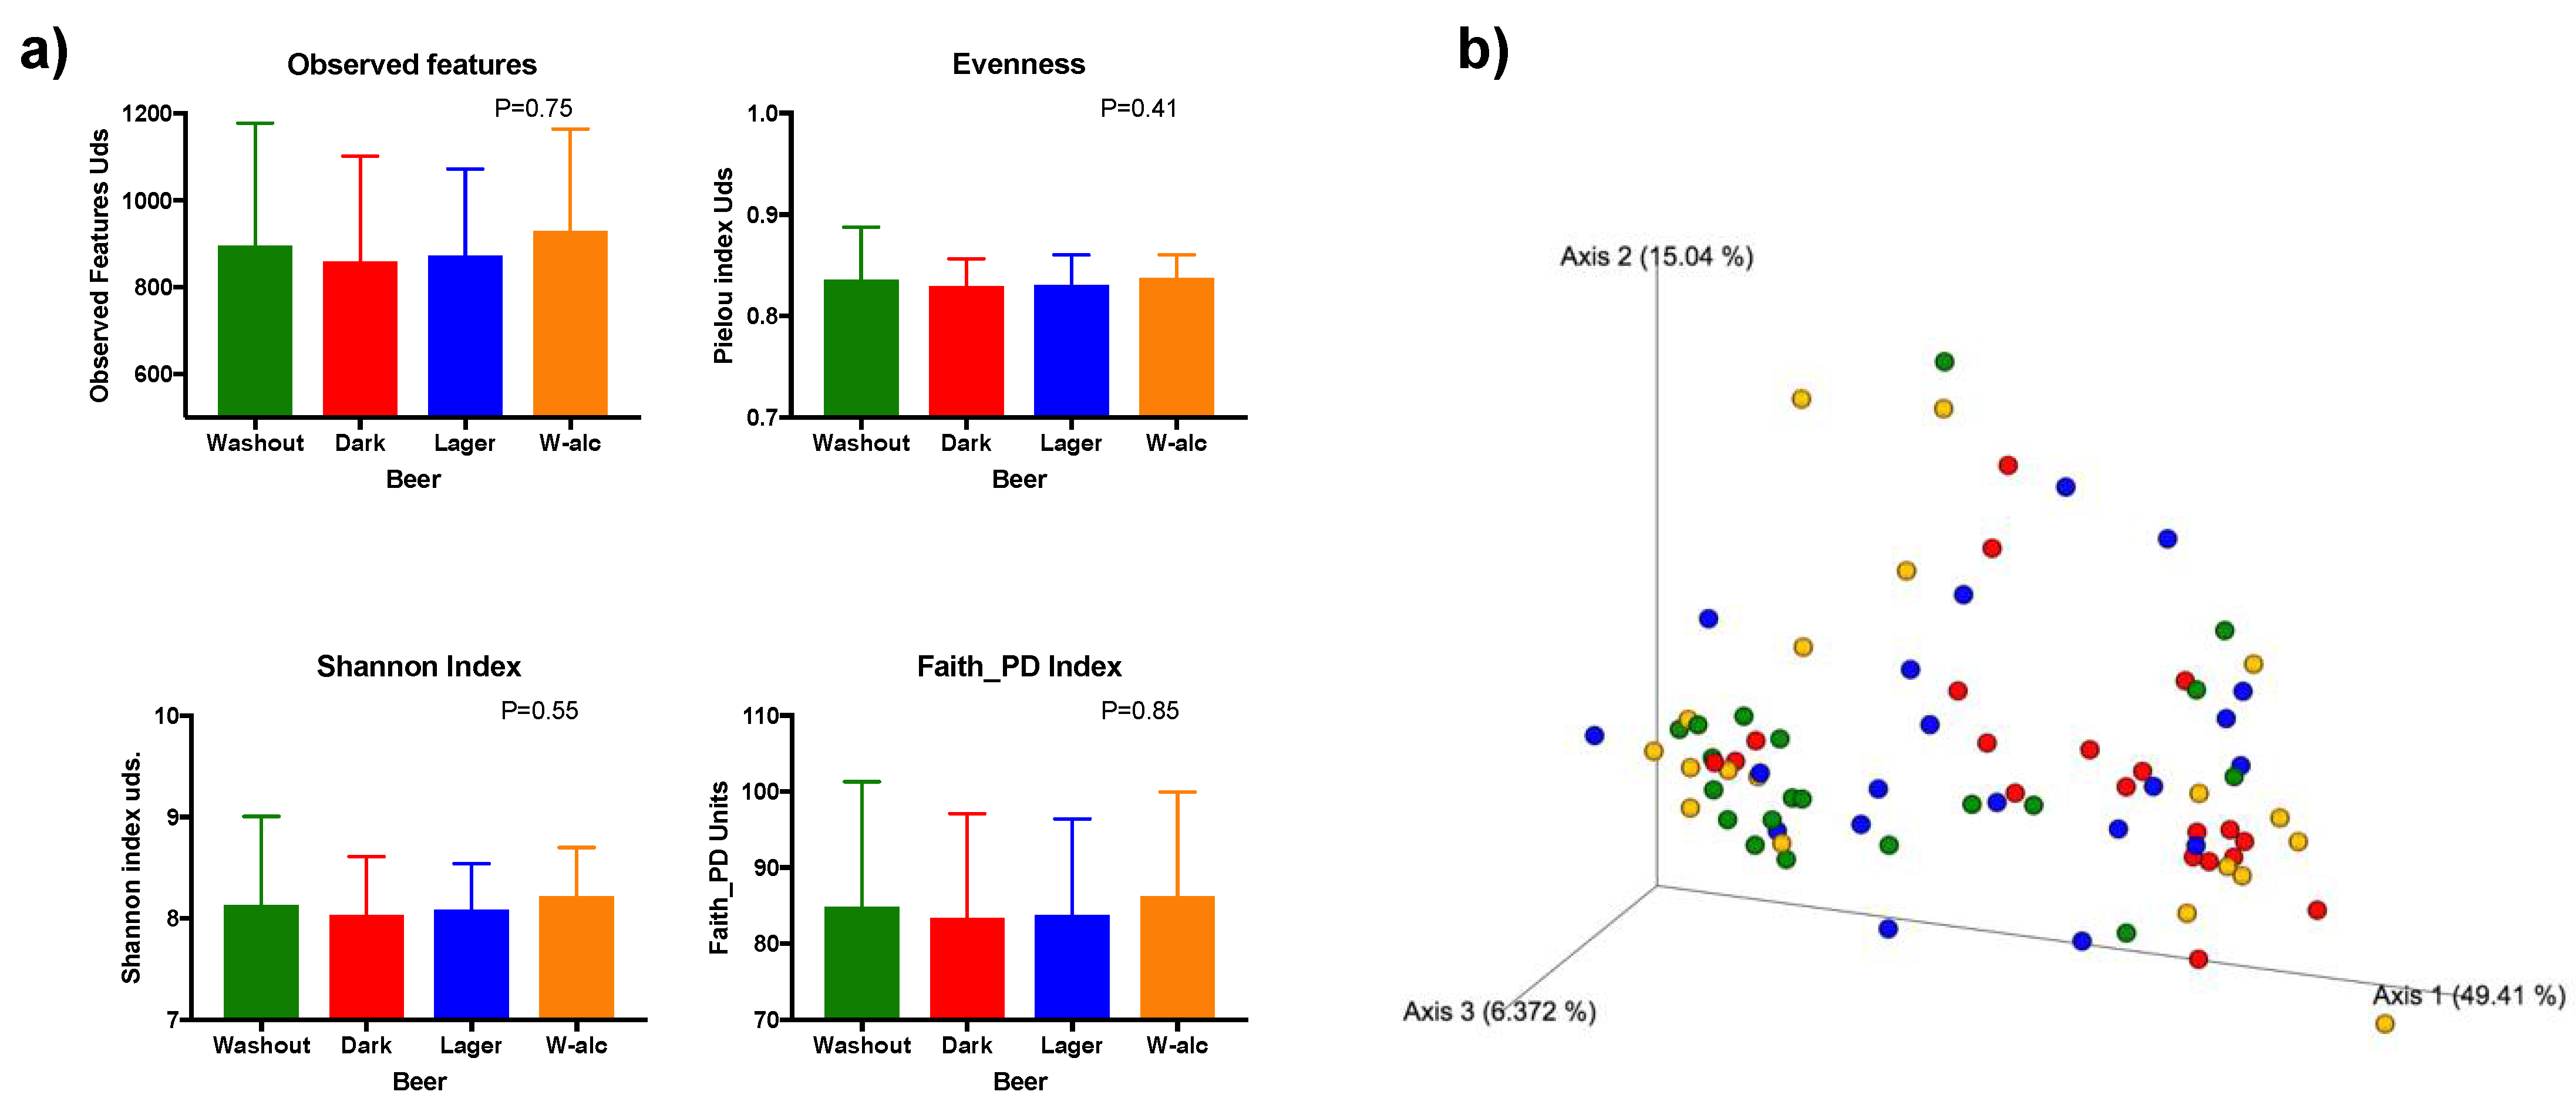
3.4.1. Diversity
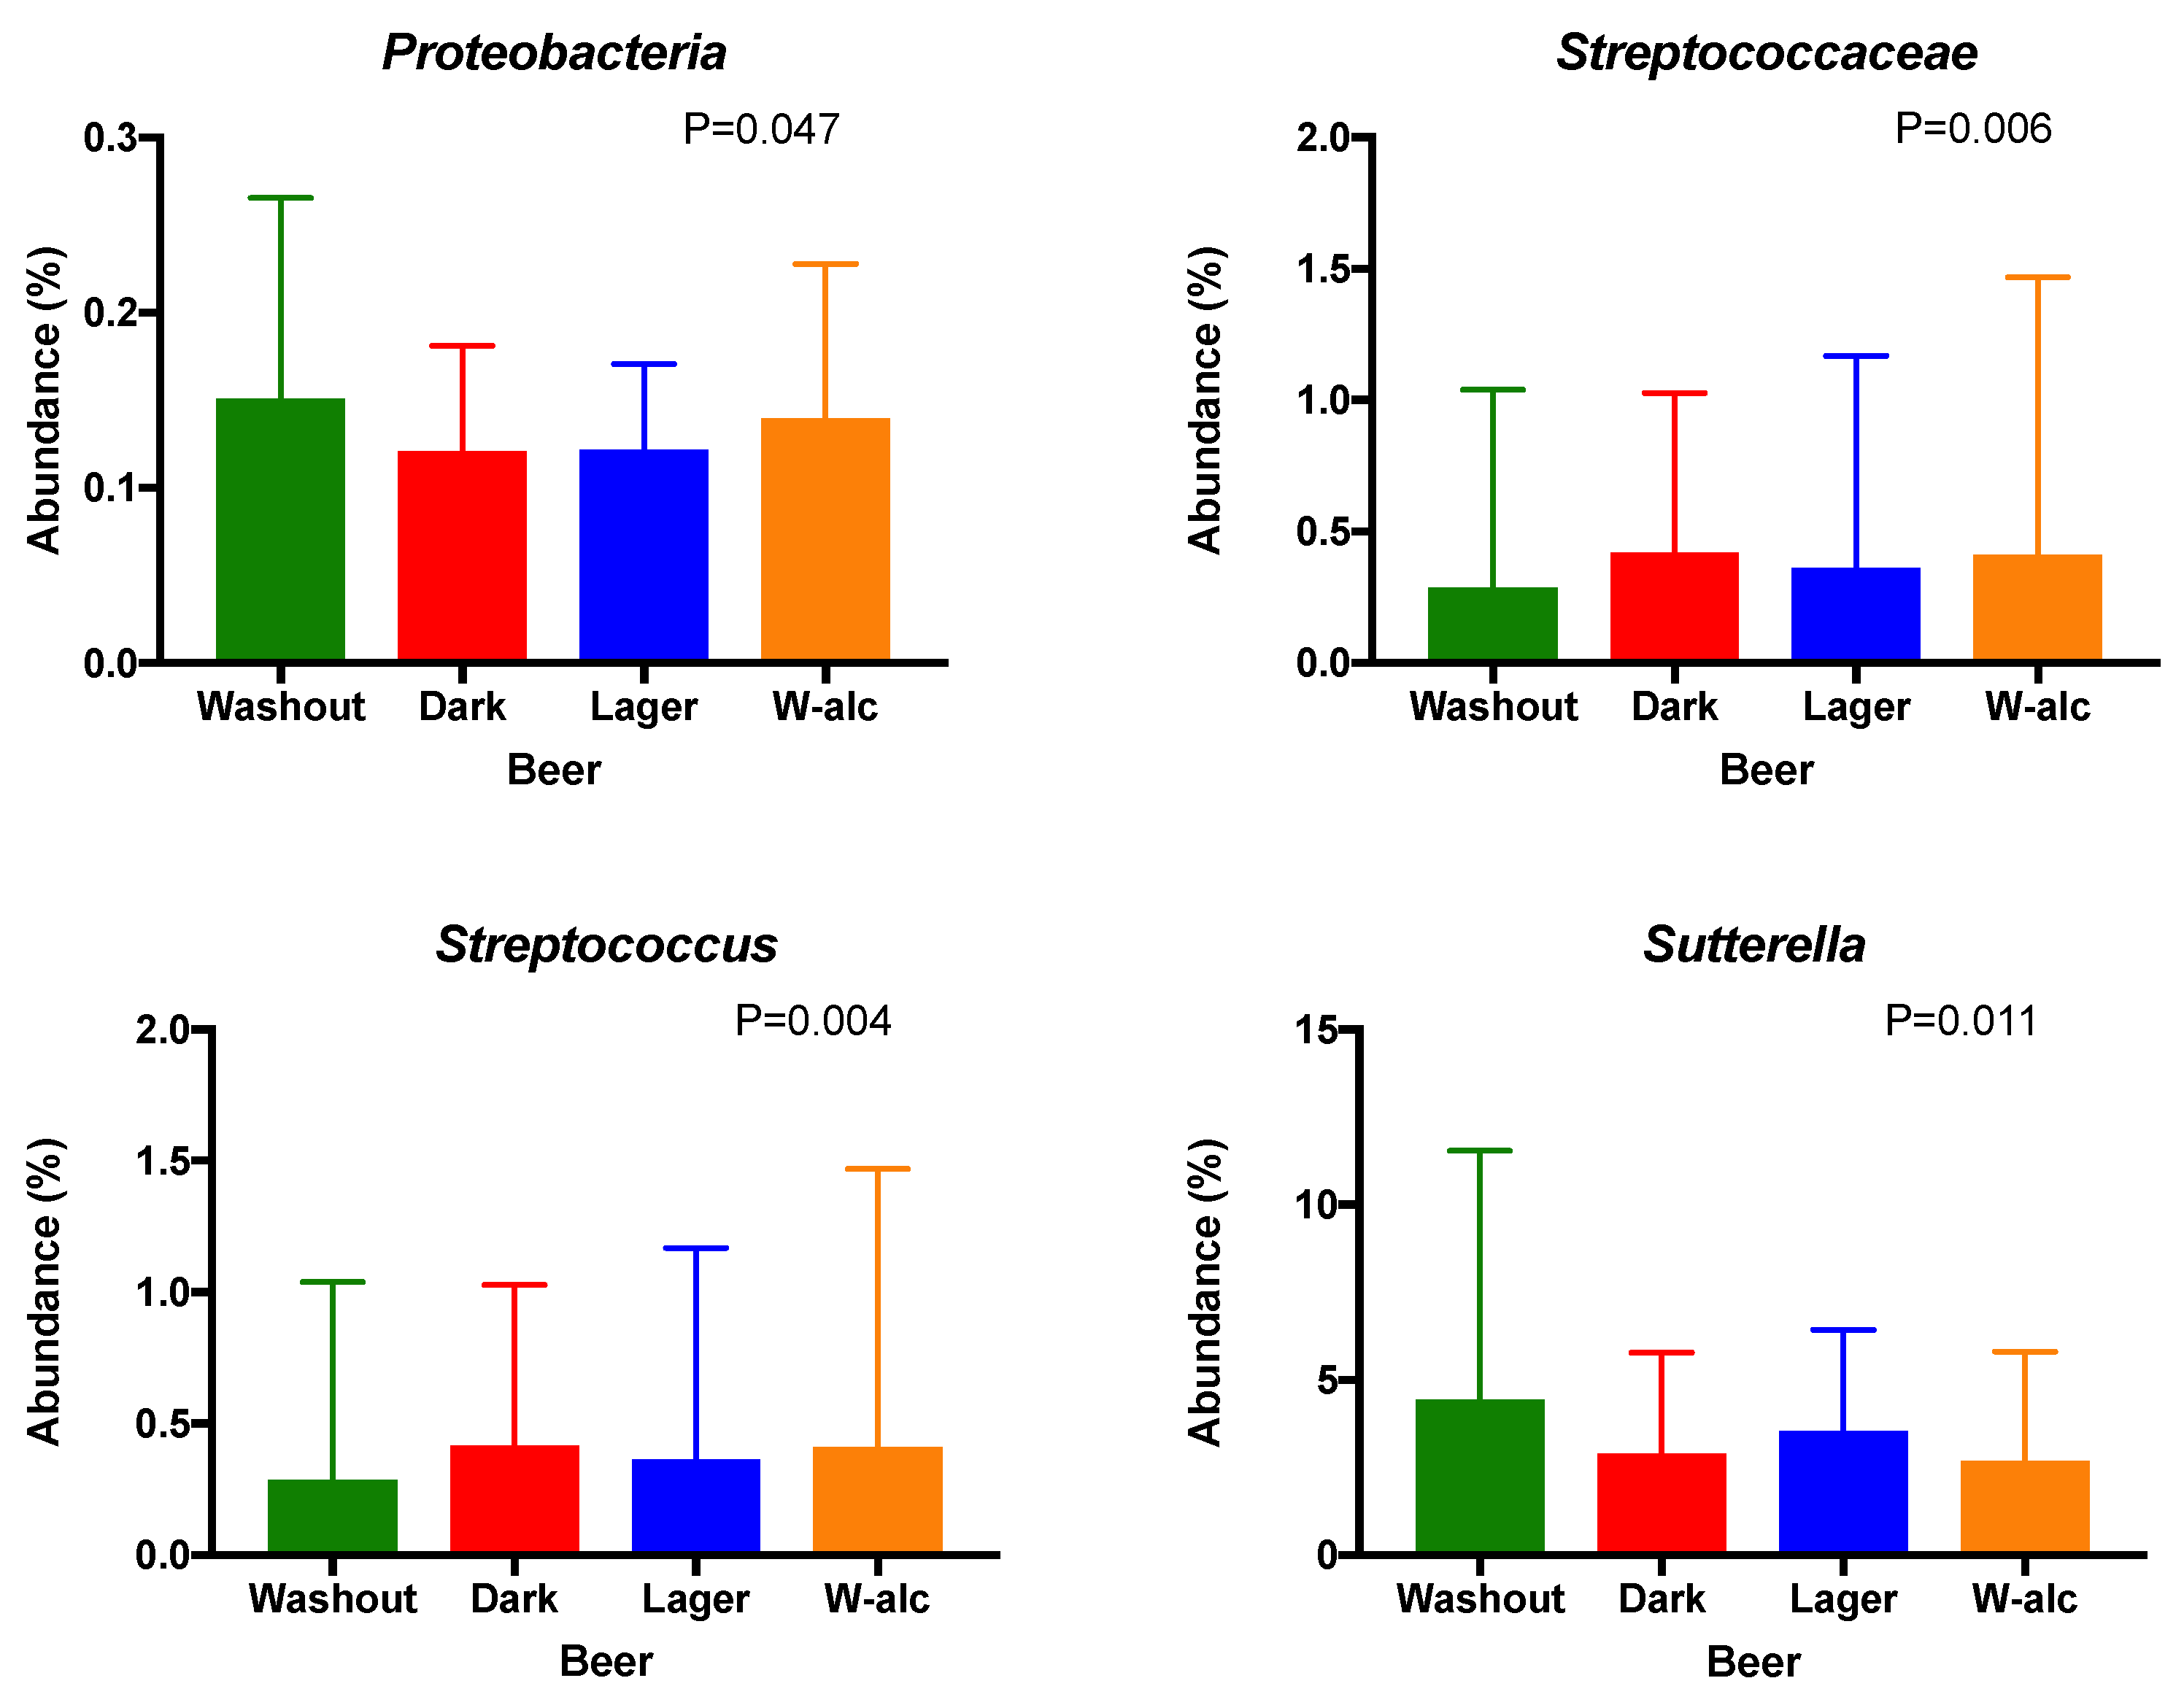
3.4.2. Bacterial Relative Abundances
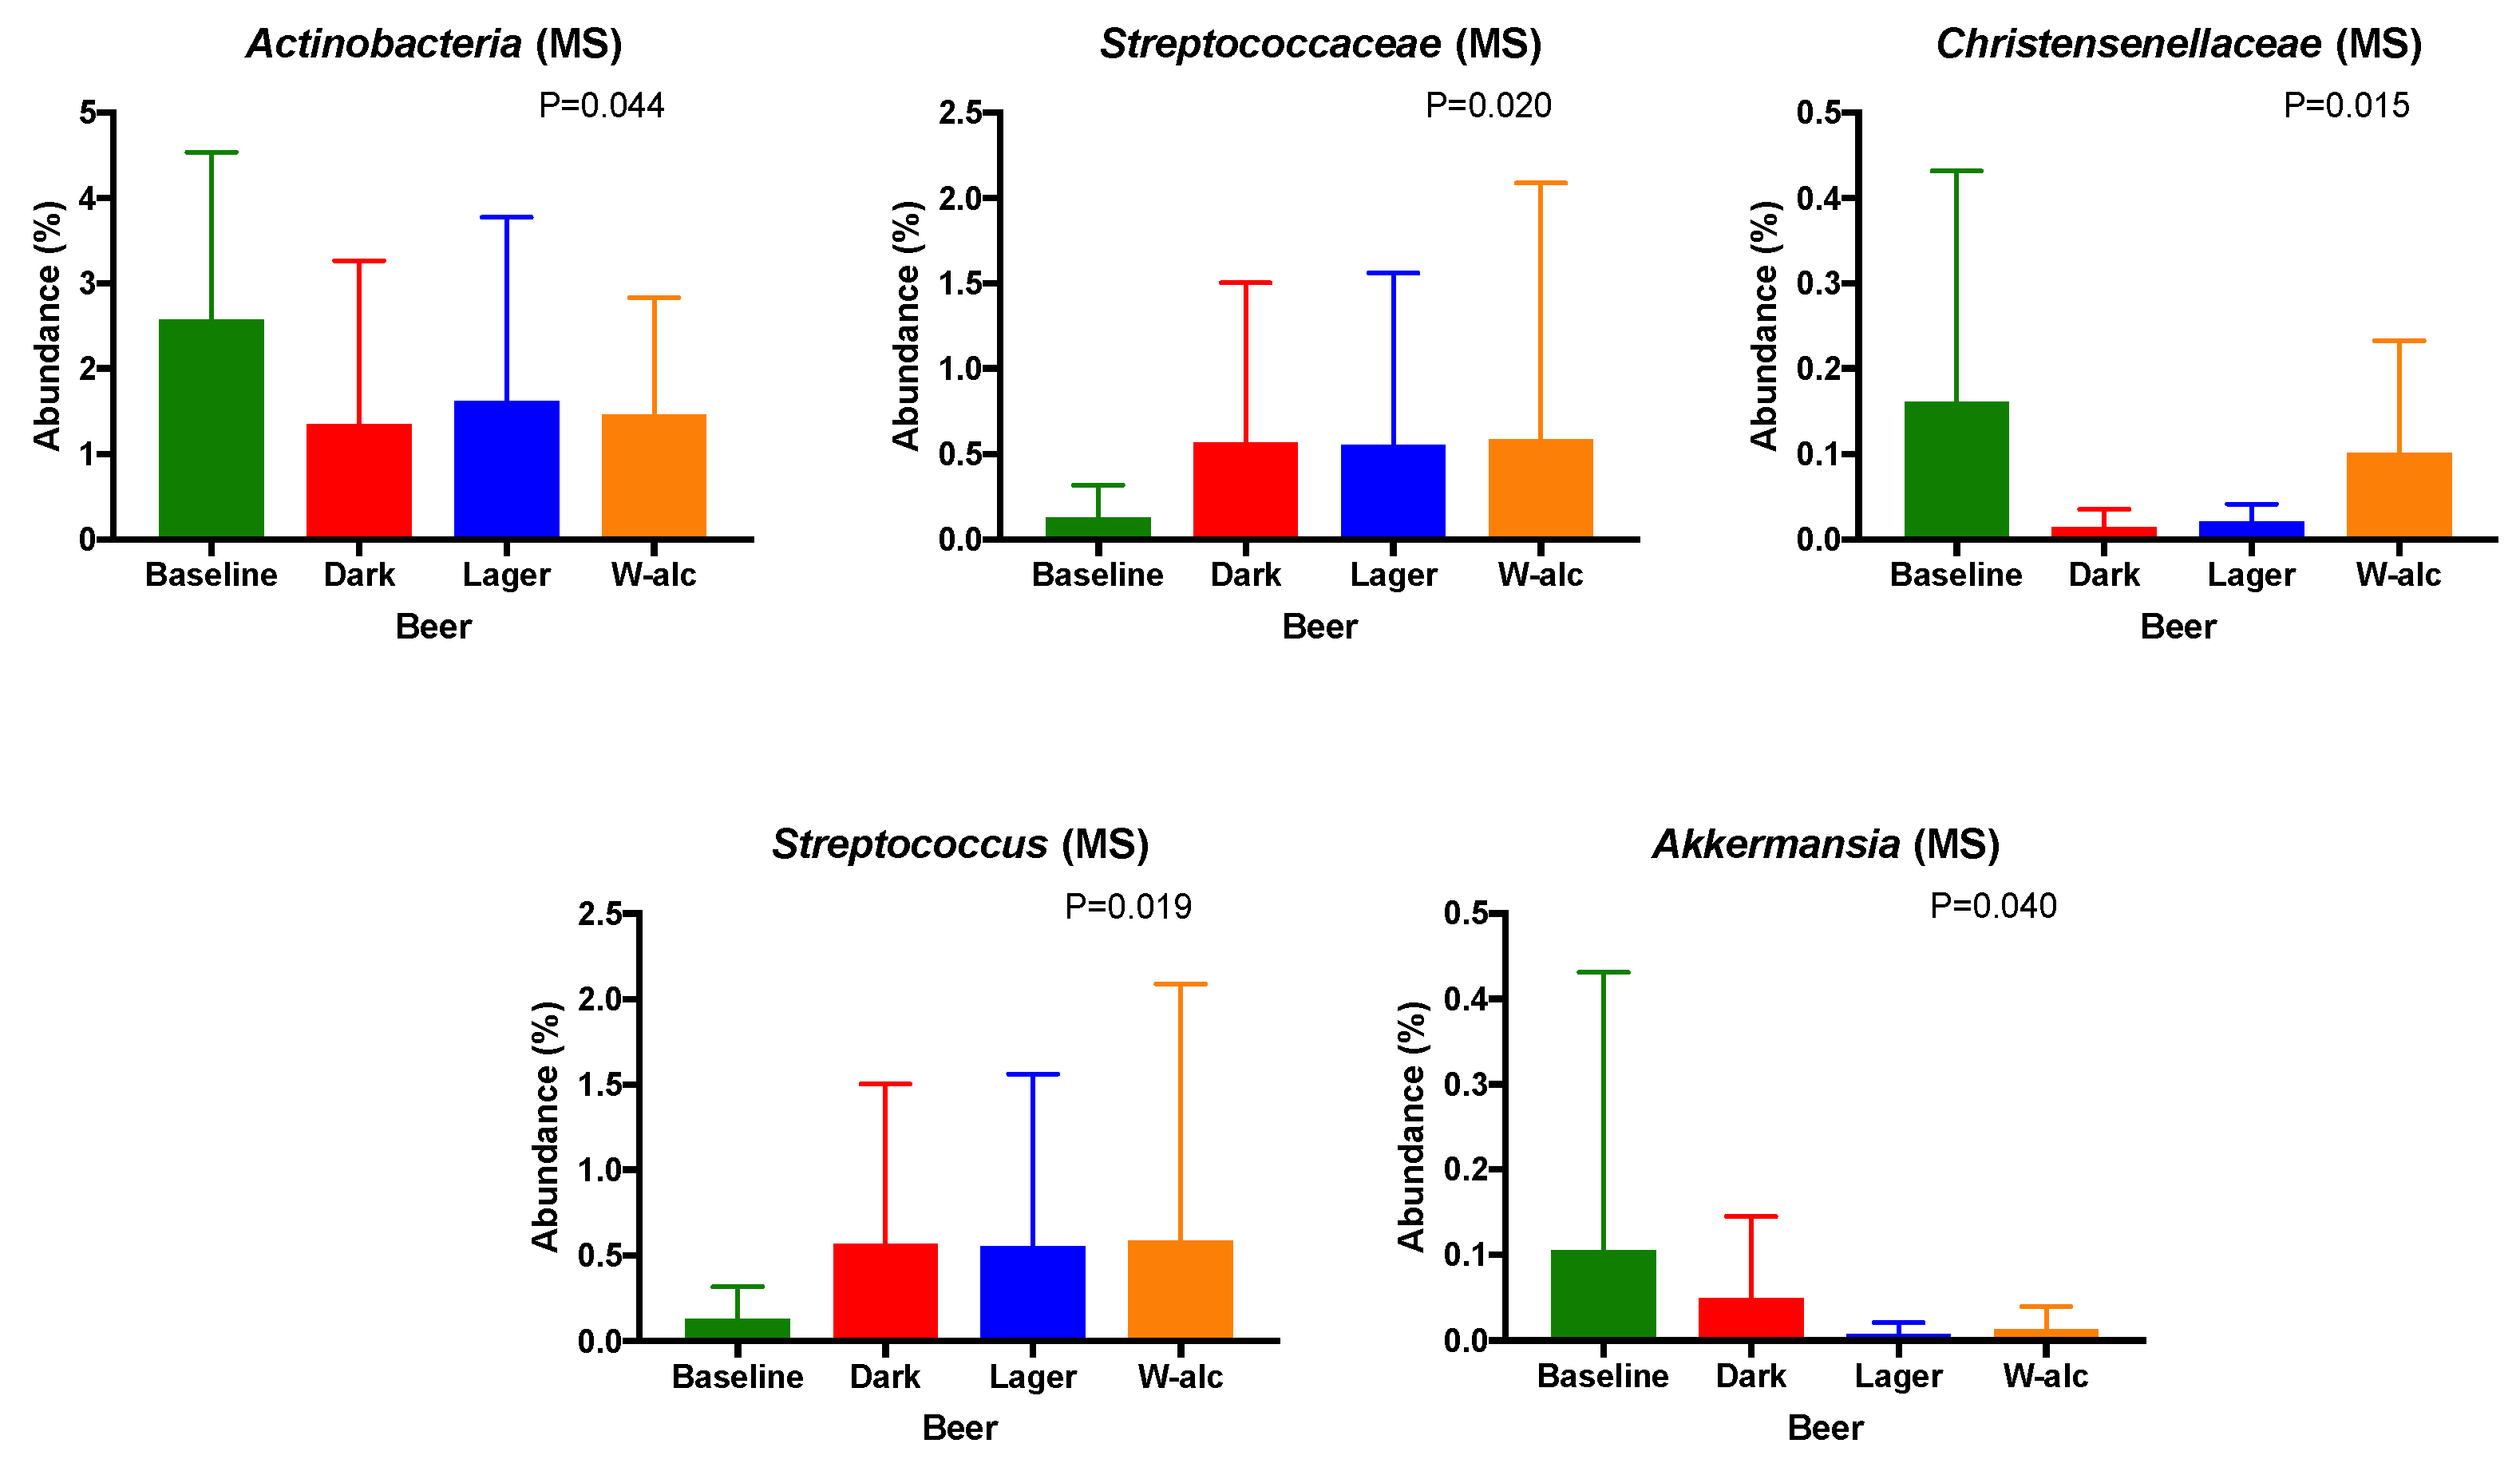
3.4.3. Gut Microbiota Changes According to the Type of Beer
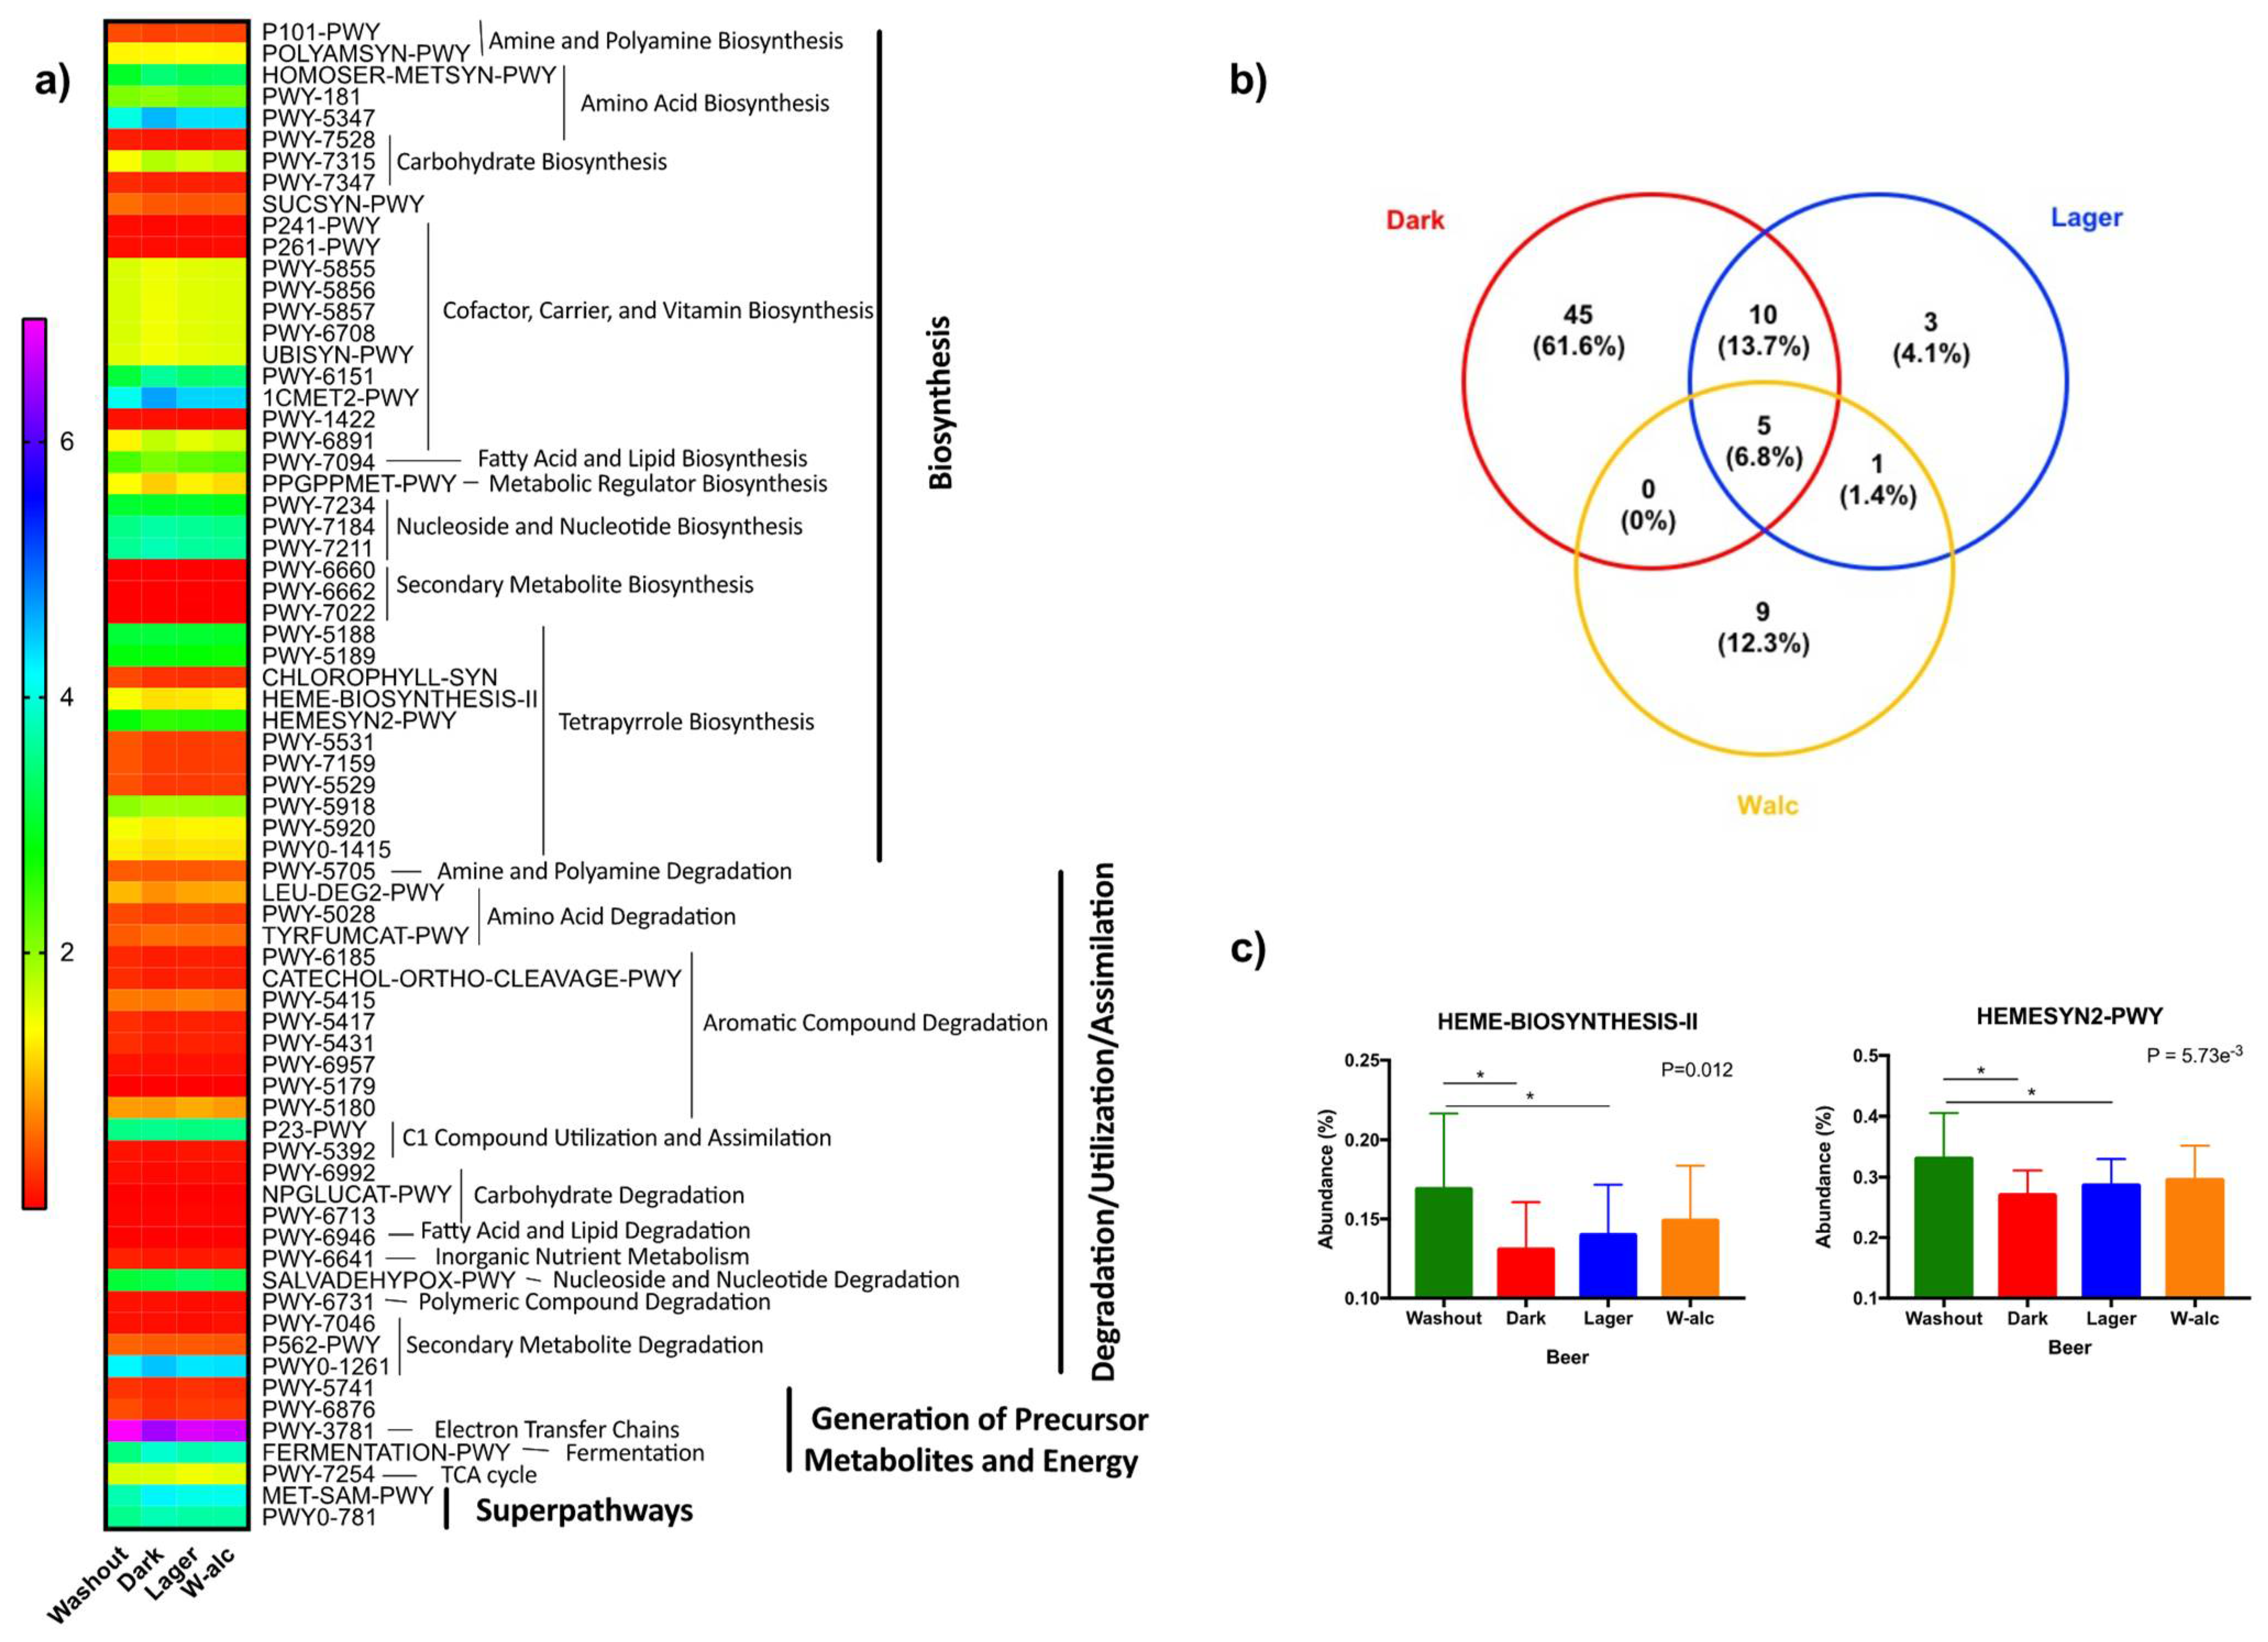
3.4.4. Metabolic Pathways
3.4.5. Microbiota Results in Relation with the Metabolic Status of the Volunteers
4. Discussion
5. Conclusions
Supplementary Materials
Author Contributions
Funding
Institutional Review Board Statement
Informed Consent Statement
Data Availability Statement
Conflicts of Interest
References
- Slater, M.; Alpert, H. Surveillance Report #115: Apparent per Capita Alcohol Consumption: National, State, and Regional Trends 2020, pp. 1977–2018. Available online: https://pubs.niaaa.nih.gov/publications/surveillance115/CONS18.htm (accessed on 10 February 2022).
- Popova, S.; Rehm, J.; Patra, J.; Zatonski, W. Comparing alcohol consumption in central and eastern Europe to other European countries. Alcohol. Alcohol. 2007, 42, 465–473. [Google Scholar] [CrossRef] [PubMed]
- Griswold, M.G.; Fullman, N.; Hawley, C.; Arian, N.; Zimsen, S.R.M.; Tymeson, H.D.; Venkateswaran, V.; Tapp, A.D.; Forouzanfar, M.H.; Salama, J.S.; et al. Alcohol use and burden for 195 countries and territories, 1990–2016: A systematic analysis for the Global Burden of Disease Study 2016. Lancet 2018, 392, 1015–1035. [Google Scholar] [CrossRef] [Green Version]
- Costanzo, S.; Di Castelnuovo, A.; Donati, M.B.; Iacoviello, L.; de Gaetano, G. Alcohol Consumption and Mortality in Patients with Cardiovascular Disease. J. Am. Coll. Cardiol. 2010, 55, 1339–1347. [Google Scholar] [CrossRef] [PubMed] [Green Version]
- Marcos, A.; Serra-Majem, L.; Pérez-Jiménez, F.; Pascual, V.; Tinahones, F.J.; Estruch, R. Moderate Consumption of Beer and Its Effects on Cardiovascular and Metabolic Health: An Updated Review of Recent Scientific Evidence. Nutrients 2021, 13, 879. [Google Scholar] [CrossRef]
- Spaggiari, G.; Cignarelli, A.; Sansone, A.; Baldi, M.; Santi, D. To beer or not to beer: A meta-analysis of the effects of beer consumption on cardiovascular health. PLoS ONE 2020, 15, e0233619. [Google Scholar] [CrossRef]
- Martinez-Gomez, A.; Caballero, I.; Blanco, C.A. Phenols and Melanoidins as Natural Antioxidants in Beer. Structure, Reactivity and Antioxidant Activity. Biomolecules 2020, 10, 400. [Google Scholar] [CrossRef] [Green Version]
- Ambra, R.; Pastore, G.; Lucchetti, S. The Role of Bioactive Phenolic Compounds on the Impact of Beer on Health. Molecules 2021, 26, 486. [Google Scholar] [CrossRef]
- Kho, Z.Y.; Lal, S.K. The Human Gut Microbiome—A Potential Controller of Wellness and Disease. Front. Microbiol. 2018, 9, 1835. [Google Scholar] [CrossRef] [Green Version]
- Adak, A.; Khan, M.R. An insight into gut microbiota and its functionalities. Cell. Mol. Life Sci. 2019, 76, 473–493. [Google Scholar] [CrossRef]
- Wilkins, L.J.; Monga, M.; Miller, A.W. Defining Dysbiosis for a Cluster of Chronic Diseases. Sci. Rep. 2019, 9, 12918. [Google Scholar] [CrossRef] [Green Version]
- Possemiers, S.; Heyerick, A.; Robbens, V.; De Keukeleire, D.; Verstraete, W. Activation of Proestrogens from Hops (Humulus lupulus L.) by Intestinal Microbiota; Conversion of Isoxanthohumol into 8-Prenylnaringenin. J. Agric. Food Chem. 2005, 53, 6281–6288. [Google Scholar] [CrossRef] [PubMed] [Green Version]
- Takagaki, A.; Nanjo, F. Bioconversion of (−)-Epicatechin, (+)-Epicatechin, (−)-Catechin, and (+)-Catechin by (−)-Epigallocatechin-Metabolizing Bacteria. Biol. Pharm. Bull. 2015, 38, 789–794. [Google Scholar] [CrossRef] [Green Version]
- Teixeira, C.; Prykhodko, O.; Alminger, M.; Fåk Hållenius, F.; Nyman, M. Barley Products of Different Fiber Composition Selectively Change Microbiota Composition in Rats. Mol. Nutr. Food Res. 2018, 62, 1701023. [Google Scholar] [CrossRef] [PubMed]
- Ou, J.; Huang, J.; Song, Y.; Yao, S.; Peng, X.; Wang, M.; Ou, S. Feruloylated Oligosaccharides from Maize Bran Modulated the Gut Microbiota in Rats. Plant Foods Hum. Nutr. 2016, 71, 123–128. [Google Scholar] [CrossRef] [PubMed]
- Everard, A.; Geurts, L.; Van Roye, M.; Delzenne, N.M.; Cani, P.D. Tetrahydro iso-Alpha Acids from Hops Improve Glucose Homeostasis and Reduce Body Weight Gain and Metabolic Endotoxemia in High-Fat Diet-Fed Mice. PLoS ONE 2012, 7, e33858. [Google Scholar] [CrossRef] [PubMed] [Green Version]
- González-Zancada, N.; Redondo-Useros, N.; Díaz, L.E.; Gómez-Martínez, S.; Marcos, A.; Nova, E. Association of Moderate Beer Consumption with the Gut Microbiota and SCFA of Healthy Adults. Molecules 2020, 25, 4772. [Google Scholar] [CrossRef]
- Hernández-Quiroz, F.; Nirmalkar, K.; Villalobos-Flores, L.E.; Murugesan, S.; Cruz-Narváez, Y.; Rico-Arzate, E.; Hoyo-Vadillo, C.; Chavez-Carbajal, A.; Pizano-Zárate, M.L.; García-Mena, J. Influence of moderate beer consumption on human gut microbiota and its impact on fasting glucose and β-cell function. Alcohol 2020, 85, 77–94. [Google Scholar] [CrossRef]
- Mateo-Gallego, R.; Moreno-Indias, I.; Bea, A.M.; Sánchez-Alcoholado, L.; Fumanal, A.J.; Quesada-Molina, M.; Prieto-Martín, A.; Gutiérrez-Repiso, C.; Civeira, F.; Tinahones, F.J. An alcohol-free beer enriched with isomaltulose and a resistant dextrin modulates gut microbiome in subjects with type 2 diabetes mellitus and overweight or obesity: A pilot study. Food Funct. 2021, 12, 3635–3646. [Google Scholar] [CrossRef]
- National Cholesterol Education Program (NCEP) Expert Panel on Detection, Evaluation, and T. of H.B.C. in A. Adult T.P.I. Third Report of the National Cholesterol Education Program (NCEP) Expert Panel on Detection, Evaluation, and Treatment of High Blood Cholesterol in Adults (Adult Treatment Panel III) final report. Circulation 2002, 106, 3143–3421. [Google Scholar] [CrossRef]
- Phenol-Explorer. Database on Polyphenol Content in Foods. Available online: http://phenol-explorer.eu/reports/38#beertext (accessed on 28 December 2021).
- Bolyen, E.; Rideout, J.R.; Dillon, M.R.; Bokulich, N.A.; Abnet, C.C.; Al-Ghalith, G.A.; Alexander, H.; Alm, E.J.; Arumugam, M.; Asnicar, F.; et al. Reproducible, interactive, scalable and extensible microbiome data science using QIIME 2. Nat. Biotechnol. 2019, 37, 852–857. [Google Scholar] [CrossRef]
- Callahan, B.J.; McMurdie, P.J.; Rosen, M.J.; Han, A.W.; Johnson, A.J.A.; Holmes, S.P. DADA2: High-resolution sample inference from Illumina amplicon data. Nat. Methods 2016, 13, 581–583. [Google Scholar] [CrossRef] [PubMed] [Green Version]
- Lozupone, C.; Lladser, M.E.; Knights, D.; Stombaugh, J.; Knight, R. UniFrac: An effective distance metric for microbial community comparison. ISME J. 2011, 5, 169–172. [Google Scholar] [CrossRef] [PubMed] [Green Version]
- Rognes, T.; Flouri, T.; Nichols, B.; Quince, C.; Mahé, F. VSEARCH: A versatile open source tool for metagenomics. PeerJ 2016, 4, e2584. [Google Scholar] [CrossRef] [PubMed]
- Dhariwal, A.; Chong, J.; Habib, S.; King, I.L.; Agellon, L.B.; Xia, J. MicrobiomeAnalyst: A web-based tool for comprehensive statistical, visual and meta-analysis of microbiome data. Nucleic Acids Res. 2017, 45, W180–W188. [Google Scholar] [CrossRef]
- Love, M.I.; Huber, W.; Anders, S. Moderated estimation of fold change and dispersion for RNA-seq data with DESeq2. Genome Biol. 2014, 15, 550. [Google Scholar] [CrossRef] [Green Version]
- Langille, M.G.I.; Zaneveld, J.; Caporaso, J.G.; McDonald, D.; Knights, D.; Reyes, J.A.; Clemente, J.C.; Burkepile, D.E.; Vega Thurber, R.L.; Knight, R.; et al. Predictive functional profiling of microbial communities using 16S rRNA marker gene sequences. Nat. Biotechnol. 2013, 31, 814–821. [Google Scholar] [CrossRef]
- Caspi, R.; Billington, R.; Keseler, I.M.; Kothari, A.; Krummenacker, M.; Midford, P.E.; Ong, W.K.; Paley, S.; Subhraveti, P.; Karp, P.D. The MetaCyc database of metabolic pathways and enzymes—A 2019 update. Nucleic Acids Res. 2020, 48, D445–D453. [Google Scholar] [CrossRef] [Green Version]
- Parks, D.H.; Tyson, G.W.; Hugenholtz, P.; Beiko, R.G. STAMP: Statistical analysis of taxonomic and functional profiles. Bioinformatics 2014, 30, 3123–3124. [Google Scholar] [CrossRef] [Green Version]
- Zouiouich, S.; Loftfield, E.; Huybrechts, I.; Viallon, V.; Louca, P.; Vogtmann, E.; Wells, P.M.; Steves, C.J.; Herzig, K.-H.; Menni, C.; et al. Markers of metabolic health and gut microbiome diversity: Findings from two population-based cohort studies. Diabetologia 2021, 64, 1749–1759. [Google Scholar] [CrossRef]
- Langner, E.; Rzeski, W. Biological Properties of Melanoidins: A Review. Int. J. Food Prop. 2014, 17, 344–353. [Google Scholar] [CrossRef]
- Bjørkhaug, S.T.; Aanes, H.; Neupane, S.P.; Bramness, J.G.; Malvik, S.; Henriksen, C.; Skar, V.; Medhus, A.W.; Valeur, J. Characterization of gut microbiota composition and functions in patients with chronic alcohol overconsumption. Gut Microbes 2019, 10, 663–675. [Google Scholar] [CrossRef] [PubMed] [Green Version]
- Zhong, X.; Cui, P.; Jiang, J.; Ning, C.; Liang, B.; Zhou, J.; Tian, L.; Zhang, Y.; Lei, T.; Zuo, T.; et al. Streptococcus, the Predominant Bacterium to Predict the Severity of Liver Injury in Alcoholic Liver Disease. Front. Cell. Infect. Microbiol. 2021, 11, 649060. [Google Scholar] [CrossRef] [PubMed]
- Khalil, R.K.S. Influence of gallic acid and catechin polyphenols on probiotic properties of Streptococcus thermophilus CHCC 3534 strain. World J. Microbiol. Biotechnol. 2010, 26, 2069–2079. [Google Scholar] [CrossRef]
- Pérez-Burillo, S.; Rajakaruna, S.; Pastoriza, S.; Paliy, O.; Ángel Rufián-Henares, J. Bioactivity of food melanoidins is mediated by gut microbiota. Food Chem. 2020, 316, 126309. [Google Scholar] [CrossRef]
- Hiippala, K.; Kainulainen, V.; Kalliomäki, M.; Arkkila, P.; Satokari, R. Mucosal Prevalence and Interactions with the Epithelium Indicate Commensalism of Sutterella spp. Front. Microbiol. 2016, 7, 1706. [Google Scholar] [CrossRef] [Green Version]
- Cani, P.D.; de Vos, W.M. Next-Generation Beneficial Microbes: The Case of Akkermansia muciniphila. Front. Microbiol. 2017, 8, 1765. [Google Scholar] [CrossRef]
- Zhang, L.; Qin, Q.; Liu, M.; Zhang, X.; He, F.; Wang, G. Akkermansia muciniphila can reduce the damage of gluco/lipotoxicity, oxidative stress and inflammation, and normalize intestine microbiota in streptozotocin-induced diabetic rats. Pathog. Dis. 2018, 76, fty028. [Google Scholar] [CrossRef] [Green Version]
- Louis, P.; Flint, H.J. Formation of propionate and butyrate by the human colonic microbiota. Environ. Microbiol. 2017, 19, 29–41. [Google Scholar] [CrossRef] [Green Version]
- Muralidharan, J.; Moreno-Indias, I.; Bulló, M.; Lopez, J.V.; Corella, D.; Castañer, O.; Vidal, J.; Atzeni, A.; Fernandez-García, J.C.; Torres-Collado, L.; et al. Effect on gut microbiota of a 1-y lifestyle intervention with Mediterranean diet compared with energy-reduced Mediterranean diet and physical activity promotion: PREDIMED-Plus Study. Am. J. Clin. Nutr. 2021, 114, 1148–1158. [Google Scholar] [CrossRef]
- Vacca, M.; Celano, G.; Calabrese, F.M.; Portincasa, P.; Gobbetti, M.; De Angelis, M. The Controversial Role of Human Gut Lachnospiraceae. Microorganisms 2020, 8, 573. [Google Scholar] [CrossRef]
- Daisley, B.A.; Koenig, D.; Engelbrecht, K.; Doney, L.; Hards, K.; Al, K.F.; Reid, G.; Burton, J.P. Emerging connections between gut microbiome bioenergetics and chronic metabolic diseases. Cell Rep. 2021, 37, 110087. [Google Scholar] [CrossRef] [PubMed]
- Canesin, G.; Hejazi, S.M.; Swanson, K.D.; Wegiel, B. Heme-Derived Metabolic Signals Dictate Immune Responses. Front. Immunol. 2020, 11, 66. [Google Scholar] [CrossRef] [PubMed] [Green Version]
- Janciauskiene, S.; Vijayan, V.; Immenschuh, S. TLR4 Signaling by Heme and the Role of Heme-Binding Blood Proteins. Front. Immunol. 2020, 11, 1964. [Google Scholar] [CrossRef] [PubMed]
- Palmas, V.; Pisanu, S.; Madau, V.; Casula, E.; Deledda, A.; Cusano, R.; Uva, P.; Vascellari, S.; Loviselli, A.; Manzin, A.; et al. Gut microbiota markers associated with obesity and overweight in Italian adults. Sci. Rep. 2021, 11, 5532. [Google Scholar] [CrossRef]
- Yun, Y.; Kim, H.N.; Kim, S.E.; Heo, S.G.; Chang, Y.; Ryu, S.; Shin, H.; Kim, H.L. Comparative analysis of gut microbiota associated with body mass index in a large Korean cohort. BMC Microbiol. 2017, 17, 151. [Google Scholar] [CrossRef] [Green Version]
- Halpern, D.; Gruss, A. A sensitive bacterial-growth-based test reveals how intestinal Bacteroides meet their porphyrin requirement Applied microbiology. BMC Microbiol. 2015, 15, 282. [Google Scholar] [CrossRef]
- Constante, M.; Fragoso, G.; Calvé, A.; Samba-Mondonga, M.; Santos, M.M. Dietary heme induces gut dysbiosis, aggravates colitis, and potentiates the development of adenomas in mice. Front. Microbiol. 2017, 8, 1809. [Google Scholar] [CrossRef] [Green Version]
- Choby, J.E.; Skaar, E.P. Heme Synthesis and Acquisition in Bacterial Pathogens. J. Mol. Biol. 2016, 428, 3408–3428. [Google Scholar] [CrossRef] [Green Version]


| Healthy Volunteers | Patients with Metabolic Syndrome | |||||||||
|---|---|---|---|---|---|---|---|---|---|---|
| Washout | Dark | Lager | Alcohol-Free | p | Washout | Dark | Lager | Alcohol-Free | p | |
| Weight (kg) | 65.6 ± 7.75 * | 65.66 ± 7.33 * | 65.46 ± 7.69 * | 65.99 ± 7.74 * | 0.358 | 93.73 ± 14.41 | 93.25 ± 14.40 | 93.25 ± 15.39 | 93.84 ± 14.34 | 0.564 |
| BMI (kg/m2) | 22.85 ± 2.51 * | 23.19 ± 3.08 * | 23.14 ± 3.19 * | 22.99 ± 2.52 * | 0.642 | 34.58 ± 4.84 | 34.40 ± 4.76 | 34.37 ± 4.98 | 34.62 ± 4.73 | 0.564 |
| Waist (cm) | 80.3 ± 8.92 * | 79.55 ± 7.94 * | 81.25 ± 8.31 * | 80.15 ± 7.58 * | 0.377 | 109.06 ± 10.17 | 108.6 ± 12.02 | 104.3 ± 8.75 | 106.1 ± 7.48 | 0.247 |
| Hip (cm) | 97 ± 6.42 * | 96.45 ± 6.39 * | 96.9 ± 6.50 * | 96.7 ± 6.39 * | 0.597 | 114.94 ± 12.82 | 111.6 ± 11.63 | 111.3 ± 12.34 | 114.2 ± 11.03 | 0.077 |
| SBP (mmHg) | 114 ± 14.54 * | 110.9 ± 14.77 * | 115.15 ± 15.52 * | 109.94 ± 9.44 * | 0.325 | 137.45 ± 13.18 | 127.65 ± 9.82 | 130.75 ± 16.24 | 126.1 ± 10.48 | 0.216 |
| DBP(mmHg) | 69.35 ± 8.30 * | 67.75 ± 9.73 * | 71.5 ± 10.76 * | 69.83 ± 7.22 * | 0.633 | 88.8 ± 10.34 | 83.15 ± 7.48 | 86.45 ± 7.86 | 83.1 ± 7.68 | 0.298 |
| Glucose (mg/dL | 82.6 ± 6.75 * | 86.3 ± 5.98 * | 86 ± 8.99 * | 84 ± 4.26 * | 0.156 | 114.7 ± 36.24 | 112.6 ± 16.28 | 113.1 ± 25.45 | 109.7 ± 14.17 | 0.965 |
| Urea (mg/dL) | 28.6 ± 8.79 | 32.6 ± 8.94 | 29.9 ± 7.01 | 31.8 ± 10.10 | 0.605 | 32.3 ± 5.39 | 34.78 ± 5.84 | 34.6 ± 4.22 | 34.67 ± 5.36 | 0.386 |
| Creatinine (mg/dL) | 0.80 ± 0.13 | 0.83 ± 0.13 | 0.80 ± 0.14 | 0.79 ± 0.12 | 0.690 | 0.728 ± 0.19 | 0.7463 ± 0.20 | 0.781 ± 0.19 | 0.7211 ± 0.20 | 0.298 |
| Uric Acid (mg/dL) | 4.22 ± 0.79 | 4.57 ± 1.05 | 4.46 ± 0.89 * | 4.41 ± 1.01 * | 0.304 | 5.31 ± 1.42 | 5.81 ± 1.31 | 5.8778 ± 1.55 | 5.69 ± 1.33 | 0.036 |
| Cholesterol (mg/dL) | 192.5 ± 31.03 | 192.2 ± 31.31 | 191.8 ± 37.25 | 185.8 ± 28.57 | 0.901 | 208.6 ± 43.14 | 214.9 ± 41.66 | 204.8 ± 42.53 | 208.6 ± 48.88 | 0.782 |
| HDL-c (mg/dL) | 64 ± 12.56 *a | 66.6 ± 13.74 *b | 65.5 ± 13.38 *b | 61.5 ± 12.32 *ab | 0.039 | 48.7 ± 11.69 | 46.67 ± 11.05 | 46.7 ± 11.78 | 44.6 ± 11.60 | 0.173 |
| LDL-c (mg/dL) | 113.6 ± 28.57 | 111.6 ± 28.42 | 111.7 ± 35.99 | 108.7 ± 27.51 | 0.564 | 129.6 ± 31.18 | 133.1 ± 38.41 | 128.9 ± 34.51 | 124.1 ± 48.36 | 0.129 |
| Triglycerides(mg/dL) | 74.6 ± 38.62 * | 69.9 ± 32.68 * | 73.3 ± 29.55 * | 77.5 ± 28.68 * | 0.484 | 151.7 ± 89.16 | 201.4 ± 133.38 | 174.5 ± 114.91 | 212.3 ± 175.55 | 0.065 |
| ALT (U/L) | 20.4 ± 10.59 * | 18.1 ± 6.74 * | 15.9 ± 11.65 * | 18.9 ± 8.87 * | 0.086 | 38.2 ± 12.56 | 34.4 ± 10.92 | 31.2 ± 11.65 | 38.2 ± 12.61 | 0.035 |
| AP (U/L) | 53.9 ± 9.37 * | 54.11 ± 7.04 * | 54.44 ± 9.09 * | 53.8 ± 8.10 | 0.990 | 69.8 ± 23.05 | 72.56 ± 18.55 | 68 ± 23.82 | 72.67 ± 27.49 | 0.455 |
| HbA1c (%) | 5.45 ± 0.20 * | 5.39 ± 0.22 * | 5.46 ± 0.20 * | 5.4 ± 0.249 * | 0.442 | 6.27 ± 0.65 c | 6.06 ± 0.73 a | 6.12 ± 0.68 ab | 6.18 ± 0.73 b | 0.002 |
| Ferritin (ng/mL) | 79.7 ± 49.72 | 66.6 ± 41.88 | 74.11 ± 50.16 | 73.61 ± 44.43 | 0.147 | 105.68 ± 90.59 | 102.42 ± 109.43 | 102.54 ± 91.97 | 97.28 ± 94.24 | 0.275 |
| CRP (mg/L) | 3.64 ± 2.82 | 6.22± 9.95 | 3.12 ± 3.34 | 2.24 ± 1.51 | 0.857 | 9.79 ± 10.24 | 8.14 ± 11.12 | 6.62 ± 6.18 | 5.525 ± 4.64 | 0.572 |
| Insulin (µUI/mL) | 5.78 ± 3.85 * | 5.84 ± 3.33 * | 5.63 ± 2.59 * | 5.51 ± 3.063 * | 0.392 | 20.03 ± 11.45 | 24.25 ± 20.03 | 19.02 ± 15.90 | 21.93 ± 19.51 | 0.197 |
| C peptide (ng/mL) | 0.89 ± 0.48 * | 0.88 ± 0.35 * | 0.94 ± 0.40 * | 0.97 ± 0.41 * | 0.426 | 2.50 ± 1.01 | 2.65 ± 1.41 | 2.58 ± 1.85 | 2.55 ± 1.41 | 0.208 |
| HOMA-IR | 1.19 ± 0.81 * | 1.25 ± 0.76 * | 1.22 ± 0.67 * | 1.15 ± 0.65 * | 0.207 | 5.8407 ± 4.01 | 7.03 ± 6.36 | 5.81 ± 5.78 | 6.38 ± 6.77 | 0.373 |
| Vitamin D (ng/mL) | 16.6 ± 7.96 | 20.89 ± 6.92 | 19.29 ± 9.42 | 20.59 ± 14.14 | 0.692 | 16.26 ± 4.47 | 19.28 ± 7.61 | 22.2 ± 10.37 | 18.11 ± 4.80 | 0.116 |
Publisher’s Note: MDPI stays neutral with regard to jurisdictional claims in published maps and institutional affiliations. |
© 2022 by the authors. Licensee MDPI, Basel, Switzerland. This article is an open access article distributed under the terms and conditions of the Creative Commons Attribution (CC BY) license (https://creativecommons.org/licenses/by/4.0/).
Share and Cite
Martínez-Montoro, J.I.; Quesada-Molina, M.; Gutiérrez-Repiso, C.; Ruiz-Limón, P.; Subiri-Verdugo, A.; Tinahones, F.J.; Moreno-Indias, I. Effect of Moderate Consumption of Different Phenolic-Content Beers on the Human Gut Microbiota Composition: A Randomized Crossover Trial. Antioxidants 2022, 11, 696. https://0-doi-org.brum.beds.ac.uk/10.3390/antiox11040696
Martínez-Montoro JI, Quesada-Molina M, Gutiérrez-Repiso C, Ruiz-Limón P, Subiri-Verdugo A, Tinahones FJ, Moreno-Indias I. Effect of Moderate Consumption of Different Phenolic-Content Beers on the Human Gut Microbiota Composition: A Randomized Crossover Trial. Antioxidants. 2022; 11(4):696. https://0-doi-org.brum.beds.ac.uk/10.3390/antiox11040696
Chicago/Turabian StyleMartínez-Montoro, José Ignacio, Mar Quesada-Molina, Carolina Gutiérrez-Repiso, Patricia Ruiz-Limón, Alba Subiri-Verdugo, Francisco J. Tinahones, and Isabel Moreno-Indias. 2022. "Effect of Moderate Consumption of Different Phenolic-Content Beers on the Human Gut Microbiota Composition: A Randomized Crossover Trial" Antioxidants 11, no. 4: 696. https://0-doi-org.brum.beds.ac.uk/10.3390/antiox11040696