
Differential Induction of Reactive Oxygen Species and Expression of Antioxidant Enzymes in Human Melanocytes Correlate with Melanin Content: Implications on the Response to Solar UV and Melanoma Susceptibility

 , , and
Abstract
:1. Introduction
2. Materials and Methods
2.1. Primary Human Melanocyte Cultures
2.2. Chemical Analysis of Melanins
2.3. Solar UV Irradiation
2.4. Viability Assay
2.5. Measurement of ROS
2.6. Quantitation of Reduced GSH
2.7. Western Blot Analysis
2.8. Real-Time Polymerase Chain Reaction (RT PCR)
2.9. Immunofluorescence Staining for Lipid Peroxidation
2.10. Statistical Analysis
3. Results
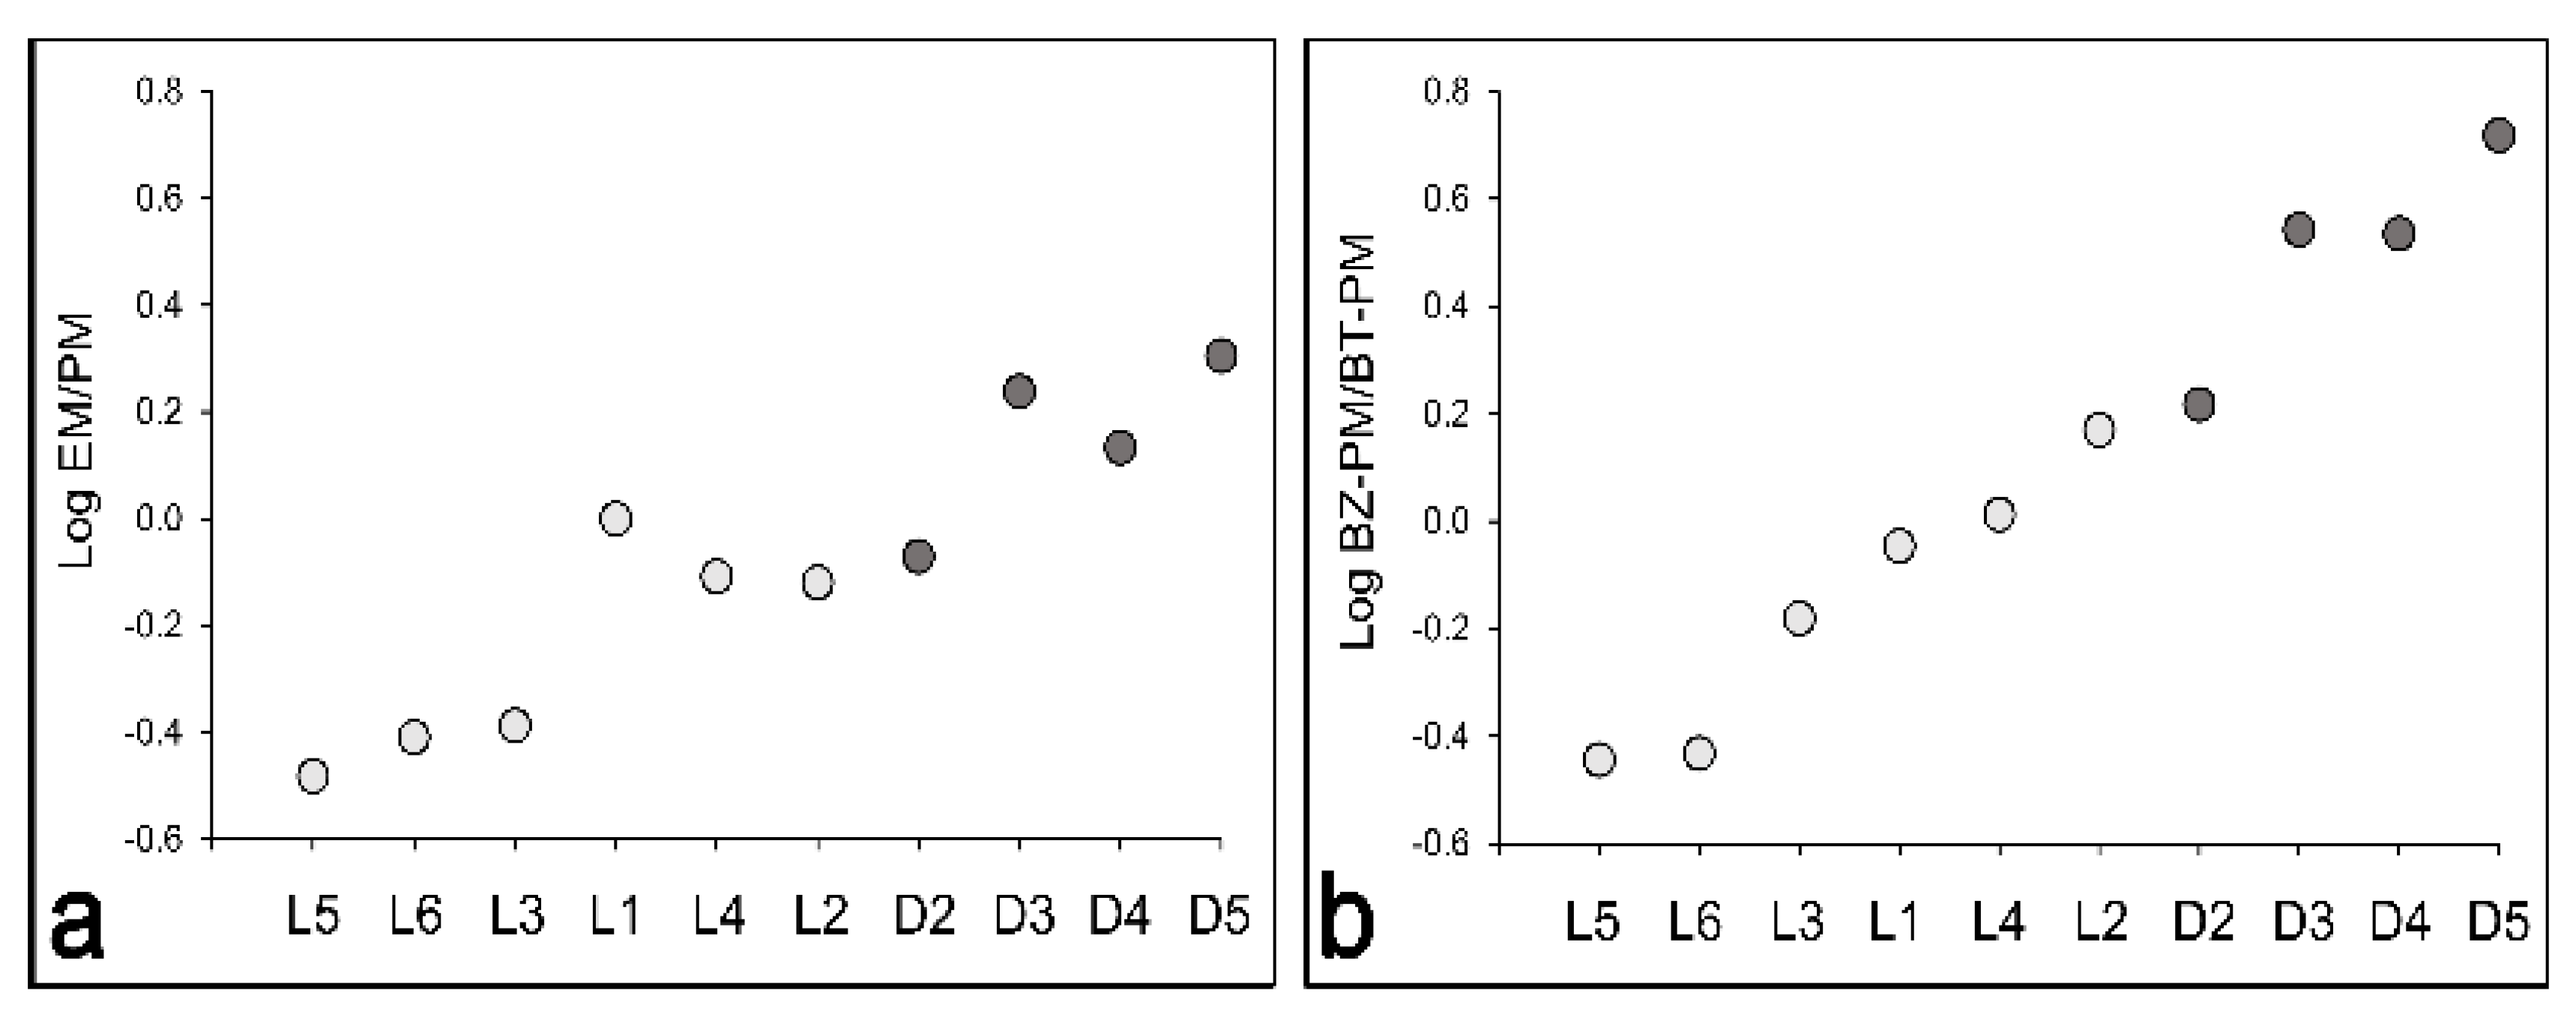
3.1. Comparison of Eumelanin and Pheomelanin Contents in Melanocyte Cultures with Different Pigmentation
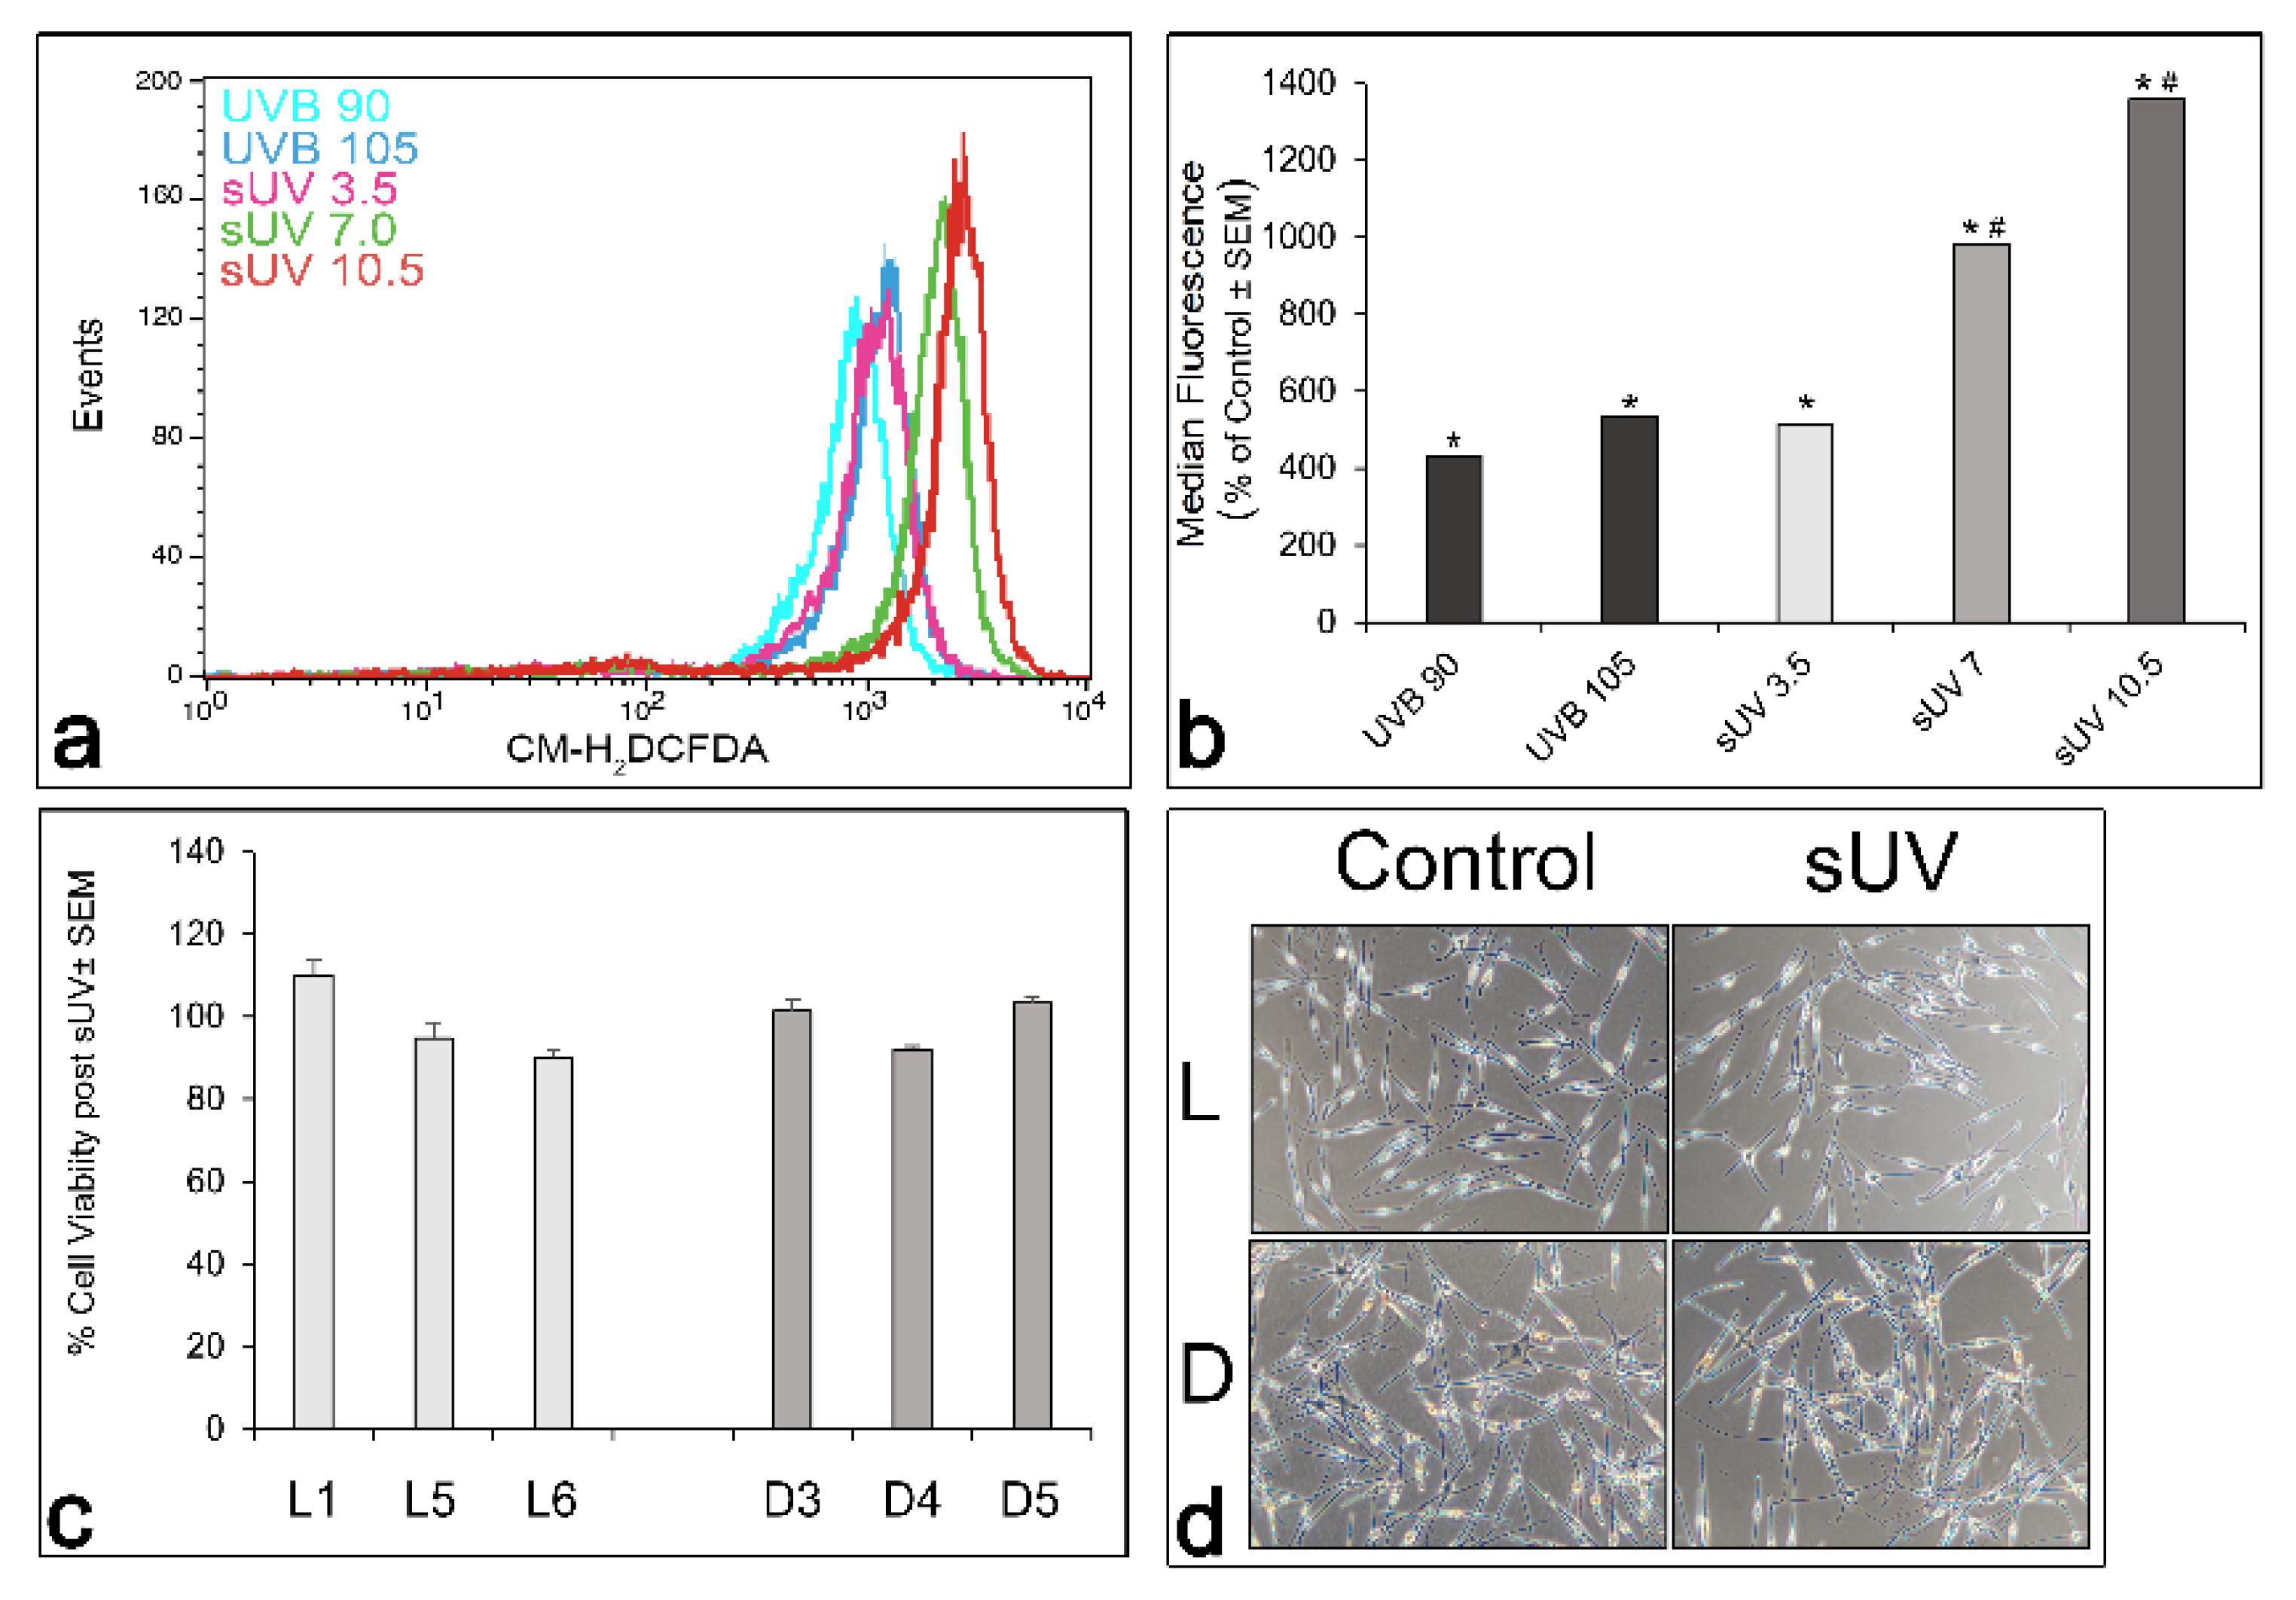
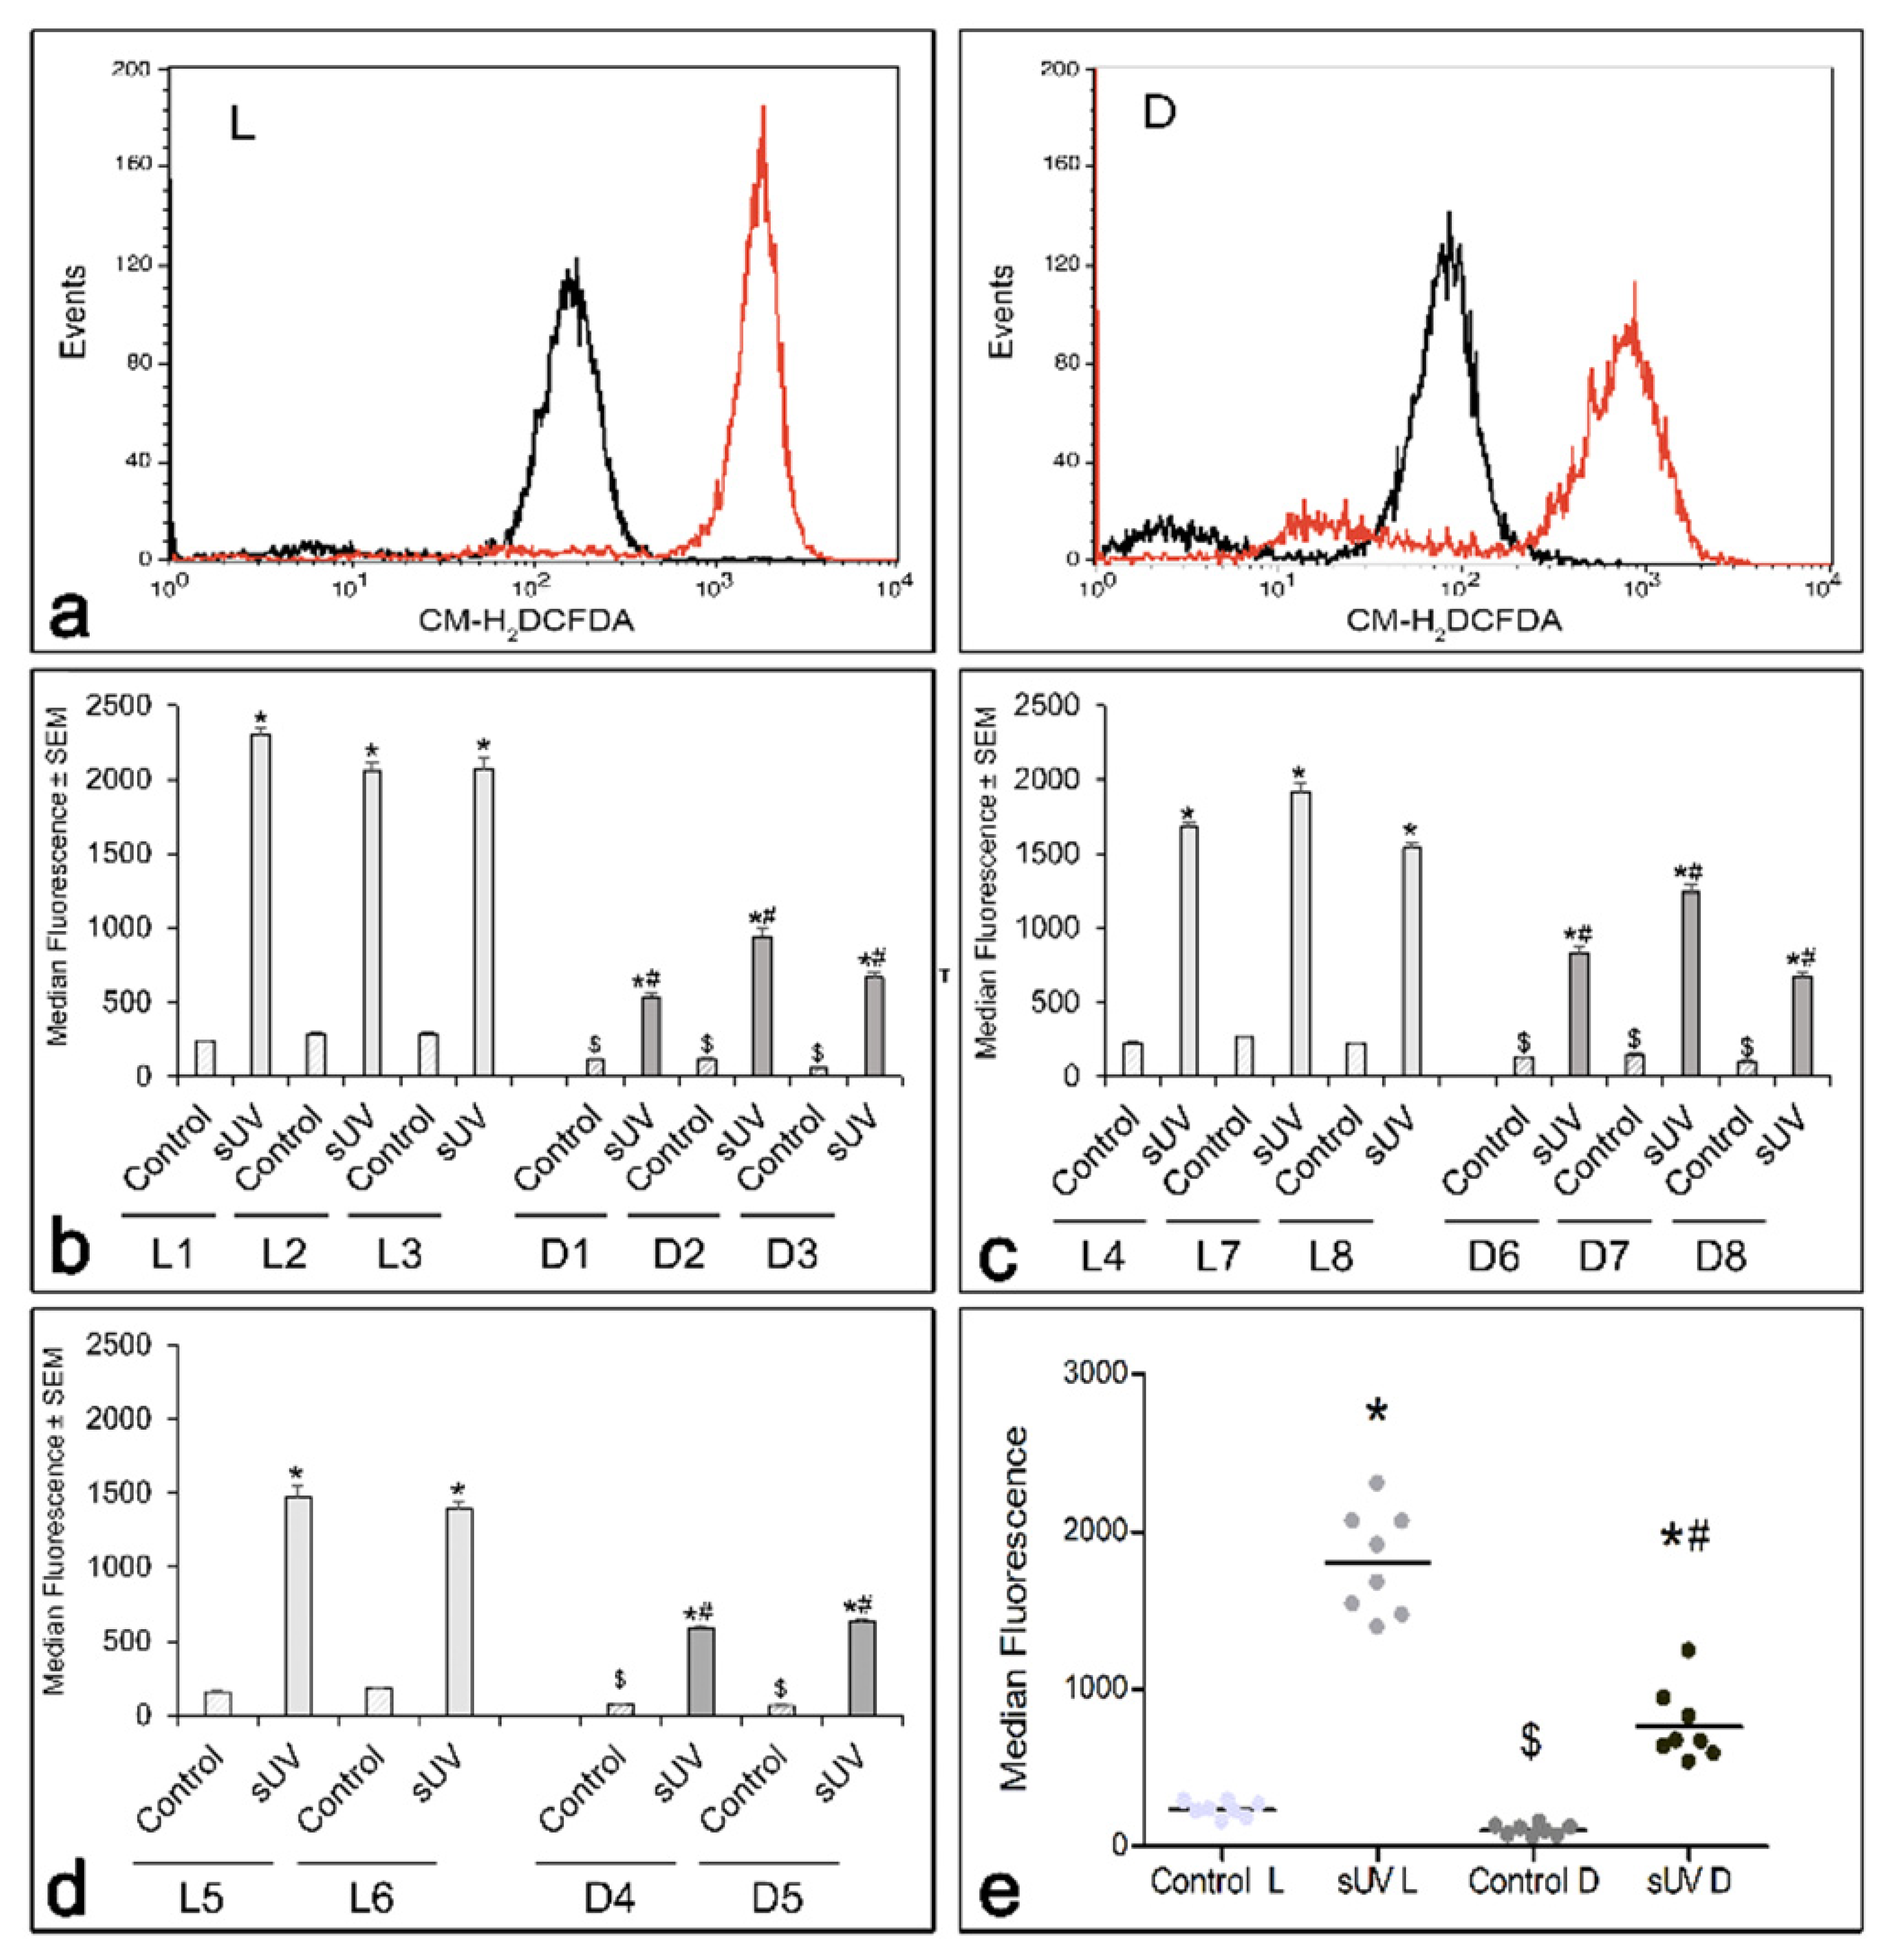
3.2. Comparison of Basal and Solar UV-Induced ROS in L versus D Melanocyte Cultures
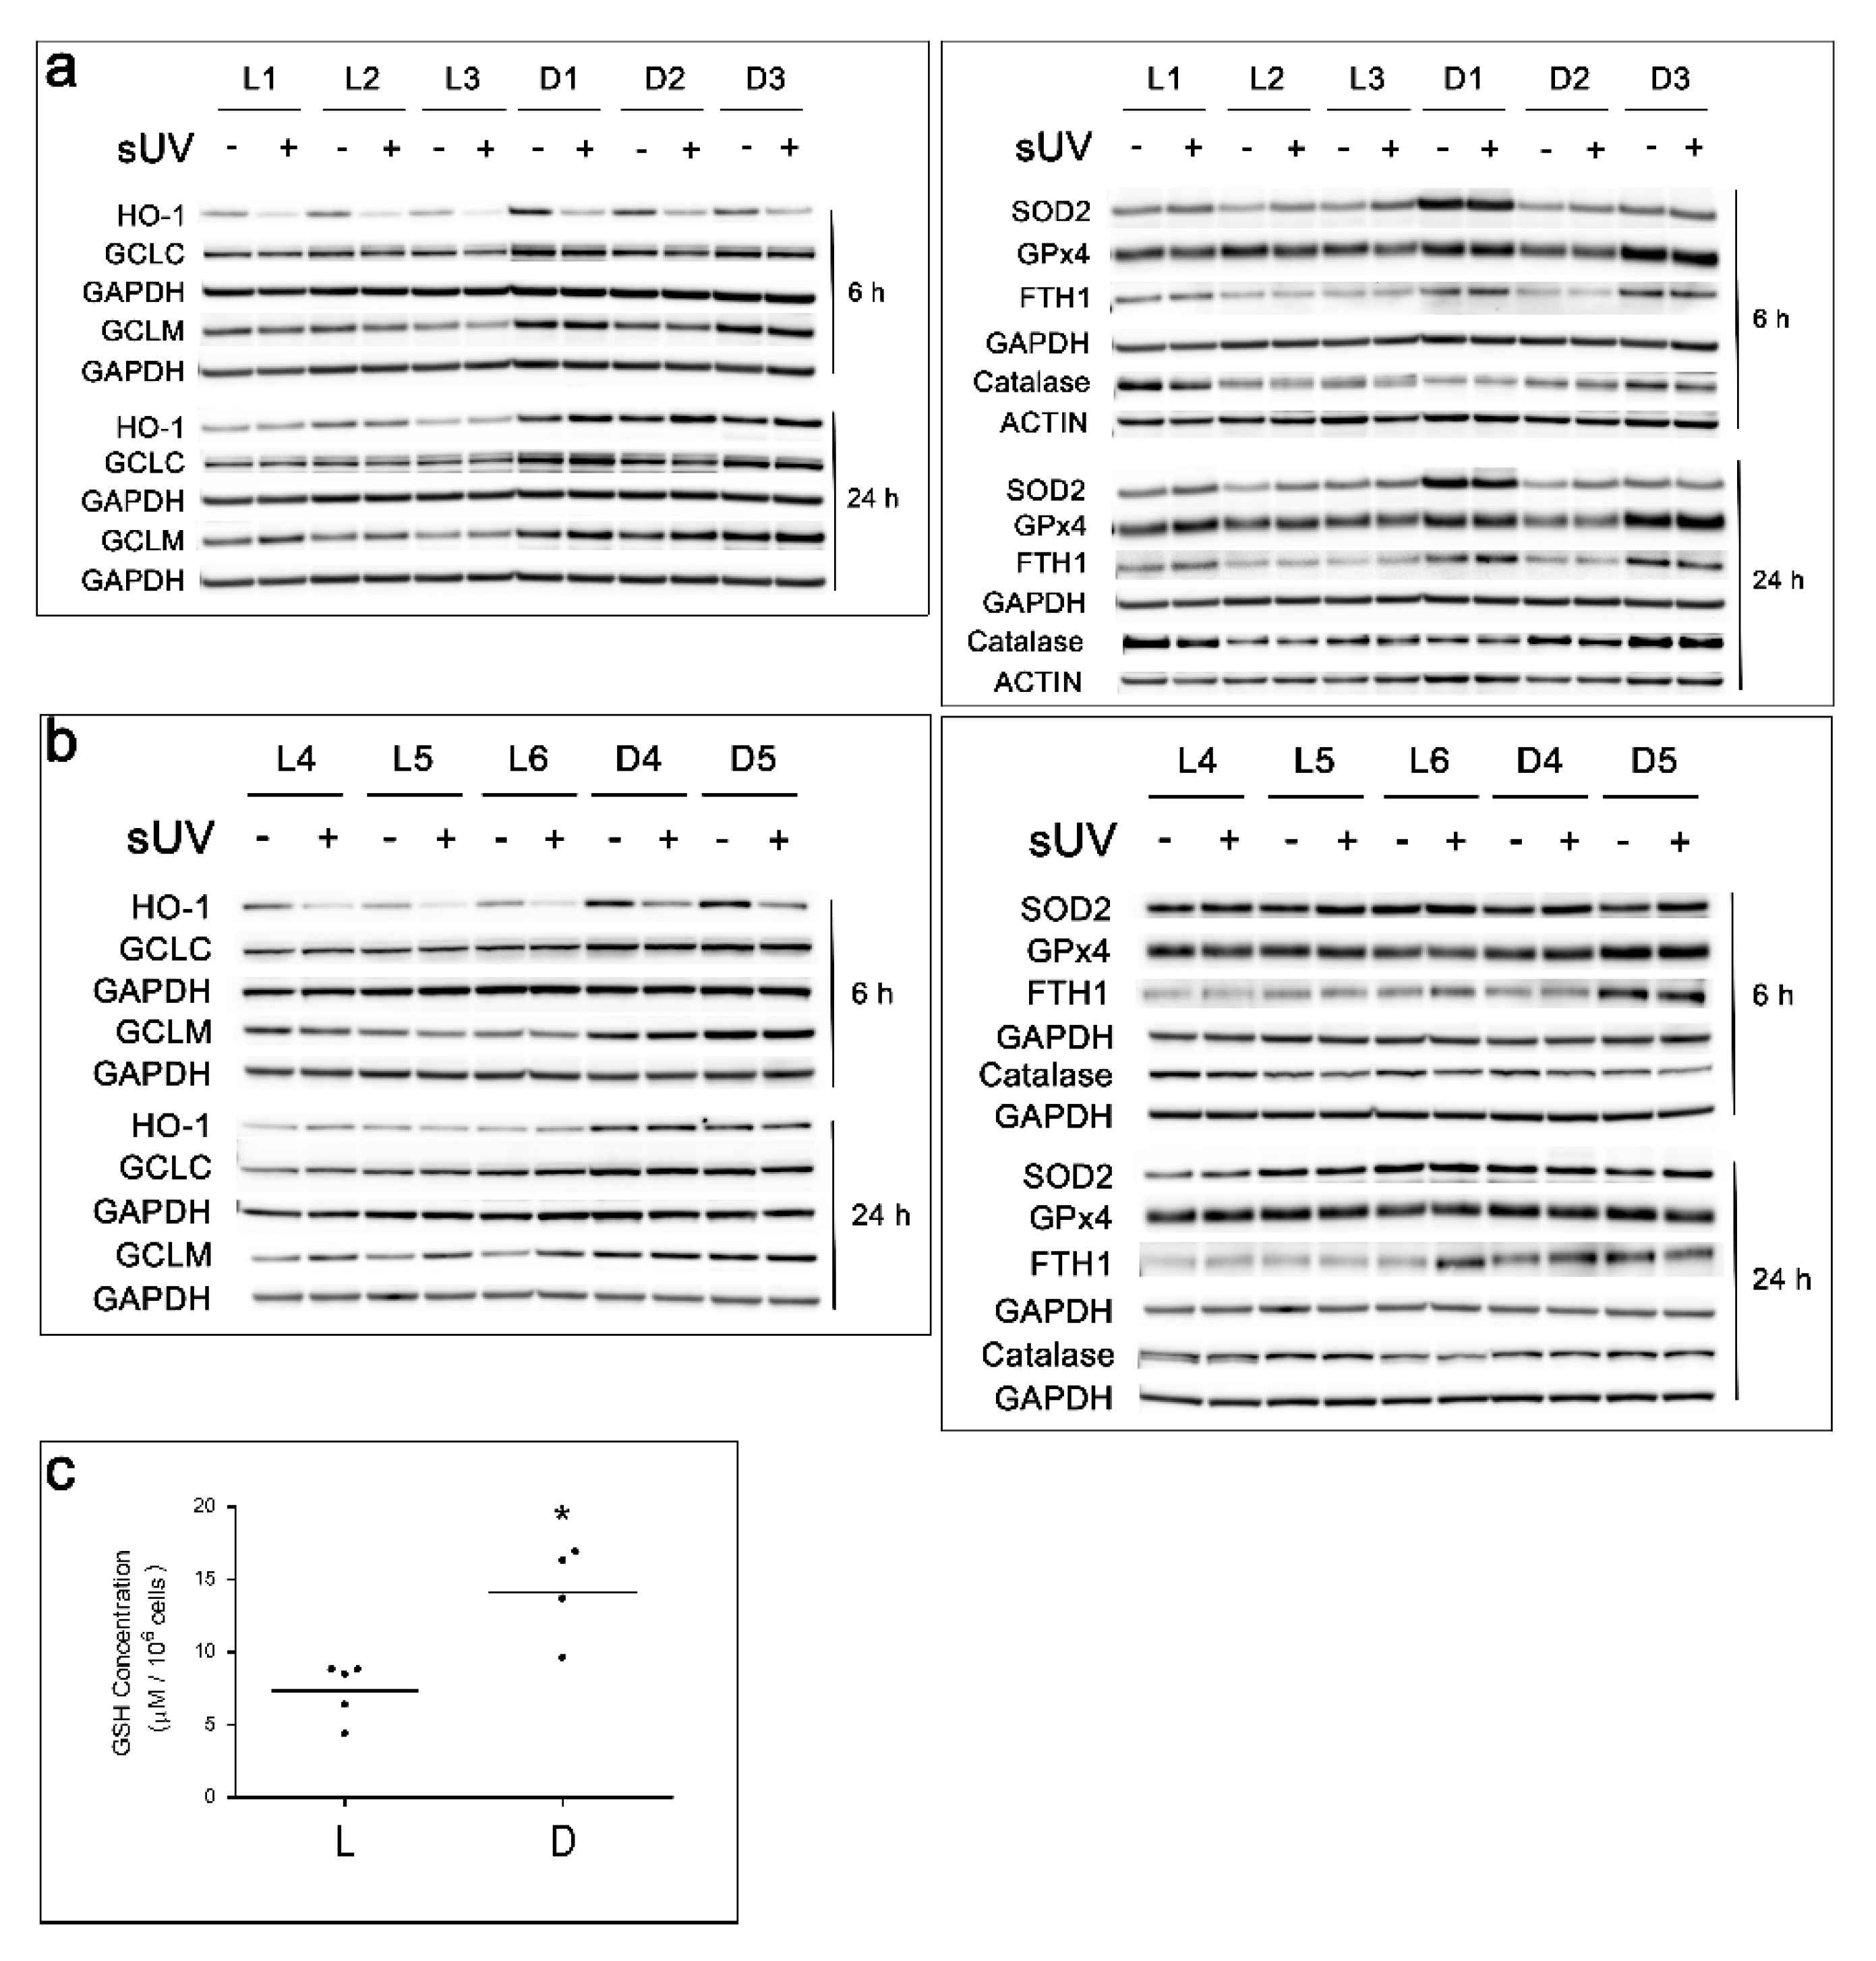
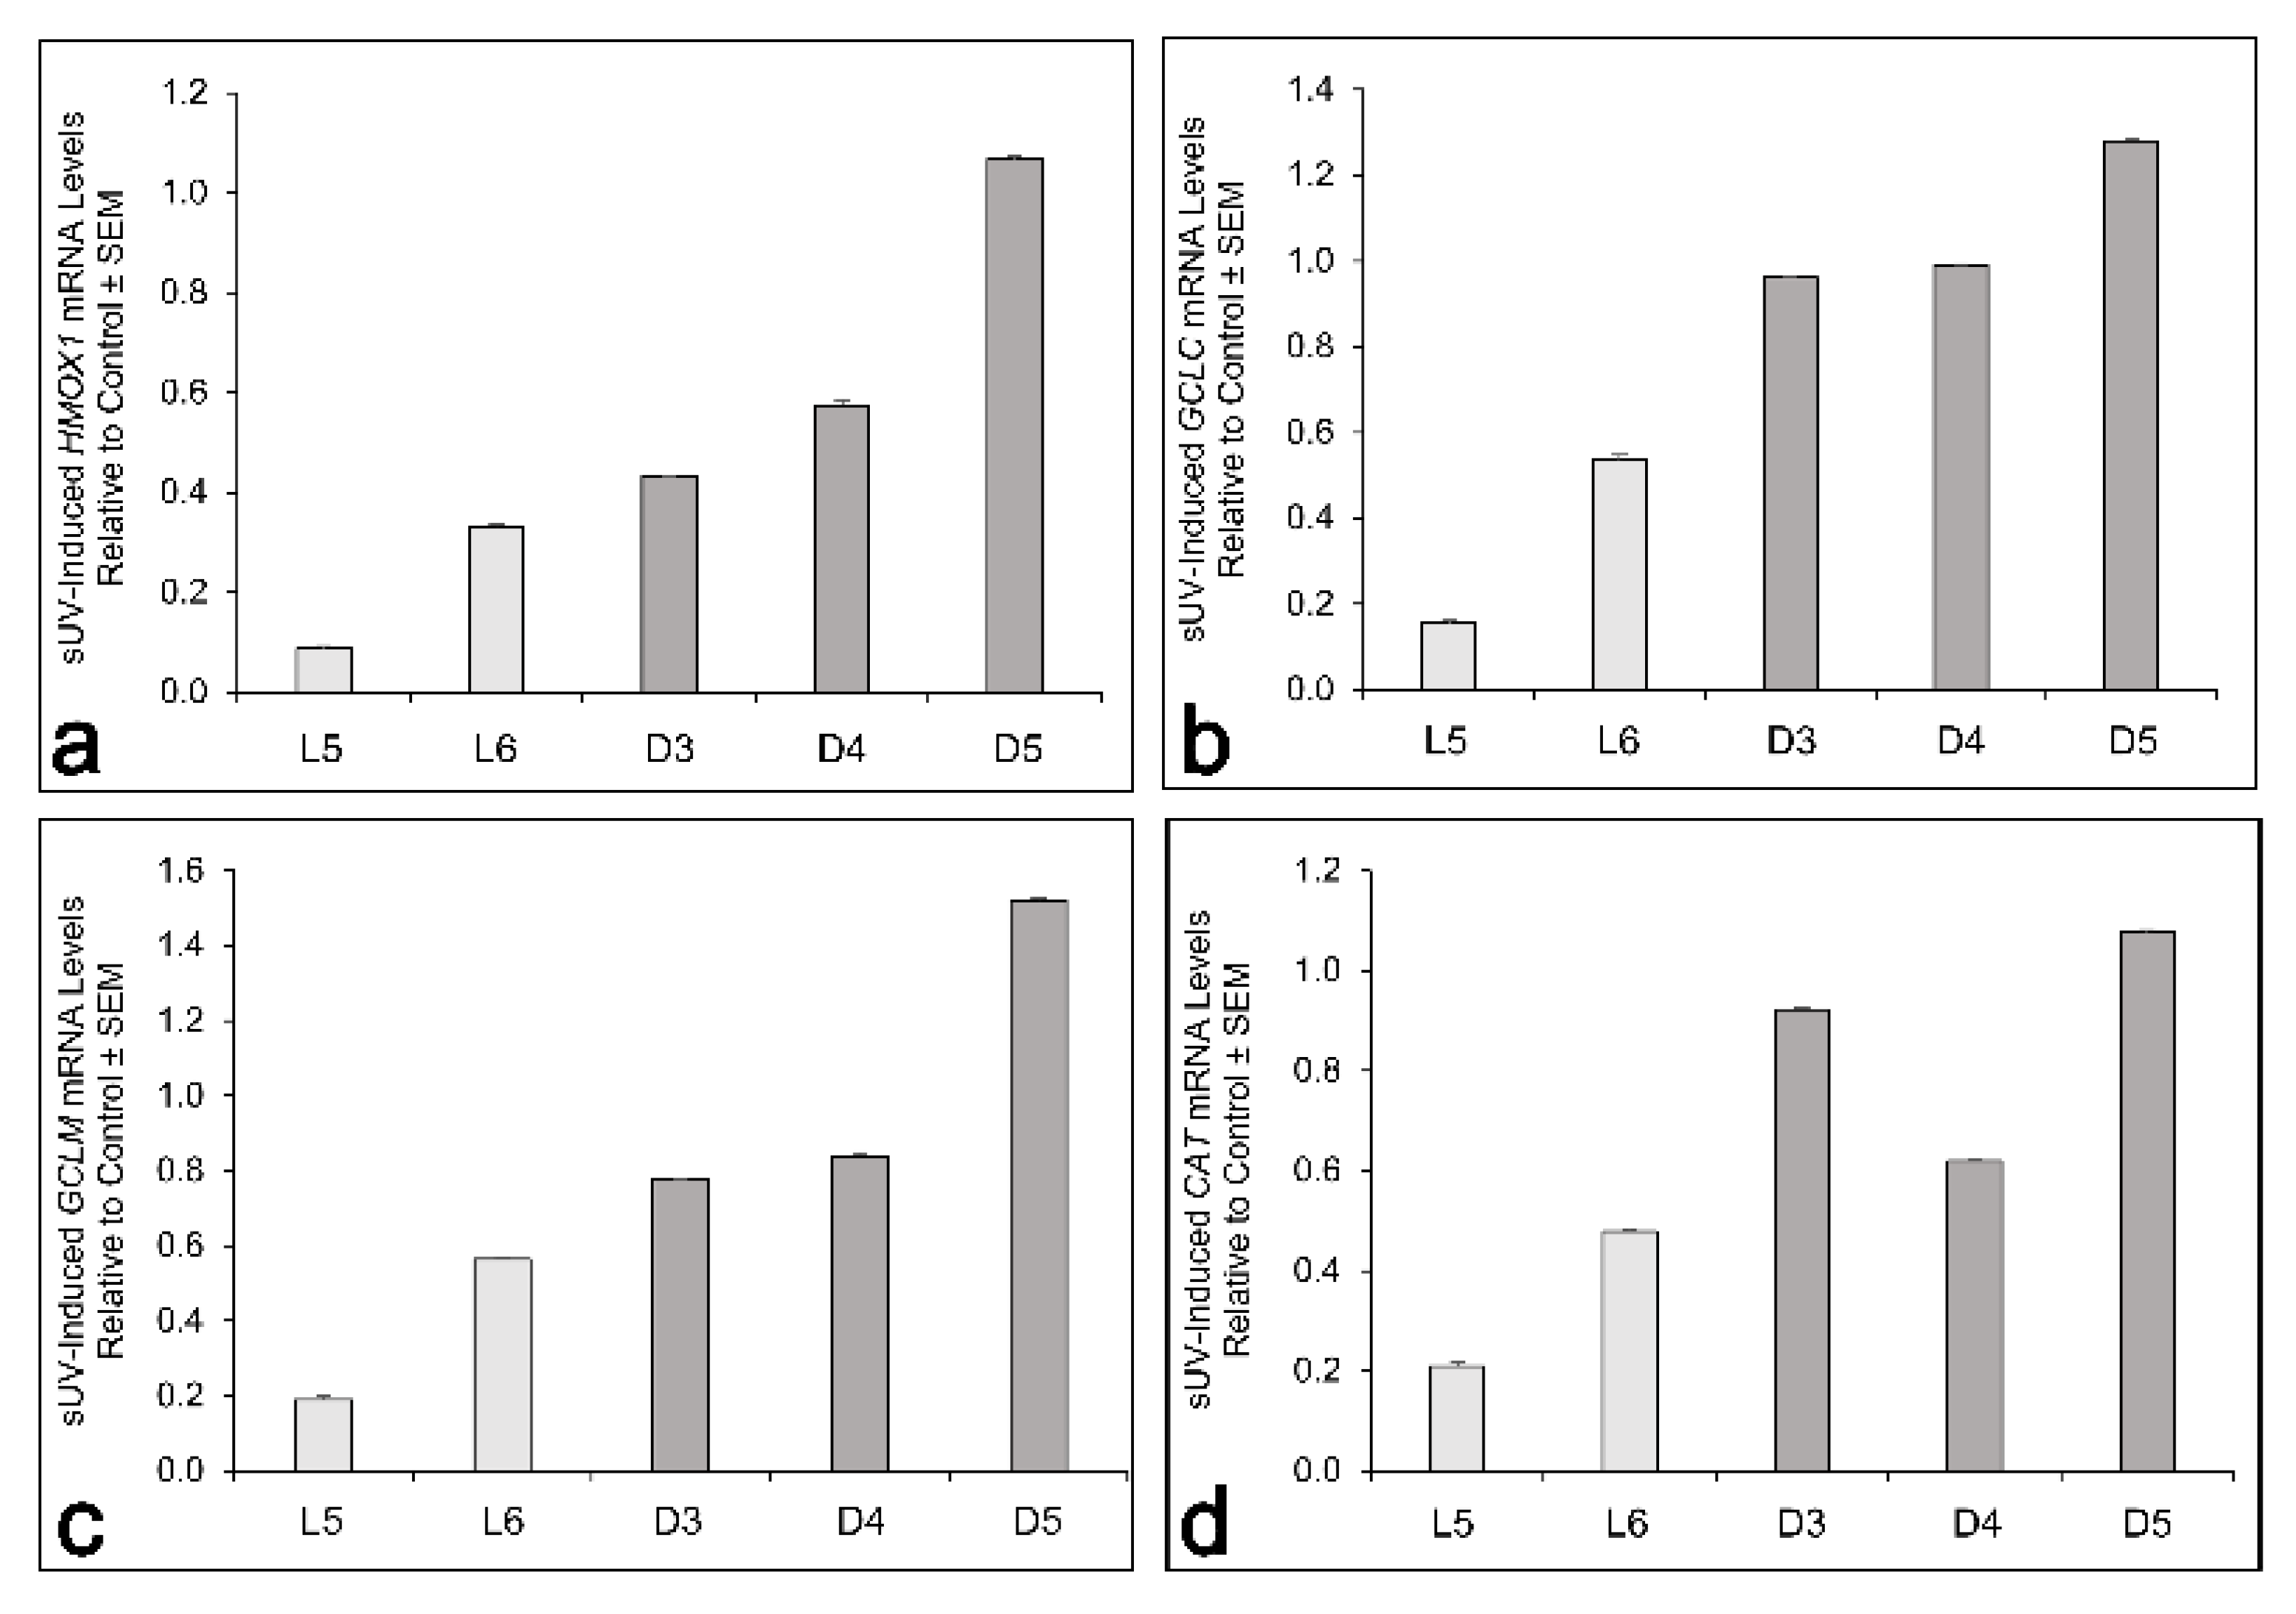
3.3. Basal and Solar-UV Induced Levels of Antioxidant Enzymes and Basal GSH Content in L versus D Melanocyte Cultures
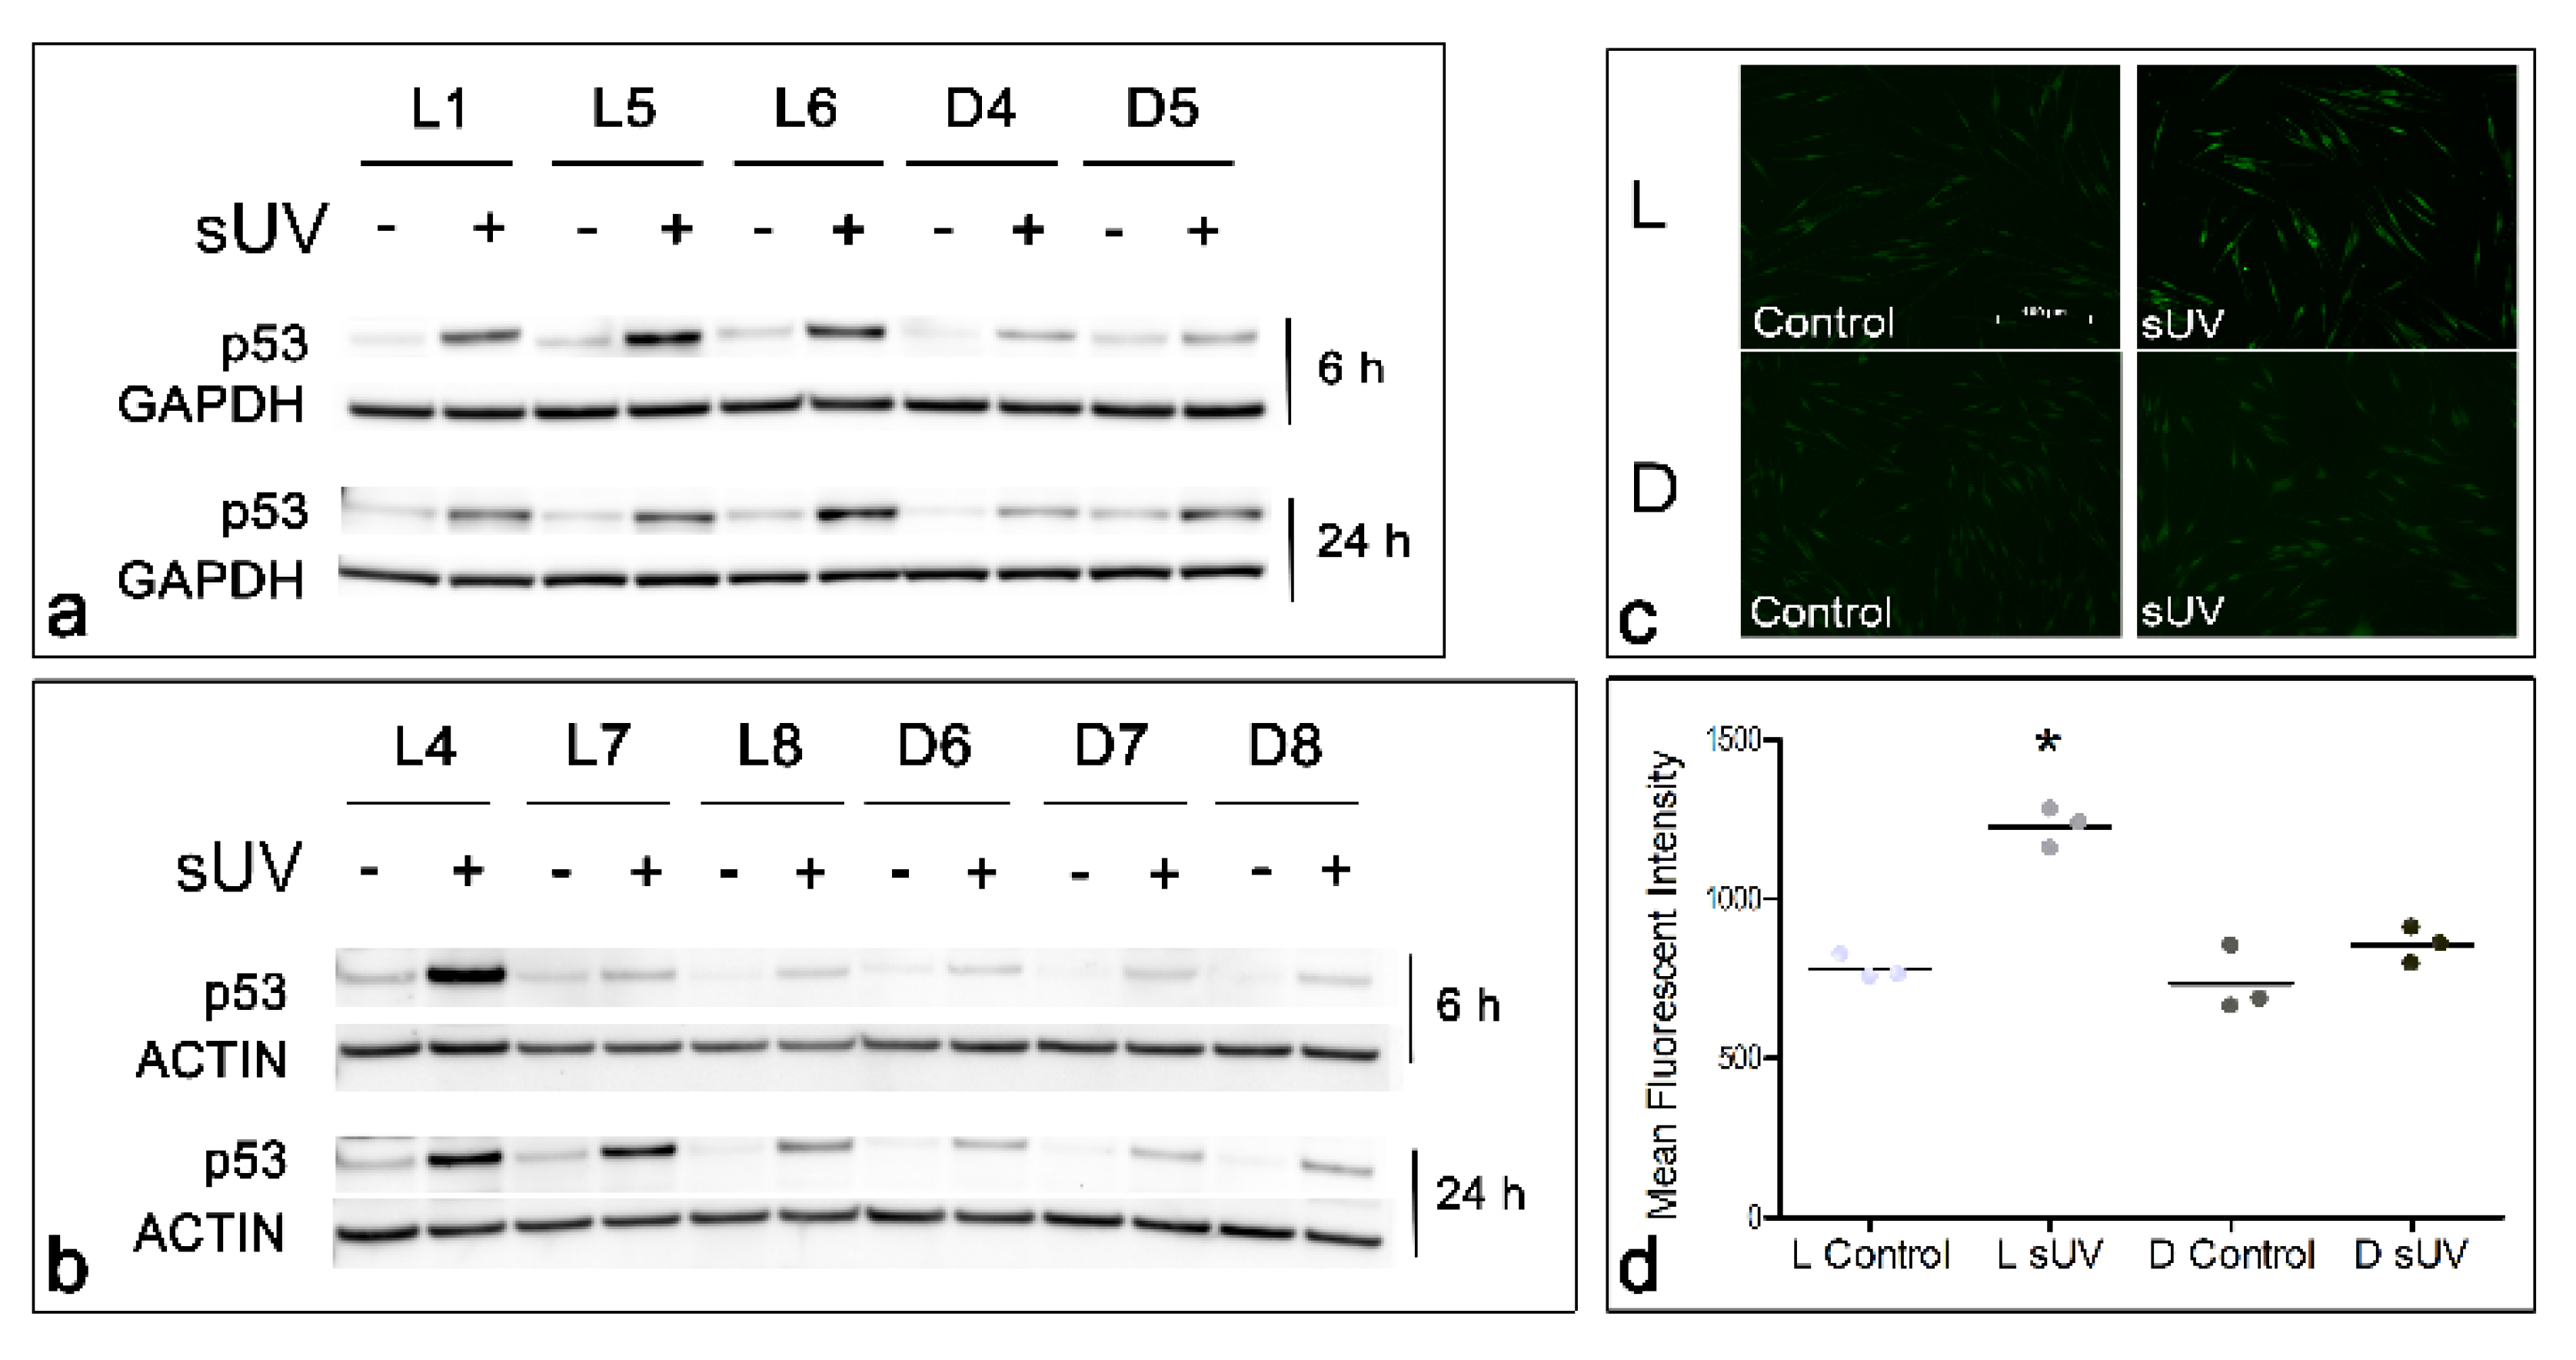
3.4. Solar UV-Induced p53 Levels and Lipid Peroxidation in Light versus Dark Melanocyte Cultures
4. Discussion
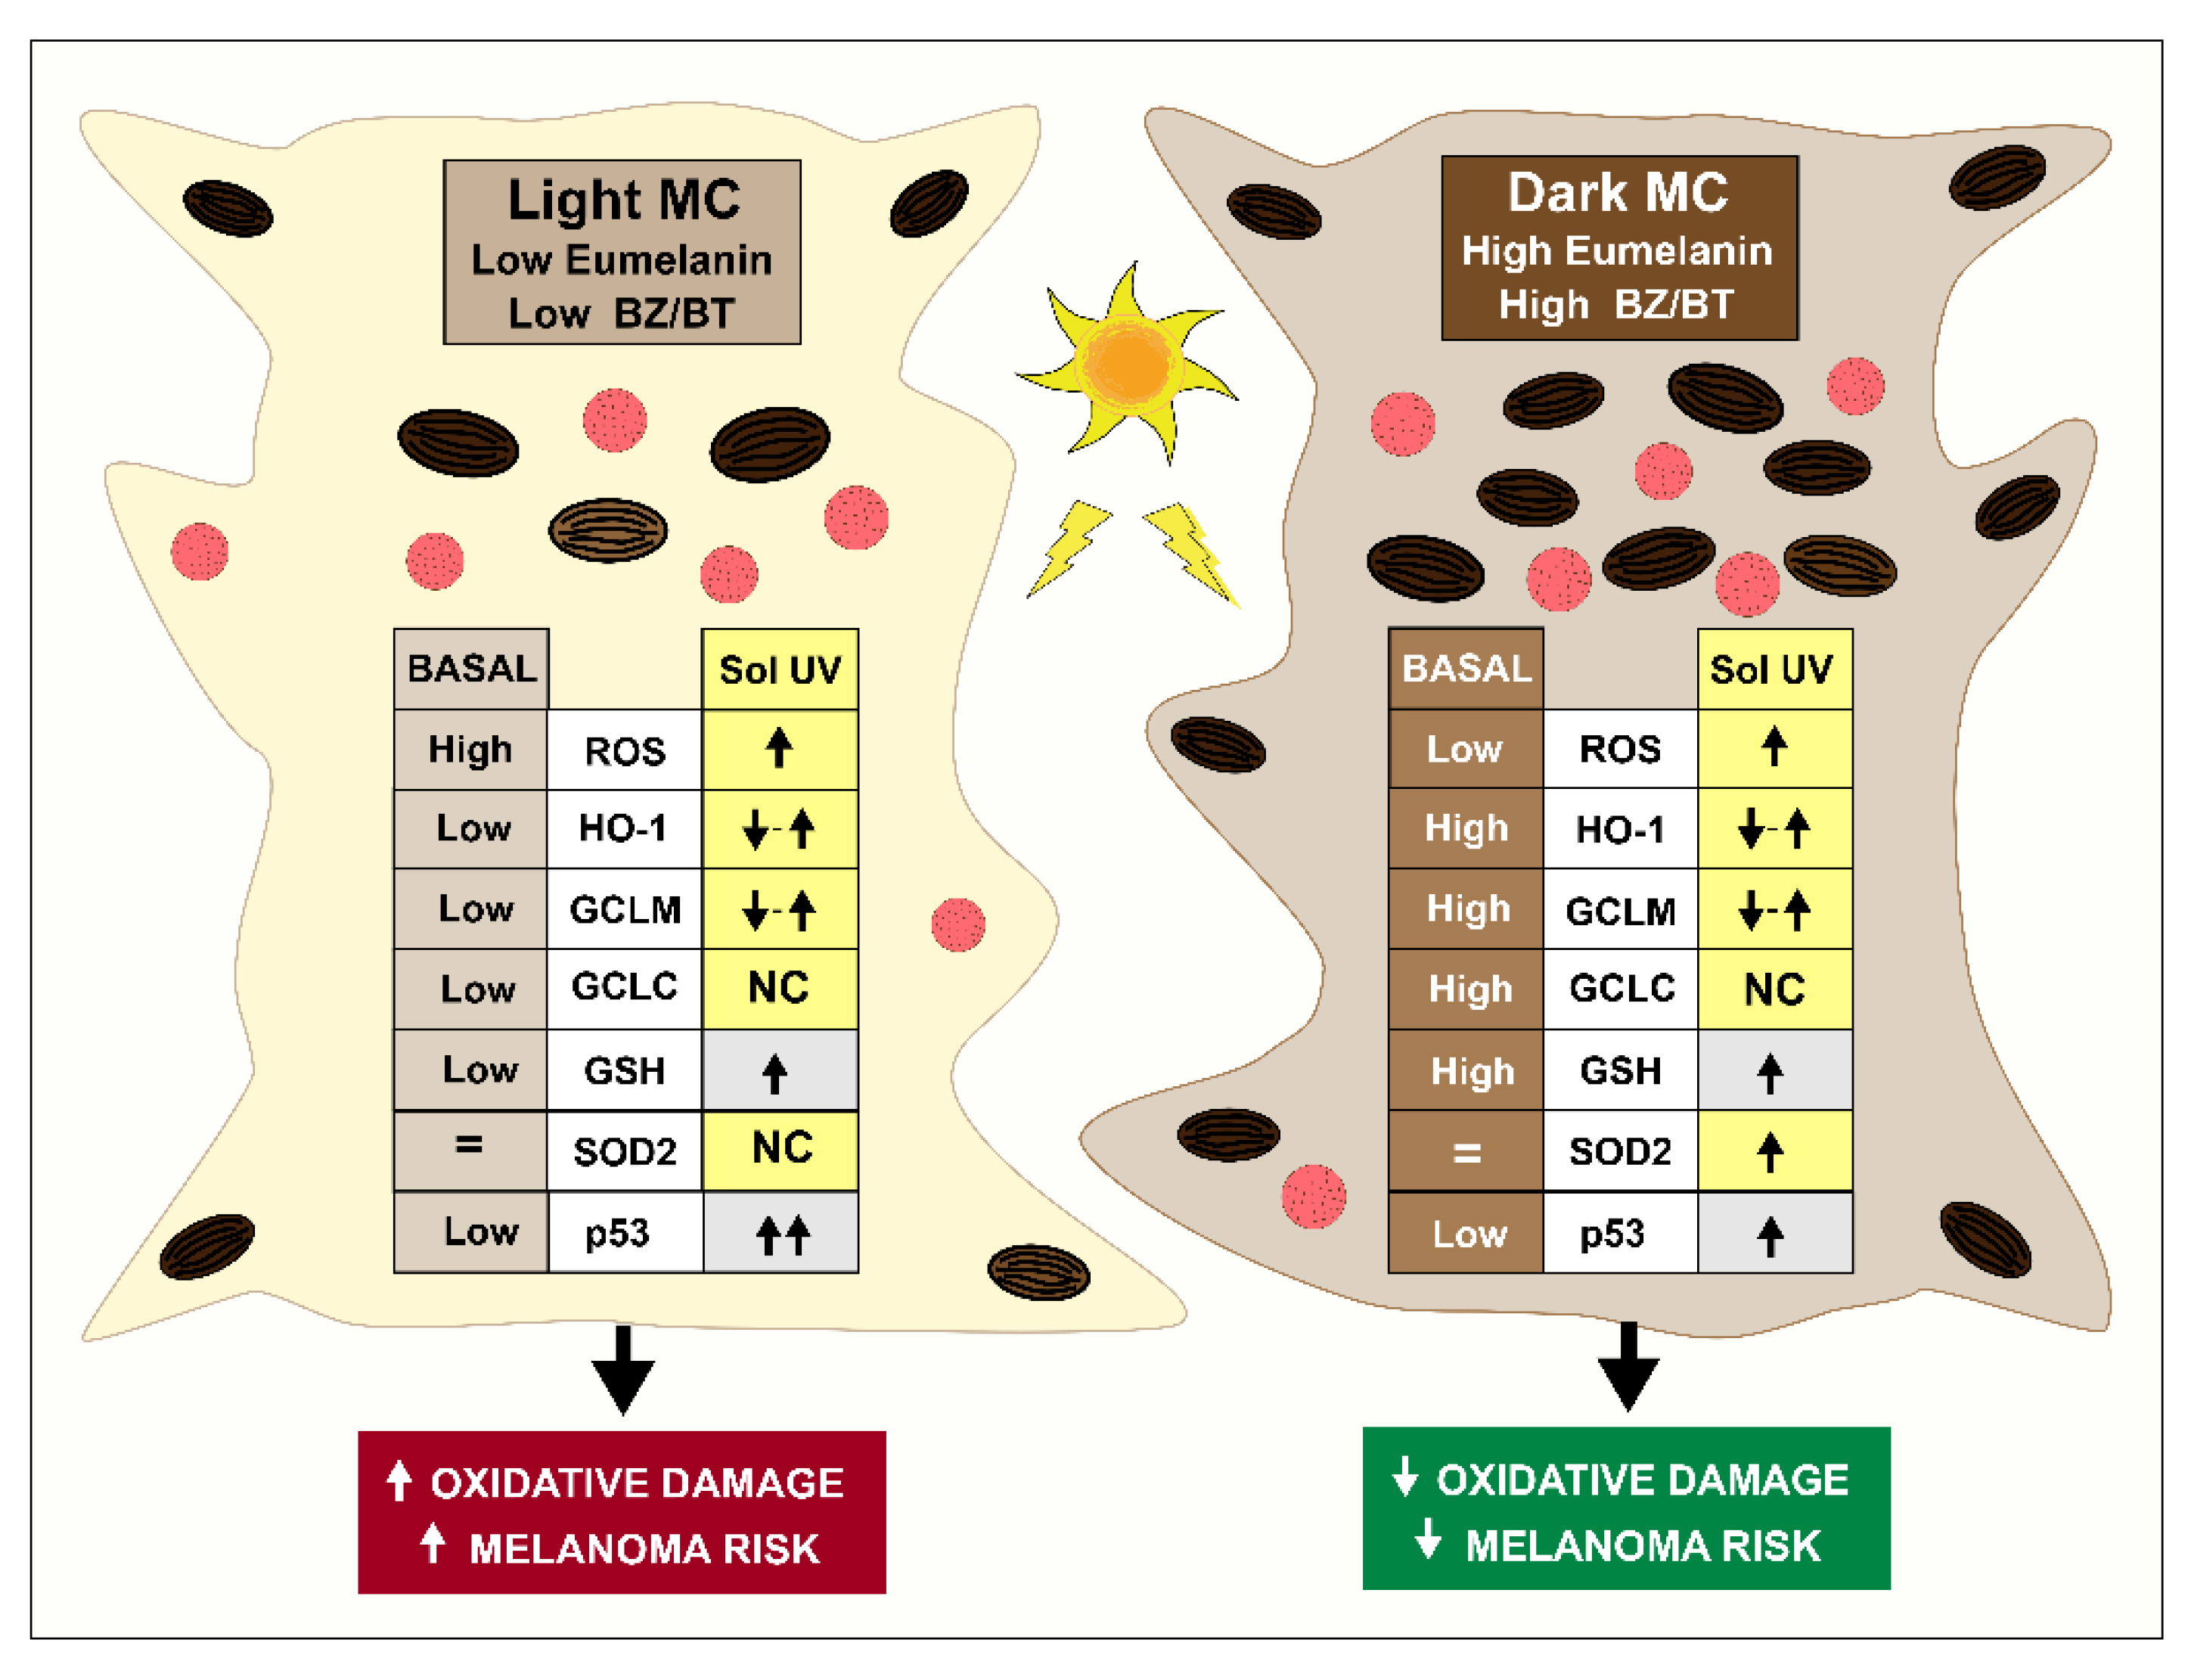
5. Conclusions
Supplementary Materials
Author Contributions
Funding
Institutional Review Board Statement
Informed Consent Statement
Data Availability Statement
Acknowledgments
Conflicts of Interest
References
- Gilchrest, B.A.; Eller, M.S.; Geller, A.C.; Yaar, M. The pathogenesis of melanoma induced by ultraviolet radiation. N. Engl. J. Med. 1999, 340, 1341–1348. [Google Scholar] [CrossRef] [PubMed]
- Dubin, N.; Moseson, M.; Pasternack, B.S. Sun exposure and malignant melanoma among susceptible individuals. Env. Health Perspect. 1989, 81, 139–151. [Google Scholar] [CrossRef] [PubMed]
- Veierod, M.B.; Weiderpass, E.; Thorn, M.; Hansson, J.; Lund, E.; Armstrong, B.; Adami, H.O. A prospective study of pigmentation, sun exposure, and risk of cutaneous malignant melanoma in women. J. Natl. Cancer Inst. 2003, 95, 1530–1538. [Google Scholar] [CrossRef] [Green Version]
- Pathak, M.A.; Jimbow, K.; Fitzpatrick, T. Photobiology of pigment cell. In Phenotypic Expression in Pigment Cells; Seiji, M., Ed.; University of Tokyo Press: Tokyo, Japan, 1980; pp. 655–670. [Google Scholar]
- Hunt, G.; Kyne, S.; Ito, S.; Wakamatsu, K.; Todd, C.; Thody, A.J. Eumelanin and pheomelanin levels in human epidermis and cultured melanocytes. Melanoma Res. 1994, 4, 13–14. [Google Scholar] [CrossRef]
- Hennessy, A.; Oh, C.; Diffey, B.; Wakamatsu, K.; Ito, S.; Rees, J. Eumelanin and pheomelanin concentrations in human epidermis before and after UVB irradiation. Pigment Cell Res. 2005, 18, 220–223. [Google Scholar] [CrossRef] [PubMed]
- Wakamatsu, K.; Kavanagh, R.; Kadekaro, A.L.; Terzieva, S.; Strum, R.A.; Leachman, S.; Abdel–malek, Z.A.; Ito, S. Diversity of pigmentation in cultured human melanocytes is due to differences in the type as well as quantity of melanin. Pigment Cell Res. 2006, 19, 154–162. [Google Scholar] [CrossRef] [PubMed]
- Menon, I.A.; Persad, S.; Ranadive, N.S.; Haberman, H.F. Photobiological effects of eumelanin and pheomelanin. In Biological, Molecular and Clinical Aspects of Pigmentation; Bagnara, J.T., Klaus, S.N., Paul, E., Schartl, M., Eds.; University of Tokyo Press: Tokyo, Japan, 1985; pp. 77–86. [Google Scholar]
- Bustamante, J.; Bredeston, L.; Malanga, G.; Mordoh, J. Role of melanin as a scavenger of active oxygen species. Pigment Cell Res. 1993, 6, 348–353. [Google Scholar] [CrossRef] [PubMed]
- Mitra, D.; Luo, X.; Morgan, A.; Wang, J.; Hoang, M.P.; Lo, J.; Guerrero, C.R.; Lennerz, J.K.; Mihm, M.C.; Wargo, J.A.; et al. An ultraviolet-radiation-independent pathway to melanoma carcinogenesis in the red hair/fair skin background. Nature 2012, 491, 449–453. [Google Scholar] [CrossRef]
- Tadokoro, T.; Kobayashi, N.; Zmudzka, B.Z.; Ito, S.; Wakamatsu, K.; Yamaguchi, Y.; Korossy, K.S.; Miller, S.A.; Beer, J.Z.; Hearing, V.J. UV-induced DNA damage and melanin content in human skin differing in racial/ethnic origin. FASEB J. 2003, 17, 1177–1179. [Google Scholar] [CrossRef] [PubMed] [Green Version]
- Hauser, J.E.; Kadekaro, A.L.; Kavanagh, R.J.; Wakamatsu, K.; Terzieva, S.; Schwemberger, S.; Babcock, G.; Rao, M.B.; Ito, S.; Abdel-Malek, Z.A. Melanin content and MC1R function independently affect UVR-induced DNA damage in cultured human melanocytes. Pigment Cell Res. 2006, 19, 303–314. [Google Scholar] [CrossRef]
- Pavel, S.; van Nieuwpoort, F.; van der Meulen, H.; Out, C.; Pizinger, K.; Cetkovska, P.; Smit, N.P.; Koerten, H.K. Disturbed melanin synthesis and chronic oxidative stress in dysplastic naevi. Eur. J. Cancer 2004, 40, 1423–1430. [Google Scholar] [CrossRef] [PubMed]
- Smit, N.P.; van Nieuwpoort, F.A.; Marrot, L.; Out, C.; Poorthuis, B.; van Pelt, H.; Meunier, J.R.; Pavel, S. Increased melanogenesis is a risk factor for oxidative DNA damage-study on cultured melanocytes and atypical nevus cells. Photochem. Photobiol. 2008, 84, 550–555. [Google Scholar] [CrossRef] [PubMed]
- Grammatico, P.; Maresca, V.; Roccella, F.; Roccella, M.; Biondo, L.; Catricala, C.; Picardo, M. Increased sensitivity to peroxidizing agents is correlated with an imbalance of antioxidants in normal melanocytes from melanoma patients. Exp. Dermatol. 1998, 7, 205–212. [Google Scholar] [CrossRef]
- Meyskens, F.L., Jr.; McNulty, S.E.; Buckmeier, J.A.; Tohidian, N.B.; Spillane, T.J.; Kahlon, R.S.; Gonzalez, R.I. Aberrant redox regulation in human metastatic melanoma cells compared to normal melanocytes. Free Radic. Biol. Med. 2001, 31, 799–808. [Google Scholar] [CrossRef] [Green Version]
- Ibarrola–Villava, M.; Martin–Gonzalez, M.; Lazaro, P.; Pizarro, A.; Lluch, A.; Ribas, G. Role of glutathione S–transferases in melanoma susceptibility: Association with GSTP1 rs1695 polymorphism. Br. J. Dermatol. 2012, 166, 1176–1183. [Google Scholar] [CrossRef] [PubMed]
- Landi, M.T.; Bauer, J.; Pfeiffer, R.M.; Elder, D.E.; Hulley, B.; Minghetti, P.; Calista, D.; Kanetsky, P.A.; Pinkel, D.; Bastian, B.C. MC1R germline variants confer risk for BRAF–mutant melanoma. Science 2006, 313, 521–522. [Google Scholar] [CrossRef]
- Bauer, J.; Buttner, P.; Murali, R.; Okamoto, I.; Kolaitis, N.A.; Landi, M.T.; Scolyer, R.A.; Bastian, B.C. BRAF mutations in cutaneous melanoma are independently associated with age, anatomic site of the primary tumor, and the degree of solar elastosis at the primary tumor site. Pigment Cell Melanoma Res. 2011, 24, 345–351. [Google Scholar] [CrossRef] [PubMed]
- Premi, S.; Wallisch, S.; Mano, C.M.; Weiner, A.B.; Bacchiocchi, A.; Wakamatsu, K.; Bechara, E.J.; Halaban, R.; Douki, T.; Brash, D.E. Photochemistry. Chemiexcitation of melanin derivatives induces DNA photoproducts long after UV exposure. Science 2015, 347, 842–847. [Google Scholar] [CrossRef]
- Abdel–Malek, Z.; Swope, V.B.; Suzuki, I.; Akcali, C.; Harriger, M.D.; Boyce, S.T.; Urabe, K.; Hearing, V.J. Mitogenic and melanogenic stimulation of normal human melanocytes by melanotropic peptides. Proc. Natl. Acad. Sci. USA 1995, 92, 1789–1793. [Google Scholar] [CrossRef] [Green Version]
- Song, X.; Mosby, N.; Yang, J.; Xu, A.; Abdel–Malek, Z.; Kadekaro, A.L. alpha–MSH activates immediate defense responses to UV–induced oxidative stress in human melanocytes. Pigment Cell Melanoma Res. 2009, 22, 809–818. [Google Scholar] [CrossRef] [PubMed]
- Ito, S.; Nakanishi, Y.; Valenzuela, R.K.; Brilliant, M.H.; Kolbe, L.; Wakamatsu, K. Usefulness of alkaline hydrogen peroxide oxidation to analyze eumelanin and pheomelanin in various tissue samples: Application to chemical analysis of human hair melanins. Pigment Cell Melanoma Res. 2011, 24, 605–613. [Google Scholar] [CrossRef] [PubMed]
- Ito, S.; Del Bino, S.; Hirobe, T.; Wakamatsu, K. Improved HPLC Conditions to Determine Eumelanin and Pheomelanin Contents in Biological Samples Using an Ion Pair Reagent. Int. J. Mol. Sci. 2020, 21, 5134. [Google Scholar] [CrossRef] [PubMed]
- Wakamatsu, K.; Ito, S.; Rees, J.L. The usefulness of 4–amino–3–hydroxyphenylalanine as a specific marker of pheomelanin. Pigment Cell Res. 2002, 15, 225–232. [Google Scholar] [CrossRef]
- Del Bino, S.; Ito, S.; Sok, J.; Nakanishi, Y.; Bastien, P.; Wakamatsu, K.; Bernerd, F. Chemical analysis of constitutive pigmentation of human epidermis reveals constant eumelanin to pheomelanin ratio. Pigment Cell Melanoma Res. 2015, 28, 707–717. [Google Scholar] [CrossRef]
- Kadekaro, A.L.; Chen, J.; Yang, J.; Chen, S.; Jameson, J.; Swope, V.B.; Cheng, T.; Kadakia, M.; Abdel–Malek, Z. Alpha–melanocyte–stimulating hormone suppresses oxidative stress through a p53–mediated signaling pathway in human melanocytes. Mol. Cancer Res. 2012, 10, 778–786. [Google Scholar] [CrossRef] [Green Version]
- Wakamatsu, K.; Ohtara, K.; Ito, S. Chemical analysis of late stages of pheomelanogenesis: Conversion of dihydrobenzothiazine to a benzothiazole structure. Pigment Cell Melanoma Res. 2009, 22, 474–486. [Google Scholar] [CrossRef]
- Greco, G.; Wakamatsu, K.; Panzella, L.; Ito, S.; Napolitano, A.; d’Ischia, M. Isomeric cysteinyldopas provide a (photo)degradable bulk component and a robust structural element in red human hair pheomelanin. Pigment Cell Melanoma Res. 2009, 22, 319–327. [Google Scholar] [CrossRef]
- Swope, V.B.; Starner, R.J.; Rauck, C.; Abdel–Malek, Z.A. Endothelin–1 and alpha–melanocortin have redundant effects on global genome repair in UV–irradiated human melanocytes despite distinct signaling pathways. Pigment Cell Melanoma Res. 2020, 33, 293–304. [Google Scholar] [CrossRef]
- Araujo, J.A.; Zhang, M.; Yin, F. Heme oxygenase–1, oxidation, inflammation, and atherosclerosis. Front. Pharmacol. 2012, 3, 119. [Google Scholar] [CrossRef] [Green Version]
- Marrot, L.; Jones, C.; Perez, P.; Meunier, J.R. The significance of Nrf2 pathway in (photo)–oxidative stress response in melanocytes and keratinocytes of the human epidermis. Pigment Cell Melanoma Res. 2008, 21, 79–88. [Google Scholar] [CrossRef]
- Jian, Z.; Li, K.; Liu, L.; Zhang, Y.; Zhou, Z.; Li, C.; Gao, T. Heme oxygenase–1 protects human melanocytes from H2O2–induced oxidative stress via the Nrf2–ARE pathway. J. Investig. Dermatol. 2011, 131, 1420–1427. [Google Scholar] [CrossRef] [Green Version]
- Franklin, C.C.; Backos, D.S.; Mohar, I.; White, C.C.; Forman, H.J.; Kavanagh, T.J. Structure, function, and post–translational regulation of the catalytic and modifier subunits of glutamate cysteine ligase. Mol. Asp. Med. 2009, 30, 86–98. [Google Scholar] [CrossRef] [Green Version]
- Flynn, J.M.; Melov, S. SOD2 in mitochondrial dysfunction and neurodegeneration. Free Radic. Biol. Med. 2013, 62, 4–12. [Google Scholar] [CrossRef] [Green Version]
- Seibt, T.M.; Proneth, B.; Conrad, M. Role of GPX4 in ferroptosis and its pharmacological implication. Free Radic. Biol. Med. 2019, 133, 144–152. [Google Scholar] [CrossRef]
- Orino, K.; Lehman, L.; Tsuji, Y.; Ayaki, H.; Torti, S.V.; Torti, F.M. Ferritin and the response to oxidative stress. Biochem. J. 2001, 357, 241–247. [Google Scholar] [CrossRef]
- Williams, A.B.; Schumacher, B. p53 in the DNA–Damage–Repair Process. Cold Spring Harb. Perspect. Med. 2016, 6, a026070. [Google Scholar] [CrossRef] [Green Version]
- Chen, J. The Cell–Cycle Arrest and Apoptotic Functions of p53 in Tumor Initiation and Progression. Cold Spring Harb. Perspect. Med. 2016, 6, a026104. [Google Scholar] [CrossRef]
- Eriksson, S.E.; Ceder, S.; Bykov, V.J.N.; Wiman, K.G. p53 as a hub in cellular redox regulation and therapeutic target in cancer. J. Mol. Cell Biol. 2019, 11, 330–341. [Google Scholar] [CrossRef] [Green Version]
- Budanov, A.V. The role of tumor suppressor p53 in the antioxidant defense and metabolism. Subcell Biochem. 2014, 85, 337–358. [Google Scholar] [CrossRef] [Green Version]
- Stagni, V.; Cirotti, C.; Barila, D. Ataxia–Telangiectasia Mutated Kinase in the Control of Oxidative Stress, Mitochondria, and Autophagy in Cancer: A Maestro With a Large Orchestra. Front. Oncol. 2018, 8, 73. [Google Scholar] [CrossRef]
- Cormier, J.N.; Xing, Y.; Ding, M.; Lee, J.E.; Mansfield, P.F.; Gershenwald, J.E.; Ross, M.I.; Du, X.L. Ethnic differences among patients with cutaneous melanoma. Arch. Intern. Med. 2006, 166, 1907–1914. [Google Scholar] [CrossRef] [Green Version]
- Halder, R.M.; Bridgeman–Shah, S. Skin cancer in African Americans. Cancer 1995, 75, 667–673. [Google Scholar] [CrossRef]
- Xiao, Y.; Lu, D.; Lei, M.; Xie, W.; Chen, Y.; Zheng, Y.; Wang, C.; Zhao, J.; Zhu, Z.; Zhao, X.; et al. Comprehensive analysis of DNA damage repair deficiency in 10,284 pan–cancer study. Ann. Transl. Med. 2021, 9, 1661. [Google Scholar] [CrossRef]
- Gambichler, T.; Rohrmoser, E.M.; Horny, K.; Sucker, A.; Schadendorf, D.; Skrygan, M.; Susok, L.; Stucker, M.; Becker, J.C. Comparison of mutation profiles in primary melanomas and corresponding nodal naevi using next–generation sequencing. Clin. Exp. Dermatol. 2022, 47, 373–380. [Google Scholar] [CrossRef]
- Wenczl, E.; Van der Schans, G.P.; Roza, L.; Kolb, R.M.; Timmerman, A.J.; Smit, N.P.M.; Pavel, S.; Schothorst, A.A. (Pheo)Melanin photosensitizes UVA–induced DNA damage in cultured human melanocytes. J. Investig. Dermatol. 1998, 111, 678–682. [Google Scholar] [CrossRef] [Green Version]
- Alaluf, S.; Atkins, D.; Barrett, K.; Blount, M.; Carter, N.; Heath, A. Ethnic variation in melanin content and composition in photoexposed and photoprotected human skin. Pigment Cell Res. 2002, 15, 112–118. [Google Scholar] [CrossRef]
- Tanaka, H.; Yamashita, Y.; Umezawa, K.; Hirobe, T.; Ito, S.; Wakamatsu, K. The Pro–Oxidant Activity of Pheomelanin is Significantly Enhanced by UVA Irradiation: Benzothiazole Moieties Are More Reactive than Benzothiazine Moieties. Int. J. Mol. Sci. 2018, 19, 2889. [Google Scholar] [CrossRef] [Green Version]
- Ito, S.; Wakamatsu, K.; Sarna, T. Photodegradation of Eumelanin and Pheomelanin and Its Pathophysiological Implications. Photochem. Photobiol. 2018, 94, 409–420. [Google Scholar] [CrossRef] [Green Version]
- Napolitano, A.; Panzella, L.; Monfrecola, G.; d’Ischia, M. Pheomelanin–induced oxidative stress: Bright and dark chemistry bridging red hair phenotype and melanoma. Pigment Cell Melanoma Res. 2014, 27, 721–733. [Google Scholar] [CrossRef] [Green Version]
- Brenner, M.; Hearing, V.J. The protective role of melanin against UV damage in human skin. Photochem. Photobiol. 2008, 84, 539–549. [Google Scholar] [CrossRef] [Green Version]
- Kobayashi, N.; Nakagawa, A.; Muramatsu, T.; Yamashina, Y.; Shirai, T.; Hashimoto, M.W.; Ishigaki, Y.; Ohnishi, T.; Mori, T. Supranuclear melanin caps reduce ultraviolet induced DNA photoproducts in human epidermis. J. Investig. Dermatol. 1998, 110, 806–810. [Google Scholar] [CrossRef] [Green Version]
- Kovacs, D.; Flori, E.; Maresca, V.; Ottaviani, M.; Aspite, N.; Dell’Anna, M.L.; Panzella, L.; Napolitano, A.; Picardo, M.; d’Ischia, M. The eumelanin intermediate 5,6–dihydroxyindole–2–carboxylic acid is a messenger in the cross–talk among epidermal cells. J. Investig. Dermatol. 2012, 132, 1196–1205. [Google Scholar] [CrossRef] [PubMed] [Green Version]
- Chedekel, M.R.; Smith, S.K.; Post, P.W.; Pokora, A.; Vessell, D.L. Photodestruction of pheomelanin: Role of oxygen. Proc. Natl. Acad. Sci. USA 1978, 75, 5395–5399. [Google Scholar] [CrossRef] [PubMed] [Green Version]
- Chedekel, M.R.; Agin, P.P.; Sayre, R.M. Photochemistry of pheomelanin: Action spectrum for superoxide production. Photochem. Photobiol. 1980, 31, 553–555. [Google Scholar] [CrossRef]
- Maresca, V.; Flori, E.; Briganti, S.; Camera, E.; Cario–Andre, M.; Taieb, A.; Picardo, M. UVA–induced modification of catalase charge properties in the epidermis is correlated with the skin phototype. J. Investig. Dermatol. 2006, 126, 182–190. [Google Scholar] [CrossRef] [PubMed] [Green Version]
- Box, N.F.; Wyeth, J.R.; O’Gorman, L.E.; Martin, N.G.; Sturm, R.A. Characterization of melanocyte stimulating hormone receptor variant alleles in twins with red hair. Hum. Mol. Genet. 1997, 6, 1891–1897. [Google Scholar] [CrossRef] [PubMed] [Green Version]
- Kennedy, C.; ter Huurne, J.; Berkhout, M.; Gruis, N.; Bastiaens, M.; Bergman, W.; Willemze, R.; Bouwes Bavinck, J.N. Melanocortin 1 receptor (MC1R) gene variants are associated with an increased risk for cutaneous melanoma which is largely independent of skin type and hair color. J. Investig. Dermatol. 2001, 117, 294–300. [Google Scholar] [CrossRef] [Green Version]
- Palmer, J.S.; Duffy, D.L.; Box, N.F.; Aitken, J.F.; O’Gorman, L.E.; Green, A.C.; Hayward, N.K.; Martin, N.G.; Sturm, R.A. Melanocortin–1 receptor polymorphisms and risk of melanoma: Is the association explained solely by pigmentation phenotype? Am. J. Hum. Genet. 2000, 66, 176–186. [Google Scholar] [CrossRef] [Green Version]
- Lamoreux, M.L.; Wakamatsu, K.; Ito, S. Interaction of major coat color gene functions in mice as studied by chemical analysis of eumelanin and pheomelanin. Pigment Cell Res. 2001, 14, 23–31. [Google Scholar] [CrossRef]
- Morgan, A.M.; Lo, J.; Fisher, D.E. How does pheomelanin synthesis contribute to melanomagenesis?: Two distinct mechanisms could explain the carcinogenicity of pheomelanin synthesis. BioEssays News Rev. Mol. Cell. Dev. Biol. 2013, 35, 672–676. [Google Scholar] [CrossRef] [Green Version]
- d’Ischia, M.; Wakamatsu, K.; Napolitano, A.; Briganti, S.; Garcia–Borron, J.C.; Kovacs, D.; Meredith, P.; Pezzella, A.; Picardo, M.; Sarna, T.; et al. Melanins and melanogenesis: Methods, standards, protocols. Pigment Cell Melanoma Res. 2013, 26, 616–633. [Google Scholar] [CrossRef]
- Panzella, L.; Leone, L.; Greco, G.; Vitiello, G.; D’Errico, G.; Napolitano, A.; d’Ischia, M. Red human hair pheomelanin is a potent pro–oxidant mediating UV–independent contributory mechanisms of melanomagenesis. Pigment Cell Melanoma Res. 2014, 27, 244–252. [Google Scholar] [CrossRef] [PubMed] [Green Version]
- Geschwind, I.I.; Huseby, R.A.; Nishioka, R. The effect of melanocyte–stimulating hormone on coat color in the mouse. Recent Prog. Horm. Res. 1972, 28, 91–130. [Google Scholar]
- Hunt, G.; Kyne, S.; Wakamatsu, K.; Ito, S.; Thody, A.J. Nle4DPhe7 α–melanocyte–stimulating hormone increases the eumelanin:phaeomelanin ratio in cultured human melanocytes. J. Investig. Dermatol. 1995, 104, 83–85. [Google Scholar] [CrossRef] [PubMed] [Green Version]
- Swope, V.; Alexander, C.; Starner, R.; Schwemberger, S.; Babcock, G.; Abdel–Malek, Z.A. Significance of the melanocortin 1 receptor in the DNA damage response of human melanocytes to ultraviolet radiation. Pigment Cell Melanoma Res. 2014, 27, 601–610. [Google Scholar] [CrossRef] [PubMed]
- Albrecht, S.; Jung, S.; Muller, R.; Lademann, J.; Zuberbier, T.; Zastrow, L.; Reble, C.; Beckers, I.; Meinke, M.C. Skin type differences in solar–simulated radiation–induced oxidative stress. Br. J. Dermatol. 2019, 180, 597–603. [Google Scholar] [CrossRef]
- Maresca, V.; Flori, E.; Briganti, S.; Mastrofrancesco, A.; Fabbri, C.; Mileo, A.M.; Paggi, M.G.; Picardo, M. Correlation between melanogenic and catalase activity in in vitro human melanocytes: A synergic strategy against oxidative stress. Pigment Cell Melanoma Res. 2008, 21, 200–205. [Google Scholar] [CrossRef]
- Barker, D.; Dixon, K.; Medrano, E.E.; Smalara, D.; Im, S.; Mitchell, D.; Babcock, G.; Abdel–Malek, Z.A. Comparison of the responses of human melanocytes with different melanin contents to ultraviolet B irradiation. Cancer Res. 1995, 55, 4041–4046. [Google Scholar]
- Liu, Y.; Gu, W. p53 in ferroptosis regulation: The new weapon for the old guardian. Cell Death Differ. 2022, 29, 895–910. [Google Scholar] [CrossRef]
- Obrador, E.; Liu–Smith, F.; Dellinger, R.W.; Salvador, R.; Meyskens, F.L.; Estrela, J.M. Oxidative stress and antioxidants in the pathophysiology of malignant melanoma. Biol. Chem. 2019, 400, 589–612. [Google Scholar] [CrossRef] [Green Version]
- Pizzimenti, S.; Ribero, S.; Cucci, M.A.; Grattarola, M.; Monge, C.; Dianzani, C.; Barrera, G.; Muzio, G. Oxidative Stress–Related Mechanisms in Melanoma and in the Acquired Resistance to Targeted Therapies. Antioxidants 2021, 10, 1942. [Google Scholar] [CrossRef] [PubMed]
- McManus, M.J.; Murphy, M.P.; Franklin, J.L. The mitochondria–targeted antioxidant MitoQ prevents loss of spatial memory retention and early neuropathology in a transgenic mouse model of Alzheimer’s disease. J. Neurosci. Off. J. Soc. Neurosci. 2011, 31, 15703–15715. [Google Scholar] [CrossRef] [PubMed] [Green Version]
- Zheng, Q.; Li, L.; Liu, M.; Huang, B.; Zhang, N.; Mehmood, R.; Nan, K.; Li, Q.; Chen, W.; Lin, S. In situ scavenging of mitochondrial ROS by anti–oxidative MitoQ/hyaluronic acid nanoparticles for environment–induced dry eye disease therapy. Chem. Eng. J. 2020, 398, 125621. [Google Scholar] [CrossRef]
- Le Gal, K.; Ibrahim, M.X.; Wiel, C.; Sayin, V.I.; Akula, M.K.; Karlsson, C.; Dalin, M.G.; Akyurek, L.M.; Lindahl, P.; Nilsson, J.; et al. Antioxidants can increase melanoma metastasis in mice. Sci. Transl. Med. 2015, 7, 308re8. [Google Scholar] [CrossRef] [PubMed]


| Melanin Contents | ||||
|---|---|---|---|---|
| Cell Strain | EM (µg/106 cells) | BZ-PM (µg/106 cells) | BT-PM (µg/106 cells) | Total Melanin (µg/106 cells) |
| L1 | 1.18 | 0.56 | 0.62 | 2.36 |
| L2 | 1.83 | 1.44 | 0.97 | 4.24 |
| L3 | 1.95 | 1.88 | 2.83 | 6.66 |
| L4 | 4.12 | 2.70 | 2.61 | 9.44 |
| L5 | 1.09 | 0.80 | 2.45 | 4.35 |
| L6 | 0.61 | 0.42 | 1.13 | 2.16 |
| D2 | 18.96 | 13.94 | 8.42 | 41.33 |
| D3 | 40.15 | 20.38 | 5.85 | 66.38 |
| D4 | 38.95 | 22.24 | 6.48 | 67.66 |
| D5 | 30.08 | 12.53 | 2.39 | 45.00 |
Publisher’s Note: MDPI stays neutral with regard to jurisdictional claims in published maps and institutional affiliations. |
© 2022 by the authors. Licensee MDPI, Basel, Switzerland. This article is an open access article distributed under the terms and conditions of the Creative Commons Attribution (CC BY) license (https://creativecommons.org/licenses/by/4.0/).
Share and Cite
Upadhyay, P.R.; Starner, R.J.; Swope, V.B.; Wakamatsu, K.; Ito, S.; Abdel-Malek, Z.A. Differential Induction of Reactive Oxygen Species and Expression of Antioxidant Enzymes in Human Melanocytes Correlate with Melanin Content: Implications on the Response to Solar UV and Melanoma Susceptibility. Antioxidants 2022, 11, 1204. https://0-doi-org.brum.beds.ac.uk/10.3390/antiox11061204
Upadhyay PR, Starner RJ, Swope VB, Wakamatsu K, Ito S, Abdel-Malek ZA. Differential Induction of Reactive Oxygen Species and Expression of Antioxidant Enzymes in Human Melanocytes Correlate with Melanin Content: Implications on the Response to Solar UV and Melanoma Susceptibility. Antioxidants. 2022; 11(6):1204. https://0-doi-org.brum.beds.ac.uk/10.3390/antiox11061204
Chicago/Turabian StyleUpadhyay, Parth R., Renny J. Starner, Viki B. Swope, Kazumasa Wakamatsu, Shosuke Ito, and Zalfa A. Abdel-Malek. 2022. "Differential Induction of Reactive Oxygen Species and Expression of Antioxidant Enzymes in Human Melanocytes Correlate with Melanin Content: Implications on the Response to Solar UV and Melanoma Susceptibility" Antioxidants 11, no. 6: 1204. https://0-doi-org.brum.beds.ac.uk/10.3390/antiox11061204