
Hydrogen Sulfide Regulates Irisin and Glucose Metabolism in Myotubes and Muscle of HFD-Fed Diabetic Mice


Department of Pediatrics and Center for Cardiovascular Diseases and Sciences, Louisiana State University, Health Sciences Center-Shreveport, Shreveport, LA 71130, USA
*
Authors to whom correspondence should be addressed.
†
Current address: Department of Life Sciences, School of Life Sciences, Central University of Tamil Nadu, Neelakudi, Thiruvarur 610005, Tamil Nadu, India.
Antioxidants 2022, 11(7), 1369; https://0-doi-org.brum.beds.ac.uk/10.3390/antiox11071369
Submission received: 14 June 2022
/
Revised: 4 July 2022
/
Accepted: 13 July 2022
/
Published: 14 July 2022
(This article belongs to the Special Issue Oxidative Stress in Diabetes and Complications)
Abstract
:Irisin, a novel myokine, is secreted by the muscle following proteolytic cleavage of fibronectin type III domain containing 5 (FNDC5) and is considered a novel regulator of glucose homeostasis. Cystathionine γ-lyase (CSE) produces hydrogen sulfide (H2S) and is involved in glucose homeostasis. We examined the hypothesis that H2S deficiency leads to decreased FNDC5 and irisin secretion, and thereby alters glucose metabolism. High-fat diet-fed mice exhibited elevated blood glucose and significantly reduced levels of CSE, H2S, and PGC-1α, with decreased FNDC5/irisin levels and increased oxidative stress in the muscle compared with those of normal diet-fed mice (control). High glucose or palmitate decreases CSE/PGC-1α/FNDC5 levels and glucose uptake in myotubes. Inhibitors (propargylglycine and aminooxyacetate) of H2S producing enzymes or CSE siRNA significantly decreased levels of H2S and FNDC5 along with PGC-1α; similar H2S-deficient conditions also resulted in decreased GLUT4 and glucose uptake. The levels of H2S, PGC-1α, and FNDC5 and glucose uptake were significantly upregulated after treatment with l-cysteine or an H2S donor. Myoblast differentiation showed upregulation of PGC-1α and FNDC5, which was consistent with the increased expression of CSE/H2S. These findings suggest that the upregulation of H2S levels can have beneficial effects on glucose homeostasis via activation of the PGC-1α/FNDC5/irisin signaling pathway.
1. Introduction
Skeletal muscle dysfunction has become a relevant factor in health and metabolic disease. Hormones secreted by skeletal muscle, called myokines [1], play essential roles in regulating glucose homeostasis and lipid metabolism [2]. Skeletal muscle health is crucial because, among other things, a lack of physical activity has contributed to an increase in the global prevalence of diabetes, which has risen from 108 million in 1980 to 422 million in 2014, according to statistics from the Centers for Disease Control and Prevention [3].
Irisin, a novel myokine secreted following proteolytic cleavage of its precursor fibronectin type III domain containing 5 (FNDC5) by the skeletal muscle [4], can regulate glucose homeostasis [5,6]. Irisin secretion occurs in response to peroxisome proliferator-activated receptor γ coactivator-1α (PGC-1α) activation through exercise. Type 2 diabetes mellitus (T2DM) patients show decreased irisin levels, along with other inverse associations with diabetes and its associated complications [7,8,9,10,11]. Serum irisin levels are closely related to those of HOMA-β under conditions of normal glucose tolerance, suggesting that irisin may also play an essential role in pancreatic β-cell function [12]. Decreased circulating irisin concentrations and FNDC5 gene expression have been observed in the muscle of obese T2DM subjects [13].
Hydrogen sulfide (H2S) is generated from l-cysteine mainly by cystathionine γ-lyase (CSE), and also by two other enzymes, cystathionine β-synthase (CBS) and 3-mercaptopyruvate sulfurtransferase (3-MST) [14]. Non-enzymatic hydrogen sulfide produced from cysteine is also shown in the blood, and this reaction is catalyzed by iron and vitamin B6 [15]. Diabetic patients have lower blood concentrations of H2S and l-cysteine (LC) [16,17]. LC undergoes enzymatic breakdown to produce hydrogen sulfide (H2S), a gasotransmitter that regulates glucose and lipid homeostasis [18]. It has been reported recently that an association has been observed between the decline in H2S levels and the high fructose diet-induced T2DM in rats and high-fat diet-fed mice [18,19,20]. Another recent report suggested that either a systemic increase or decrease in H2S levels achieved by pharmacological means causes a reduction in insulin resistance [21], implying that various organ-specific metabolic responses play a role in regulating cardiovascular function, inflammation, insulin resistance, obesity, and glucose metabolism [22,23,24,25,26,27,28,29].
In vitro, in vivo, and human studies from our laboratory and others have shown that a decreased level of H2S is associated with high glucose/insulin resistance/diabetes [16,17,18,20,30,31,32,33,34,35,36,37,38,39,40,41,42] and that H2S reportedly reduces insulin resistance. Together, these studies suggest that H2S exerts control over glucose homeostasis at physiologically relevant concentrations. However, the precise biological effect of both endogenous or exogenous H2S on myokine irisin and its contribution to glucose homeostasis is not apparent. No previous study has investigated the impact of H2S on the regulation of muscle myokine irisin.
This study is the first to report downregulation of both CSE mediated H2S synthesis and FNDC5/irisin, and the subsequent alteration of glucose metabolism in the skeletal muscle of mice fed a HFD. Cell culture studies have shown that either downregulation or upregulation of physiological levels of H2S exerted inhibitory/beneficial effects by altering PGC-1α, FNDC5/irisin, and glucose homeostasis. This provides evidence for H2S as a new endogenous factor responsible for regulating PGC-1α mediated regulation of irisin and glucose metabolism.
2. Materials and Methods
All chemicals and reagents used in the study, which were of molecular and analytical grade, were purchased from Sigma Chemical Co. (St. Louis, MO, USA), unless otherwise mentioned. Antibodies against FNDC5 (ab174833), and PGC-1α (ab54481) were purchased from Abcam. The anti-CTH (WH0001491M), anti-GLUT4 (G4048), and anti-GAPDH HRP (G9295) antibodies were purchased from Sigma Aldrich. Goat anti-mouse HRP (170–6516) was purchased from Biorad and the goat anti-rabbit HRP (12–348) from Millipore.
2.1. Animals and Dietary Treatment
C57BL/6J male mice (5 weeks old, 20–24 g; Jackson Laboratory, Bar Harbor, ME, USA) were housed in a temperature-controlled room (22 ± 2 °C) with a 12-h: 12-h light: dark cycle. Animals were acclimatized in the Institutional Animal House for one week. Mice fasted overnight, were weighed and then tested for hyperglycemia by measuring their blood glucose concentrations. Blood glucose was assessed following a tail prick using an Accu-Chek glucometer (Boehringer Mannheim Corp., Indianapolis, IN, USA). Animals were randomly distributed into two groups by computer-generated randomization, and each animal had ad libitum access to water and was fed either a high-fat diet (HFD, Harlan TD.88137, providing 42% calories as fat) or a standard chow feed (control, Harlan TD.08485, providing 5.2% calories as fat) for 16 weeks (n = 6, in each group). The detailed composition of these diets is given in a recent publication [43]. This is a reasonable model (dietary-induced insulin resistance) for the human metabolic syndrome condition, which created both fasting hyperglycemia and hyperinsulinemia.
All of the procedures that involved animal handling followed the ethical standards of the institution and were approved by the Institutional Animal Ethical Committee. After 16 weeks, the mice were weighed and sacrificed, blood was collected and plasma isolated after centrifuging the blood in a 4 °C centrifuge at 2000× g for 15 min; the plasma was stored at −80 °C until use. Skeletal muscles were collected and cut into pieces adequate for the preparation of homogenates, immediately frozen in liquid nitrogen, and stored at −80 °C until use.
2.2. Cell Culture, Gene Silencing, and Treatments
Mouse C2C12 myoblasts (American Type Culture Collection no. CRL-1772, Manassas, VA, USA) were cultured at 37 °C in an atmosphere of 5% CO2 and allowed to differentiate into myotubes [18,44]. CSE/H2S deficiency was induced by CSE siRNA (100 nM; 24 h) [18,44] or the chemical inhibitors propargylglycine or aminooxyacetate (100 µM for 6 h). After the transfection procedure, cells were treated with serum and phenol red-free medium for 6 h, similar to the NaHS treatment (described below).
An additional set of experimental myotubes were treated with high glucose (25 mM) or palmitate (0.6 mM) (which mimics diabetic conditions) for 24 h. In another set of experiments, cells were supplemented with either l-cysteine (LC; 300 μM)/Na2S (Na2S; 20 μM) for 6 h. Alamar Blue reduction bioassay was employed in all the experimental conditions to determine the cell viability.
2.3. Analysis of mRNA Expression Using Quantitative PCR and Western Blot Analysis
Quantitative PCR was performed using the TaqMan™ Gene Expression Assays (Applied Biosystems, Waltham, MA, USA) with primer/probe sets CSE (Mm00461247_m1), PGC-1α (Mm01208835_m1), FNDC5 (Mm01181543_m1), GLUT4 (Mm00436615_m1), GAPDH (Mm99999915_g1), Applied Biosystems™, Waltham, MA, USA. In accordance with MIQE guidelines, technical replicates (n = 3) and biological replicates (n = 4) were included in all of our experiments. The relative amount of fold change mRNA was calculated using the 2−ΔΔCT method with a 7900HT real-time PCR system and software (Applied Biosystems, Waltham, MA, USA), and the results were expressed as relative quantification (RQ).
2.4. Hydrogen Sulfide Measurements
Plasma and cell culture supernatant hydrogen sulfide (H2S) levels were determined as per the previously published methylene blue method [41,46]. Free sulfide was measured in cells using a specific fluorescent probe, sulfide fluor-7 acetoxymethyl ester (SF7-AM) (748110, ALDRICH, St. Louis, MO, USA) [18]. Results were expressed as the fold change with the respective controls ratio of F0/Fi.
2.5. Glucose Uptake Assays
The glucose uptake assay was performed using 6-NBDG (Invitrogen, Waltham, MA, USA), a fluorescent analog of 2-deoxyglucose, following the method of Jung et al. [47]. Results were expressed as relative fluorescence units (RFU).
2.6. GSH, Protein Carbonyl, MDA, Hydrogen Peroxide, and Irisin Assays
Levels of total GSH from tissues were quantified using a fluorimetric method (#CS1020; Glutathione Assay Kit, Fluorimetric; Sigma, St. Louis, MO, USA). Oxidative stress was assessed by measuring the quantification of protein carbonyls and MDA using a Protein Carbonyl Colorimetric Kit and TBARS Assay kit (Cayman Chemical, Ann Arbor, MI, USA). Amplex™ Red Hydrogen Peroxide/Peroxidase Assay Kit (ThermoFisher Scientific, Grand Island, NY, USA) was used to detect hydrogen peroxide (H2O2) and expressed as nmol/mg protein. Protocols, as provided in the manufacturer’s instructions, were followed in all the assays using the appropriate controls and standards. Plasma and cell culture supernatant levels of irisin were determined using ELISA kits from Phoenix Pharmaceuticals, Inc. Burlingame, CA, USA (Cat# EK-067-29).
2.7. Statistical Analysis
The data were subjected to either Student’s t-test to compare the control with the HFD group or one-way analysis of variance (ANOVA), followed by Student’s-Newman–Keul’s (SNK) test to assess the significance between control and experimental groups. The data were considered statistically significant at the level of p < 0.05 and expressed as mean ± standard error of the mean (SEM). GraphPad Prism version 8.00 for Windows (GraphPad Software, La Jolla, CA, USA) was used for statistical analysis.
3. Results
3.1. H2S Deficiency Impairs FNDC5/Irisin in the Skeletal Muscle of HFD-Fed Mice
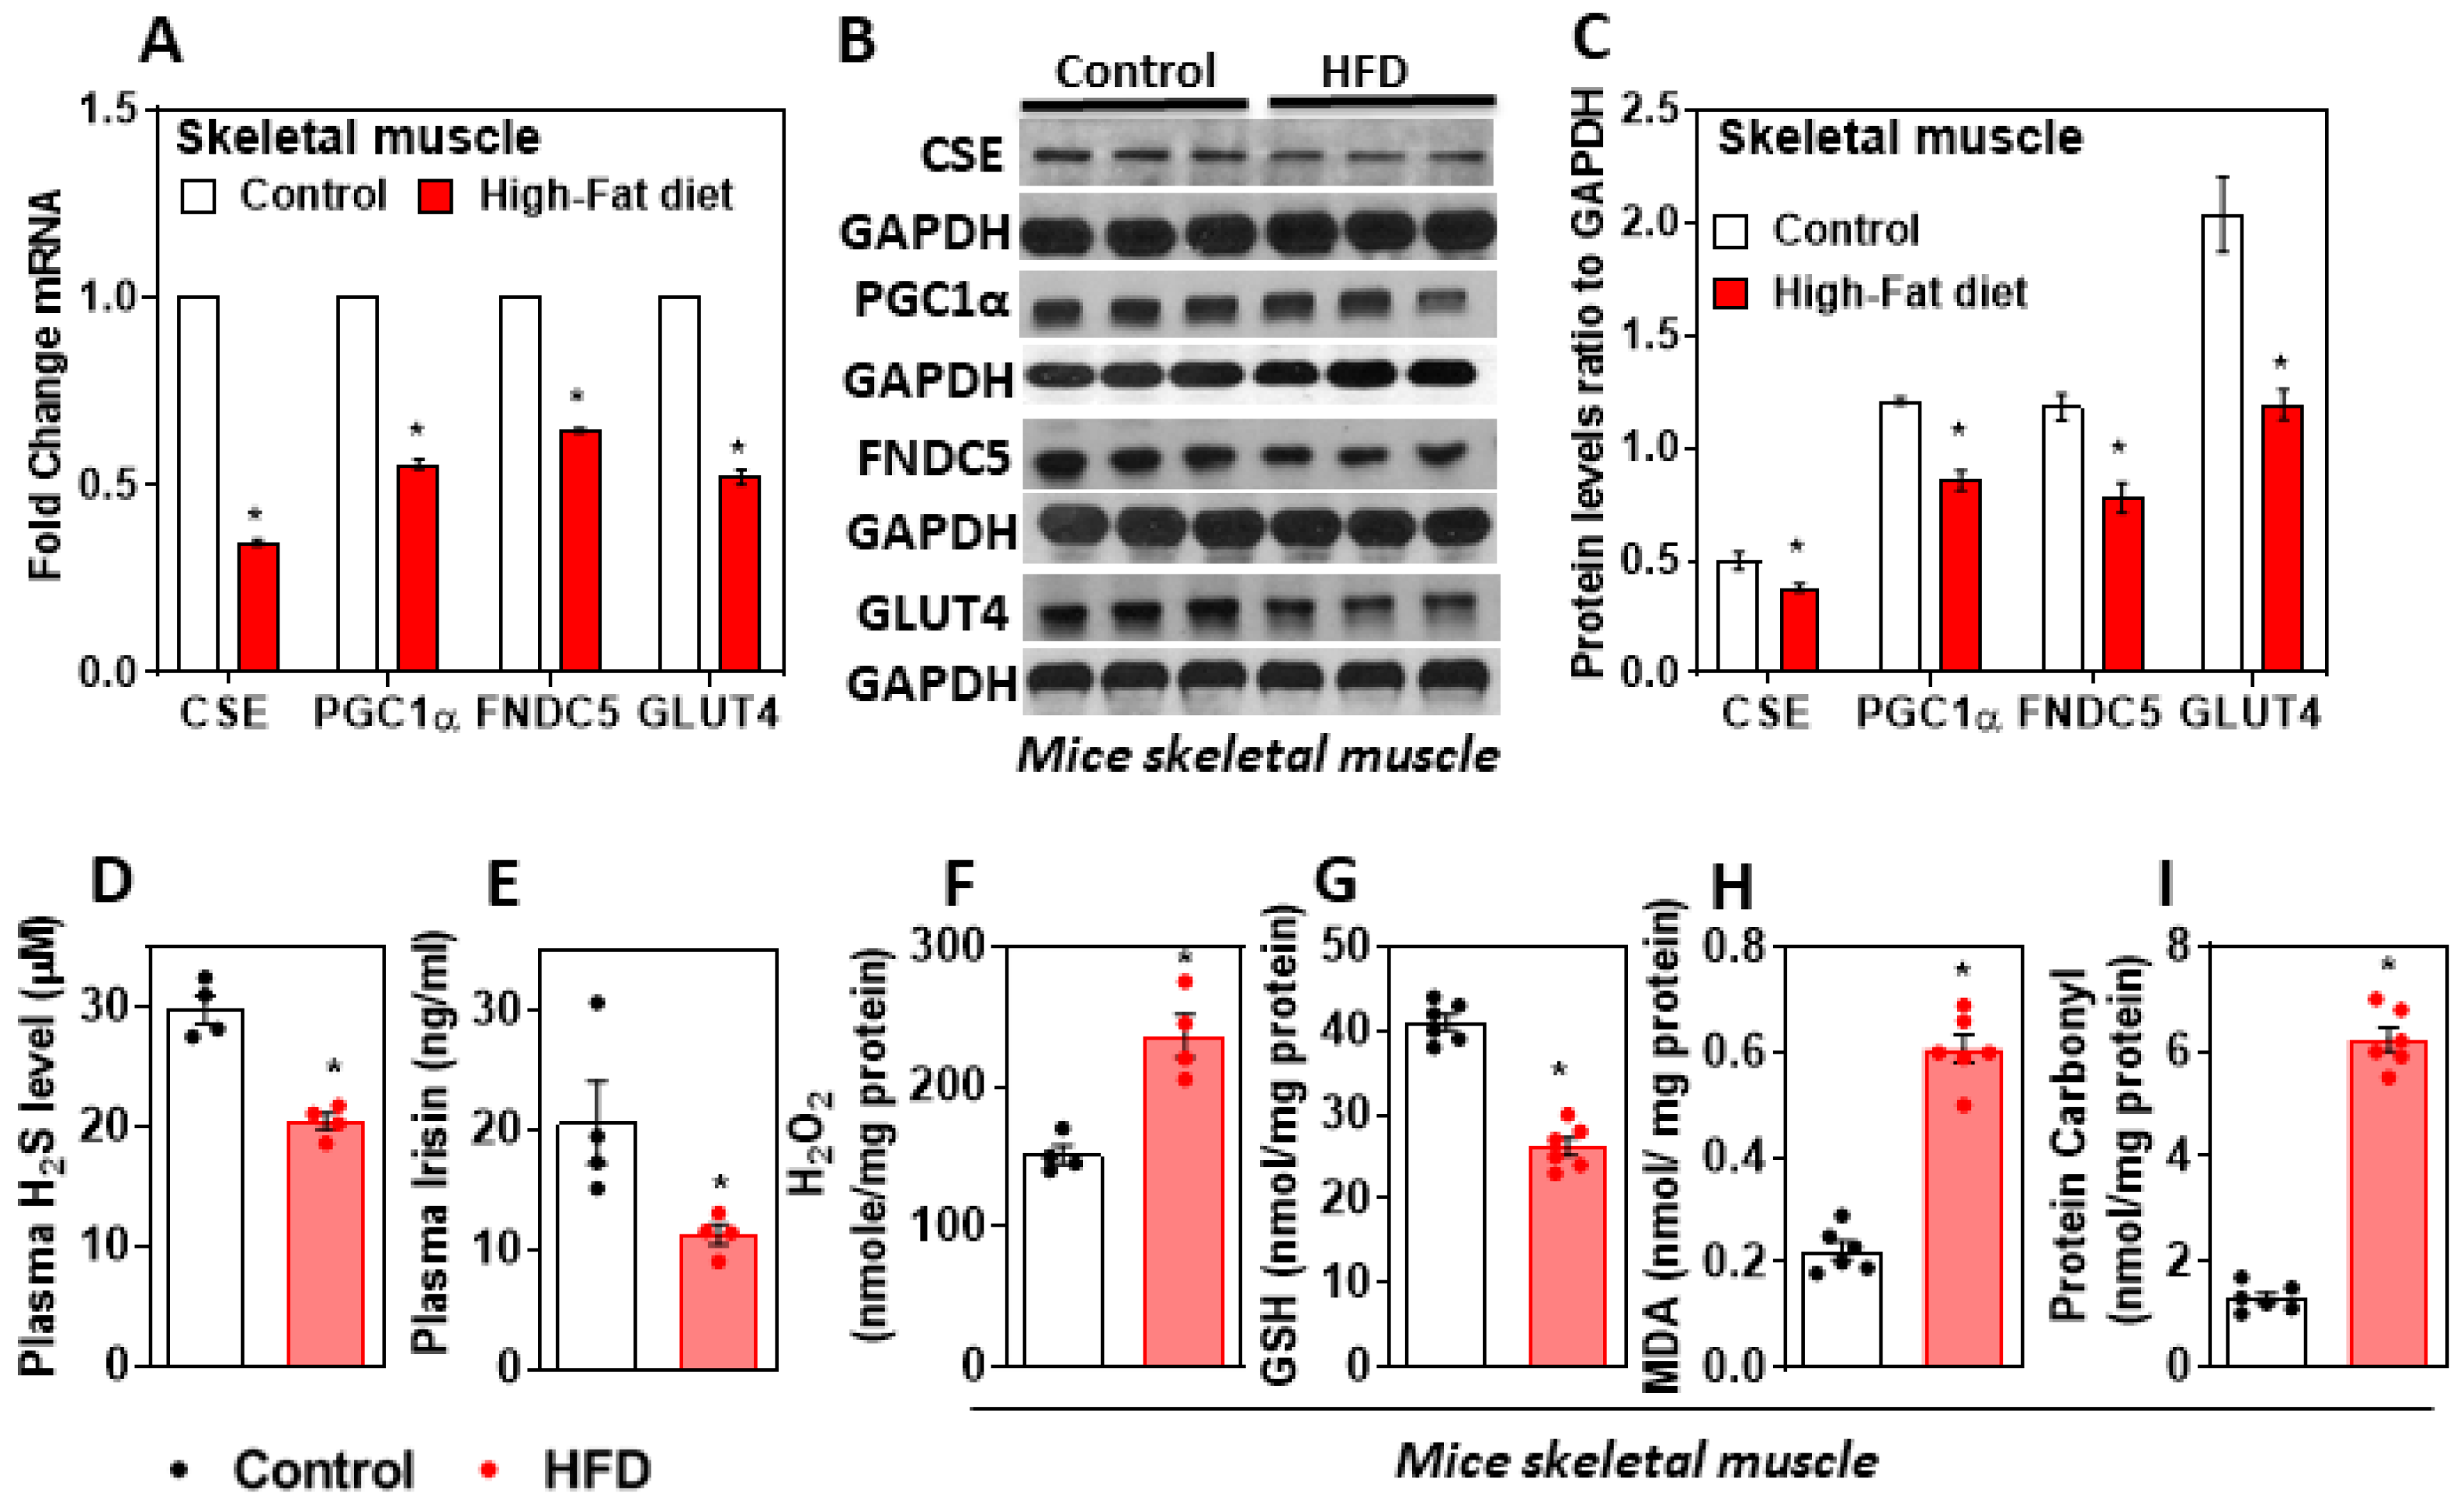
Mice fed a HFD for 16 weeks showed a metabolic phenotype similar to that of obese T2DM human subjects. In the muscle of HFD-fed mice, the expression of CSE decreased along with that of the gene, which encodes for the protein FNDC5, and its cleaved product irisin was downregulated (Figure 1A–C). The genes involved in glucose homeostasis, PGC-1α, and GLUT4, were significantly downregulated in the muscle of HFD-fed mice compared to those of the control group (Figure 1A–C). Furthermore, the levels of plasma H2S and irisin decreased significantly, and those of oxidative stress markers, such as H2O2, MDA, and protein carbonyl, increased in HFD-fed mice muscle compared to those of controls (Figure 1D–I). This suggests that a decreased status for the antioxidants GSH, H2S, and excess oxidative stress in the muscle of diabetic mice blunts the expression of FNDC5 and the levels of myokine irisin.
3.2. Treatment with High Glucose and Palmitate Affects H2S Levels and FNDC5/Irisin Expression and Secretion in In Vitro myotubes
Differentiated myotubes were used to investigate expression and secretion of FNDC5/irisin in an in vitro condition, which is devoid of the neuro humoral milieu of an integral body. Treatment with high glucose (25mM) or palmitate (0.6mM) (which mimics diabetic conditions) for 24 h decreased CSE, PGC-1α, and FNDC5 protein levels in differentiated mouse myotubes (Figure 2A–D); the levels of irisin in the condition medium also significantly decreased (Figure 2I). Furthermore, in vitro, the diabetic conditions significantly decreased the levels of GLUT4 mRNA and glucose uptake, along with cellular and medium H2S levels (Figure 2E–H). From these data, it is inferred that diabetic conditions may be directly triggered to downregulate the CSE-H2S system and irisin.
3.3. Inhibition of H2S Production Reduces Irisin and Glucose Uptake
Myotubes treated with pharmacological inhibitors of H2S producing enzymes (propargylglycine or aminooxyacetate; 100 µM for 6 h) showed decreased levels of H2S and FNDC5 along with PGC-1α (Figure 3A–D); similar H2S-deficient conditions also caused decreases in both GLUT4 and glucose uptake (Figure 3E,F). The levels of irisin in the condition medium decreased significantly along with inhibition of H2S (Figure 3G–I). These data imply that inhibition of the H2S system can affect irisin and glucose uptake in myotubes.
3.4. CSE Knockdown Affects the PGC-1α Mediated Uptake of Irisin, GLUT4, and Glucose
The direct effect of CSE-H2S deficiency status on PGC-1α, FNDC5/irisin, and GLUT4 and glucose uptake was assessed using in vitro CSE siRNA (100 nM; 24 h) experiments on mouse myotubes. CSE knockdown (KD) cells showed decreased CSE expression and H2S content (Figure 4A,B,G). PGC-1α and FNDC5 expression were also attenuated in CSE KD cells compared to that in control cells (Figure 4A,C,D). Additionally, similar decreasing trends were observed for irisin, GLUT4 mRNA, and glucose uptake in the condition medium of CSE KD cells (Figure 4E,F,H,I). These results suggest that the status of H2S may have a direct effect on the muscle myokine irisin.
3.5. H2S Donors/Precursor (NaHS/Na2S/LC) Positively Regulate PGC-1α, Irisin, and GLUT4 Mediated Glucose Uptake in Myoblasts
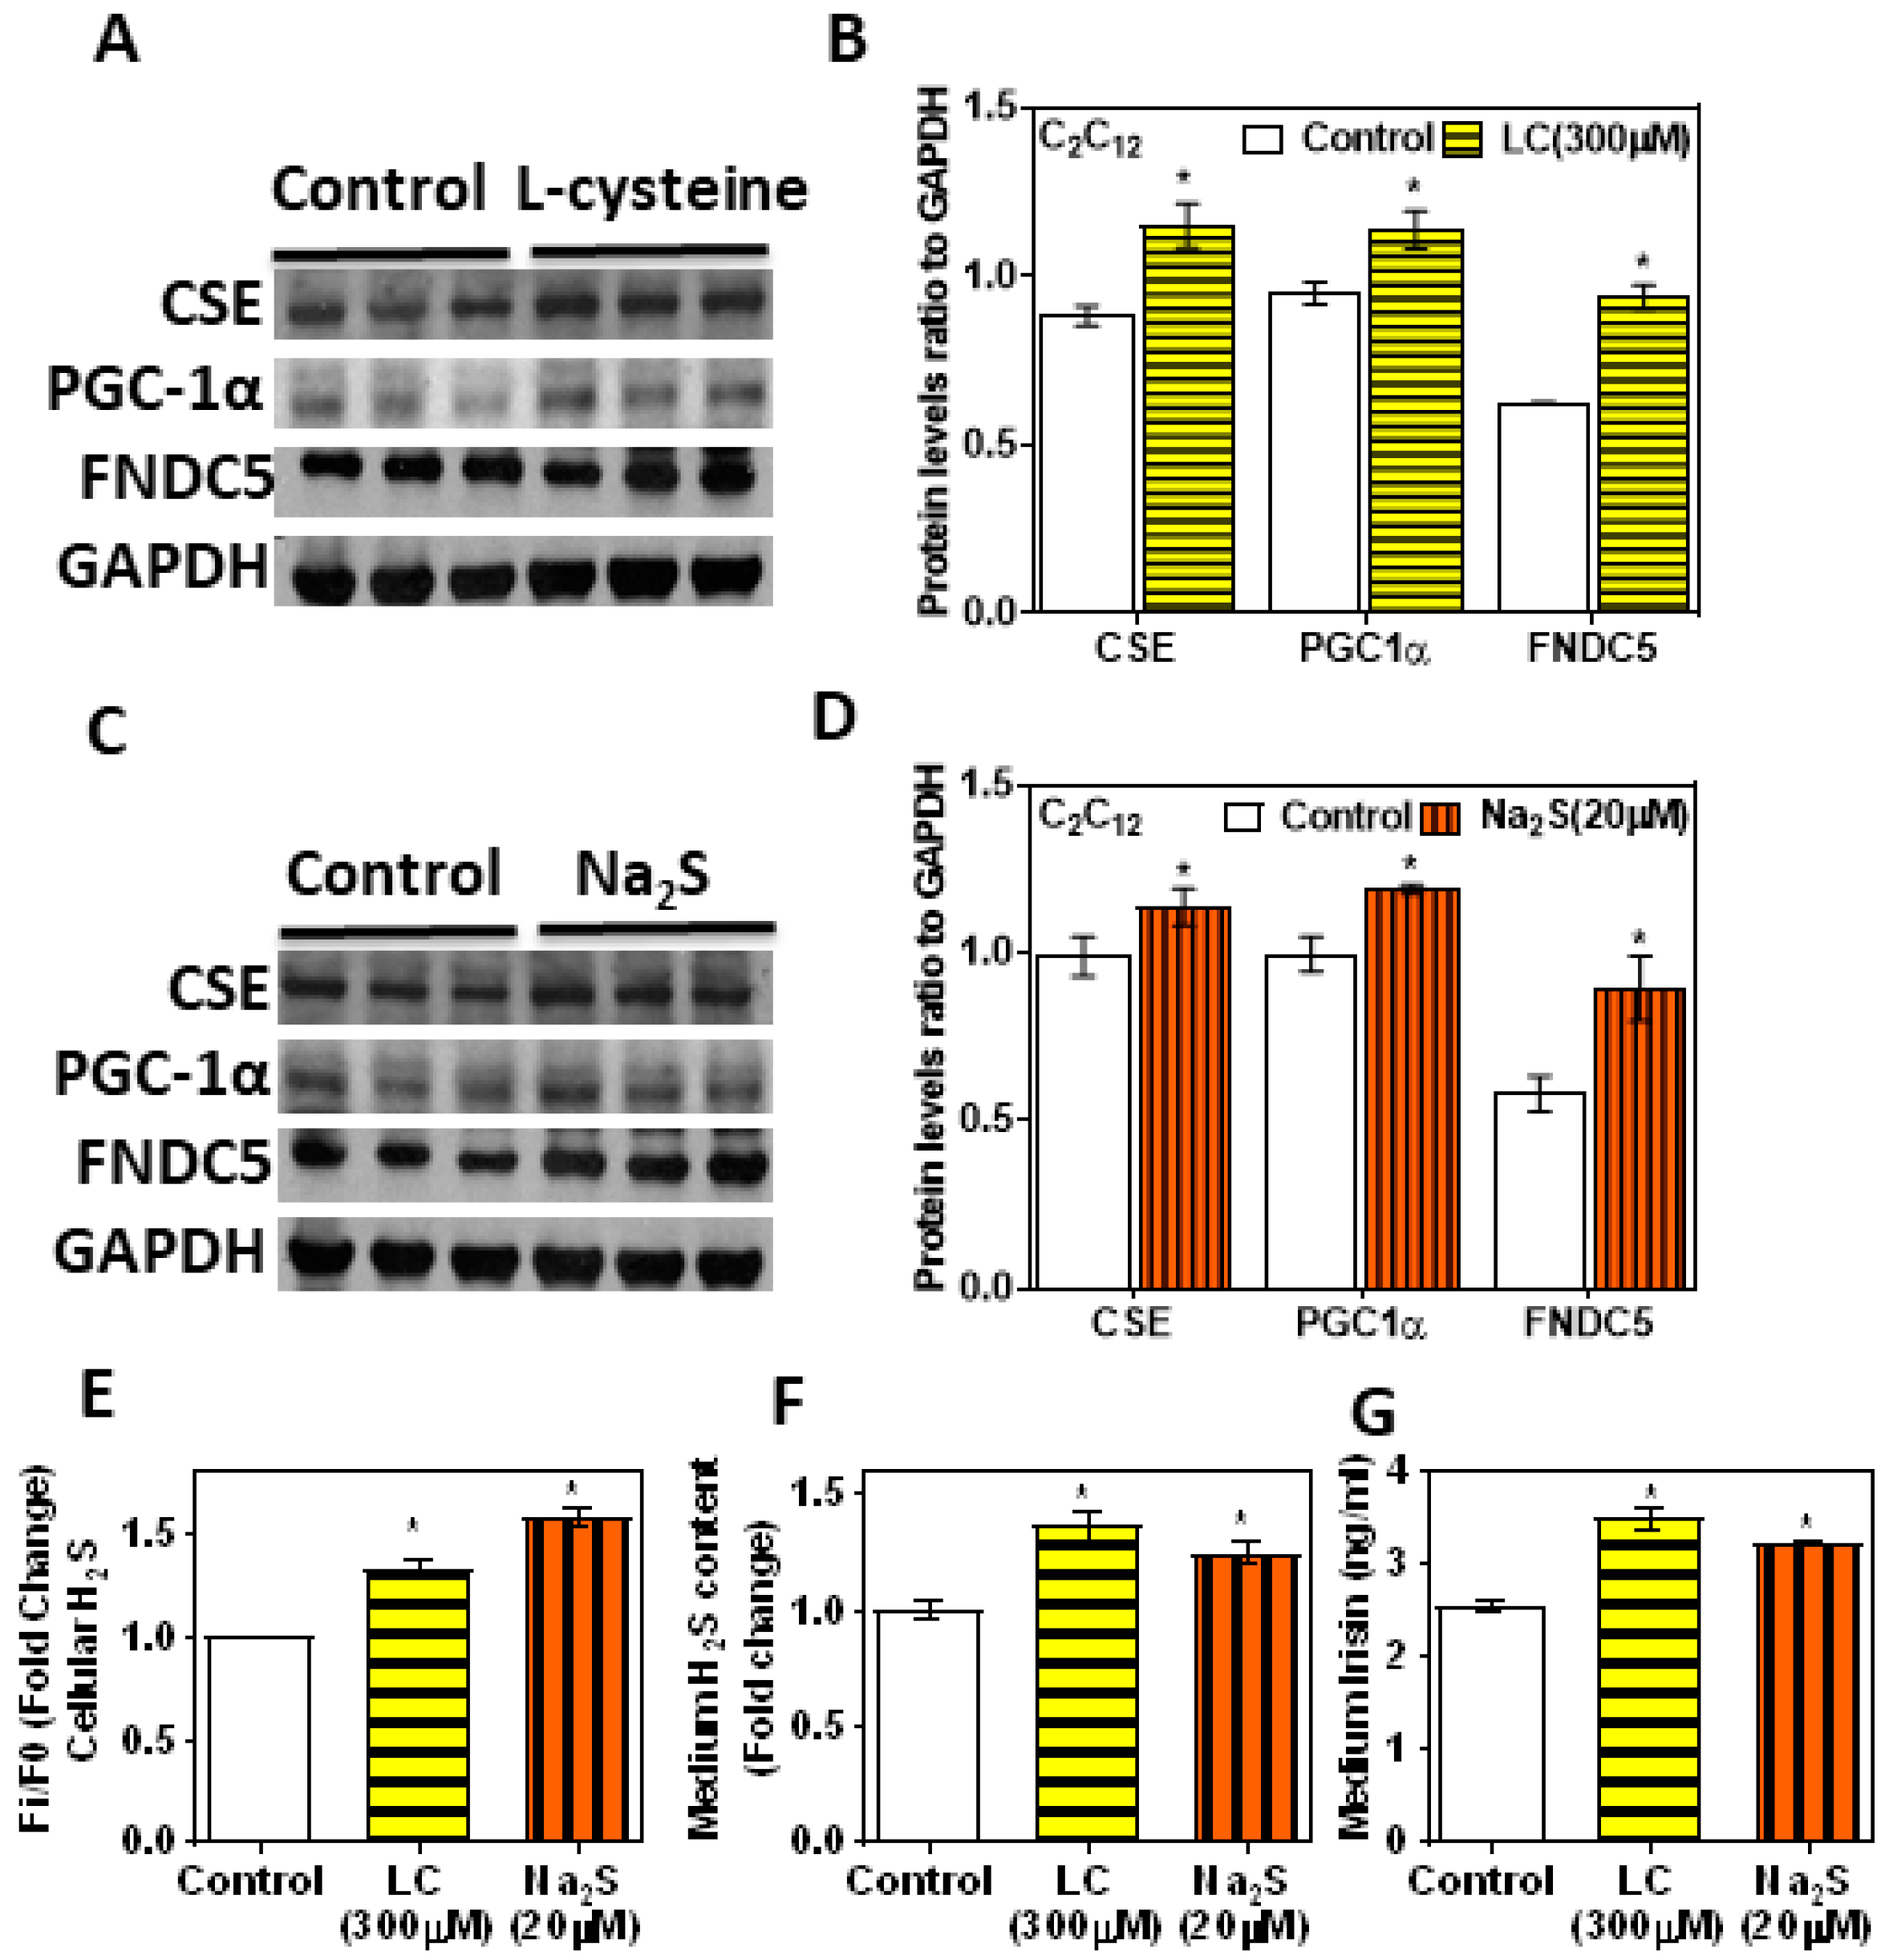
The CSE KD cells supplemented with an H2S donor showed a beneficial effect over the H2S system and FNDC5/irisin levels (Figure 4). The levels of CSE, H2S, PGC-1α, and FNDC5 and glucose uptake were significantly upregulated after treatment with LC (300 µM) or H2S donor (NaHS/Na2S; 20 µM) for 6 h (Figure 5A–F). The levels of irisin in the condition medium also significantly increased in the LC and H2S donor groups compared to those in the control group (Figure 5G). Cell viability was not affected under any of these conditions. This suggests that H2S donors/precursors may have beneficial effects over myokine irisin and glucose homeostasis.
3.6. Myoblast Differentiation Synergistically Upregulates CSE-H2S and the PGC-1α-FNDC5/Irisin Pathway
Myogenesis is affected during metabolic disorders, such as obesity and diabetes mellitus. Myoblast differentiation shows significant upregulation of PGC-1α and FNDC5, which was consistent with the increased expression of CSE-H2S, along with levels of myogenic markers (MyoD and myogenin) (Figure 6A–I). These findings suggest that the upregulation of physiological levels of H2S can have beneficial effects on muscle glucose homeostasis via the PGC-1α/FNDC5/irisin pathway.
4. Discussion
H2S has been shown to elicit a variety of biological effects and has been gaining acceptance as a signaling molecule that may mediate protection from various metabolic disorders [23,24,25,26,27,28,29,48]. Experimental and clinical studies reveal the importance of irisin in improving insulin sensitivity, pancreatic β cell function, and the browning of white adipose tissue and associated metabolic disorders [49]. This study provides novel evidence that circulating levels of irisin/tissue FNDC5 can be regulated by hydrogen sulfide. The decrease in H2S (cystathionine γ-lyase-mediated) is positively associated with muscle FNDC5 expression and the plasma irisin level in HFD-fed obese diabetic mice. This is consistent with recent studies in metabolic syndrome/obese/diabetic subjects showing decreased blood levels of H2S [18,19,20], and irisin [7,8,9].
This study demonstrates that a HFD causes a lower level of circulating H2S and irisin, with decreased expression of the irisin precursor FNDC5 in the muscle of HFD-fed mice. H2S positively regulates glutathione biosynthesis and inhibits oxidative stress in myotubes [18,44]. It is well recognized that diabetes induces oxidative stress that causes subchronic immuno-inflammatory conditions. ATB-346, a hydrogen sulphide (H2S)-releasing anti-inflammatory and analgesic drug, significantly boosted H2S levels and inhibited cyclooxygenase activity in a phase 2B study, with minimal gastrointestinal effects [50]. Multiple sclerosis is associated with decreased expression of the H2S-producing enzyme 3-mercaptopyruvate-sulfurtransferase, whereas H2S donor GYY4137 upregulates tolerogenic pathways [51]. H2S and its donors have been shown to be effective in preclinical animal models of autoimmune, acute, and chronic inflammatory disorders [52]. In this study, decreased cystathionine γ-lyase expression leads to H2S deficiency, which induces oxidative stress in myotubes exposed to high glucose or palmitate (which mimics diabetic conditions) and in the muscle of HFD-fed mice. Furthermore, deficiency of H2S impairs expression of PGC-1α, GLUT4, and glucose uptake in the muscle. H2S deficiency induced in myotubes by the pharmacological inhibitors (PPG or AOA) or CSE gene silencing reduced levels of PGC-1α, irisin, GLUT4, and glucose uptake. This is in line with data from the muscle of HFD-fed mice. It should also be noted that our data demonstrate that myoblast differentiation synergistically upregulates CSE-H2S, PGC-1α, and FNDC5/irisin, along with myogenic markers (MyoD and myogenin). These results suggest the novel physiological role played by the H2S system during myogenesis, which can directly affect the myokine irisin and impair glucose disposal in myotubes. This study makes the novel observation that supplementation with H2S donors or precursors beneficially regulates CSE-H2S, PGC-1α, and FNDC5/irisin. This suggests that circulating levels of H2S have a potentially significant effect on irisin and glucose metabolism.
H2S as a signaling molecule may trigger various biochemical pathways and activate PGC-1α, which upregulates irisin and favors glucose uptake. H2S promotes stimulation of adenosine triphosphate-sensitive potassium (KATP) channels [53,54]. NaHS (an H2S donor) increases intracellular calcium [Ca2+]i through NMDA receptor, L-type, and T-type calcium channels, which may mobilize a movement of calcium from the ER into the cytosol via the ryanodine receptor [55,56]. Exercise induces calcium influx and activates transcriptional co-factor PGC-1α, which regulates FNDC5 expression/release of irisin from myocytes [4,57]. It has been suggested that an exercise-independent form of H2S-mediated Ca2+ influx may activate PGC-1α and induce the expression of FNDC5. It is possible that exogenous H2S increases PGC-1α. It has been shown that NaHS also increased mitochondrial biogenesis by upregulation of the expression of PGC-1α in the rat liver [58]. Sirtuin 1 activates PGC-1α via deacetylation [59], and AMPK activates PGC-1α via phosphorylation [60]; recently, it was shown in primary hepatocytes that PGC-1α activity was enhanced via S-sulfhydration with no change in acetylation modification [61]. H2S signals via protein S-sulfhydration as a physiological post-transcriptional modification of cysteine residues in the target protein that leads to enhanced protein function [62]. Indeed, future mechanistic studies of how H2S regulates PGC-1α in the maintenance of FNDC5/irisin and glucose homeostasis, whether by an exercise-independent increase in Ca2+ influx or by protein S-sulfhydration and activation of PGC-1α, would be interesting.
5. Conclusions
H2S deficiency alters the PGC-1α/FNDC/irisin signaling pathway and glucose homeostasis in the muscle of HFD-fed obese diabetic mice (Figure 7A). Supplementation with l-cysteine (an H2S precursor), NaHS, or Na2S (H2S donors) increases levels of irisin and positively regulates GLUT4 mediated glucose uptake in C2C12 mouse myotubes (Figure 7B). These findings demonstrate that the upregulation of physiological levels of H2S can have beneficial effects on irisin secretion and glucose homeostasis via the PGC-1α signaling pathway. The understanding and validation of the mechanisms by which H2S supplementation improves glycemia should support the design of clinical intervention using novel molecules (containing sulfide and cysteine moieties) to improve glucose metabolism. This study suggests a novel potential role for H2S donors as adjuvant therapy in the treatment of metabolic complications in diabetes.
Author Contributions
Conceptualization, R.P. and S.K.J.; methodology, R.P. and S.K.J.; software, R.P.; validation, R.P. and S.K.J.; formal analysis, R.P. and S.K.J.; investigation, R.P. and S.K.J.; resources, S.K.J.; data curation, R.P.; writing—original draft preparation, R.P.; writing—review and editing, R.P. and S.K.J.; visualization, R.P.; funding acquisition, S.K.J. All authors have read and agreed to the published version of the manuscript.
Funding
This research was funded by the National Institutes of Health/National Center for Complementary and Integrative Health (5R33AT010637), along with support from grants to R.P. from the Malcolm W. Feist Cardiovascular Research Fellowship support and the Endowed Chair in Diabetes from the Center for Cardiovascular Diseases and Sciences (CCDS), LSUHSC-Shreveport to S.K.J.
Institutional Review Board Statement
The animal study protocol was approved by the Institutional Review Board (Animal Care Committee) of Louisiana State Health Sciences Center (Animal Care protocol number P-15-006) for studies involving animals.
Informed Consent Statement
Not applicable.
Data Availability Statement
Data is contained within this article.
Acknowledgments
We thank Paula Polk, Manager and Wiola Luszczek, Research Specialist at the Research Core Facility at LSUHSC-Shreveport for their expert technical assistance. We also thank William E. McLean and Christopher M. Stevens for lab assistance. The authors thank Georgia Morgan for excellent editing. Rajesh Parsanathan acknowledges the Department of Biotechnology (DBT), Ministry of Science and Technology, Government of India for the Ramalingaswami Re-entry Fellowship (D.O. NO. BT/HRD/35/02/2006) awarded (2021).
Conflicts of Interest
The authors declare no conflict of interest.
References
- Pedersen, B.K.; Febbraio, M.A. Muscles, exercise and obesity: Skeletal muscle as a secretory organ. Nat. Rev. Endocrinol. 2012, 8, 457–465. [Google Scholar] [CrossRef]
- Rajesh, P.; Balasubramanian, K. Phthalate exposure in utero causes epigenetic changes and impairs insulin signalling. J. Endocrinol. 2014, 223, 47–66. [Google Scholar] [CrossRef] [Green Version]
- The Emerging Risk Factors Collaboration; Sarwar, N.; Gao, P.; Seshasai, S.R.; Gobin, R.; Kaptoge, S.; Di Angelantonio, E.; Ingelsson, E.; Lawlor, D.A.; Selvin, E.; et al. Diabetes mellitus, fasting blood glucose concentration, and risk of vascular disease: A collaborative meta-analysis of 102 prospective studies. Lancet 2010, 375, 2215–2222. [Google Scholar] [CrossRef] [Green Version]
- Boström, P.; Wu, J.; Jedrychowski, M.P.; Korde, A.; Ye, L.; Lo, J.C.; Rasbach, K.A.; Boström, E.A.; Choi, J.H.; Long, J.Z.; et al. A PGC1-α-dependent myokine that drives brown-fat-like development of white fat and thermogenesis. Nature 2012, 481, 463–468. [Google Scholar] [CrossRef]
- Bubak, M.P.; Heesch, M.W.; Shute, R.J.; Dinan, N.E.; Laursen, T.L.; La Salle, D.T.; Slivka, D.R. Irisin and Fibronectin Type III Domain-Containing 5 Responses to Exercise in Different Environmental Conditions. Int. J. Exerc. Sci. 2017, 10, 666–680. [Google Scholar]
- Matsuo, Y.; Gleitsmann, K.; Mangner, N.; Werner, S.; Fischer, T.; Bowen, T.S.; Kricke, A.; Matsumoto, Y.; Kurabayashi, M.; Schuler, G.; et al. Fibronectin type III domain containing 5 expression in skeletal muscle in chronic heart failure-relevance of inflammatory cytokines. J. Cachexia Sarcopenia Muscle 2015, 6, 62–72. [Google Scholar] [CrossRef]
- Liu, J.-J.; Wong, M.D.; Toy, W.C.; Tan, C.S.; Liu, S.; Ng, X.W.; Tavintharan, S.; Sum, C.F.; Lim, S.C. Lower circulating irisin is associated with type 2 diabetes mellitus. J. Diabetes Its Complicat. 2013, 27, 365–369. [Google Scholar] [CrossRef]
- Choi, Y.-K.; Kim, M.-K.; Bae, K.H.; Seo, H.-A.; Jeong, J.-Y.; Lee, W.-K.; Kim, J.-G.; Lee, I.-K.; Park, K.-G. Serum irisin levels in new-onset type 2 diabetes. Diabetes Res. Clin. Pract. 2013, 100, 96–101. [Google Scholar] [CrossRef]
- Kurdiova, T.; Balaz, M.; Vician, M.; Maderova, D.; Vlcek, M.; Valkovic, L.; Srbecky, M.; Imrich, R.; Kyselovicova, O.; Belan, V.; et al. Effects of obesity, diabetes and exercise on Fndc5 gene expression and irisin release in human skeletal muscle and adipose tissue: In vivo and in vitro studies. J. Physiol. 2014, 592, 1091–1107. [Google Scholar] [CrossRef]
- Liu, J.-J.; Liu, S.; Wong, M.D.; Tan, C.S.; Tavintharan, S.; Sum, C.F.; Lim, S.C. Relationship between circulating irisin, renal function and body composition in type 2 diabetes. J. Diabetes Its Complicat. 2014, 28, 208–213. [Google Scholar] [CrossRef] [PubMed]
- Zhang, M.; Chen, P.; Chen, S.; Sun, Q.; Zeng, Q.-C.; Chen, J.-Y.; Liu, Y.-X.; Cao, X.-H.; Ren, M.; Wang, J.-K. The association of new inflammatory markers with type 2 diabetes mellitus and macrovascular complications: A preliminary study. Eur. Rev. Med. Pharmacol. Sci. 2014, 18, 1567–1572. [Google Scholar] [PubMed]
- Yang, M.; Chen, P.; Jin, H.; Xie, X.; Gao, T.; Yang, L.; Yu, X. Circulating levels of irisin in middle-aged first-degree relatives of type 2 diabetes mellitus—correlation with pancreatic β-cell function. Diabetol. Metab. Syndr. 2014, 6, 133. [Google Scholar] [CrossRef] [PubMed] [Green Version]
- Moreno-Navarrete, J.M.; Ortega, F.J.; Serrano, M.; Guerra, E.; Pardo, G.; Tinahones, F.; Ricart, W.; Fernández-Real, J.M. Irisin Is Expressed and Produced by Human Muscle and Adipose Tissue in Association with Obesity and Insulin Resistance. J. Clin. Endocrinol. Metab. 2013, 98, E769–E778. [Google Scholar] [CrossRef] [PubMed]
- Li, L.; Rose, P.; Moore, P.K. Hydrogen Sulfide and Cell Signaling. Annu. Rev. Pharmacol. Toxicol. 2011, 51, 169–187. [Google Scholar] [CrossRef] [Green Version]
- Yang, J.; Minkler, P.; Grove, D.; Wang, R.; Willard, B.; Dweik, R.; Hine, C. Non-enzymatic hydrogen sulfide production from cysteine in blood is catalyzed by iron and vitamin B6. Commun. Biol. 2019, 2, 194. [Google Scholar] [CrossRef] [Green Version]
- Jain, S.K.; Micinski, D.; Lieblong, B.J.; Stapleton, T. Relationship between hydrogen sulfide levels and HDL-cholesterol, adiponectin, and potassium levels in the blood of healthy subjects. Atherosclerosis 2012, 225, 242–245. [Google Scholar] [CrossRef] [Green Version]
- Pichette, J.; Fynn-Sackey, N.; Gagnon, J. Hydrogen Sulfide and Sulfate Prebiotic Stimulates the Secretion of GLP-1 and Improves Glycemia in Male Mice. Endocrinology 2017, 158, 3416–3425. [Google Scholar] [CrossRef]
- Parsanathan, R.; Jain, S.K. Hydrogen sulfide increases glutathione biosynthesis, and glucose uptake and utilisation in C2C12 mouse myotubes. Free Radic. Res. 2018, 52, 288–303. [Google Scholar] [CrossRef]
- Padiya, R.; Khatua, T.N.; Bagul, P.K.; Kuncha, M.; Banerjee, S.K. Garlic improves insulin sensitivity and associated metabolic syndromes in fructose fed rats. Nutr. Metab. 2011, 8, 53. [Google Scholar] [CrossRef] [Green Version]
- Parsanathan, R.; Jain, S.K. Glutathione deficiency alters the vitamin D-metabolizing enzymes CYP27B1 and CYP24A1 in human renal proximal tubule epithelial cells and kidney of HFD-fed mice. Free Radic. Biol. Med. 2018, 131, 376–381. [Google Scholar] [CrossRef]
- Geng, B.; Cai, B.; Liao, F.; Zheng, Y.; Zeng, Q.; Fan, X.; Gong, Y.; Yang, J.; Cui, Q.H.; Tang, C.; et al. Increase or Decrease Hydrogen Sulfide Exert Opposite Lipolysis, but Reduce Global Insulin Resistance in High Fatty Diet Induced Obese Mice. PLoS ONE 2013, 8, e73892. [Google Scholar] [CrossRef] [PubMed] [Green Version]
- Tsai, C.-Y.; Peh, M.T.; Feng, W.; Dymock, B.W.; Moore, P.K. Hydrogen Sulfide Promotes Adipogenesis in 3T3L1 Cells. PLoS ONE 2015, 10, e0119511. [Google Scholar] [CrossRef]
- Huang, C.W.; Feng, W.; Peh, M.T.; Peh, K.; Dymock, B.W.; Moore, P.K. A novel slow-releasing hydrogen sulfide donor, FW1256, exerts anti-inflammatory effects in mouse macrophages and in vivo. Pharmacol. Res. 2016, 113, 533–546. [Google Scholar] [CrossRef] [PubMed]
- Katsouda, A.; Szabo, C.; Papapetropoulos, A. Reduced adipose tissue H2S in obesity. Pharmacol. Res. 2018, 128, 190–199. [Google Scholar] [CrossRef] [PubMed]
- Monti, M.; Terzuoli, E.; Ziche, M.; Morbidelli, L. H2S dependent and independent anti-inflammatory activity of zofenoprilat in cells of the vascular wall. Pharmacol. Res. 2016, 113, 426–437. [Google Scholar] [CrossRef] [PubMed]
- Longen, S.; Beck, K.-F.; Pfeilschifter, J. H2S-induced thiol-based redox switches: Biochemistry and functional relevance for inflammatory diseases. Pharmacol. Res. 2016, 111, 642–651. [Google Scholar] [CrossRef] [PubMed]
- Wójcicka, G.; Jamroz-Wiśniewska, A.; Atanasova, P.; Chaldakov, G.N.; Chylińska-Kula, B.; Bełtowski, J. Differential effects of statins on endogenous H2S formation in perivascular adipose tissue. Pharmacol. Res. 2011, 63, 68–76. [Google Scholar] [CrossRef]
- Xiong, Q.; Wang, Z.; Yu, Y.; Wen, Y.; Suguro, R.; Mao, Y.; Zhu, Y.Z. Hydrogen sulfide stabilizes atherosclerotic plaques in apolipoprotein E knockout mice. Pharmacol. Res. 2019, 144, 90–98. [Google Scholar] [CrossRef]
- Nicholson, C.K.; Calvert, J.W. Hydrogen sulfide and ischemia–reperfusion injury. Pharmacol. Res. 2010, 62, 289–297. [Google Scholar] [CrossRef] [Green Version]
- Pichette, J.; Gagnon, J. Implications of Hydrogen Sulfide in Glucose Regulation: How H2S Can Alter Glucose Homeostasis through Metabolic Hormones. Oxid. Med. Cell. Longev. 2016, 2016, 3285074. [Google Scholar] [CrossRef] [Green Version]
- Ates, I.; Kaplan, M.; Yuksel, M.; Mese, D.; Alisik, M.; Erel, Ö.; Yilmaz, N.; Guler, S. Determination of thiol/disulphide homeostasis in type 1 diabetes mellitus and the factors associated with thiol oxidation. Endocrine 2015, 51, 47–51. [Google Scholar] [CrossRef] [PubMed]
- Ates, I.; Kaplan, M.; Inan, B.; Alısık, M.; Erel, O.; Yilmaz, N.; Guler, S. How does thiol/disulfide homeostasis change in prediabetic patients? Diabetes Res. Clin. Pract. 2015, 110, 166–171. [Google Scholar] [CrossRef] [PubMed]
- Zheng, F.; Han, J.; Lu, H.; Cui, C.; Yang, J.; Cui, Q.; Cai, J.; Zhou, Y.; Tang, C.; Xu, G.; et al. Cystathionine beta synthase-hydrogen sulfide system in paraventricular nucleus reduced high fatty diet induced obesity and insulin resistance by brain-adipose axis. Biochim. Biophys. Acta Mol. Basis Dis. 2018, 1864, 3281–3291. [Google Scholar] [CrossRef] [PubMed]
- Yang, G.; Ju, Y.; Fu, M.; Zhang, Y.; Pei, Y.; Racine, M.; Baath, S.; Merritt, T.J.; Wang, R.; Wu, L. Cystathionine gamma-lyase/hydrogen sulfide system is essential for adipogenesis and fat mass accumulation in mice. Biochim. Biophys. Acta (BBA) Mol. Cell Biol. Lipids 2018, 1863, 165–176. [Google Scholar] [CrossRef] [PubMed]
- Chhabra, A.; Mishra, S.; Kumar, G.; Gupta, A.; Keshri, G.K.; Bharti, B.; Meena, R.N.; Prabhakar, A.K.; Singh, D.; Bhargava, K.; et al. Glucose-6-phosphate dehydrogenase is critical for suppression of cardiac hypertrophy by H2S. Cell Death Discov. 2018, 4, 6. [Google Scholar] [CrossRef] [PubMed] [Green Version]
- Yang, F.; Zhang, L.; Gao, Z.; Sun, X.; Yu, M.; Dong, S.; Wu, J.; Zhao, Y.; Xu, C.; Zhang, W.; et al. Exogenous H2S Protects Against Diabetic Cardiomyopathy by Activating Autophagy via the AMPK/mTOR Pathway. Cell. Physiol. Biochem. 2017, 43, 1168–1187. [Google Scholar] [CrossRef] [PubMed] [Green Version]
- Untereiner, A.; Wu, L. Hydrogen Sulfide and Glucose Homeostasis: A Tale of Sweet and the Stink. Antioxid. Redox Signal. 2018, 28, 1463–1482. [Google Scholar] [CrossRef]
- Manna, P.; Gungor, N.; McVie, R.; Jain, S.K. Decreased Cystathionine-γ-lyase (CSE) Activity in Livers of Type 1 Diabetic Rats and Peripheral Blood Mononuclear Cells (PBMC) of Type 1 Diabetic Patients. J. Biol. Chem. 2014, 289, 11767–11778. [Google Scholar] [CrossRef] [Green Version]
- Manna, P.; Jain, S.K. L-cysteine and hydrogen sulfide increase PIP3 and AMPK/PPARγ expression and decrease ROS and vascular inflammation markers in high glucose treated human U937 monocytes. J. Cell. Biochem. 2013, 114, 2334–2345. [Google Scholar] [CrossRef]
- Jain, S.K.; Kahlon, G.; Morehead, L.; Lieblong, B.; Stapleton, T.; Hoeldtke, R.; Bass, P.F.; Levine, S.N. The Effect of Sleep Apnea and Insomnia on Blood Levels of Leptin, Insulin Resistance, IP-10, and Hydrogen Sulfide in Type 2 Diabetic Patients. Metab. Syndr. Relat. Disord. 2012, 10, 331–336. [Google Scholar] [CrossRef] [Green Version]
- Jain, S.K.; Bull, R.; Rains, J.L.; Bass, P.F.; Levine, S.N.; Reddy, S.; McVie, R.; Bocchini, J.A. Low Levels of Hydrogen Sulfide in the Blood of Diabetes Patients and Streptozotocin-Treated Rats Causes Vascular Inflammation? Antioxid. Redox Signal. 2010, 12, 1333–1337. [Google Scholar] [CrossRef] [PubMed]
- Whiteman, M.; Gooding, K.M.; Whatmore, J.L.; Ball, C.I.; Mawson, D.; Skinner, K.; Tooke, J.E.; Shore, A.C. Adiposity is a major determinant of plasma levels of the novel vasodilator hydrogen sulphide. Diabetologia 2010, 53, 1722–1726. [Google Scholar] [CrossRef] [PubMed] [Green Version]
- Manna, P.; Achari, A.E.; Jain, S.K. Vitamin D supplementation inhibits oxidative stress and upregulate SIRT1/AMPK/GLUT4 cascade in high glucose-treated 3T3L1 adipocytes and in adipose tissue of high fat diet-fed diabetic mice. Arch. Biochem. Biophys. 2017, 615, 22–34. [Google Scholar] [CrossRef] [PubMed]
- Parsanathan, R.; Jain, S.K. Hydrogen sulfide regulates circadian-clock genes in C2C12 myotubes and the muscle of high-fat-diet-fed mice. Arch. Biochem. Biophys. 2019, 672, 108054. [Google Scholar] [CrossRef] [PubMed]
- Parsanathan, R.; Jain, S.K. Glutathione deficiency induces epigenetic alterations of vitamin D metabolism genes in the livers of high-fat diet-fed obese mice. Sci. Rep. 2019, 9, 14784. [Google Scholar] [CrossRef] [Green Version]
- Zhu, Y.Z.; Wang, Z.J.; Ho, P.; Loke, Y.Y.; Huang, S.H.; Tan, C.S.; Whiteman, M.; Lu, J.; Moore, P.K. Hydrogen sulfide and its possible roles in myocardial ischemia in experimental rats. J. Appl. Physiol. 2007, 102, 261–268. [Google Scholar] [CrossRef]
- Jung, D.-W.; Ha, H.-H.; Zheng, X.; Chang, Y.-T.; Williams, D.R. Novel use of fluorescent glucose analogues to identify a new class of triazine-based insulin mimetics possessing useful secondary effects. Mol. BioSyst. 2010, 7, 346–358. [Google Scholar] [CrossRef] [Green Version]
- Giuffrè, A.; Vicente, J.B. Hydrogen Sulfide Biochemistry and Interplay with Other Gaseous Mediators in Mammalian Physiology. Oxid. Med. Cell. Longev. 2018, 2018, 6290931. [Google Scholar] [CrossRef]
- Gizaw, M.; Anandakumar, P.; Debela, T. A Review on the Role of Irisin in Insulin Resistance and Type 2 Diabetes Mellitus. J. Pharmacopunct. 2017, 20, 235–242. [Google Scholar] [CrossRef]
- Wallace, J.L.; Nagy, P.; Feener, T.D.; Allain, T.; Ditrói, T.; Vaughan, D.J.; Muscara, M.N.; de Nucci, G.; Buret, A.G. A proof-of-concept, Phase 2 clinical trial of the gastrointestinal safety of a hydrogen sulfide-releasing anti-inflammatory drug. J. Cereb. Blood Flow Metab. 2019, 177, 769–777. [Google Scholar] [CrossRef]
- Lazarević, M.; Battaglia, G.; Jevtić, B.; Djedovic, N.; Bruno, V.; Cavalli, E.; Miljković, Đ.; Nicoletti, F.; Momčilović, M.; Fagone, P. Upregulation of Tolerogenic Pathways by the Hydrogen Sulfide Donor GYY4137 and Impaired Expression of H2S-Producing Enzymes in Multiple Sclerosis. Antioxidants 2020, 9, 608. [Google Scholar] [CrossRef] [PubMed]
- Fagone, P.; Mazzon, E.; Bramanti, P.; Bendtzen, K.; Nicoletti, F. Gasotransmitters and the immune system: Mode of action and novel therapeutic targets. Eur. J. Pharmacol. 2018, 834, 92–102. [Google Scholar] [CrossRef]
- Liu, Y.; Liu, J.; Li, X.; Wang, F.; Xu, X.; Wang, C. Exogenous H2S prevents high glucose-induced damage to osteoblasts through regulation of KATP channels. Biochimie 2017, 137, 151–157. [Google Scholar] [CrossRef] [PubMed]
- Yang, W.; Yang, G.; Jia, X.; Wu, L.; Wang, R. Activation of KATP channels by H2S in rat insulin-secreting cells and the underlying mechanisms. J. Physiol. 2005, 569, 519–531. [Google Scholar] [CrossRef]
- Yong, Q.C.; Choo, C.H.; Tan, B.H.; Low, C.-M.; Bian, J.-S. Effect of hydrogen sulfide on intracellular calcium homeostasis in neuronal cells. Neurochem. Int. 2010, 56, 508–515. [Google Scholar] [CrossRef] [PubMed]
- Munaron, L.; Avanzato, D.; Moccia, F.; Mancardi, D. Hydrogen sulfide as a regulator of calcium channels. Cell Calcium 2013, 53, 77–84. [Google Scholar] [CrossRef] [PubMed]
- Wrann, C.D.; White, J.P.; Salogiannnis, J.; Laznik-Bogoslavski, D.; Wu, J.; Ma, D.; Lin, J.D.; Greenberg, M.E.; Spiegelman, B.M. Exercise Induces Hippocampal BDNF through a PGC-1α/FNDC5 Pathway. Cell Metab. 2013, 18, 649–659. [Google Scholar] [CrossRef] [Green Version]
- Aslami, H.; Pulskens, W.P.; Kuipers, M.T.; Bos, A.P.; Van Kuilenburg, A.B.P.; Wanders, R.J.A.; Roelofsen, J.; Roelofs, J.; Kerindongo, R.P.; Beurskens, C.J.P.; et al. Hydrogen Sulfide Donor NaHS Reduces Organ Injury in a Rat Model of Pneumococcal Pneumosepsis, Associated with Improved Bio-Energetic Status. PLoS ONE 2013, 8, e63497. [Google Scholar] [CrossRef]
- Rodgers, J.T.; Lerin, C.; Haas, W.; Gygi, S.P.; Spiegelman, B.M.; Puigserver, P. Nutrient control of glucose homeostasis through a complex of PGC-1α and SIRT1. Nature 2005, 434, 113–118. [Google Scholar] [CrossRef]
- Thirupathi, A.; De Souza, C.T. Multi-regulatory network of ROS: The interconnection of ROS, PGC-1 alpha, and AMPK-SIRT1 during exercise. J. Physiol. Biochem. 2017, 73, 487–494. [Google Scholar] [CrossRef]
- Untereiner, A.A.; Wang, R.; Ju, Y.J.; Wu, L. Decreased Gluconeogenesis in the Absence of Cystathionine Gamma-Lyase and the Underlying Mechanisms. Antioxid. Redox Signal. 2016, 24, 129–140. [Google Scholar] [CrossRef] [PubMed] [Green Version]
- Mustafa, A.K.; Gadalla, M.M.; Sen, N.; Kim, S.; Mu, W.; Gazi, S.K.; Barrow, R.K.; Yang, G.; Wang, R.; Snyder, S.H. H2S Signals Through Protein S-Sulfhydration. Sci. Signal. 2009, 2, ra72. [Google Scholar] [CrossRef] [PubMed] [Green Version]
Figure 1.
Effect of HFD on muscle CSE-H2S, irisin, and oxidative stress. MaleC57BL/6J mice (5 weeks old) were fed either a standard chow diet (control) or a high-fat diet (HFD) for 16 weeks. (A) RT-qPCR was performed to assess the level of target genes as indicated (n = 6); (B) representative Western blot analysis (CSE, PGC-1α, FNDC5, and GLUT4) was performed on total protein extracts (n = 3 independent experiments) in the muscle; (C) semi-quantitative analysis of the abundance ratio of protein to GAPDH; (D) plasma H2S (n = 4); (E) irisin level (n = 4); (F) hydrogen peroxide [H2O2] (n = 4); (G) glutathione level (n = 6); (H) malondialdehyde(MDA)-lipid peroxidation (n = 6); (I) protein carbonyl levels in muscle (n = 6).The student’s t-test was used to compare the control with the HFD group. * p ≤ 0.05 was considered significant for a statistical test. Data are expressed as mean ± SEM.

Figure 2.
Effect of treatment with high glucose and palmitate on CSE-H2S, PGC-1α, FNDC5 (irisin), and glucose uptake in C2C12 mouse myotubes. Differentiated myotubes treated with high glucose (25mM) or palmitate (0.6mM) for 24 h. Mannitol was used as an osmolarity control. (A) Western blot analysis (CSE, PGC-1α, and FNDC5) was performed on total protein extracts (n = 3 independent experiments) in mouse myotubes; (B–D) semi-quantitative analysis of the abundance ratio of protein to GAPDH. (E) RT-qPCR was performed to assess the level of the GLUT4 gene, as indicated (n = 3). (F) Glucose uptake; (G) levels of intracellular H2S; (H) cell culture medium H2S; (I) cell culture medium irisin levels. One-way ANOVA followed by SNK (Student’s Newman–Keul’s) means comparison was performed between the control and treatment groups. * p ≤ 0.05 was considered significant for a statistical test. Data are expressed as mean ± SEM.

Figure 3.
Effect of H2S producing enzyme inhibitors (propargylglycine or aminooxyacetate) on CSE-H2S, PGC-1α, FNDC5 (irisin), and glucose uptake in C2C12 mouse myotubes. Differentiated myotubestreated with propargylglycine (PPG; 100 µM) oraminooxyacetate (AOA; 100 µM) or a combination of both for 6 h. (A) Western blot analysis (CSE, PGC-1α, and FNDC5) was performed on total protein extracts (n = 3 independent experiments) in mouse myotubes; (B–D) semi-quantitative analysis of the abundance ratio of protein to GAPDH. (E) RT-qPCR was performed to assess the level of the GLUT4 gene, as indicated (n = 3). (F) Glucose uptake; (G) levels of intracellular H2S; (H) cell culture medium H2S; (I) cell culture medium irisin levels. One-way ANOVA followed by SNK (Student’s Newman–Keul’s) means comparison was performed between the control and treatment groups. * p ≤ 0.05 was considered significant for a statistical test. Data are expressed as mean ± SEM.

Figure 4.
Effect of sodium hydrosulfide (a donor of H2S) treatment on CSE/H2S-deficient myotubes and the levels of CSE-H2S, PGC-1α, FNDC5 (irisin), and glucose uptake. CSE/H2S-normal (scrambled siRNA) and CSE/H2S-deficient myotubes (100 nM CSE siRNA) treated with sodium hydrosulfide (NaHS, 20 µM). A scrambled siRNA nonspecific RNA duplex with no sequence homology with any of the genes served as a control. (A) Western blot analysis (CSE, PGC-1α, and FNDC5) was performed on total protein extracts (n = 3 independent experiments) in mouse myotubes; (B–D) semi-quantitative analysis of the abundance ratio of protein to GAPDH. (E) RT-qPCR was performed to assess the level of the GLUT4 gene, as indicated (n = 3). (F) Glucose uptake; (G) levels of intracellular H2S; (H) cell culture medium H2S; (I) cell culture medium irisin levels. One-way ANOVA followed by SNK (Student’s Newman–Keul’s) means comparison was performed between the control and treatment groups. * p ≤ 0.05 was considered significant for a statistical test. Data are expressed as mean ± SEM.

Figure 5.
Effect of treatment with l-cysteine and sodium sulfide (a donor of H2S) on C2C12 mouse myotube CSE-H2S, PGC-1α, and FNDC5 (irisin). Differentiated myotubes treated with either l-cysteine (LC; 300 µM) or sodium sulfide (Na2S; 20 µM) for 6 h. (A,C) Western blot analysis (CSE, PGC-1α, and FNDC5) was performed on total protein extracts (n = 3 independent experiments) in mouse myotube; (B,D) semi-quantitative analysis of the abundance ratio of protein to GAPDH. (E) Levels of intracellular H2S; (F) cell culture medium H2S; (G) cell culture medium irisin level. The Student’s t-test was used to compare the controls with the LC/Na2S group. One-way ANOVA followed by SNK (Student’s Newman–Keul’s) means comparison was performed between the control and treatment groups. * p ≤ 0.05 was considered significant for a statistical test. Data are expressed as mean ± SEM.

Figure 6.
Effect of the myogenic commitment to differentiate C2C12 myoblasts into myotubes on the levels of CSE-H2S, PGC-1α, and FNDC5 (irisin). C2C12 cells grown to confluence and differentiated into myotubes were cultured in DMEM with 2% horse serum for up to 7 days. (A) Western blot analysis to monitor the expression of myogenic factors (MyoD, myogenin) and CSE, PGC-1α, and FNDC5 was performed on total protein extracts (n = 3 independent experiments) during C2C12 cell differentiation at days 0, 1, 3, 5, and 7 of myogenesis; (B–F) semi-quantitative analysis of the abundance ratio of protein to GAPDH. (G) Intracellular H2S levels; (H) cell culture medium H2S; (I) cell culture medium irisin levels. One-way ANOVA followed by SNK (Student’s Newman–Keul’s) means comparison was performed between the control and treatment groups. * p ≤ 0.05 was considered significant for a statistical test. Data are expressed as mean ± SEM.

Figure 7.
Schematic presentation of the proposed mechanism by which an HFD-induced deficiency of the CSE/H2S system alters PGC-1α, FNDC5 (irisin, a muscle myokine), and glucose homeostasis in the muscle (A), and how supplementation with l-cysteine, NaHS, or Na2S (H2S donors) increases irisin and GLUT4 mediated glucose uptake in C2C12 mouse myotubes (B).

Publisher’s Note: MDPI stays neutral with regard to jurisdictional claims in published maps and institutional affiliations. |
© 2022 by the authors. Licensee MDPI, Basel, Switzerland. This article is an open access article distributed under the terms and conditions of the Creative Commons Attribution (CC BY) license (https://creativecommons.org/licenses/by/4.0/).
Share and Cite
MDPI and ACS Style
Parsanathan, R.; Jain, S.K. Hydrogen Sulfide Regulates Irisin and Glucose Metabolism in Myotubes and Muscle of HFD-Fed Diabetic Mice. Antioxidants 2022, 11, 1369. https://0-doi-org.brum.beds.ac.uk/10.3390/antiox11071369
AMA Style
Parsanathan R, Jain SK. Hydrogen Sulfide Regulates Irisin and Glucose Metabolism in Myotubes and Muscle of HFD-Fed Diabetic Mice. Antioxidants. 2022; 11(7):1369. https://0-doi-org.brum.beds.ac.uk/10.3390/antiox11071369
Chicago/Turabian StyleParsanathan, Rajesh, and Sushil K. Jain. 2022. "Hydrogen Sulfide Regulates Irisin and Glucose Metabolism in Myotubes and Muscle of HFD-Fed Diabetic Mice" Antioxidants 11, no. 7: 1369. https://0-doi-org.brum.beds.ac.uk/10.3390/antiox11071369
Note that from the first issue of 2016, this journal uses article numbers instead of page numbers. See further details here.