Ketogenic Diet and microRNAs Linked to Antioxidant Biochemical Homeostasis

 ,
,  ,
, 

Abstract
:1. Introduction
2. Materials and Methods
2.1. Population
2.2. Immunoblot Analysis and RNAs Extraction
2.3. NanoString Sample Preparation and Data Analysis
2.4. In Silico Prediction of hsa-miR Target Genes
2.5. Statistical Analysis
3. Results
3.1. Characteristics of Subjects
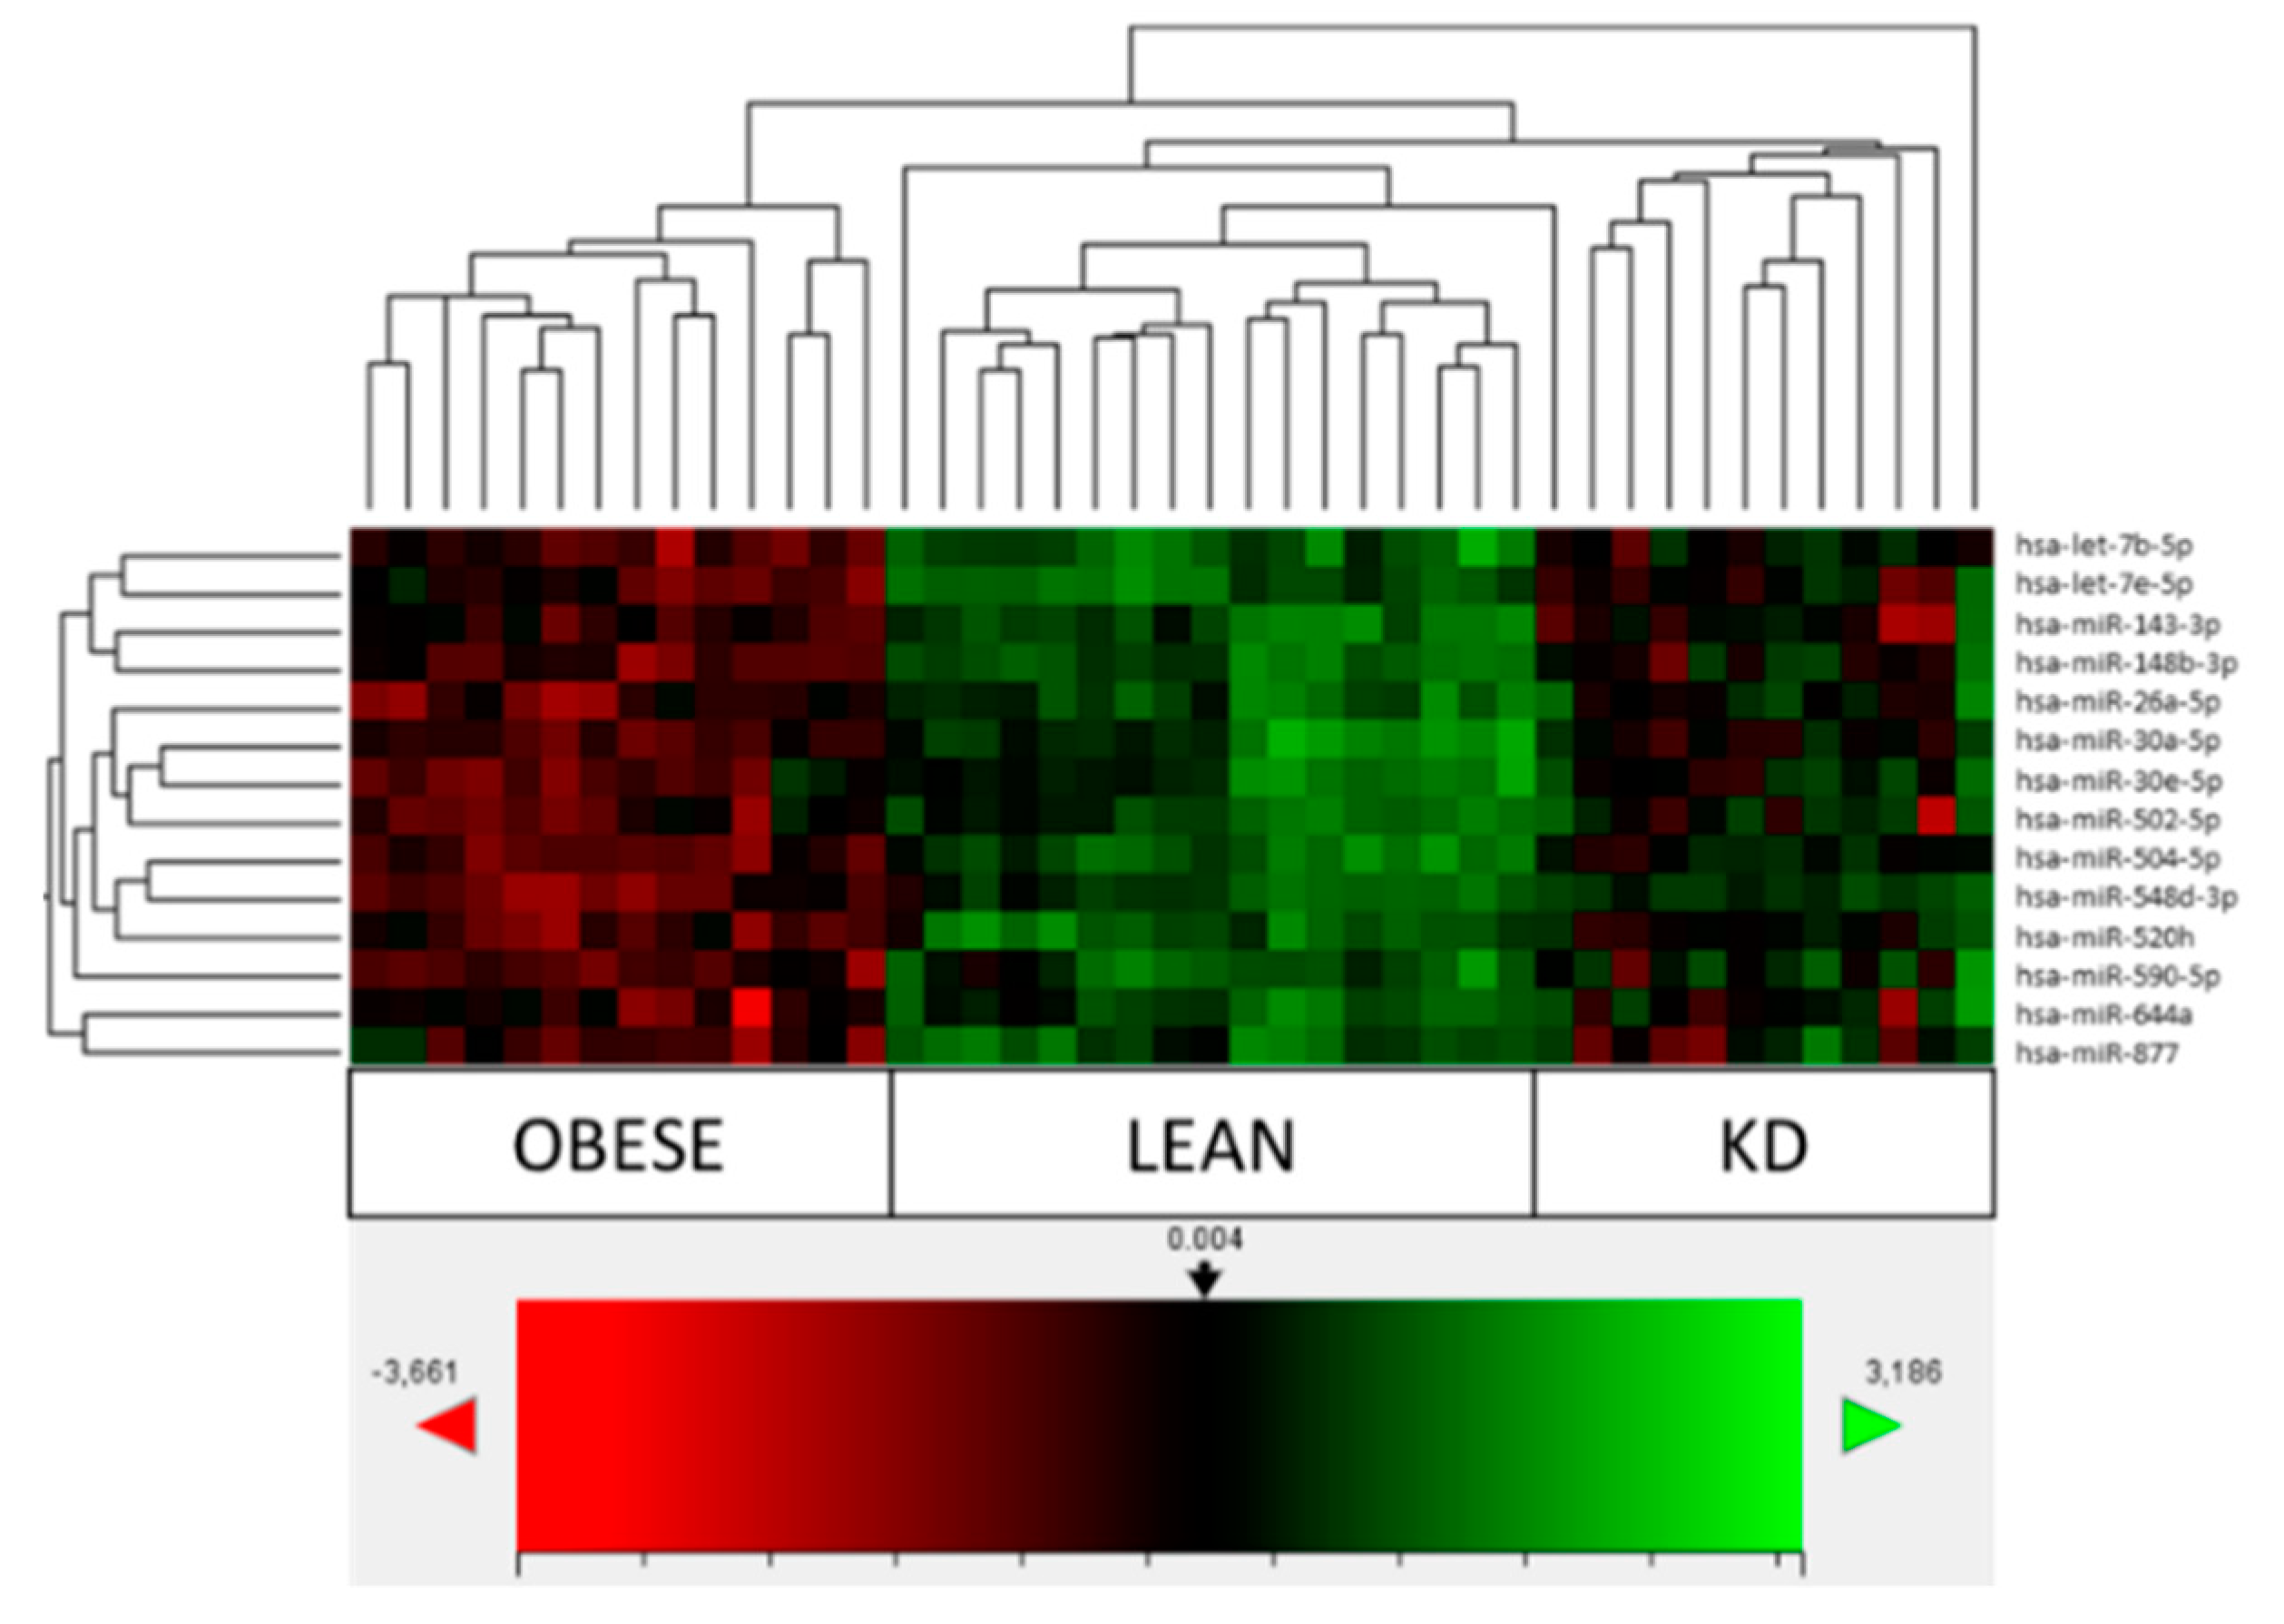
3.2. Comparison of Obese, Lean and KD Array Profiles
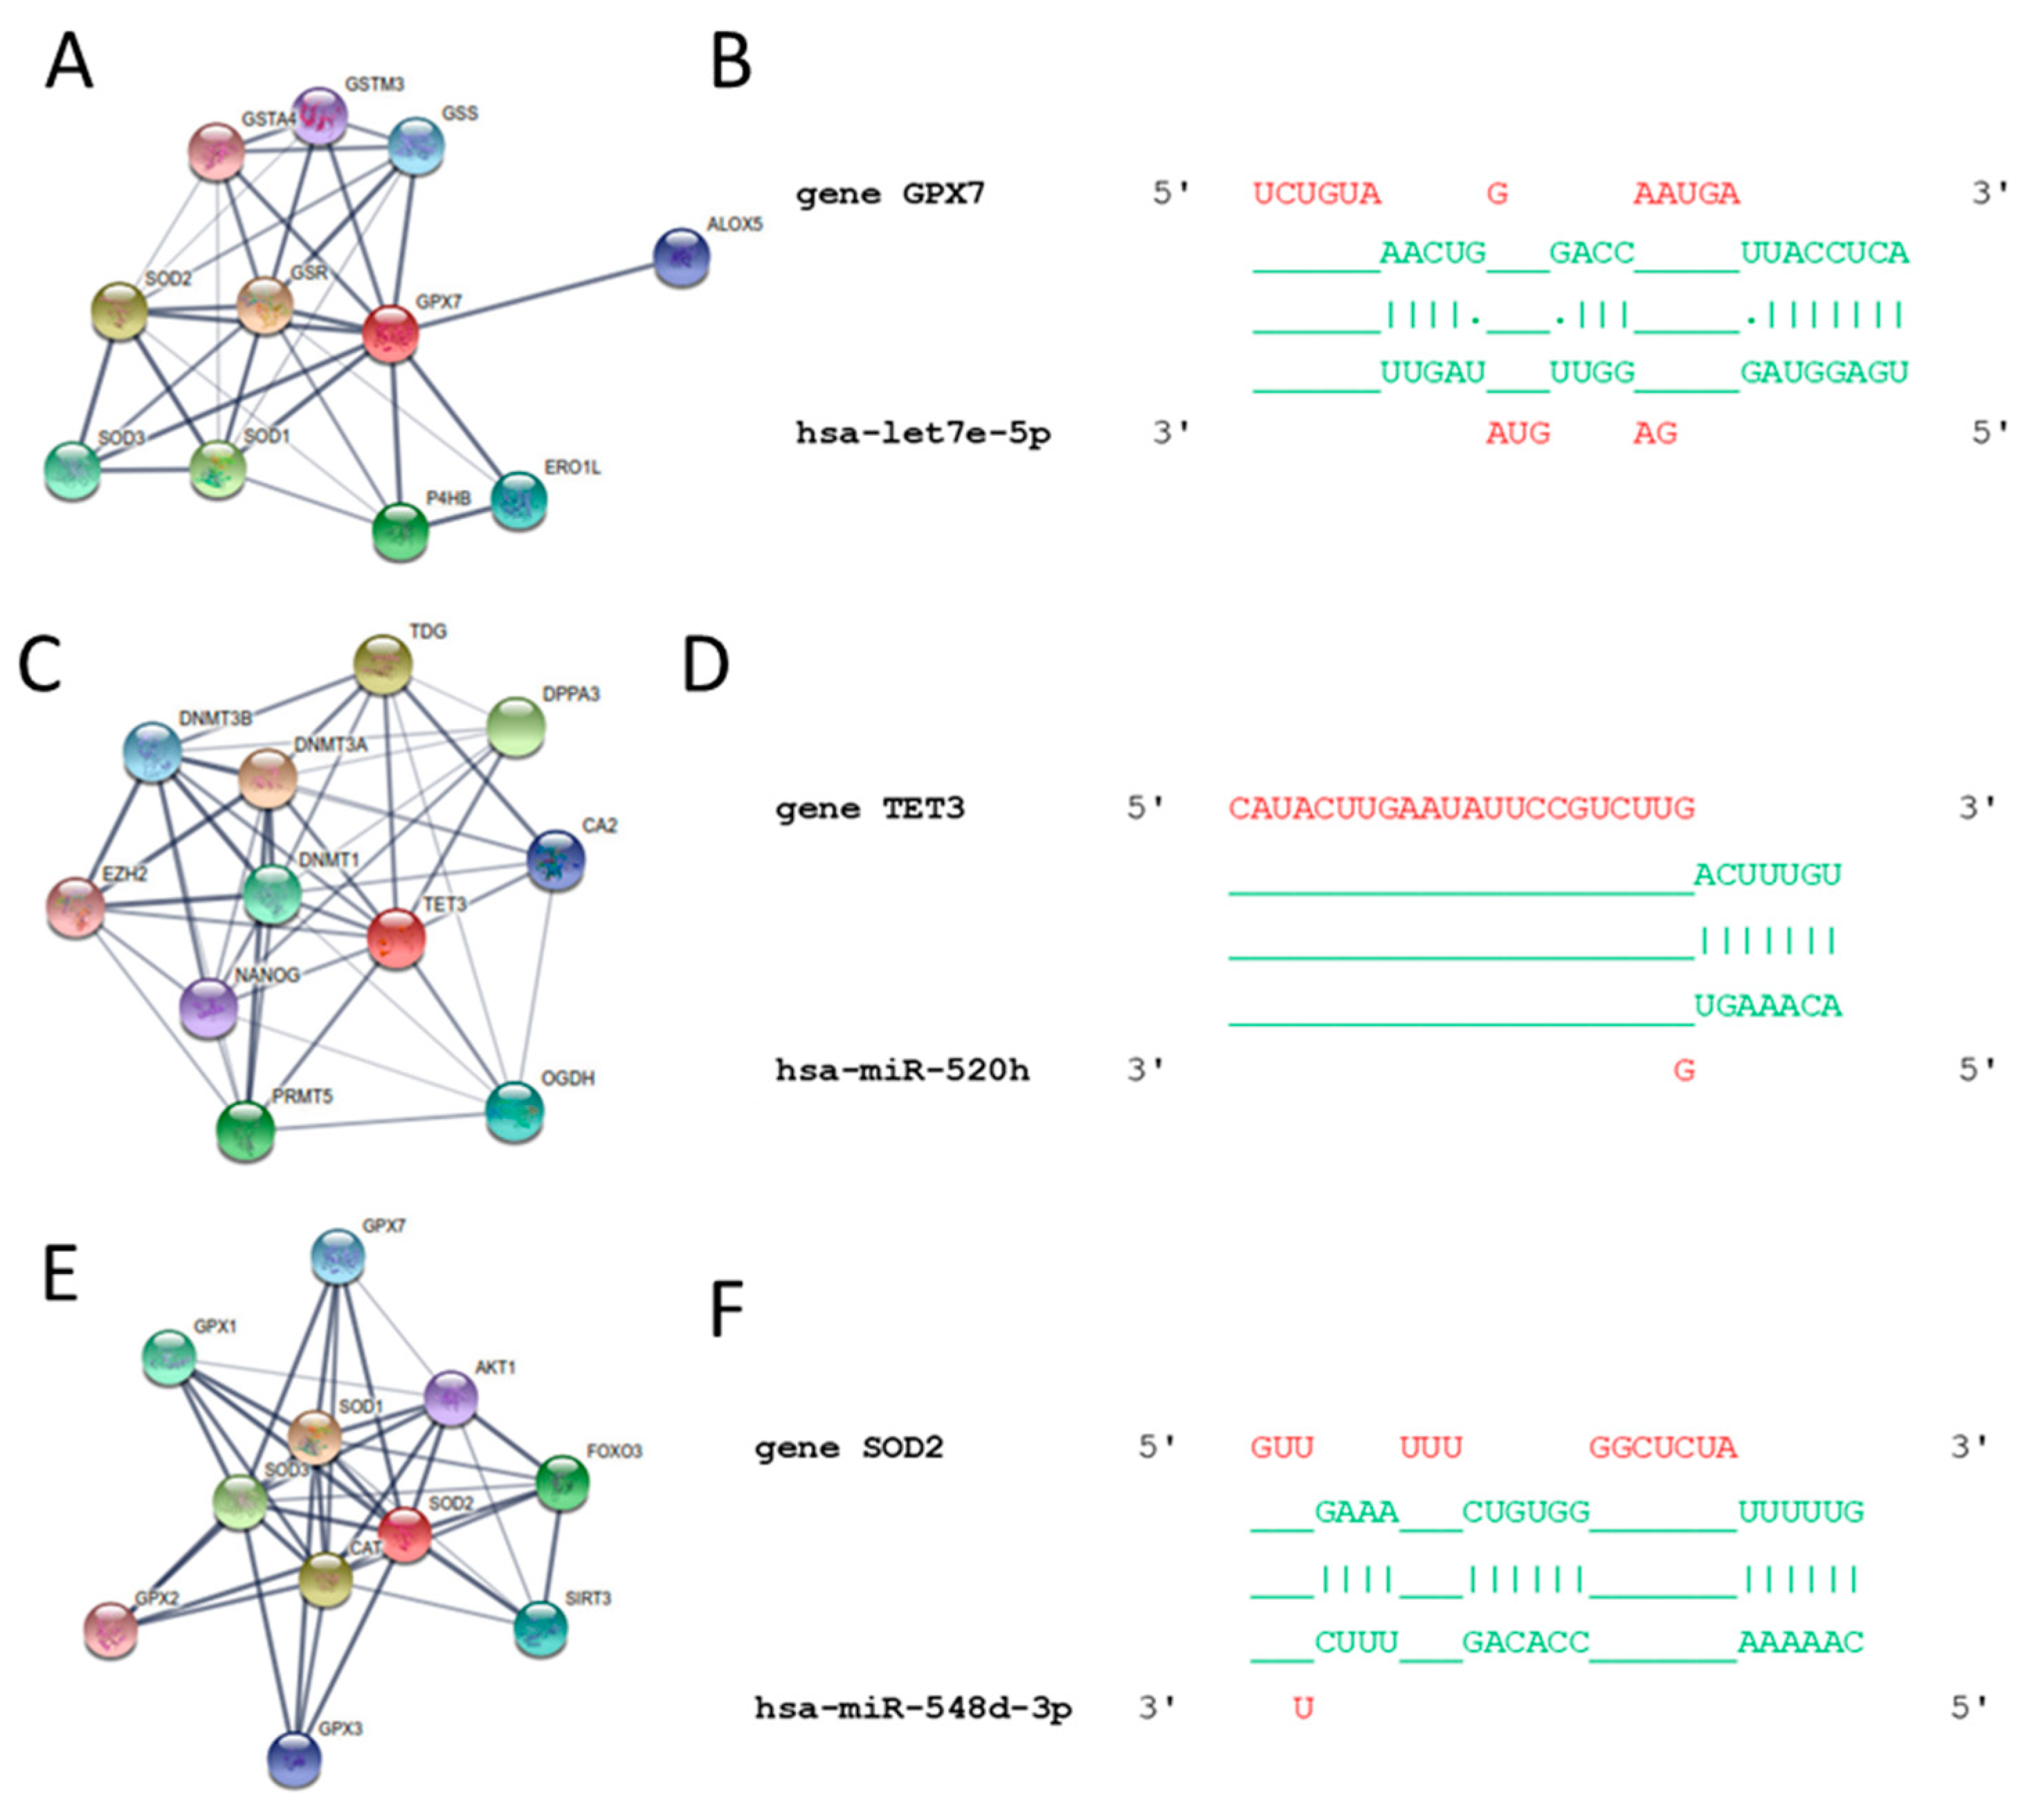
3.3. In Silico Results
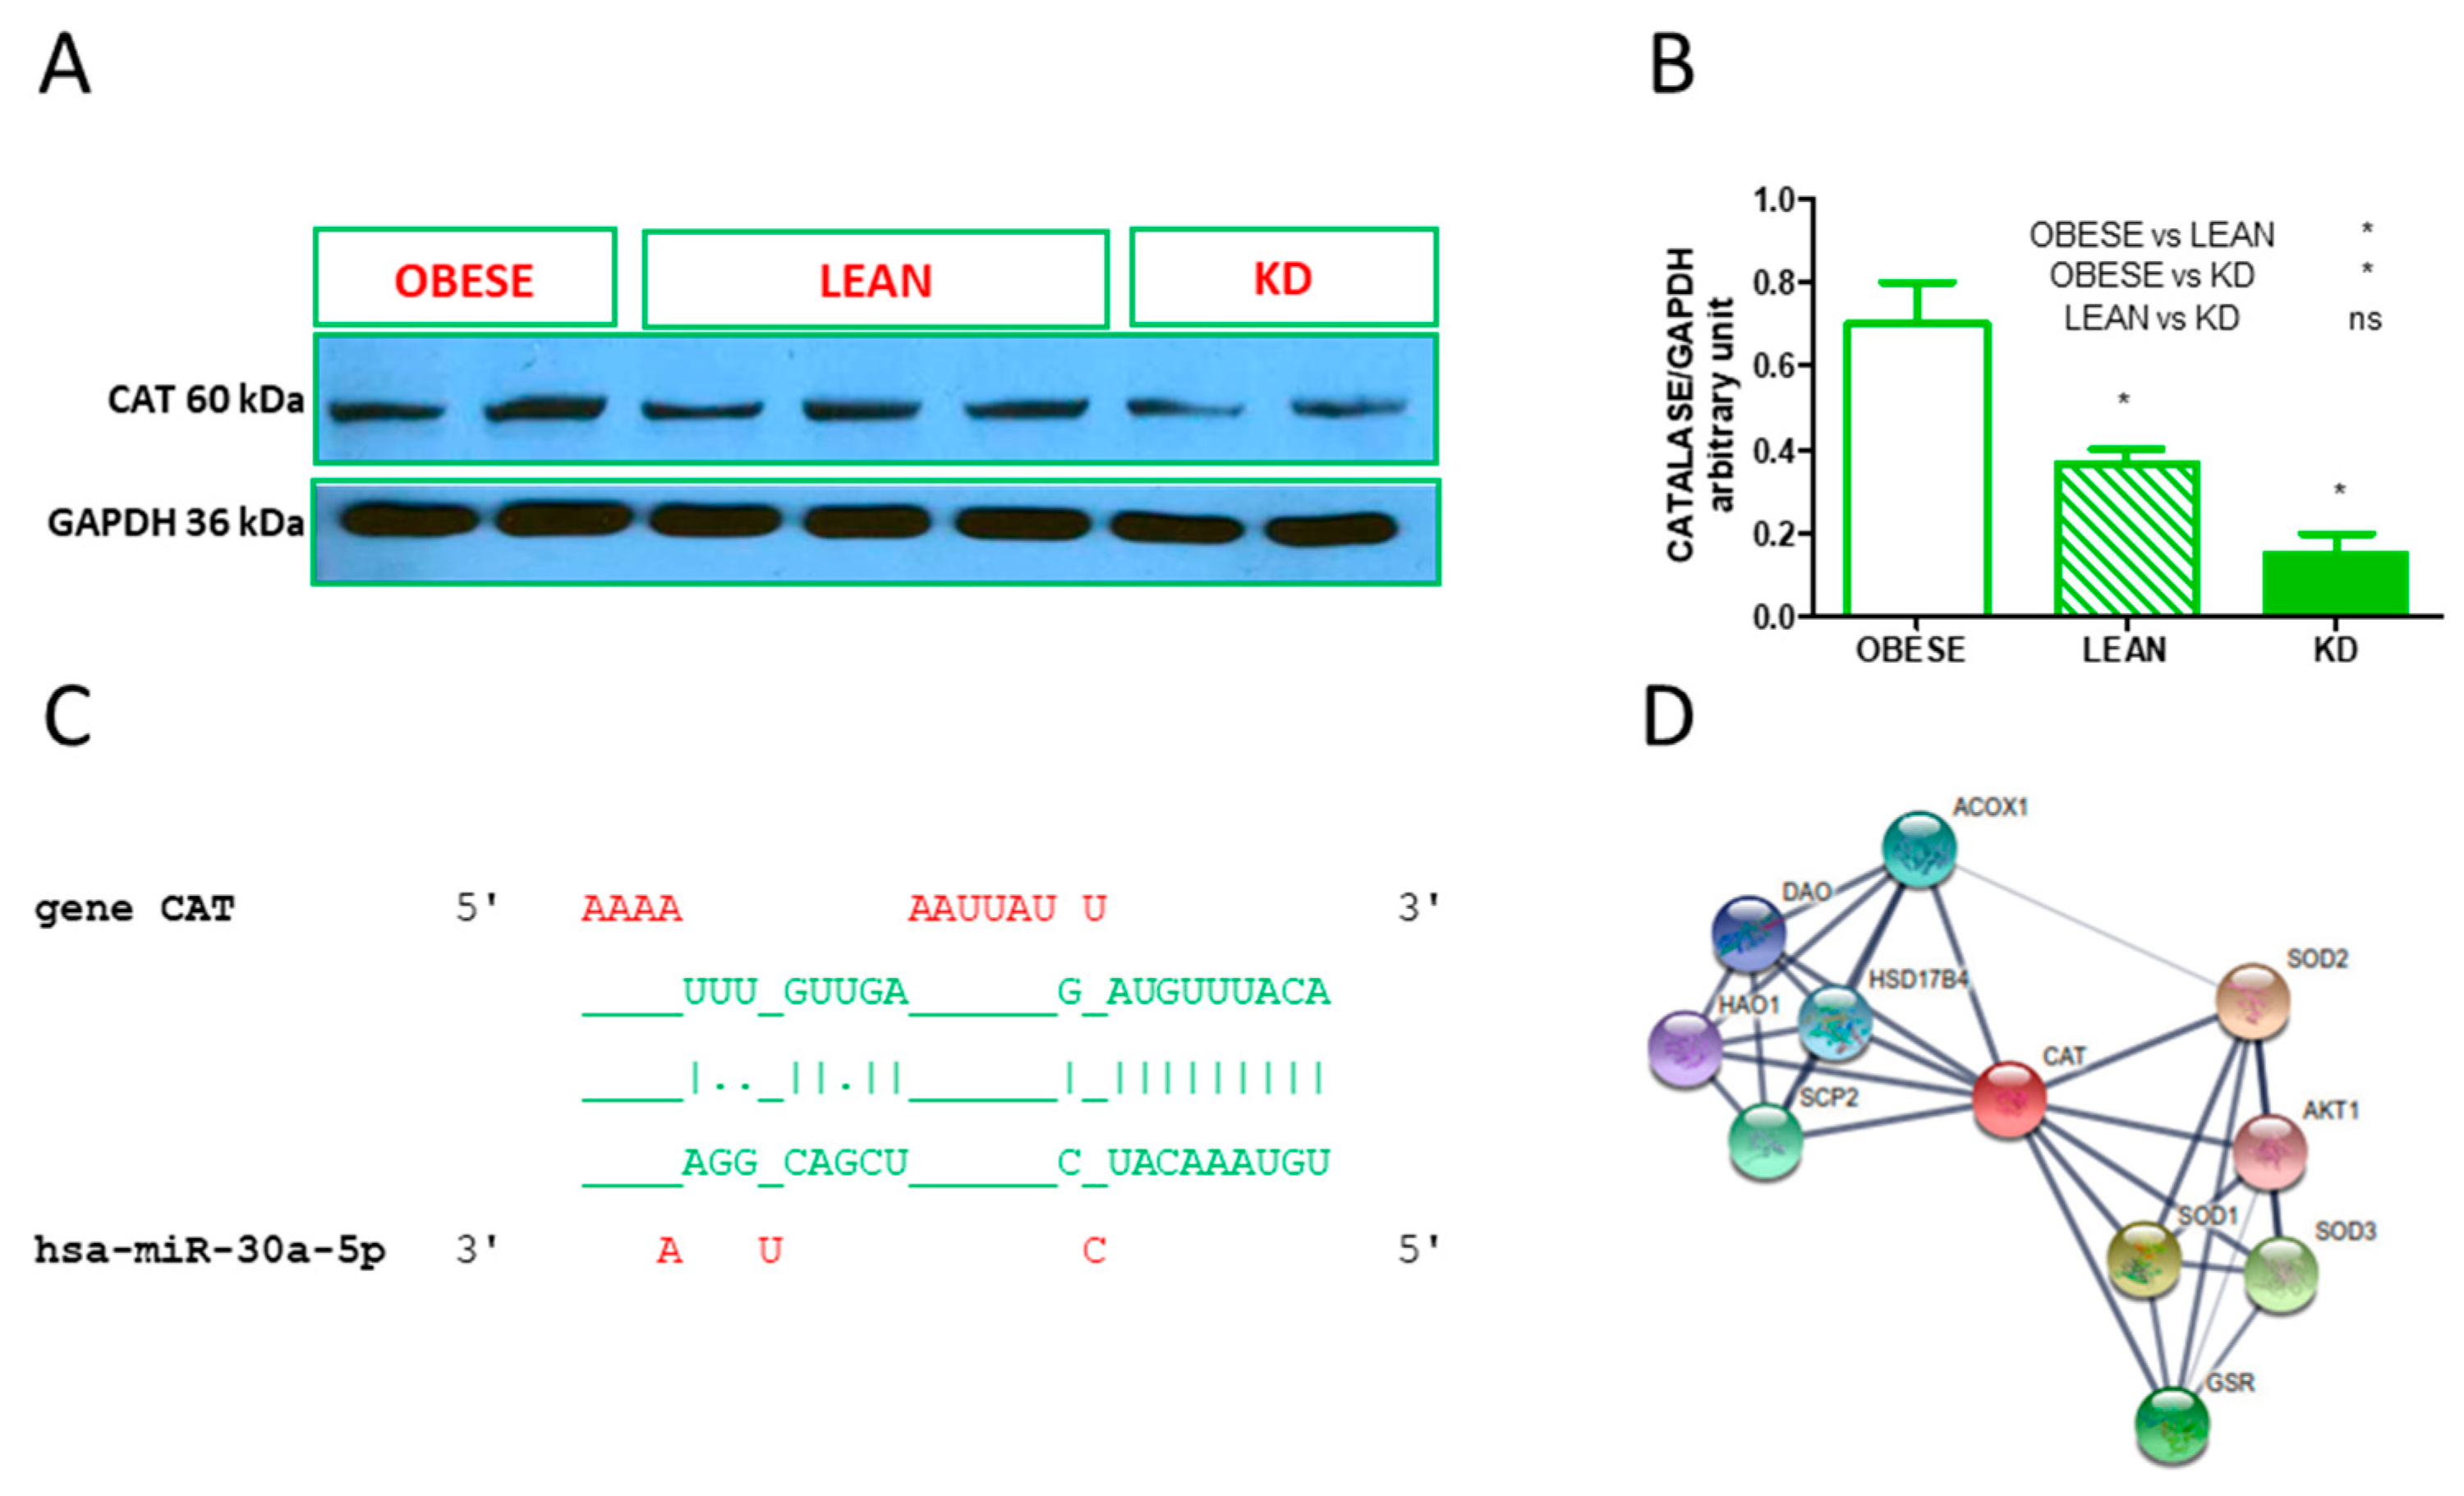
3.4. Validated hsa-miR Interaction and Western Blot Analysis of Catalase
4. Discussion
5. Conclusions
Author Contributions
Funding
Conflicts of Interest
References
- Sorensen, T.I.; Virtue, S.; Vidal-Puig, A. Obesity as a clinical and public health problem: Is there a need for a new definition based on lipotoxicity effects? Biochim. Biophys. Acta 2010, 1801, 400–404. [Google Scholar] [CrossRef] [PubMed]
- Ezzati, M.; Bentham, J.; Di Cesare, M.; Bilano, V.; Bixby, H.; Zhou, B.; Stevens, A.G.; Riley, M.L.; Taddei, C.; Hajifathalian, K.; et al. Worldwide trends in body-mass index, underweight, overweight, and obesity from 1975 to 2016: A pooled analysis of 2416 population-based measurement studies in 128.9 million children, adolescents, and adults. Lancet 2017, 390, 2627–2642. [Google Scholar]
- Li, J.; Shen, X. Oxidative stress and adipokine levels were significantly correlated in diabetic patients with hyperglycemic crises. Diabetol. Metab. Syndr. 2019, 11, 13. [Google Scholar] [CrossRef] [PubMed]
- Fernández-Sánchez, A.; Madrigal-Santillán, E.; Bautista, M.; Esquivel-Soto, J.; Morales-Gonzalez, A.; Esquivel-Chirino, C.; Durante-Montiel, I.; Sánchez-Rivera, G.; Valadez-Vega, C.; Morales-Gonzalez, J.A. Inflammation, oxidative stress, and obesity. Int. J. Mol. Sci. 2011, 12, 3117–3132. [Google Scholar] [CrossRef] [PubMed]
- Franco, R.; Navarro, G.; Martínez-Pinilla, E. Antioxidant Defense Mechanisms in Erythrocytes and in the Central Nervous System. Antioxidants (Basel) 2019, 8, 46. [Google Scholar] [CrossRef] [PubMed]
- Tucci, P.; Cione, E.; Perri, M.; Genchi, G. All-trans-retinoic acid induces apoptosis in Leydig cells via activation of the mitochondrial death pathway and antioxidant enzyme regulation. J. Bioenerg. Biomembr. 2008, 40, 315–323. [Google Scholar] [CrossRef] [PubMed]
- Lobo, V.; Patil, A.; Phatak, A.; Chandra, N. Free radicals, antioxidants and functional foods: Impact on human health. Pharmacogn. Rev. 2010, 4, 118–126. [Google Scholar] [CrossRef] [PubMed]
- Spalice, A.; Guido, C.A. Cardiovascular Risks of Ketogenic Diet for Glut-1 Deficiency. Pediatr. Neurol. Briefs 2018, 32, 8. [Google Scholar] [CrossRef]
- Iacovides, S.; Meiring, R.M. The effect of a ketogenic diet versus a high-carbohydrate, low-fat diet on sleep, cognition, thyroid function, and cardiovascular health independent of weight loss: Study protocol for a randomized controlled trial. Trials 2018, 19, 62. [Google Scholar] [CrossRef]
- Pinto, A.; Bonucci, A.; Maggi, E.; Corsi, M.; Businaro, R. Anti-Oxidant and Anti-Inflammatory Activity of Ketogenic Diet: New Perspectives for Neuroprotection in Alzheimer’s Disease. Antioxidants (Basel) 2018, 7, 63. [Google Scholar] [CrossRef]
- Canning, K.L.; Brown, R.E.; Wharton, S.; Sharma, A.M.; Kuk, J.L. Edmonton Obesity Staging System Prevalence and Association with Weight Loss in a Publicly Funded Referral-Based Obesity Clinic. J. Obes. 2015, 2015, 619734. [Google Scholar] [CrossRef] [PubMed]
- Cannataro, R.; Perri, M.; Gallelli, L.; Caroleo, M.C.; De Sarro, G.; Cione, E. Ketogenic Diet Acts on Body Remodeling and MicroRNAs Expression Profile. Microrna 2019, 8, 116–126. [Google Scholar] [CrossRef] [PubMed]
- Tan, B.L.; Norhaizan, M.E.; Liew, W.P. Nutrients and Oxidative Stress: Friend or Foe? Oxid. Med. Cell. Longev. 2018, 2018, 9719584. [Google Scholar] [CrossRef] [PubMed]
- Malivindi, R.; Rago, V.; De Rose, D.; Gervasi, M.C.; Cione, E.; Russo, G.; Santoro, M.; Aquila, S. Influence of all-trans retinoic acid on sperm metabolism and oxidative stress: Its involvement in the physiopathology of varicocele-associated male infertility. J. Cell. Physiol. 2018, 233, 9526–9537. [Google Scholar] [CrossRef] [PubMed]
- Perri, M.; Pingitore, A.; Cione, E.; Vilardi, E.; Perrone, V.; Genchi, G. Proliferative and anti-proliferative effects of retinoic acid at doses similar to endogenous levels in Leydig MLTC-1/R2C/TM-3 cells. Biochim. Biophys. Acta 2010, 1800, 993–1001. [Google Scholar] [CrossRef] [PubMed]
- Cione, E.; Pingitore, A.; Perri, M.; Genchi, G. Influence of all-trans-retinoic acid on oxoglutarate carrier via retinoylation reaction. Biochim. Biophys. Acta 2009, 1791, 3–7. [Google Scholar] [CrossRef] [PubMed]
- Mohanty, J.G.; Shukla, H.D.; Williamson, J.D.; Launer, L.J.; Saxena, S.; Rifkind, J.M. Alterations in the red blood cell membrane proteome in alzheimer’s subjects reflect disease-related changes and provide insight into altered cell morphology. Proteome Sci. 2010, 8, 11. [Google Scholar] [CrossRef]
- Gallelli, L.; Falcone, D.; Pelaia, G.; Renda, T.; Terracciano, R.; Malara, N.; Vatrella, A.; Sanduzzi, A.; D’Agostino, B.; Rossi, F.; et al. Interleukin-6 receptor superantagonist Sant7 inhibits TGF-beta-induced proliferation of human lung fibroblasts. Cell Prolif. 2008, 41, 393–407. [Google Scholar] [CrossRef]
- Pelaia, G.; Gallelli, L.; D’Agostino, B.; Vatrella, A.; Cuda, G.; Fratto, D.; Renda, T.; Galderisi, U.; Piegari, E.; Crimi, N.; et al. Effects of TGF-beta and glucocorticoids on map kinase phosphorylation, IL-6/IL-11 secretion and cell proliferation in primary cultures of human lung fibroblasts. J. Cell. Physiol. 2007, 210, 489–497. [Google Scholar] [CrossRef]
- Perri, M.; Lucente, M.; Cannataro, R.; De Luca, I.F.; Gallelli, L.; Moro, G.; De Sarro, G.; Caroleo, M.C.; Cione, E. Variation in Immune-Related microRNAs Profile in Human Milk Amongst Lactating Women. Microrna 2018, 7, 107–114. [Google Scholar] [CrossRef]
- Geiss, G.K.; Bumgarner, E.R.; Birditt, B.; Dahl, T.; Dowidar, N.; Dunaway, D.L.; Fell, H.P.; Ferree, S.; George, R.D.; Grogan, T.; et al. Direct multiplexed measurement of gene expression with color-coded probe pairs. Nat. Biotechnol. 2008, 26, 317–325. [Google Scholar] [CrossRef] [PubMed]
- Foye, C.; Yan, I.K.; David, W.; Shukla, N.; Habboush, Y.; Chase, L.; Ryland, K.; Kesari, V.; Patel, T. Comparison of miRNA quantitation by Nanostring in serum and plasma samples. PLoS ONE 2017, 12, e0189165. [Google Scholar] [CrossRef] [PubMed]
- Waggott, D.; Chu, K.; Yin, S.; Wouters, B.G.; Liu, F.-F.; Boutros, P.C. NanoStringNorm: An extensible R package for the pre-processing of NanoString mRNA and miRNA data. Bioinformatics 2012, 28, 1546–1548. [Google Scholar] [CrossRef] [PubMed]
- Shkurnikov, M.Y.; Knyazev, E.N.; Fomicheva, K.A.; Mikhailenko, D.S.; Nyushko, K.M.; Saribekyan, E.K.; Samatov, T.R.; Alekseev, B.Y.; Knyazev, E. Analysis of Plasma microRNA Associated with Hemolysis. Bull. Exp. Biol. Med. 2016, 160, 748–750. [Google Scholar] [CrossRef] [PubMed]
- Abdali, D.; Samson, S.E.; Grover, A.K. How effective are antioxidant supplements in obesity and diabetes? Med. Princ. Pract. 2015, 24, 201–215. [Google Scholar] [CrossRef] [PubMed]
- Burgio, E.; Lopomo, A.; Migliore, L. Obesity and diabetes: From genetics to epigenetics. Mol. Biol. Rep. 2015, 42, 799–818. [Google Scholar] [CrossRef] [PubMed]
- Dashti, H.M.; Mathew, T.C.; Hussein, T.; Asfar, S.K.; Behbahani, A.; A Khoursheed, M.; Al-Sayer, H.M.; Bo-Abbas, Y.Y.; Al-Zaid, N.S. Long-term effects of a ketogenic diet in obese patients. Exp. Clin. Cardiol. 2004, 9, 200–205, PMCID:PMC2716748. [Google Scholar] [PubMed]
- Ma, S.; Suzuki, K. Keto-Adaptation and Endurance Exercise Capacity, Fatigue Recovery, and Exercise-Induced Muscle and Organ Damage Prevention: A Narrative Review. Sports (Basel) 2019, 7, 40, PMCID:PMC6410243. [Google Scholar] [CrossRef] [PubMed]
- Suzuki, K. Chronic Inflammation as an Immunological Abnormality and Effectiveness of Exercise. Biomolecules 2019, 9, 223. [Google Scholar] [CrossRef]
- Ling, C.; Ronn, T. Epigenetics in Human Obesity and Type 2 Diabetes. Cell Metab. 2019, 29, 1028–1044. [Google Scholar] [CrossRef] [Green Version]
- Herrera, B.M.; Lindgren, C.M. The genetics of obesity. Curr. Diabetes Rep. 2010, 10, 498–505. [Google Scholar] [CrossRef]
- Lopomo, A.; Burgio, E.; Migliore, L. Epigenetics of Obesity. Prog. Mol. Biol. Transl. Sci. 2016, 140, 151–184. [Google Scholar]
- Izquierdo, A.G.; Crujeiras, A.B. Obesity-Related Epigenetic Changes After Bariatric Surgery. Front. Endocrinol. 2019, 10, 232. [Google Scholar] [CrossRef]
- Sato, F.; Tsuchiya, S.; Meltzer, S.J.; Shimizu, K. MicroRNAs and epigenetics. FEBS J. 2011, 278, 1598–1609. [Google Scholar] [CrossRef]
- Hildebrand, D.; Eberle, M.-E.; Wölfle, S.M.; Egler, F.; Sahin, D.; Sahr, A.; Bode, K.A.; Heeg, K. Hsa-miR-99b/let-7e/miR-125a Cluster Regulates Pathogen Recognition Receptor-Stimulated Suppressive Antigen-Presenting Cells. Front. Immunol. 2018, 9, 1224. [Google Scholar] [CrossRef]
- Rudov, A.; Balduini, W.; Carloni, S.; Perrone, S.; Buonocore, G.; Albertini, M.C. Involvement of miRNAs in placental alterations mediated by oxidative stress. Oxid. Med. Cell. Longev. 2014, 2014, 103068. [Google Scholar] [CrossRef]
- Engedal, N.; Žerovnik, E.; Rudov, A.; Galli, F.; Olivieri, F.; Procopio, A.D.; Rippo, M.R.; Monsurrò, V.; Betti, M.; Albertini, M.C. From Oxidative Stress Damage to Pathways, Networks, and Autophagy via MicroRNAs. Oxid. Med. Cell. Longev. 2018, 2018, 4968321. [Google Scholar] [CrossRef]
- Maiorino, M.; Bosello-Travain, V.; Cozza, G.; Miotto, G.; Roveri, A.; Toppo, S.; Zaccarin, M.; Ursini, F. Understanding mammalian glutathione peroxidase 7 in the light of its homologs. Free Radic. Biol. Med. 2015, 83, 352–360. [Google Scholar] [CrossRef]
- Peng, J.; Yang, Q.; Li, A.-F.; Li, R.-Q.; Wang, Z.; Liu, L.-S.; Ren, Z.; Zheng, X.-L.; Tang, X.-Q.; Li, G.-H.; et al. Tet methylcytosine dioxygenase 2 inhibits atherosclerosis via upregulation of autophagy in ApoE-/- mice. Oncotarget 2016, 7, 76423–76436. [Google Scholar] [CrossRef]
- Kurian, J.R.; Louis, S.; Keen, K.L.; Wolfe, A.; Terasawa, E.; Levine, J.E. The Methylcytosine Dioxygenase Ten-Eleven Translocase-2 (tet2) Enables Elevated GnRH Gene Expression and Maintenance of Male Reproductive Function. Endocrinology 2016, 157, 3588–3603. [Google Scholar] [CrossRef]
- Mao, L.; Liu, S.; Hu, L.; Jia, L.; Wang, H.; Guo, M.; Chen, C.; Liu, Y.; Xu, L. miR-30 Family: A Promising Regulator in Development and Disease. BioMed Res. Int. 2018, 2018, 9623412. [Google Scholar] [CrossRef]
- Kim, Y.S.; Vallur, P.G.; Phaëton, R.; Mythreye, K.; Hempel, N. Insights into the Dichotomous Regulation of SOD2 in Cancer. Antioxidants (Basel) 2017, 6, 86. [Google Scholar] [CrossRef]
- Rahal, A.; Kumar, A.; Singh, V.; Yadav, B.; Tiwari, R.; Chakraborty, S.; Dhama, K. Oxidative stress, prooxidants, and antioxidants: The interplay. BioMed Res. Int. 2014, 2014, 761264. [Google Scholar] [CrossRef]
- Kephart, W.C.; Mumford, P.W.; Mao, X.; Romero, M.A.; Hyatt, H.W.; Zhang, Y.; Mobley, C.B.; Quindry, J.C.; Young, K.C.; Beck, D.T.; et al. The 1-Week and 8-Month Effects of a Ketogenic Diet or Ketone Salt Supplementation on Multi-Organ Markers of Oxidative Stress and Mitochondrial Function in Rats. Nutrients 2017, 9, 1019. [Google Scholar] [CrossRef]


| Characteristic | Obese (n = 14) | Lean (n = 17) | KD (n = 12) | p Value * |
|---|---|---|---|---|
| Age, y | 46.5 ± 10.51 | 46.83 ±12.32 | 46.6±11.56 | ns |
| Height, cm | 175.1 ± 5.2 | 171.3 ± 6.6 | 176.3 ± 3.3 | ns |
| Weight, kg | 107.5 ± 3.0 | 70.8 ± 3.8 | 96.97 ± 11.2 | <0.001 |
| BMI, kg/m2 | 33.9 ± 1.2 | 22.1 ± 2.5 | 31.5 ± 1.3 | <0.001 |
| Number of Target Genes | ||
|---|---|---|
| miRTargetLink Human | DIANA Tools | |
| hsa-let-7b-5p | 124 | 312 |
| hsa-let-7e-5p | 15 | 273 |
| hsa-miR-143-3p | 32 | 82 |
| hsa-miR-148b-3p | 10 | 218 |
| hsa-miR-26a-5p | 52 | 391 |
| hsa-miR-30a-5p | 119 | 458 |
| hsa-miR-30e-5p | 7 | 412 |
| hsa-miR-502-5p | 3 | 30 |
| hsa-miR-504-5p | 6 | 7 |
| hsa-miR-520h | 5 | 5 |
| hsa-miR-548d-3p | 1 | 203 |
| hsa-miR-590-5p | 2 | 43 |
| hsa-miR-644a | 2 | 0 |
| hsa-miR-877 | 0 | 19 |
| Biochemical Pathways and Possible miRs Gene Interaction | ||
|---|---|---|
| miRNA | Validated target genes | |
| Glutathione metabolism | hsa-let-7b-5p | GPX7, GSR, RRM2, GGCT |
| has-let-7e-5p | GPX7 | |
| hsa-miR-26a-5p | RRM2 | |
| Chondroitin sulfate biosynthesis | hsa-let-7b-5p | CHPF2, XYLT2 |
| Arachidonic acid metabolism | hsa-let-7b-5p | CYP2J2, GPX7, LTA4H, PTGS1, PTGS2, PTGES2 |
| hsa-miR-26a-5p | PTGS1 | |
| hsa-miR-143-3p | PTGS2 | |
| Toll like receptor signalling pathway | hsa-let-7b-5p | IFNB1, NFKBIA, MAPK1, MAP2K2, TAB2 |
| hsa-miR-26a-5p | IFNB1, IL6 | |
| hsa-miR-30e-5p | CAT | |
| hsa-miR-877-5p | MAPK8 | |
| hsa-miR-148b-3p | PIK3CA, PIK3CG | |
| hsa-miR-143-3p | AKT1 | |
| hsa-miR-520h | TET3 | |
| Natural killer cell mediated cytotoxicity and T Cell, B Cell receptor signalling pathways | hsa-let-7b-5p | IFNB1, NFATC1, NFATC3, NRAS, NFKBIA, PAK1, MAPK1, MAP2K2, PDK1, CD81 |
| hsa-miR-26a-5p | IFNB1, SHC2, IL6 | |
| hsa-miR-30e-5p | RELA, CAT | |
| hsa-miR-504-5p | FAS | |
| hsa-miR-877-5p | NFAT5, NRAS, PIK3CCA | |
| hsa-miR-143-3p | HRAS, KRAS, AKT1 | |
| hsa-miR-148a-3p | HLA-G, CCL28 | |
| hsa-miR-548d-3p | AKT3, SOD2 | |
| Abbreviation | Gene Name |
|---|---|
| AKT1 | Serine-threonine protein kinase 1 |
| AKT3 | Serine-threonine protein kinase 3 |
| CAT | Catalase |
| CCL28 | C-C motif chemokinine 28 precursor |
| CD81 | CD81 antigen target proliferate antibody 1 |
| CHPF2 | Chondroitin polymerizing factor 2 |
| CYP2J2 | Cytochrome P450 2J2 |
| FAS | FAS cell surface deat receptor |
| GGCT | Gamma-glutamylcyclotransferase |
| GPX7 | Glutathione peroxidase 7 |
| GSR | Glutathione disulphide reductase |
| HLA-G | HLA Class I Histocompatibility Antigen, Alpha Chain G |
| HRAS | Hras protogoncogene GTPase |
| IFNB1 | Interferon beta 1 |
| IL6 | Interleukin-6 |
| KRAS | Kras protogoncogene GTPase |
| LTA4H | Leukotriene-A4 hydrolase |
| MAP2K2 | Mitogen-activated protein kinase 2 |
| MAPK1 | Mitogen-activated protein kinase 1 |
| MAPK8 | Mitogen-activated protein kinase 8 |
| NFAT5 | Nuclear factor of activated T-cells 5 |
| NFATC1 | Nuclear factor of activated T cells 1 |
| NFATC3 | Nuclear factor of activated T cells 3 |
| NFKBIA | NFKB inhibitor alpha |
| NRAS | NRAS-proto-oncogene |
| PAK1 | Serine/threonine-protein kinase |
| PDK1 | Phosphoinositide-dependent kinase-1 |
| PIK3CA | Phosphaidylinositol-3-kinase |
| PIK3CG | Phosphaidylinositol-4,5-Bisphosphatase 3-kinase |
| PTGES2 | Prostaglandin-E synthase 2 |
| PTGS1 | Prostaglandin-endoperoxidase synthase 1 |
| PTGS2 | Prostaglandin-endoperoxdase synthase 2 |
| PTES2 | Prostaglandin-E synthase 2 |
| RELA | RELA-proto-oncogene |
| RRM2 | Ribonucleotide reductase regulatory subunit M2 |
| SHC2 | SHC-trasorming protein 2 |
| TAB2 | TGF-beta activated kinase 1 binding protein 2 |
| XYLT2 | Xylosyltransferase 2 |
© 2019 by the authors. Licensee MDPI, Basel, Switzerland. This article is an open access article distributed under the terms and conditions of the Creative Commons Attribution (CC BY) license (http://creativecommons.org/licenses/by/4.0/).
Share and Cite
Cannataro, R.; Caroleo, M.C.; Fazio, A.; La Torre, C.; Plastina, P.; Gallelli, L.; Lauria, G.; Cione, E. Ketogenic Diet and microRNAs Linked to Antioxidant Biochemical Homeostasis. Antioxidants 2019, 8, 269. https://0-doi-org.brum.beds.ac.uk/10.3390/antiox8080269
Cannataro R, Caroleo MC, Fazio A, La Torre C, Plastina P, Gallelli L, Lauria G, Cione E. Ketogenic Diet and microRNAs Linked to Antioxidant Biochemical Homeostasis. Antioxidants. 2019; 8(8):269. https://0-doi-org.brum.beds.ac.uk/10.3390/antiox8080269
Chicago/Turabian StyleCannataro, Roberto, Maria Cristina Caroleo, Alessia Fazio, Chiara La Torre, Pierluigi Plastina, Luca Gallelli, Graziantonio Lauria, and Erika Cione. 2019. "Ketogenic Diet and microRNAs Linked to Antioxidant Biochemical Homeostasis" Antioxidants 8, no. 8: 269. https://0-doi-org.brum.beds.ac.uk/10.3390/antiox8080269