Article

Carnosine Decreases PMA-Induced Oxidative Stress and Inflammation in Murine Macrophages

by
Giuseppe Caruso
1,*,†,
Claudia G. Fresta
2,3,†,‡,
Annamaria Fidilio
4,†,
Fergal O’Donnell
5,
Nicolò Musso
6,
Giacomo Lazzarino
7,8,
Margherita Grasso
1,4,
Angela M. Amorini
9,
Fabio Tascedda
10,11,
Claudio Bucolo
9,
Filippo Drago
9,
Barbara Tavazzi
7,8,
Giuseppe Lazzarino
9,*,
Susan M. Lunte
2,3,12,§ and
Filippo Caraci
1,4,§
1
Department of Laboratories, Oasi Research Institute—IRCCS, 94018 Troina, Italy
2
Ralph N. Adams Institute for Bioanalytical Chemistry, University of Kansas, Lawrence, KS 66047-1620, USA
3
Department of Pharmaceutical Chemistry, University of Kansas, Lawrence, KS 66047-1620, USA
4
Department of Drug Sciences, University of Catania, 95125 Catania, Italy
5
School of Biotechnology, Dublin City University, D09W6Y4 Dublin, Ireland
6
Bio-Nanotech Research and Innovation Tower (BRIT), University of Catania, 95125 Catania, Italy
7
Institute of Biochemistry and Clinical Biochemistry, Catholic University of Rome, 00168 Rome, Italy
8
Fondazione Policlinico Universitario A. Gemelli IRCCS, Largo A. Gemelli 8, 00168 Rome, Italy
9
Department of Biomedical and Biotechnological Sciences, University of Catania, 95125 Catania, Italy
10
Department of Life Sciences, University of Modena and Reggio Emilia, 41125 Modena, Italy
11
Center for Neuroscience and Neurotechnology, University of Modena and Reggio Emilia, 41125 Modena, Italy
12
Department of Chemistry, University of Kansas, Lawrence, KS 66047-1620, USA
*
Authors to whom correspondence should be addressed.
Consider that the first three should be regarded as joint First Authors.
Current address: Department of Biomedical and Biotechnological Sciences, PhD Program in Neurosciences, University of Catania, 95125 Catania, Italy.
§
Consider that the last two should be regarded as joint Last Authors.
Submission received: 22 June 2019 / Revised: 23 July 2019 / Accepted: 31 July 2019 / Published: 6 August 2019
(This article belongs to the Special Issue Natural Products in Health Promotion and Disease Prevention)

Abstract

:
Carnosine is an endogenous dipeptide composed of β-alanine and L-histidine. This naturally occurring molecule is present at high concentrations in several mammalian excitable tissues such as muscles and brain, while it can be found at low concentrations in a few invertebrates. Carnosine has been shown to be involved in different cellular defense mechanisms including the inhibition of protein cross-linking, reactive oxygen and nitrogen species detoxification as well as the counteraction of inflammation. As a part of the immune response, macrophages are the primary cell type that is activated. These cells play a crucial role in many diseases associated with oxidative stress and inflammation, including atherosclerosis, diabetes, and neurodegenerative diseases. In the present study, carnosine was first tested for its ability to counteract oxidative stress. In our experimental model, represented by RAW 264.7 macrophages challenged with phorbol 12-myristate 13-acetate (PMA) and superoxide dismutase (SOD) inhibitors, carnosine was able to decrease the intracellular concentration of superoxide anions (O2•) as well as the expression of Nox1 and Nox2 enzyme genes. This carnosine antioxidant activity was accompanied by the attenuation of the PMA-induced Akt phosphorylation, the down-regulation of TNF-α and IL-6 mRNAs, and the up-regulation of the expression of the anti-inflammatory mediators IL-4, IL-10, and TGF-β1. Additionally, when carnosine was used at the highest dose (20 mM), there was a generalized amelioration of the macrophage energy state, evaluated through the increase both in the total nucleoside triphosphate concentrations and the sum of the pool of intracellular nicotinic coenzymes. Finally, carnosine was able to decrease the oxidized (NADP+)/reduced (NADPH) ratio of nicotinamide adenine dinucleotide phosphate in a concentration dependent manner, indicating a strong inhibitory effect of this molecule towards the main source of reactive oxygen species in macrophages. Our data suggest a multimodal mechanism of action of carnosine underlying its beneficial effects on macrophage cells under oxidative stress and inflammation conditions.

1. Introduction

Reactive oxygen species (ROS) and reactive nitrogen species (RNS) are both part of natural aerobic cell metabolism and are involved in the pathophysiology of different diseases [1,2]. Under physiological conditions, the controlled production of ROS and RNS as well as the activity of the cell antioxidant machinery are well-balanced [3], otherwise a well-known phenomenon named “oxidative/nitrosative stress” will occur [4,5]. ROS, in most healthy cells, are formed as superoxide anions (O2•) by mitochondria, that generates O2• during the tetravalent reduction of molecular oxygen to water catalyzed by the electron transport chain and connected to adenosine triphosphate (ATP) production [2,6,7,8]. Spontaneous O2• dismutation is remarkably accelerated by superoxide dismutase (SOD) activity, that leads to the formation of hydrogen peroxide and diatomic oxygen [9]. At physiological levels, O2• is implicated in several functions such as the messenger of endothelial function [10] and in the phosphorylation and activation of numerous protein kinases [11]. When O2• is overproduced and exceeds cell antioxidant defences, it can either generate secondary, more dangerous ROS, or can easily react with nitric oxide (NO) to form the so-called “deadly cocktail”, as defined by Estévez and Jordán [12]. Oxidative/nitrosative stress leads to the production of ROS and RNS, including hydroxyl radicals and peroxynitrite, which are able to damage fatty acids, proteins, DNA, carbohydrates, and mitochondria [12]. The reaction between O2• and NO is faster than the detoxification reaction catalyzed by SOD [13]. ROS and RNS are widely recognized as important stress mediators of pro-inflammatory conditions, thus connecting oxidative stress and inflammation phenomena [14].
When inflammation processes take place, inducible nitric oxide synthase (iNOS), responsible for NO production [15], as well as NADPH oxidase (Nox), responsible for O2• production [16], are overexpressed in immune cells such as macrophages and microglia [17,18]. Different types of cells are involved in the immune response, among others macrophages are those primarily activated [19,20]. Macrophages can be classified in two different and functionally distinct sub-populations: pro-inflammatory or classically-activated macrophages (M1) and anti-inflammatory or alternatively activated macrophages (M2) [21]. While the M1 sub-population is associated with a high production of pro-inflammatory cytokines (e.g., IL-1β, IL-6, TNF-α, and IL-1), ROS, and RNS, the M2 sub-population produces anti-inflammatory cytokines (e.g., IL-4, IL-10, IL-13, and TGF-β1) [22]. Both peripheral macrophages and microglia, the resident macrophages of the brain, play a pivotal role in several diseases characterized by both oxidative stress and inflammation [23,24].
Carnosine is a natural dipeptide (β-alanyl-L-histidine) discovered more than 100 years ago [25]. This molecule and its related compounds such as anserine (L-alanyl-1-methyl-L-histidine) and homocarnosine (γ-amino-butyryl-L-histidine) are widely distributed in mammalian tissues [26] and in a few number of invertebrates [27,28]. Carnosine is synthesized starting from β-alanine and L-histidine via the activity of the enzyme carnosine synthetase 1, through an ATP-consuming process [29,30]. Although carnosine is mainly found in muscles [31], where it can reach a concentration close to 20 mM [32], its levels in the brain may also be considered reasonably high, ranging from 0.7 to 2.0 mM [33]. There are different in vivo studies in the literature showing the ability of carnosine to protect against pathologies characterized by oxidative stress and/or inflammation. In the study carried out by Zhang et al., employing a neonatal rat model, carnosine was able to protect against hypoxia-ischemia brain damage [34]; Albrecht et al. demonstrated that carnosine treatment improves glucose metabolism, albuminuria, and pathology in BTBR ob/ob mice [35]; very recently, Bermúdez and colleagues carried out an in vivo study in which intranasal carnosine administration attenuated transcriptomic alterations and improved mitochondrial function in the Thy1-aSyn mouse model of Parkinson’s disease (PD) [36]; lastly, carnosine rescued cognitive deficits and decreased expression of the receptor for advanced glycation end products in blood vessels and microglial activation in a transgenic mouse model of Alzheimer disease (AD) fed with a high fat diet [37]. Most of carnosine protective activities are attributable to its antioxidant and anti-inflammatory properties [38]. The interaction of carnosine with specific receptors localized on the cell membrane has been shown to modulate macrophage function [39] by increasing their phagocytotic activity [40]. The ability of this dipeptide to modulate NO production and macrophages polarization has also been proved [41,42]. Very recently, carnosine has been shown to decrease both oxidative stress and inflammation in an in vitro model of amyloid-induced inflammation [43].
In the present study, we first investigated the production of O2• induced by phorbol 12-myristate 13-acetate (PMA) and SOD inhibitors, in the absence or in the presence of increasing concentrations of carnosine and anserine, in RAW 264.7 cells, representing an established in vitro experimental model for studying oxidative stress, with particular reference to O2• production [1,44,45,46,47]. Additionally, in order to understand the molecular mechanisms underlying the ability of carnosine in counteracting O2• production, we studied the variation of parameters representative of cellular energy metabolism, the expression of oxidative stress-related enzymes, and the expression of pro- and anti-inflammatory cytokines in RAW 264.7 cells challenged with PMA and SOD inhibitors in the absence or in the presence of carnosine. Lastly, relying on the fact that Akt protein is overactivated in macrophages under pro-oxidative and pro-inflammatory conditions [48], we also evaluated the effect of carnosine on the PMA-induced activation of Akt in RAW 264.7 macrophages.

2. Materials and Methods

2.1. Materials and Reagents

RAW 264.7 cells (ATCC® TIB-71™), Dulbecco’s Modified Eagle Medium (DMEM), fetal bovine serum (FBS), and penicillin/streptomycin antibiotic solution were purchased from American Type Culture Collection (ATCC, Manassas, VA, USA). Ultrapure standards for high-performance liquid chromatography (HPLC), tetrabutylammonium hydroxide, L-carnosine, L-Anserine nitrate salt, anhydrous dimethyl sulfoxide (DMSO), potassium chloride, sodium dodecyl sulfate (SDS), phosphate-buffered saline (PBS), trypan blue solution, 2-methoxyestradiol (2-ME), cocktail of protease inhibitors, serine/threonine phosphatase inhibitors, tyrosine protein phosphatases inhibitors, RIPA buffer, bovine serum albumin, Bradford reagent, sodium diethyldithiocarbamate trihydrate (DDC), and PMA were all supplied by Sigma-Aldrich (St. Louis, MO, USA). Centrifuge tubes equipped with 3 kDa molecular weight cut-off filters and water, methanol, far-UV acetonitrile, and chloroform (all HPLC-grade) were supplied by VWR International (West Chester, PA, USA). MitoSOX Red probe was purchased from Life Technologies (Carlsbad, CA, USA). C-Chip disposable hemocytometer was purchased from Bulldog Bio, Inc. (Portsmouth, NH, USA). SuperScript III First-Strand Synthesis SuperMix, TE buffer, 25 and 75 mL polystyrene culture flasks, 60 × 15 mm polystyrene Petri dishes, phenol red-free RPMI-1640 medium, boric acid, sodium hydroxide, acetone, 2-propanol, ethanol (95%), PierceTM BCA Protein Assay Kit, and Ne-PER Nuclear and Cytoplasmic Extraction Reagents were obtained from Thermo Fisher Scientific Inc. (Pittsburgh, PA, USA). QuantiTect SYBR Green PCR Kits, RNeasy Mini Kit, and QuantiTect Primer Assays, were purchased from Qiagen (Hilden, Germany). Anti-GAPDH primary antibody was obtained from Millipore (Burlington, MA, USA); anti-nuclear factor erythroid 2-related factor 2 (Nrf2), anti-Akt, and anti-p(ser473)Akt primary antibodies were all obtained from Cell Signaling Technology Inc. (Danvers, MA, USA); anti-heme oxygenase 1 (HO-1) and anti-Histone H3 primary antibodies were purchased from Abcam (Cambridge, UK). Secondary goat anti-rabbit labeled with IRDye 680 and goat anti-mouse labeled with IRDye 800 were purchased from Li-COR Biosciences (Lincoln, NE, USA). 384-well plates were obtained by Roche Molecular Systems Inc. (Pleasanton, CA, USA). Eppendorf LoBind 1.5 mL Microcentrifuge Tubes PCR Clean as well as PCR tubes were both obtained from Eppendorf (Hamburg, Germany). Sylgard 184 polydimethylsiloxane (PDMS) prepolymer and curing agent were obtained from Ellsworth Adhesives (Germantown, WI, USA).

2.2. Cell Culture and Preparation

RAW 264.7 macrophages were cultured in DMEM plus supplements and maintained in polystyrene culture flasks as previously described in detail [1]. Cells were passaged every 2 to 3 days depending on the cell confluence to avoid overgrowth. On the day of the experiment, cells were harvested, 100 μL of the cell suspension was used for cell counting (C-Chip disposable hemocytometer), and plated in polystyrene culture flasks or Petri dishes at the appropriate density.

2.3. Superoxide Anion Levels Determination Using Microchip Electrophoresis with Laser-Induced Fluorescence (ME-LIF) and MitoSOX Red Probe

MitoSOX Red (5 mM), DDC (100 mM), 2-ME (16.5 mM), and PMA (1 mg/mL) stock solutions were prepared as previously described [47]. Macrophages, plated at the density of 3 × 10⁶ cells/flask and ready for the treatment, were incubated for 1 h with the two well-known SOD inhibitors, the cytosolic DDC (1 mM final concentration) and the mitochondrial 2-ME (50 μM final concentration), in presence of the MitoSOX Red probe (10 μM final concentration). Cells were then subjected to an acute (30 or 60 min) stimulation with PMA (1 μg/mL) to increase O2• production. To investigate the effects of carnosine or its methylated analogue anserine on O2• production, cells were pre-incubated for 24 h with increasing carnosine or anserine concentrations (5, 10, or 20 mM), before PMA stimulation. During the incubation of the macrophages with MitoSOX Red, the flasks were always covered with aluminium foil to minimize any photobleaching of the probe. Untreated cells from the same population were used as a control. Cells were then harvested, counted, centrifuged, and the obtained cell pellet was prepared and analyzed by ME-LIF as recently described [43].
Supplementary Figure S1 depicts the experimental procedure to measure O2• production in RAW 264.7 macrophages.

2.4. HPLC Analysis of Metabolites

Macrophage cells, plated at the density of 4.5 × 10⁶ cells/Petri dish and stimulated as described in Section 2.3, were deproteinized according to the organic solvent deproteinization, suitable to measure acid labile and easily oxidizable compounds described in detail elsewhere [49]. The analytes of interest were separated and quantified by ion-pairing HPLC method as previously described in detail [50,51]. Identification and measurement of the different compounds in chromatographic runs of cell extracts were performed by comparing retention times, absorption spectra, and area of the peaks of chromatographic runs of mixtures containing known concentrations of true ultrapure standard mixtures.

2.5. Gene Expression Analysis by Quantitative Real-Time PCR (qRT-PCR)

The concentration of total RNA recovered from 4.5 × 10⁶ cells (previously seeded in Petri dishes) by using RNeasy Mini Kit was determined by measuring the absorbance at 260 nm with a NanoDrop® ND-1000 (Thermo Fisher Scientific, Waltham, MA, USA). The reverse transcription of 100 ng of total RNA (for each sample) was accomplished by using the SuperScript III First-Strand Synthesis SuperMix kit, while the quantification of each cDNA sample loaded in a 384-well plate was achieved by using a LightCycler® 480 System (Roche Molecular Systems, Inc., Pleasanton, CA, USA). The list containing the information of each primer used for this study is reported in Table 1.
The protocol employed for sample amplification, fluorescence data collection, and sample quantification is the same as previously described by us [43].

2.6. Western Blot Analysis

Western blot analyses were performed as previously described [54] on macrophages harvested at 4 °C in RIPA buffer in the presence of a cocktail of protease inhibitors, serine/threonine phosphatase inhibitors, and tyrosine protein phosphatases inhibitors. After a sonication step, each lysate was subjected to centrifugation and supernatant collection. The protein concentrations were determined by Bradford reagent and by measuring the absorbance at 595 nm with a Varioskan® Flash spectrophotometer (Thermo Fisher Scientific, Waltham, MA, USA). A standard curve was made by using bovine serum albumin. After blocking, membranes were incubated with the selected primary antibodies (1:2000 for GAPDH; 1:500 for all other primary antibodies) overnight at 4 °C. After 3 washing steps, membranes were incubated at room temperature, 60 min, with secondary goat anti-rabbit labeled with IRDye 680 and goat anti-mouse labeled with IRDye 800 (1:15000 for both of them).
The nuclear translocation of Nrf2 in macrophages under all our experimental conditions was measured by employing Ne-PER Nuclear and Cytoplasmic Extraction Reagents following the manufacturer’s specification. Briefly, after centrifugation at 500× g for 3 min, the cellular pellet was re-suspended in ice-cold CER I, vortexed, and incubated on ice. Next, the suspension was added of ice-cold CER II and centrifuged in order to obtain supernatant cytoplasmic extract. The residual pellet (nuclear fraction) was suspended in ice-cold NER, incubated on ice, and vortexed several times. Lastly, the samples were centrifuged to obtain supernatant nuclear extract. After protein concentration determination by using PierceTM BCA Protein Assay Kit, nuclear samples were analyzed as described in the case of total protein extracts (Akt, pAkt, Nrf2, and HO-1). The dilution of Histone H3, used to normalize the densitometric values of nuclear Nrf2 [55], was 1:30000.
Hybridization signals were detected with the Odyssey Infrared Imaging System (LI-COR Biosciences, Lincoln, NE, USA). Western blot data were quantified by densitometric analysis (Image J software) of the hybridization signals.

2.7. Statistical Analysis

Graphpad prism (Graphpad software, San Diego, CA, USA) was the software selected to perform the statistical analysis. Normal data distribution was tested using the Jarque–Bera test, before performing the comparison within groups using the one-way analysis of variance (ANOVA) and the Tukey test for multiple comparisons, as the post hoc test. Only two-tailed p-values less than 0.05 were considered statistically significant.

3. Results

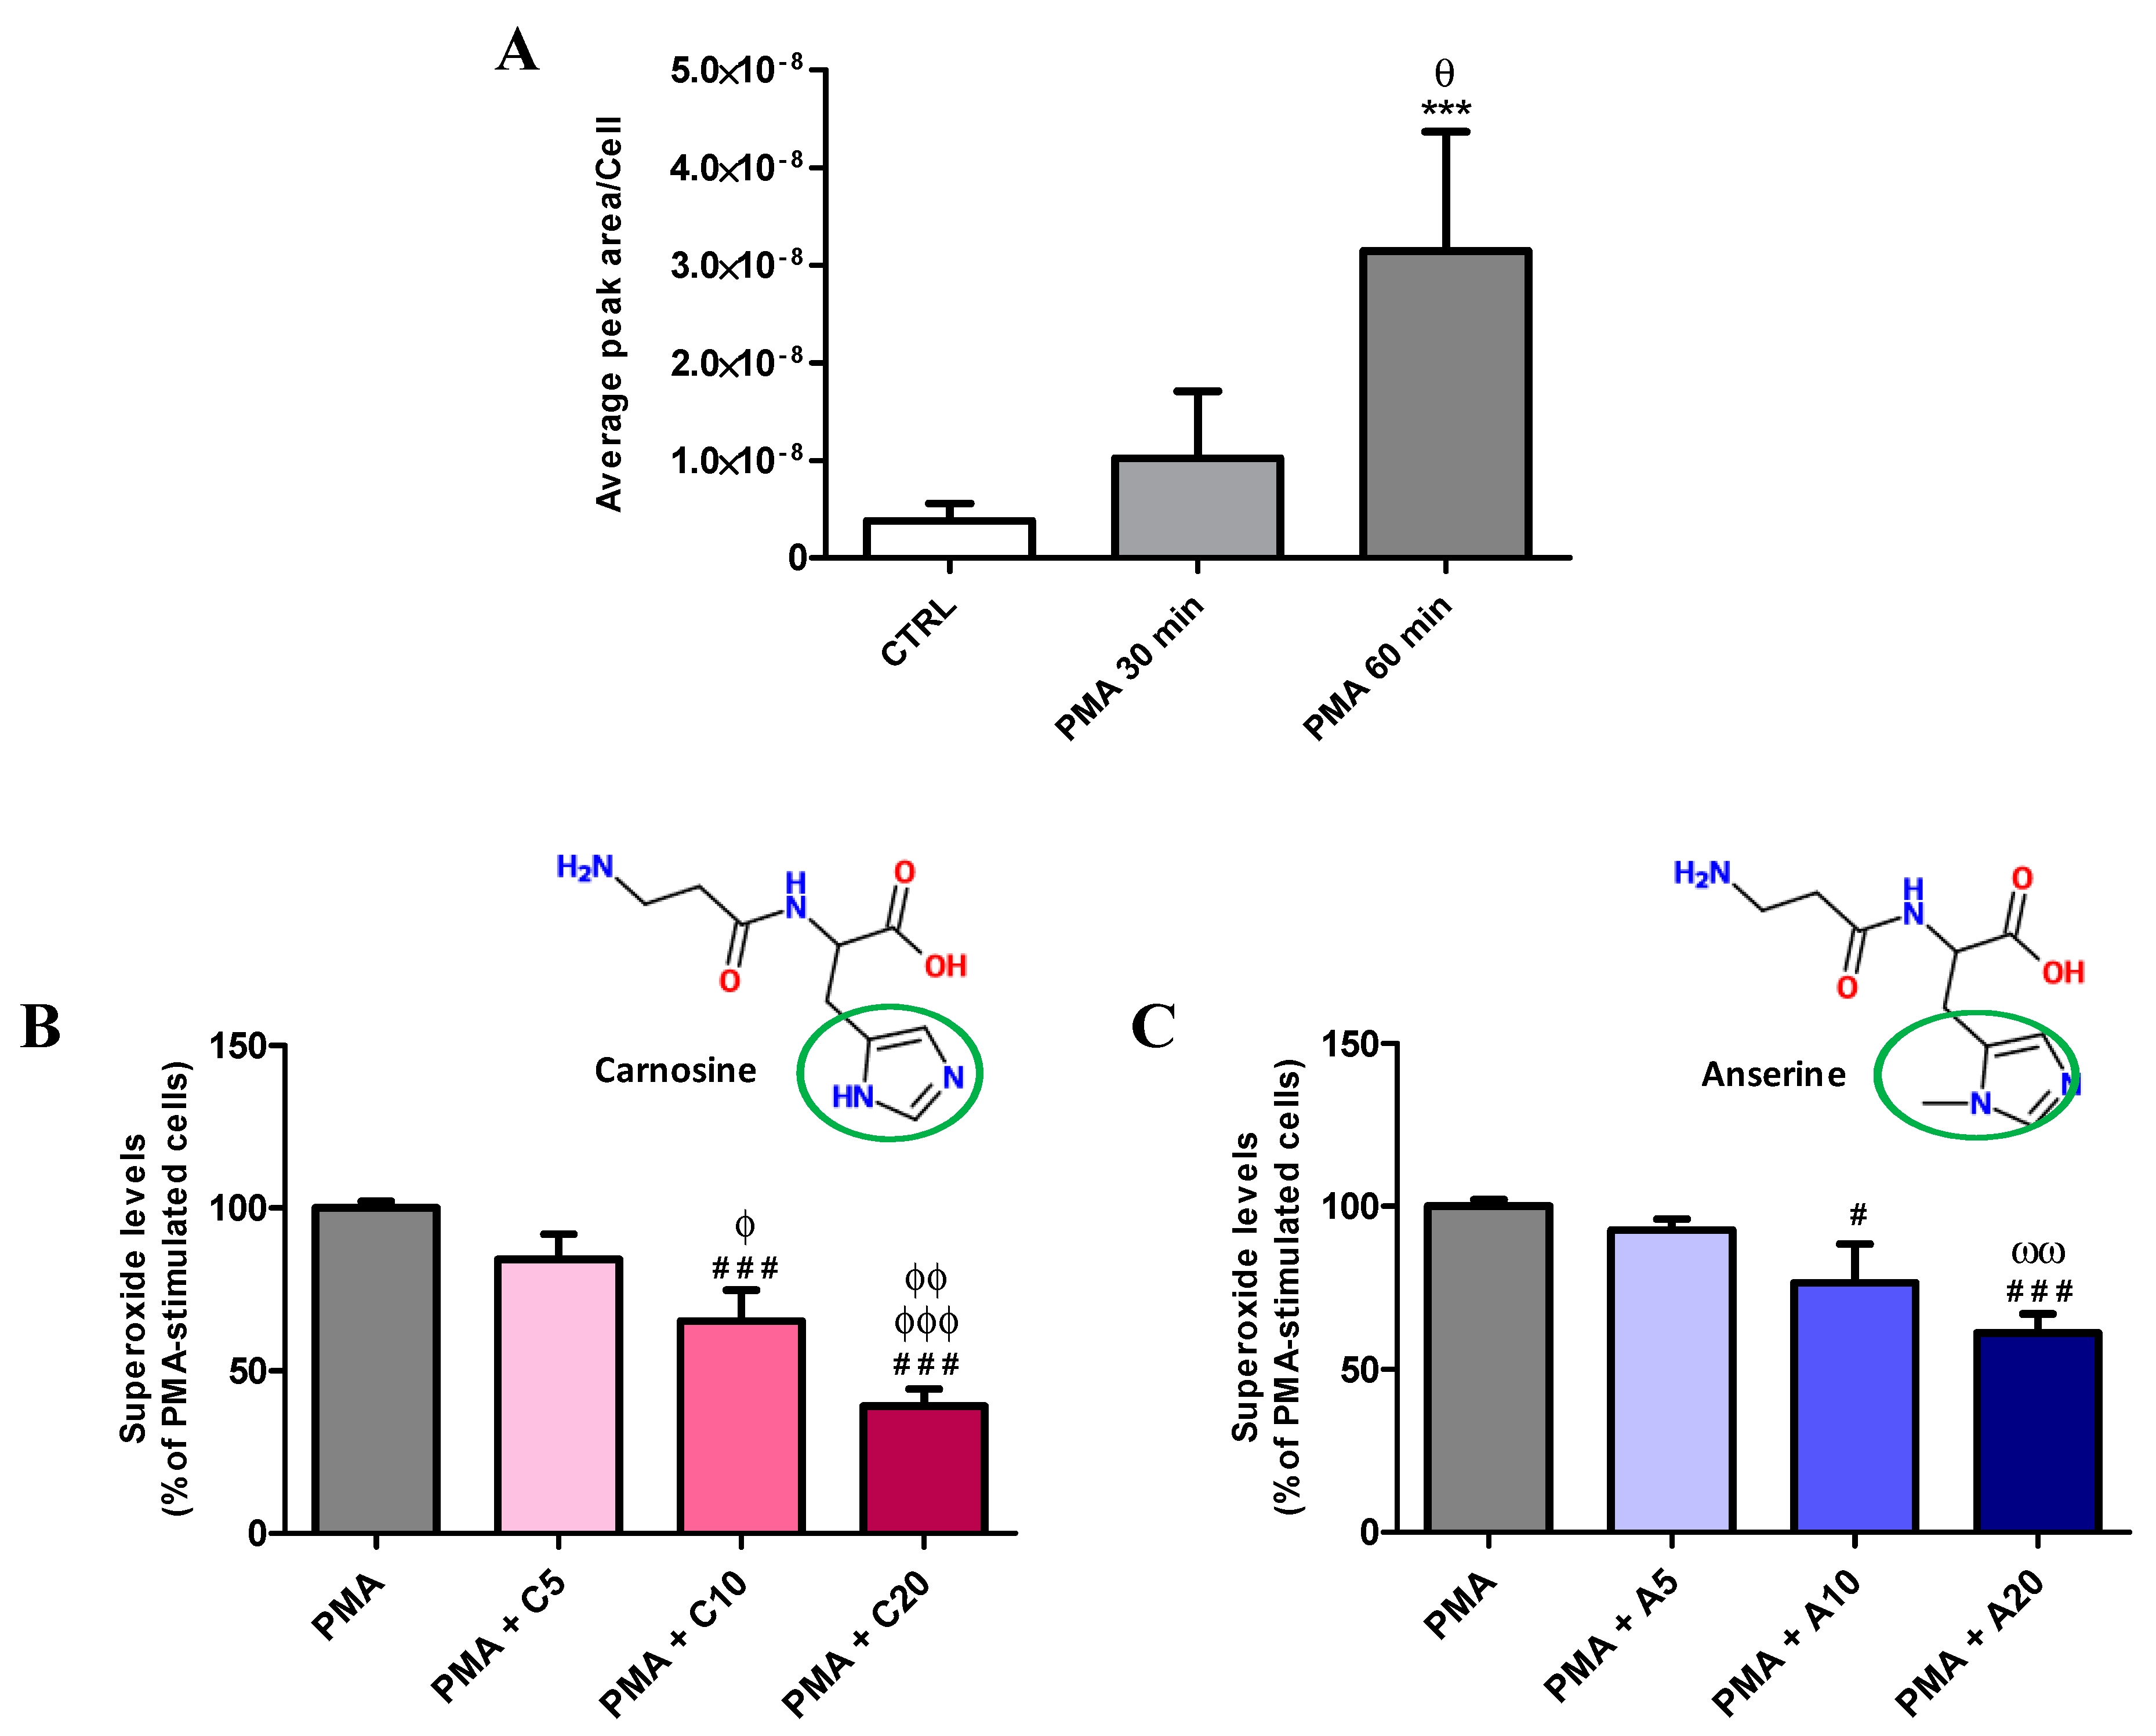
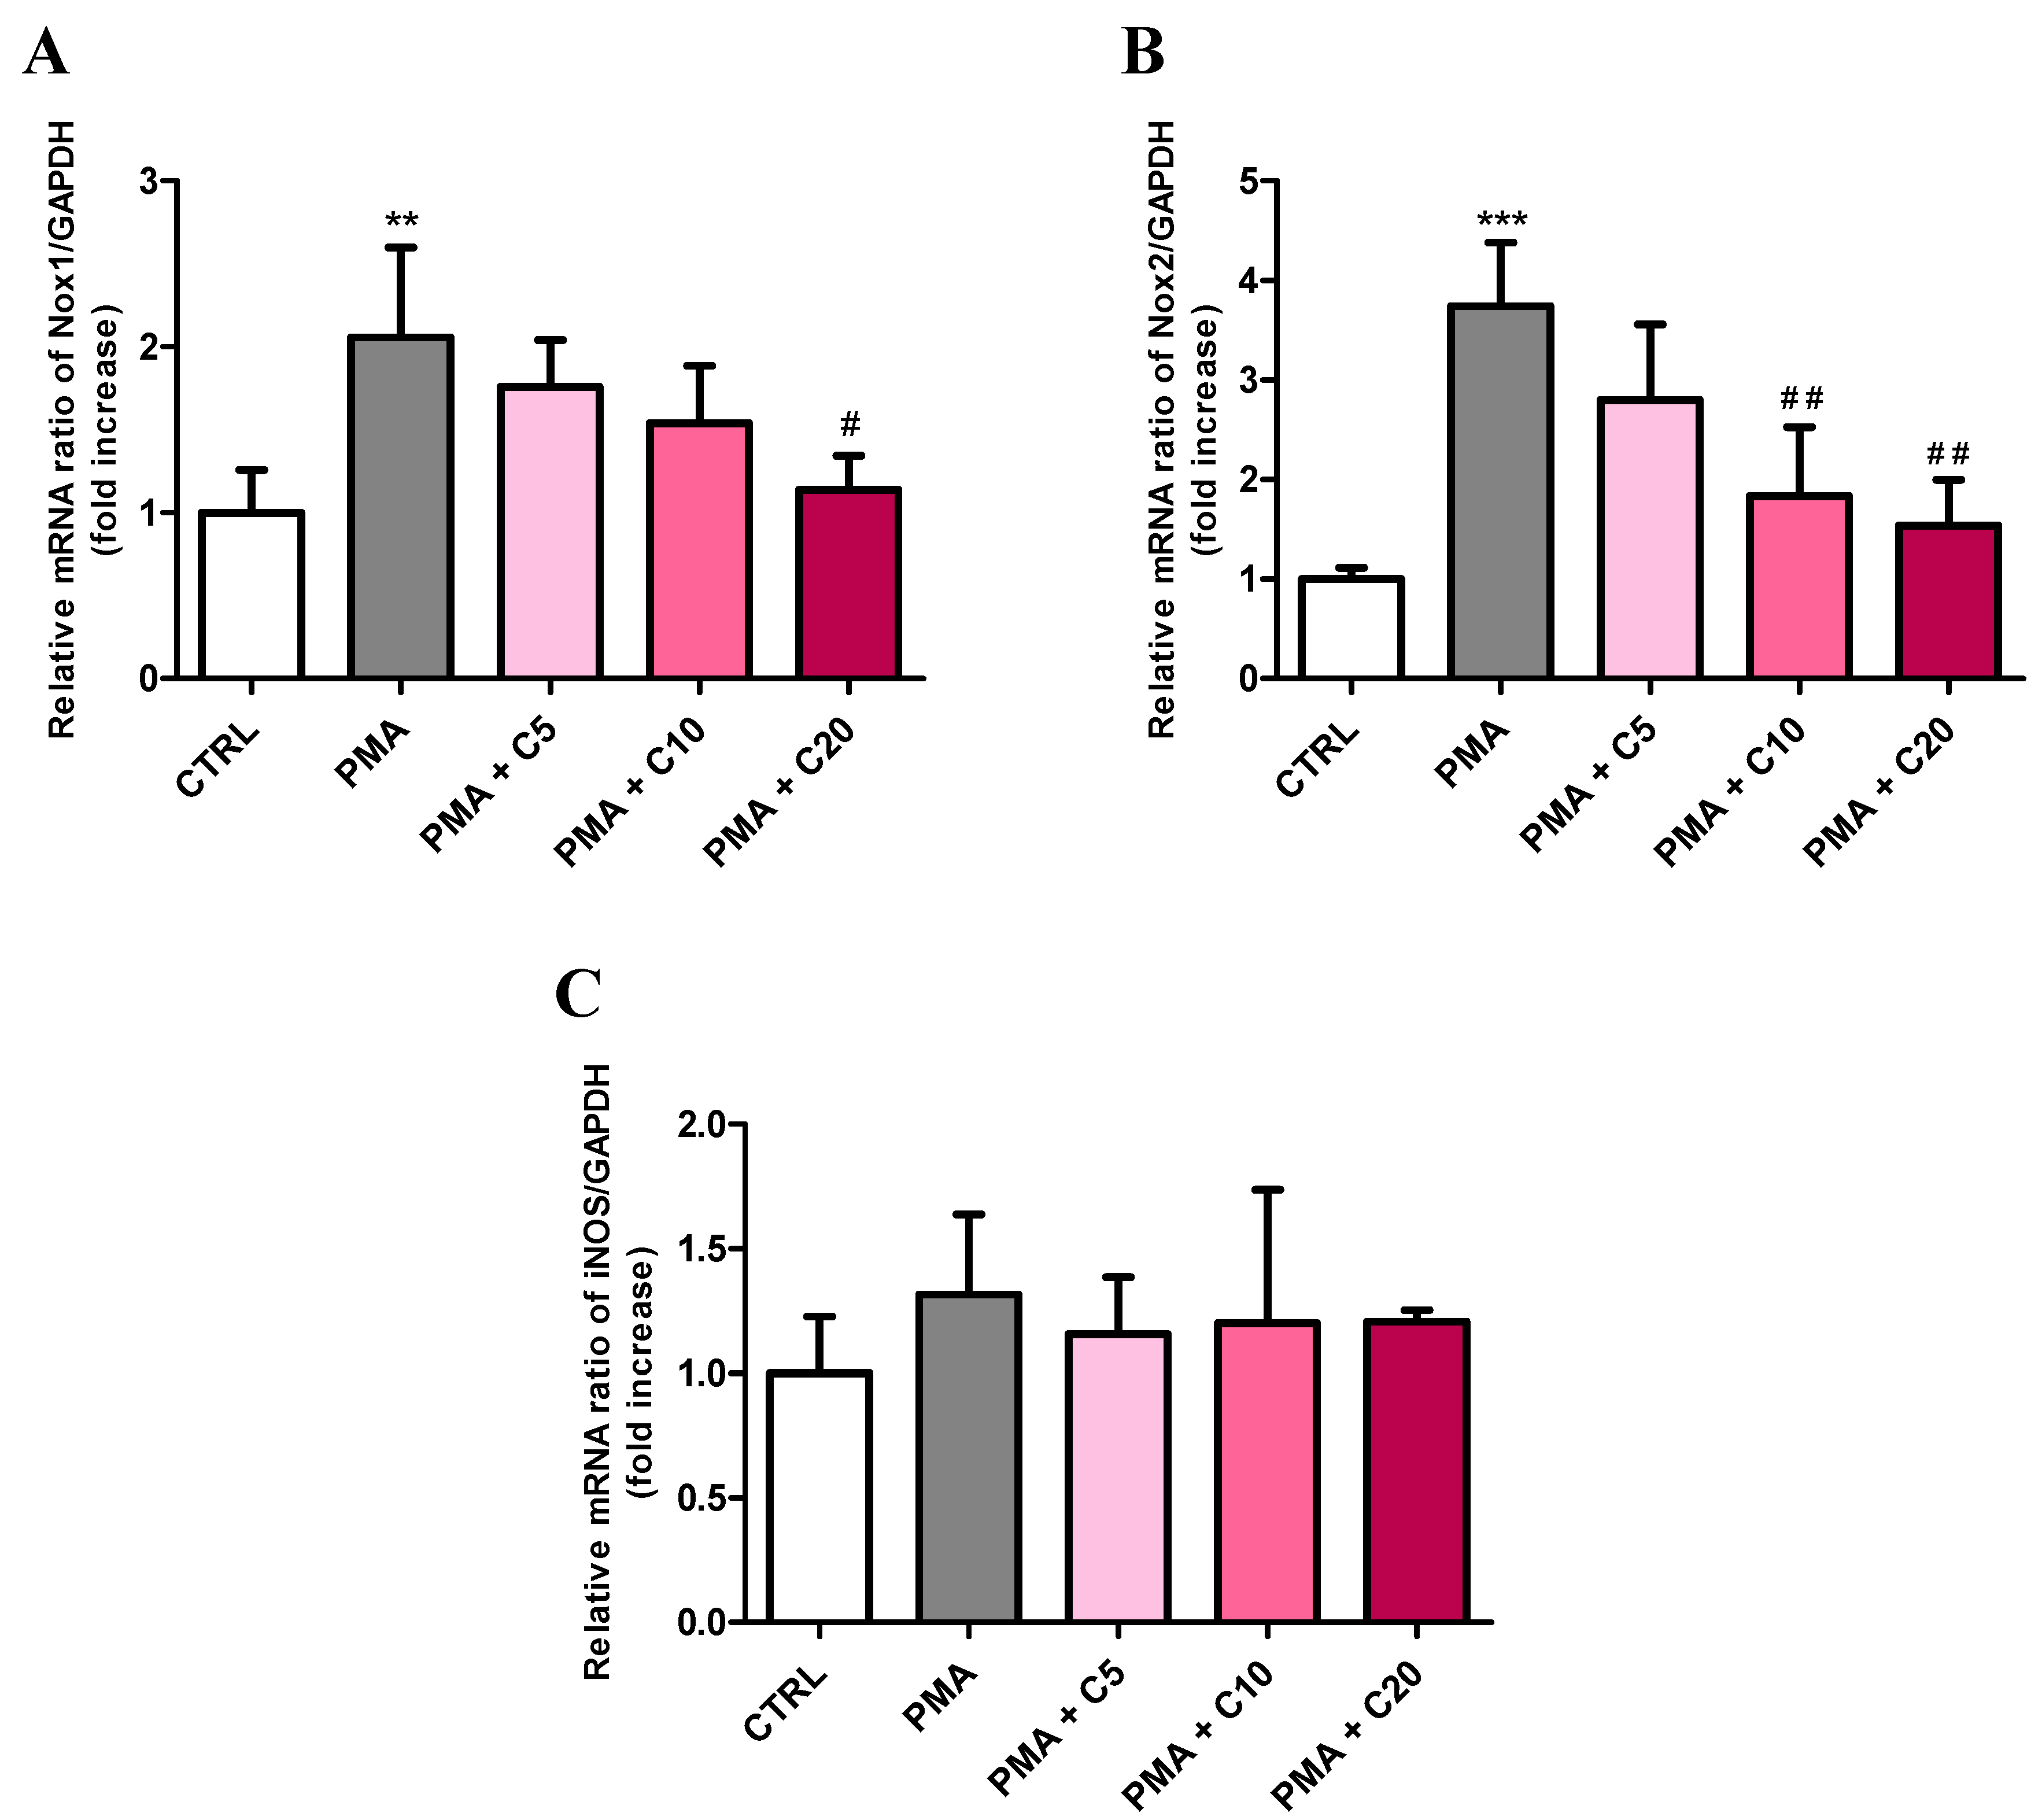
3.1. Carnosine Effects on PMA-Induced O2• Production in Cultured Macrophages

Before monitoring the effects of carnosine or its methylated analogue anserine (5, 10, or 20 mM, indicated in each figure as C5, C10, C20, or A5, A10, A20, respectively), we first investigated the effects of acute stimulations of RAW 264.7 macrophages with 1 µg/mL PMA for 30 or 60 min on O2• production.
Figure 1A clearly shows the time-dependent increase in O2• production induced by acute stimulation with PMA. The shorter stimulation time (30 min) lead to a ~2.7-fold increase in O2• production compared to control (untreated) cells, while cells stimulated for the longer time (60 min) had a further remarkable increase in O2• production compared to both 30-min stimulation (~3.1-fold increase, p < 0.01) and controls (~8.3-fold increase, p < 0.001).
Once the optimal cell stimulation protocol was established (60 min stimulation with 1 µg/mL PMA), the effects of increasing carnosine and anserine (5, 10, or 20 mM) on intracellular O2• levels in stimulated macrophages were tested. Carnosine decreased O2• production in PMA-stimulated macrophages in a concentration-dependent manner (Figure 1B). Unlike 5 mM carnosine (−13% in O2• production, not significant), the pre-treatment with 10 mM (−30%, p < 0.001 vs. PMA; −17%, p < 0.05 vs. PMA + C5) or 20 mM carnosine (−62%, p < 0.001 vs. PMA; −49%, p < 0.001 vs. PMA + C5; −32%, p < 0.01 vs. PMA + C10) led to significant decrease of intracellular O2•. To evaluate the impact of the freedom of the imidazole ring on the decrease of O2• levels we have replicated the experiment using anserine instead of carnosine. As observed for carnosine, the pre-treatment with anserine decreased O2• production in PMA-stimulated RAW 264.7 macrophages (Figure 1C). The pre-treatment with 5 mM anserine did not affect the O2• levels (−8%, not significative), while both 10 mM (−24%, p < 0.05 vs. PMA) and 20 mM (−39%, p < 0.001 vs. PMA; −31%, p < 0.01 vs. PMA + A5) significantly decreased O2• levels. It is however worth underlining that each anserine concentration tested was less effective than the corresponding concentration of carnosine. In particular, 20 mM carnosine caused 1.6 times stronger decrease in O2• levels (−62%) compared to the same concentration of its methylated analogue anserine (−39%, p < 0.01 compared to 20 mM carnosine).

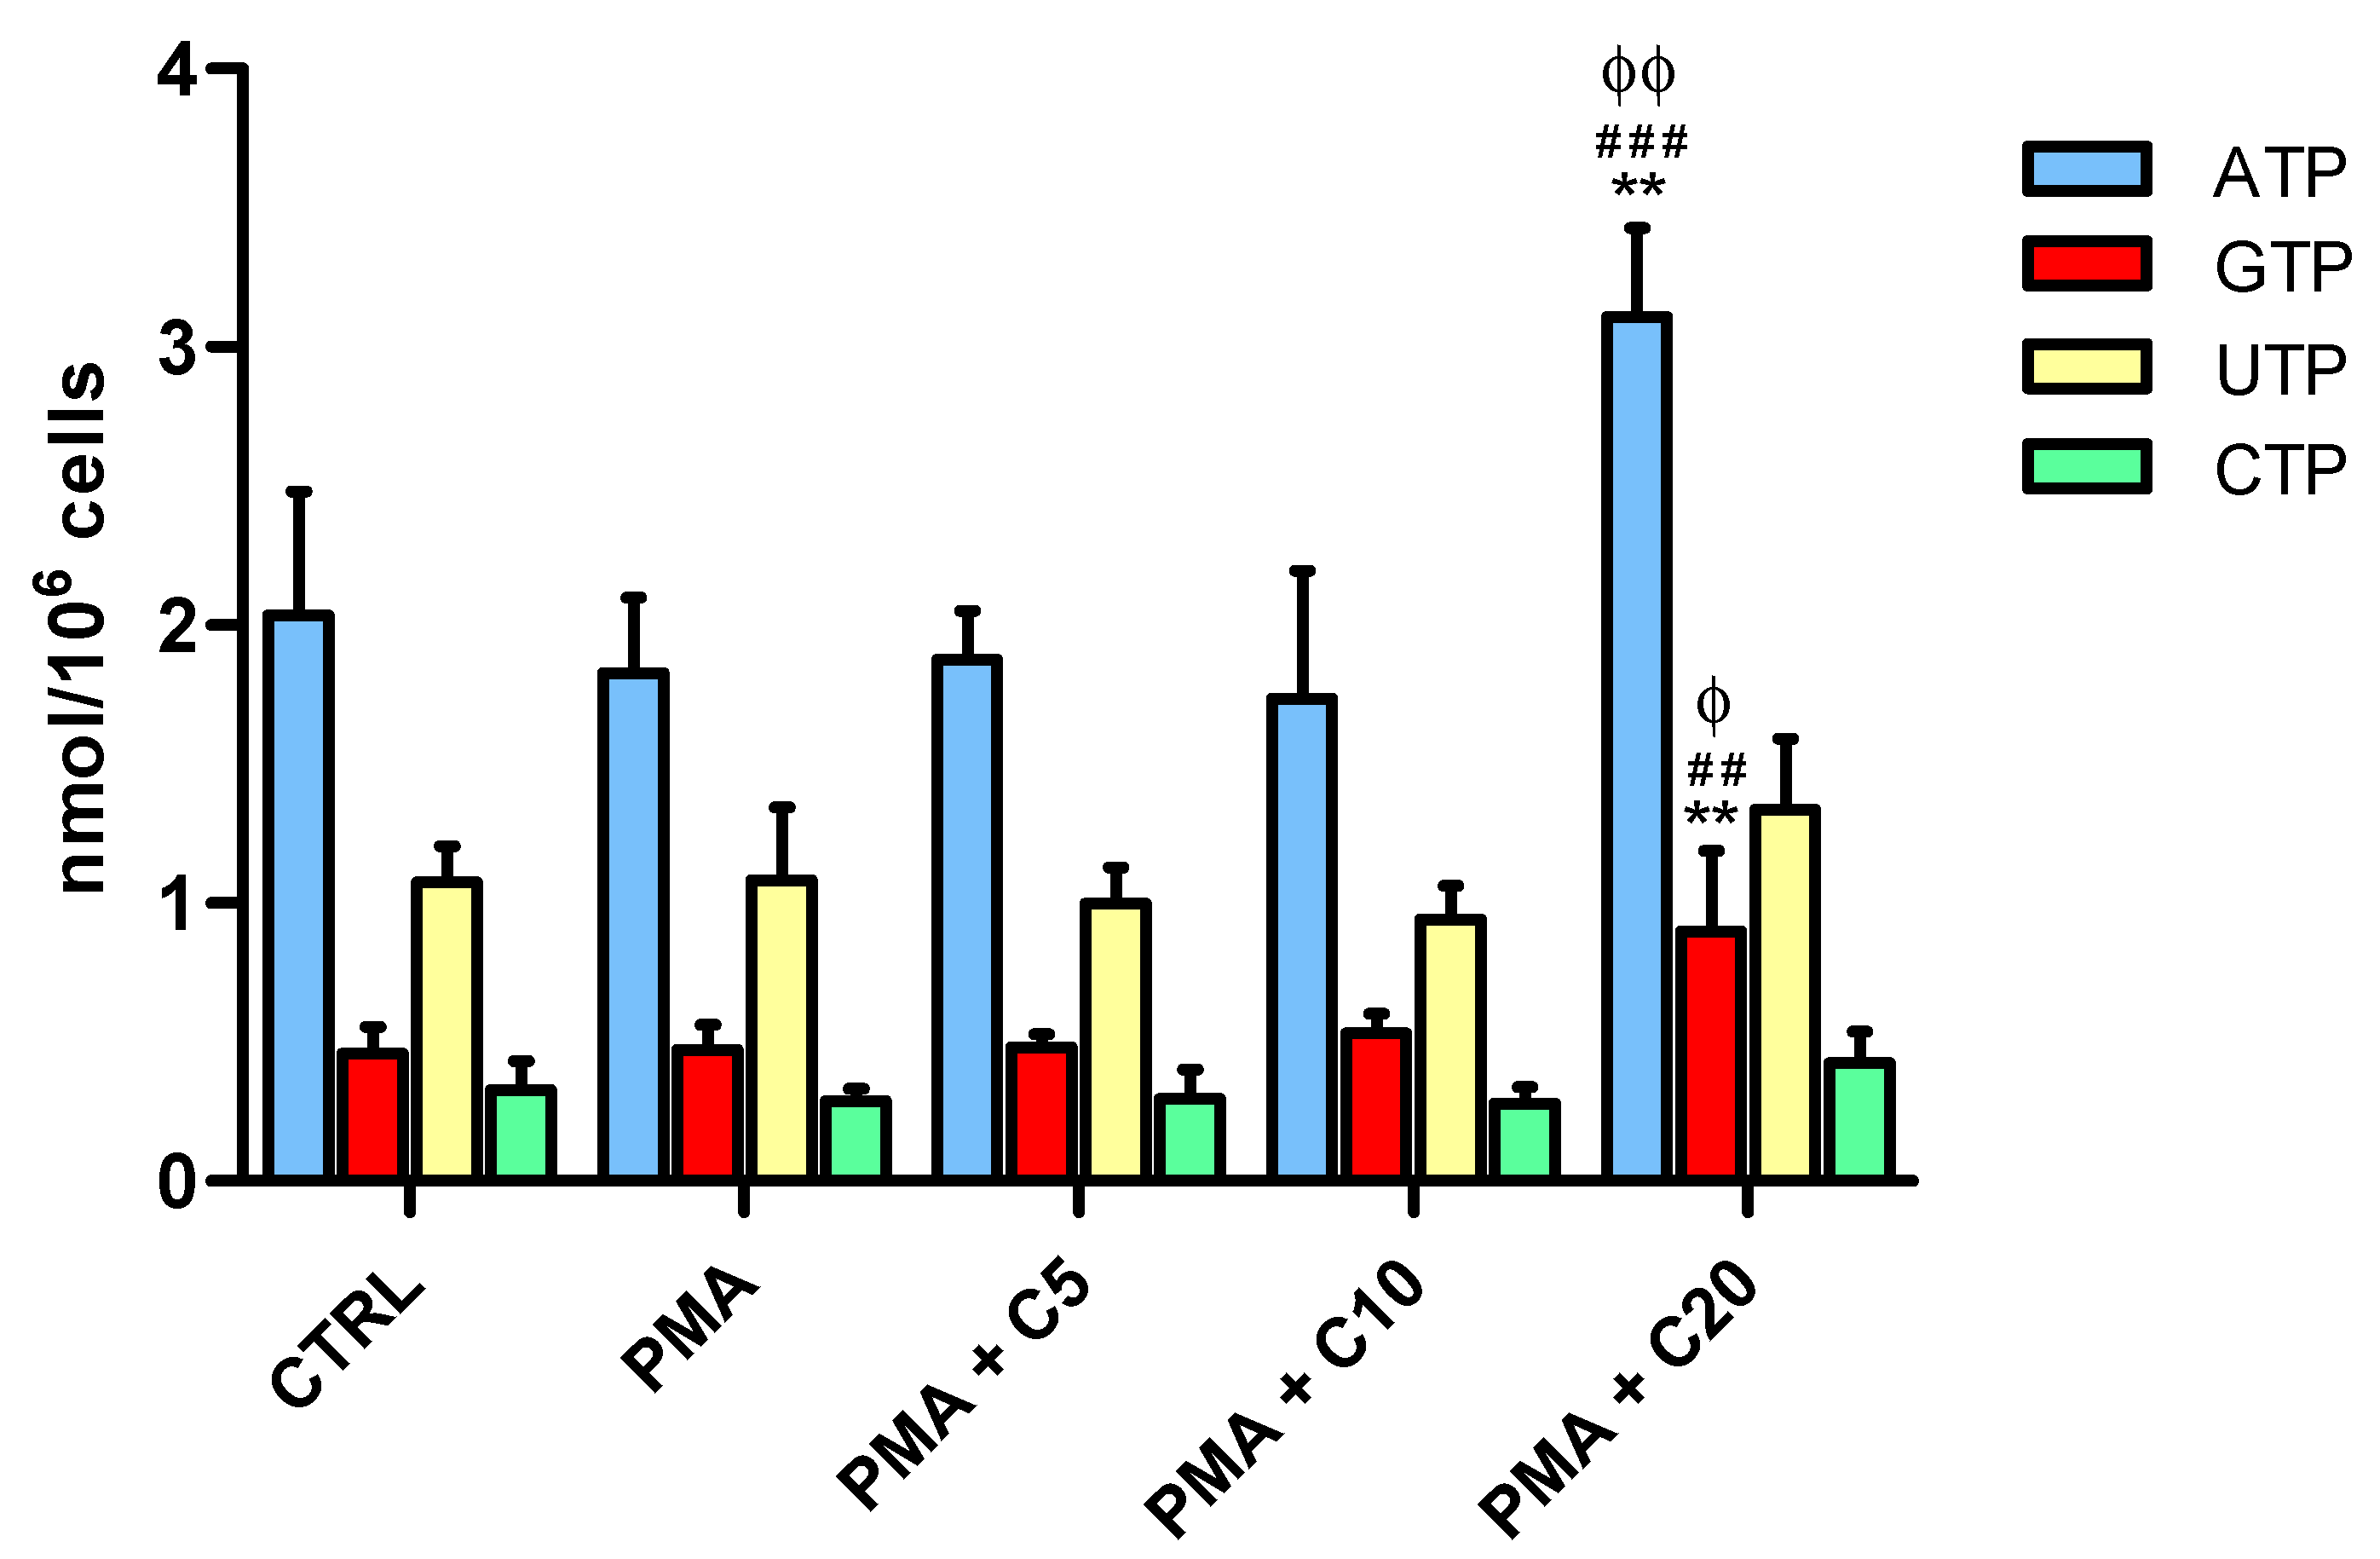
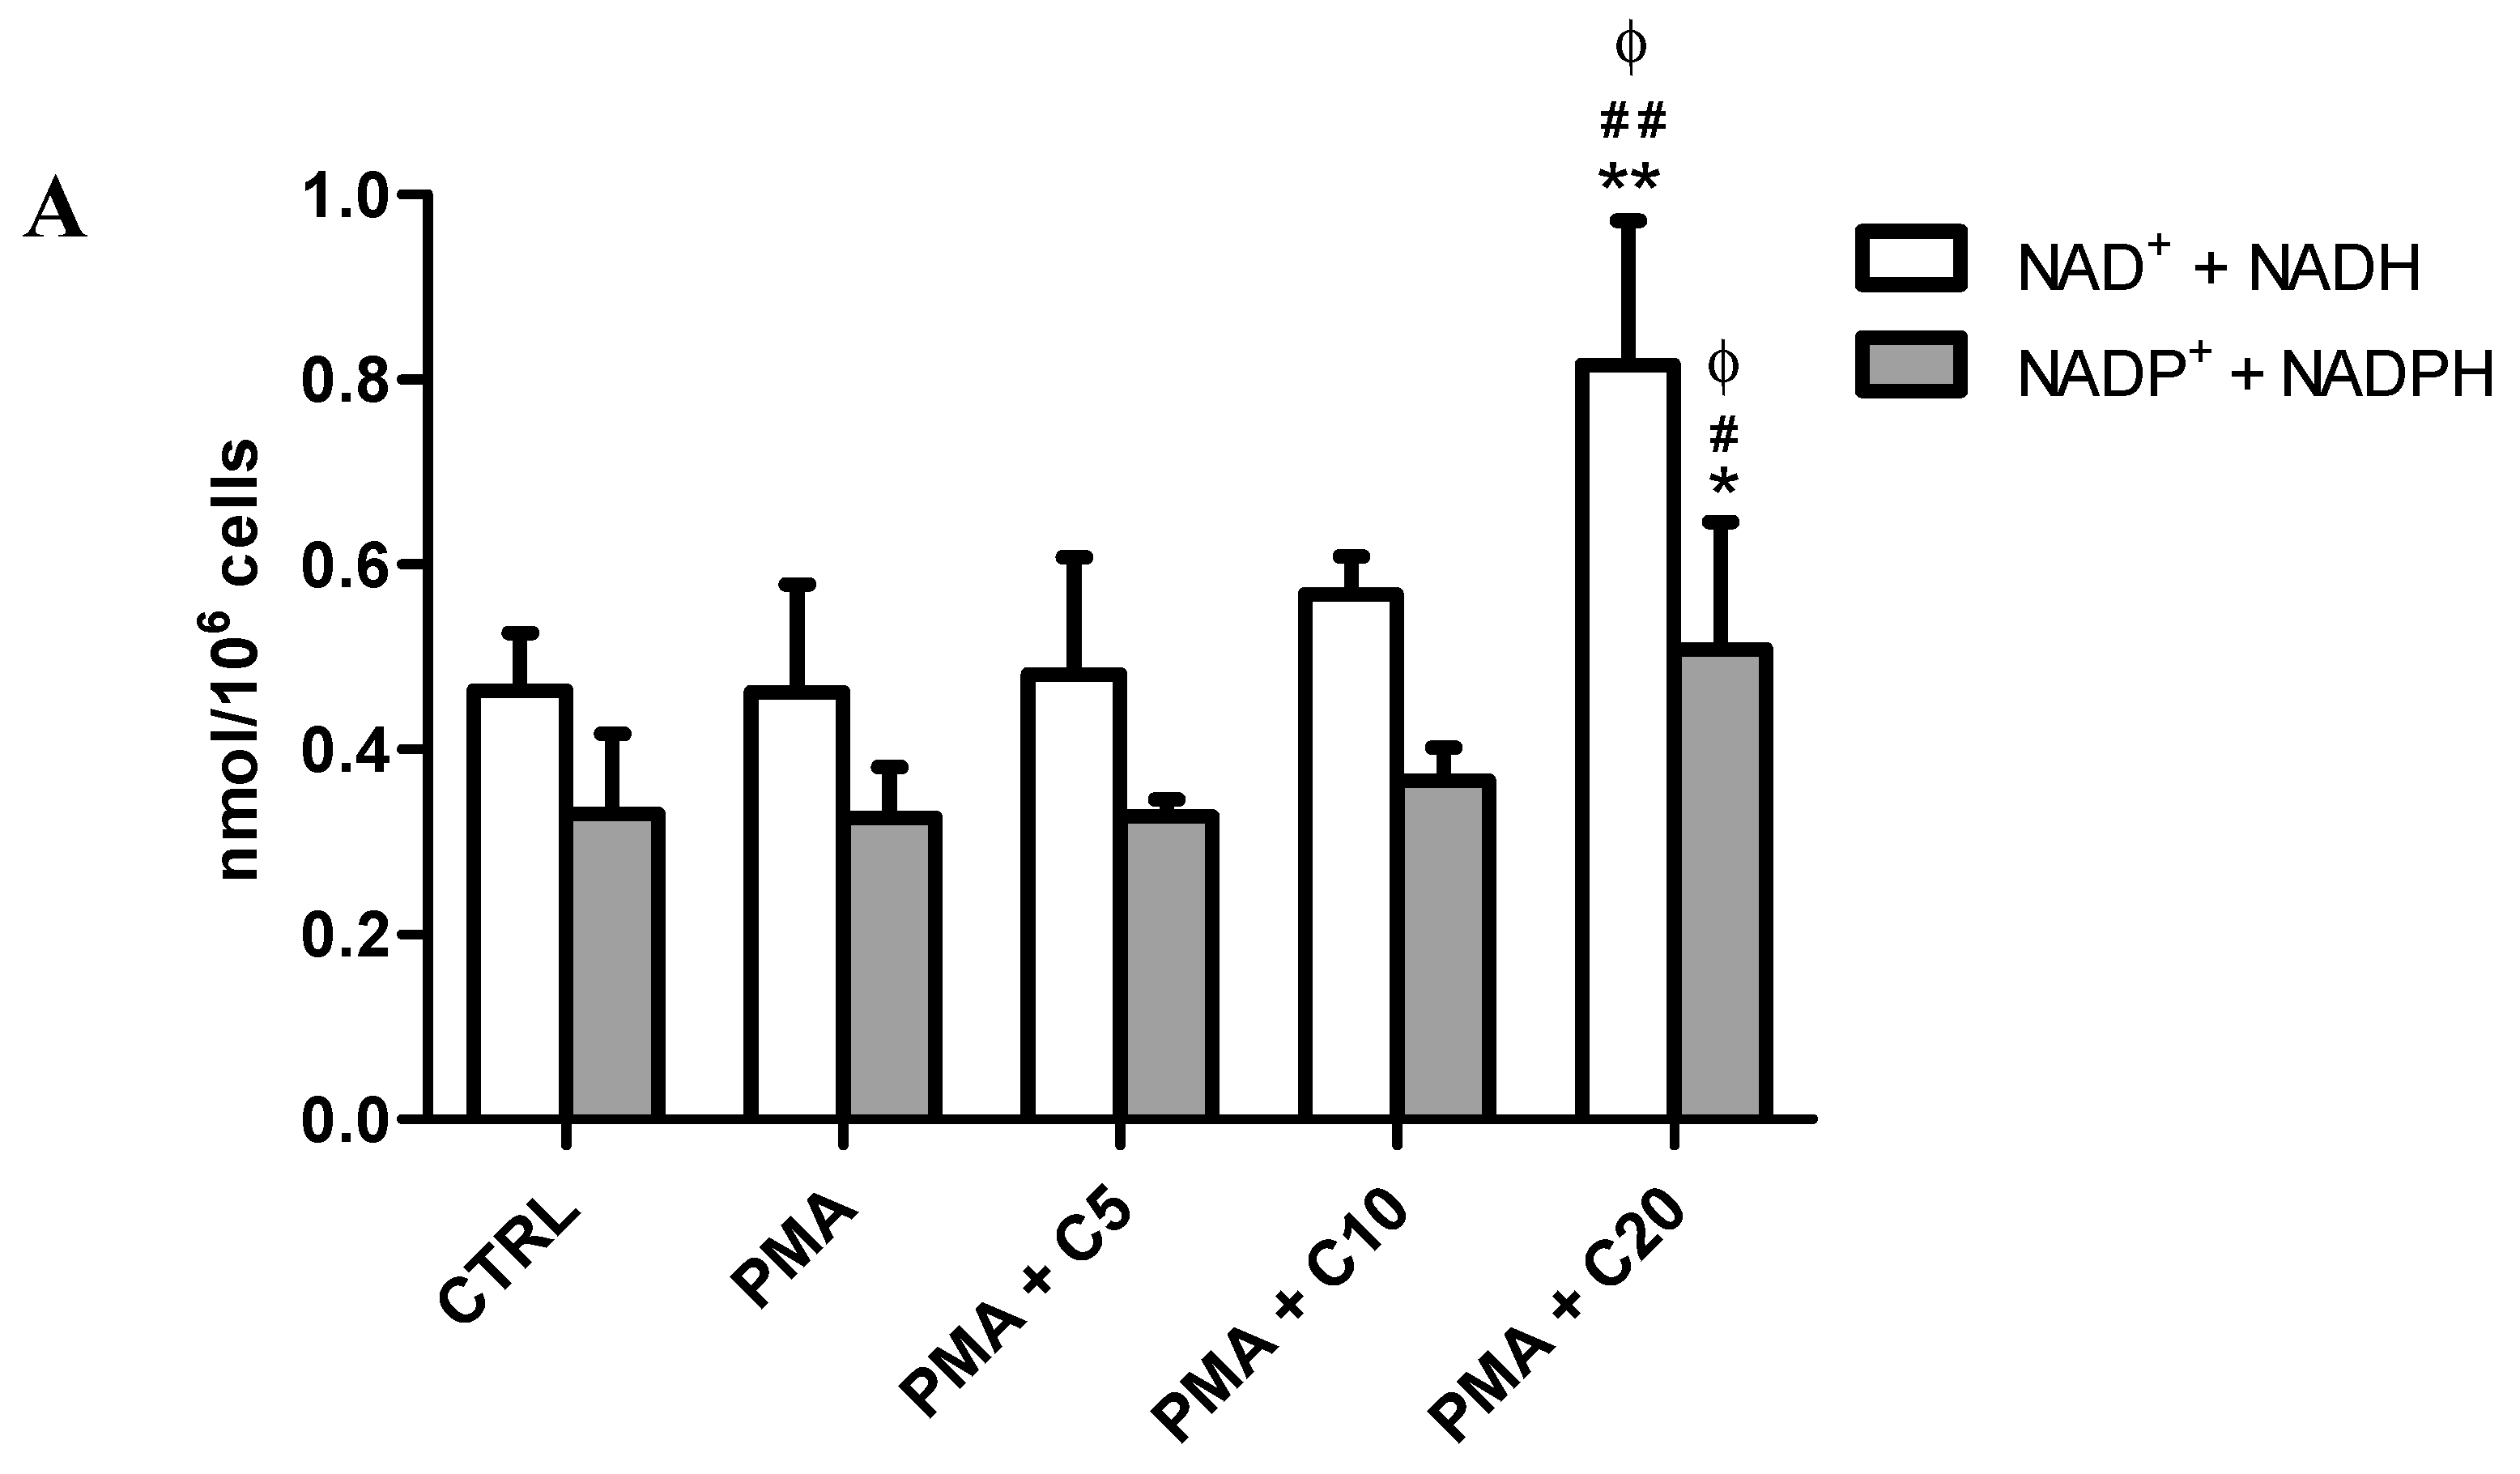
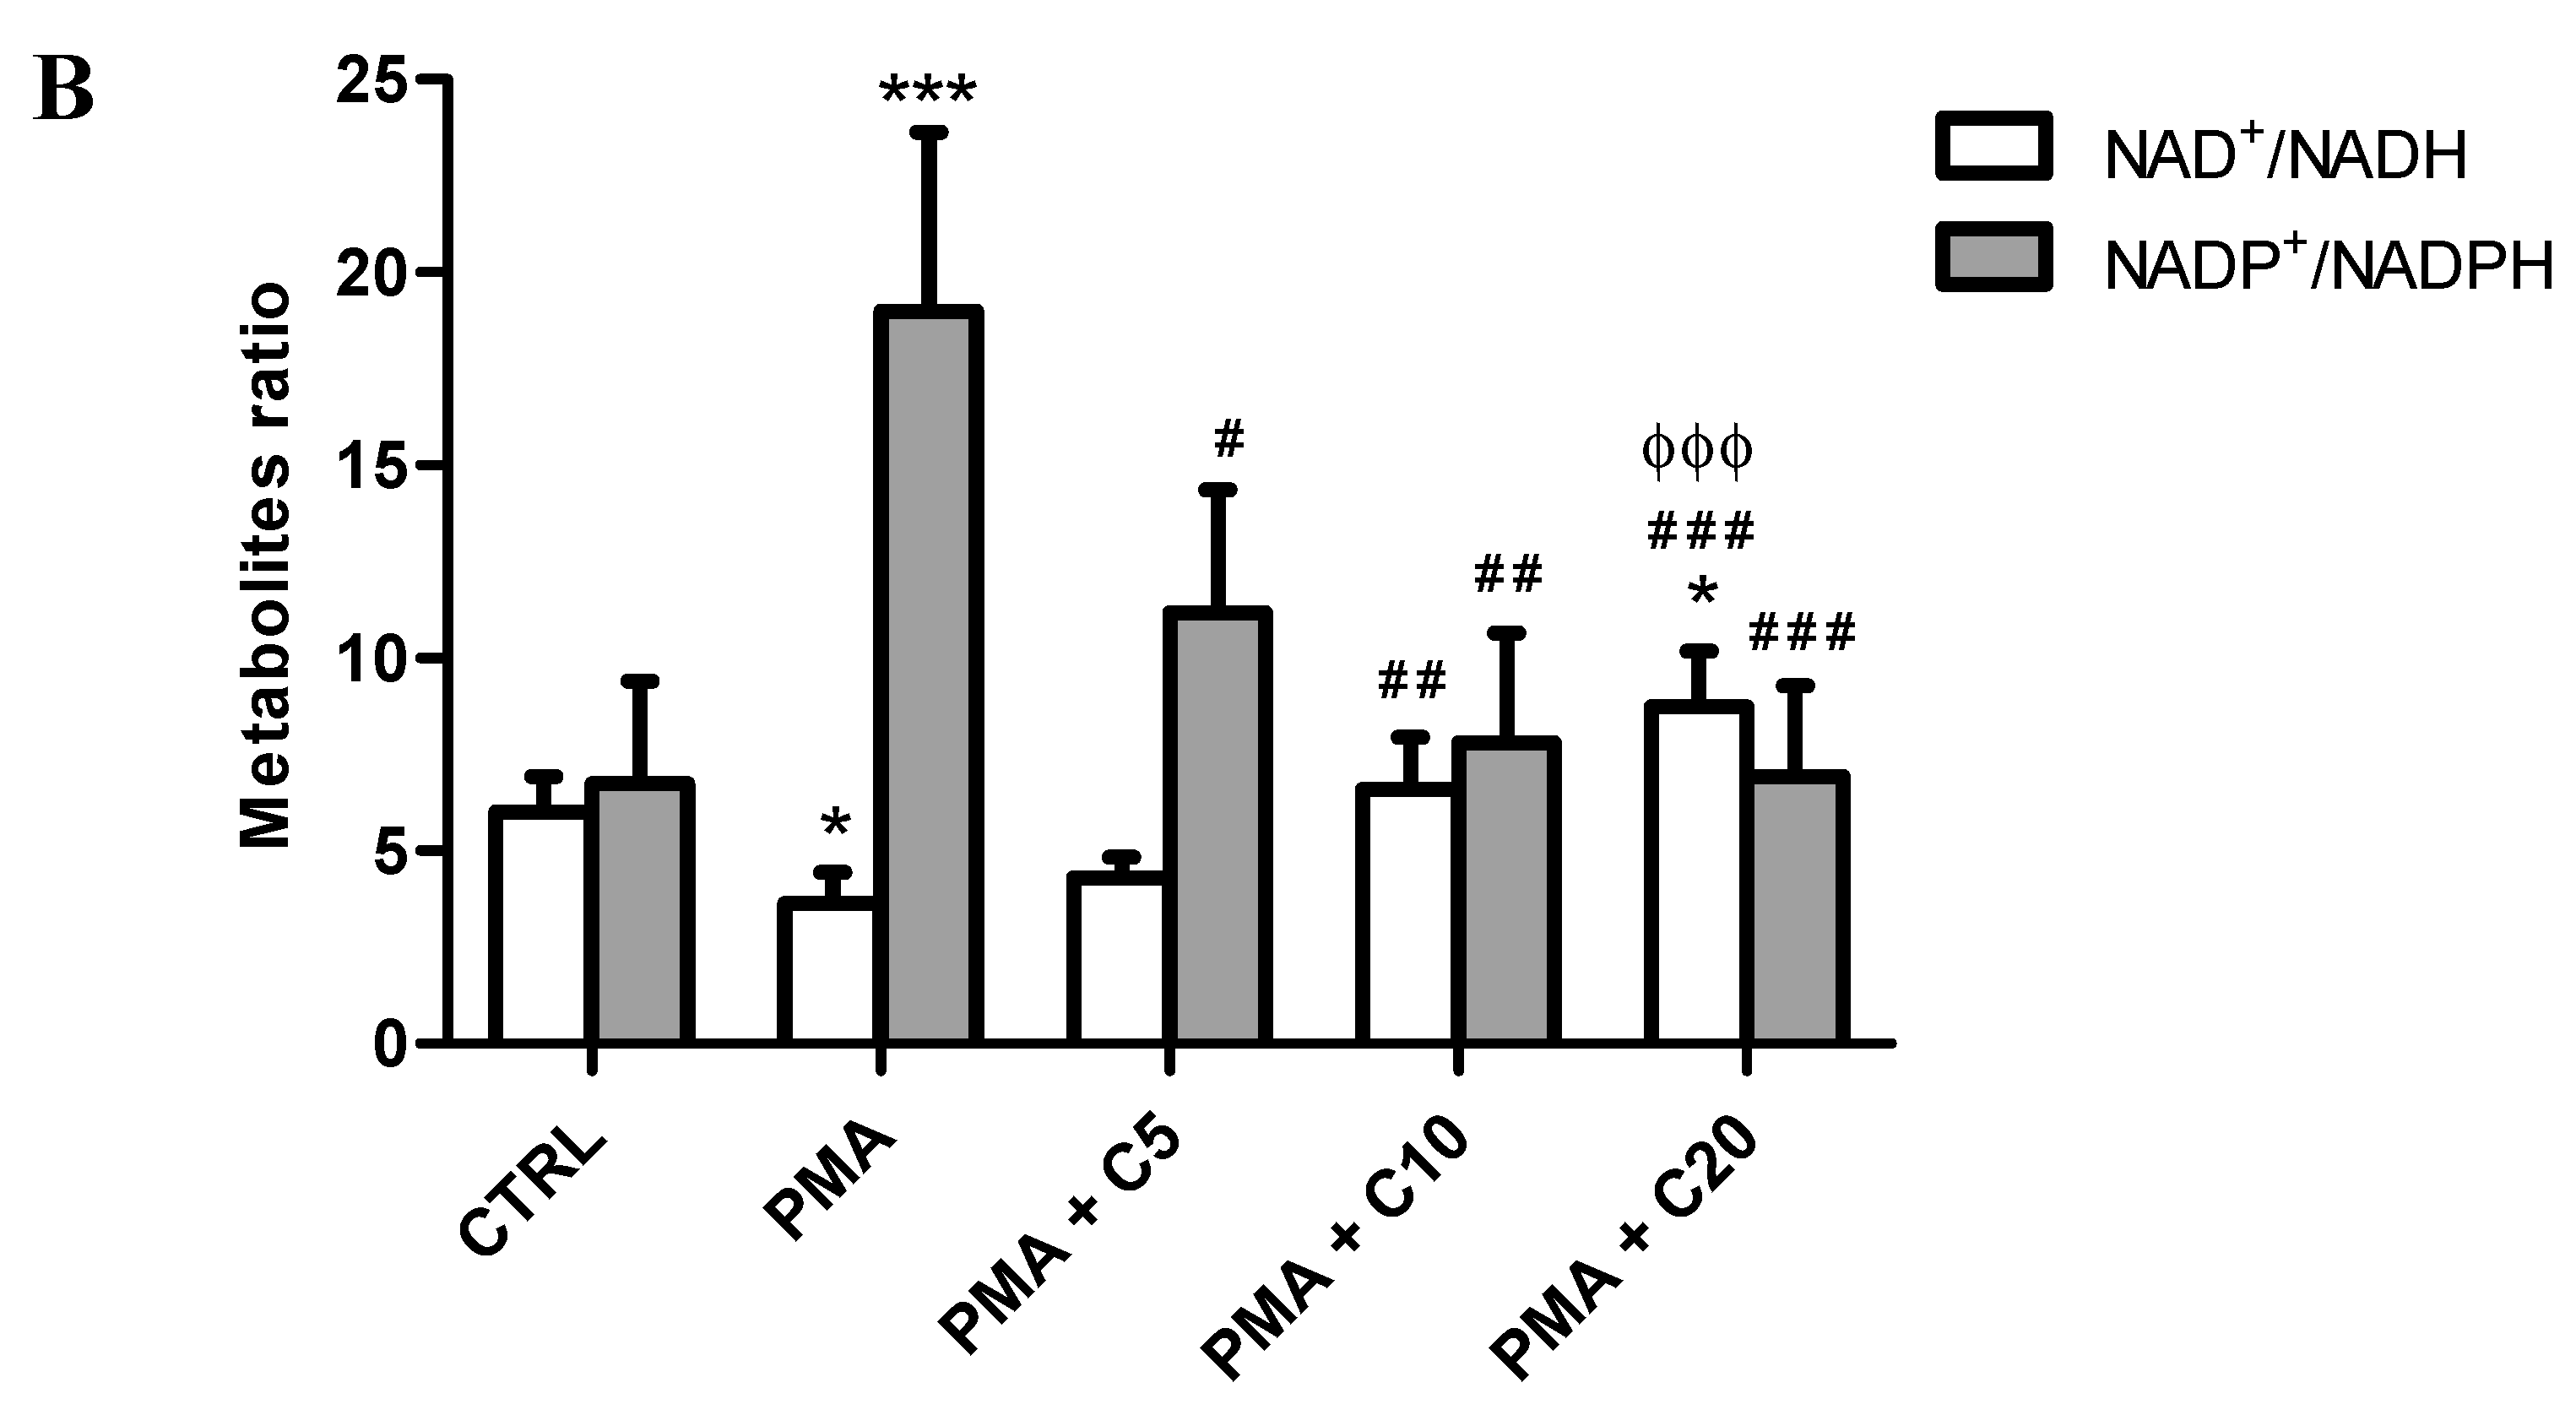
3.2. Influence of Carnosine on Energy Metabolism of Cultured Macrophages

In Figure 2, the results show the effects of PMA and SOD inhibitors in absence or presence of increasing concentrations of carnosine (5, 10, or 20 mM) on energy metabolites concentrations (ATP, GTP, UTP, and CTP) of RAW 264.7 macrophages.
The short incubation time with PMA did not cause changes in any of these compounds. Similarly, 5 or 10 mM carnosine had no effects on the nucleoside triphosphates considered. Interestingly, 24 h incubation with 20 mM carnosine before PMA challenge induced a significant increase in both ATP (3.10 ± 0.32 nmol/106 cells, p < 0.01 vs. CTRL; p < 0.001 vs. PMA; p < 0.01 vs. PMA + C5 or C10) and GTP (0.89 ± 0.29 nmol/106 cells, p < 0.01 vs. CTRL; p < 0.01 vs. PMA; p < 0.05 vs. PMA + C5 or C10), while no effect was observed for UTP (1.33 ± 0.25 nmol/106 cells) and CTP (0.42 ± 0.11 nmol/106 cells). The total amount of nucleoside triphosphates (ATP + GTP + UTP + CTP) was 3.89 nmol/106 cells in control (untreated) cells and increased up to 5.76 nmol/106 cells (+47.9%) in PMA + 20 mM carnosine-treated cells. Overall these data show a reinforcement of the cellular phosphorylating capacity following the addition of 20 mM carnosine to macrophages before PMA challenge.
In the same experimental conditions, we evaluated the levels of intracellular nicotinic coenzymes (NAD+ + NADH and NADP+ + NADPH) (Figure 3A).
The sum of NAD+ + NADH, as well as that of NADP+ + NADPH, were not significantly affected at any experimental conditions excepted for the PMA + C20 treatment. Indeed, significant increases in both NAD+ + NADH (0.82 ± 0.16 nmol/106 cells, p < 0.01 vs. CTRL; p < 0.01 vs. PMA; p < 0.05 vs. PMA + C5 or C10) and NADP+ + NADPH (0.51 ± 0.01 nmol/106 cells, p < 0.05 vs. all other treatments) were observed when using PMA + C20 treatment, indicating a better coenzymatic set for oxido-reductive reactions. The apparent lack of effects of PMA was vice versa manifested when considering the NAD+/NADH and NADP+/NADPH ratio (Figure 3B). PMA caused a 1.65-folds decrease of NAD+/NADH (p < 0.05 vs. CTRL) that did not ameliorate with 5 mM carnosine. Differently, 10 mM carnosine normalized this ratio (not significant vs. CTRL; p < 0.01 vs. PMA) and 20 mM carnosine caused a further increase up to values 1.45- and 2.40-folds higher than control and PMA, respectively (p < 0.05 vs. CTRL; p < 0.001 vs. PMA; p < 0.001 vs. PMA + C5). A different trend was observed when considering the NADP+/NADPH ratio; a 2.81-folds increase was measured for cells treated with PMA and SOD inhibitors only (p < 0.001 vs. CTRL). A dose-response effect was noticed for carnosine treatment, which, at 10 and 20 mM concentrations, normalized the ratio of these nicotinic coenzymes (not significant vs. CTRL; p < 0.01 vs. PMA).

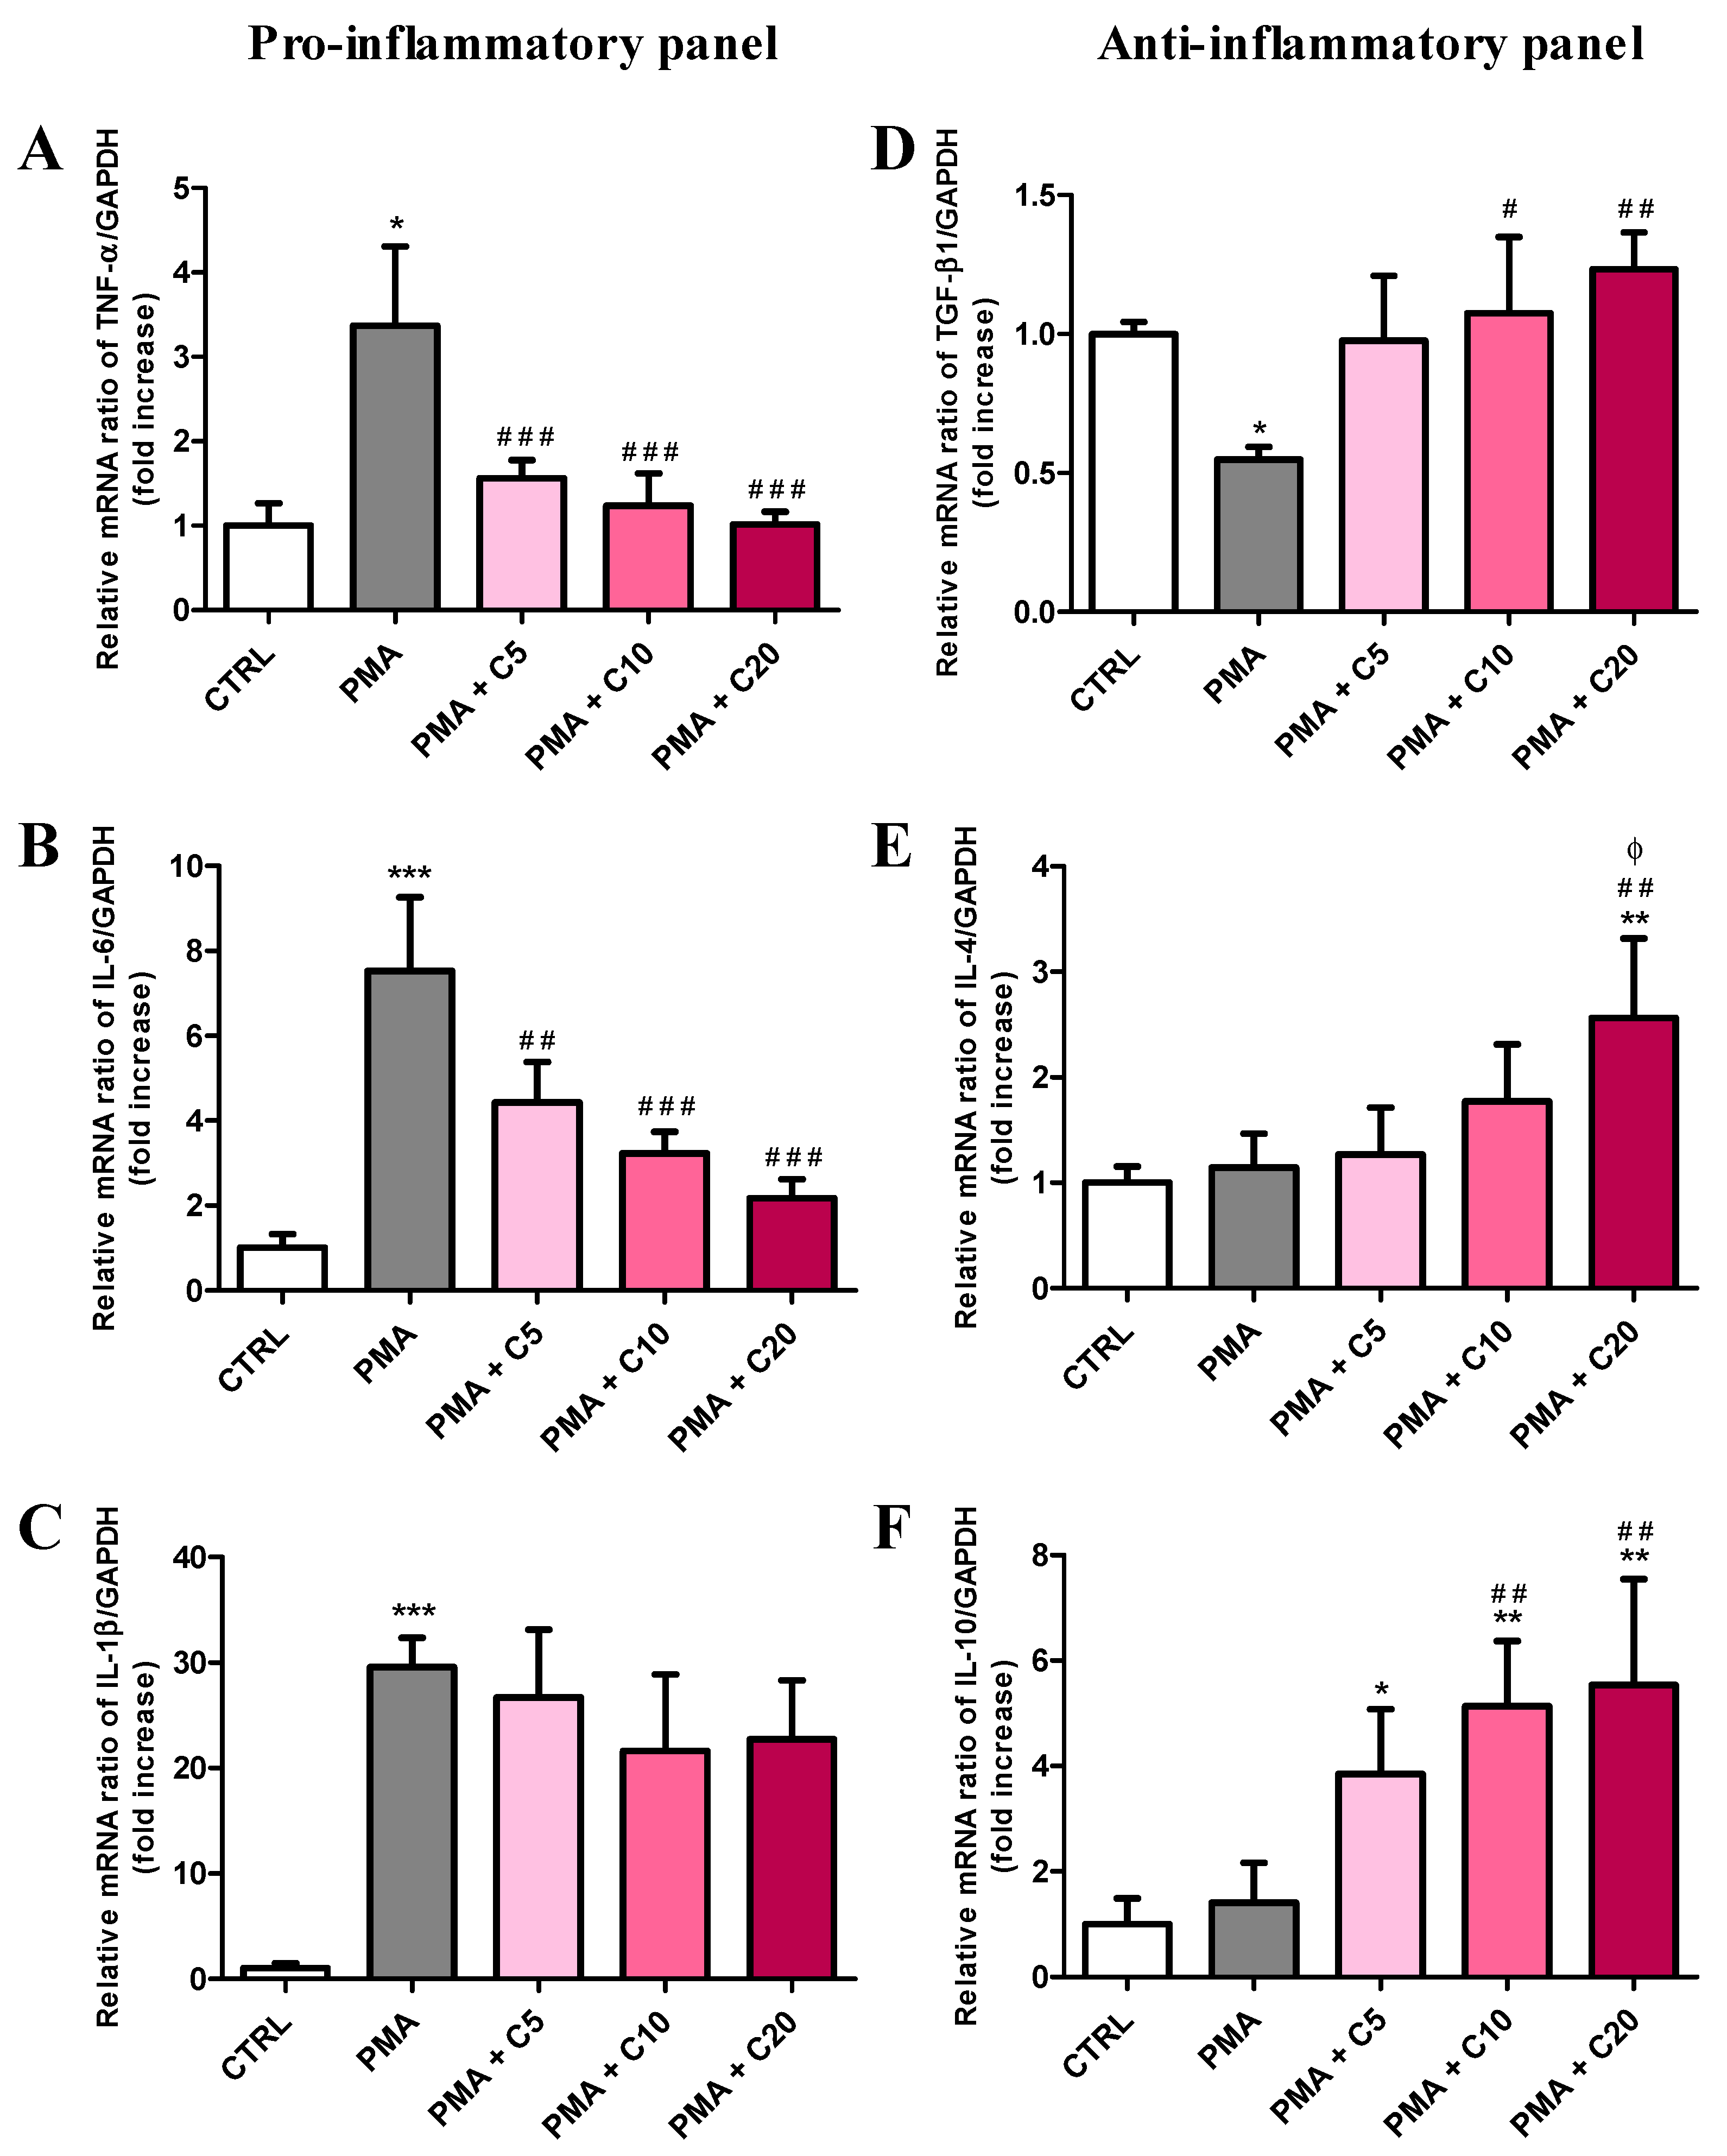
3.3. Carnosine Effects on PMA-Induced Inflammatory Response of Cultured Macrophages

Since the treatment of RAW 264.7 macrophages with carnosine decreased the PMA-induced O2• production (Figure 1B), we assessed the ability of carnosine to modulate the expression of Nox1 and Nox2 as well as that of iNOS enzyme and the genes responsible for the transcription of pro- (TNF-α, IL-6, and IL-1β) and anti-inflammatory (TGF-β1, IL-4, and IL-10) cytokines in PMA-stimulated macrophages. As expected, the expression level of Nox1 (+2.05-folds, p < 0.01 vs. CTRL) and Nox2 (+3.74-folds, p < 0.001 vs. CTRL) mRNAs was significantly increased following PMA treatment (Figure 4A,B).
Among the three carnosine concentrations used in our study, the highest concentration (20 mM) was able to significantly decrease PMA-induced Nox1 activation (p < 0.05 vs. PMA), restoring values not significantly different from those determined in controls. Both 10 and 20 mM carnosine effectively decreased PMA-induced overexpression of Nox2 (p < 0.01 vs. PMA for both of them). The treatment of RAW 264.7 macrophages with PMA, in presence or absence of increasing concentration of carnosine did not significantly affect mRNA iNOS expression (Figure 4C).
Figure 5 shows the expression of genes related to the production of pro- (A–C) and anti-inflammatory (D–F) cytokines in resting (control) RAW 264.7 macrophages and in macrophages stimulated with PMA and SOD inhibitors, in absence or presence of increasing concentrations (5, 10, or 20) of carnosine.
Compared to control cells (Figure 5A–C), PMA treatment significantly increased the expression levels of TNF-α (+3.36-folds, p < 0.05), IL-6 (+7.51-folds, p < 0.001), and IL-1β (+29.56-folds, p < 0.001). Carnosine decreased TNF-α levels in a concentration-dependent manner (p < 0.001 vs. PMA for all carnosine concentrations) up to values equaling those found in controls, when carnosine was used at 10 or 20 mM. A similar trend was observed in the case of IL-6 (p < 0.01 vs. PMA for PMA + C5 and p < 0.001 vs. PMA for PMA + C10 or C20), although IL-6 expression was higher than control even in presence of 20 mM carnosine. Unlike TNF-α and IL-6, carnosine treatment did not significantly decrease the remarkable increased in IL-1β mRNA expression induced by PMA (p < 0.001 vs. CTRL). Significant decrease in the expression levels of TGF-β1 was recorded after the challenge of macrophages with PMA (−0.43-folds, p < 0.05 vs. CTRL)) (Figure 5D). Compared to control cells, PMA stimulation did not affect the production of IL-4 and IL-10 (Figure 5E–F). Each of the three carnosine treatments (5, 10, and 20 mM) was able to restore TGF-β1 expression (Figure 5D), whilst only the 20 mM concentration (Figure 5E) significantly increased IL-4 expression (p < 0.01 vs CTRL; p < 0.01 vs. PMA; p < 0.05 vs. PMA + C5). It is also worth underlining that 10 and 20 mM carnosine significantly increased IL-10 expression (Figure 5F) notwithstanding the stimulation with PMA (p < 0.01 vs. PMA or vs. CTRL).

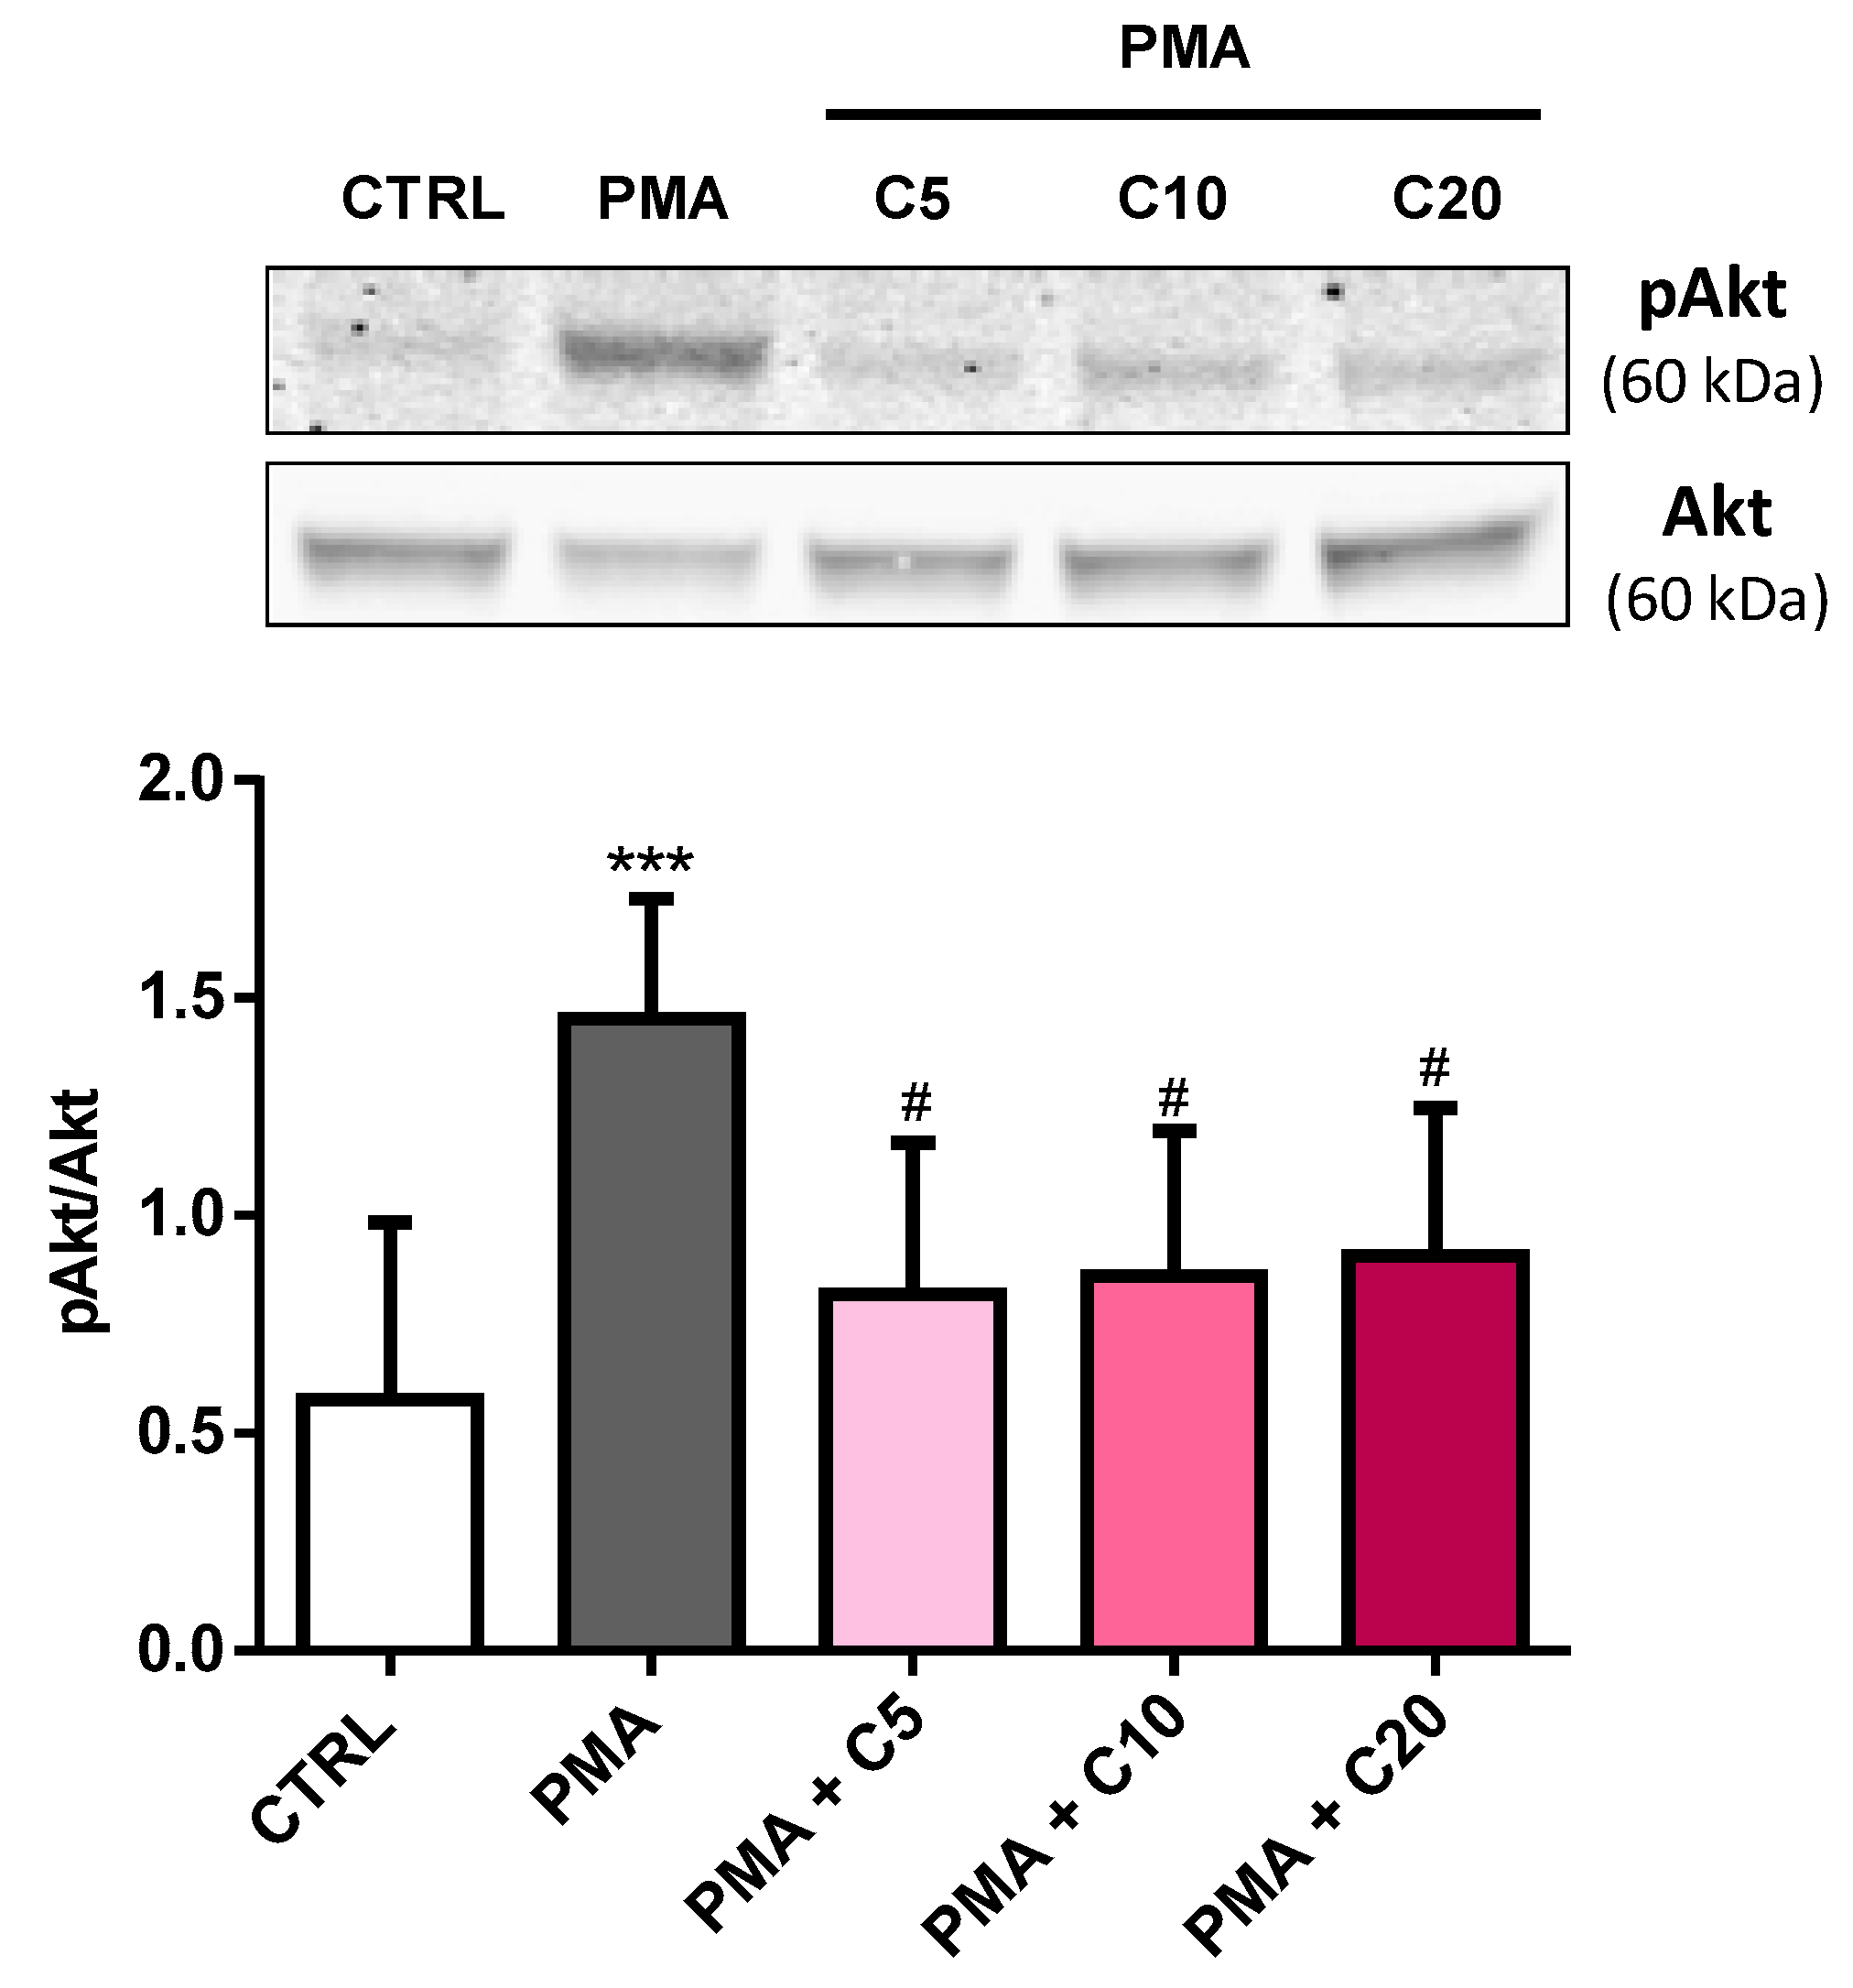
3.4. Carnosine Effects on PMA-Induced Akt Phosphorylation in Cultured Macrophages

To address whether the ability to decrease oxidative stress and inflammation was also connected to other beneficial molecular phenomena, the effect of carnosine pre-treatment on Akt phosphorylation, Nrf2, and HO-1 was studied in PMA-stimulated macrophages. As showed in Figure 6, the stimulation of macrophages with PMA and SOD inhibitors strongly increased the activation of Akt as assessed by immunoblot analysis of phosphorylated-Akt (p(ser473)Akt) (from ~0.6 to ~1.45 pAkt/Akt; p < 0.001 vs. CTRL).
Carnosine was able to significantly attenuate this phenomenon (from ~1.45 to ~0.85 pAkt/Akt, p < 0.05) but no differences were observed between the three concentrations tested.
In the case of Nrf2 (total and nuclear) and HO-1 protein analysis, as it was expected considering the short duration of the stimulation time (60 min), no differences were observed among all the different experimental conditions (Figure S2).

4. Discussion

The connections among oxidative/nitrosative stress, NADPH oxidase and NOS activity, inflammation, and damages to biomolecules have well been characterized in various experimental studies, using macrophages as the typical cell line actively participating to all the aforementioned phenomena [56,57,58,59].
In the present study, using the macrophage RAW 264.7 cell line, we demonstrated that carnosine is a compound effectively interfering with ROS generation, NADPH oxidase expression, and the production of pro- and anti-inflammatory mediators.
We initially explored the production of O2• induced by PMA and SOD inhibitors as well as the antioxidant capacity of carnosine (or its methylated analogue anserine), in the RAW 264.7 macrophage cell line, representing an established in vitro experimental model for studying oxidative stress [1,44,45,46,47]. Among the various protocols tested, we selected an acute stimulation with PMA (60 min) (Figure 1A) giving the best combination of O2• production and cell viability. To test carnosine activity, cells were pre-treated for 24 h with this dipeptide since, according to our previous results, the uptake of carnosine by RAW 264.7 macrophages increases proportionally during this time window, and it is ~3 times higher under stressing conditions [60]. In the present experiments, we found that carnosine was able to decrease the O2• production PMA-induced in a concentration-dependent manner, with maximal effect observed when macrophage cells were pre-treated with 20 mM carnosine (Figure 1B). This specific carnosine feature is likely to be of great benefit in the case of cardiovascular disease, especially in the case of heart failure [61], hypertension and atherosclerosis [62], characterized by excessive production and/or inadequate removal of ROS, especially O2• [63]. Our findings are in agreement with the previously shown carnosine antioxidant activity [38] and its ability to directly interact with different reactive species, decreasing their bioavailability [41,64]. In order to prove that the observed decrease in O2• levels was in part attributable to the H atom of the secondary amine of the imidazole ring of carnosine (easily removable as H. during ROS-mediated oxidation reactions), macrophages were pre-treated with anserine rather than with carnosine. In line with the well-known antioxidant properties of histidine [65,66], anserine, presenting a methyl group replacing H atom of the secondary amine of the histidine ring, was always less effective than carnosine in reducing O2• levels at each concentration tested (Figure 1C). The stronger carnosine activity can in part explain why during clinical studies investigating the potential beneficial effects of dietary anserine/carnosine mixture supplementation on elderly people, anserine is always in excess with respect to carnosine (from 2:1 to 3:1) [67,68,69].
A lot of in vitro and in vivo studies linking carnosine antioxidant activity with its protective features are available [70,71]. In one of them, Tsai and co-workers showed the ability of this dipeptide to protect mice treated with 1-methyl-4-phenyl-1,2,3,6-tetrahydropyridine (MPTP) significantly attenuating glutathione loss, retaining the activity of glutathione peroxidase and SOD enzymes, diminishing oxidative stress, lowering pro-inflammatory cytokines and nitrite levels, and finally suppressing iNOS activity [72].
Under the experimental conditions to stress RAW 264.7 cells, PMA caused a significant decrease in the NAD+/NADH ratio and an increase in the NADP+/NADPH ratio (Figure 3B), demonstrating profound changes in the cell oxido-reductive state. While the change in the NAD+/NADH ratio was of relatively minor entity, confirming the PMA ability to increase the glycolytic rate [73], the almost 3 times increase in the NADP+/NADPH ratio strongly suggests the activation of NADPH oxidase during PMA-mediated oxidative burst [74].
In these experiments, only pre-treatment with 20 mM carnosine before the challenge with PMA significantly modified the cell energy state. Contrary to previous results obtained in cultured astrocytes, showing remarkable decrease in ATP induced by extracellular carnosine [75], we here found that the highest dose of carnosine tested not only caused a significant increase in ATP, but also a significant increase in GTP. According to our results, the raise in ATP might be related to increased mitochondrial oxidative phosphorylation linked to an augmented electron transfer chain and tricarboxylic acid activity [76,77]. Data showing a dose dependent increase in the carnosine-mediated NAD+/NADH ratio (particularly evident when 20 mM carnosine was used) supported this hypothesis. It is also worth underlining that carnosine dose-dependently decreased the NADP+/NADPH ratio, strongly indicating the decrease in the activity in the main actor (NADPH oxidase) responsible for ROS production and confirming that the improvement of cell bioenergetics has the inhibitory effects of a PMA-induced oxidative burst [78]. This ability of carnosine to modulate energy metabolism, with specific reference to ATP, could help reinforce the idea of its use in the treatment or prevention of diverse age-related conditions characterized by energy dysmetabolism [79].
According with the results showed in Figure 1B and with what was aforementioned, carnosine down-regulated the expression of both Nox1 and Nox2 enzymes, especially at the highest concentration (20 mM) (Figure 4A,B). These results are in agreement with the ability of this dipeptide to decrease oxidative stress-related enzymes, protecting microglial cells challenged with the oligomeric form of amyloid-β peptide [43]. A completely different scenario was observed when we investigated the effect of carnosine on pro- and anti-inflammatory cytokine genes expression in stimulated macrophages. In fact, on one hand the pre-treatment with carnosine was able to significantly (p < 0.001) down-regulate the expression of TNF-α and IL-6 mRNAs (Figure 5A,B); on the other hand, carnosine up-regulated the expression of IL-4 and IL-10 mRNAs (Figure 5E,F), also rescuing the TGF-β1 expression level to the values detected in resting cells, which was significantly higher than that of PMA alone (Figure 5D). These results point to an important role of carnosine in counteracting inflammatory phenomena promoting the transition in macrophages from a pro-inflammatory to an anti-inflammatory phenotype [80]. This “macrophage transition” plays a fundamental role in many diseases; in fact, the ratio of pro-inflammatory/anti-inflammatory macrophages, highly regulated in normal tissues, increases during diseases [80,81]. Therefore, the ability of carnosine to push towards an anti-inflammatory macrophage phenotype could, in part, make the difference between health and a pathological state.
During the last decade, the therapeutic potential of TGF-β1 in diseases characterized by oxidative stress and inflammation such as AD has emerged [82]. Carnosine in our experimental model induced a robust TGF-β1 overexpression. It has been shown that TGF-β1 administration protects rats against neuroinflammation and neurodegeneration Aβ-induced [82,83,84,85], while TGF-β1 knockout mice die from multifocal inflammation and autoimmune disorders in internal organs [86,87], highlighting the protective role of this multifunctional cytokine in protecting against inflammatory events. The ability of carnosine in counteracting the activation of Akt, enhanced in different cell types under stress conditions [48,88] and connected to the production of pro-inflammatory cytokines in macrophages [48], confirmed previous results obtained under different experimental conditions [48,89,90,91].
Our study produced robust evidences that carnosine effectively inhibits pro-oxidant and pro-inflammatory conditions in macrophages. Results demonstrated that the effects of carnosine are not only connected to the modulation of canonical pathways and activities causing oxidative/nitrosative stress and inflammation, but also that they are strictly linked to the capacity of this molecule to interact positively with the cell bioenergetics. Since the number of pathological conditions causing mitochondrial dysfunction and energy deficit are continuously increasing [92], it appears that the data showing the unexpected beneficial effects of carnosine on energy metabolism, related to improved mitochondrial oxidative phosphorylation and electron transport chain, looks particularly relevant in light of the potential application of this dipeptide in the treatment of pathologies such as neurodegenerative disorders.

5. Conclusions

In the present study we provided evidence that carnosine is able to reduce oxidative stress and inflammation, simultaneously restoring the parameters of cellular energy metabolism in activated macrophage cells. We reported for the first time that carnosine reduces PMA-induced oxidative stress in RAW 264.7 macrophage cells by decreasing the expression of Nox1 and Nox2 genes as well as the intracellular superoxide anion levels. In our experimental model, carnosine was also able to attenuate the PMA-induced Akt phosphorylation, down-regulate the expression of TNF-α and IL-6 mRNAs, simultaneously up-regulating the expression of the anti-inflammatory mediators IL-4 and IL-10, and rescuing TGF-β1 expression levels. Further, when used at the highest concentration, the antioxidant and anti-inflammatory effects of carnosine were accompanied by a generalized amelioration of the macrophage energy state, evaluated through the increase both in the total nucleoside triphosphate concentrations and the sum of the pool of intracellular nicotinic coenzymes. Finally, carnosine decreases the NADP+/NADPH ratio in a concentration dependent manner, indicating a strong inhibitory effect of this molecule towards the main source of ROS in this cell line.

Supplementary Materials

The following are available online at https://0-www-mdpi-com.brum.beds.ac.uk/2076-3921/8/8/281/s1, Figure S1: Experimental procedure for the determination of O2• levels in RAW 264.7 macrophages using microchip electrophoresis with laser-induced fluorescence (ME-LIF) and MitoSOX Red probe; Figure S2: Representative immunoblots of (A) total Nrf2, (B) nuclear Nrf2, and (C) HO-1 in protein extracts from resting (control) macrophages and macrophages stimulated with PMA and SOD inhibitors, in absence or presence of increasing concentrations (5, 10, or 20) of carnosine. Histograms refer to the means ± SD of three independent experiments. The densitometric values of total Nrf2 and HO-1 bands were normalized against GAPDH. The densitometric values of nuclear Nrf2 were normalized against Histone H3.

Author Contributions

Conceptualization, G.C., G.L. (Giuseppe Lazzarino) and F.C; Data curation, G.C., C.G.F., A.F., F.O., N.M., G.L. (Giacomo Lazzarino), M.G., A.M.A., F.T., C.B., F.D. and B.T.; Formal analysis, G.C., C.G.F., A.F., F.O., N.M., G.L. (Giacomo Lazzarino) and M.G.; Funding acquisition, G.C., S.M.L. and F.C; Investigation, G.C., C.G.F., A.F., F.O., N.M., G.L. (Giacomo Lazzarino) and M.G.; Project administration, G.C., G.L. (Giuseppe Lazzarino), S.M.L. and F.C; Resources, A.M.A., F.T., C.B., F.D., B.T., G.L. (Giuseppe Lazzarino), S.M.L. and F.C; Supervision, G.C., G.L. (Giuseppe Lazzarino), S.M.L. and F.C; Validation, G.C., C.G.F. and A.F.; Visualization, G.C., C.G.F., A.F., F.O., N.M., G.L. (Giacomo Lazzarino) and M.G.; Writing—original draft, G.C., C.G.F. and A.F.; Writing—review & editing, G.C., C.G.F., A.F., F.O., N.M., G.L. (Giacomo Lazzarino), M.G., A.M.A., F.T., C.B., F.D., B.T., G.L. (Giuseppe Lazzarino), and F.C.

Funding

Part of this study was supported by the National Science Foundation (NSF), grant number CHE-1411993, and National Institutes of Health (NIH), grant number COBRE P20GM103638. GC received support from the American Heart Association (Midwest Affiliate Postdoctoral Research Fellowship), grant number NFP0075515. GC and FC would also like to acknowledge the support received from the Italian Ministry of Health Research Program 2018, grant number RC: 2635256.

Acknowledgments

F.O. acknowledges the Craig Lunte and Malcolm Smyth DCU scholarship for support. We all thank Rosa di Giorgio for editorial support.

Conflicts of Interest

The authors declare no conflict of interest.

References

  1. De Campos, R.P.; Siegel, J.M.; Fresta, C.G.; Caruso, G.; Da Silva, J.A.; Lunte, S.M. Indirect detection of superoxide in raw 264.7 macrophage cells using microchip electrophoresis coupled to laser-induced fluorescence. Anal. Bioanal. Chem. 2015, 407, 7003–7012. [Google Scholar] [CrossRef] [PubMed]
  2. Ma, Z.A.; Zhao, Z.; Turk, J. Mitochondrial dysfunction and beta-cell failure in type 2 diabetes mellitus. Exp. Diabetes Res. 2012, 2012, 703538. [Google Scholar] [CrossRef] [PubMed]
  3. Birben, E.; Sahiner, U.M.; Sackesen, C.; Erzurum, S.; Kalayci, O. Oxidative stress and antioxidant defense. World Allergy Organ. J. 2012, 5, 9–19. [Google Scholar] [CrossRef] [PubMed]
  4. Gunasekara, D.B.; Siegel, J.M.; Caruso, G.; Hulvey, M.K.; Lunte, S.M. Microchip electrophoresis with amperometric detection method for profiling cellular nitrosative stress markers. Analyst 2014, 139, 3265–3273. [Google Scholar] [CrossRef] [PubMed] [Green Version]
  5. Weidinger, A.; Kozlov, A.V. Biological activities of reactive oxygen and nitrogen species: Oxidative stress versus signal transduction. Biomolecules 2015, 5, 472–484. [Google Scholar] [CrossRef]
  6. Villa, R.F.; Ferrari, F.; Bagini, L.; Gorini, A.; Brunello, N.; Tascedda, F. Mitochondrial energy metabolism of rat hippocampus after treatment with the antidepressants desipramine and fluoxetine. Neuropharmacology 2017, 121, 30–38. [Google Scholar] [CrossRef] [PubMed]
  7. Robinson, K.M.; Janes, M.S.; Pehar, M.; Monette, J.S.; Ross, M.F.; Hagen, T.M.; Murphy, M.P.; Beckman, J.S. Selective fluorescent imaging of superoxide in vivo using ethidium-based probes. Proc. Natl. Acad. Sci. USA 2006, 103, 15038–15043. [Google Scholar] [CrossRef]
  8. Villa, R.F.; Ferrari, F.; Gorini, A.; Brunello, N.; Tascedda, F. Effect of desipramine and fluoxetine on energy metabolism of cerebral mitochondria. Neuroscience 2016, 330, 326–334. [Google Scholar] [CrossRef]
  9. Ferrer-Sueta, G.; Radi, R. Chemical biology of peroxynitrite: Kinetics, diffusion, and radicals. ACS Chem. Biol. 2009, 4, 161–177. [Google Scholar] [CrossRef]
  10. Ullrich, V.; Bachschmid, M. Superoxide as a messenger of endothelial function. Biochem. Biophys. Res. Commun. 2000, 278, 1–8. [Google Scholar] [CrossRef]
  11. Afanas’ev, I.B. Signaling functions of free radicals superoxide and nitric oxide under physiological and pathological conditions. Mol. Biotechnol. 2007, 37, 2–4. [Google Scholar] [CrossRef] [PubMed]
  12. Estevez, A.G.; Jordan, J. Nitric oxide and superoxide, a deadly cocktail. Ann. N. Y. Acad. Sci. 2002, 962, 207–211. [Google Scholar] [CrossRef] [PubMed]
  13. Indo, H.P.; Yen, H.C.; Nakanishi, I.; Matsumoto, K.; Tamura, M.; Nagano, Y.; Matsui, H.; Gusev, O.; Cornette, R.; Okuda, T.; et al. A mitochondrial superoxide theory for oxidative stress diseases and aging. J. Clin. Biochem. Nutr. 2015, 56, 1–7. [Google Scholar] [CrossRef] [PubMed] [Green Version]
  14. Hsieh, H.L.; Yang, C.M. Role of redox signaling in neuroinflammation and neurodegenerative diseases. Biomed. Res. Int. 2013, 2013, 484613. [Google Scholar] [CrossRef] [PubMed]
  15. Metto, E.C.; Evans, K.; Barney, P.; Culbertson, A.H.; Gunasekara, D.B.; Caruso, G.; Hulvey, M.K.; Fracassi Da Silva, J.A.; Lunte, S.M.; Culbertson, C.T. An integrated microfluidic device for monitoring changes in nitric oxide production in single t-lymphocyte (jurkat) cells. Anal. Chem. 2013, 85, 10188–10195. [Google Scholar] [CrossRef] [PubMed]
  16. Sorescu, D.; Weiss, D.; Lassegue, B.; Clempus, R.E.; Szocs, K.; Sorescu, G.P.; Valppu, L.; Quinn, M.T.; Lambeth, J.D.; Vega, J.D.; et al. Superoxide production and expression of nox family proteins in human atherosclerosis. Circulation 2002, 105, 1429–1435. [Google Scholar] [CrossRef]
  17. Mander, P.; Brown, G.C. Activation of microglial nadph oxidase is synergistic with glial inos expression in inducing neuronal death: A dual-key mechanism of inflammatory neurodegeneration. J. Neuroinflamm. 2005, 2, 20. [Google Scholar] [CrossRef]
  18. Siegel, J.M.; Schilly, K.M.; Wijesinghe, M.B.; Caruso, G.; Fresta, C.G.; Lunte, S.M. Optimization of a microchip electrophoresis method with electrochemical detection for the determination of nitrite in macrophage cells as an indicator of nitric oxide production. Anal. Methods 2019, 11, 148–156. [Google Scholar] [CrossRef]
  19. Martinez, F.O.; Helming, L.; Gordon, S. Alternative activation of macrophages: An immunologic functional perspective. Annu. Rev. Immunol. 2009, 27, 451–483. [Google Scholar] [CrossRef]
  20. Malagoli, D.; Mandrioli, M.; Tascedda, F.; Ottaviani, E. Circulating phagocytes: The ancient and conserved interface between immune and neuroendocrine function. Biol. Rev. 2017, 92, 369–377. [Google Scholar] [CrossRef]
  21. Biswas, S.K.; Chittezhath, M.; Shalova, I.N.; Lim, J.Y. Macrophage polarization and plasticity in health and disease. Immunol. Res. 2012, 53, 11–24. [Google Scholar] [CrossRef]
  22. Roman, A.; Kreiner, G.; Nalepa, I. Macrophages and depression—A misalliance or well-arranged marriage? Pharm. Rep. 2013, 65, 1663–1672. [Google Scholar] [CrossRef]
  23. Lucherini, O.M.; Lopalco, G.; Cantarini, L.; Emmi, G.; Lopalco, A.; Venerito, V.; Vitale, A.; Iannone, F. Critical regulation of th17 cell differentiation by serum amyloid-a signalling in behcet’s disease. Immunol. Lett. 2018, 201, 38–44. [Google Scholar] [CrossRef]
  24. Lopalco, G.; Lucherini, O.M.; Lopalco, A.; Venerito, V.; Fabiani, C.; Frediani, B.; Galeazzi, M.; Lapadula, G.; Cantarini, L.; Iannone, F. Cytokine signatures in mucocutaneous and ocular behcet’s disease. Front. Immunol. 2017, 8, 200. [Google Scholar] [CrossRef]
  25. Gulewitsch, W.; Amiradžibi, S. Ueber das carnosin, eine neue organische base des fleischextractes. Ber. Der Dtsch. Chem. Ges. 1900, 33, 1902–1903. [Google Scholar] [CrossRef]
  26. Choi, S.Y.; Kwon, H.Y.; Kwon, O.B.; Kang, J.H. Hydrogen peroxide-mediated cu,zn-superoxide dismutase fragmentation: Protection by carnosine, homocarnosine and anserine. Biochim. Biophys. Acta 1999, 1472, 651–657. [Google Scholar] [CrossRef]
  27. Parker, C.J., Jr.; Ring, E. A comparative study of the effect of carnosine on myofibrillar-atpase activity of vertebrate and invertebrate muscles. Comp. Biochem. Physiol. 1970, 37, 413–419. [Google Scholar] [CrossRef]
  28. Drozak, J.; Veiga-da-Cunha, M.; Vertommen, D.; Stroobant, V.; Van Schaftingen, E. Molecular identification of carnosine synthase as atp-grasp domain-containing protein 1 (atpgd1). J. Biol. Chem. 2010, 285, 9346–9356. [Google Scholar] [CrossRef]
  29. Kalyankar, G.D.; Meister, A. Enzymatic synthesis of carnosine and related beta-alanyl and gamma-aminobutyryl peptides. J. Biol. Chem. 1959, 234, 3210–3218. [Google Scholar]
  30. Winnick, R.E.; Winnick, T. Carnosineanserine synthetase of muscle. I. Preparation and properties of soluble enzyme from chick muscle. Biochim. Biophys. Acta 1959, 31, 47–55. [Google Scholar] [CrossRef]
  31. Boldyrev, A.A.; Aldini, G.; Derave, W. Physiology and pathophysiology of carnosine. Physiol. Rev. 2013, 93, 1803–1845. [Google Scholar] [CrossRef]
  32. Gariballa, S.E.; Sinclair, A.J. Carnosine: Physiological properties and therapeutic potential. Age Ageing 2000, 29, 207–210. [Google Scholar] [CrossRef]
  33. Hipkiss, A.R.; Preston, J.E.; Himsworth, D.T.; Worthington, V.C.; Keown, M.; Michaelis, J.; Lawrence, J.; Mateen, A.; Allende, L.; Eagles, P.A.; et al. Pluripotent protective effects of carnosine, a naturally occurring dipeptide. Ann. N. Y. Acad. Sci. 1998, 854, 37–53. [Google Scholar] [CrossRef]
  34. Zhang, X.; Song, L.; Cheng, X.; Yang, Y.; Luan, B.; Jia, L.; Xu, F.; Zhang, Z. Carnosine pretreatment protects against hypoxia-ischemia brain damage in the neonatal rat model. Eur. J. Pharm. 2011, 667, 202–207. [Google Scholar] [CrossRef]
  35. Albrecht, T.; Schilperoort, M.; Zhang, S.; Braun, J.D.; Qiu, J.; Rodriguez, A.; Pastene, D.O.; Kramer, B.K.; Koppel, H.; Baelde, H.; et al. Carnosine attenuates the development of both type 2 diabetes and diabetic nephropathy in btbr ob/ob mice. Sci. Rep. 2017, 7, 44492. [Google Scholar] [CrossRef]
  36. Bermudez, M.L.; Skelton, M.R.; Genter, M.B. Intranasal carnosine attenuates transcriptomic alterations and improves mitochondrial function in the thy1-asyn mouse model of parkinson’s disease. Mol. Genet. Metab. 2018, 125, 305–313. [Google Scholar] [CrossRef]
  37. Herculano, B.; Tamura, M.; Ohba, A.; Shimatani, M.; Kutsuna, N.; Hisatsune, T. Beta-alanyl-l-histidine rescues cognitive deficits caused by feeding a high fat diet in a transgenic mouse model of alzheimer’s disease. J. Alzheimers Dis. 2013, 33, 983–997. [Google Scholar] [CrossRef]
  38. Caruso, G.; Caraci, F.; Jolivet, R.B. Pivotal role of carnosine in the modulation of brain cells activity: Multimodal mechanism of action and therapeutic potential in neurodegenerative disorders. Prog. Neurobiol. 2019, 175, 35–53. [Google Scholar] [CrossRef]
  39. Guiotto, A.; Calderan, A.; Ruzza, P.; Borin, G. Carnosine and carnosine-related antioxidants: A review. Curr. Med. Chem. 2005, 12, 2293–2315. [Google Scholar] [CrossRef]
  40. Onufriev, M.V.; Potanova, G.I.; Silaeva, S.A.; Nikolaev, A. Carnosine as a stimulator of cytotoxic and phagocytic function of peritoneal macrophages. Biokhimiia 1992, 57, 1352–1359. [Google Scholar]
  41. Caruso, G.; Fresta, C.G.; Martinez-Becerra, F.; Antonio, L.; Johnson, R.T.; De Campos, R.P.S.; Siegel, J.M.; Wijesinghe, M.B.; Lazzarino, G.; Lunte, S.M. Carnosine modulates nitric oxide in stimulated murine raw 264.7 macrophages. Mol. Cell. Biochem. 2017, 431, 197–210. [Google Scholar] [CrossRef]
  42. Fresta, C.G.; Chakraborty, A.; Wijesinghe, M.B.; Amorini, A.M.; Lazzarino, G.; Lazzarino, G.; Tavazzi, B.; Lunte, S.M.; Caraci, F.; Dhar, P.; et al. Non-toxic engineered carbon nanodiamond concentrations induce oxidative/nitrosative stress, imbalance of energy metabolism, and mitochondrial dysfunction in microglial and alveolar basal epithelial cells. Cell Death Dis. 2018, 9, 245. [Google Scholar] [CrossRef]
  43. Caruso, G.; Fresta, C.G.; Musso, N.; Giambirtone, M.; Grasso, M.; Spampinato, S.F.; Merlo, S.; Drago, F.; Lazzarino, G.; Sortino, M.A.; et al. Carnosine prevents abeta-induced oxidative stress and inflammation in microglial cells: A key role of tgf-beta1. Cells 2019, 8, 64. [Google Scholar] [CrossRef]
  44. Momose, I.; Terashima, M.; Nakashima, Y.; Sakamoto, M.; Ishino, H.; Nabika, T.; Hosokawa, Y.; Tanigawa, Y. Phorbol ester synergistically increases interferon regulatory factor-1 and inducible nitric oxide synthase induction in interferon-gamma-treated raw 264.7 cells. Biochim. Biophys. Acta 2000, 1498, 19–31. [Google Scholar] [CrossRef]
  45. Zhao, K.; Huang, Z.; Lu, H.; Zhou, J.; Wei, T. Induction of inducible nitric oxide synthase increases the production of reactive oxygen species in raw264.7 macrophages. Biosci. Rep. 2010, 30, 233–241. [Google Scholar] [CrossRef]
  46. Idelman, G.; Smith, D.L.; Zucker, S.D. Bilirubin inhibits the up-regulation of inducible nitric oxide synthase by scavenging reactive oxygen species generated by the toll-like receptor 4-dependent activation of nadph oxidase. Redox Biol. 2015, 5, 398–408. [Google Scholar] [CrossRef]
  47. Caruso, G.; Fresta, C.G.; Siegel, J.M.; Wijesinghe, M.B.; Lunte, S.M. Microchip electrophoresis with laser-induced fluorescence detection for the determination of the ratio of nitric oxide to superoxide production in macrophages during inflammation. Anal. Bioanal. Chem. 2017, 409, 4529–4538. [Google Scholar] [CrossRef]
  48. Rajaram, M.V.; Ganesan, L.P.; Parsa, K.V.; Butchar, J.P.; Gunn, J.S.; Tridandapani, S. Akt/protein kinase b modulates macrophage inflammatory response to francisella infection and confers a survival advantage in mice. J. Immunol. 2006, 177, 6317–6324. [Google Scholar] [CrossRef]
  49. Lazzarino, G.; Amorini, A.M.; Fazzina, G.; Vagnozzi, R.; Signoretti, S.; Donzelli, S.; Di Stasio, E.; Giardina, B.; Tavazzi, B. Single-sample preparation for simultaneous cellular redox and energy state determination. Anal. Biochem. 2003, 322, 51–59. [Google Scholar] [CrossRef]
  50. Lazzarino, G.; Listorti, I.; Muzii, L.; Amorini, A.M.; Longo, S.; Di Stasio, E.; Caruso, G.; D’Urso, S.; Puglia, I.; Pisani, G.; et al. Low-molecular weight compounds in human seminal plasma as potential biomarkers of male infertility. Hum. Reprod. 2018, 33, 1817–1828. [Google Scholar] [CrossRef]
  51. Lazzarino, G.; Listorti, I.; Bilotta, G.; Capozzolo, T.; Amorini, A.M.; Longo, S.; Caruso, G.; Lazzarino, G.; Tavazzi, B.; Bilotta, P. Water-and fat-soluble antioxidants in human seminal plasma and serum of fertile males. Antioxidants 2019, 8, 96. [Google Scholar] [CrossRef]
  52. Available online: https://0-www-ncbi-nlm-nih-gov.brum.beds.ac.uk/gene/ (accessed on 20 June 2019).
  53. Available online: https://www.qiagen.com/it/shop/pcr/real-time-pcr-enzymes-and-kits/two-step-qrt-pcr/quantitect-primer-assays/ (accessed on 20 June 2019).
  54. Caraci, F.; Gulisano, W.; Guida, C.A.; Impellizzeri, A.A.; Drago, F.; Puzzo, D.; Palmeri, A. A key role for tgf-beta1 in hippocampal synaptic plasticity and memory. Sci. Rep. 2015, 5, 11252. [Google Scholar] [CrossRef]
  55. Xia, C.; Bai, X.; Hou, X.; Gou, X.; Wang, Y.; Zeng, H.; Huang, M.; Jin, J. Cryptotanshinone reverses cisplatin resistance of human lung carcinoma a549 cells through down-regulating nrf2 pathway. Cell. Physiol. Biochem. 2015, 37, 816–824. [Google Scholar] [CrossRef]
  56. Castaneda, O.A.; Lee, S.C.; Ho, C.T.; Huang, T.C. Macrophages in oxidative stress and models to evaluate the antioxidant function of dietary natural compounds. J. Food Drug. Anal. 2017, 25, 111–118. [Google Scholar] [CrossRef]
  57. Oishi, Y.; Manabe, I. Macrophages in inflammation, repair and regeneration. Int. Immunol. 2018, 30, 511–528. [Google Scholar] [CrossRef]
  58. Van Der Heijden, J.; Bosman, E.S.; Reynolds, L.A.; Finlay, B.B. Direct measurement of oxidative and nitrosative stress dynamics in salmonella inside macrophages. Proc. Natl. Acad. Sci. USA 2015, 112, 560–565. [Google Scholar] [CrossRef]
  59. Slauch, J.M. How does the oxidative burst of macrophages kill bacteria? Still an open question. Mol. Microbiol. 2011, 80, 580–583. [Google Scholar] [CrossRef] [Green Version]
  60. Fresta, C.G.; Hogard, M.L.; Caruso, G.; Melo Costa, E.E.; Lazzarino, G.; Lunte, S.M. Monitoring carnosine uptake by raw 264.7 macrophage cells using microchip electrophoresis with fluorescence detection. Anal. Methods 2017, 9, 402–408. [Google Scholar] [CrossRef]
  61. Munzel, T.; Harrison, D.G. Increased superoxide in heart failure: A biochemical baroreflex gone awry. Circulation 1999, 100, 216–218. [Google Scholar] [CrossRef]
  62. Fukai, T.; Ushio-Fukai, M. Superoxide dismutases: Role in redox signaling, vascular function, and diseases. Antioxid. Redox Signal. 2011, 15, 1583–1606. [Google Scholar] [CrossRef]
  63. Fukai, T.; Folz, R.J.; Landmesser, U.; Harrison, D.G. Extracellular superoxide dismutase and cardiovascular disease. Cardiovasc. Res. 2002, 55, 239–249. [Google Scholar] [CrossRef]
  64. Klebanov, G.I.; Teselkin Yu, O.; Babenkova, I.V.; Popov, I.N.; Levin, G.; Tyulina, O.V.; Boldyrev, A.A.; Vladimirov Yu, A. Evidence for a direct interaction of superoxide anion radical with carnosine. Biochem. Mol. Biol. Int. 1997, 43, 99–106. [Google Scholar] [CrossRef]
  65. Wade, A.M.; Tucker, H.N. Antioxidant characteristics of l-histidine. J. Nutr. Biochem. 1998, 9, 308–315. [Google Scholar] [CrossRef]
  66. Vera-Aviles, M.; Vantana, E.; Kardinasari, E.; Koh, N.L.; Latunde-Dada, G.O. Protective role of histidine supplementation against oxidative stress damage in the management of anemia of chronic kidney disease. Pharmaceuticals 2018, 11, 111. [Google Scholar] [CrossRef]
  67. Szczesniak, D.; Budzen, S.; Kopec, W.; Rymaszewska, J. Anserine and carnosine supplementation in the elderly: Effects on cognitive functioning and physical capacity. Arch. Gerontol. Geriatr. 2014, 59, 485–490. [Google Scholar] [CrossRef]
  68. Rokicki, J.; Li, L.; Imabayashi, E.; Kaneko, J.; Hisatsune, T.; Matsuda, H. Daily carnosine and anserine supplementation alters verbal episodic memory and resting state network connectivity in healthy elderly adults. Front. Aging Neurosci. 2015, 7, 219. [Google Scholar] [CrossRef]
  69. Katakura, Y.; Totsuka, M.; Imabayashi, E.; Matsuda, H.; Hisatsune, T. Anserine/carnosine supplementation suppresses the expression of the inflammatory chemokine ccl24 in peripheral blood mononuclear cells from elderly people. Nutrients 2017, 9, 1199. [Google Scholar] [CrossRef]
  70. Alpsoy, L.; Akcayoglu, G.; Sahin, H. Anti-oxidative and anti-genotoxic effects of carnosine on human lymphocyte culture. Hum. Exp. Toxicol. 2011, 30, 1979–1985. [Google Scholar] [CrossRef]
  71. Aydin, A.F.; Kusku-Kiraz, Z.; Dogru-Abbasoglu, S.; Uysal, M. Effect of carnosine treatment on oxidative stress in serum, apob-containing lipoproteins fraction and erythrocytes of aged rats. Pharm. Rep. 2010, 62, 733–739. [Google Scholar] [CrossRef]
  72. Tsai, S.J.; Kuo, W.W.; Liu, W.H.; Yin, M.C. Antioxidative and anti-inflammatory protection from carnosine in the striatum of mptp-treated mice. J. Agric. Food Chem. 2010, 58, 11510–11516. [Google Scholar] [CrossRef]
  73. Rodriguez-Espinosa, O.; Rojas-Espinosa, O.; Moreno-Altamirano, M.M.; Lopez-Villegas, E.O.; Sanchez-Garcia, F.J. Metabolic requirements for neutrophil extracellular traps formation. Immunology 2015, 145, 213–224. [Google Scholar] [CrossRef] [Green Version]
  74. Saffarzadeh, M. Neutrophil extracellular traps as a drug target to counteract chronic and acute inflammation. Curr. Pharm. Biotechnol. 2018, 19, 1196–1202. [Google Scholar] [CrossRef]
  75. Shen, Y.; Tian, Y.; Yang, J.; Shi, X.; Ouyang, L.; Gao, J.; Lu, J. Dual effects of carnosine on energy metabolism of cultured cortical astrocytes under normal and ischemic conditions. Regul. Pept. 2014, 192, 45–52. [Google Scholar] [CrossRef]
  76. Macedo, L.W.; Cararo, J.H.; Maravai, S.G.; Goncalves, C.L.; Oliveira, G.M.; Kist, L.W.; Guerra Martinez, C.; Kurtenbach, E.; Bogo, M.R.; Hipkiss, A.R.; et al. Acute carnosine administration increases respiratory chain complexes and citric acid cycle enzyme activities in cerebral cortex of young rats. Mol. Neurobiol. 2016, 53, 5582–5590. [Google Scholar] [CrossRef]
  77. Ouyang, L.; Tian, Y.; Bao, Y.; Xu, H.; Cheng, J.; Wang, B.; Shen, Y.; Chen, Z.; Lyu, J. Carnosine decreased neuronal cell death through targeting glutamate system and astrocyte mitochondrial bioenergetics in cultured neuron/astrocyte exposed to ogd/recovery. Brain. Res. Bull. 2016, 124, 76–84. [Google Scholar] [CrossRef]
  78. Schinetti, M.L.; Lazzarino, G. Inhibition of phorbol ester-stimulated chemiluminescence and superoxide production in human neutrophils by fructose 1, 6-diphosphate. Biochem. Pharm. 1986, 35, 1762–1764. [Google Scholar] [CrossRef]
  79. Hipkiss, A.R.; Cartwright, S.P.; Bromley, C.; Gross, S.R.; Bill, R.M. Carnosine: Can understanding its actions on energy metabolism and protein homeostasis inform its therapeutic potential? Chem. Cent J. 2013, 7, 38. [Google Scholar] [CrossRef]
  80. Cassetta, L.; Cassol, E.; Poli, G. Macrophage polarization in health and disease. Sci. World J. 2011, 11, 2391–2402. [Google Scholar] [CrossRef]
  81. Fujisaka, S.; Usui, I.; Bukhari, A.; Ikutani, M.; Oya, T.; Kanatani, Y.; Tsuneyama, K.; Nagai, Y.; Takatsu, K.; Urakaze, M.; et al. Regulatory mechanisms for adipose tissue m1 and m2 macrophages in diet-induced obese mice. Diabetes 2009, 58, 2574–2582. [Google Scholar] [CrossRef]
  82. Caraci, F.; Spampinato, S.F.; Morgese, M.G.; Tascedda, F.; Salluzzo, M.G.; Giambirtone, M.C.; Caruso, G.; Munafo, A.; Torrisi, S.A.; Leggio, G.M.; et al. Neurobiological links between depression and ad: The role of tgf-beta1 signaling as a new pharmacological target. Pharm. Res. 2018, 130, 374–384. [Google Scholar] [CrossRef]
  83. Chen, J.H.; Ke, K.F.; Lu, J.H.; Qiu, Y.H.; Peng, Y.P. Protection of tgf-beta1 against neuroinflammation and neurodegeneration in abeta1-42-induced alzheimer’s disease model rats. PLoS ONE 2015, 10, e0116549. [Google Scholar]
  84. Fisichella, V.; Giurdanella, G.; Platania, C.B.; Romano, G.L.; Leggio, G.M.; Salomone, S.; Drago, F.; Caraci, F.; Bucolo, C. Tgf-beta1 prevents rat retinal insult induced by amyloid-beta (1-42) oligomers. Eur. J. Pharm. 2016, 787, 72–77. [Google Scholar] [CrossRef]
  85. Platania, C.B.M.; Fisichella, V.; Fidilio, A.; Geraci, F.; Lazzara, F.; Leggio, G.M.; Salomone, S.; Drago, F.; Pignatello, R.; Caraci, F.; et al. Topical ocular delivery of tgf-beta1 to the back of the eye: Implications in age-related neurodegenerative diseases. Int. J. Mol. Sci. 2017, 18, 2076. [Google Scholar] [CrossRef]
  86. Shull, M.M.; Ormsby, I.; Kier, A.B.; Pawlowski, S.; Diebold, R.J.; Yin, M.; Allen, R.; Sidman, C.; Proetzel, G.; Calvin, D.; et al. Targeted disruption of the mouse transforming growth factor-beta 1 gene results in multifocal inflammatory disease. Nature 1992, 359, 693–699. [Google Scholar] [CrossRef]
  87. Kulkarni, A.B.; Karlsson, S. Inflammation and tgf beta 1: Lessons from the tgf beta 1 null mouse. Res. Immunol. 1997, 148, 453–456. [Google Scholar] [CrossRef]
  88. Sun, H.; Zhu, X.; Cai, W.; Qiu, L. Hypaphorine attenuates lipopolysaccharide-induced endothelial inflammation via regulation of tlr4 and ppar-γ dependent on pi3k/akt/mtor signal pathway. Int. J. Mol. Sci. 2017, 18, 844. [Google Scholar] [CrossRef]
  89. Kadry, M.O.; Ali, H.M. Downregulation of hif1-alpha, smad-2, akt, and bax gene expression in sodium nitrite-induced lung injury via some antioxidants. J. Biochem. Mol. Toxicol. 2017, 31, e21909. [Google Scholar] [CrossRef]
  90. Zhang, Z.; Miao, L.; Wu, X.; Liu, G.; Peng, Y.; Xin, X.; Jiao, B.; Kong, X. Carnosine inhibits the proliferation of human gastric carcinoma cells by retarding akt/mtor/p70s6k signaling. J. Cancer 2014, 5, 382–389. [Google Scholar] [CrossRef]
  91. Cheng, J.; Yang, J.; Liu, Y.; Xu, M.; Huang, Y.; Zhang, J.; Cao, P.; Lyu, J.; Shen, Y. Profiling and targeting of cellular mitochondrial bioenergetics: Inhibition of human gastric cancer cell growth by carnosine. Acta Pharmacol. Sin. 2019, 40, 938–948. [Google Scholar] [CrossRef]
  92. Ramirez-Camacho, I.; Flores-Herrera, O.; Zazueta, C. The relevance of the supramolecular arrangements of the respiratory chain complexes in human diseases and aging. Mitochondrion 2019, 47, 266–272. [Google Scholar] [CrossRef]
Figure 1. Detection of intracellular concentrations of O2• (as detected by microchip electrophoresis with laser-induced fluorescence (ME-LIF)) in resting (control) macrophages and in macrophages stimulated with phorbol 12-myristate 13-acetate (PMA) and superoxide dismutase (SOD) inhibitors, in absence or presence of increasing concentrations (5, 10, or 20) of carnosine or anserine. (A) Change in O2• production (expressed as Average peak area/Cell) in macrophages subjected to two different acute stimulations with PMA. (B,C) show the ability of carnosine and anserine in decreasing the intracellular concentrations of O2• PMA-induced, respectively. The O2• levels are expressed as the percent variation with respect to the PMA-stimulated cells. Values are means ± SD of three to five independent experiments. *** p < 0.001 vs. CTRL; θ p < 0.05 vs. PMA 30 min; # p < 0.05 vs. PMA; ### p < 0.001 vs. PMA; ϕ p < 0.05 vs. PMA + C5; ϕϕ p < 0.01 vs. PMA + C10; ϕϕϕ p < 0.001 vs. PMA + C5; ωω p < 0.01 vs. PMA + A5.
Antioxidants 08 00281 g001
Figure 2. Changes in nucleoside triphosphate concentrations (ATP, GTP, UTP, and CTP), expressed as nmol/million cells, in resting (control) macrophages and in macrophages stimulated with PMA and SOD inhibitors, in absence or presence of increasing concentrations (5, 10, or 20) of carnosine. Values are means ± SD of four independent experiments. ** p < 0.01 vs. CTRL; ## p < 0.01 vs. PMA; ### p < 0.001 vs. PMA; ϕ p < 0.05 vs. PMA + C5 and PMA + C10; ϕϕ p < 0.01 vs. PMA + C5 and PMA + C10.
Antioxidants 08 00281 g002
Figure 3. Consequences of the different cell treatments on (A) the sum (NAD+ + NADH and NADP+ + NADPH) and (B) the ratio (NAD+/NADH and NADP+/NADPH) of intracellular nicotinic coenzymes in resting (control) macrophages and in macrophages stimulated with PMA and SOD inhibitors, in absence or presence of increasing concentrations (5, 10, or 20) of carnosine. The sum of intracellular nicotinic coenzymes is expressed as nmol/million cells. Values are means ± SD of four independent experiments. * p < 0.05 vs. CTRL; ** p < 0.01 vs. CTRL; *** p < 0.001 vs. CTRL; # p < 0.05 vs. PMA; ## p < 0.01 vs. PMA; ### p < 0.001 vs. PMA; ϕ p < 0.05 vs. PMA + C5 and PMA + C10; ϕϕϕ p < 0.001 vs. PMA + C5.
Antioxidants 08 00281 g003aAntioxidants 08 00281 g003b
Figure 4. Measurement of (A) Nox1, (B) Nox2, and (C) iNOS mRNA expression levels (quantitative real-time PCR (qRT-PCR)) in resting (control) macrophages and in macrophages stimulated with PMA and SOD inhibitors, in absence or presence of increasing concentrations (5, 10, or 20) of carnosine. The abundance of each mRNA of interest was expressed relative to the abundance of GAPDH-mRNA, as an internal control. As a negative control, a reaction in absence of cDNA (no template control, NTC) was performed. Values are means ± SD of three to seven independent experiments. ** p < 0.01 vs. CTRL; *** p < 0.001 vs. CTRL; # p < 0.05 vs. PMA; ## p < 0.01 vs. PMA.
Antioxidants 08 00281 g004
Figure 5. Measurement of (A) TNF-α, (B) IL-6, (C) IL-1β, (D) TGF-β1, (E) IL-4, and (F) IL-10mRNA expression levels (qRT-PCR) in resting (control) macrophages and in macrophages stimulated with PMA and SOD inhibitors, in absence or presence of increasing concentrations (5, 10, or 20) of carnosine. GAPDH-mRNA and NTC reactions were used as internal and negative controls, respectively, as described in Figure 4. Values are means ± SD of three to seven independent experiments. * p < 0.05 vs. CTRL; ** p < 0.01 vs. CTRL; *** p < 0.001 vs. CTRL; # p < 0.05 vs. PMA; ## p < 0.01 vs. PMA; ### p < 0.001 vs. PMA; ϕ p < 0.05 vs. PMA + C5.
Antioxidants 08 00281 g005
Figure 6. Carnosine partially reduced Akt phosphorylation levels PMA-induced in macrophages. Representative immunoblots of phosphorylated Akt (p(ser473)Akt) and total Akt (Akt) in total protein extracts from resting (control) macrophages and macrophages stimulated with PMA and SOD inhibitors, in absence or presence of increasing concentrations (5, 10, or 20) of carnosine. Histograms refer to the means ± SD of five independent experiments. The densitometric values of pAkt bands were normalized against Akt. *** p < 0.001 vs. CTRL; # p < 0.05 vs. PMA.
Antioxidants 08 00281 g006
Table 1. The list of primers used for quantitative real-time PCR (qRT-PCR).
Official Name #Official SymbolAlternative Titles/SymbolsDetected TranscriptAmplicon LengthCat. No.
nitric oxide synthase 2, inducibleNos2iNOS; Nos-2; Nos2a; i-NOS; NOS-II; MAC-NOSNM_010927118 bpQT00100275
NADPH oxidase 1Nox1MOX1; NOH1; NOH-1; NOX1a; Nox-1; GP91-2; NOX1alphaNM_172203
XM_006528515
180 bpQT00140091
cytochrome b-245, beta polypeptideCybbCgd; Cyd; Nox2; C88302; gp91-1; gp91phox; CGD91-phoxNM_007807
XM_006527565
146 bpQT00139797
interleukin 1 betaIl1bIl-1b; IL-1beta; IL-1βNM_008361 XM_006498795150 bp
682 bp
QT01048355
tumor necrosis factorTnfDIF; Tnfa; TNF-a; TNFSF2; Tnlg1f; Tnfsf1a; TNFalpha; TNF-alpha; TNF-αNM_013693 NM_001278601112 bp
112 bp
QT00104006
interleukin 6Il6Il-6NM_031168128 bpQT00098875
interleukin 4Il4Il-4; BSF-1NM_021283132 bpQT02418311
interleukin 10Il10CSIF; Il-10NM_010548103 bpQT00106169
transforming growth factor, beta 1Tgfb1Tgfb; Tgfb-1; TGFbeta1; TGF-beta1NM_011577145 bpQT00145250
glyceraldehyde-3-phosphate dehydrogenaseGapdhGapdNM_008084
XM_001003314
XM_990238
NM_001289726
144 bpQT01658692
# [52]; [53].

