Antioxidant Activity and Phenolic Profile of Selected Organic and Conventional Honeys from Poland


1
Department of Food Product Quality, Cracow University of Economics, Sienkiewicza 5, 30-033 Kraków, Poland
2
Hamburg School of Food Science, Institute of Food Chemistry, University of Hamburg, Grindelallee 117, 20146 Hamburg, Germany
3
Life Sciences and Facility Management, Zurich University of Applied Sciences, 8820 Wädenswil, Switzerland
*
Author to whom correspondence should be addressed.
Antioxidants 2020, 9(1), 44; https://0-doi-org.brum.beds.ac.uk/10.3390/antiox9010044
Submission received: 17 December 2019
/
Revised: 1 January 2020
/
Accepted: 2 January 2020
/
Published: 4 January 2020
(This article belongs to the Special Issue Phenolic Profiling and Antioxidant Capacity in Plants)
Abstract
:Honey is a natural food product hypothesized to have significant health-beneficial value. The results of recent studies indicate that the biological activity of honey can also be ascribed to phenolic compounds and their antioxidant activity. The aims of this study were: To determine the phenolic profiles of several varieties of Polish honey and their correlation with various factors influencing the quality of honey, plus to verify the impact of production method (organic/conventional) and the pollen content on these profiles. In total, 11 organic and 11 conventional honey samples from Poland were investigated. The botanical origin of the samples was identified through melissopalynological analysis, whereas individual phenolic compounds were determined by the LC/MS analysis. The Folin–Ciocalteau assay was used for the determination of the total phenolic content (TPC). Moreover, the CIE L*a*b* color values were measured and matched with the above-mentioned parameters. The results of the study contribute to the discussion on the health benefits of organic farming. It was found that chrysin may act as a potential indicator compound. The study confirms the existence of the link between TPC and color, and it shows that there is a correlation between pinocembrin and galangin, two compounds that are reported to ameliorate insulin resistance.
1. Introduction
Honey, as a natural food product, is believed to provide significant nutritional, as well as preventive and curative, value. Numerous literature sources point out that regular consumption of honey is one of the best forms of providing the organism with easily digestible carbohydrates, bioactive and bacteriostatic substances, organic acids, amino acids, as well as certain macro- and micronutrients [1]. As honey originates from various single and/or multiple plant species, it is also a natural source of antioxidants such as phenolic acids, carotenoids, proteins, certain enzymes and to some extent Maillard reaction products [2,3,4,5,6]. However, the contents and composition of antioxidant compounds depend to a large extent on the floral source, and thus also on the variety of honey [7,8]. Moreover, the composition of honey is influenced by various ecophysiological factors of the field (such as global radiation, temperature, soil conditions) and processing conditions (temperature in the hive or during the preparation of the final honey) [9].
Recent studies by Alvarez-Suarez et al. [10] have shown that the biological activity of honey can be associated with the content of phenolic compounds found in it. Due to their chemical structure, phenolic compounds are the most effective antioxidants in the context of food ingredients [2,11], but they also provide anti-inflammatory, anti-proliferative, and antimicrobial activity [10]. Consequently, research suggests that phenolic compounds are also mainly responsible for the antioxidant activity of honey [8,12].
As shown by Badolato et al. [13], the basic composition of phenolic compounds in different varieties of honey is quite similar and includes p-coumaric acid, eugenol, ferulic acid, caffeic acid, pinobanksin, pinocembrin, chrysin, quercetin, apigenin, and naringin in different proportions. Nonetheless, honey can contain some variety-specific compounds that may be used as markers of their botanical origin [3,14]. Hence, the floral source, along with the geographical origin and climatic conditions, influence antioxidant properties of honey [15,16,17,18]. Consequently, the properties of the same variety of honey might be different in the diverse regions of the world.
As mentioned before, the literature suggests the dependence of the total phenolic content on the antioxidant activity of honey [19,20,21], but it may also be responsible for its color, e.g., [22,23,24]. However, in Polish honeys, only a few studies related to the content of phenolic compounds, color, antioxidant activity, etc., have been conducted.
When looking at the quality of honey, the production method plays an interesting role as well. However, because the results of the studies investigating the influence of organic farming on the phenolic compounds in vegetables and fruits are still not comprehensive enough and more or less inconclusive [25], this issue needs further analysis, especially considering transformation products such as honey, where plant extracts and pollen are found. The results obtained so far suggest that there is still a need to deepen the research on antioxidant properties of honey, especially considering the influence of pollens contained in it [22,23,26,27,28,29].
Considering the above-mentioned issues, the main aim of this study was to determine the phenolic profile of Polish honeys with a special focus on the influence of production method (organic vs. conventional) and the pollen content on the concentrations of phenolic compounds. Moreover, the study aimed at the recognition of possible correlations between the contents of specific phenolic compounds, color parameters, total phenolic content, and antioxidant activity of the samples tested.
2. Materials and Methods
2.1. Reagents
The following phenolic compounds were bought from Sigma-Aldrich Chemie GmbH (Buchs, Switzerland): Apigenin, chrysin, caffeic acid, p-coumaric acid, ferulic acid, galangin, luteolin, pinocembrin, quercetin, and kaempferol. Acetonitrile, methanol, water, and formic acid (LC-MS grade) were also purchased from Sigma-Aldrich. The Folin-Ciocalteau reagent (2 M) and anhydrous sodium carbonate (Sigma-Aldrich,) were used to measure the total phenolic content. To measure the antioxidant activity, 2,2-diphenyl-1-picrylhydrazyl (DPPH; Sigma-Aldrich) was used.
2.2. Samples
The study comprised 22 honey samples of 11 varieties, which were directly specified by the beekeepers, considering the location of the hive, the season, and all available floral sources. Each variety was represented by an organic and a conventional sample. The samples came from the following regions of Poland: Podlaskie, (samples Nos. 1, 4, 12, 14, 21, 22), Podkarpackie (samples Nos. 2, 3, 5, 6), Pomorskie (samples Nos. 7, 10, 17, 19), Mazowieckie (samples No. 9, 16, 18), Zachodniopomorskie (sample No. 11), Lubelskie (samples Nos. 13, 15), Świętokrzyskie (sample No. 20), Lubuskie (sample No. 8). They were bought directly the apiaries and in organic food stores.
The botanical origin of the honey samples was determined by the melissopalynological analysis, as established by the International Commission of Bee Botany [30]. In the case of the samples of honeydew honey, specific electrical conductivity measurements of aqueous 20% solutions were made with the use of a CX-721 sensor (ELMETRON, Zabrze, Poland). The detailed characteristics of the honey samples, along with pollen analysis and conductivity test results, are presented in Table 1.
The results of melissopalynological analyses are shown as the percentage of each pollen type content. According to Flores et al. [31], pollens are classified as dominant (concentration equal to or upper than 45%), accompanying (concentration between 15% and 45%), or important (concentration between 3% and 15%). Moar [32] indicated that the content of 45% is a universal and minimal limit for the classification of honey as monofloral. As the results obtained showed that in most of the cases the classification of honeys made by their producers was incorrect, the research outcomes were analyzed and discussed with consideration of the determined pollen concentrations and conductivity.
2.3. Sample Preparation
In the present study, 2 g honey samples were weighed into a 50 mL centrifuge vessel and mixed with 2.5 mL distilled water, adjusted to pH 2.0 with concentrated HCl, and homogenized for 10 min. The extraction of phenolic compounds and the enrichment using Amberlite XAD-2 resin were performed according to Yao et al. [33]. The stationary phase was prepared by soaking 7 g of the Amberlite XAD-2 resin in distilled water for 10 min. Further, the fluid honey sample was mixed with 7 g Amberlite XAD-2 for 30 min. The Amberlite particles were then packed in a 6 mL glass column (Macherey-Nagel GmbH & Co. KG, Oensingen, Switzerland) and washed with 10 mL acidified water with the addition of 10 mL distilled water. The Amberlite-resin-bound phenolic compounds were eluted subsequently with 7 mL methanol and 7 mL acetonitrile. The eluent was dried overnight under nitrogen at 20 °C with a sample concentrator (Portmann Instruments AG, Biel-Benken, Switzerland). For the RP-HPLC-ESI/MS analysis, the sample was subsequently dissolved in 200 µL methanol and 200 µL acetonitrile and stored at −20 °C. Each sample was prepared in triplicate, and each one was analyzed three times over (mean ± SD).
2.4. Characterization of Chemical Components Using Folin–Ciocalteau Assay
2.5. Quantification of Chemical Components Using LC-DAD/ESI-MSD
The identification of the individual compounds in the honey extracts was confirmed by RP-LC-DAD/ESI-MSD. This was performed on an Agilent 1200 series liquid chromatography and quadrupole mass spectrometer with electrospray ionization interface (LC-MSD 6120, G6100 series, Agilent Technologies AG, Waldbronn, Germany). The honey extracts were analyzed using a gradient mixture of water-formic acid (99.9:0.1, v:v) (solvent A) and acetonitrile-water-formic acid (94.9:5:0.1, v:v:v) (solvent B). A 3.0 × 150 mm Eclipse XDB-C18 (3.5 µm) column (Agilent Technologies AG) was used. The separation was effected using a linear gradient at 38 °C with a flow of 0.25 mL/min as follows: 3% B at 0–5 min, 3–6% B at 5–8 min, 6–11% B at 8–20 min, 11–12% B at 20–25 min, 12–17% B at 25–32 min, 17–20% B at 32–38 min, 20–28% B at 38–44 min, 28–31% B at 44–47 min, 31–38% B at 47–51 min, 38–45% at 51–54 min, 45–50% at 54–58 min, 50–90% at 58–61 min, 90% B at 61–63 min and 90–1% B at 63–64 min.
2.6. RP-HPLC-Online-TEAC
The analysis of methanolic honey extracts was performed using an HPLC system (S5050 Knauer GmbH, Berlin, Germany) equipped with a Knauer S1000 quaternary solvent manager pump and Knauer S3950 autosampler. A Knauer S2600 diode array detector (set at 280, 325, 350, 365 nm) was used for detection of the positive peaks, whereas a Knauer S2550 UV-VIS detector (set at 414, 734 nm) was used for detection of the negative peaks. The system was controlled with ClarityChrom 3.0.7.662 software (Knauer GmbH). The separation was carried out on a Luna® 5 µm phenyl-hexyl 100 Å (250 × 4.60 mm; Phenomenex Inc., Aschaffenburg, Germany) column at a temperature of 21 °C and a flow rate of 0.7 mL/min. The injection volume was 30 µL. A binary gradient system measurement was performed with the eluent water-formic acid (99.9:0.1, v:v) (solvent A) and acetonitrile-formic acid (99.9:0.1, v:v) (solvent B) for the methanolic extracts: 10% B isocratic at 0–5 min, 10–15% B at 5–10 min, 15% B isocratic at 10–30 min, 15–20% B at 30–40 min, 20–55% B at 40–60 min, 55–95% B at 60–65 min, 95% B isocratic at 65–70 min, 95–10% B at 70–75 min, and 10% B isocratic at 75–85 min.
For the purpose of the online-TEAC assay, an ABTS·+ solution (100 µM) was added at a flow rate of 0.7 mL/min using an auxiliary Knauer S100 pump with a T-valve. The scavenging reaction took place in a reaction capillary (5.0 m × 0.25 mm) at a temperature of 40 °C. The ABTS•+ solution was prepared using 54 mg ABTS•+ and 9.4 mg K2S2O8. The chemicals were weighed into a 50 mL volumetric flask and filled up with water. The solution was thoroughly shaken. Afterwards, it was incubated and light-protected at room temperature for about 20 h. Then the solution was diluted with 950 mL water and sonicated for 10 min.
2.7. Color
For consumers, the color of honey is one of its most important sensory traits. In the present study, the color was mapped by measuring L* (lightness), a* (degree of greenness/redness), and b* (degree of blueness/yellowness) values in the CIEL*a*b* system [36]. The honey samples were measured using the CM-5 bench-top spectrophotometer (Konica Minolta Holdings K.K, Dietikon, Switzerland).
2.8. Statistical Analysis
The data were analyzed using statistical methods and the R 3.5.3 software [37]. A value of 0.05 was required for statistical significance. The normality was assessed with Shapiro–Wilk test. The comparisons of quantitative variables in two groups were conducted with either the Student t-test (in the case of normal distribution in both groups), or with Man–Whitney test (otherwise). The correlations between quantitative variables were assessed with either the Pearson’s (in the case of normal distribution of both variables), or with the Spearman’s (otherwise) correlation coefficient. The strength of association was judged with the following scores [38]: (I) |r| ≥ 0.9—very strong, (II) 0.7 ≤ |r| < 0.9—strong, (III) 0.5 ≤ |r| < 0.7—moderate, (IV) 0.3 ≤ |r| < 0.5—weak, (V) |r| < 0.3—very weak.
The clustering was done by the agglomerative hierarchical clustering method (AHC). Typical parameters of the method, e.g., Euclidean distance and Ward connection were used. The variables were standardized prior to the AHC analysis to ensure the same weight for each of them.
The dimension reduction was done with the principal component analysis method (PCA). Two first components were extracted for further analysis.
3. Results and Discussion
The phenolic compound profiles, along with total phenolic contents (TPC), total antioxidant activities (AOX), and color parameters (L*, a*, b*) of all samples tested are presented in Table 2.
3.1. Phenolic Compound Profiles
In the analyzed honey samples, ten phenolic compounds were detected. The concentration of Chrysin fluctuated from 38 to 108 µg/100 g, whereas caffeic acid varied from 37 to 215 µg/100 g, p-coumaric acid from 164 to 788 µg/100 g, and pinocembrin from 27 to 113 µg/100 g. In five cases, the concentration of luteolin was below the detection level and varied between 1 and 105 µg/100 g for the remaining samples. The concentration of quercetin fluctuated from 0.002 to 0.483 mg/100 g, kaempferol from 25 to 161 µg/100 g, galangin from 35 to 154 µg/100 g, trans-ferulic acid from 47 to 315 µg/100 g, and apigenin from 7 to 45 µg/100 g.
The present study has confirmed earlier findings about honey composition and its link to the floral source, geographical origin, and climatic conditions, not only with the antioxidant activity [15,16,17,18] but also with their characteristic phenolic profile.
However, Jasicka-Misiak et al. [23] identified even more phenolic compounds in Polish honeys than those identified in the present research. Besides the compounds detected in the samples investigated in the present study, also 3-hydroxybenzoic acid, chlorogenic acid, 4-hydroxybenzoic acid, vanillic acid, syringic acid, rosmarinic acid, ellagic acid, and myricetin in heather honey (Calluna vulgaris), 3,4-dihydroxybenzoic, chlorogenic, 4-hydroxybenzoic, 3-hydroxybenzoic, vanillic, ferulic, p-coumaric, ellagic, rosmarinic acids as well as myricetin in buckwheat honeys (Fagopyrum esculentum) were found. However, they did not find pinocembrin, luteolin, or apigenin. The levels of phenolic compounds identified in the present study for honeys containing dominant heather and accompanying buckwheat pollens are in agreement with the results provided by Jasicka-Misiak et al. [23]. Mostly, the concentrations determined in the present study are in the lower part of the marked range as described in the literature, with the exception of galangin in heather honeys. However, in sample No. 8, the concentrations were much higher than in the study done by Jasicka-Misiak et al. [23]. Socha et al. [29] also identified a higher number of phenolic compounds in Polish honeys. Besides polyphenols determined in the present study, they also found: Gallic acid, ferulic acid, syringic acid, synaptic acid, and chlorogenic acid, as well as chrysin, hesperetin, and naringenin. The ranges of phenolic compounds identified in both studies were more or less similar. Exceptions concerned lower amounts of chrysin, galangin, kaempferol, and quercetin, and the lack of luteolin and apigenin in the study by Socha et al. [29]. Jasicka-Misiak et al. [39] tested Polish yellow sweet clover (Melilotus officinalis) honeys. There, they also identified different profiles of phenolic compounds: Gallic acid, catechin, 4-hydroxybenzoic acid, caffeic acid, 3-hydroxybenzoic acid, p-coumaric acid, ferulic acid, rosmarinic acid, ellagic acid, myricetin, cinnamic acid, quercetin, genistein, pinocembrin, and morin hydrate. The concentrations of polyphenols identified by Jasicka-Misiak [39] were higher than in the present study, with regard to compounds common in both studies.
Moreover, several other research results performed on different varieties all around the world showed qualitative and quantitative differences in the phenolic profiles. Consequently, a phenolic profile is more or less unique.
Serbian polyfloral honeys contained protocatechuic acid, chlorogenic acid, caffeic acid, p-coumaric acid, ellagic acid, rutin, luteolin, quercetin, cis, trans-abscisic acid, apigenin, kaempferol, chrysin, pinocembrin, and galangin. The concentrations of compounds identified in the present study were mostly in the lower part of the ranges, as presented by Gašić et al. [40]. The exceptions were luteolin and quercetin, which showed higher concentrations in the present study. Of note, Gašić et al. [40] did not identify trans-ferulic acid. Habib et al. [41] determined gallic acid, 4-hydroxy-3-methoxybenzoic acid, syringic acid, p-coumaric acid, ferulic acid, cinnamic acid, catechin, epicatechin, and rutin in honeys from arid and non-arid regions. They found much lower concentrations of compounds than in the present study. Can et al. [42] detected gallic acid, protocatechuic acid, p-hydroxybenzoic acid, catechin, vanillic acid, caffeic acid, syringic acid, epicatechin, p-coumaric acid, ferulic acid, rutin, quercetin, apigenin, kaempferol, and isorhamnetin (only in acacia honey) in Turkish honeys. The concentrations of caffeic and p-coumaric acids determined in the present study were in the lower ranges as noted for the Turkish honeys. Similar situation concerned kaempferol. Apart from samples No. 17 and No. 18, the concentrations found in the present study were much higher. Quercetin and apigenin had higher levels in the study described by Can et al. [42]. Pichichero et al. [19] identified gallic acid, chlorogenic acid, p-coumaric acid, caffeic acid, myricetin, quercetin, genistein, kaempferol, apigenin, chrysin, and galangin in Italian honeys. Considering the results of the present and the Italian study, the concentrations of kaempferol and caffeic acid were on a similar level, galangin and chrysin were higher in Italian honeys, quercetin generally similar, but in three cases much higher in Polish honeys, whereas the contents of p-coumaric acid were mostly higher in Polish honeys. Do Nascimento et al. [43] determined gallic, protocatechuic, cinnamic, and p-coumaric acids, as well as quercetin and myricetin in 48 Brazilian honeys. However, it should be noted that protocatechuic was detected only in two, myricetin in three, cinnamic acid in four, and p-coumaric in eight cases. When comparing the results obtained in Brazil with the outcomes of the present study, it can be noted that p-coumaric acid concentrations were higher in Polish honeys, whereas quercetin contents were generally on similar level. Chinese honeys characterized by Zhao et al. [44] contained gallic acid, protocatechuic acid, p-hydroxybenzoic acid, caffeic acid, p-coumaric acid, rutin, rosmarinic acid, quercetin, and kaempferol. The concentrations of caffeic acid and kaempferol were much higher than in the case of Polish honeys of the present study. The determined levels of p-coumaric acid in Polish honeys were in the lower range of the concentrations identified for Chinese honeys. Generally, Chinese honeys also contained more quercetin. There were, however, tree exceptions (samples Nos. 1, 2, and 22), where the concentrations were similar to those noted by Zhao et al. [44]. Oroian and Ropciuc [45] identified apigenin, caffeic acid, chrysin, galangin, gallic acid, isorhamnetin, kaempherol, luteolin, myricetin, p-coumaric acid, pinocembrin, and quercetin in Romanian honeys. Mostly higher concentrations of the detected phenolic compounds than in the case of Polish honeys were suggested, but the form of the results presented made it impossible to make a direct comparison. In Nordic honeys, Salonen et al. [46] determined more diverse phenolic profiles than in the present study. They identified 33 phenolic compounds: 14 cinnamic acid derivatives, 6 phenolic acids, and 13 flavonoids.
3.2. Total Phenolic Content (TPC)
Total phenolic content varied between 3.43 mg GAE/100 g for rapeseed honey (sample No. 17) and 22.33 mg GAE/100 g for multifloral honey, containing buckwheat accompanying pollen (sample No. 11).
Similarly, for Polish honeys, Socha et al. [29] noted the TPC ranging from 4.46 (rapeseed honey) to 15.04 mg GAE/100 g (buckwheat honey). Moreover, Wesołowska and Dżugan [22] determined the TPC in a similar range, i.e., from 8.48 mg GAE/100 g (for linden honey) to 28.15 mg GAE/100 g (for buckwheat honey) for honeys of Polish origin. Nevertheless, generally higher TPC for Polish honeys was determined, ranging from 69.4 mg GAE/100 g for willow honey to 160.7 mg GAE/100 g for buckwheat honey [47], from 14.28 mg GAE/100 g for black locust honey to 111.3 mg GAE/100 g for buckwheat honey [48], from 17.57 mg GAE/100 g for rapeseed honey to 189.52 mg GAE/100 g for heather honey [28], as well as from 67.55 mg GAE/100 g for yellow sweet clover honeys [38], or from 59.9 mg GAE/100 g for heather honey to 121.4 mg GAE/100 g for buckwheat honey [23].
Accordingly, the results of research conducted in different parts of the world indicate a high variation of TPC and show that the results obtained in the present study are mostly in lower ranges. Romanian heather honeys tested by Moise et al. [49] contained, on average, 54.22 mg GAE/100 g of phenolic compounds. Pérez Martín et al. [50] noted the average TPC of 102 mg GAE/100 g for Spanish honeydew honeys and 45 mg GAE/100 g for nectar Spanish honeys. Bertoncelj et al. [51] for Slovenian honeys measured total phenol content from 44.8 (acacia honey) to 241.4 mg GAE/kg (for honeydew honey). The TPC of Brazilian eucalyptus honeys and wild honeys examined by Bueno-Costa et al. [51] fluctuated from 61.16 to 111.37 mg GAE/100 g. Moreover, Do Nascimento et al. [43] determined TPC in the range of 26.0 to 100.0 mg GAE/100 g for Brazilian honeys [52]. Similar values were detected for Sicilian monofloral honeys with 16.5 to 133.3 mg GAE/100 g [53], for Tunisian honeys (32.17 to 119.42 mg GAE/100 g [54], Can et al. [42] for Turkish honeys (16.02 to 120.04 mg GAE/100 g), Habib et al. [41] (30.81 to 132.6 mg GAE/100 g), or Flanjak et al. [8] for Croatian honey (39.1 to 318.6 mg GAE/100 g). Alvarez-Suarez et al. [55], on the other hand, detected an average value of 54.30 mg GAE/100 g for polyfloral honeys from Cuba. Serem and Bester [56] noted TPC ranging from 68.85 to 167.96 mg GAE/100 g for southern African honeys. Spanish honeys studied by Escuredo et al. [57] contained, on average, 112.8 mg GAE/100 g, with the lowest value of 78.4 mg GAE/100 g for eucalyptus honey and the highest of 181 mg GAE/100 g for heather honey. Honeydew honeys studied by Flores, Escuredo and Seijo [31] contained, on average, 100 to 154.4 mg GAE/100 g polyphenols, depending on the production year. Gašić et al. [40] determined the TPC ranging from 6 to 136 mg GAE/kg for Serbian polyfloral honeys. The TPC of Chinese honeys ranged from 33.3 to 50.2 mg GAE/100 g [44] and from 13.5 to 63.9 mg GAE/100 g [58]. A wide range of TPC was noted by Noor et al. [59] for Pakistani honeys (1.33 to 252 mg GAE/100 g). The TPC of Palestinian honeys ranged from 26.9 to 70.7 mg GAE/100 g [60]. Nevertheless, there are studies showing similar TPC ranges as obtained in the present study. Czech honeys had the TPC ranging from 8.36 mg GAE/100 g for linden honey to 24.25 mg GAE/100 g for honeydew honey [61], Nordic honeys from 0.94 mg GAE/100 g for willow honey to 5.52 mg GAE/100 g for heather honey [46] and Italian honeys from 6.05 mg GAE/100 g (Sulla honey) to 27.6 mg GAE/100 g (honeydew honey) [19].
3.3. Total Antioxidant Activity (AOX)
The antioxidant activity of the honey samples tested varied between 41.42 mg GAE/100 g for rapeseed honey (sample No. 21) and 83.16 mg GAE/100 g also for rapeseed honey (sample No. 16).
By comparison, Czech honeys studied by Lachman et al. [61] showed generally lower antioxidant activity. Those values ranged from 9.87 to 44.2 mg GAE/kg. It is, however, difficult to compare values with the literature because of different presentation of the results (e.g., expressed as percentage inhibition of DPPH or further radicals). Nevertheless, the results obtained by other authors show high variability in honeys [15,16,17,18], indicating that the floral source, geographical origin, and ecophysiological conditions affect the antioxidant properties of honey. For instance, Bertoncelj et al. [51] noted DPPH-IC50 values from 8.1 to 13.9 mg/mL for Slovenian honeys, Zhao et al. [44] 87.5 to 136.2 mg/mL for Chinese honeys, Al-Farsi et al. [62] 7.8 to 72.3 mg/mL for Omani honeys, Flanjak et al. [8] 8.69 to 125.48 mg/mL for Croatian honeys, Escuredo et al. [57] 8.6 and 17.8 mg/mL for Spanish honeys. Sicilian monofloral honeys as characterized by Attanzio et al. [53] showed antioxidant activity (DPPH assay) ranging from 8.5 to 238.4 μmol TE/100 g, whereas honeys from Southern Africa ranged from 42 to 372 μmol TE/100 g [56]. The average antioxidant activity (expressed as DPPH radical scavenging activity) of Romanian heather honeys was 56% [49], whereas for Spanish honeydew and nectar honeys 60.8% and 34.8% were determined accordingly [50].
A high variability of radical scavenging activity in DPPH assay results can also be noticed in Polish honeys: Wesołowska and Dżugan [22] noted an average value of 12.4% for linden honey, 13.6% for rapeseed honey, and 48.6% for buckwheat honey, whereas Socha et al. [29] reported 34.5%, 18.2%, and 46.4% accordingly, and Wilczyńska [28] 100% for buckwheat honey. However, the results for Polish honeys show the tendency of higher radical scavenging activity with regard to darker colored honeys [22,28,29,48].
When evaluating the contribution of colored compounds to antioxidant activity, two fractions have to be kept in mind. Melanins that are formed from the oxidation (‘browning’) of polyphenols, usually catalyzed by (plant) endogenous enzymes [63], but also non-enzymatic browning, often described as the Maillard reaction. The latter is occurring in honey as well, as the hive has a certain temperature, leading to reactions of sugars and amino compounds (e.g., proteins, peptides, amino acids), ending up in the formation of melanoidins. Gaining additional complexity, Brudzynski and Miotto [64] showed for honey that the heat treatment causes increased incorporation of phenolics during the formation of high molecular weight melanoidins.
Melanins, as well as melanoidins, are very good antioxidants [65,66,67]. Resulting from the chemical structure, the polymerization of phenolic compounds provides numerous structural features (e.g., aromatic rings, double bonds, hydroxyl groups) for scavenging radicals. Almost similar structures can be found in melanoidins, which result from the well-known Maillard reaction [66,67]. Moreover, two types of covalent protein-polyphenol-reaction products have been described in honey. In that case, oligomerization of phenolic monomers occurred prior to protein binding [68].
3.4. Color Parameters (L*, a*, b*)
The color of honey depends on the floral source and mineral content and usually varies between water white to dark amber [69]. In the present study, L* color parameter ranged from 23.18 (for honeydew honey) to 59.91 (for multifloral honey with significant amounts of linden and white/sweet clover pollens), whereas b* parameter ranged from −1.61 (for multifloral honey with significant amounts of linden and white/sweet clover pollens) to 11.6 (for multifloral honey with significant amounts of white/sweet clover, phacelia and buckwheat pollens). An a* parameter ranged from 7.59 (for rapeseed honey) to 31.33 (for multifloral honey with significant amounts of white/sweet clover, phacelia and buckwheat pollens).
In general, the color values determined were in a similar range, as reported in the literature [8,48]. For Croatian honeys, Flanjak et al. [8] noted average L* values ranging from 29.07 (for honeydew honey) to 46.15 (for black locust honey), a* values from −1.08 (for black locust honey) to 7.95 (for chestnut honey), and b* values from 4.79 (for honeydew honey) to 19.62 (for lime honey). For Polish honeys, Kuś et al. [48] determined L* values ranging from 41.5 for (buckwheat honey) to 86.2 for (black locus honey), a* values from −1.6 (for black locust honey) to 31.9 (for buckwheat honey), and b* values from 19.6 (for black locust honey) to 69.2 (for buckwheat honey). Comparable values for L* and a* were also noted by Bertoncelj et al. [51] for Slovenian mulitfloral honeys. There, L* values ranged from 50.30 to 57.30 (53.87 on average), whereas a* values were from −0.90 to 5.77 (2.25 on average), and b* values between 43.10 and 49.22 (46.45 on average).
3.5. Comparison of Organic and Conventional Samples
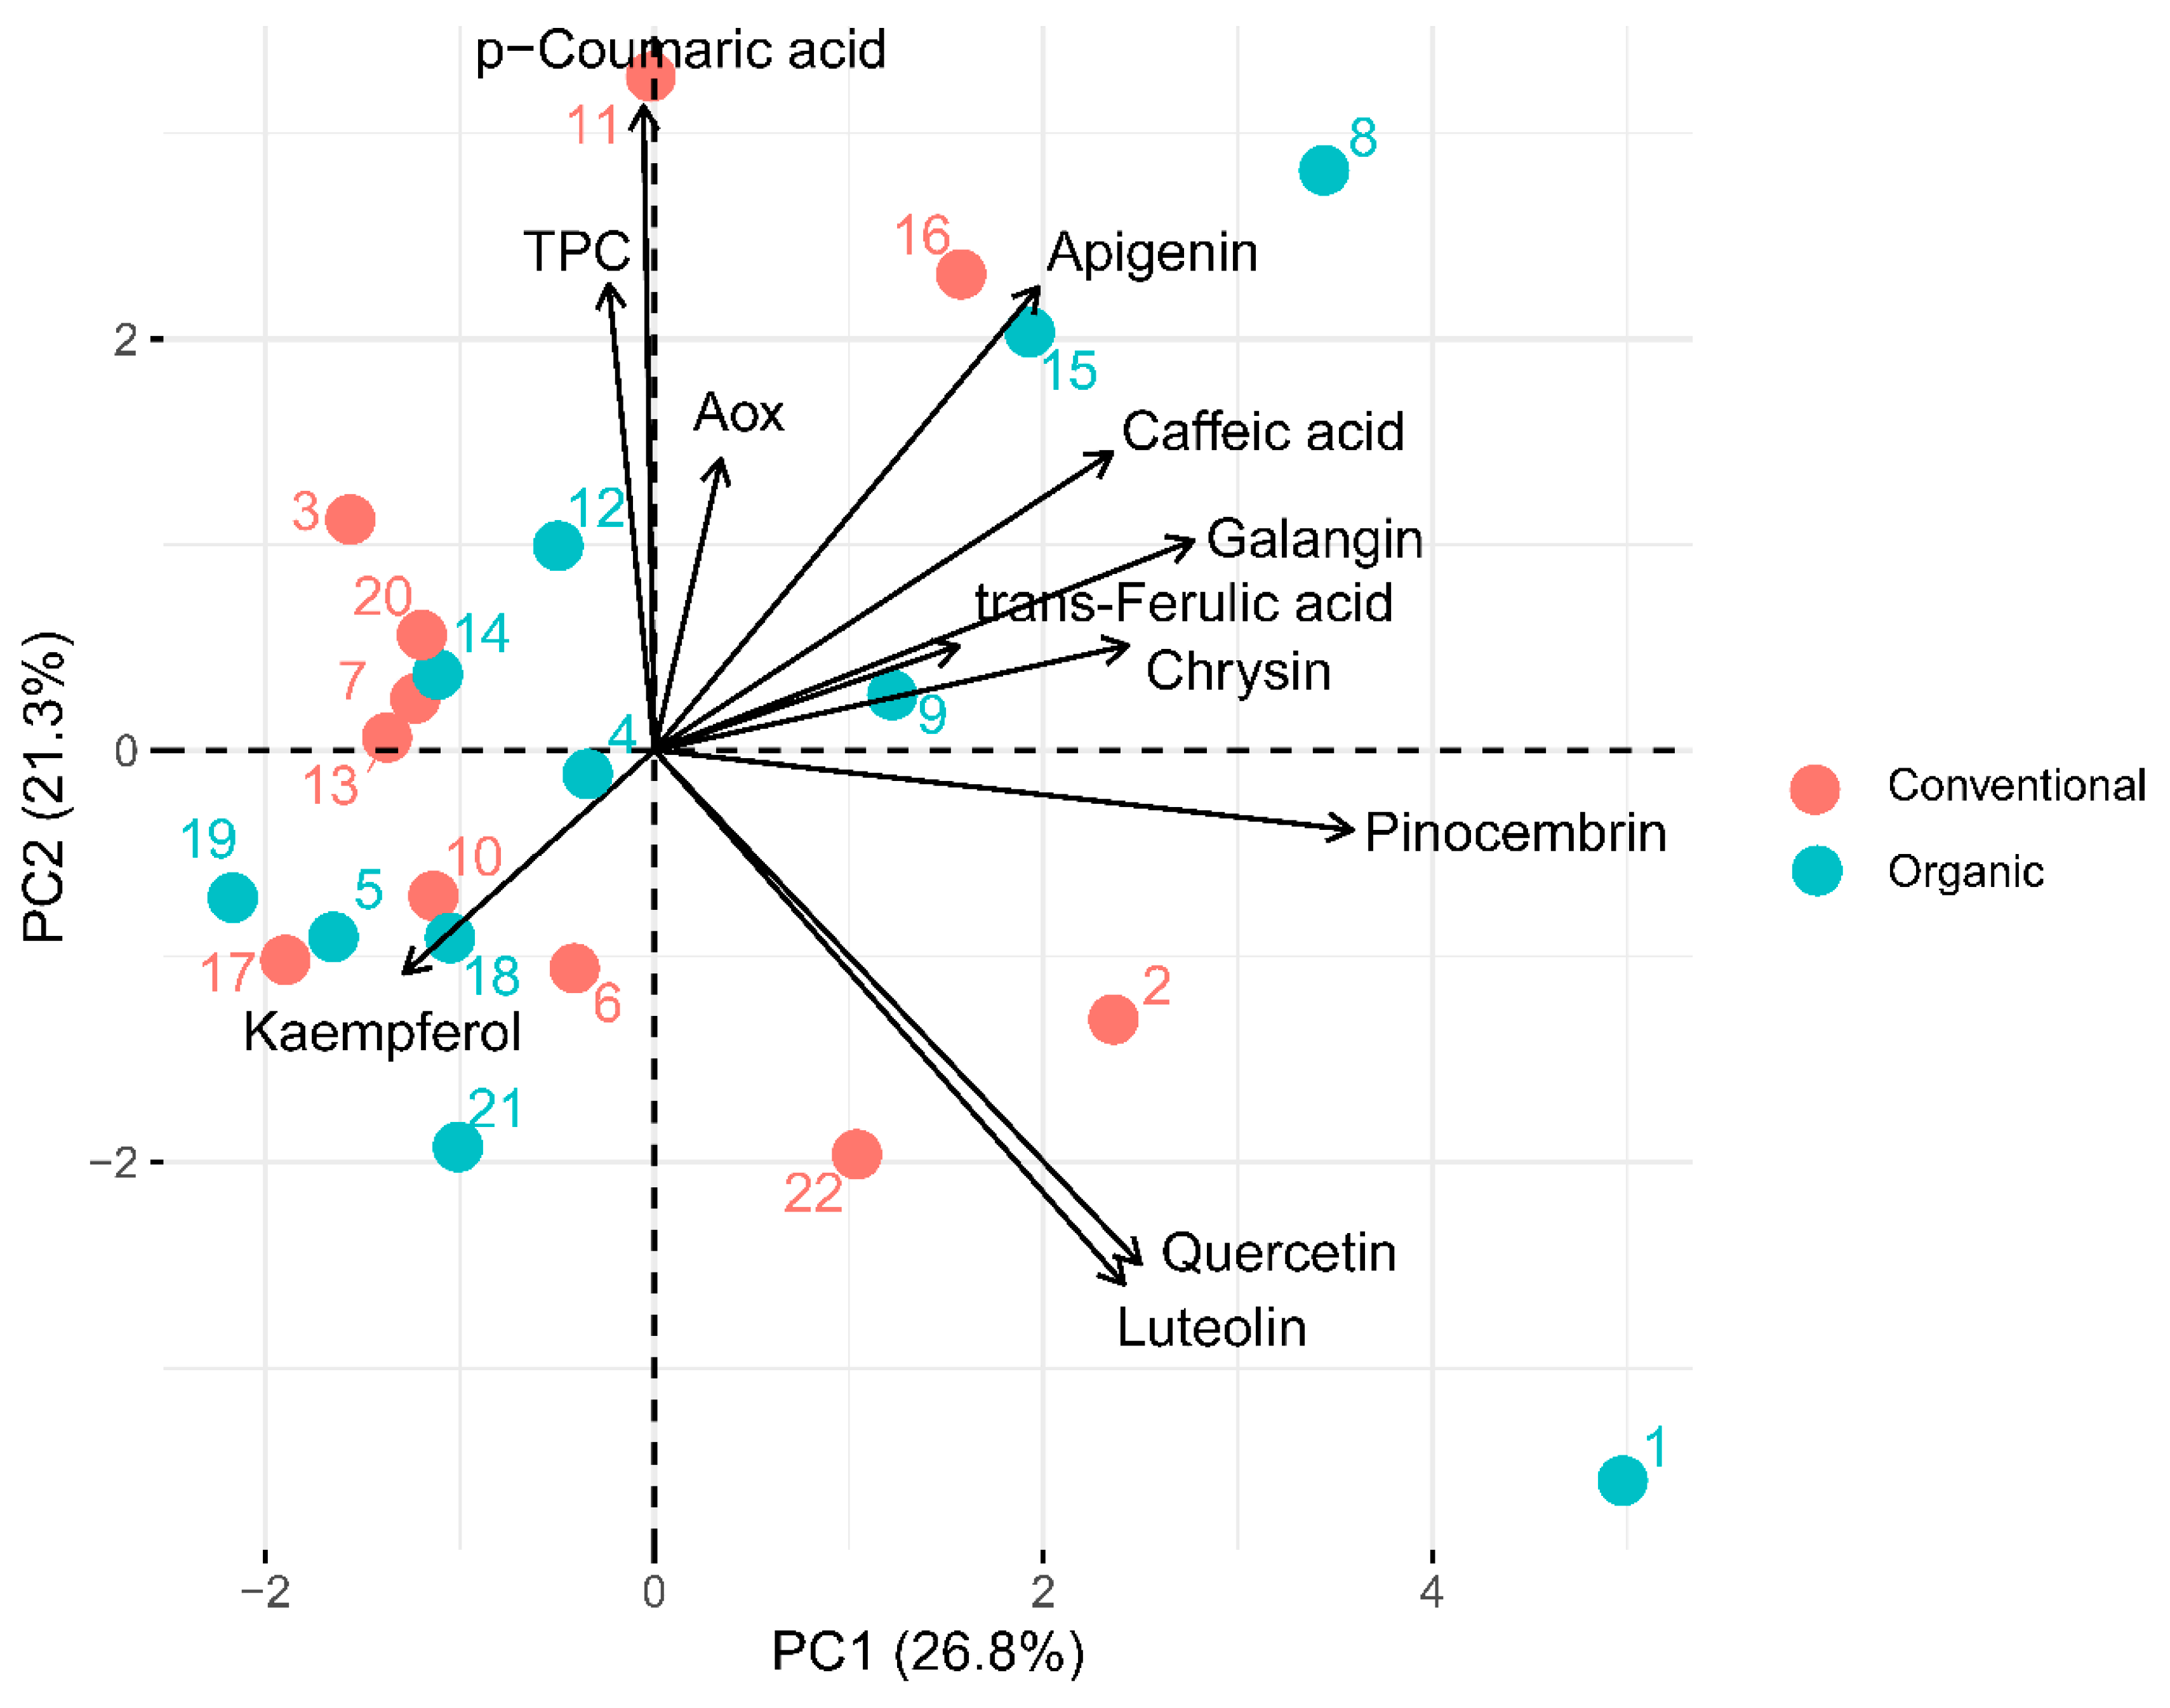
In order to compare organic and conventional honey samples, the PCA method was applied. The first two main components explained 49.71% of the total variance, with the first component (PC1) 28.18% and the second one (PC2) 21.53%.
Based on the biplot (Figure 1), it can be noticed that the first component indicates high concentrations of apigenin, caffeic acid, galangin, chrysin, pinocembrin, quercetin, and luteolin, but low concentrations of kaempferol in the products. The second component indicates a high TPC and a high content of p-coumaric acid and apigenin with low concentrations of quercetin and luteolin.
Moreover, Figure 1 shows that straightforward discrimination of organic and conventional samples is not possible. The results of the analysis show that most of the samples tested had low concentrations of the first component. The other samples (sample Nos. 1, 2, and 22) were characterized by high concentrations of pinocembrin, quercetin, and luteolin, whereas samples Nos. 8, 9, 15, and 16 by high concentrations of apigenin, caffeic acid, galangin, and chrysin.
On the other hand, the comparison of the average concentrations of the single polyphenols, AOX, TPC, and L* a* b* color parameters proved that organic honeys contain significantly more chrysin than their corresponding conventional counterparts (Table 3).
3.6. Correlations between Tested Parameters of Honey
As only the average content of chrysin seems to make the differentiation of organic and conventional honeys possible, correlations between pollen content and phenolic profile along with AOX, TPC, and color parameters (L*, a*, B*) were tested as well.
In total, 47 statistically significant correlations were detected (Table 4). There were strong, positive correlations with regard to buckwheat pollen and three further parameters (TPC, a*, b*). In this way, it was confirmed that buckwheat pollen strongly adds red and yellow tones to the color of honey. It also moderately negatively affects the lightness of honey. On the other hand, plum/apple trees and chervil pollens have a positive influence on the lightness of honey. Moreover, buckwheat honeys scored the highest AOX among all samples tested. However, the high impact of buckwheat pollen on TPC was not reflected in its correlation with AOX. Buckwheat pollen only moderately correlated with p-coumaric acid, which is further, according to Socha et al. [29], weakly correlated with the antioxidant activity of honey. In contrast to buckwheat pollen, chervil pollen affected the TPC moderately negatively. The concentrations of selected polyphenols were correlated with specific pollens in the present study, as well: Pinocembrin showed moderate, positive correlation with white/sweet clover pollen, kaempferol with rapeseed pollen, and luteolin with chervil. However, kaempferol was moderately negatively correlated with buckwheat pollen and p-coumaric acid with willow pollen.
Besides existing interdependencies between color parameters, the TPC was also correlated with them. In the case of b* values, the correlation was strong and positive, in the case of a* values moderate and positive, whereas in the case of L* values moderate and negative. This means that the higher the TPC, the more yellow and red color tones honey has. At the same time, honey is darker. Similar results were noted by Bertoncelj et al. [51], Kuś et al. [48], and Kavanagh et al. [15]. In the present study, the light color of honey was also moderately negatively correlated with AOX and p-coumaric acid. As mentioned above, other studies also showed that a higher antioxidant activity can be found in the case of a darker color of the honey samples, resulting from higher concentrations of melanoidins, being comparatively good antioxidants [59].
The correlations between selected phenolic compounds were determined, as well. A particularly interesting finding was the existence of strong dependencies between the concentrations of pinocembrin and galangin. Of note, these two compounds are reported to ameliorate insulin resistance [70]. Moderate correlations with regard to the pairs luteolin and quercetin, chrysin and pinocembrin, caffeic acid and pinocembrin, chrysin and apigenin, as well as chrysin and galangin were observed. These dependencies may indicate that some polyphenols can be expected to occur together in honey.
Although some authors indicated that the phenolic compounds in honey significantly contribute to its antioxidant activity and capacity, e.g., [8,12,19,20,21,29,48,71], in the present study an only moderate positive correlation between AOX and TPC was determined. This suggests that the antioxidant activity of honey is diversified and as stated by Gheldof et al. [3,72] does not solely result from phenolic compounds, but seems to be a consequence of the combined activity of phenolic compounds, melanins thereof, peptides, organic acids, enzymes, and Maillard reaction products.
In this way, the earlier mentioned lack of correlation between AOX and buckwheat pollen, despite a strong interdependence between the TPC and buckwheat pollen, can be explained. Buckwheat pollen seems to be associated with high amounts of polyphenol compounds of weak or moderate antioxidant activity. A positive dependence between the antioxidant activity of honey, determined by the oxygen radical absorbance capacity (ORAC) assay, and the TPC was also noted by Gheldof and Engeseth [73]. Nevertheless, in their research, the correlation was strong (R2 = 0.9497). However, as stated by Küçük et al. [74] and Gül and Pehlivan [75], the mismatch between the content of phenolic substances and the antioxidant activity can be explained by the varying radical scavenging activities of the phenolic compounds compiled in the varying profiles.
4. Conclusions
The findings of the present study contribute to the discussion on the health benefits of organic farming by indicating significant differences concerning chrysin as a marker compound.
Moreover, the elaborated phenolic profiles, which include pollen contents, vastly contribute to increasing knowledge about Polish honeys. The PCA results have shown that most of the samples had a high content of apigenin, caffeic acid, galangin, chrysin, pinocembrin, quercetin, and luteolin, while they were low in kaempferol. However, the concentrations were mostly in the lower part of the ranges, as described in other studies. Moreover, the TPC values were within the ranges of Polish honeys, already described in the literature. Total antioxidant activity analysis results are also in line with earlier studies, indicating that darker colored honeys in comparison to the light-colored ones, have a higher AOX. The determined values of the L*a*b* color parameters were in similar ranges to those reported in the literature.
Furthermore, the present study not only confirmed the link between TPC and color (the higher TPC, the more yellow and red color tones can be observed in honey) but also indicated positive influences on the lightness of honey resulting from plum/apple tree and chervil pollens. The light color of honey was moderately, negatively correlated with AOX and p-coumaric acid content.
Despite the fact that some authors pointed out that the phenolic compounds in honey significantly contribute to its antioxidant activity, in the present study, only a moderate positive correlation between AOX and TPC was found.
An additional value of this research is that it has indicated the correlation of pinocembrin and galangin, two very interesting compounds in honey that are reported to ameliorate insulin resistance.
Author Contributions
Methodology, V.P., S.G. and M.H.; software, V.P.; validation, V.P., S.G.; formal analysis, V.P., S.G.; investigation, V.P., S.G., M.H.; resources, S.P.; data curation, M.H.; writing—original draft preparation, M.H., S.R.; writing—review and editing, M.H., S.R.; visualization, V.P.; supervision, M.H., S.R.; project administration, M.H.; funding acquisition, M.H. All authors have read and agreed to the published version of the manuscript.
Funding
This research was funded by the National Science Center, Poland, grant number DEC-2017/01/X/NZ9/00001.
Acknowledgments
Special thanks go to Fabian Mazenauer and Katrin Jedrys for participation in sample preparation.
Conflicts of Interest
The authors declare no conflict of interest.
References
- David, W.B. The chemical composition of honey. J. Chem. Educ. 2007, 84, 1647. [Google Scholar]
- Al-Mamary, M.; Al-Meeri, A.; Al-Habori, M. Antioxidant activities and total phenolics of different types of honey. Nutr. Res. 2002, 22, 1041–1047. [Google Scholar] [CrossRef]
- Gheldof, N.; Wang, X.; Engeseth, N.J. Identification and quantification of antioxidant components of honeys from various floral sources. J. Agric. Food Chem. 2002, 50, 5870–5877. [Google Scholar] [CrossRef]
- Schramm, D.D.; Karim, M.; Schrader, H.R.; Holt, R.R.; Cardetti, M.; Keen, C.L. Honey with high levels of antioxidants can provide protection to healthy human subjects. J. Agric. Food Chem. 2003, 51, 1732–1735. [Google Scholar] [CrossRef]
- Vela, L.; de Lorenzo, C.; Pérez, R.A. Antioxidant capacity of Spanish honeys and its correlation with polyphenol content and other physicochemical properties. J. Sci. Food Agric. 2007, 87, 1069–1075. [Google Scholar] [CrossRef]
- Chua, L.S.; Rahaman, N.L.A.; Adnan, N.A.; Eddie Tan, T.T. Antioxidant activity of three honey samples in relation with their biochemical components. J. Anal. Methods Chem. 2013, 8. [Google Scholar] [CrossRef]
- Elbanna, K.; Attalla, K.; Elbadry, M.; Abdeltawab, A.; Gamal-Eldin, H.; Fawzy Ramadan, M. Impact of floral sources and processing on the antimicrobial activities of different unifloral honeys. Asian Pacific J. Trop. Diss. 2014, 4, 194–200. [Google Scholar] [CrossRef]
- Flanjak, I.; Kenjeric, D.; Bubalo, D.; Primorac, L. Characterisation of selected Croatian honey types based on the combination of antioxidant capacity, quality parameters, and chemometrics. Eur. Food Res. Technol. 2016, 242, 467–475. [Google Scholar] [CrossRef]
- Kıvrak, S.; Kıvrak, I. Assessment of phenolic profile of Turkish honeys. Int. J. Food Prop. 2017, 20, 864–876. [Google Scholar] [CrossRef] [Green Version]
- Alvarez-Suarez, J.M.; Giampieri, F.; Battino, M. Honey as a source of dietary antioxidants: Structures, bioavailability and evidence of protective effects against human chronic diseases. Curr. Med. Chem. 2013, 20, 621–638. [Google Scholar] [CrossRef] [PubMed]
- Sousa, J.M.; de Souza, E.L.; Marques, G.; Meireles, B.; de Magalhães Cordeiro, Â.T.; Gullón, B.; Pintado, M.M.; Magnani, M. Polyphenolic profile and antioxidant and antibacterial activities of monofloral honeys produced by Meliponini in the Brazilian semiarid region. Food Res. Int. 2016, 84, 61–68. [Google Scholar] [CrossRef]
- Baek, Y.; Kim, Y.J.; Baik, M.; Kim, D.; Lee, H. Total Phenolic Contents and Antioxidant Activities of Korean Domestic Honey from Different Floral Sources. Food Sci. Biotechnol. 2015, 24, 1453–1457. [Google Scholar] [CrossRef]
- Badolato, M.; Carullo, G.; Cione, E.; Aiello, F.; Caroleo, M.C. From the hive: Honey, a novel weapon against cancer. Eur. J. Med. Chem. 2017, 142, 290–299. [Google Scholar] [CrossRef] [PubMed]
- Anklam, E.A. Review of the analytical methods to determine the geographical and botanical origin of honey. Food Chem. 1998, 63, 549–562. [Google Scholar] [CrossRef]
- Kavanagh, S.; Gunnoo, J.; Passos, T.M.; Stout, J.C.; White, B. Physicochemical properties and phenolic content of honey from different floral origins and from rural versus urban landscapes. Food Chem. 2019, 272, 66–75. [Google Scholar] [CrossRef]
- Subramanian, A.P.; John, A.A.; Vellayappan, M.V.; Balaji, A.; Jaganathan, S.K.; Mandal, M.; Supriyant, E. Honey and its phytochemicals: Plausible agents in combating colon cancer through its diversified action. J. Food Biochem. 2016, 40, 613–629. [Google Scholar] [CrossRef]
- Di Marco, G.; Manfredini, A.; Leonardi, D.; Canuti, L.; Impei, S.; Gismondi, A.; Canini, A. Geographical, botanical and chemical profile of monofloral Italian honeys as food quality guarantee and territory brand. Plant. Biosyst. 2017, 151, 450–463. [Google Scholar] [CrossRef]
- Al, M.L.; Daniel, D.; Moise, A.; Bobis, O.; Laslo, L.; Bogdanov, S. Physicochemical and bioactive properties of different floral origin honeys from Romania. Food Chem. 2009, 112, 863–867. [Google Scholar] [CrossRef]
- Pichichero, E.; Canuti, L.; Canini, A. Characterisation of the phenolic and flavonoid fractions and antioxidant power of Italian honeys of different botanical origin. J. Sci. Food Agric. 2009, 89, 609–616. [Google Scholar] [CrossRef]
- Paramas, A.M.G.; Barez, J.A.G.; Marcos, C.C.; Garcıa-Villanova, R.J.; Sanchez, J.S. HPLC-fluorimetric method for analysis of amino acids in products of the hive (honey and bee-pollen). Food Chem. 2006, 95, 146–156. [Google Scholar] [CrossRef]
- Blasa, M.; Candiracci, M.; Accorsi, A.; Piacentini, M.P.; Albertini, M.C.; Piatti, E. Raw Millefiori honey is packed full of antioxidants. Food Chem. 2006, 97, 217–222. [Google Scholar] [CrossRef]
- Wesołowska, M.; Dżugan, M. The Use of the PHOTOCHEM Device in Evaluation of Antioxidant Activity of Polish Honey. Food Anal. Methods 2017, 10, 1568–1574. [Google Scholar] [CrossRef]
- Jasicka-Misiak, I.; Poliwoda, A.; Dereń, M.; Kafarski, P. Phenolic compounds and abscisic acid as potential markers for the floral origin of two Polish unifloral honeys. Food Chem. 2012, 131, 1149–1156. [Google Scholar] [CrossRef]
- Tezcan, F.; Kolayli, S.; Sahin, H.; Ulusoy, E.; Erim, F.B. Evaluation of organic acid, saccharide composition and antioxidant properties of some authentic Turkish honeys. J. Food Nutr. Res. 2011, 50, 33–40. [Google Scholar]
- Matt, D.; Rembiałkowska, E.; Luik, A.; Peetsmann, E.; Pehme, S. Quality of Organic vs Conventional Food and Effects on Health: Report; Estonian University of Life Sciences: Tartu, Estonia, 2011. [Google Scholar]
- Wilczyńska, A.; Przybyłowski, P.; Rój, A. Próba identyfikacji związków fenolowych w miodach pszczelich (An attempt to identify by the phenolics content of honey). Bromat. Chem. Toksykol. 2005, XXXVII, 197–201. [Google Scholar]
- Wilczyńska, A.; Przybyłowski, P.; Rój, A. Investigations of phenolic acids and abscisic acid in different types of honey. In Current Trends in Commodity Science, Proceedings of the 8th International Commodity Science Conference; Poznan University of Economics Publishing: Tartu, Estonia, 2005; pp. 1298–1303. [Google Scholar]
- Wilczyńska, A. Phenolic content and antioxidant activity of different types of polish honey—A short report. Pol. J. Food Nutr. Sci. 2010, 60, 309–313. [Google Scholar]
- Socha, R.; Juszczak, L.; Pietrzyk, S.; Gałkowska, D.; Fortuna, T.; Witczak, T. Phenolic profile and antioxidant properties of Polish honeys. Int. J. Food Sci. Technol. 2011, 46, 528–534. [Google Scholar] [CrossRef]
- Louveaux, J.; Maurizio, A.; Vorwohl, G. Methods of melissopalynology (republished and updated). Bee World 1978, 59, 139–157. [Google Scholar] [CrossRef]
- Flores, M.S.R.; Escuredo, O.; Seijo, M.C. Assessment of physicochemical and antioxidant characteristics of Quercus pyrenaica honeydew honeys. Food Chem. 2015, 166, 101–106. [Google Scholar] [CrossRef]
- Moar, N.T. Pollen analysis of New Zealand honey. New Zeal. J. Agr. Res. 1985, 28, 39–70. [Google Scholar] [CrossRef]
- Yao, L.; Jiang, Y.; Singanusong, R.; Datta, N.; Raymont, K. Phenolic acids and abscisic acid in Australian Eucalyptus honeys and their potential for floral authentication. Food Chem. 2004, 86, 169–177. [Google Scholar] [CrossRef]
- Singleton, V.L.; Rossi, J.A. Colorimetry of Total Phenolics with Phosphomolybdic-Phosphotungstic Acid Reagents. Am. J. Enol. Viticult. 1965, 16, 144–158. [Google Scholar]
- Pedan, V.; Popp, M.; Rohn, S.; Nyfeler, M.; Bongartz, A. Characterization of Phenolic Compounds and Their Contribution to Sensory Properties of Olive Oil. Molecules 2019, 24, 2041. [Google Scholar] [CrossRef] [PubMed] [Green Version]
- McLaren, K. The development of the CIE 1976 (L*a*b*) Uniform Colour-Space and Colour-Difference Formula. J. Soc. Dyers Colour. 1976, 92, 338–341. [Google Scholar] [CrossRef]
- R Core Team. R: A Language and Environment for Statistical Computing; R Foundation for Statistical Computing: Vienna, Austria, 2019. [Google Scholar]
- Hinkle, D.E.; Wiersma, W.; Jurs, S.G. Applied Statistics for the Behavioral Sciences, 5th ed.; Houghton Mifflin: Boston, MA, USA, 2003. [Google Scholar]
- Jasicka-Misiak, I.; Makowicz, E.; Stanek, N. Polish Yellow Sweet Clover (Melilotus officinalis L.) Honey, Chromatographic Fingerprints, and Chemical Markers. Molecules 2017, 22, 138. [Google Scholar] [CrossRef] [Green Version]
- Gašić, U.; Kečkeš, S.; Dabić, D.; Trifković, J.; Milojković-Opsenica, D.; Natić, M.; Tešić, Ž. Phenolic profile and antioxidant activity of Serbian polyfloral honeys. Food Chem. 2014, 145, 599–607. [Google Scholar] [CrossRef]
- Habib, H.M.; Al Meqbali, F.T.; Kamal, H.; Souka, U.D.; Ibrahim, W.H. Bioactive components, antioxidant and DNA damage inhibitory activities of honeys from arid regions. Food Chem. 2014, 153, 28–34. [Google Scholar] [CrossRef]
- Can, Z.; Oktay, Y.; Sahin, H.; Turumtay, E.A.; Silic, S.; Kolayli, S. An investigation of Turkish honeys: Their physicochemical properties, antioxidant capacities and phenolic profiles. Food Chem. 2015, 180, 133–141. [Google Scholar] [CrossRef]
- Do Nascimento, K.S.; Sattler, J.A.G.; Macedo, L.F.L.; González, C.V.S.; de Melo, I.L.P.; da Silva Araújo, E.; Granato, D.; Sattler, A.; de Almeida-Muradian, L.B. Phenolic compounds, antioxidant capacity and physicochemical properties of Brazilian Apis mellifera honeys. LWT-Food Sci. Technol. 2018, 91, 85–94. [Google Scholar] [CrossRef]
- Zhao, H.; Cheng, N.; He, L.; Peng, G.; Xue, X.; Wu, L.; Cao, W. Antioxidant and hepatoprotective effects of A. cerana honey against acute alcohol-induced liver damage in mice. Food Res. Int. 2017, 101, 35–44. [Google Scholar] [CrossRef]
- Oroian, M.; Ropciuc, S. Romanian honey authentication using voltammetric electronic tongue. Correlation of voltammetric data with physico-chemical parameters and phenolic compounds. Comput. Electron. Agr. 2019, 157, 371–379. [Google Scholar] [CrossRef]
- Salonen, A.; Virjamo, V.; Tammela, P.; Fauch, L.; Julkunen-Tiitto, R. Screening bioactivity and bioactive constituents of Nordic unifloral honeys. Food Chem. 2017, 237, 214–224. [Google Scholar] [CrossRef] [PubMed] [Green Version]
- Moskwa, J.; Borawska, M.H.; Markiewicz-Zukowska, R.; Puscion-Jakubik, A.; Naliwajko, S.K.; Socha, K.; Soroczynska, J. Polish Natural Bee Honeys Are Anti-Proliferative and Anti-Metastatic Agents in Human Glioblastoma multiforme U87MG Cell Line. PLoS ONE 2014, 9, 1–9. [Google Scholar] [CrossRef] [PubMed]
- Kuś, P.M.; Congiu, F.; Teper, D.; Sroka, Z.; Jerković, I.; Tuberoso, C.I.G. Antioxidant activity, color characteristics, total phenol content and general HPLC fingerprints of six Polish unifloral honey types. LWT-Food Sci. Technol. 2014, 55, 124–130. [Google Scholar] [CrossRef]
- Moise, A.; Liviu, A.M.; Dezmirean, D.; Bobis, O. Nutraceutical properties of Romanian heather honey. Nutr. Food Sci. 2013, 43, 218–227. [Google Scholar] [CrossRef]
- Pérez Martín, R.A.; Hortigüela, L.V.; Lozano, P.L.; Cortina, M.D.R.; de Lorenzo Carretero, C. In Vitro Antioxidant and Antimicrobial Activities of Spanish Honeys. Int. J. Food Prop. 2008, 11, 727–737. [Google Scholar] [CrossRef]
- Bertoncelj, J.; Doberšek, U.; Jamnik, M.; Golob, T. Evaluation of the phenolic content, antioxidant activity and colour of Slovenian honey. Food Chem. 2007, 105, 822–828. [Google Scholar] [CrossRef]
- Bueno-Costa, F.M.; Zambiazi, R.C.; Bohmer, B.W.; Chaves, F.C.; da Silva, W.P.; Zanusso, J.T.; Dutra, I. Antibacterial and antioxidant activity of honeys from the state of Rio Grande do Sul. Brazil. LWT-Food Sci. Technol. 2016, 65, 333–340. [Google Scholar] [CrossRef] [Green Version]
- Attanzio, A.; Tesoriere, L.; Allegra, M.; Livrea, M.A. Monofloral honeys by Sicilian black honeybee (Apis mellifera ssp. sicula) have high reducing power and antioxidant capacity. Food Sci. 2016, 2, 1–18. [Google Scholar] [CrossRef] [Green Version]
- Boussaid, A.; Chouaibi, M.; Rezig, L.; Hellal, R.; Donsì, F.; Ferrari, G.; Hamdi, S. Physicochemical and bioactive properties of six honey samples from various floral origins from Tunisia. Arab. J. Chem. 2014, 11, 265–274. [Google Scholar] [CrossRef] [Green Version]
- Alvarez-Suarez, J.M.; Giampieri, F.; Brenciani, A.; Mazzoni, L.; Gasparrini, M.; González--Paramás, A.M.; Santos-Buelga, C.; Morroni, G.; Simoni, S.; Forbes-Hernández, T.Y.; et al. Apis mellifera vs melipona beecheii cuban polifloral honeys: A comparison based on their physicochemical parameters, chemical composition and biological properties. LWT–Food Sci. Technol. 2018, 87, 272–279. [Google Scholar] [CrossRef]
- Serem, J.C.; Bester, M.J. Physicochemical properties, antioxidant activity and cellular protective effects of honeys from southern Africa. Food Chem. 2012, 133, 1544–1550. [Google Scholar] [CrossRef]
- Escuredo, O.; Miguez, M.; Maria Fernandez-Gonzalez, M.; Seijo, M.C. Nutritional value and antioxidant activity of honeys produced in a European Atlantic area. Food Chem. 2013, 138, 851–856. [Google Scholar] [CrossRef] [PubMed]
- Guo, P.; Deng, Q.; Lu, Q. Anti-alcoholic effects of honeys from different floral origins and their correlation with honey chemical compositions. Food Chem. 2019, 286, 608–615. [Google Scholar] [CrossRef] [PubMed]
- Noor, N.; Sarfraz, R.A.; Ali, S.; Shahid, M. Antitumour and antioxidant potential of some selected Pakistani honeys. Food Chem. 2014, 143, 362–366. [Google Scholar] [CrossRef] [PubMed]
- Imtara, H.; Elamine, Y.; Lyoussi, B. Physicochemical characterization and antioxidant activity of Palestinian honey samples. Food Sci. Nutr. 2018, 6, 2056–2065. [Google Scholar] [CrossRef]
- Lachman, J.; Orsák, M.; Hejtmánková, A.; Kovářová, E. Evaluation of antioxidant activity and total phenolics of selected Czech honeys. LWT-Food Sci. Technol. 2010, 43, 52–58. [Google Scholar] [CrossRef]
- Al-Farsi, M.; Al-Amri, A.; Al-Hadhrami, A.; Al-Belushi, S. Color, flavonoids, phenolics and antioxidants of Omani honey. Heliyon 2018, 4, 1–14. [Google Scholar] [CrossRef] [Green Version]
- Nicolas, J.J.; Richard-Forget, F.C.; Goupy, P.M.; Amoit, M.; Aubert, S.Y. Enzymatic browning reactions in apple and apple products. Crit. Rev. Food Sci. Nutr. 1994, 34, 109–157. [Google Scholar] [CrossRef]
- Brudzynski, K.; Miotto, D. Honey melanoidins: Analysis of the compositions of the high molecular weight melanoidins exhibiting radical-scavenging activity. Food Chem. 2011, 127, 1023–1030. [Google Scholar] [CrossRef]
- Yao, Z.-Y.; Qi, J.-H. Comparison of Antioxidant Activities of Melanin Fractions from Chestnut Shell. Molecules 2016, 21, 487. [Google Scholar] [CrossRef] [PubMed] [Green Version]
- Langner, E.; Rzeski, W. Biological Properties of Melanoidins: A Review. Int. J. Food Prop. 2014, 17, 344–353. [Google Scholar] [CrossRef]
- Manzocco, L.; Calligaris, S.; Mastrocola, D.; Nicoli, M.C.; Lerici, C.R. Review of non-enzymatic browning and antioxidant capacity in processed foods. Trends Food Sci. Tech. 2000, 11, 340–346. [Google Scholar] [CrossRef]
- Brudzynski, K.; Sjaarda, C.; Maldonado-Alvarez, L. A new look on protein-polyphenol complexation during honey storage: Is this a random or organized event with the help of dirigent-like proteins? PLoS ONE 2013, 8, e72897. [Google Scholar] [CrossRef] [Green Version]
- Khalil, M.I.; Sulaiman, S.A.; Boukraa, L. Antioxidant Properties of Honey and Its Role in Preventing Health Disorder. Open Nutraceuticals J. 2010, 3, 6–16. [Google Scholar] [CrossRef]
- Liu, Y.; Liang, X.; Zhang, G.; Kong, L.; Peng, W.; Zhang, H. Galangin and Pinocembrin from Propolis Ameliorate Insulin Resistance in HepG2 Cells via Regulating Akt/mTOR Signaling. Evid-Based Compl. Alt. 2018, 2018, 10. [Google Scholar] [CrossRef] [Green Version]
- Meda, A.; Lamien, C.E.; Romito, M.; Millogo, J.; Nacoulma, O.G. Determination of the total phenolic, flavonoid and proline contents in Burkina Fasan honey, as well as their radical scavenging activity. Food Chem. 2005, 91, 571–577. [Google Scholar] [CrossRef]
- Gheldof, N.; Wang, X.H.; Engeseth, N.J. Buckwheat honey increases serum antioxidant capacity in humans. J. Agric. Food Chem. 2003, 51, 1500–1505. [Google Scholar] [CrossRef]
- Gheldof, N.; Engeseth, N.J. Antioxidant capacity of honeys from various floral sources based on the determination of oxygen radical absorbance capacity and inhibition of in vitro lipoprotein oxidation in human serum samples. J. Agric. Food Chem. 2002, 50, 3050–3055. [Google Scholar] [CrossRef]
- Küçük, M.; Kolayli, S.; Karaoǧlu, Ş.; Ulusoy, E.; Baltaci, C.; Candan, F. Biological activities and chemical composition of three honeys of different types from Anatolia. Food Chem. 2007, 100, 526–534. [Google Scholar] [CrossRef]
- Gül, A.; Pehlivan, T. Antioxidant activities of some monofloral honey types produced across Turkey. Saudi J. Biol. Sci. 2018, 25, 1056–1065. [Google Scholar] [CrossRef] [PubMed]
Figure 1.
The results of the principal component analysis (PCA) with ● organic and ● conventional honey.
Figure 1.
The results of the principal component analysis (PCA) with ● organic and ● conventional honey.


Table 1.
Research material with its specific characteristics.
| Sample No | Variety-Declaration by Producer | The Determined Pollens of Nectar Honeys/the Determined Conductivity of Honeydew Honeys | Variety According to Pollen Analysis Results | ||||
|---|---|---|---|---|---|---|---|
| Dominant Pollens >45%/Conductivity | Accompanying Pollens <15–45% | Important Pollens <3–15% | Other Pollens <3% | Wind Pollinating and no Nectar Producing Plants Pollens | |||
| 1 | Linden * | linden: 22.7% white/sweet clover: 19.4% | Brassicaceae: 12.9% chervil: 12.4% plum/apple tree: 7.1% willow: 7.0% red clover: 4.8% thistle: 3.2% | dandelion: 2.2% blue cornflower: 1.6% other: 6.7% | oak: 2.1% sorrel: 1.5% Plantago lanceolata L.: 2.0% | Multifloral | |
| 2 | Linden ** | Brassicaceae: 42.3% | white/sweet clover: 12.7% chervil: 8.5% plum/apple tree: 7.4% linden: 6.3% blue cornflower: 5.8% red clover: 3.2% | dandelion: 2.6% vicia: 2.5% thistle: 2.1% phacelia: 1.1% other: 5.5% | oak: 5.8% sorrel: 2.4% | Multifloral | |
| 4 | Goldenrod * | Brassicaceae: 43.4% goldenrod: 25.5% | plum/apple tree: 11.1% heather: 4.8% white/sweet clover: 3.4% | phacelia: 2.7% red clover: 2.1% linden: 0.7% other: 5.5% | goosefoot: 0.7% corn: 0.5% pine: 0.3% | ||
| 3 | Goldenrod ** | goldenrod: 55.8% | phacelia: 21.5% | heather: 7.7% buckwheat: 6.1% Brassicaceae: 5.5% | blue cornflower: 1.1% other: 2.3% | mugwort: 1.1% sorrel: 0.6% Plantago lanceolata L.: 0.5% | Goldenrod |
| 5 | Dandelion* | rapeseed: 79.7% | willow: 11.1% plum/apple tree: 6.1% | other: 3.1% | oak: 0.9% | Rapeseed | |
| 6 | Dandelion ** | rapeseed: 53.4% | willow: 27.7% | raspberry: 6.5% plum/apple tree: 5.9% chervil: 5.6% | other: 0.9% | Plantago lanceolata L.: 3.3% | Rapeseed |
| 8 | Heather * | heather: 65.6% | phacelia: 10.0% buckwheat: 9.7% rapeseed: 4.3% blue cornflower: 3.8% | Achillea millefolium L.: 2.2% linden: 0.9% other: 5.4% | sorrel: 1.2% | Heather | |
| 7 | Heather ** | heather: 47.9% | phacelia: 12.7% rapeseed: 11.9% blue cornflower: 7.3% white/sweet clover: 5.7% red clover: 4.6% buckwheat: 4.5% | other: 5.4% | Heather | ||
| 9 | Acacia * | rapeseed: 41.2% raspberry: 21.8% | maple: 10.1% Frangula alnus Mill.: 8.4% willow: 7.6% blue cornflower: 5.1% | other: 5.8% | Multifloral | ||
| 10 | Acacia ** | rapeseed: 50.1% | phacelia: 37.4% | plum/apple tree: 3.7% | Achillea millefolium L.: 2.6% sunflower: 2.1% blue cornflower: 1.7% vicia: 1.1% | Rapeseed | |
| 12 | Buckwheat * | rapeseed: 45.5% | buckwheat: 19.9% | sunflower: 10.9% white/sweet clover: 9.6% vicia: 3.8% thistle: 3.2% | other: 7.1% | mugwort: 5.8% corn: 1.7% Plantago lanceolata L.: 0.6% | Rapeseed |
| 11 | Buckwheat ** | white/sweet clover: 39.7% phacelia: 19.6% buckwheat: 17.2% | blue cornflower: 9.5% red clover: 7.1% | other: 6.9% | pine: 0.9% oak: 0.8% | Multifloral | |
| 14 | Honeydew * | Conductivity: 1.05 mS/cm | raspberry/blueberry, white clover, Plantago lanceolata L., Frangula alnus Mill., blue cornflower. | Coniferous honeydew | |||
| 13 | Honeydew ** | Conductivity: 0.67 mS/cm | raspberry/blueberry, Impatiens L., linden, Heracleum L., linden, grass, dandelion, Achillea millefolium L., red clover. | Nectar-honeydew | |||
| 15 | Bean * | rapeseed: 44.6% white/sweet clover: 17.1% | raspberry: 12.7% Asteraceae: 10.6% thistle: 4.2% | phacelia: 2.1% other: 8.7% | mugwort: 62.2% corn: 0.8% Plantago lanceolata L.: 1.5% | Multifloral | |
| 16 | Bean ** | rapeseed: 59.8% | Medicago sativa L.: 10.7% raspberry: 8.1% white/sweet clover: 6.3% blue cornflower: 3.6% | chervil: 2.7% vicia: 2.6% thistle: 1.8% other: 4.4% | Rapeseed | ||
| 18 | Rapeseed * | rapeseed: 86.4% | willow: 6.8% maple: 3.1% | plum/apple tree: 2.1% other: 1.6% | Rapeseed | ||
| 17 | Rapeseed ** | rapeseed: 86.2% | willow: 7.7% plum/apple tree: 4.5% | other: 1.6% | pine: 2.1% | Rapeseed | |
| 19 | Wild raspberry * | rapeseed: 79.6% | phacelia: 13.4% | willow: 2.2%; blue cornflower: 2.1% red clover: 0.9% other: 1.8% | pine: 3.9% | Rapeseed | |
| 20 | Wild raspberry ** | rapeseed: 54.6% | raspberry: 26.6% | plum/apple tree: 8.5% phacelia: 4.1% | buckwheat: 1.5% dandelion: 1.1% Asteraceae: 0.7% other: 2.9% | oak: 0.7% | Rapeseed |
| 21 | Forest * | rapeseed: 56.1% | willow: 15.2% | Frangula alnus Mill.: 11.7% raspberry: 8.4% white/sweet clover: 3.6% | red clover: 0.8% other: 4.2% | oak: 2.6% Plantago lanceolata L.: 3.5% sorrel: 1.7% goosefoot: 1.4% | Rapeseed |
| 22 | Forest ** | rapeseed: 38.9% | willow: 14.6% chervil: 13.7% maple: 8.9% linden: 7.3% white/sweet clover: 6.6% raspberry: 4.3% | Frangula alnus Mill.: 1.9% sunflower: 0.6% Other: 3.2% | oak: 0.9% sorrel: 0.3% | Multifloral | |
*—organic sample; **—conventional sample.
Table 2.
Phenolic compound profile, total phenolic content (TPC), total antioxidant activity (AOX), and color parameters (L*, a*, b*) of some selected honey samples.
Table 2.
Phenolic compound profile, total phenolic content (TPC), total antioxidant activity (AOX), and color parameters (L*, a*, b*) of some selected honey samples.
| Sample No | 1 * | 2 ** | 3 ** | 4 * | 5 * | 6 ** | 7 ** | 8 * | 9 * | 10 ** | 11 ** | 12 * | 13 ** | 14 * | 15 * | 16 ** | 17 ** | 18 * | 19 * | 20 ** | 21 * | 22 ** |
|---|---|---|---|---|---|---|---|---|---|---|---|---|---|---|---|---|---|---|---|---|---|---|
| AOX [mg GAE/100 g] | 53.33 (2.36) | 71.58 (10.03) | 77.58 (2.42) | 53.94 (0.90) | 54.42 (2.04) | 45.65 (2.54) | 56.25 (8.73) | 47.63 (4.08) | 46.23 (12.47) | 55.12 (2.02) | 67.28 (4.14) | 58.30 (0.18) | 45.58 (0.20) | 50.24 (0.65) | 51.81 (1.77) | 83.16 (2.56) | 53.37 (3.43) | 54.37 (1.95) | 54.66 (1.03) | 52.90 (7.45) | 41.42 (1.50) | 55.75 (0.97) |
| TPC [mg GAE/100 g] | 3.96 (0.49) | 3.86 (0.38) | 8.15 (0.49) | 5.81 (0.50) | 5.26 (0.64) | 4.08 (0.22) | 14.08 (1.66) | 12.40 (0.77) | 4.15 (0.07) | 4.15 (0.04) | 22.33 (0.81) | 17.95 (1.57) | 6.79 (0.76) | 7.24 (0.24) | 4.07 (0.14) | 3.73 (0.26) | 3.43 (0.19) | 3.93 (0.21) | 4.21 (0.48) | 6.38 (0.07) | 5.69 (0.45) | 4.05 (0.02) |
| Chrysin [µg/100 g] | 86 (46) | 79 (23) | 54 (10) | 101 (5) | 85 (11) | 89 (18) | 69 (8) | 108 (7) | 79 (7) | 66 (2) | 67 (4) | 79 (3) | 60 (11) | 71 (3) | 89 (14) | 79 (5) | 53 (6) | 66 (3) | 59 (11) | 38 (6) | 58 (5) | 74 (5) |
| Caffeic acid [µg/100 g] | 120 (16) | 98 (0) | 70 (3) | 46 (0) | 56 (0) | 54 (2) | 51 (9) | 194 (24) | 215 (68) | 184 (75) | 110 (38) | 72 (6) | 94 (17) | 37 (6) | 203 (28) | 157 (18) | 52 (3) | 61 (4) | 42 (0) | 107 (20) | 76 (2) | 97 (2) |
| p-Coumaric acid [µg/100 g] | 181 (54) | 291 (15) | 526 (35) | 327 (21) | 338 (14) | 166 (157) | 266 (125) | 407 (8) | 272 (13) | 164 (6) | 788 (48) | 427 (7) | 473 (43) | 423 (16) | 539 (55) | 510 (65) | 288 (10) | 210 (13) | 276 (9) | 534 (26) | 170 (10) | 310 (17) |
| Pinocembrin [µg/100 g] | 113 (32) | 98 (6) | 30 (3) | 49 (2) | 29 (2) | 51 (14) | 40 (2) | 76 (3) | 69 (16) | 38 (3) | 71 (6) | 59 (1) | 27 (23) | 35 (4) | 63 (9) | 59 (4) | 41 (5) | 48 (4) | 33 (3) | 35 (6) | 42 (10) | 58 (6) |
| Luteolin [µg/100 g] | 105 (24) | 56 (6) | nd | nd | 19 (1) | 9 (1) | 8 (0) | 11 (2) | 4 (2) | nd | 3 (1) | 7 (1) | 10 (3) | 9 (0) | 4 (1) | 2 (0) | nd | 1 (0) | nd | 5 (3) | 45 (1) | 64 (10) |
| Quercetin [µg/100 g] | 483 (131) | 248 (53) | 35 (4) | 36 (2) | 42 (2) | 37 (4) | 31 (3) | 19 (3) | 25 (1) | 22 (4) | 27 (0) | 57 (4) | 49 (1) | 7 (1) | 2 (8) | 11 (0) | 43 (1) | 20 (14) | 10 (4) | 33 (18) | 63 (2) | 233 (35) |
| Kaempferol [µg/100 g] | 36 (19) | 99 (12) | 51 (6) | 76 (5) | 146 (4) | 117 (44) | 80 (34) | 68 (7) | 80 (5) | 105 (5) | 35 (2) | 40 (1) | 92 (38) | 25 (2) | 88 (10) | 71 (9) | 161 (11) | 158 (14) | 99 (2) | 54 (7) | 63 (2) | 63 (10) |
| Galangin [mg/100 g] | 126 (89) | 64 (16) | 40 (9) | 63 (0) | 35 (0) | 91 (14) | 63 (15) | 154 (34) | 118 (11) | 58 (5) | 70 (3) | 68 (2) | 51 (10) | 58 (2) | 107 (9) | 143 (10) | 86 (10) | 117 (9) | 54 (5) | 61 (8) | 37 (2) | 63 (5) |
| trans-Ferulic acid [µg/100 g] | 252 (66) | 184 (20) | 229 (13) | 170 (15) | 79 (102) | 70 (37) | 81 (33) | 167 (7) | 128 (17) | 84 (4) | 115 (14) | 47 (4) | 204 (115) | 221 (12) | 283 (28) | 213 (32) | 106 (9) | 112 (7) | 87 (1) | 315 (15) | 128 (6) | 179 (4) |
| Apigenin [µg/100 g] | 7 (2) | 22 (7) | 10 (1) | 12 (1) | 13 (0) | 17 (3) | 18 (3) | 45 (1) | 15 (0) | 7 (0) | 15 (2) | 11 (1) | 13 (1) | 11 (0) | 29 (3) | 23 (2) | 10 (1) | 13 (1) | 11 (0) | 8 (1) | 11 (0) | 9 (0) |
| L * | 59.91 (0.42) | 59.07 (0.10) | 29.26 (0.53) | 52.83 (0.67) | 41.06 (1.05) | 52.46 (0.74) | 29.27 (0.08) | 25.58 (0.26) | 36.42 (0.68) | 55.83 (0.46) | 27.71 (0.45) | 36.04 (0.68) | 33.32 (0.97) | 23.18 (1.24) | 47.48 (0.35) | 34.38 (0.84) | 54.55 (0.36) | 52.47 (0.35) | 43.82 (1.25) | 38.13 (1.73) | 35.26 (0.54) | 57.91 (0.68) |
| a * | −1.61 (0.12) | −1.23 (0.19) | 1.89 (0.48) | −0.39 (0.09) | 0.38 (0.11) | −0.91 (0.04) | 7.40 (0.17) | 5.30 (0.27) | −1.38 (0.07) | −1.12 (0.00) | 11.60 (0.68) | 10.14 (0.42) | 6.04 (0.16) | 5.02 (0.16) | −1.03 (0.00) | −1.00 (0.00) | −1.17 (0.01) | −1.02 (0.05) | −1.17 (0.09) | 1.53 (0.26) | 0.98 (0.02) | −0.84 (0.17) |
| b * | 11.49 (0.91) | 13.07 (0.33) | 21.61 (0.78) | 16.01 (0.09) | 20.19 (0.16) | 15.52 (0.07) | 29.06 (0.78) | 24.32 (0.44) | 15.97 (0.56) | 12.86 (0.26) | 31.33 (1.41) | 30.45 (1.30) | 27.51 (0.54) | 23.55 (0.62) | 9.96 (0.17) | 7.59 (0.30) | 13.35 (4.87) | 13.71 (0.31) | 13.46 (0.28) | 22.10 (0.37) | 20.01 (0.34) | 15.36 (0.12) |
SD—standard deviation; nd—not detected; *—organic sample, **—conventional sample.
Table 3.
Phenolic profiles, total phenols content (TPC), total antioxidant activity (AOX), and color parameters (L*, a*, b*) of organic and conventional honeys of Polish origin.
Table 3.
Phenolic profiles, total phenols content (TPC), total antioxidant activity (AOX), and color parameters (L*, a*, b*) of organic and conventional honeys of Polish origin.
| Parameter | Conventional (N = 11) | Organic (N = 11) | p * |
|---|---|---|---|
| Chrysin [mg/100 g] | 0.066 (0.014) | 0.08 (0.016) | 0.045 (P) |
| Caffeic acid [mg/100 g] | 0.098 (0.043) | 0.102 (0.069) | 0.797 (NP) |
| p-Coumaric acid [mg/100 g] | 0.392 (0.19) | 0.325 (0.117) | 0.326 (P) |
| Pinocembrin [mg/100 g] | 0.05 (0.021) | 0.056 (0.024) | 0.529 (P) |
| Luteolin [mg/100 g] | 0.014 (0.023) | 0.018 (0.032) | 0.817 (NP) |
| Quercetin [mg/100 g] | 0.068 (0.086) | 0.069 (0.139) | 0.511 (NP) |
| Kaempferol [mg/100 g] | 0.084 (0.036) | 0.08 (0.042) | 0.792 (P) |
| Galangin [mg/100 g] | 0.072 (0.028) | 0.085 (0.040) | 0.669 (NP) |
| trans-Ferulic acid [mg/100 g] | 0.162 (0.077) | 0.152 (0.075) | 0.769 (P) |
| Apigenin [mg/100 g] | 0.014 (0.006) | 0.016 (0.011) | 0.792 (NP) |
| AOX [mg GAE/100 g] | 60.38 (12.57) | 51.49 (5.44) | 0.054 (P) |
| TPC [mg GAE/100 g] | 7.37 (5.61) | 6.79 (4.27) | 0.748 (NP) |
| L * | 42.899 (12.926) | 41.277 (11.455) | 0.898 (NP) |
| a * | 2.017 (4.400) | 1.383 (3.800) | 0.606 (NP) |
| b * | 19.032 (7.761) | 18.101 (6.234) | 0.760 (P) |
*p = normality in both groups, Student t-test; NP = lack of normality in at least one group, Mann–Whitney test.
Table 4.
Correlations between the parameters tested.
| Variables | Correlation Coefficient | p * Pearson’s Correlation Coefficient | Dependency Direction | Dependence Strength | ||
|---|---|---|---|---|---|---|
| Buckwheat pollen | TPC | 0.755 | p < 0.001 NP | positive | strong | |
| Buckwheat pollen | a * | 0.708 | p < 0.001 NP | positive | strong | |
| Buckwheat pollen | b * | 0.705 | p < 0.001 NP | positive | strong | |
| White/sweet clover pollen | pinocembrin | 0.659 | p = 0.001 NP | positive | moderate | |
| Plum/apple tree pollen | L * | 0.653 | p = 0.001 NP | positive | moderate | |
| Willow pollen | p-coumaric acid | −0.591 | p = 0.004 NP | negative | moderate | |
| Rapeseed pollen | kaempferol | 0.574 | p = 0.005 NP | positive | moderate | |
| Buckwheat pollen | L * | −0.567 | p = 0.006 NP | negative | moderate | |
| Chervil pollen | TPC | −0.559 | p = 0.007 NP | negative | moderate | |
| Chervil pollen | luteolin | 0.522 | p = 0.013 NP | positive | moderate | |
| Chervil pollen | L * | 0.516 | p = 0.014 NP | positive | moderate | |
| Buckwheat pollen | kaempferol | −0.51 | p = 0.015 NP | negative | moderate | |
| Chervil pollen | b * | −0.485 | p = 0.022 NP | negative | weak | |
| Chervil pollen | pinocembrin | 0.483 | p = 0.023 NP | positive | weak | |
| Heather pollen | TPC | 0.476 | p = 0.025 NP | positive | weak | |
| Buckwheat pollen | p-coumaric acid | 0.46 | p = 0.031 NP | positive | weak | |
| Willow pollen | TPC | −0.455 | p = 0.033 NP | negative | weak | |
| Chervil pollen | quercetin | 0.447 | p = 0.037 NP | positive | weak | |
| Brassicaceae pollen | quercetin | 0.445 | p = 0.038 NP | positive | weak | |
| Rapeseed pollen | trans-ferulic acid | −0.44 | p = 0.04 NP | negative | weak | |
| Raspberry pollen | caffeic acid | 0.439 | p = 0.041 NP | positive | weak | |
| Phacelia pollen | TPC | 0.43 | p = 0.046 NP | positive | weak | |
| a * | b * | 0.888 | p < 0.001 NP | positive | strong | |
| Pinocembrin | galangin | 0.801 | p < 0.001 NP | positive | strong | |
| TPC | b * | 0.8 | p < 0.001 NP | positive | strong | |
| L * | a * | −0.758 | p < 0.001 NP | negative | strong | |
| L * | b * | −0.695 | p < 0.001 P | negative | moderate | |
| TPC | a * | 0.661 | p = 0.001 NP | positive | moderate | |
| TPC | L * | −0.651 | p = 0.001 NP | negative | moderate | |
| Luteolin | quercetin | 0.649 | p = 0.001 NP | positive | moderate | |
| Chrysin | pinocembrin | 0.596 | p = 0.003 NP | positive | moderate | |
| Caffeic acid | pinocembrin | 0.568 | p = 0.006 NP | positive | moderate | |
| p-Coumaric acid | L * | −0.564 | p = 0.006 P | negative | moderate | |
| AOX | L * | −0.542 | p = 0.009 NP | negative | moderate | |
| AOX | TPC | 0.541 | p = 0.009 NP | positive | moderate | |
| Chrysin | apigenin | 0.527 | p = 0.012 NP | positive | moderate | |
| Chrysin | galangin | 0.514 | p = 0.014 NP | positive | moderate | |
| Aox | b * | 0.505 | p = 0.017 NP | positive | moderate | |
| p-Coumaric acid | a * | 0.496 | p = 0.02 NP | positive | weak | |
| Caffeic acid | galangin | 0.48 | p = 0.024 NP | positive | weak | |
| Kaempferol | a * | −0.47 | p = 0.027 NP | negative | weak | |
| Kaempferol | L * | 0.465 | p = 0.029 P | positive | weak | |
| p-Coumaric acid | kaempferol | −0.439 | p = 0.041 P | negative | weak | |
| Quercetin | AOX | −0.437 | p = 0.042 NP | negative | weak | |
| p-Coumaric acid | b * | 0.432 | p = 0.045 P | positive | weak | |
| Galangin | apigenin | 0.432 | p = 0.045 NP | positive | weak | |
| Kaempferol | trans-ferulic acid | −0.423 | p = 0.05 P | negative | weak | |
p* = normality of both parameters Pearson’s correlation coefficient; NP = lack of normality of at least one parameter Spearman’s correlation coefficient.
© 2020 by the authors. Licensee MDPI, Basel, Switzerland. This article is an open access article distributed under the terms and conditions of the Creative Commons Attribution (CC BY) license (http://creativecommons.org/licenses/by/4.0/).
Share and Cite
MDPI and ACS Style
Halagarda, M.; Groth, S.; Popek, S.; Rohn, S.; Pedan, V. Antioxidant Activity and Phenolic Profile of Selected Organic and Conventional Honeys from Poland. Antioxidants 2020, 9, 44. https://0-doi-org.brum.beds.ac.uk/10.3390/antiox9010044
AMA Style
Halagarda M, Groth S, Popek S, Rohn S, Pedan V. Antioxidant Activity and Phenolic Profile of Selected Organic and Conventional Honeys from Poland. Antioxidants. 2020; 9(1):44. https://0-doi-org.brum.beds.ac.uk/10.3390/antiox9010044
Chicago/Turabian StyleHalagarda, Michał, Sabrina Groth, Stanisław Popek, Sascha Rohn, and Vasilisa Pedan. 2020. "Antioxidant Activity and Phenolic Profile of Selected Organic and Conventional Honeys from Poland" Antioxidants 9, no. 1: 44. https://0-doi-org.brum.beds.ac.uk/10.3390/antiox9010044
Note that from the first issue of 2016, this journal uses article numbers instead of page numbers. See further details here.