Article

Enrichment in Antioxidant Flavonoids of Stamen Extracts from Nymphaea lotus L. Using Ultrasonic-Assisted Extraction and Macroporous Resin Adsorption

by
Duangjai Tungmunnithum
1,2,3,*,
Samantha Drouet
2,3,
Atul Kabra
4 and
Christophe Hano
2,3,*
1
Department of Pharmaceutical Botany, Faculty of Pharmacy, Mahidol University, Bangkok 10400, Thailand
2
Laboratoire de Biologie des Ligneux et des Grandes Cultures, INRA USC1328, University of Orleans, CEDEX 2, 45067 Orléans, France
3
Bioactifs et Cosmetiques, CNRS GDR 3711 Orleans, CEDEX 2, 45067 Orléans, France
4
School of Pharmacy, Raffles University, Neemrana 301705, Alwar, Rajasthan, India
*
Authors to whom correspondence should be addressed.
Submission received: 3 June 2020 / Revised: 25 June 2020 / Accepted: 29 June 2020 / Published: 2 July 2020
(This article belongs to the Special Issue Phenolics as Antioxidant Agents)

Abstract

:
Nymphaea lotus L. is the medicinal plant that has long been used for food, cosmetics and traditional medicines in Africa and Asia since ancient times. Its flavonoids and other interesting phytochemical compounds from rhizome, leaf and the whole flowers have been reported in the previous published research. However, stamens, which are essential for reproductive functions, may also represent new alternative sources of potential antioxidant flavonoids, as investigated in this study. The innovative green chemistry methods, i.e., ultrasound-assisted extraction (UAE) as well as a macroporous resin (MPR) purification procedure, were employed in this current research. Using a full factorial design coupled to three-dimensional (3D) surface plot methodology, the influence of three variables, namely aqEtOH concentration (ranging from 50 to 100% (v/v), US frequency (ranging from 0 (no US applied) to 45 kHz), and the extraction duration (ranging from 20 to 60 min), were evaluated. Five MPRs with different surface areas, average pore diameters, matrix types and polarities were also investigated for the purification of total flavonoids. The optimal UAE condition is 90% (v/v) aqEtOH with 34.65 khz ultrasonic frequency and 46 min of extraction duration. Compared with the conventional heat reflux extraction (HRE) method, a significant 1.35-fold increase in total flavonoids content was obtained using optimized UAE conditions (169.64 for HRE vs. 235.45 mg/g dry weight for UAE), causing a 2.80-fold increase when this UAE associated with MPR purification (475.42 mg/g dry weight). In vitro cell free antioxidant activity of N. lotus stamen extracts and in cellulo antioxidant investigation using yeast model showed the same trend, indicating that the best antioxidant flavonoid can be found in UAE coupled with MPR purification. Moreover, in the yeast model, the expression of key antioxidant genes such as SIR2 and SOD2 were expressed at the highest level in yeast cells treated with the extract from UAE together with MPR purification. Consequently, it can be seen that the UAE combined with MPR purification can help enhance the flavonoid antioxidant potential of the stamens extract from this medicinal species.

Graphical Abstract

1. Introduction

Nymphaea lotus L. (Figure 1) is commonly known as the water lily or Egyptian lotus. This medicinal plant is native to Africa, Asia and some specific areas in Europe. It has various vernacular names depending on the country, e.g., Bau-Sai (Thailand), Nettai Suiren (Japan), Sulyeon (Korea) and Bashneen Abiad (Egypt). N. lotus is an aquatic flowering herb with tuberous rhizome. Due to the beauty of its flower, this plant is widely used and cultivated as an ornamental plant. Moreover, N. lotus is used as a medicinal plant for traditional medicines, food and herbal tea for health benefits, especially in many Asian countries, Egypt and other countries in Africa [1,2,3,4,5]. Almost every part of this medicinal plant is edible. Its petiole and peduncle can be eaten raw as a vegetable or cooked with meats for curry menu; its flower and peduncle are popular in some traditional desserts [3,6,7,8,9].
In the past few decades, this medicinal plant has received continuously growing interested for its economical and pharmacological potentials. Many research teams have conducted studies focusing on N. lotus in several aspects. The safety of N. lotus flower extracts was verified by Kameni et al. [10]. Acute, sub-chronic and neurotoxicity were studied in vivo using an albinos Wistar rat model. This study indicated that the N. lotus flowers extract probably account for neuroprotective, immune-boosting and antioxidant activity without neurotoxicity [10]. Furthermore, the pharmacological and medicinal potential of this medicinal species were currently confirmed at in vivo level, i.e., anti-diarrhea effect of N. lotus rhizome extract [5], anxiolytic and antidepressant potential from the N. lotus leaf extract [11]. Oyeyemi et al. [12] investigated the hepatoprotective effect of N. lotus methanol extract to fight against carbon tetrachloride-induced chronic hepatotoxicity in vivo model using Wistar rats. Their results indicated that extracts of N. lotus show hepatoprotective potential through an antioxidative mechanism [12]. The strong antioxidant activity of extract of N. lotus flower compared to other medicinal plants was reported and related to their flavonoid content [13]. N. lotus is known to accumulate various flavonol glycosides in both vegetative and reproductive parts [4,14,15]. In particular, flavonoids composition has been related to flower color variations of Nymphaea species [14].
The development of effective extraction methods is important for the optimal valuation of plant extracts. Different methods have been developed for the extraction of natural antioxidants from various natural matrices based on traditional methods, such as maceration or extraction by Soxhlet. More recently, green extraction methods for plant-natural products, such as microwave-assisted [16], enzymatic-assisted [17] or ultrasound-assisted extraction (UAE) [18,19,20,21,22], have been published. Such methods, especially UAE, are considered to be more productive and have attracted considerable interest in industrial applications [18,19,21,22,23,24,25]. UAE is considered one of the simplest, most efficient and most economical methods of increasing the yields of plant extraction [23]. UAE is also successfully employed in the extraction of the black locust flower [26] and wheatgrass [27] as well as the pot marigold flower [28] to investigate their polyphenols and flavonoids.
Ultrasound (US) effectively creates an acoustic cavitation effect that facilitates the penetration of the extraction solvent. This results in the intracellular content of the plant material being released successfully by increasing the solvent agitation, resulting in increased surface contact between the solvent and the target compounds, as well as increased solubility of the target compounds in the solvent [23]. Typically, UAE has a shorter extraction duration with a reduced usage of solvent compared to other traditional extraction methods, making it a green extraction technique that can be upscaled for industrial purposes [23]. Many methods have been developed to further selectively enrich a plant extract in bioactive compounds, including liquid-liquid extraction [15], solid phase extraction [29] or high-speed counter-current chromatography [30]. However, there are several limitations to these methods, such as low capacity, low yields and the need of special instrumentation [31]. Such methods also share common difficulties in completely extracting flavonoids, which are the main active ingredients in N. lotus stamens. By contrast, due to high adsorption efficiency, good stability, low operating costs and ease of use, macroporous resins (MPR) are effective for the enrichment of raw herbal extracts in bioactive components [31,32]. MPR has been successfully used in industries to separate and prepare bioactive extracts enriched in flavonoids, glycosides or saponins [31,32,33].
In this context, the present study reports on the establishment an UAE procedure, in conjunction with the MPR enrichment step, to increase the total flavonoid content (TFC) of N. lotus stamen extracts. First, design of experiment (DOE), coupled with the Response Surface Method (RSM), was used to determine and optimize the values of independent parameters of the UAE, including extraction duration, aqueous ethanol concentration (aqEtOH) and US frequency affecting the extraction of flavonoids from N. lotus stamens. The MPR purification step using microporous resin was also optimized with the evaluation of five different MPR. Analysis by LC-MS of this flavonoid-enriched extract from N. lotus stamens was performed. The in vitro cell-free and cellular antioxidant activities of each extract (UAE and UAE + MPR step) were evaluated, and then compared with activities obtained for extracts generated through conventional heat reflux extraction (HRE) and for commercial antioxidants.

2. Materials and Methods

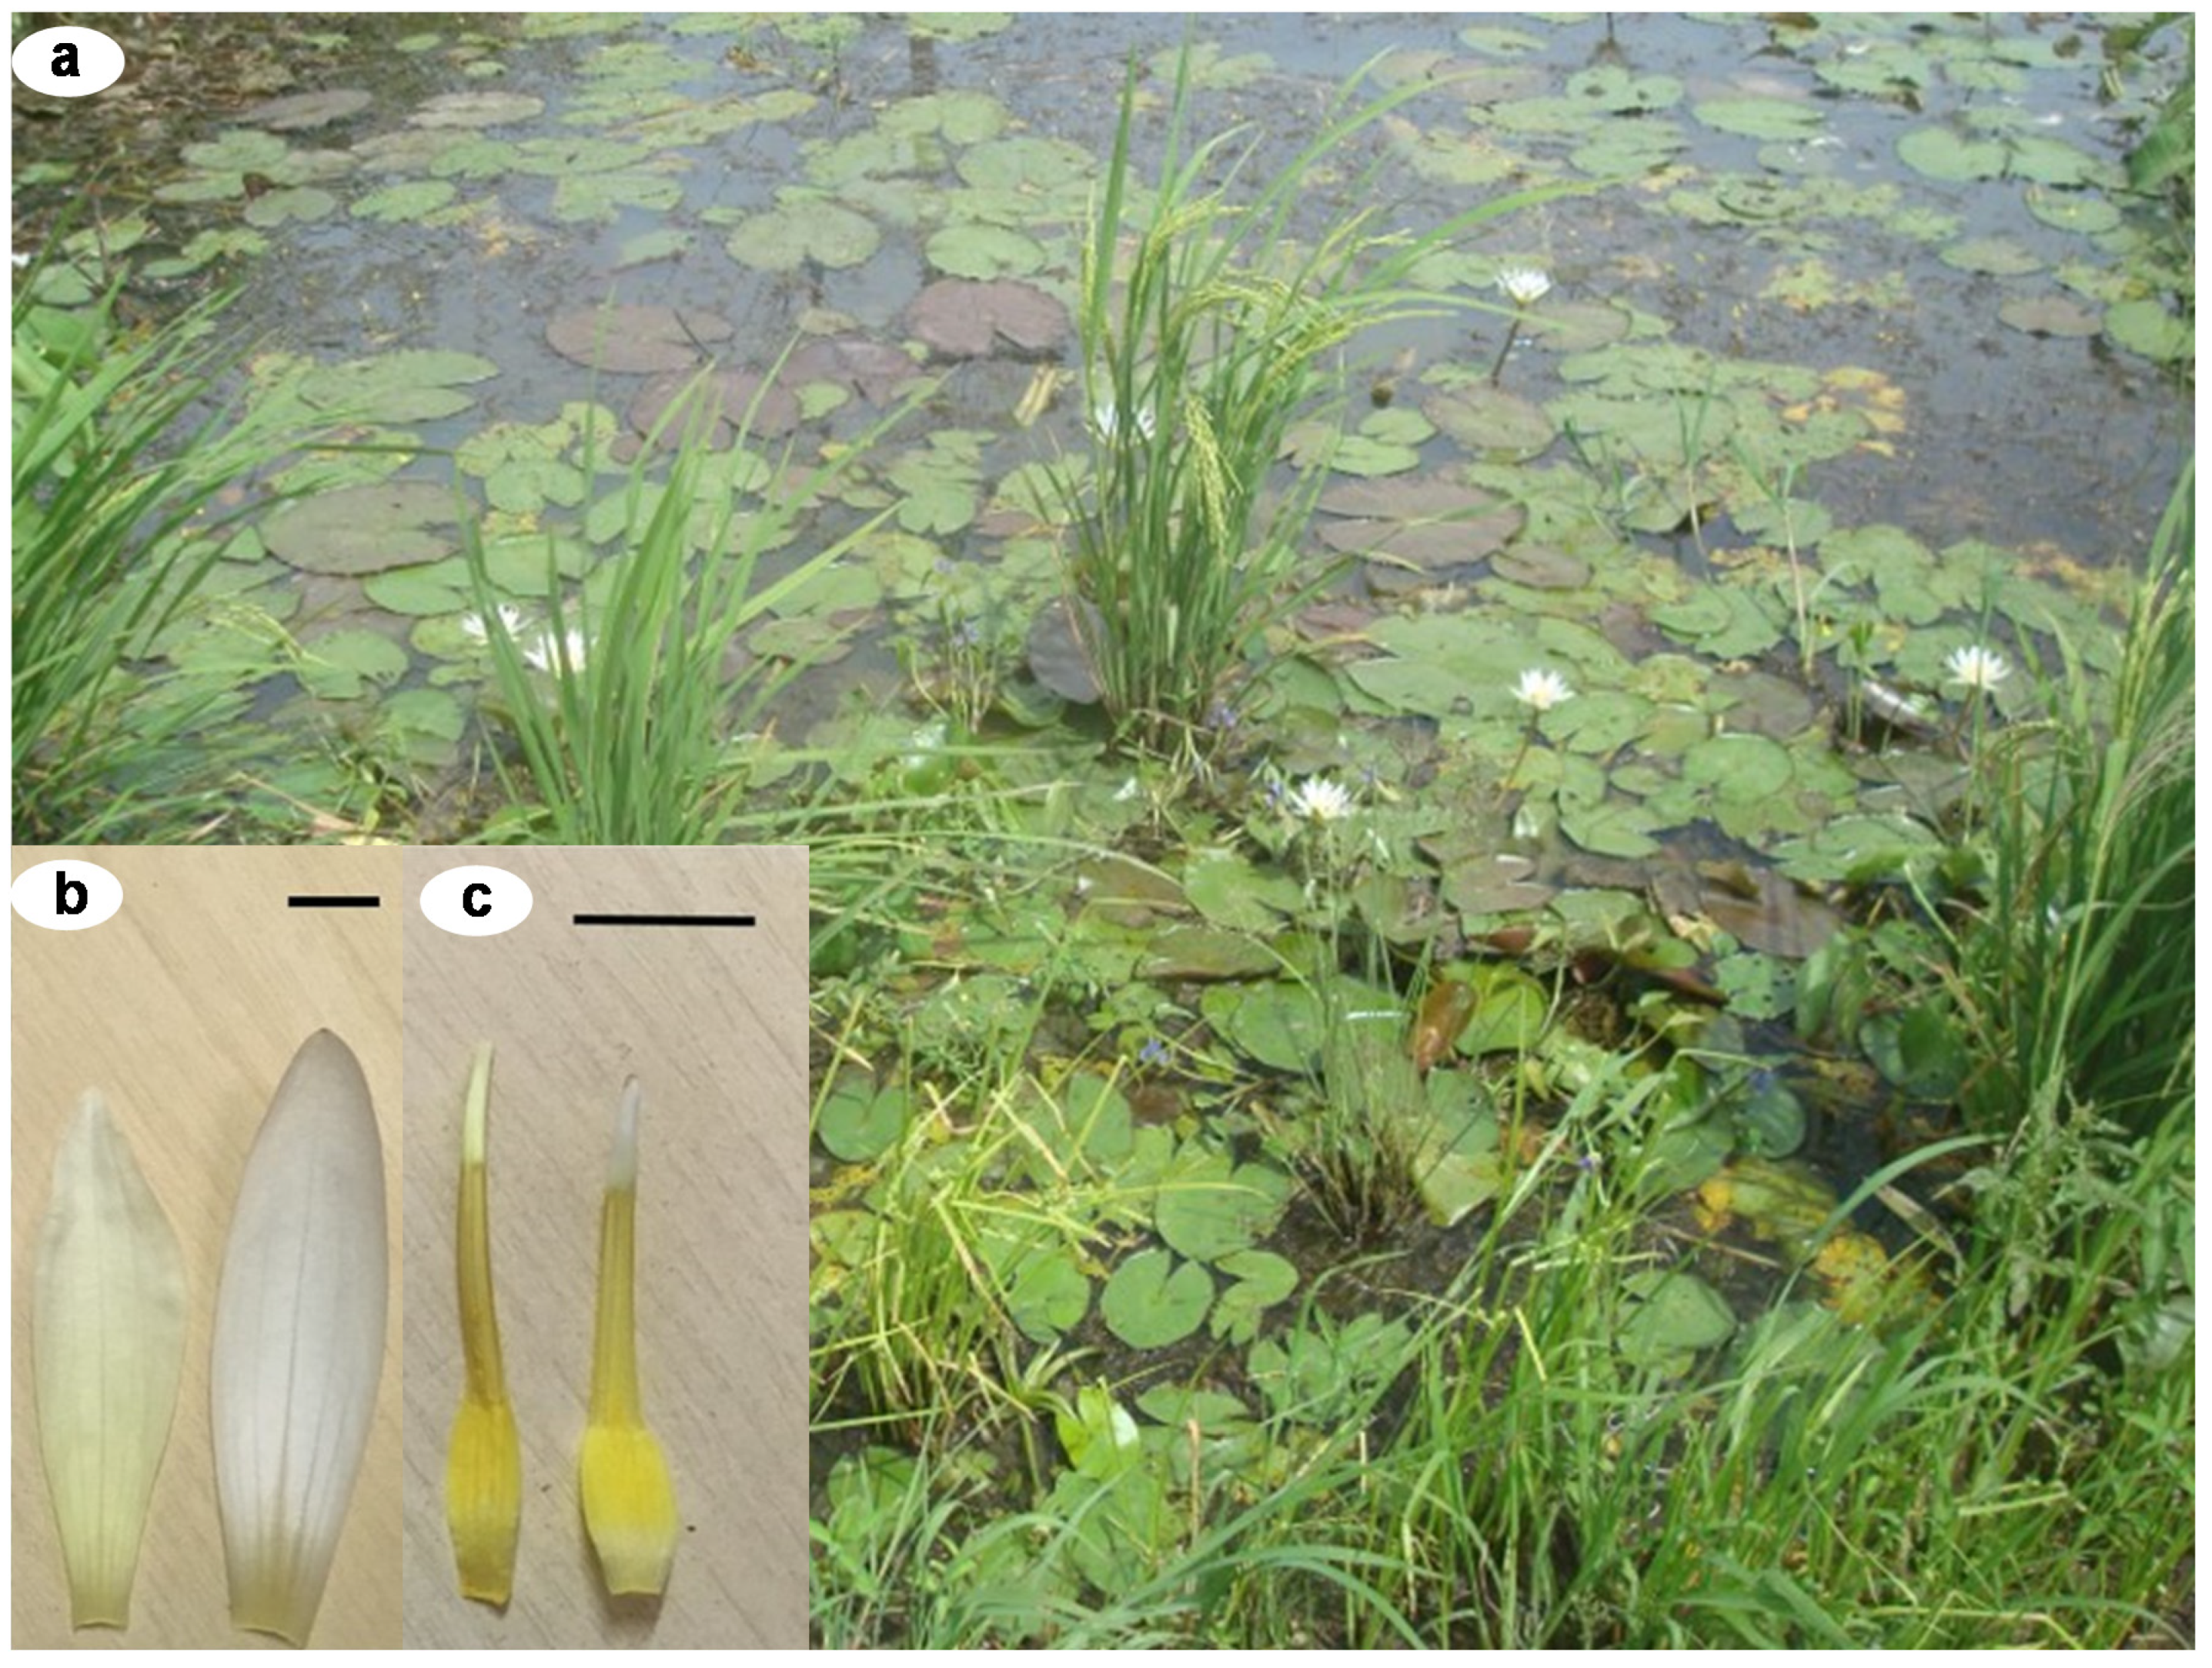
2.1. Plant Materials and Plant Collection

The living specimen of N. lotus was searched and collected from its natural habitat in Nakhon Sawan province, Northern Floristic Regions of Thailand. The collected specimen was identified using the key-to-species and description in the existing Floras, as well as compared with the herbarium specimens kept in Forest Herbarium (BKF), the Pr. Kasin Suvatabandhu from Herbarium, Chulalongkorn University, (BCU). Herbarium abbreviations are used according to Thiers [34]. Then, the stamens from N. lotus flower were cut, and air-dried stamen samples were prepared following the World Health Organization [35] recommendations.

2.2. Chemicals

Analytical grade or the highest available purity solvents and reagents were used for extraction, LC-MS analysis and bioassays (Merck Millipore, Saint-Quentin Fallavier, France). Deionized water was prepared with the Milli-Q water purification system (Merck Millipore, Saint-Quentin Fallavier, France). Commercial standards were purchased from Extrasynthese (Genay, France).

2.3. Extraction

2.3.1. Apparatus and General Procedure

The USC1200TH (Prolabo, Fontenay-sous-Bois, France) ultrasonic bath used is equipped with timer, frequency and temperature controllers, with a maximum heating power of 400 W corresponding to an acoustic power of 1 W/cm2 and a tank of 300 mm × 240 mm × 200 mm (inner dimension). The sample was placed in 5 mL quartz tubes containing 1 mL solvent for extraction and fitted with a vapor condenser. Their position in the ultrasonic bath was chosen in accordance with the Aluminum Foil Efficiency Test [18].

2.3.2. UAE Optimization Using Full Factorial Design

Sample (100 mg) was suspended in 1 mL extraction solvent, corresponding to a liquid to solid ratio of 10:1 mL/g DW (dry weight), in 5 mL quartz tubes equipped with a vapor condenser. Extraction was done at 45 °C. Using XLSTAT2019 tools (Addinsoft, Paris, France), full factorial design experiment was applied to determine optimum extraction conditions. Three independent variables coded at three different levels (−1, 0 and +1; Table 1): aqueous ethanol (EtOH) concentration (X1), US frequency (X2) and extraction duration (X3) were considered. The experiments were randomized and carried out in triplicate. Equation fitting the model was calculated using XLSTAT2019 DOE Analysis tool (Addinsoft, Paris, France). Surface and contour plots showing TFC as a function of the coded levels of the independent variables were obtained using fxy Excel add-in (Redmond, WA, USA).

2.3.3. Optimized UAE

Sample (100 mg) was suspended in 1 mL 90% (v/v) aqEtOH in 5 mL quartz tubes equipped with a vapor condenser. Extraction was performed at 45 °C in USC1200TH (Prolabo, Fontenay-sous-Bois, France) ultrasonic bath operating at a 30 kHz frequency for 46 min. After extraction, the extract was centrifuged 15 min at 5000× g (Heraeus Biofuge Stratos, Thermo Scientific, Illkirch, France) and the supernatant extract was filtered through 0.45 μm of nylon syringe membranes (Merck Millipore, Saint-Quentin Fallavier, France).

2.3.4. Heat Reflux Extraction

Sample (100 mg) was suspended in 1 mL aqEtOH 90% (v/v) in 5 mL quartz tubes equipped with a vapor condenser. Extraction was performed at 45 °C in a water bath under agitation (150 rpm) for 46 min. After extraction, the extract was centrifuged 15 min at 5000× g (Heraeus Biofuge Stratos, Thermo Scientific, Illkirch, France) and the supernatant extract was filtered through 0.45 μm of nylon syringe membranes (Merck Millipore, Saint-Quentin Fallavier, France).

2.4. Determination of Total Flavonoid Content (TFC)

TFC was determined using the colorimetric aluminum trichloride (AlCl3) method [36]. Mixture (200 µL) was prepared in a microplate containing 20 µL of N. lotus stamen extract, 10 µL potassium acetate 1 M, 10 µL AlCl3 (10% (w/v)) and 160 µ of deionized water. Mixture was incubated 30 min at 25 °C in the dark, and an absorbance at 415 nm was determined with a microplate reader (Multiskan GO, Thermo Fischer Scientific, Illkirch, France). TFC was expressed in mg/g dry weight (DW) of quercetin equivalent using a five-point calibration line (linearity ranging from 0 to 40 µg/mL quercetin concentration with a R2 of 0.998).

2.5. LC-MS Analysis

Analysis of the LC-MS carried out, as described in Drouet et al. [37], on a Water 2695 Alliance coupled with a single quadrupole mass spectrometer ZQ (Waters-Micromass, Manchester, UK). LC-ESI-MS (liquid chromatography-electrospray ionization-mass spectrometry) MassLynx 4.0 software (Waters-Micromass, Manchester, UK) was used to acquire and process data. The separation was conducted using a linear gradient: from a mixture of 10:90 (v/v) to 100:0 (v/v) of solvent A (methanol) and solvent B (water + 0.05% (v/v) formic acid) at a flow rate of 1.00 mL/min during a run of 1 h. The detection was set at 350 nm. Before injection, extracts were centrifuged 15 min at 5000× g (Heraeus Biofuge Stratos, Thermo Scientific, Illkirch, France) and the supernatant extract was filtered through 0.45 μm of nylon syringe membranes (Merck Millipore, Saint-Quentin Fallavier, France).

2.6. Macroporous Resin (MPR) Purification Step

2.6.1. MPR Preparation

Five MPR purchased from (Merck Millipore, Saint-Quentin Fallavier, France) presented in Table 2 were evaluated for flavonoid purification step. Before use, the MPR was activated by soaking for 24 h with 95% (v/v) aqEtOH and washed thoroughly with deionized water afterwards. The MPR was then subsequently soaked 12 h in 5% HCl and then 2% NaOH solutions. Afterward, MPR was extensively washed with deionized water until neutral.

2.6.2. MPR Selection

The adsorption and desorption ratios were evaluated and compared among the five MPRs for selection. In this screening phase, absorption and desorption were performed at 25 °C. Each prepared MPR (5 g) was placed in an Erlenmeyer flask and mixed with 50 mL of N. lotus stamen extract prepared using optimized UAE conditions. At 25 °C in the dark, each flask was then incubated on an orbital shaker operating at 120 rpm. For the screening phase, incubation time to achieve absorption equilibrium was arbitrarily fixed to 6 h. Through filtration under vacuum, the resultant liquid phase was isolated from the MPR and its TFC was determined. The absorption ratio A was calculated as follow: A (%) = [(C0 − C1)/C0] × 100, where C0 (expressed in mg/mL) is the initial total flavonoid concentration of the extract and C1 (expressed in mg/mL) is the equilibrium total flavonoid concentration.
The MPR was washed with deionized water to eliminate excess of flavonoids. Then, it was desorbed with 50 mL of 95% (v/v) aqEtOH solution with incubation at 25 °C in an orbital shaker operating at 120 rpm. For the screening phase incubation time to achieve desorption was arbitrary fixed to 6 h. The TFC of the resulting eluent was determined. The desorption ratio D was calculated as follow: D (%) = [(V2 × C2)/(M × Q)] × 100, where C2 (expressed in mg/mL) is the total flavonoid concentration of the eluent, V2 (in mL) is the volume of the eluent solution, M (in g) is the MPR mass and Q is the absorption capacity determined as follow: Q = [(C0 − C1)/M] × V1, with V1 (in mL) is the initial volume of the extract placed in contact with the MPR.

2.6.3. Optimization of Static Absorption and Desorption on XAD-8 MPR

After the screening phase, the XAD-8 MPR was selected for further optimization experiments. Optimal absorption and desorption times were determined as described above with different incubation durations (0–60 min) for absorption and then for desorption. The concentration of the aqEtOH solution (0–100 (v/v)) as well as the desorption incubation temperature (25–55 °C) were also evaluation using the optimal absorption incubation time of 25 min and the optimal desorption incubation time of 15 min. Using 1 M HCl and 1 M NaOH solutions, the desorption solution pH was adapted to different values (2–10) to evaluate the influence of the pH value on purification capacity of XAD-8 MPR.
Estimation of non-target compounds, such as reducing sugars, was done by the determination of conductivity values as well as total reducing sugar content as described previously [38,39].

2.7. Antioxidant Assays

2.7.1. In Vitro Cell Free DPPH Free Radical Scavenging Assay

The DPPH (2,2-diphenyl-1-picrylhydrazyl) in vitro cell free cell assay was used to evaluate the free radical scavenging activity of the extracts as described in Shah et al. [40]. In brief, 20 μL of extract were mixed with 180 μL of DPPH reagent solution (0.1 mM final concentration in methanol) in a microplate well, and incubated for 60 min in the dark at 25 °C. Butylated hydroxytoluene (BHT, 100 µM in methanol) was used as positive control. Negative control was obtained with 180 µL DPPH mixed with 20 μL of the corresponding extraction solvent. After incubation, absorbance at 515 nm was recorded with a microplate reader (BioTek ELX800 Absorbance Microplate Reader, BioTek Instruments, Colmar, France). Antioxidant capacity was expressed as Trolox C equivalent antioxidant capacity (TEAC) with a standard curve (0–500 μM Trolox C; R2 = 0.999).

2.7.2. In Vitro Cell Free ABTS Antioxidant Assay

The ABTS (2,2-azinobis (3-ethylbenzthiazoline-6-sulphonic acid)) in vitro cell free cell assay was used to evaluate the free radical scavenging activity of the extracts as described in Ullah et al. [41]. First, the absorbance at 734 nm of the ABTS solution (ABTS salt (7 mM) and potassium persulphate (2.45 mM), incubated in the dark for at least 16 h) was adjusted to 0.7 after its preparation. Then, 10 μL of extract were mixed with 190 µL of this prepared ABTS solution in a microplate well, and incubated for 15 min in the dark at 25 °C. Butylated hydroxytoluene (BHT, 100 µM in methanol) was used as positive control. Negative control was obtained with 190 µL ABTS solution incubated with 10 μL of the corresponding extraction solvent. After incubation, absorbance at 734 nm was recorded with a microplate reader (BioTek ELX800 Absorbance Microplate Reader, BioTek Instruments, Colmar, France). Antioxidant capacity was expressed as Trolox C equivalent antioxidant capacity (TEAC) with a standard curve (0–500 μM Trolox C; R2 = 0.998).

2.7.3. In Vitro Cell Free FRAP Antioxidant Assay

The FRAP (Ferric Reducing Antioxidant Power) in vitro cell free cell assay was used to evaluate the free radical scavenging activity of the extracts as described in Abbasi et al. [42]. In brief, 10 μL of extract were mixed well with FRAP solution (FeCl3 (20 mM), 2,4,6-Tris(2-pyridyl)-s-triazine (TPTZ, 10 mM), acetate buffer (300 mM, pH 3.6) prepared in a 1:1:10 (v/v/v) ratio) in a microplate well, and incubated for 15 min in the dark at 25 °C. Butylated hydroxytoluene (BHT, 100 µM in methanol) was used as positive control. Negative control was obtained with 190 µL FRAP solution incubated with 10 μL of the corresponding extraction solvent. After incubation, absorbance at 630 nm was recorded with a microplate reader (BioTek ELX800 Absorbance Microplate Reader, BioTek Instruments, Colmar, France). Antioxidant capacity was expressed as Trolox C equivalent antioxidant capacity (TEAC) with a standard curve (0–500 μM Trolox C; R2 = 0.998).

2.8. Cellular Antioxidant Assay

For evaluation of cellular antioxidant activity, an assay based on the method defined by Nazir et al. [43], using yeast cells, was employed. Yeast cells (DBY746 (MATα leu2-3,112 his3Δ1 trp1-289a ura3-52 GAI+)) were grown aerobically in complete 2.0% (w/v) glucose YPD (yeast extract peptone dextrose) medium (Sigma Aldrich, Saint-Quentin Fallavier, France) in an orbital shaker (150 rpm) at 30 °C. Each extract was evaporated under nitrogen flow, dissolved in DMSO, and then added to the yeast cells 6 h prior oxidative stress induction at a final concentration of 10, 25 or 50 µg/mL. The same volume of DMSO was used for untreated control yeast cells, whereas yeast cells treated with resveratrol (Sigma Aldrich, Saint Quentin Fallavier, France) at 10 μM, with the final concentration prepared in DMSO, was used as positive control. The final concentration of DMSO applied on the yeast cells was circa 1% (v/v). Oxidative stress was induced by UV-C irradiation at 106.5 J/m2 UV-C (254 nm) using Vilber VL-6.C filtered lamp (Thermo Fisher Scientific, Villebon-sur-Yvette, France). Yeast cells were then incubated overnight at 30 °C.
Reactive oxygen and nitrogen species (ROS/RNS) produced were determined using dihydrorhodamine-123 (DHR-123) fluorescent dye (Sigma-Aldrich, Saint-Quentin Fallavier, France) as described by Tungmunnithum et al. [25]. Approximately 108 yeast cells of each condition were rinsed twice with phosphate buffered saline (PBS 1X, pH7.4), before being resuspended in 0.4 μM DHR-123 solution prepared in PBS (1X, pH7.4) and then incubated 10 min at 30 °C in the dark. After twice washing with PBS (1X, pH7.4), the fluorescence intensity was measured with a VersaFluor fluorimeter (Biorad, Marnes-la-Coquette, France) using λex = 505 nm and λem = 535 nm.
A thiobarbituric acid reactive substances (TBARS) assay was employed to determine the membrane lipid peroxidation level. For this purpose, ca. 107 cells were ground in liquid nitrogen with a mortar and pestle, dissolved in 250 µL double distilled water (molecular biology grade, Thermo Fisher Scientific, Villebon-sur-Yvette, France), and centrifuged for 10 min at 10,000× g. Fractions of the supernatant (75 µL) were then mixed with 25 µL of SDS (3% (w/v)), 50 µL of TBA (thiobarbituric acid, 3% (w/v) in a 50 mM NaOH solution), and 50 µL of HCl (23% (v/v)) with vigorous mixing after each addition. The mixture was incubated at 80 °C for 20 min and then cooled on ice. The TBARS value was determined by measuring absorbance at 532 nm, and subtracting non-specific absorbance at 600 nm using UV-Vis spectrophotometer (Cary50, Varian, Les Ulis, France).
Impact on gene expression was determined by RTqPCR. First, total RNAs were extracted from the yeast cells with the RiboPure RNA extraction kit (Thermo Scientific, Illkirch, France) following manufacturer instructions. Total RNA content was determined with the Quant-iT HR RNA assay and using Qubit fluorimeter (Thermo Scientific, Illkirch, France). Then, reverse transcription was completed with the SuperScript IV cDNA synthesis kit (Thermo Scientific, Illkirch, France) using 5 mg of total RNA, oligo (dT) adaptor primer (Thermo Scientific, Illkirch, France) and 1 unit of RiboLock (Thermo Scientific, Illkirch, France). Real-time PCR was performed with a PikoReal™ Real-Time PCR System (Thermo Scientific, Illkirch, France) using DyNAmo ColorFlash SYBR Green qPCR (Thermo Scientific, Illkirch, France) and specific primers (Eurogentec, Liege, Belgium). Primers used were: SIR2, forward: 5′-CGTTCCCCAAGTCCTGATTA-3′, and reverse: 5′- CCACATTTTTGGGCTACCAT-3′; SOD2, forward: 5′-CTCCGGTCAAATCAACGAAT-3′, and reverse: 5′-CCTTGGCCAGAAGATCTGAG-3′; TUB1, forward: 5′-CCAAGGGCTATTTACGTGGA-3′, and reverse: 5′-GGTGTAATGGCCTCTTGCAT-3′. The parameters used for the qPCR were as follows: 95 °C—5 min initial denaturation, then 40 cycles of 95 °C—15 s denaturation, 55 °C—10 s primer annealing and 72 °C—20 s extension. After these 40 cycles, a final extension period 72 °C—90 s was carried out. The presence of a single amplicon was confirmed by observation of a single peak in the melting curve obtained after amplification for each gene and condition. Housekeeping gene TUB1 was used for normalization. Expression levels were calculated and normalized using 2−ΔΔCt method.

2.9. Statistical Treatment of Data

Statistical analyses were performed with XLSTAT 2019 suite (Addinsoft, Paris, France). Data composed of at least three independent replicates were presented using the means and standard deviations. Student t-test was carried out for statistical comparative analysis. Significant thresholds at p < 0.05, 0.01 and 0.001 were represented by *, ** and ***, respectively. Different letters were used to indicate significant thresholds at p < 0.05.

3. Results and Discussion

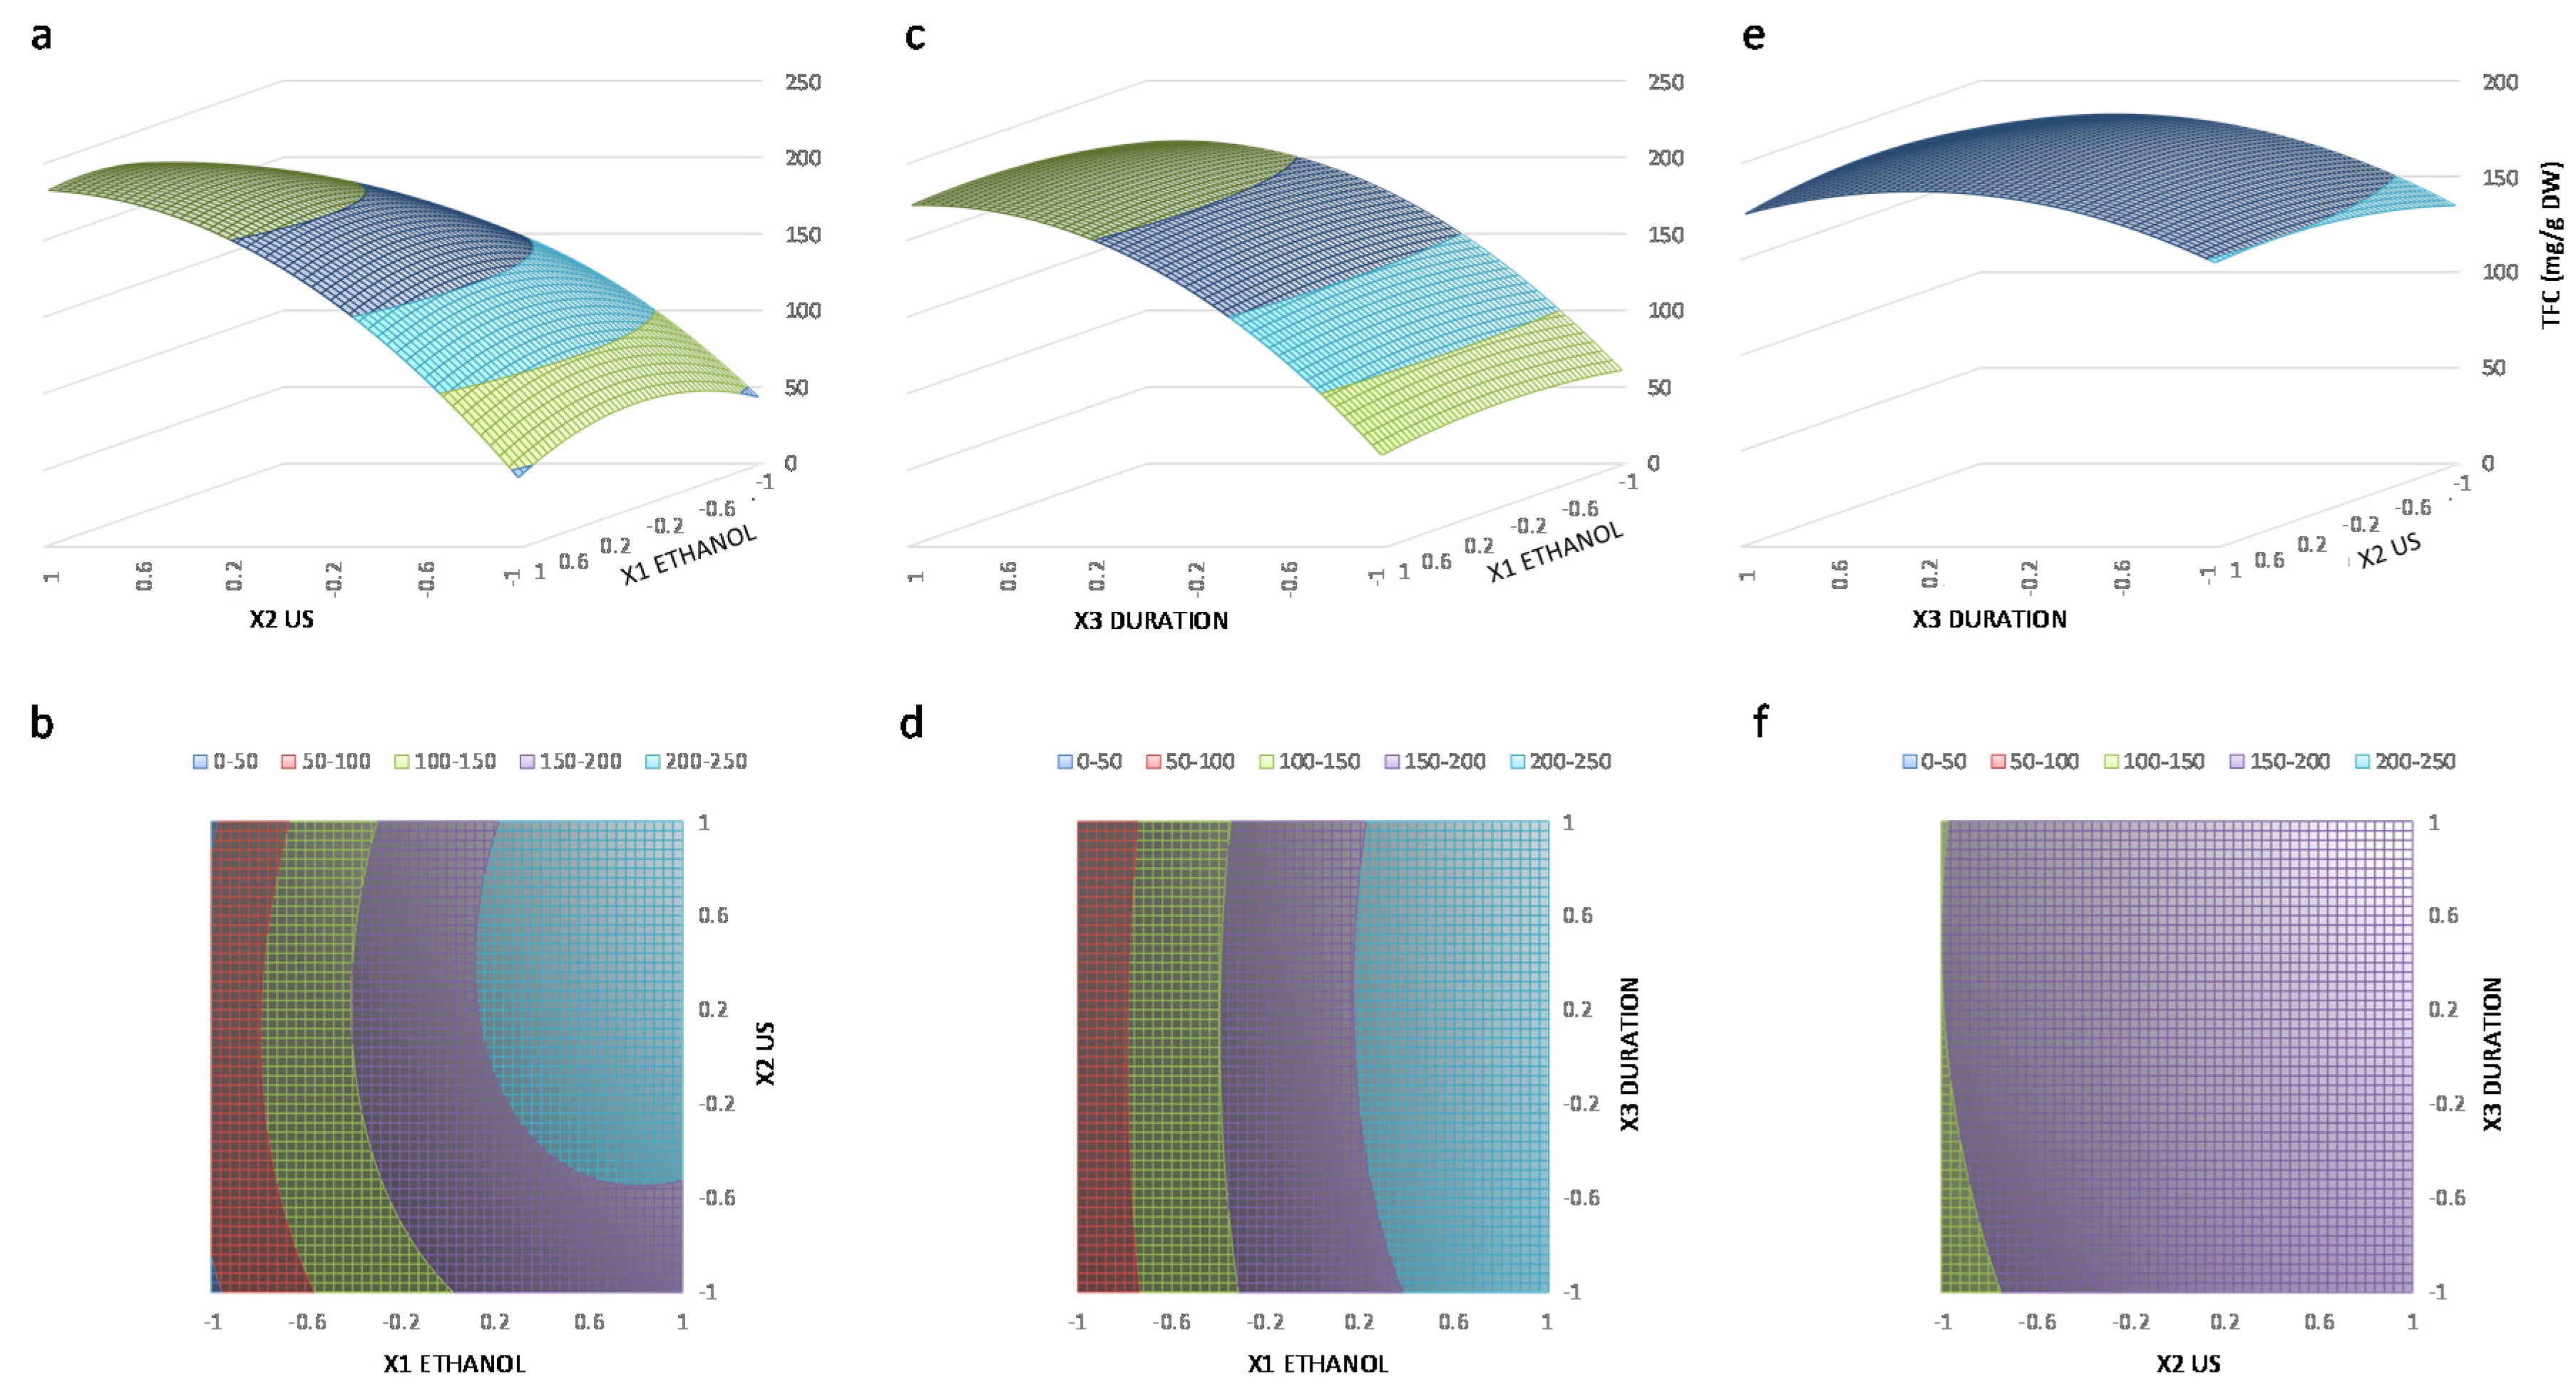
3.1. Optimization of UAE of Total Flavonoids from N. lotus Stamens

In view of its high reproducibility due to the actual measurement of a large number of experimental conditions compared to other DOE approaches [44], a full factorial design was used to optimize the UAE of N. lotus stamens flavonoids. In the framework of the development of the UAE method, three parameters of influence stand out very clearly: the nature of the extraction solvent, the US frequency and the extraction duration [18,21,22,23,24,25]. With these considerations in mind, the impact of these three variables for the development of an UAE of the total flavonoids from N. lotus stamen was evaluated. When designing an extraction method, the choice of solvent is a key parameter to determine. Ethanol has been widely used as environmentally friendly solvents for extracting a wide variety of polyphenols from plant matrices [17,18,21,22,25,45,46,47]. EtOH is one of the least toxic to humans and more environmentally friendly organic solvents [45], classified by the Food and Drug Administration (FDA) as a generally recognized as safe (GRAS) substance [48]. It is a versatile solvent with both a polarity and extraction capacity that can be easily modulated by the simple addition of water, making it the ideal solvent for extracting a wide variety of low-to high-polarity polyphenols. Water and EtOH are commonly used as two universal solvents for various food and/or cosmetic applications [21,22,23,45]. It was therefore rational for us to choose these two universal solvents for the development of the UAE method of total N. lotus stamen flavonoids according to the principles of green chemistry.
The three variables were: X1 for aqEtOH concentration (ranging from 50 to 100% (v/v), X2 for US frequency (ranging from 0 (no US applied) to 45 kHz) and X3 extraction duration (ranging from 20 to 60 min). Their coded levels and experimental values are shown in Table 1. The ranges of each variables were determined based on single parameter evaluation preliminary experiments. In comparison, based on the results obtained from these preliminary experiments, the influences of the liquid/solid ratio and extraction temperature parameters were negligible (i.e., no significant impact) and were fixed to 25:1 mL/g DW and 45 °C, respectively (data not shown). In silico, the 27 different bath conditions (run ID) for the full factorial design were determined and randomized (run order). The respective independent process variables for each batch condition are shown in Table 2. Each batch condition was tested in separate triplicates. Table 3 presents the TFC from the N. lotus stamens resulting from these extraction conditions. Here, TFC ranged from 29.68 ± 2.75 (run ID#1) to 230.74 ± 5.97 (run ID#27) mg/g DW. These results clearly have shown that stamens are a rich flavonoid plant tissue. This is quite logical given the key biological role of stamens (bearing pollen) in which flavonoids may have important plant functions as antioxidants (e.g., during pollen germination [49]) but also as protective compounds (e.g., antifungal [50]), particularly for aquatic plants such as water lily.
The multiple regression analysis (Table 4) provided a model of the TFC extracted from N. lotus stamens as a function of the three different variables. The TFC extraction yield (YTFC), obtained using the conditions listed in Table 1; Table 2, was expressed in the form of a polynomial equation, YTFC as a function of the X1 (aqEtOH concentration), X2 (US frequency) and X3 (extraction duration): YTFC = 187.5 + 78.0 X1 + 16.5 X2 + 3.0 X3 – 42.4 X12 – 22.7 X22 – 6.7 X32 + 15.7 X1×2 + 3.6 X1X3 – 3.8 X2X3 (Table 4).
The statistical analysis (Table 4) evidenced the highly significant important effect (p < 0.001) on TFC extracted from N. lotus stamens of aqEtOH concentration and US frequency through their linear coefficients X1 and X2, quadratic coefficients X12 and X22, as well as their interaction coefficient X1X2. On the contrary, all the other coefficients involving extraction duration (i.e., X3) were not statistically significant (p > 0.05). The representation normalized coefficients for each variable, with the 95% confidence interval (CI), for the proposed polynomial model is shown in Figure S2.
Table 5 lists the results of the analysis of variance (ANOVA) and the fit for the model obtained for TFC extracted from N. lotus stamens. This analysis, in particular the high F-value (239.686) and the low p-value (p < 0.0001), clearly indicated that the model as highly significant and appropriate to predict the TFC extracted from the N. lotus stamens as a function three variable value with high precision (Table 4). This trend is also confirmed by the low and non-significant lack of fit value, and the coefficient of determination of the model (R2 of 0.992 with an adjusted value at 0.988), whereas the coefficient value (CV) indicated the appropriateness between the model and the experimental values. This precision of the model in the prediction of TFC experimental values is further illustrated by the predicted vs. experimental TFC plot presented in Figure S1.
The values of linear coefficients of the polynomial second-order equation for X1 aqEtOH concentration, X2 US frequency and X3 extraction duration, as well as of the interaction coefficients X1X2 (aqEtOH concentration × US frequency) and X1X3 (aqEtOH concentration × extraction duration), were all positive, suggesting that the increase of these parameters results in a favorable effect on the extraction of TFC. However, the negative values of their quadratic coefficients (X12, X22 and X32, respectively), as well as of the interaction coefficient between US frequency and extraction duration (X2X3), imply that this total flavonoids extraction process from the stamens of N. lotus is much more complex and reaches a maximum value before decreasing for high values of those three extraction parameters.
These trends are clearly observed in the three-dimensional (3D) plots (Figure 2), with first positive action on the TFC extracted from N. lotus stamens with increased aqEtOH concentrations combined with higher US frequency and/or longer duration of extraction prior to its decline (Figure 2a,b). High US frequency combined with prolonged extraction duration at high US frequency, resulted in a marked decline in TFC extracted from N. lotus stamens (Figure 2c).
EtOH is a universal solvent that is widely used to extract a wide range of phenolic compounds of low to high polarity, since its polarity and thus its extraction capacity can be easily modulated by adding water. Results indicate that a small addition of water, and therefore a slight increase in polarity, is favorable for the extraction of total flavonoid from N. lotus stamens. In accordance with this result, different organs of N. lotus have been reported to accumulate flavonoids mainly in the form of glycosides [4,14,15]. Solvents used for flavonoid extraction are generally selected according to their polarity [51]. The less polar solvents are particularly useful for the extraction of aglycones, while more polar solvents are used if glycosides are pursued [51]. As is the case in the present study, flavonoid glycosides are typically isolated from plant material by extraction with alcohol, such as EtOH, water or a combination thereof [17,18,21,22,25,45,46,51]. Note that the concentration of aqEtOH depends also on the plant matrix considered for optimum results [23,45]. The cavitation effect and the diffusion coefficient of the compounds in the extraction solvent are significantly affected by the US frequency [23,45]. As a result, the US frequency may increase the solubilization of the compound in the extracting solvent and thus improve the extraction yield [23,45]. By acting on the cavitation effect and the diffusion coefficient, the US frequency also contributes to the reduction of the extraction duration [23,45]. The duration of extraction, in itself, is also an important parameter to consider, bearing in mind that a duration increase does not automatically increase the extraction yield, particularly during UAE. In fact, extended extraction duration in the case of UAE may lead to increased degradation of the bioactive compounds [21,25]. Extended extraction duration during UAE, particularly in the presence of water has been shown to induce oxidation of polyphenols, thus drastically reducing antioxidant capacity of the resulting extract [21,23]. In the context of green chemistry, it is also of particular interest to reduce the extraction duration in order to diminish the impact of energy consumption [52]. Consequently, all these extraction parameters should be precisely optimized and their possible interactions taken into account in order to avoid any sharp reduction in the extraction yield (both quantitatively and qualitatively) but also any dramatic decline in the biological activity of the sample extract.
Hence, in this context, the use of multivariate techniques, such as full factorial design, to optimize the UAE method starting from complex plant materials is particularly appropriate [44,53]. It is an effective, precise and rapid way of integrating a large number of extraction conditions and of demonstrating possible interactions between independent variables compared to single-factor approaches [44,53]. Here, according to the adjusted second order polynomial equation determined by the TFC obtained with the full factorial design experiment, the optimum conditions were: 90% (v/v) aqEtOH as extraction solvent, 34.6 kHz for the US frequency and an extraction duration of 46 min (here, using an extraction temperature and liquid to solid ratio fixed at 45 °C and 25:1 mL/g DW, respectively). Adjusted to the US bath apparatus used, an US frequency of 30 kHz was used. Under these optimized conditions, TFC extracted from N. lotus stamens reached 235.45 ± 5.44 mg/g DW.

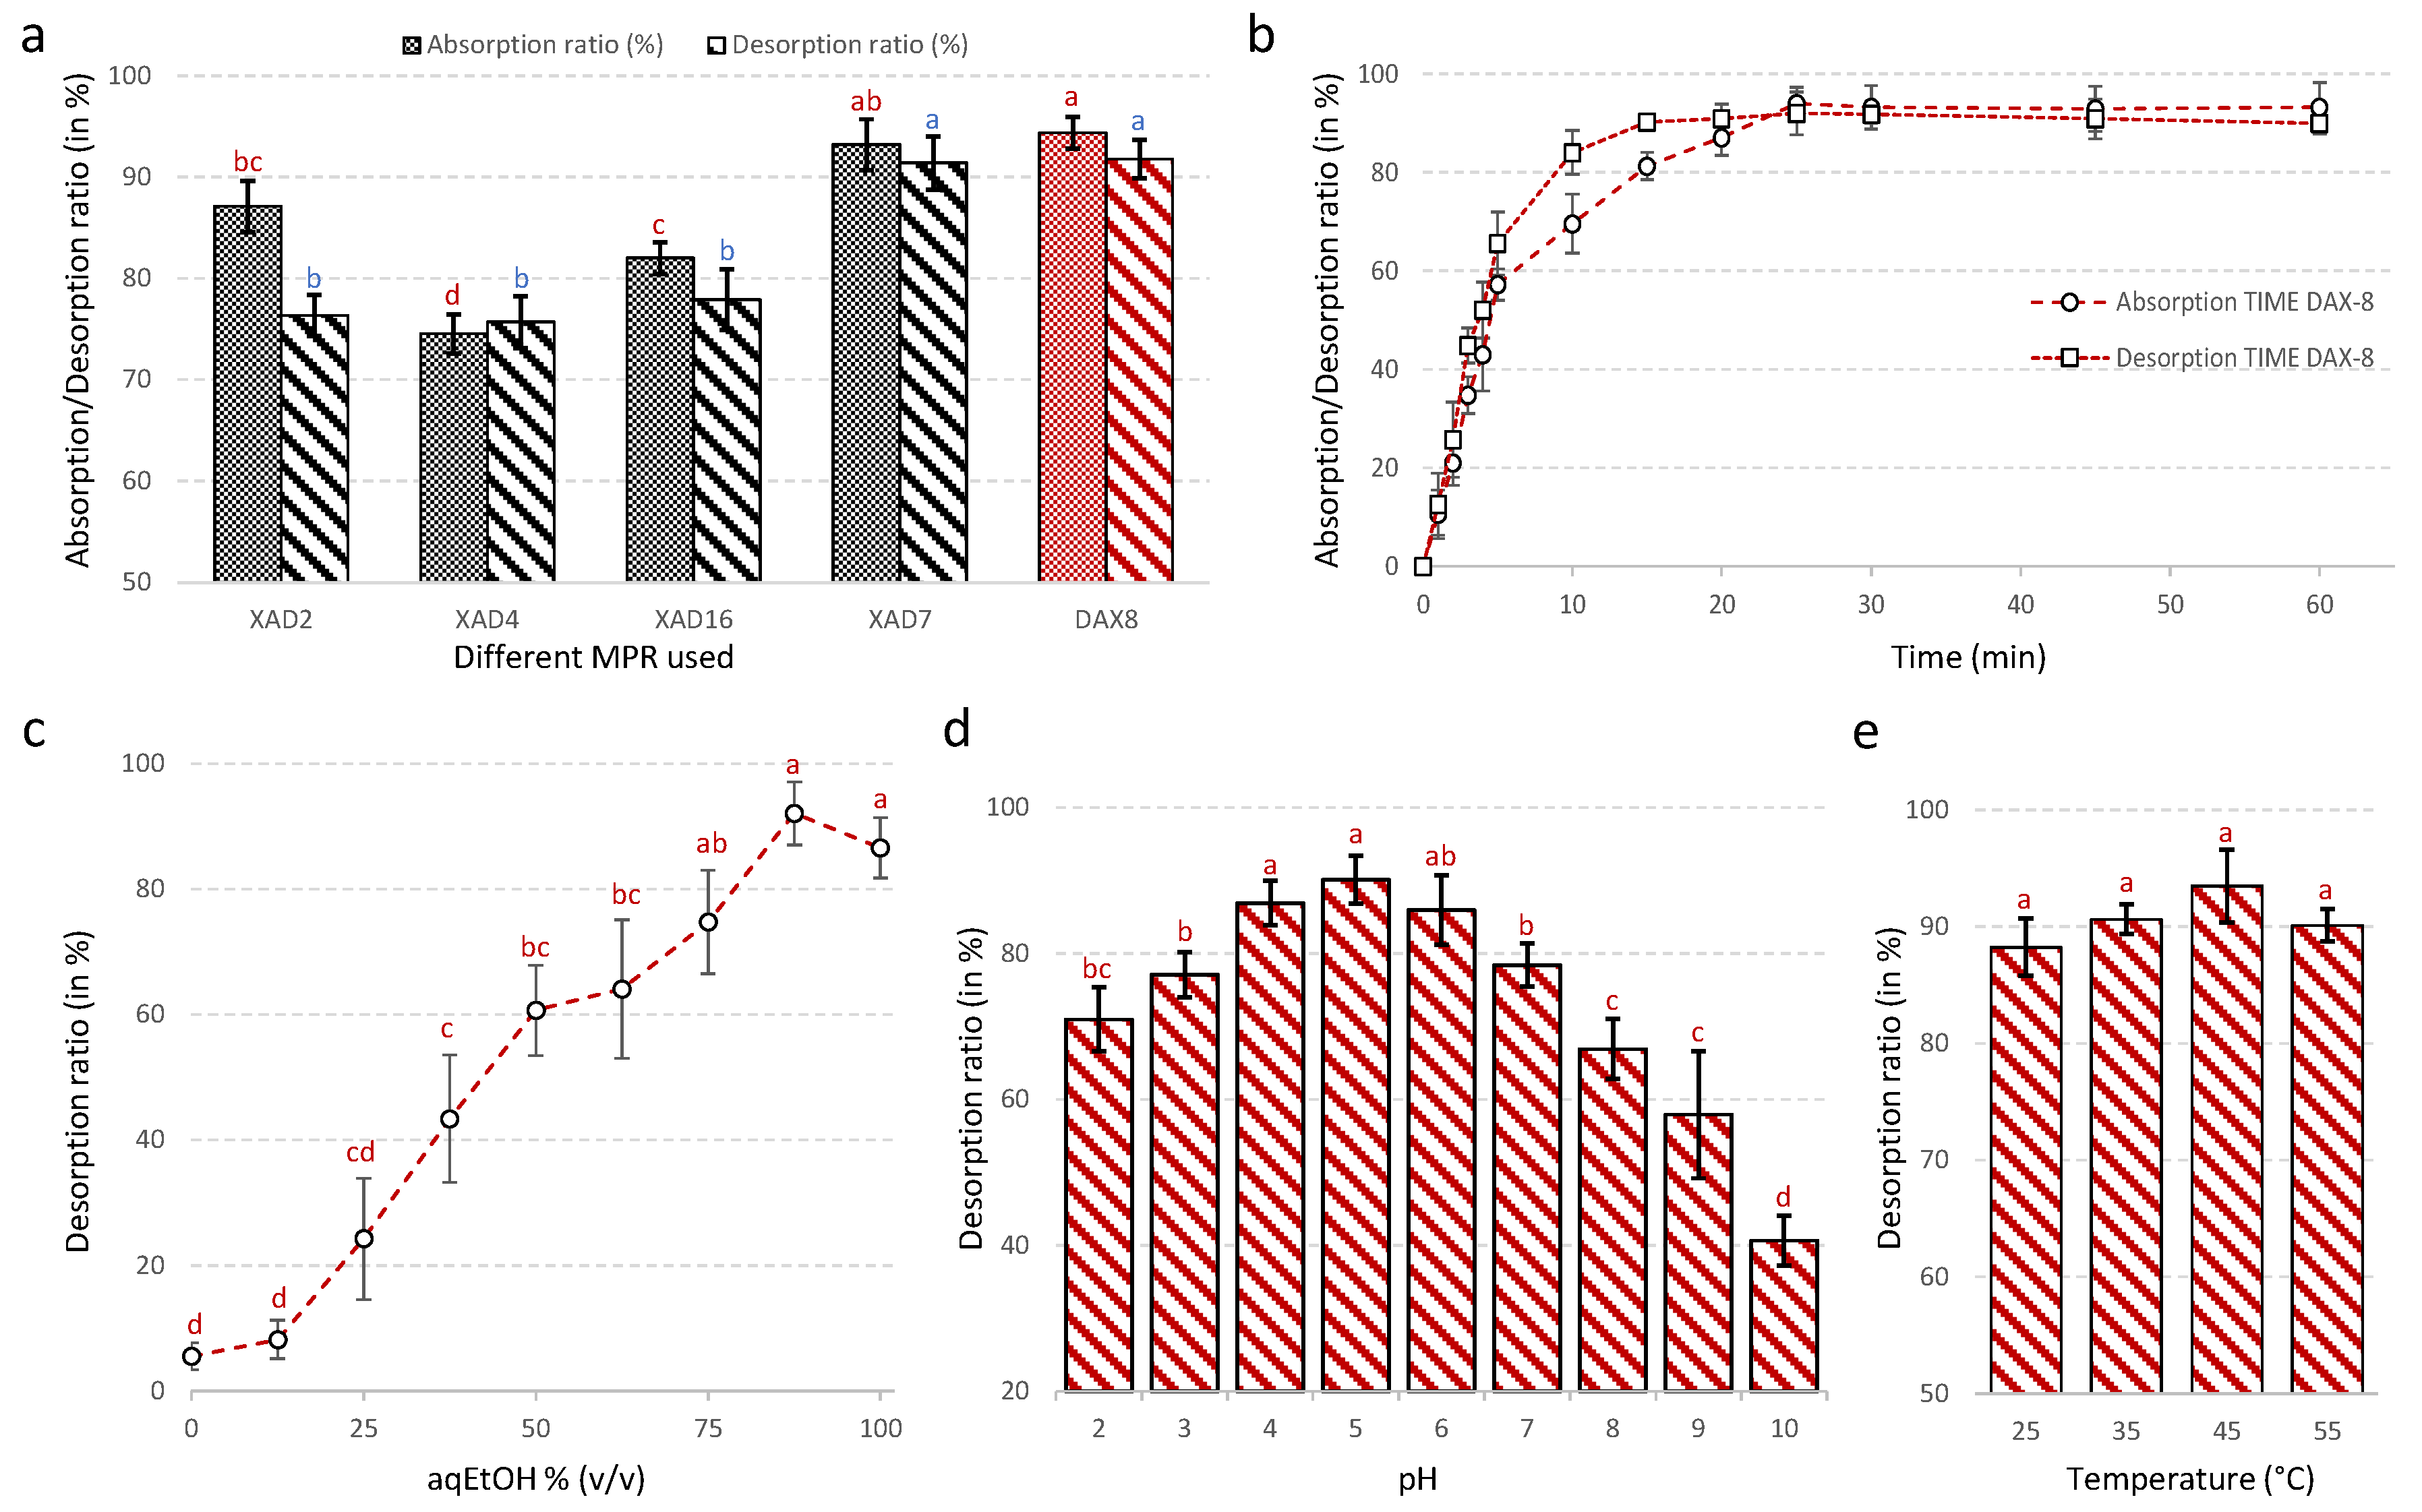
3.2. Optimization of Macroporous Resin Purification of Total Flavonoids from N. lotus Stamens

Five MPR (Table 2) with different surface areas, average pore diameters, matrix types and polarities were investigated for the purification of total flavonoids from N. lotus stamen. The results of their adsorption capacity and desorption capacity of the total flavonoids from N. lotus stamen extract obtained under optimal UAE conditions are shown in Figure 3a. Both DAX-8 and XAD-7 acrylic-type MPR showed stronger static adsorption and desorption for the flavonoids from N. lotus stamen extract than other styrene divinyl benzene resins tested. The styrene-divinyl-benzene macroreticulate XAD-2 MPR showed similar absorption capacity compared to the XAD-7, but with significantly lower desorption capacity than these two microporous resins. Due to its higher adsorption and desorption capacity for the flavonoids from N. lotus stamen extract, the DAX-8 MPR was selected. The purification conditions were further optimized to make the purification process more efficient.
Figure 3b shows the kinetics for static adsorption and desorption capacity of the DAX-8 MPR for total flavonoid present in N. lotus extract from stamens. As shown by the adsorption curve, total flavonoids from the N. lotus extract were rapidly and efficiently absorbed by the DAX-8 MPR with an adsorption equilibrium occurring after 25 min, and a maximal adsorption capacity of 94.37 ± 3.30% for the total flavonoids from the extract. The desorption ratio increased sharply, reaching a maximum value after 15 min (Figure 3b). The desorption curve indicates that the total flavonoids absorbed into the resin were more effectively desorbed with 90% (v/v) aqEtOH solution (Figure 3c). The pH of the extract significantly influenced this purification step with optimal value obtained pH5 (Figure 3d). Increased desorption temperature to 45 °C resulted in a slight but not significant increase in the desorption ratio (Figure 3e). Under these conditions, the desorption ratio reached 94.37 ± 1.56%.
Divergent assumptions on the effect of the chemical structure (e.g., styrene, acrylic) and physical properties (such as surface area, pore diameter) of the MPR on the recovery of flavonoids were made, depending on the plant matrix [54,55,56,57,58,59,60]. In line with some recent reports [56,58,59,60], here, better results were achieved using the moderately polar acrylic DAX-8 and XAD-7 MPRs, certainly due to the nature of the flavonoids present in the N. lotus stamen extract. Acrylic MPRs, DAX-8 MPR in particular, have previously been reported for its efficacy in the enrichment of total flavonoid extracts from mature oil palm leaf (Elaeis guineensis Jacq.) [60]. The authors of this study pointed out the importance of adjusting the chemical nature of the MPR, but also its physical properties, to the nature of the plant extract and the compounds to be purified [60]. The ester substitution of the acrylic matrix with a lower surface area (140 m2/g), a lower particle diameter (250–420 μm) and a lower pore diameter (225 Å) of the DAX-8 MPR compared to the XAD-7 MPR were more suitable characteristics for the purification of total flavonoids from N. lotus stamen extract. The rapid equilibrium reached for both absorption (i.e., 25 min) and desorption (i.e., 15 min) are in line with the literature data [55]. The results showed that concentration and pH of the aqEtOH solution and the temperature influenced the desorption capacity of the MPR. In the literature, most flavonoids are desorbed with an aqEtOH concentration for the desorption solution ranging from 75–100% (v/v) in agreement with the present study [54,55,56,57,58,59,60]. The pH value can change the ionization of flavonoids, which also affects their adsorption to the MPR [57]. The optimal pH value was around 5, which resulted in an increased enrichment of the N. lotus stamen extract in total flavonoids. This result is consistent with other studies [55,56,57,58,59,60]. At a higher pH value, the flavonoid phenolic hydroxyl groups dissociated with H+ and the corresponding flavonoid anion result in lower adsorption capacity and thus a drastic reduction in the purification yield [57].

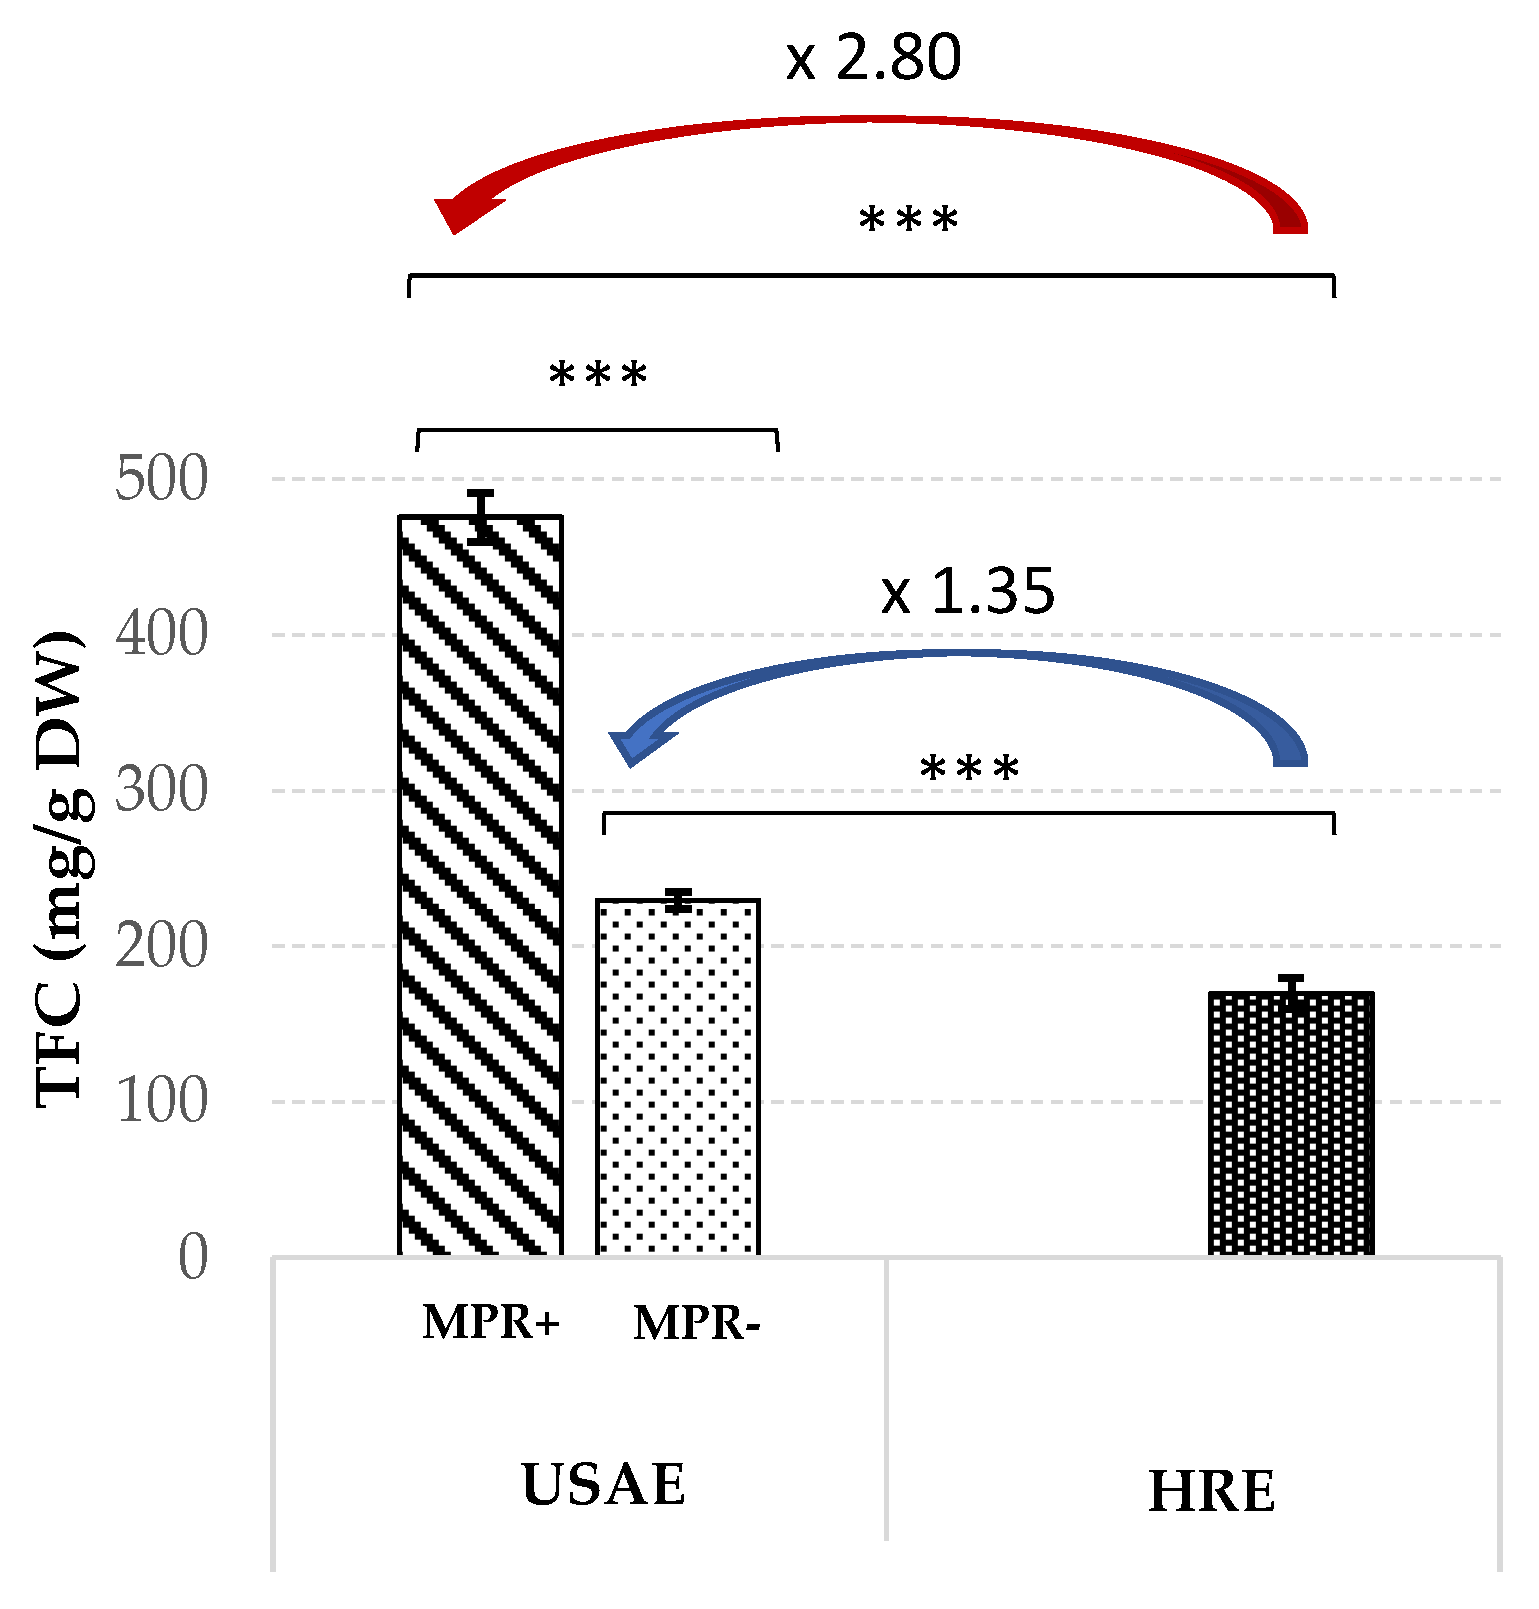
3.3. Comparison with Conventional HRE Method

To evaluate the efficacy of the proposed protocol, TFC obtained from N. lotus stamens using optimized UAE alone (UAE MPR−) or coupled with the proposed MPR purification step (UAE MPR+) was compared to the conventional HRE method. For this purpose, HRE was performed using the same aqEtOH concentration of 90% (v/v), extraction duration of 46 min, temperature of 45 °C and L/S ratio of 25:1 mL/g as for the optimized UAE (the only difference is the absence of a request from the US). The results of these extraction protocols are shown in Figure 4.
The results of these different extraction procedures showed a significant increase (1.35-fold) in TFC extracted from N. lotus stamen using UAE (TFC = 235.45 ± 5.44 mg/g DW) compared to HRE (TFC = 169.64 ± 9.86 mg/g DW), thus demonstrating the efficiency of US application. Higher extraction yields can be obtained with HRE when the extraction duration increases, but without reaching observed values with the UAE (data not shown), and with increased energy consumption as a result of this extension in duration. Therefore, in the context of green chemistry, but also for potential industrial applications, this UAE protocol is of particular interest in terms of reducing energy consumption through the use of this innovative technology. It enables high extraction yields of flavonoids from N. lotus stamens with lower extraction costs (reduction in terms of length of treatment and solvent use). It can be assumed that this UAE efficiency may be a consequence of the collapse of cavitation bubbles acting as microreactors creating locally high temperature and pressure conditions in the surrounding liquid [23], resulting in a more effective breakdown of the plant tissue and thus a more efficient release and solubilization of the released flavonoids. This increase yield appeared even higher with UAE coupled with MPR purification (TFC = 475.42 ± 16.61 mg/g DW), resulting in a significant 2.80-fold increase compared to HRE. This enrichment in flavonoids was the result of the UAE, followed by the MPR purification step. The enrichment in total flavonoids of the plant extract obtained by the UAE following the MPR purification step has already been reported [31]. Here, this enrichment may result from the elimination of other non-target compounds from the extract, such as simple sugars, as demonstrated by the reductions observed in the conductivity value as well as total sugar content of the extract following the XAD-8 MPR purification step (Table S1).

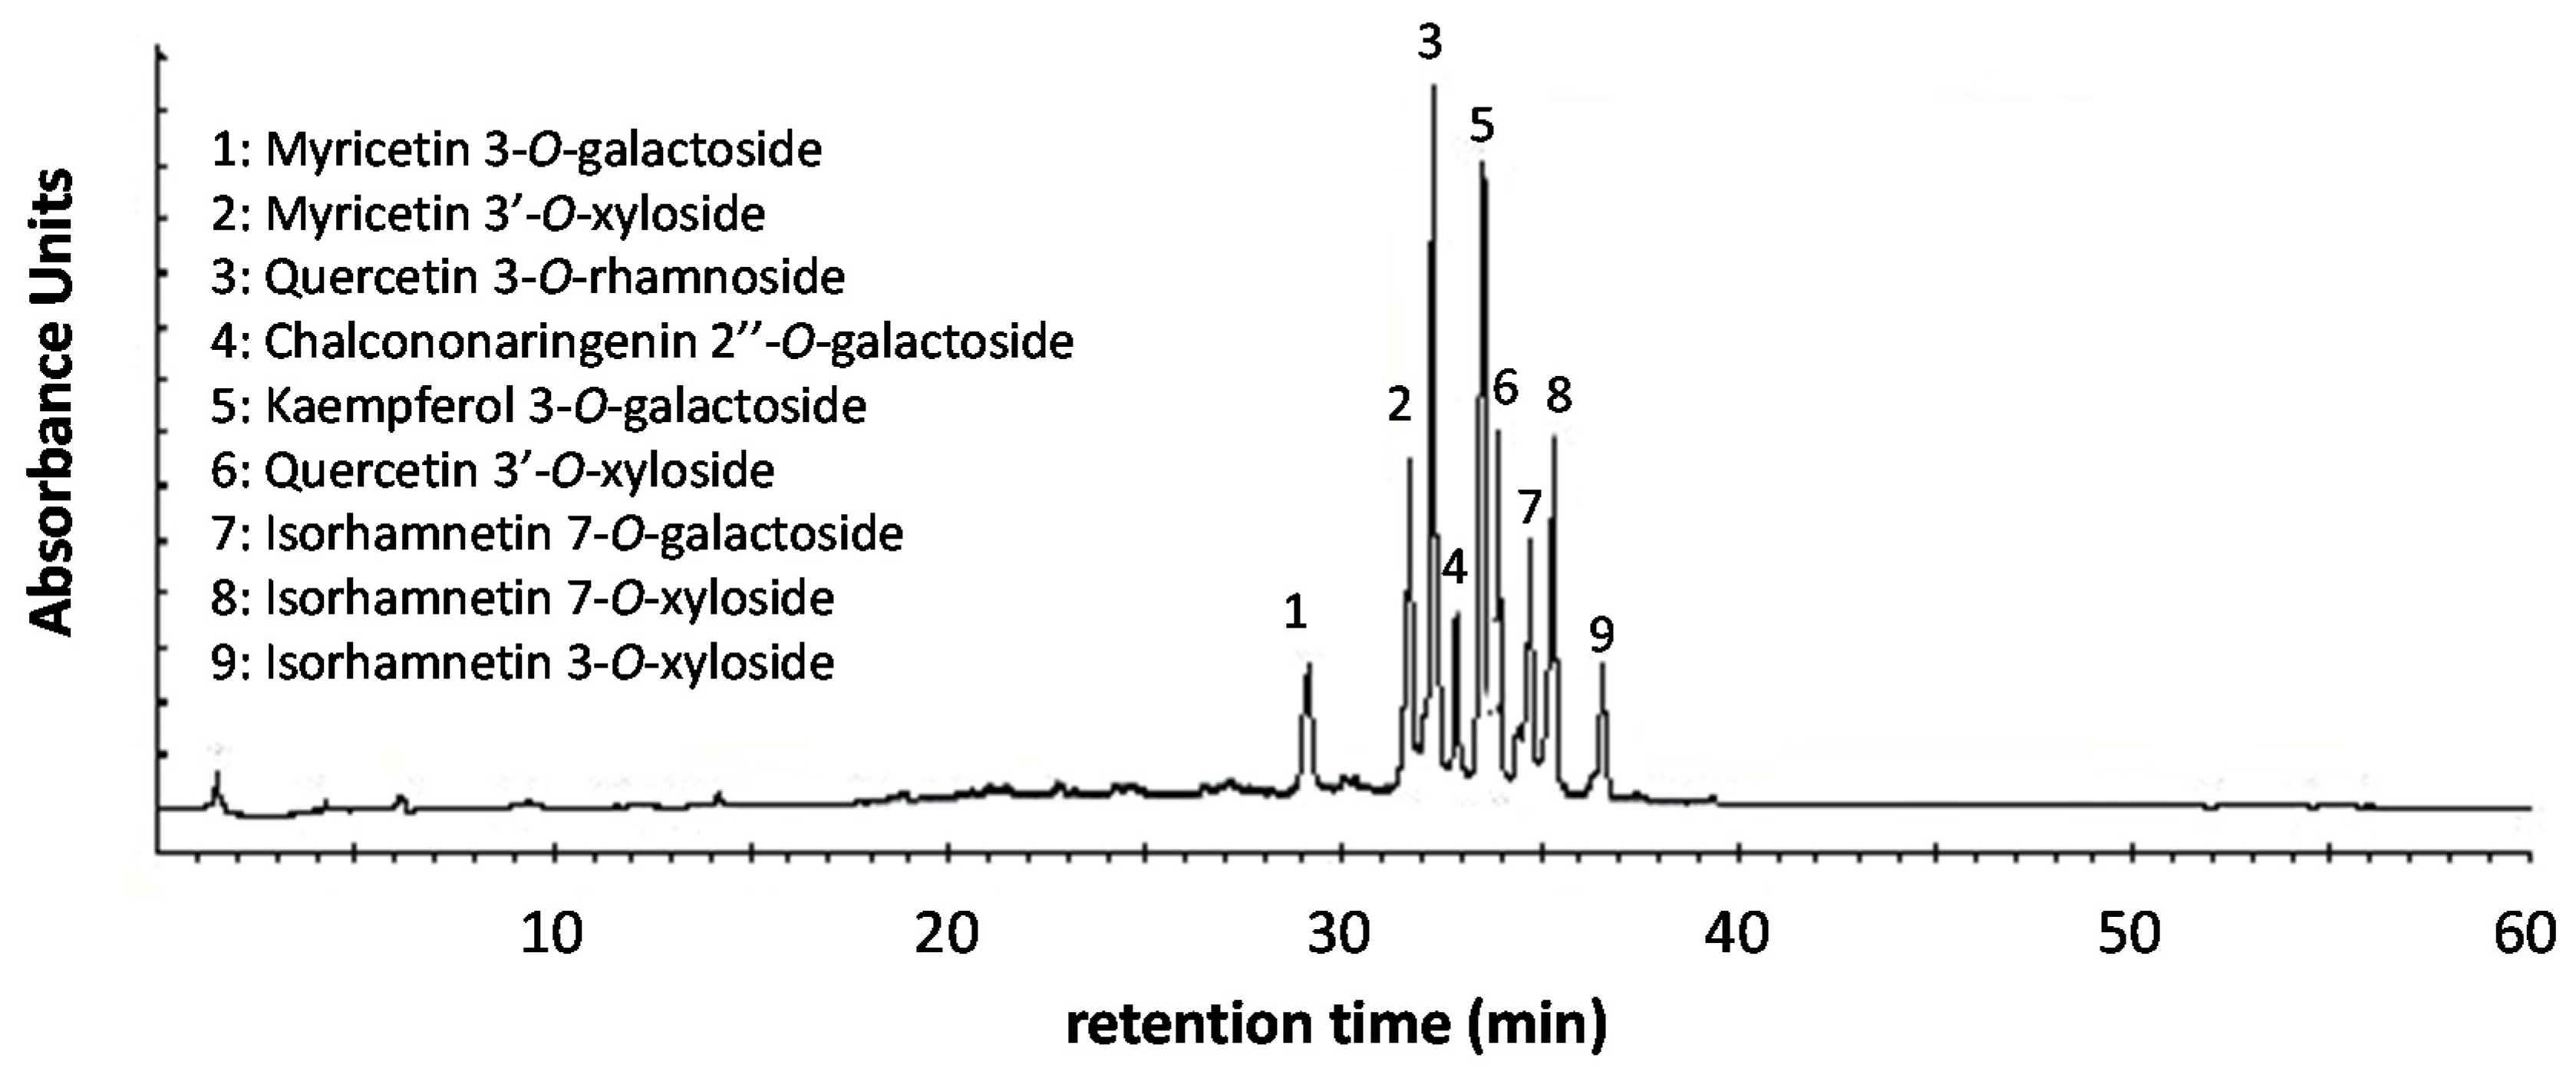
3.4. Analysis of Flavonoids by LC-MS

Figure 5 shows the chromatographic LC profile recorded at 350 nm of an extract from N. lotus stamens prepared, under optimum conditions, by UAE followed by DAX-8 MPR purification step.
Based on LC-MS analysis, a comparison with authentic standards and literature data [4,14], nine major flavonoids derived from N. lotus extracts were identified in the MPR extract (Table S2). These flavonoids were: (i) eight flavonol glycosides: three isorhamnetin (Iso) derivatives (Iso-7-O-galactoside (7), Iso-7-O-xyloside (8) and Iso-3-O-xyloside (9)), two myricetin (Myr) derivatives (Myr 3-O-galactoside (1) and Myr 3′-O-xyloside (2)), two quercetin (Que) derivatives (Que-3-O-rhamnoside (3) and Que-3′-O-xyloside (6)) and one kaempferol derivative (Kae-3-O-galactoside (5)); (ii) one chalcone glycoside: chalcononaringenin-2′′-O-galactoside (4) (Figure 5). Their relative quantification in the different N. lotus extracts is presented in Table 6. Previously, the current LC separation conditions were optimized for the separation of different plant extracts, in particular for the separation of simple phenolic glycosides that elute between 0 and 25 min, the flavonoid glycosides between 25 and 45 min, while the flavonoid aglycones are separated after 45 min (unpublished results). Here, the current separation clearly showed that the UAE and DAX-8 MPR purification steps are effective procedures for enriching N. lotus extract from stamen in flavonoid glycosides. All these flavonoids have been previously described in N. lotus, especially in flower tissue [4,14], but the current study is the first one specifically dedicated to the extraction from stamens of antioxidant flavonoids. The stamen is the reproductive organ of a flower that produces pollen. In plants, flavonols accumulated in pollen grains are known to enhance their development and regulate the sexual reproduction of plants by reducing the abundance of reactive oxygen species (ROS) [49]. Bees also collect this pollen from plant stamens (in the anthers) to make a product rich in antioxidant flavonoids consumed by humans with many human health-related properties [50].

3.5. Evaluation of Antioxidant Activity of Total Flavonoid Extracts from N. lotus Stamens

3.5.1. In Vitro Antioxidant Activity of Total Flavonoid Extracts from N. lotus Stamens

The antioxidant activity of plant extracts cannot be assessed by a single method due to the complex nature of the phytochemicals, in particular because the determination of antioxidant activity is highly dependent on the reaction mechanism involved. For this reason, several chemical or biological assays are required to assess antioxidant activity and describe the antioxidant mechanism of action of a plant extract [61]. In vitro cell-free chemical assays based on different mechanisms of reaction may provide an idea of the chemistry behind a plant extract’s antioxidant activity. These in vitro cell-free antioxidant assays can be roughly divided into different categories based on the chemical reaction involved, with ABTS based on a hydrogen atom transfer reaction (HAT) and FRAP based on an electron transfer reaction (ET), while DPPH can be considered as a mixed assay [61,62,63]. With this in mind, a series of in vitro cell-free antioxidant assays, including DPPH and ABTS scavenging activities, and a FRAP assay were used to determine the antioxidant activity of the extracts from N. lotus stamens. Results, shown in Table 7, were expressed as Trolox C equivalent antioxidant activity (TEAC), with the synthetic commercial antioxidant BHT being used as positive control.
All N. lotus extracts showed good free radical scavenging activity in the DPPH assay. The activity of N. lotus extract resulting from UAE followed by DAX-8 MPR purification step (MPR condition: 4749.67 ± 166.05 μmol TEAC/g, Table 6) was significantly higher than that of the positive control BHT (3059.07 ± 401.32 μmol TEAC/g). The free radical scavenging activity in the DPPH assay of N. lotus extract resulting from UAE without additional purification step (UAE condition: 3167.85 ± 342.64 μmol TEAC/g, Table 6) was similar to that of BHT. A similar trend was observed for the FRAP assay, in particular, with N. lotus extract resulting from UAE followed by DAX-8 MPR purification step (MPR condition: 3601.74 ± 126.26 μmol TEAC/g) showing significantly higher activity than that of BHT (1724.12 ± 161.27 μmol TEAC/g). Using ABTS assay, the antioxidant activity recorded for N. lotus extract resulting from UAE followed by DAX-8 MPR purification step (MPR condition: 4710.67 ± 155.64 TEAC/g) was statistically similar to that of BHT (4378.12 ± 106.62 μmol TEAC/g). These results highlighted the interest of the proposed extraction/purification process with a great antioxidant potential, at least similar to that of BHT. From a mechanistic point of view, this antioxidant activity can be correlated with the various flavonoid components found in this N. lotus extract, in particular with the capacity of electron donation, which have been associated with the degree and position of hydroxylation and methoxylation of the flavonoid ring B [64].

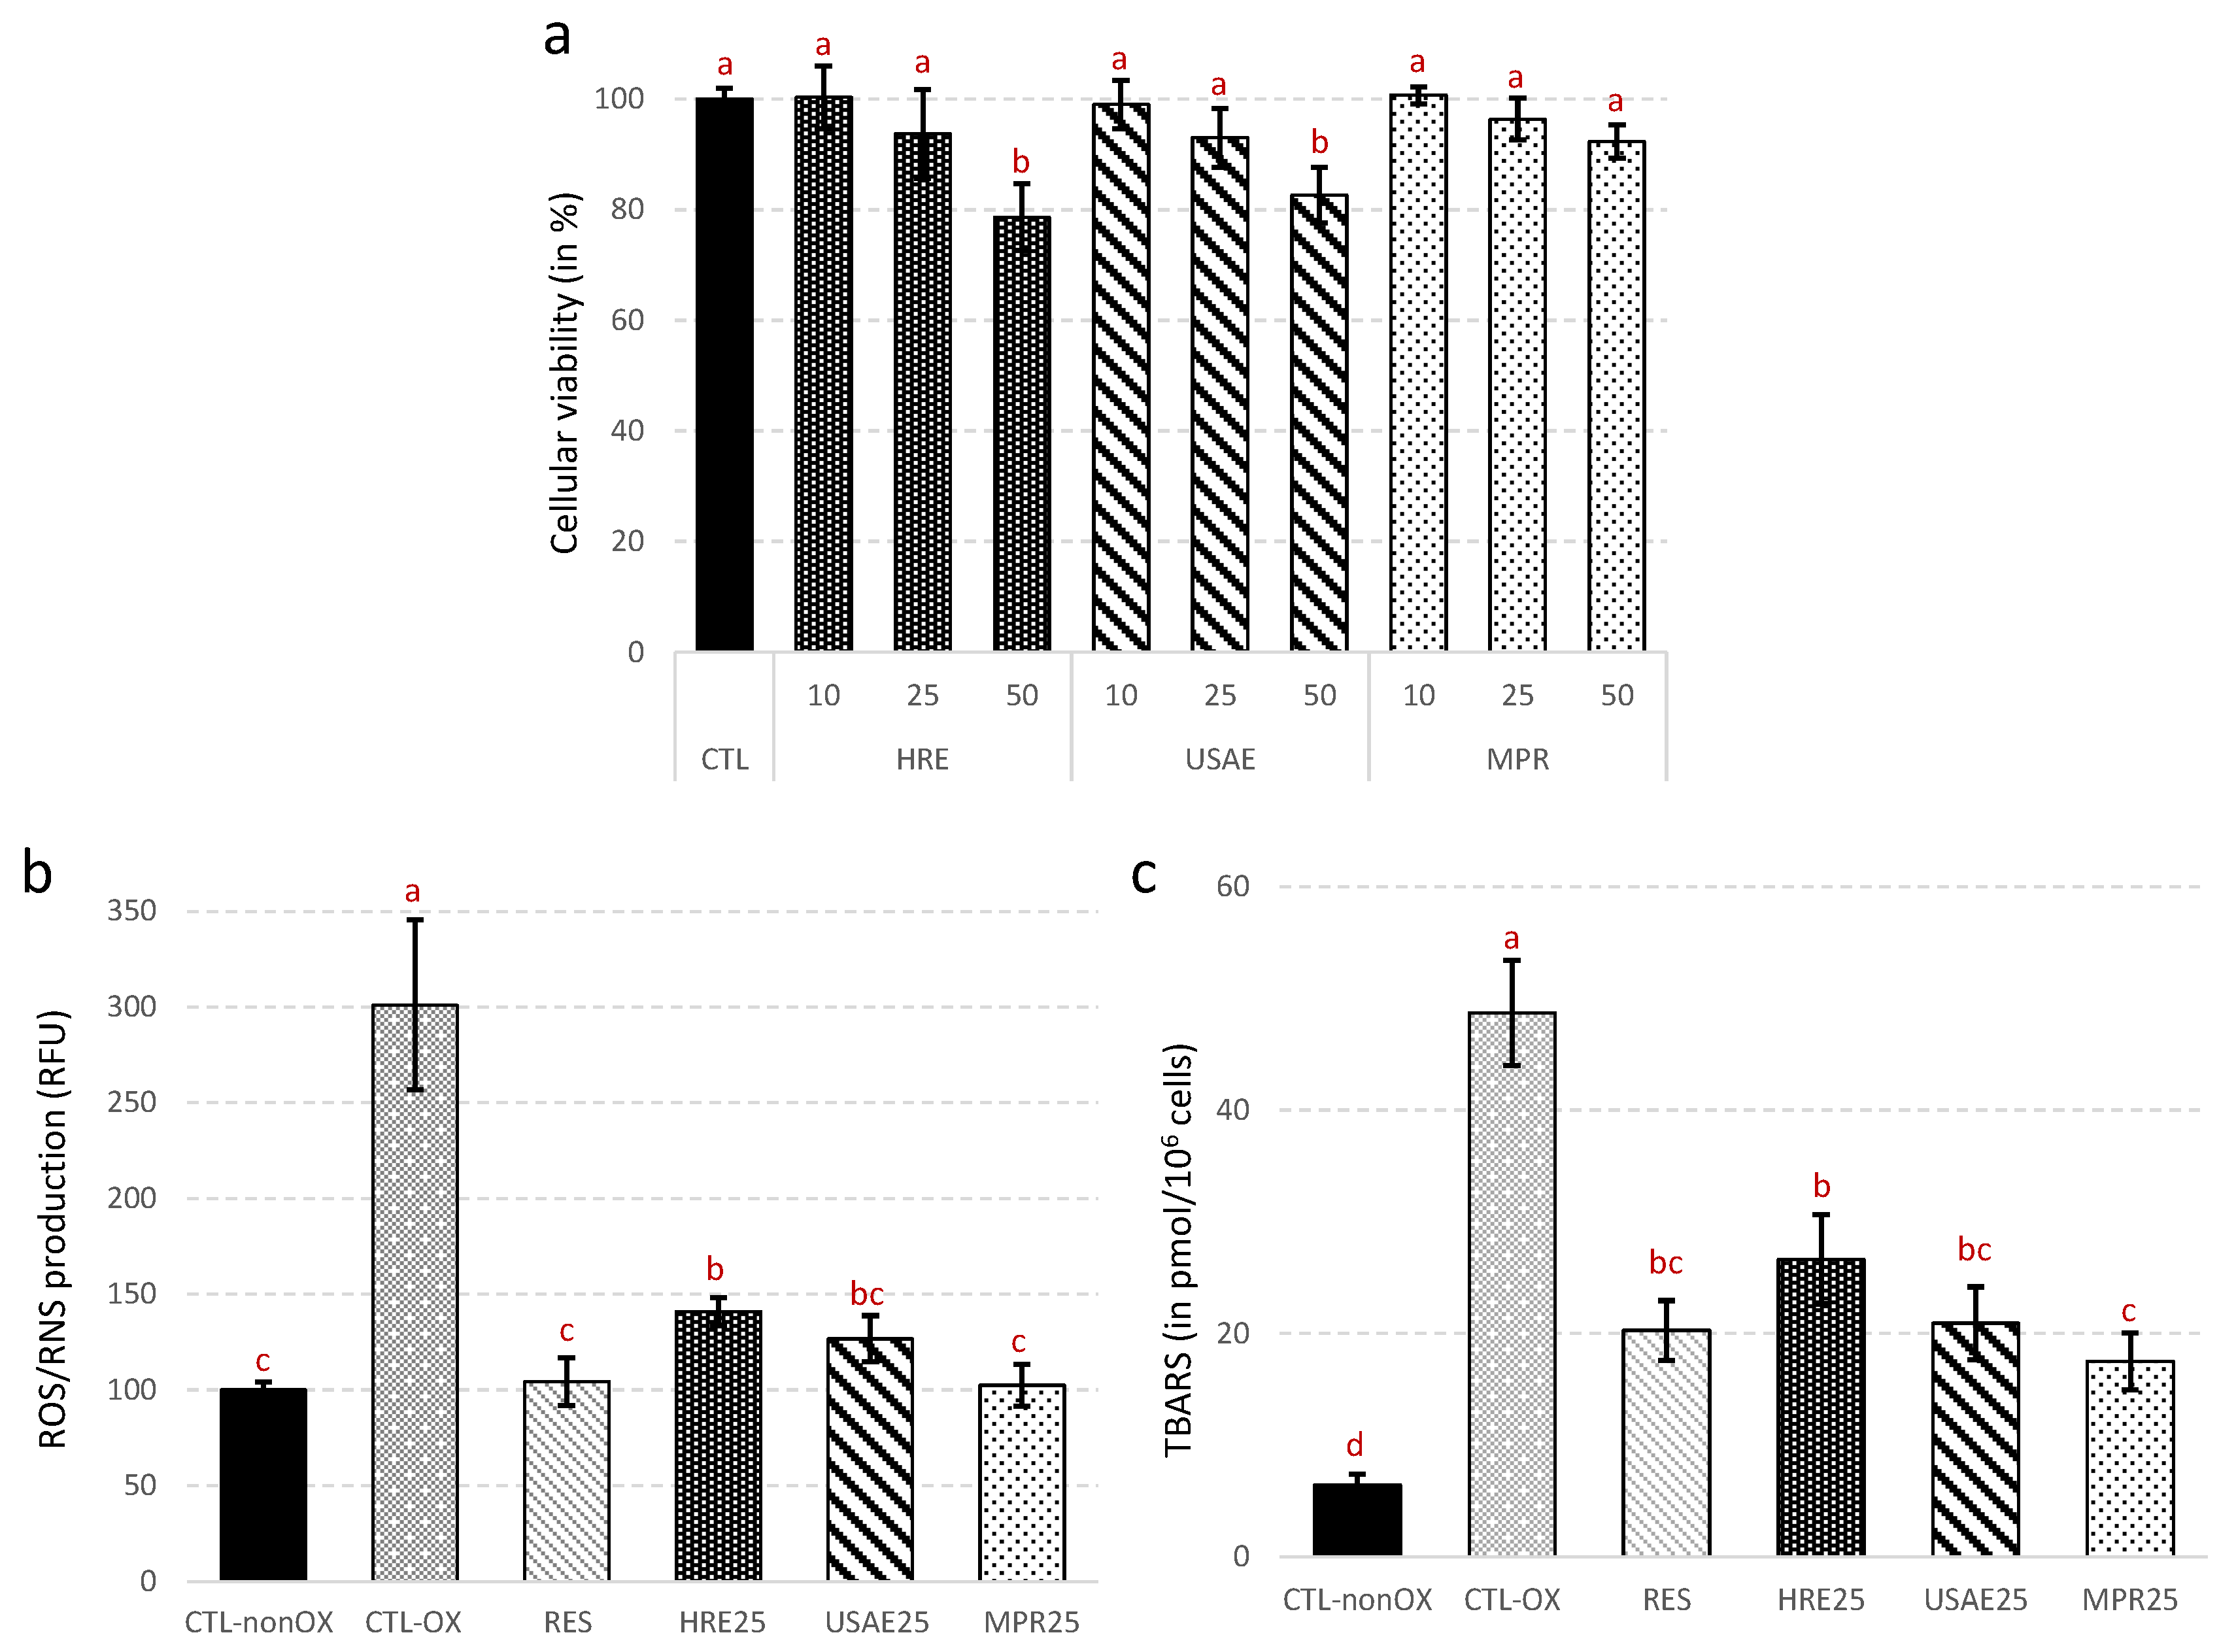
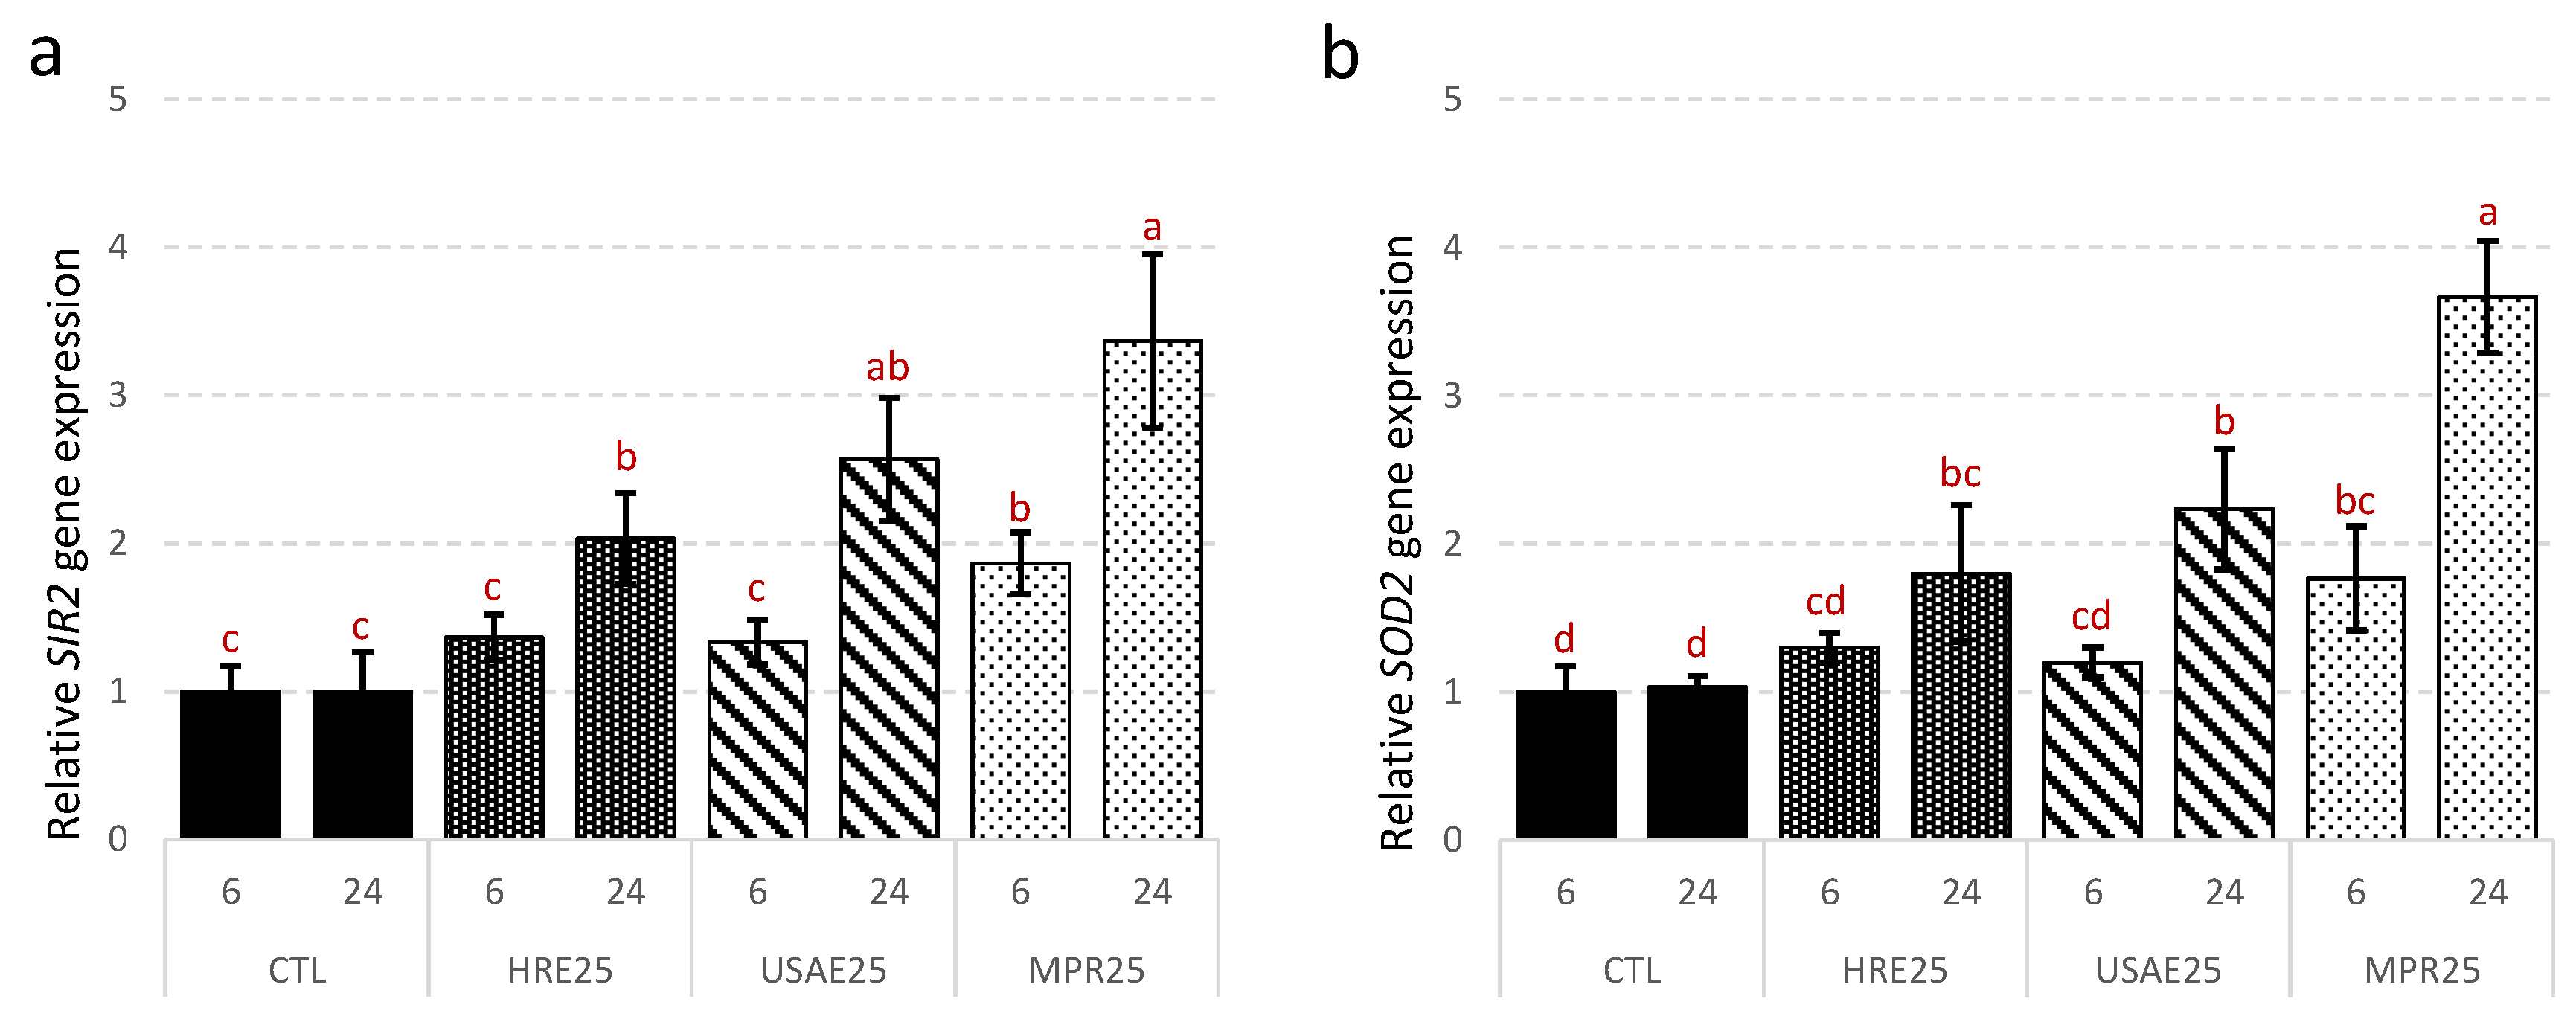
3.5.2. Cellular Antioxidant Activity of Total Flavonoid Extracts from N. lotus Stamens

Although interesting from a purely predictive point of view based on chemical reactions, the in vitro cell-free assays do not necessarily represent the situation occurring in in vivo systems. Therefore, the validity of these antioxidant data must be considered to be limited to an interpretation within the significance of the chemical reactivity in relation to the considered radicals generated in vitro, and therefore, this must be confirmed in vivo. Consequently, the antioxidant activity of the three N. lotus extracts was further studied for their ability to inhibit ROS/RNS production as well as membrane lipid peroxidation in a cellular oxidative stress model, to have an improved understanding of and better reflect the in vivo situation.
In order to avoid any bias resulting from possible toxic or antifungal activities, the absence of any significant effects on the growth and viability of the extracts was evaluated prior to the assessment of their cellular antioxidant action. The absence of a toxic effect was recorded, for the three extract concentrations tested, for the N. lotus extract resulting from UAE followed by DAX-8 MPR purification step (MPR, Figure 6a). On the contrary, a slight toxic effect was observed with N. lotus extracts resulting from both UAE (without DAX-8 MPR purification step, UAE, Figure 6a) and HRE at the highest concentration evaluated (i.e., 50 µg/mL). However, for these extracts, no significant impact on cell viability were observed for the other two concentrations. A concentration of 25 µg/mL was therefore used to evaluate cellular antioxidant activity of each extract.
The production of ROS and RNS in yeast cell subjected to oxidative stress induced by UV treatment was assessed using a dihydrorhodamine 123 (DHR123) probe (Figure 6b). In response to the UV treatment, ROS and RNS production increased in control cells. As for resveratrol (RES, positive control, Figure 6b), the three different N. lotus extracts were able to significantly reduce the production of ROS and RNS in yeast in response to UV treatment. N. lotus extracts from UAE (both resulting from UAE and MPR, Figure 6b) inhibited the production of ROS and RNS as efficiently as resveratrol. A significant gain in the cellular ROS/RNS inhibition capacity was observed for N. lotus extract resulting from UAE followed by DAX-8 MPR purification step (MPR) compared to extract obtained after conventional HRE (Figure 6b). Similar trends were observed in the production of TBARS, as evidenced by a significant reduction in lipid membrane peroxidation in yeast cells under oxidative stress condition in the presence of N. lotus extracts (Figure 6c). The best results were obtained with N. lotus extracts prepared after the UAE coupled with the DAX-8 MPR purification step. Mitochondria physiologically and continuously produced ROS and RNS as by-products of cellular metabolism. The production of ROS and RNS increases with age, stress or pollution as a direct consequence of redox cellular imbalances and could lead to the development of various degenerative diseases [65,66]. Flavonoids as strong natural antioxidants present in food may potentially counteract the negative effects of excessive ROS and RNS cellular production [64,67]. Yeast cells have been proposed as an excellent model for in vivo assessment of antioxidant capacity in relation to cellular oxidative stress [68]. It is an attractive and reliable eukaryotic model whose mechanisms of defense and adaptation to oxidative stress are well known and can be extrapolated to human cells with mechanisms that are more complex but well preserved with this model [69,70]. The present results confirm at a cellular level the trend observed using in vitro cell-free antioxidant assays, thus demonstrating the potential interest of the current extraction method in producing valuable antioxidant extracts from N. lotus stamen. The results also suggest that the antioxidant activity of the N. lotus extract is directly associated with flavonoid content and purity.
The next objective was to decode the molecular mechanism on which the cellular antioxidant activity of N. lotus extracts was based. The expression of two key genes involved in antioxidant defense was therefore monitored by qRT-PCR in yeast cells treated with the three N. lotus extracts (Figure 7).
The results suggested that the cellular antioxidant potential of N. lotus extracts could be the result of activation of gene expression of key antioxidant genes in yeast such as SIR2 (silent information regulator 2) and SOD2 (superoxide dismutase 2) (Figure 7a,b). Treatment with N. lotus extracts significantly increased the expression of SIR2 and SOD2 genes compared to control 24 h after treatment. Higher and faster stimulation of the expression of both gene was observed as soon as 6 h after treatment with N. lotus extract prepared after the UAE coupled with the DAX-8 MPR purification step.
SIR2 encoded for a Nicotinamide Adenine Dinucleotide-dependent protein deacetylase and compelling evidence has linked its activity to oxidative stress response, in particular to ROS-driven mitochondrial-mediated response [66]. SOD2 encodes for a mitochondrial Mn-SOD and plays a key role in the antioxidant response through effective ROS scavenging [71]. SIR2 (aka SIRT1) has been proposed as an inducer of SOD2 gene expression in various models [72,73]. The activation by different plant-derived natural products of both SIR2 and SOD2 gene expression has been associated with the increased antioxidant capacity [20,74,75,76]. The cellular antioxidant activity of the N. lotus extract may be linked to this ability to activate the expression of the key genes involved in the antioxidant response.

4. Conclusions

The stamens of the N. lotus medicinal plant are an alternative potential rich source of flavonoid antioxidants. This research employed current innovative green chemistry techniques, such as UAE, which are widely used for food, cosmetic and pharmaceutical industries together with MPR purification to enhance the antioxidant effect of flavonoids from its stamens. The optimal UAE condition is 90% (v/v) aqEtOH with 34.65 khz ultrasonic frequency and 46 min of extraction duration. Compared with the heat reflux extraction (HRE) conventional method, the significant 1.35-fold increase in total flavonoids content was obtained using optimized UAE conditions, jumping to a 2.80-fold increase when this UAE associated with MPR purification.
The results also indicated that UAE associated with MPR purification provided the best antioxidant potential of N. lotus stamens in both an in vitro (DPPH, ABTS and FRAP) and in cellulo yeast model comparing with the conventional HRE. In addition, the strongest cellular antioxidant activity (decreases of both ROS and RNS production as well as membrane lipid peroxidation (TBARS)) were observed in the extracts using UAE coupled with MPR purification. Furthermore, the best results of key antioxidant genes expression in eukaryotic yeast cell were detected using this innovative method. Indeed, the expression of key antioxidant genes such as SIR2 and SOD2 were also expressed at the highest level in yeast cell treated with the extract from UAE together with MPR purification.
According to these results, it is clearly seen that UAE associated with MPR purification step can enrich the antioxidant flavonoids potential of N. lotus stamens. This current discovery sheds new light on the applications of flavonoids from this medicinal plant in medical and pharmaceutical aspects for human health and well-being benefits. These results suggested that this innovative extract with high antioxidant capacity might be applied as effective antioxidants in the food industry. For the futures perspectives of N. lotus extract application, the enrichment in antioxidant flavonoids from this current research can be employed to test the potential of this stamen extract such as anticancer and the other pharmacological activities. Furthermore, this rich-antioxidant flavonoid extract may also be used as an alternative choice of an active ingredient for cosmetic product development.

Supplementary Materials

The following are available online at https://0-www-mdpi-com.brum.beds.ac.uk/2076-3921/9/7/576/s1, Figure S1: Biplot representation of the linear relation between predicted vs. measured TFC in the 27 N. lotus sample extracts; Figure S2: Normalized coefficients representation with the 95% CI for the proposed polynomial model. Table S1: Conductivity and total reducing sugar contents in the different extracts from N. lotus stamen; Table S2: Characteristic and tentative identification of flavonoids from N. lotus stamen extract.

Author Contributions

Conceptualization, D.T. and C.H.; methodology, D.T., S.D., A.K. and C.H.; software, D.T., S.D. and C.H.; validation, D.T. and C.H.; formal analysis, D.T. and C.H.; investigation, D.T., S.D., A.K. and C.H.; resources, D.T. and C.H.; data curation, D.T. and C.H.; writing—original draft preparation, D.T. and C.H.; writing—review and editing, D.T., S.D., A.K. and C.H.; visualization, D.T., S.D. and C.H.; supervision, D.T. and C.H.; project administration, D.T. and C.H.; funding acquisition, D.T. and C.H. All authors have read and agreed to the published version of the manuscript.

Funding

This research was funded by Mahidol University. This research was supported by Cosmetosciences, a global training and research program dedicated to the cosmetic industry. Located in the heart of the Cosmetic Valley, this program led by University of Orléans is funded by the Région Centre-Val de Loire.

Acknowledgments

This research project is supported by Mahidol University. D.T. gratefully acknowledges the financial support from Mahidol University. D.T. and C.H. gratefully acknowledges the support of the French government via the French Embassy in Thailand in the form of Junior Research Fellowship Program 2018. C.H. and D.T. gratefully acknowledges the support of Campus France through the PHC SIAM (PNPIA, Project 44926WK). S.D. acknowledges research fellowship of Loire Valley Region.

Conflicts of Interest

The authors declare no conflict of interest. The funders had no role in the design of the study; in the collection, analyses or interpretation of data; in the writing of the manuscript, or in the decision to publish the results.

References

  1. Mohamed, Z.A.; Serag, M.S. Ecology and anatomy of Nymphaea Lotus L. in the Nile delta. J. Environ. Sci. 2003, 26, 1–20. [Google Scholar]
  2. Kandeler, R.; Ullrich, W.R. Symbolism of plants: Examples from European-Mediterranean culture presented with biology and history of art: JULY: Lotus. J. Exp. Bot. 2009, 60, 2461–2464. [Google Scholar] [CrossRef] [PubMed]
  3. Lim, T.K. Nymphaea lotus. In Edible Medicinal and Non Medicinal Plants; Springer: Berlin/Heidelberg, Germany, 2014; pp. 514–518. [Google Scholar]
  4. Yin, D.-D.; Yuan, R.-Y.; Wu, Q.; Li, S.-S.; Shao, S.; Xu, Y.-J.; Hao, X.-H.; Wang, L.-S. Assessment of flavonoids and volatile compounds in tea infusions of water lily flowers and their antioxidant activities. Food Chem. 2015, 187, 20–28. [Google Scholar] [CrossRef] [PubMed]
  5. Bello, F.H.; Maiha, B.B.; Anuka, J.A. The effect of methanol rhizome extract of Nymphaea lotus Linn.(Nymphaeaceae) in animal models of diarrhoea. J. Ethnopharmacol. 2016, 190, 13–21. [Google Scholar] [CrossRef] [PubMed]
  6. Irvine, F.R.; Trickett, R.S. Waterlilies as food. Kew Bull. 1953, 8, 363–370. [Google Scholar] [CrossRef]
  7. Ziada, M.E.A.; Mashaly, I.A.; El-Monem, M.A.; Torky, M. Economic potentialities of some aquatic plants growing in north east Nile delta, Egypt. J. Appl. Sci. 2008, 8, 1395–1405. [Google Scholar]
  8. Löhne, C.; Yoo, M.-J.; Borsch, T.; Wiersema, J.; Wilde, V.; Bell, C.D.; Barthlott, W.; Soltis, D.E.; Soltis, P.S. Biogeography of Nymphaeales: Extant patterns and historical events. Taxon 2008, 57, 1123-19E. [Google Scholar] [CrossRef]
  9. Paul, S.; Barbaruah, A.D. Studies of some important wetland plants with their growth form and uses from Monoha beel of Morigaon, Assam. Clar. Int. Multidiscip. J. 2013, 2, 37–40. [Google Scholar]
  10. Poumeni, M.K.; Bilanda, D.C.; Djomeni, P.D.D.; Ngadena, Y.S.M.; Mballa, M.F.; Ngoungoure, M.C.; Ouafo, A.C.; Dimo, T.; Kamtchouing, P. Safety assessment of the aqueous extract of the flowers of Nymphaea lotus Linn (Nymphaeaceae): Acute, neuro-and subchronic oral toxicity studies in albinos Wistar rats. J. Complement. Integr. Med. 2017, 14, 14. [Google Scholar] [CrossRef]
  11. Fajemiroye, J.O.; Adam, K.; Zjawiony Jordan, K.; Alves, C.E.; Aderoju, A.A. Evaluation of anxiolytic and antidepressant-like activity of aqueous leaf extract of Nymphaea lotus Linn. in mice. Iran. J. Pharm. Res. IJPR 2018, 17, 613. [Google Scholar]
  12. Oyeyemi, I.T.; Akanni, O.O.; Adaramoye, O.A.; Bakare, A.A. Methanol extract of Nymphaea lotus ameliorates carbon tetrachloride-induced chronic liver injury in rats via inhibition of oxidative stress. J. Basic Clin. Physiol. Pharmacol. 2017, 28, 43–50. [Google Scholar] [CrossRef] [PubMed]
  13. Saleem, A.; Ahotupa, M.; Pihlaja, K. Total phenolics concentration and antioxidant potential of extracts of medicinal plants of Pakistan. Z. für Naturforsch. C 2001, 56, 973–978. [Google Scholar] [CrossRef] [PubMed]
  14. Zhu, M.; Zheng, X.; Shu, Q.; Li, H.; Zhong, P.; Zhang, H.; Xu, Y.; Wang, L.; Wang, L. Relationship between the composition of flavonoids and flower colors variation in tropical water lily (Nymphaea) cultivars. PLoS ONE 2012, 7, e34335. [Google Scholar] [CrossRef] [PubMed] [Green Version]
  15. Elegami, A.A.; Bates, C.; Gray, A.I.; Mackay, S.P.; Skellern, G.G.; Waigh, R.D. Two very unusual macrocyclic flavonoids from the water lily Nymphaea lotus. Phytochemistry 2003, 63, 727–731. [Google Scholar] [CrossRef]
  16. Fliniaux, O.; Corbin, C.; Ramsay, A.; Renouard, S.; Beejmohun, V.; Doussot, J.; Falguières, A.; Ferroud, C.; Lamblin, F.; Lainé, E.; et al. Microwave-Assisted Extraction of Herbacetin Diglucoside from Flax (Linum usitatissimum L.) Seed Cakes and Its Quantification using an RP-HPLC-UV System. Molecules 2014, 19, 3025–3037. [Google Scholar] [CrossRef] [Green Version]
  17. Renouard, S.; Hano, C.; Corbin, C.; Fliniaux, O.; Lopez, T.; Montguillon, J.; Barakzoy, E.; Mesnard, F.; Lamblin, F.; Lainé, E. Cellulase-assisted release of secoisolariciresinol from extracts of flax (Linum usitatissimum) hulls and whole seeds. Food Chem. 2010, 122, 679–687. [Google Scholar] [CrossRef]
  18. Corbin, C.; Fidel, T.; Leclerc, E.A.; Barakzoy, E.; Sagot, N.; Falguiéres, A.; Renouard, S.; Blondeau, J.; Ferroud, C.; Doussot, J.; et al. Development and validation of an efficient ultrasound assisted extraction of phenolic compounds from flax (Linum usitatissimum L.) seeds. Ultrason. Sonochem. 2015, 26, 176–185. [Google Scholar] [CrossRef]
  19. Bourgeois, C.; Leclerc, É.A.; Corbin, C.; Doussot, J.; Serrano, V.; Vanier, J.-R.; Seigneuret, J.-M.; Auguin, D.; Pichon, C.; Lainé, É.; et al. Nettle (Urtica dioica L.) as a source of antioxidant and anti-aging phytochemicals for cosmetic applications, L’ortie (Urtica dioica L.), une source de produits antioxidants et phytochimiques anti-âge pour des applications en cosmétique. Comptes Rendus Chim. 2016, 19. [Google Scholar] [CrossRef]
  20. Tungmunnithum, D.; Abid, M.; Elamrani, A.; Drouet, S.; Addi, M.; Hano, C. Almond Skin Extracts and Chlorogenic Acid Delay Chronological Aging and Enhanced Oxidative Stress Response in Yeast. Life 2020, 10, 80. [Google Scholar] [CrossRef]
  21. Tungmunnithum, D.; Garros, L.; Drouet, S.; Renouard, S.; Lainé, E.; Hano, C. Green Ultrasound Assisted Extraction of trans Rosmarinic Acid from Plectranthus scutellarioides (L.) R.Br. Leaves. Plants 2019, 8, 50. [Google Scholar] [CrossRef] [Green Version]
  22. Drouet, S.; Leclerc, E.A.; Garros, L.; Tungmunnithum, D.; Kabra, A.; Abbasi, B.H.; Lain, É.; Hano, C. A Green Ultrasound-Assisted Extraction Optimization of the Natural Antioxidant and Anti-Aging Flavonolignans from Milk Thistle Silybum marianum (L.) Gaertn. Fruits for Cosmetic Applications. Antioxidants 2019, 8, 1–19. [Google Scholar] [CrossRef] [PubMed] [Green Version]
  23. Lavilla, I.; Bendicho, C. Fundamentals of Ultrasound-Assisted Extraction. In Water Extraction of Bioactive Compounds; Elsevier: Amsterdam, The Netherlands, 2017; pp. 291–316. [Google Scholar] [CrossRef]
  24. Medina-Torres, N.; Ayora-Talavera, T.; Espinosa-Andrews, H.; Sánchez-Contreras, A.; Pacheco, N. Ultrasound Assisted Extraction for the Recovery of Phenolic Compounds from Vegetable Sources. Agronomy 2017, 7, 47. [Google Scholar] [CrossRef]
  25. Tungmunnithum, D.; Elamrani, A.; Abid, M.; Drouet, S.; Kiani, R.; Garros, L.; Kabra, A.; Addi, M.; Hano, C. A Quick, Green and Simple Ultrasound-Assisted Extraction for the Valorization of Antioxidant Phenolic Acids from Moroccan Almond (Prunus dulcis (Mill.) DA Webb) Cold-Pressed Oil Residues. Appl. Sci. 2020, 3313. [Google Scholar] [CrossRef]
  26. Savic Gajic, I.; Savic, I.; Boskov, I.; Žerajić, S.; Markovic, I.; Gajic, D. Optimization of Ultrasound-Assisted Extraction of Phenolic Compounds from Black Locust (Robiniae Pseudoacaciae) Flowers and Comparison with Conventional Methods. Antioxidants 2019, 8, 248. [Google Scholar] [CrossRef] [PubMed] [Green Version]
  27. Savic, I.M.; Savic Gajic, I.M. Optimization of ultrasound-assisted extraction of polyphenols from wheatgrass (Triticum aestivum L.). J. Food Sci. Technol. 2020. [Google Scholar] [CrossRef]
  28. Zerajić, S.A.; Savić-Gajić, I.M.; Savić, I.M.; Nikolić, G.S. The optimization of ultrasound-assisted extraction of total flavonoids from pot marigold (Calendulae officinalis L.) flowers. Adv. Technol. 2019, 8, 10–18. [Google Scholar] [CrossRef] [Green Version]
  29. Chen, W.-L.; Wang, G.-S.; Gwo, J.-C.; Chen, C.-Y. Ultra-high performance liquid chromatography/tandem mass spectrometry determination of feminizing chemicals in river water, sediment and tissue pretreated using disk-type solid-phase extraction and matrix solid-phase dispersion. Talanta 2012, 89, 237–245. [Google Scholar] [CrossRef]
  30. Deng, S.; Deng, Z.; Fan, Y.; Peng, Y.; Li, J.; Xiong, D.; Liu, R. Isolation and purification of three flavonoid glycosides from the leaves of Nelumbo nucifera (Lotus) by high-speed counter-current chromatography. J. Chromatogr. B 2009, 877, 2487–2492. [Google Scholar] [CrossRef]
  31. Zhu, M.-Z.; Wu, W.; Jiao, L.-L.; Yang, P.-F.; Guo, M.-Q. Analysis of flavonoids in lotus (Nelumbo nucifera) leaves and their antioxidant activity using macroporous resin chromatography coupled with LC-MS/MS and antioxidant biochemical assays. Molecules 2015, 20, 10553–10565. [Google Scholar] [CrossRef] [Green Version]
  32. Du, H.; Wang, H.; Yu, J.; Liang, C.; Ye, W.; Li, P. Enrichment and purification of total flavonoid C-glycosides from Abrus mollis extracts with macroporous resins. Ind. Eng. Chem. Res. 2012, 51, 7349–7354. [Google Scholar] [CrossRef]
  33. Li, X.; Bonawitz, N.D.; Weng, J.; Chapple, C. The Growth Reduction Associated with Repressed Lignin Biosynthesis in Arabidopsis thaliana Is Independent of Flavonoids. Plant Cell 2010, 22, 1620–1632. [Google Scholar] [CrossRef] [Green Version]
  34. Thiers, B.; Thiers, B.H.; Cokic, B.B.B. Index Herbariorum: A Global Directory of Public Herbaria and Associated Staff. New York Botanical Garden’s Virtual Herbarium. 2009. Available online: http://sweetgum.nybg.org/ih (accessed on 1 May 2020).
  35. Organization W.H. Quality Control Methods for Medicinal Plant Materials; World Health Organization: Geneva, Switzerland, 1998; ISBN 9241545100. [Google Scholar]
  36. Usman, H.; Ullah, M.A.; Jan, H.; Siddiquah, A.; Drouet, S.; Anjum, S.; Giglioli-Guviarc’h, N.; Hano, C.; Abbasi, B.H. Interactive Effects of Wide-Spectrum Monochromatic Lights on Phytochemical Production, Antioxidant and Biological Activities of Solanum xanthocarpum Callus Cultures. Molecules 2020, 25, 2201. [Google Scholar] [CrossRef] [PubMed]
  37. Drouet, S.; Abbasi, B.H.; Falguières, A.; Ahmad, W.; Sumaira; Ferroud, C.; Doussot, J.; Vanier, J.R.; Lainé, E.; Hano, C. Single Laboratory Validation of a Quantitative Core Shell-Based LC Separation for the Evaluation of Silymarin Variability and Associated Antioxidant Activity of Pakistani Ecotypes of Milk Thistle (Silybum Marianum L.). Molecules 2018, 23, 904. [Google Scholar] [CrossRef] [Green Version]
  38. Hano, C.; Addi, M.; Fliniaux, O.; Bensaddek, L.; Duverger, E.; Mesnard, F.; Lamblin, F.; Lainé, E. Molecular characterization of cell death induced by a compatible interaction between Fusarium oxysporum f. sp. linii and flax (Linum usitatissimum) cells. Plant Physiol. Biochem. 2008, 46, 590–600. [Google Scholar] [CrossRef] [PubMed]
  39. Renouard, S.; Hano, C.; Ouagne, P.; Blondeau, J.-P.; Lainé, E. Protection of flax fiber-based yarns against natural soil degradation by chitosan. Mater. Lett. 2014, 137. [Google Scholar] [CrossRef]
  40. Shah, M.; Ullah, M.A.; Drouet, S.; Younas, M.; Tungmunnithum, D.; Giglioli-Guivarc’h, N.; Hano, C.; Abbasi, B.H. Interactive effects of light and melatonin on biosynthesis of silymarin and anti-inflammatory potential in callus cultures of Silybum marianum (L.) gaertn. Molecules 2019, 24, 1207. [Google Scholar] [CrossRef] [Green Version]
  41. Ullah, M.A.; Tungmunnithum, D.; Garros, L.; Drouet, S.; Hano, C.; Abbasi, B.H. Effect of Ultraviolet-C Radiation and Melatonin Stress on Biosynthesis of Antioxidant and Antidiabetic Metabolites Produced in In Vitro Callus Cultures of Lepidium sativum L. Int. J. Mol. Sci. 2019, 20, 1787. [Google Scholar] [CrossRef] [Green Version]
  42. Abbasi, B.H.; Siddiquah, A.; Tungmunnithum, D.; Bose, S.; Younas, M.; Garros, L.; Drouet, S.; Giglioli-Guivarc’h, N.; Hano, C. Isodon rugosus (Wall. ex Benth.) codd in vitro cultures: Establishment, phytochemical characterization and in vitro antioxidant and anti-aging activities. Int. J. Mol. Sci. 2019, 20, 452. [Google Scholar] [CrossRef] [Green Version]
  43. Nazir, M.; Tungmunnithum, D.; Bose, S.; Drouet, S.; Garros, L.; Giglioli-Guivarc’h, N.; Abbasi, B.H.; Hano, C. Differential Production of Phenylpropanoid Metabolites in Callus Cultures of Ocimum basilicum L. With Distinct in Vitro Antioxidant Activities and in Vivo Protective Effects against UV stress. J. Agric. Food Chem. 2019, 67, 1847–1859. [Google Scholar] [CrossRef]
  44. Rakić, T.; Kasagić-Vujanović, I.; Jovanović, M.; Jančić-Stojanović, B.; Ivanović, D. Comparison of Full Factorial Design, Central Composite Design, and Box-Behnken Design in Chromatographic Method Development for the Determination of Fluconazole and Its Impurities. Anal. Lett. 2014, 47, 1334–1347. [Google Scholar] [CrossRef]
  45. Chemat, F.; Abert-Vian, M.; Fabiano-Tixier, A.S.; Strube, J.; Uhlenbrock, L.; Gunjevic, V.; Cravotto, G. Green extraction of natural products. Origins, current status, and future challenges. Trends Anal. Chem. 2019, 118, 248–263. [Google Scholar] [CrossRef]
  46. Renouard, S.; Lopez, T.; Hendrawati, O.; Dupre, P.; Doussot, J.; Falguieres, A.; Ferroud, C.; Hagege, D.; Lamblin, F.; Laine, E.; et al. Podophyllotoxin and deoxypodophyllotoxin in juniperus bermudiana and 12 other juniperus species: Optimization of extraction, method validation, and quantification. J. Agric. Food Chem. 2011, 59. [Google Scholar] [CrossRef] [PubMed]
  47. Renouard, S.; Corbin, C.; Colas, C.; Fidel, T.; Lopez, T.; Leclerc, E.A.; Hendrawati, O.; Falguières, A.; Doussot, J.; Ferroud, C.; et al. Aerial parts of Callitris species as a rich source of deoxypodophyllotoxin. Ind. Crops Prod. 2015, 63, 53–57. [Google Scholar] [CrossRef]
  48. Gad, S.E.; Sullivan, D.W., Jr. Generally Recognized As Safe (GRAS); Elsevier: Amsterdam, The Netherlands, 2014. [Google Scholar]
  49. Muhlemann, J.K.; Younts, T.L.B.; Muday, G.K. Flavonols control pollen tube growth and integrity by regulating ROS homeostasis during high-temperature stress. Proc. Natl. Acad. Sci. USA 2018, 115, E11188–E11197. [Google Scholar] [CrossRef] [Green Version]
  50. Komosinska-Vassev, K.; Olczyk, P.; Kaźmierczak, J.; Mencner, L.; Olczyk, K. Bee pollen: Chemical composition and therapeutic application. Evid. Based Complement. Altern. Med. 2015, 2015, 1–6. [Google Scholar] [CrossRef] [Green Version]
  51. Hostettmann, K.; Hostettmann, M. Isolation techniques for flavonoids. In The Flavonoids; Springer: Berlin/Heidelberg, Germany, 1982; pp. 1–18. [Google Scholar]
  52. Ameer, K.; Shahbaz, H.M.; Kwon, J.H. Green Extraction Methods for Polyphenols from Plant Matrices and Their Byproducts: A Review. Compr. Rev. Food Sci. Food Saf. 2017, 16, 295–315. [Google Scholar] [CrossRef] [Green Version]
  53. Ferreira, S.L.C.; Silva Junior, M.M.; Felix, C.S.A.; da Silva, D.L.F.; Santos, A.S.; Santos Neto, J.H.; de Souza, C.T.; Cruz Junior, R.A.; Souza, A.S. Multivariate optimization techniques in food analysis–A review. Food Chem. 2019, 273, 3–8. [Google Scholar] [CrossRef]
  54. Tomás-Barberán, F.A.; Blázquez, M.A.; Garcia-Viguera, C.; Ferreres, F.; Tomás-Lorente, F. A comparative study of different Amberlite XAD resins in flavonoid analysis. Phytochem. Anal. 1992, 3, 178–181. [Google Scholar] [CrossRef]
  55. Dong, Y.; Zhao, M.; Sun-Waterhouse, D.; Zhuang, M.; Chen, H.; Feng, M.; Lin, L. Absorption and desorption behaviour of the flavonoids from Glycyrrhiza glabra L. leaf on macroporous adsorption resins. Food Chem. 2015, 168, 538–545. [Google Scholar] [CrossRef]
  56. Gao, N.; Wang, Y.; Jiao, X.; Chou, S.; Li, E.; Li, B. Preparative purification of polyphenols from Aronia melanocarpa (Chokeberry) with cellular antioxidant and antiproliferative activity. Molecules 2018, 23, 139. [Google Scholar] [CrossRef] [Green Version]
  57. Wu, Z.; Wang, W.; He, F.; Li, D.; Wang, D. Simultaneous Enrichment and Separation of Four Flavonoids from Zanthoxylum bungeanum Leaves by Ultrasound-Assisted Extraction and Macroporous Resins with Evaluation of Antioxidant Activities. J. Food Sci. 2018, 83, 2109–2118. [Google Scholar] [CrossRef] [PubMed]
  58. Heinonen, J.; Farahmandazad, H.; Vuorinen, A.; Kallio, H.; Yang, B.; Sainio, T. Extraction and purification of anthocyanins from purple-fleshed potato. Food Bioprod. Process. 2016, 99, 136–146. [Google Scholar] [CrossRef]
  59. Jampani, C.; Naik, A.; Raghavarao, K. Purification of anthocyanins from jamun (Syzygium cumini L.) employing adsorption. Sep. Purif. Technol. 2014, 125, 170–178. [Google Scholar] [CrossRef]
  60. Che Zain, M.S.; Lee, S.Y.; Teo, C.Y.; Shaari, K. Adsorption and Desorption Properties of Total Flavonoids from Oil Palm (Elaeis guineensis Jacq.) Mature Leaf on Macroporous Adsorption Resins. Molecules 2020, 25, 778. [Google Scholar] [CrossRef] [Green Version]
  61. Prior, R.L.; Wu, X.; Schaich, K. Standardized Methods for the Determination of Antioxidant Capacity and Phenolics in Foods and Dietary Supplements. J. Agric. Food Chem. 2005, 53, 4290–4302. [Google Scholar] [CrossRef]
  62. Hano, C.; Corbin, C.; Drouet, S.; Quéro, A.; Rombaut, N.; Savoire, R.; Molinié, R.; Thomasset, B.; Mesnard, F.; Lainé, E. The lignan (+)-secoisolariciresinol extracted from flax hulls is an effective protectant of linseed oil and its emulsion against oxidative damage. Eur. J. Lipid Sci. Technol. 2017, 119. [Google Scholar] [CrossRef]
  63. Drouet, S.; Doussot, J.; Garros, L.; Mathiron, D.; Bassard, S.; Favre-Réguillon, A.; Molinié, R.; Lainé, É.; Hano, C. Selective Synthesis of 3-O-Palmitoyl-Silybin, a New-to-Nature Flavonolignan with Increased Protective Action against Oxidative Damages in Lipophilic Media. Molecules 2018, 23, 2594. [Google Scholar] [CrossRef] [Green Version]
  64. Rice-Evans, C.A.; Miller, N.J.; Paganga, G.; Catherine, A.R.-E.; Nicholas, J.M.; George, P. Structure-antioxidant activity relationships of flavonoids and phenolic acids. Free Radic. Biol. Med. 1996, 20, 933–956. [Google Scholar] [CrossRef]
  65. Lacza, Z.; Pankotai, E.; Csordás, A.; Gero, D.; Kiss, L.; Horváth, E.M.; Kollai, M.; Busija, D.W.; Szabó, C. Mitochondrial NO and reactive nitrogen species production: Does mtNOS exist? Nitric Oxide 2006, 14, 162–168. [Google Scholar] [CrossRef]
  66. Merksamer, P.I.; Liu, Y.; He, W.; Hirschey, M.D.; Chen, D.; Verdin, E. The sirtuins, oxidative stress and aging: An emerging link. Aging 2013, 5, 144. [Google Scholar] [CrossRef] [Green Version]
  67. Hano, C.; Tungmunnithum, D. Plant Polyphenols, More than Just Simple Natural Antioxidants: Oxidative Stress, Aging and Age-Related Diseases. Medicines 2020, 7, 26. [Google Scholar] [CrossRef]
  68. Steels, E.L.; Learmonth, R.P.; Watson, K. Stress tolerance and membrane lipid unsaturation in Saccharomyces cerevisiae grown aerobically or anaerobically. Microbiology 1994, 140 Pt 3, 569–576. [Google Scholar] [CrossRef] [Green Version]
  69. Wolak, N.; Kowalska, E.; Kozik, A.; Rapala-Kozik, M. Thiamine increases the resistance of baker’s yeast Saccharomyces cerevisiae against oxidative, osmotic and thermal stress, through mechanisms partly independent of thiamine diphosphate-bound enzymes. FEMS Yeast Res. 2014, 14, 1249–1262. [Google Scholar] [CrossRef] [Green Version]
  70. Bisquert, R.; Muñiz-Calvo, S.; Guillamón, J.M. Protective role of intracellular Melatonin against oxidative stress and UV radiation in Saccharomyces cerevisiae. Front. Microbiol. 2018, 9, 1–11. [Google Scholar] [CrossRef] [Green Version]
  71. Semchyshyn, H.M.; Lozinska, L.M. Fructose protects baker’s yeast against peroxide stress: Potential role of catalase and superoxide dismutase. FEMS Yeast Res. 2012, 12, 761–773. [Google Scholar] [CrossRef] [PubMed] [Green Version]
  72. Tanno, M.; Kuno, A.; Yano, T.; Miura, T.; Hisahara, S.; Ishikawa, S.; Shimamoto, K.; Horio, Y. Induction of manganese superoxide dismutase by nuclear translocation and activation of SIRT1 promotes cell survival in chronic heart failure. J. Biol. Chem. 2010, 285, 8375–8382. [Google Scholar] [CrossRef] [Green Version]
  73. Daitoku, H.; Hatta, M.; Matsuzaki, H.; Aratani, S.; Ohshima, T.; Miyagishi, M.; Nakajima, T.; Fukamizu, A. Silent information regulator 2 potentiates Foxo1-mediated transcription through its deacetylase activity. Proc. Natl. Acad. Sci. USA 2004, 101, 10042–10047. [Google Scholar] [CrossRef] [Green Version]
  74. Xiang, L.; Sun, K.; Lu, J.; Weng, Y.; Taoka, A.; Sakagami, Y.; Qi, J. Anti-aging effects of phloridzin, an apple polyphenol, on yeast via the SOD and Sir2 genes. Biosci. Biotechnol. Biochem. 2011, 75, 854–858. [Google Scholar] [CrossRef] [Green Version]
  75. Sun, K.; Xiang, L.; Ishihara, S.; Matsuura, A.; Sakagami, Y.; Qi, J. Anti-aging effects of hesperidin on Saccharomyces cerevisiae via inhibition of reactive oxygen species and UTH1 gene expression. Biosci. Biotechnol. Biochem. 2012, 76, 640–645. [Google Scholar] [CrossRef] [Green Version]
  76. Sun, K.; Cao, S.; Pei, L.; Matsuura, A.; Xiang, L.; Qi, J. A steroidal saponin from Ophiopogon japonicus extends the lifespan of yeast via the pathway involved in SOD and UTH1. Int. J. Mol. Sci. 2013, 14, 4461–4475. [Google Scholar] [CrossRef] [PubMed] [Green Version]
Figure 1. Pictures of Nymphaea lotus plants used in the present study. (a) N. lotus in its natural habitat in Nakhon Sawan province, Northern Floristic Regions of Thailand; (b) N. lotus petals (Bar scale = 1 cm); (c) N. lotus stamens (Bar scale = 1 cm). Pictures by Duangjai Tungmunnithum.
Antioxidants 09 00576 g001
Figure 2. Three-dimensional (3D) surface response and two-dimensional (2D) contour plots, respectively, from the model predicted TFC (in mg/g DW) extracted from mature N. lotus stamens as a function of aqEtOH concentration and US frequency. (a,b), aqEtOH concentration and extraction duration (c,d) and US frequency and extraction duration (e,f).
Antioxidants 09 00576 g002
Figure 3. Static adsorption and desorption capacities of the five tested microporous resins for flavonoids from N. lotus stamens. (a); Kinetics for static adsorption and desorption on DAX-8 resins for flavonoids from N. lotus stamens (b); Effect of ethanol concentration on desorption ratio on DAX-8 resins for flavonoids from N. lotus stamens (c); Effect of pH on desorption ratio on DAX-8 resins for flavonoids from N. lotus stamens (d); Effect of temperature on desorption ratio on DAX-8 resins for flavonoids from N. lotus stamens (e).
Antioxidants 09 00576 g003
Figure 4. Comparison of TFC extracted from N. lotus stamens using traditional HRE and presently optimized UAE alone (MPR−) or coupled with the optimized DAX-8 macroporous resin purification step (MPR+). Values are means ± SD of three independent experiments. *** significant p < 0.001.
Antioxidants 09 00576 g004
Figure 5. Representative LC chromatogram of extract from N. lotus stamens prepared by UAE followed by MPR purification step recorded at 350 nm.
Antioxidants 09 00576 g005
Figure 6. Effects of the different extracts from N. lotus stamen on yeast cell viability estimated at different extract concentrations (10, 25 or 50 µg/mL) (a), ROS/RNS production in response to UV-induced oxidative stress (b) and TBARS production in response to UV-induced oxidative stress (c). CTL-nonOX are control yeast cells; CTL-OX are control yeast cells subjected to UV-induced oxidative stress; RES are yeast cells subjected to UV-induced oxidative stress in presence of resveratrol (positive antioxidant control, 10 µM); HRE25 are yeast cells subjected to UV-induced oxidative stress in presence of 25 µg/mL of N. lotus extract obtained by HRE; UAE are yeast cells subjected to UV-induced oxidative stress in presence of 25 µg/mL of N. lotus extract obtained by UAE; MPR are yeast cells subjected to UV-induced oxidative stress in presence of 25 µg/mL of N. lotus extract obtained by UAE followed by DAX-8 MPR purification step. Values are means ± SD of three independent experiments. Different letters represent significant differences between the various extraction conditions (p < 0.05).
Antioxidants 09 00576 g006
Figure 7. Effects of the different extracts from N. lotus stamen on SIR2 (a) and SOD2 (b) gene expression determined by RT-qPCR. Expression was normalized with TUB1 gene. CTL are control (untreated, DMSO addition) yeast cells; HRE25 are yeast cells subjected to UV-induced oxidative stress in presence of 25 µg/mL of N. lotus extract obtained by HRE; UAE are yeast cells subjected to UV-induced oxidative stress in presence of 25 µg/mL of N. lotus extract obtained by UAE; MPR are yeast cells subjected to UV-induced oxidative stress in presence of 25 µg/mL of N. lotus extract obtained by UAE followed by DAX-8 MPR purification step. Values are means ± SD of three independent experiments. Different letters represent significant differences between the various extraction conditions (p < 0.05).
Antioxidants 09 00576 g007
Table 1. Identity, code unit, coded levels and actual experimental values of each variable used for UAE of TFC from N. lotus stamens.
VariableCode UnitCoded Variable Levels
−10+1
Ethanol concentration (% v/v) 1X15075100
US frequency (kHz)X2022.545
Extraction duration (min)X3204060
1 Percentage of ethanol (analytical grade) concentration in mixture with ultrapure water (HPLC grade).
Table 2. Characteristics of the MPR used in the present study.
ResinsSurface Area
(m2/g)
Particle Diameter
(µm)
Average Pore Diameter
(Å)
Matrix TypePolarity
XAD-2300560–71090Styrene-divinyl-benzene macroreticulateHydrophobic
XAD-4750250–840100Styrene-divinyl-benzeneHydrophobic
XAD-16800560–710200Styrene-divinyl-benzeneHydrophobic
XAD-7380560–710300–400AcrylicModerately polar
DAX-8140250–420225Acrylic esterModerately polar
Table 3. Results of full factorial design experiments for the UAE of TFC from N. lotus stamens.
Run IDRun OrderX1X2X3Experimental TFC
(mg/g DW)
Predicted TPC
(mg/g DW)
Obs14−1−1−129.68 ± 2.7533.75
Obs2230−1−1132.73 ± 6.96134.83
Obs317+1−1−1142.43 ± 3.71151.11
Obs419−10−167.69 ± 2.7960.99
Obs52400−1175.81 ± 4.95177.81
Obs622+10−1208.71 ± 5.93209.80
Obs716−1+1−147.24 ± 2.0242.86
Obs860+1−1180.17 ± 2.90175.40
Obs914+1+1−1225.21 ± 3.56223.13
Obs1027−1−1047.67 ± 3.3743.61
Obs11110−10158.32 ± 3.64148.30
Obs121+1−10180.84 ± 4.82168.18
Obs138−10058.67 ± 3.7467.08
Obs1420000188.82 ± 2.52187.51
Obs1525+100228.89 ± 5.53223.11
Obs165−1+1031.71 ± 4.0245.19
Obs1720+10176.27 ± 3.51181.34
Obs1810+1+10225.81 ±5.99232.67
Obs197−1−1+139.86 ± 2.8540.03
Obs-20180−1+1144.12 ± 2.72148.33
Obs2112+1−1+1164.30 ± 3.23171.82
Obs2221−10+161.11 ± 1.3059.74
Obs231300+1178.45 ± 8.61183.77
Obs2426+10+1224.66 ± 5.50222.99
Obs259−1+1+143.71 ± 2.7334.08
Obs26150+1+1176.45 ± 7.33173.84
Obs273+1+1+1230.74 ± 5.97228.78
Values are the means ± SD of three independent replicates.
Table 4. Statistical analysis of the regression coefficients of UAE of TFC from N. lotus stamens.
SourceValueSDtP > |t|
Constant187.5073.98447.064<0.0001 ***
X178.0151.84442.301<0.0001 ***
X216.5201.8448.957<0.0001 ***
X32.9841.8441.6180.124
X12−42.4083.194−13.276<0.0001 ***
X22−22.6873.194−7.102<0.0001 ***
X32−6.7173.194−2.1030.051
X1X215.7282.2596.963<0.0001 ***
X1X33.6082.2591.5970.129
X2X3−3.7642.259−1.6660.114
SD standard deviation; *** significant p < 0.001.
Table 5. ANOVA of the predicted model for used for UAE of TFC from N. lotus stamens.
SourceSum of SquaredfMean of SquareF-Valuep-Value
Model132,069.810914,674.423239.686<0.0001 ***
Lack of fit1040.8011761.224--
Residual1036.9801760.999--
Pure Error3.8220---
Cor. Total133,110.61126---
R20.992
R2 adj0.988
CV %0.979
df: degree of freedom; Cor. Total: corrected total; R2: determination coefficient; R2 adj: adjusted R2; CV variation coefficient value; *** significant p < 0.001.
Table 6. Relative quantification of the different flavonoid glucosides in the N. lotus stamen extracts.
Peak NumberTentative IdentificationHREUSAEMPR
1Myr 3-O-Gal21.1 ± 1.328.3 ± 1.176.9 ± 3.8
2Myr 3′-O-Xyl34.4 ± 1.745.7 ± 2.1129.3 ± 6.7
3Que-3-O-Rha62.1 ± 3.186.3 ± 1.4244.2 ± 5.1
4CNar-2″-O-Gal16.4 ± 1.322.9 ± 1.364.7 ± 3.6
5Kae-3-O-Gal54.7 ± 2.373.4 ± 3.2200.2 ± 5.4
6Que-3′-O-Xyl29.1 ± 1.541.2 ± 2.1117.2 ± 2.4
7Iso-7-O-Gal24.8 ± 1.633.6 ± 1.790.4 ± 3.3
8Iso-7-O-Xyl41.4 ± 2.455.4 ± 2.3144.2 ± 5.7
9Iso-3-O-Xyl13.2 ± 1.419.7 ± 1.156.6 ± 1.7
Expressed in absorbance unit per g DW; HRE: N. lotus extract obtained by HRE; USAE: N. lotus extract obtained by USAE; MPR: N. lotus extract obtained by USAE followed by DAX-8 MPR purification step.
Table 7. TFC and in vitro cell-free antioxidant activity of the different extracts from N. lotus stamen.
SampleTFC
(mg/g DW)
DPPH
(µmol TEAC 1/g)
ABTS
(µmol TEAC 1/g)
FRAP
(µmol TEAC 1/g)
HRE169.64 ± 9.86 c2134.37 ± 130.84 c2488.95 ± 344.45 c1270.71 ± 65.53 a
UAE235.45 ± 5.44 b3167.85 ± 342.64 b3218.56 ± 234.90 b2405.25 ± 315.86 b
MPR475.42 ± 16.61 a4749.67 ± 166.05 a4710.67 ± 155.64 a3601.74 ± 126.26 a
BHT-3059.07 ± 401.32 b4378.12 ± 106.62 a1724.12 ± 161.27 b
1 TEAC: Trolox C equivalent antioxidant capacity. HRE: heat reflux extraction; UAE: ultrasound assisted extraction; MPR: UAE following by DAX-8 MPR purification step. Values are means ± SD of three independent experiments. Different letters represent significant differences between the various extraction conditions (p < 0.05).

