Article

Influences of Temperature and Substrate Particle Content on Granular Sludge Bed Anaerobic Digestion

Department of Process, Energy and Environmental Technology, University of South-Eastern Norway, Kjølnes Ring 56, NO 3918 Porsgrunn, Norway
*
Author to whom correspondence should be addressed.
Submission received: 21 November 2019 / Revised: 18 December 2019 / Accepted: 19 December 2019 / Published: 23 December 2019
(This article belongs to the Special Issue Biomass Energy and Biomass as a Clean Renewable Fuel)

Abstract

:
Influences of temperature (25–35 °C) and substrate particulate content (3.0–9.4 g total suspended solids (TSS)/L) on granular sludge bed anaerobic digestion (AD) were analyzed in lab-scale reactors using manure as a substrate and through modeling. Two particle levels were tested using raw (RF) and centrifuged (CF) swine manure slurries, fed into a 1.3-L lab-scale up-flow anaerobic sludge bed reactor (UASB) at temperatures of 25 °C and 35 °C. Biogas production increased with temperature in both high- and low-particle-content substrates; however, the temperature effect was stronger on high-particle-content substrate. RF and CF produced a comparable amount of biogas at 25 °C, suggesting that biogas at this temperature came mainly from the digestion of small particles and soluble components present in similar quantities in both substrates. At 35 °C, RF showed significantly higher biogas production than CF, which was attributed to increased (temperature-dependent) disintegration of larger solid particulates. Anaerobic Digestion Model No.1 (ADM1) based modeling was carried out by separating particulates into fast and slow disintegrating fractions and introducing temperature-dependent disintegration constants. Simulations gave a better fit for the experimental data than the conventional ADM1 model.

1. Introduction

Up-flow anaerobic sludge bed reactors (UASBs) are normally used for the treatment of substrates with a low level of suspended solids such as industrial wastewater. Their attributes, such as low cost, high efficiency, and low footprint, also make them attractive for the treatment of particle-rich substrates such as sludge and manure slurries that are available in large quantities worldwide [1]. Solid accumulation and granular sludge floatation leading to losses of biomass are known challenges in the treatment of wastewater with a high level of suspended solids [2], but high anaerobic digestion (AD) efficiency was also reported for particle-rich substrates [3]. Traditionally, continuous stirred tank reactors (CSTR) are used to treat particle-rich substrates such as manure slurries but, due to drawbacks such as long hydraulic retention time (HRT) and large reactor volume requirement, high-rate AD reactors are becoming more popular. High-rate reactors are characterized by long sludge retention time (SRT), short HRT, and efficient degradation of organic substances. Long SRT is achieved because of microbial aggregation phenomena forming a granular sludge bed that stays in reactors for a relatively long time. The use of high-rate reactors, however, has its own drawbacks with regard to particle-rich substrates. Accumulation of solid particles in the sludge bed is considered a problem [4]. Moreover, the interaction of solid particles with microorganisms in the sludge bed, as well as the extent of the contribution of solid particulates to biogas production, is not clear. Due to these reasons, high-rate reactors are mostly used for the treatment of substrates with low solid content, mostly industrial wastes. Nevertheless, Bergland et al. [3] showed that particle-rich substrates (swine manure slurry) could also be treated using high-rate lab-scale UASB reactors. Solid particulates are thought to undergo disintegration and hydrolysis before the rest of the anaerobic digestion process takes place. Some researchers treat disintegration and hydrolysis as a single step, while others do not. In this paper, we treat them as distinct steps. The rate-limiting step in AD of particle-rich substrates is usually disintegration/hydrolysis. Solid particulates disintegrate relatively slowly and tend to accumulate, making it challenging to adopt high-rate reactors for particle-rich substrates. The aim of this study is to contribute to the development of high-rate reactors for particle-rich substrates. For this, it is important to understand how the suspended solid content influences granular sludge bed AD by identifying disintegration and hydrolysis patterns of particulates and their dependence on temperature.

1.1. Particle Disintegration and Hydrolysis

Disintegration is a physical and biological process where complex composite substrates are progressively broken apart before hydrolysis takes place, whereas hydrolysis is a biological enzyme-mediated process where biopolymers are broken down into their respective monomers. Both steps are extracellular processes [5]. Particulate carbohydrates, proteins, and lipids, as well as inert materials, are produced by disintegration of composite substrates. Microbes release enzymes that hydrolyze these biopolymers into smaller components and, given that polymers can hold particles together, hydrolysis contributes to disintegration, making it difficult to distinguish the two steps. Carbohydrates are hydrolyzed into monosaccharides, proteins into amino acids, and lipids into long-chain fatty acids (LCFA) [6]. Disintegration and hydrolysis are often modeled with first-order kinetics with respect to reactor particle content, as a single step or two, such as in anaerobic digestion model no.1 (ADM1) [5]. However, AD experiments with high inoculum-to-substrate ratio resulted in relatively high hydrolysis rates, indicating that microorganisms play a role in the hydrolysis rate. For simple substrates (i.e., substrates with a high proportion of soluble biodegradable components), first-order kinetics is enough to characterize the hydrolysis process. For complex substrates, the presence of solids and fewer biodegradable components makes bioavailability an important factor in determining the hydrolysis kinetics. Since first-order kinetics does not consider microbial influence, its fitness for complex substrates is questioned. Surface-based kinetics were developed that consider the available surface area of particulates for enzymatic action [7]. Inhibition of hydrolysis may occur in substrates with very high solid content (solid-state AD) likely due to diffusion limitation [8]. In addition, hydrolysis could be inhibited by high concentrations of LCFA, H2, and NH3 (Vavilin et al. [6]). In this article, we intend to demonstrate that first-order disintegration and hydrolysis kinetics can accurately model the anaerobic digestion of complex substrates by classifying complex particulates into fast and slow disintegrating sections. We demonstrated the effectiveness of this approach in batch anaerobic reactors [9].

1.2. Temperature Effect on Particle Hydrolysis

Various authors studied the temperature effect on biogas production. Their findings indicate that there is a positive correlation between temperature and biogas production. Increase in temperature leads to an increase in the maximum substrate utilization rate of microorganisms, as well as the specific growth rate [10]. Anaerobic digestion is generally classified into three categories based on temperature. The categories are psychrophilic (assumed to be <20 °C [11,12]), mesophilic (20–42 °C), and thermophilic (42–60 °C [13] but typically 50–55 °C). Psychrophilic AD is probably the least studied of the three categories. The psychrophilic reaction rates are slow, and the microbial growth is limited. In addition, hydrolysis of suspended solid is near zero, and effective application of low-temperature AD is restricted to very-low-strength wastewater with little or no suspended solids [14]. However, recent studies by Massé et al. [15], Zhu et al. [16], and Rajagopal et al. [17] demonstrated that psychrophilic anaerobic digestion may have a potential for digestion of substrates with higher solid contents. Lettinga et al. [14] showed that expanded granular sludge bed reactor (EGSB) might be feasible for soluble pre-acidified wastewater at temperatures of 5–10 °C. On the other hand, mesophilic AD provides optimum conditions and stable process for biogas production. As a result, large-scale anaerobic digesters often run on operational temperatures in the mesophilic range. Wide ranges of microorganisms thrive in the mesophilic temperature range with the optimum temperature often cited as 35 °C. Microbial diversity, in turn, contributes to the stability and shock tolerance of the anaerobic process. Thermophilic anaerobic digestion has benefits such as higher biogas production and better digestate quality [18]. However, it is less stable than mesophilic AD due to high risk of ammonia or volatile fatty acid (VFA) inhibition. In addition, it is highly sensitive to temperature fluctuations (unlike thermophilic microorganisms, mesophilic microorganisms may tolerate fluctuations of up to ±3 °C). When the removal of pathogens from the digestate is a requirement, thermophilic AD is the best option, as the high operating temperature kills most of the microorganisms present in the digestate. High temperature could also contribute to higher solid disintegration and hydrolysis (solid removal) compared to mesophilic AD [19]. In general, a temperature increase leads to an increase in the hydrolysis rate [20]. If enzyme concentration is not rate-limiting, the hydrolysis rate as a function of temperature is described by the Arrhenius equation as follows:
K h   = K   e Δ E RT ,
where Kh is hydrolysis rate constant, K is the specific rate constant in day−1, Δ E is the activation energy in J∙mol−1, T is the temperature in K, and R is the ideal gas constant in J∙mol−1∙K−1.

1.3. Effect of Temperature Change in Anaerobic Digestion

Temperature has a strong influence on anaerobic digestion. It plays a major role in microbial growth, enzymatic activity, kinetics, and conversion processes and, consequently, in biogas yield and composition. All the steps of anaerobic digestion are directly or indirectly affected by digestion temperature. Temperature variation within anaerobic digesters is typically not recommended due to difficulties associated with adaptation of the microbial community and overall stability of the digestion process. The microbial community comprises various types of bacteria and archaea. They have different optimum temperatures for growth rate and activity. For example, the activity and growth rate of hydrolytic bacteria increase with increasing temperature (well beyond the mesophilic range). This is considered a benefit because hydrolysis is often the rate-limiting step; however, this benefit is negated by a decline in the growth rate and activity of methanogens (archaea) leading to the accumulation of volatile fatty acids (VFAs) and process failure. an increase in temperature could also affect the digestion of specific types of substrates. It was shown that digestion of substrates rich with protein, such as cattle waste, is negatively affected due to increased ammonia inhibition [21]. Free ammonia concentration (NH3) increases due to a shift in NH3/NH4+ equilibrium in its favor as temperature rises. There are indications that temperature change within a given range affects microbial activity and biogas production. The activity and growth rate of microorganisms increase by up to 50% for every 10 °C increase in temperature within the mesophilic range [22]. Change in temperature also affects the physical and chemical properties of produced biogas, as well as other components in the reactor. The solubility of biogas components, especially CH4, in the reactor liquid mixture is an important aspect. Biogas plants that run at low temperature release effluents with a higher content of dissolved CH4 compared to biogas plants that run at high temperature. The dissolved CH4 in the effluent is then released into the atmosphere as a greenhouse gas [23,24], which is a bad outcome from an environmental and economic standpoint. In this article, we investigate the effect of temperature variation on anaerobic digestion of particle-rich and particle-“free” substrates by varying temperature between 25 °C and 35 °C. This enables us to understand how biogas production and reactor stability is affected by temperature variation. In addition, it provides insight into how particulate disintegration and hydrolysis are affected by temperature.

2. Materials and Methods

2.1. Samples

Swine manure slurry was collected from a swine production farm in Porsgrunn, Norway. Two sets of substrate samples were prepared. The first sample was directly taken from a storage pit (called “raw feed or RF”). The second sample was prepared by centrifuging the RF sample and only taking the liquid part (called “centrifuged feed or CF”), thereby reducing the total and suspended solid content. Centrifugation was carried out using a centrifuge (Beckman J-25, with JA-10 rotor) at 10,000 rpm for 15 min and discarding the settled solids. All prepared samples were kept in a refrigerator at 4 °C until they were transferred into the feed container of the reactor.

2.2. Sample Analysis

Influent and effluent samples were regularly analyzed during the course of the experiment. Total solids (TS), total suspended solids (TSS), volatile solids (VS), and volatile suspended solids (VSS) were determined in accordance with the American Public Health Association standard method APHA 2540 [25]. Total and soluble COD (chemical oxygen demand) of influent and effluent samples was analyzed using test kits and a spectrophotometric method in accordance with APHA standard method 5220 D. Feed and effluent pH was measured using a Beckman 300 pH meter equipped with a Sentix-82 pH electrode. Ammonium–nitrogen content (NH4+-N) was measured according to APHA 4500-NH3. Both COD and NH4+-N concentrations were measured using commercially available Merck test kits and a Spectroquant Pharo 300 spectrophotometer (Darmstadt, Germany). Volatile fatty acids (VFA) were analyzed using gas chromatography (Hewlett Packard 6890) with a flame ionization detector and a capillary column (free fatty acid phase (FFAP) 30 m, inner diameter 0.250 mm, film 0.25 µm). The oven was programmed to go from 100 °C, held for one minute, to 180 °C at a rate of 30 °C/min, and then to 230 °C at a rate of 100 °C/min. The carrier gas used was helium at 245 mL/min. The injector and detector temperatures were set to 200 and 250 °C, respectively.

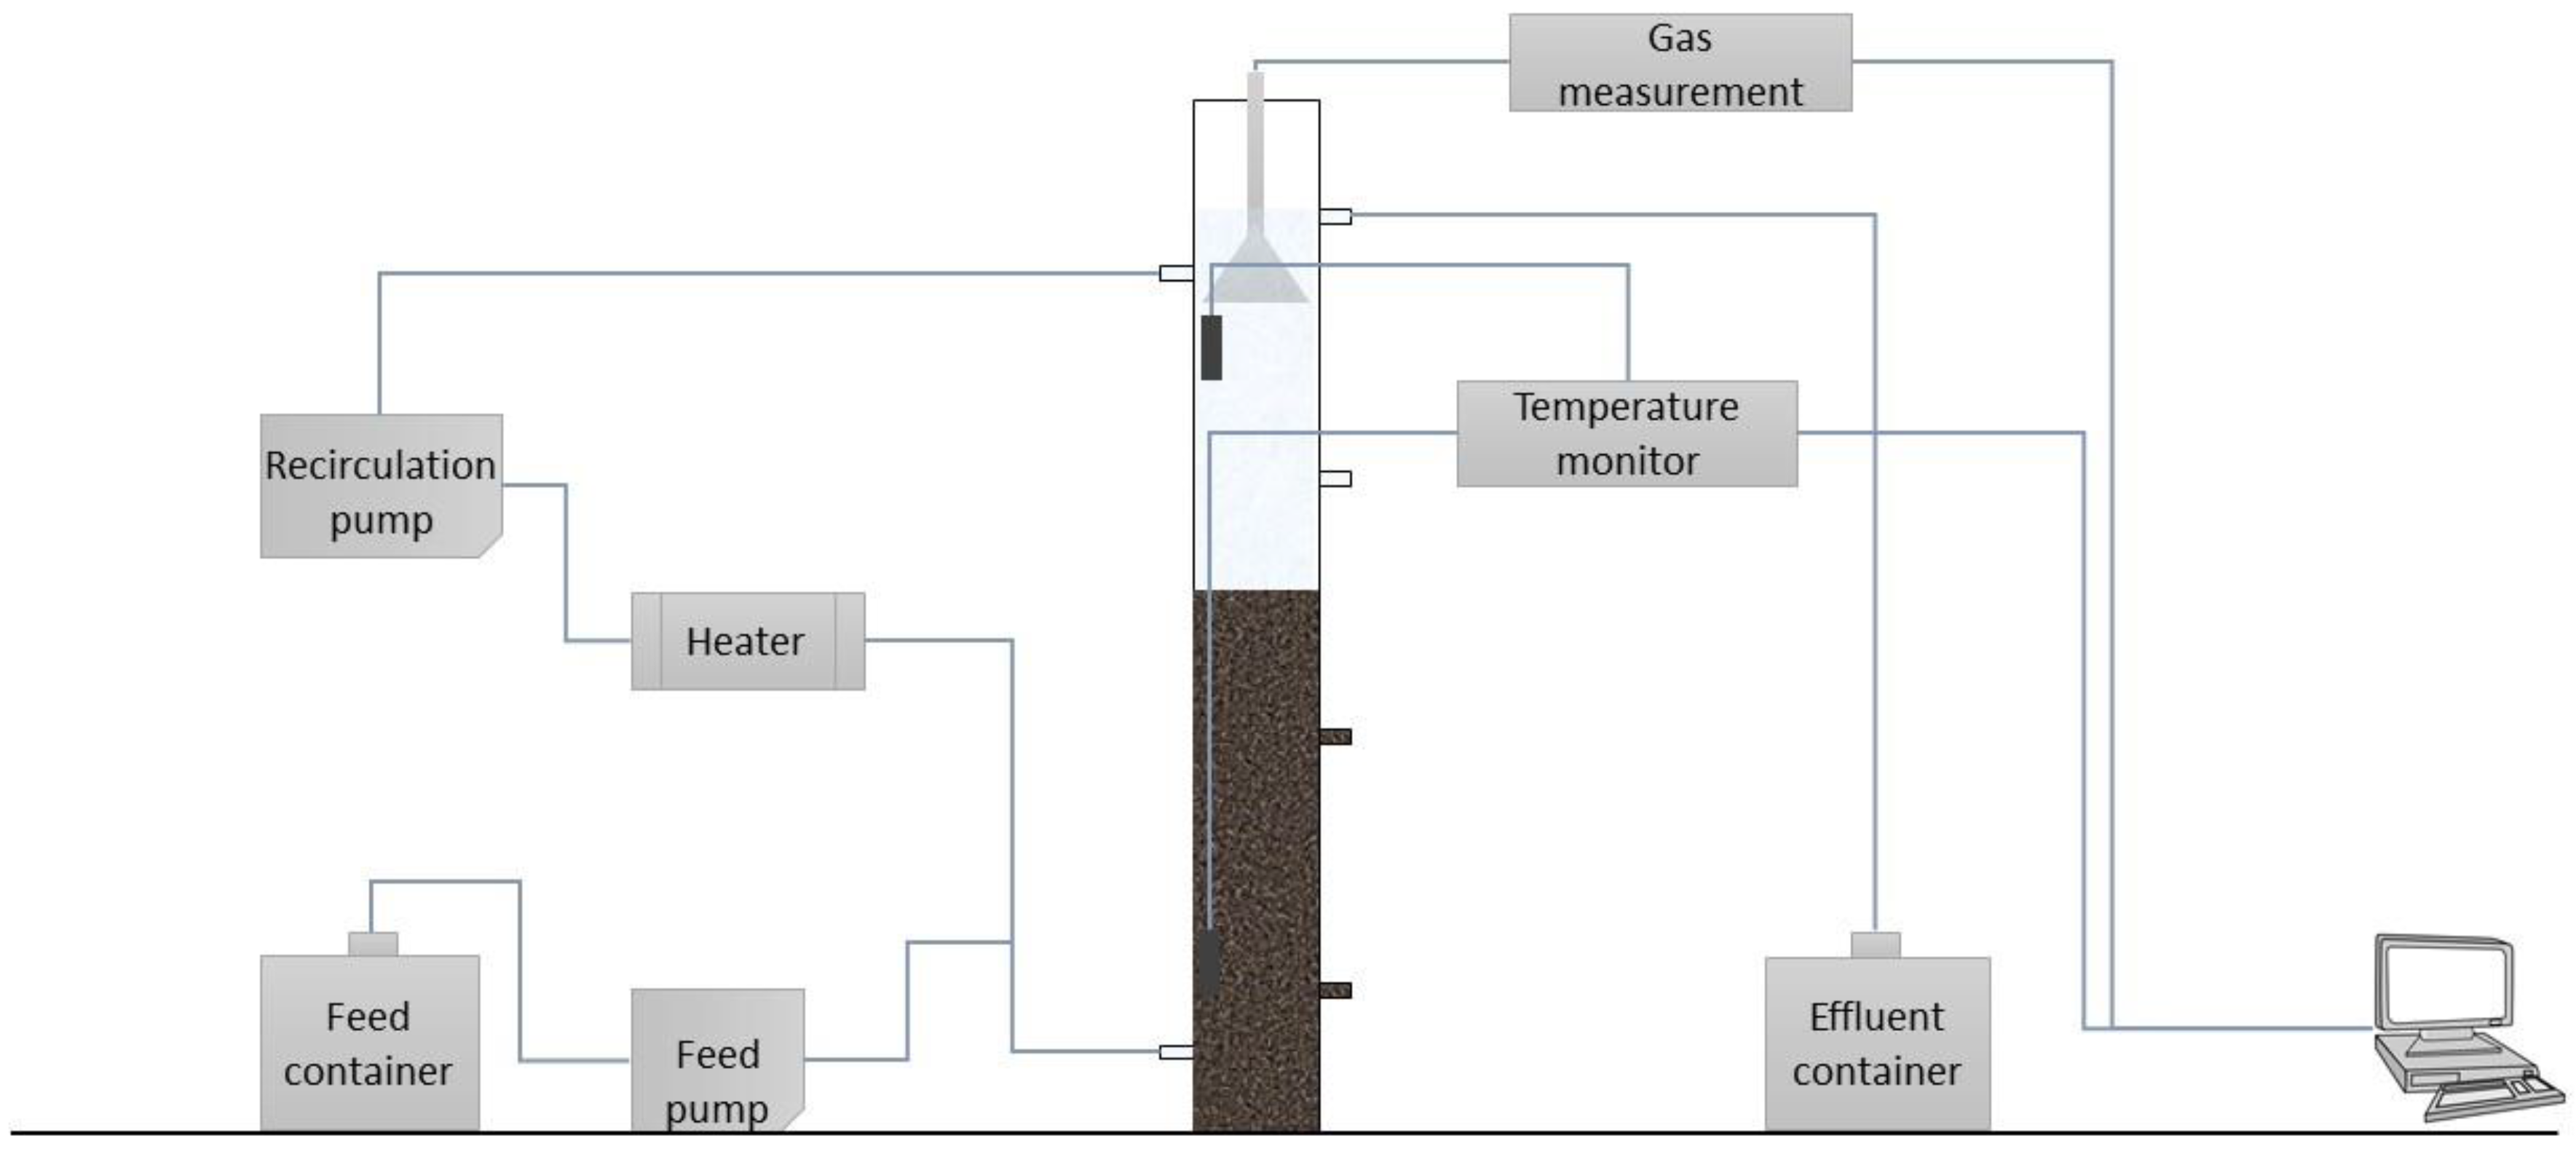
2.3. Reactor and Experimental Procedure

The UASB lab-scale reactor dimensions were 85 cm in height and 4.4 cm in internal diameter giving 1.3 L of total volume. A mixture of granular sludge (0.5 L) obtained from various industrial wastewater treatment plants was used after long-term adaptation to manure. The reactor was run using swine manure samples (both raw and centrifuged) for over a year prior to the start of the experiment. The up-flow velocity was set to 1.75 m/h, hydraulic retention time was 3.8 days, and organic loading rate was 6.5 and 4.5 g∙L−1∙day−1 for RF and CF samples, respectively. The reactor was equipped with heater temperature controls (±0.5 °C) and a liquid displacement and buoyancy device for biogas flow measurement working according to the same principle used by Bergland et al. [3]. Data were logged online with LabVIEW software (Figure 1). The reactor started at 35 °C, and it was fed RF and run for 11 days before the temperature was lowered to 25 °C. After 15 days at 25 °C, CF was introduced, and the experiment continued at 25 °C for another 18 days before the temperature was raised back to 35 °C and run for 15 days (Table 1). The temperature was monitored, showing that the temperature transitions took 4–5 h after each imposed temperature change.

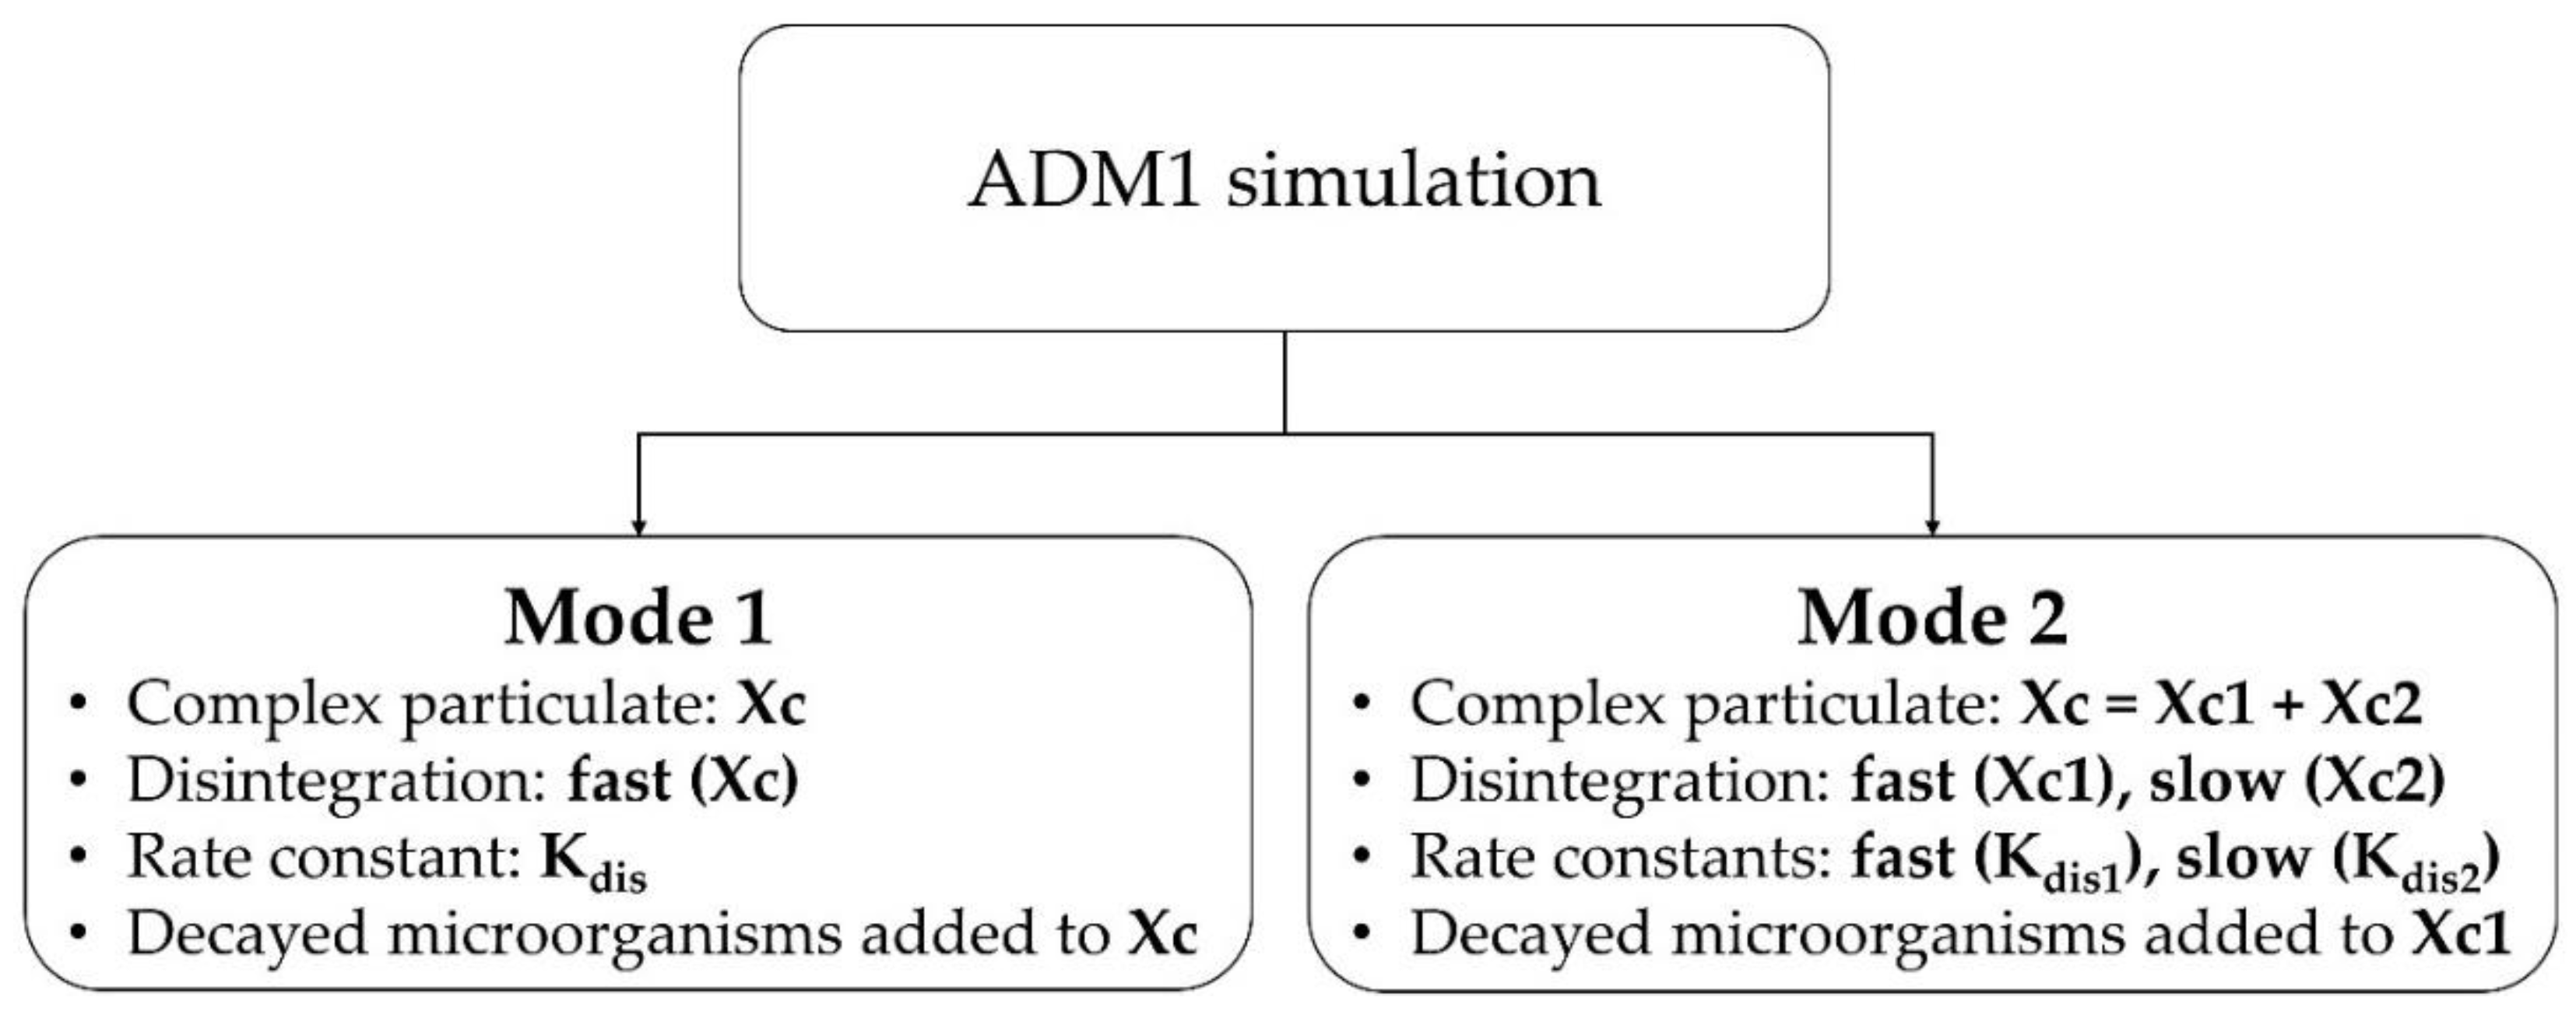
2.4. ADM1 Simulation

The modeling was based on the standard ADM1 implemented in Aquasim software [5,26], only modified by splitting substrate particulates into two fractions, one fast and one slow disintegrating, and making first-order disintegration of these particle fractions temperature-dependent. Rate expressions for the disintegration of fast and slow fractions of the composite substrates are given as follows:
dXc 1 dt =   K dis 1 Xc 1 ,
dXc 2 dt =   K dis 2 Xc 2 ,
where dXc 1 dt and dXc 2 dt are disintegration rates for fast and slow fractions in kg COD∙m−3∙day−1, Xc1 and Xc2 are fast and slow disintegrating fractions of the complex particulate, respectively, and Kdis1 and Kdis2 are rate constants for fast and slow disintegrating fractions, respectively. The dependency of Kdis values on temperature was based on Equation (4).
K dis   = K dis , ref   e [ E a R ] [ 1 T 1 T ref ] ,
where Ea is the activation energy in J∙mol−1, R is the gas constant in J∙mol−1∙K−1, and Tref is the reference temperature in K. Activation energy was estimated from literature data on energy requirements for mechanical disintegration of solid substrates such as straw. According to Krátký and Jirout [22], the energy required to disintegrate straw to sizes less than 10 mm is 29 kWh/t (104.4 kJ/kg). In addition, Kunov-Kruse et al. [27] showed that the activation energy of cellulose hydrolysis is 96.4 ± 4.1 kJ/mol. Since straw, which is composed of up to 50% cellulose, is one of the main sources of particulates in manure substrates, it is reasonable to base the estimate of Ea on these data. We used an Ea of 90 kJ/mol for fast disintegrating and 130 kJ/mol for slow disintegrating particles (corresponding to Kdis of 0.03–0.05 and 0.17 at 25 and 35 °C, respectively). Gali et al. [28] showed that Kdis for swine manure samples at 35 °C is around 0.17 day−1, which we used as reference Kdis and T values. Input composite materials (Xc1 and Xc2) were determined based on the ratio between total and soluble COD values CODtotal and CODsoluble as shown in Equations (5)–(7). Yields for the disintegration of complex materials for swine manure ADM1 modeling by Gali et al. [28] were used with modification to account for fast and slow disintegrating components (Table 2, Table 3 and Table 4).
Xc =   Xc 1 + Xc 2 .
Xc 1 =   COD soluble COD total Xc .
Xc 2 = 1   COD soluble COD total Xc .
Two modes of simulations were carried out. In Mode 1, first-order disintegration kinetics was used without classification of particulates into fast and slow disintegrating sections. In Mode 2, particulates were classified as fast and slow disintegrating. Figure 2 illustrates the two modes of simulations employed.

3. Result and Discussion

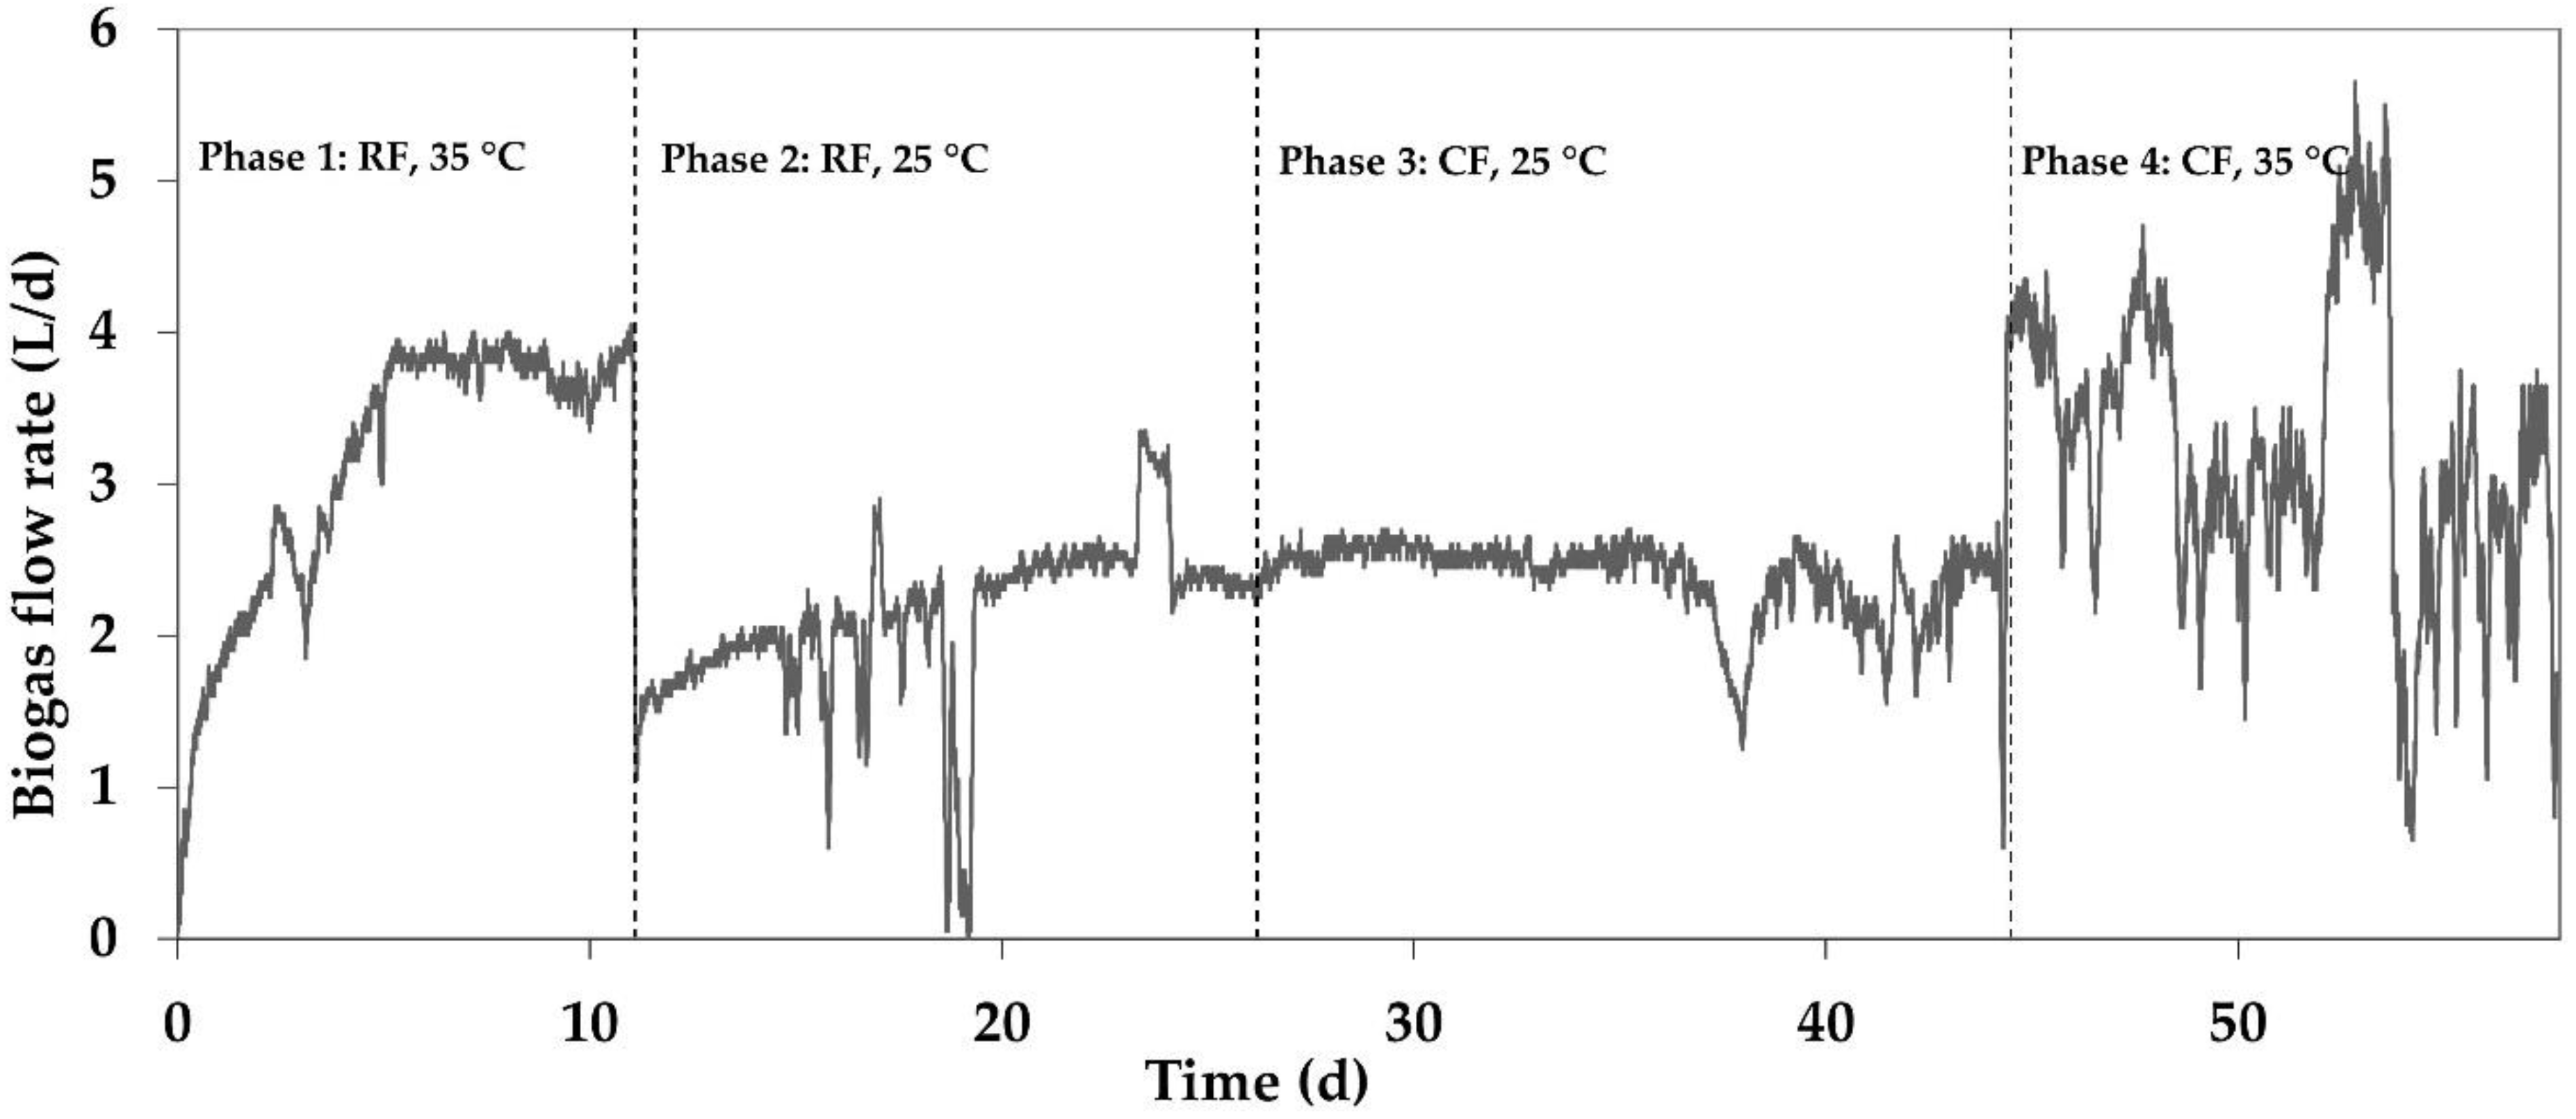
3.1. Biogas Production

The experiment was carried out in four phases based on substrate type and temperature. Stable temperatures at the new levels were achieved 4–5 hours after each temperature controller change (Table 1). In Phase 1, with RF at 35 °C, the biogas production rate increased from the start until the sixth day (Figure 3), followed by stable 3.7–3.9 L/day production. An immediate decrease in biogas production rate was observed in Phase 2, from day 11, when the temperature was reduced to 25 °C (from 3.9 L/day to 1.4 L/day). However, it gradually increased and stabilized around 2.5 L/day until the end of Phase 2. The biogas production rate did not noticeably decrease from Phase 2 to Phase 3 at day 26 when RF was replaced by CF (at 25 °C), even though CODtotal of CF was significantly lower than that of RF. Furthermore, the biogas production rate was more stable in Phase 3 compared to Phase 2. In Phase 4, where CF was used at 35 °C, the biogas production rate increased but with significant fluctuations and an average (11%) less than the stable production in Phase 1. From Phase 1 to 2, the biogas production decreased roughly by 42%. The decrease can be explained by temperature decline (10 °C within a matter of a few hours), which affects the rate of hydrolysis, as well as reaction kinetics. This is comparable to the 44% decrease in total biogas production observed by Lin et al. [29] when the temperature was reduced from 35 to 25 °C. The solubility of methane and other gases also increases as temperature decreases, resulting in a lower amount of biogas in the gas phase [30]. The decline in biogas production seemed to recover in two steps, with the first one being a sharp increase that lasted for a few hours, followed by a gradual increase that stabilized toward the end of Phase 2. Effluent VFAtotal before and immediately after temperature decrease was 0.54 g/L (80% acetate) and 1.6 g/L (62% acetate), respectively, suggesting a negative effect on both acetoclastic methanogenesis and acetogenesis. The concentration of VFAtotal in the effluent increased to 2.3 g/L after few days in Phase 2 and seemed to stabilize at that concentration. Since methanogens are sensitive to temperature changes, process instability (VFA accumulation) during temperature decline is expected. However, the decrease in the proportion of oxidized acids indicates that it may also affect the oxidation of propionic acid to acetate and/or an increase in hydrolysis rate.
A gradual increase in biogas production was also observed in Phase 2. Kim et al. [31] observed a similar trend. They observed the recovery of biogas production rate with no lasting damage to the performance after an initial decline due to sharp temperature decrease (temperature shock). However, their observed biogas yield decline was less pronounced than what we observed (17% decline from 35 to 25 °C compared to the 42% decline in our study). The reason for the gradual increase in biogas production may be linked to gradual microbial adaptation to temperature change. In addition, solid particulates entrapped in the granular sludge may have been slowly disintegrated and hydrolyzed, contributing to the increase in biogas production throughout Phase 2. However, the disintegration and hydrolysis of solid particulates at 25 °C do not seem to be carried out to an appreciable degree. In Phase 3, even with the decrease in CODtotal and solid content of the feed, the biogas production rate did not decrease in any appreciable way compared to Phase 2 (Table 5 and Table 6). Experimental results of total and suspended solid contents from influent and effluent samples showed that most of the feed solid content ended up in the effluent. In fact, the percentage of solids was higher in the effluent of the centrifuged sample than the raw sample (Table 7). This is perhaps because solid particles in the centrifuged sample are relatively smaller than those in the raw sample, which help most of the solid particulates avoid entrapment in the sludge bed and wash out to the effluent before any degradation occurs. As a result, it is reasonable to assume that the biogas produced in Phase 3 must have come primarily from the digestion of soluble components. Biogas production in Phase 4 showed the most fluctuation. However, experimental analysis of influent and effluent samples seems to indicate that the process was still stable with effluent VFAtotal of 0.17 g/L, pH of 8.1, 51% CODtotal removal, and 62% CODsoluble removal on average. When the temperature was increased from 25 °C to 35 °C at day 45, there was a fast decline in the biogas production, followed quickly by a sharp increase. During the transition from 35 °C to 25 °C in Phase 1, the production rate also showed a fast decline followed by a quick recovery. This indicates that, regardless of whether the temperature was increased or decreased, there seemed to be a decline in biogas production rate after a rapid change in reactor temperature. However, the rate quickly recovered.

3.2. Methane Yield and Solid Removal Efficiency

Methane yields were higher for CF than RF and increased with temperature (Table 6). The influent and effluent analysis shows that temperature affected the digestion of both suspended and dissolved solids. At 25 °C, 50% of the RF total suspended solids (TSS) were removed, while 68% were removed at 35 °C (Table 8). For dissolved solids (TDS), the removals were 7.8% and 9.1% at 25 °C and 35 °C, respectively. Little or negative TSS and ~30% TDS removals were observed for CF. Effluent CODsoluble measurements show that the difference in biogas production between RF and CF was due to digestion of feed particulate content.

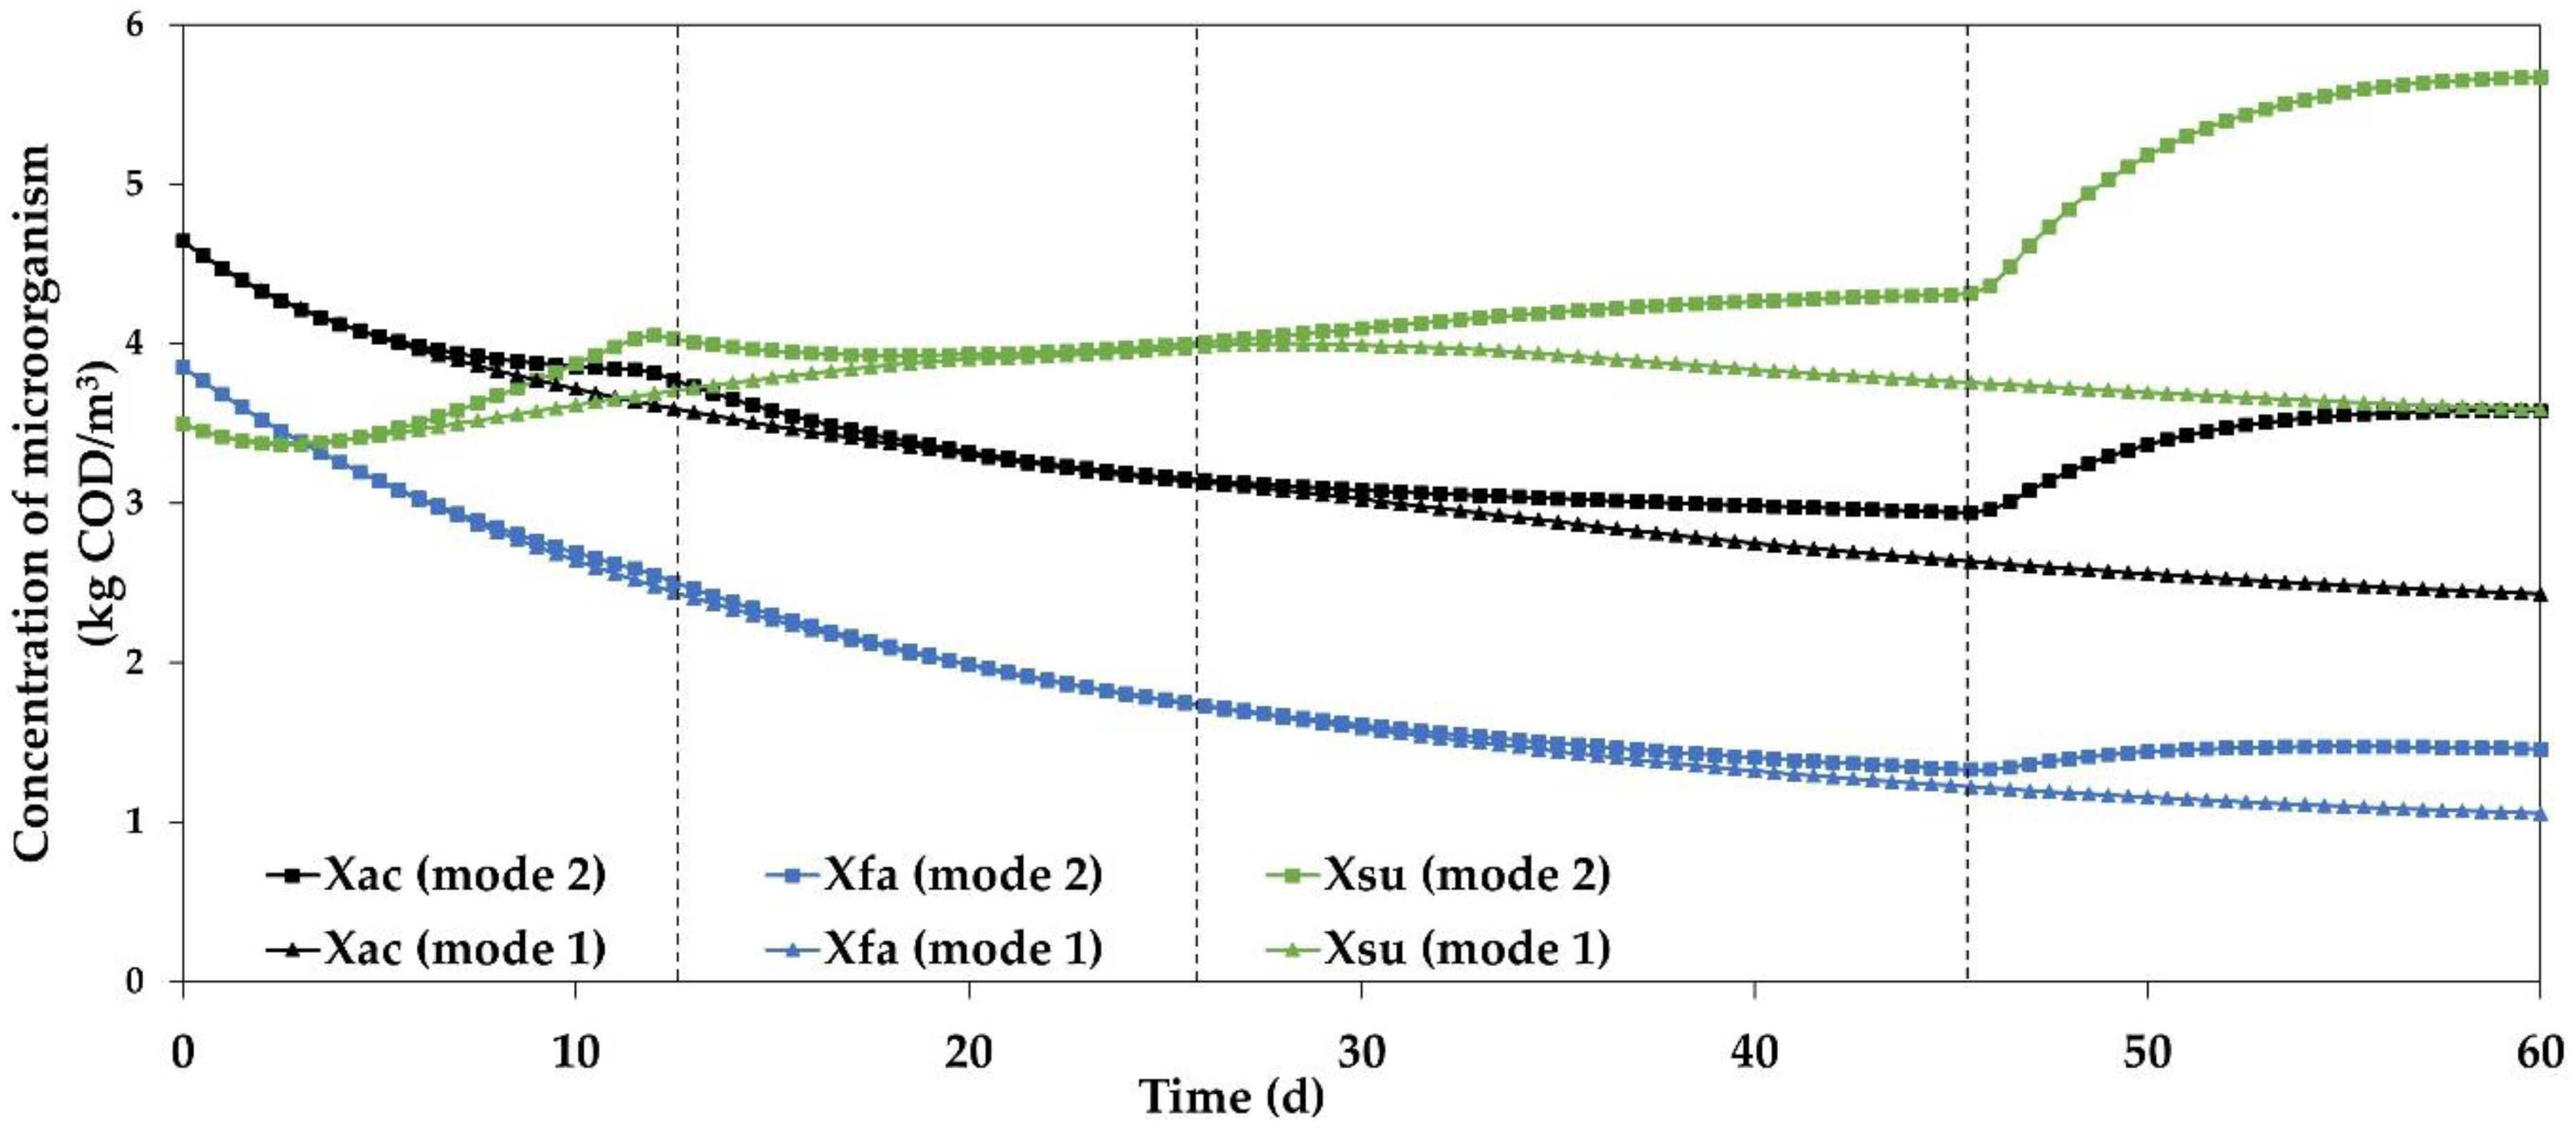
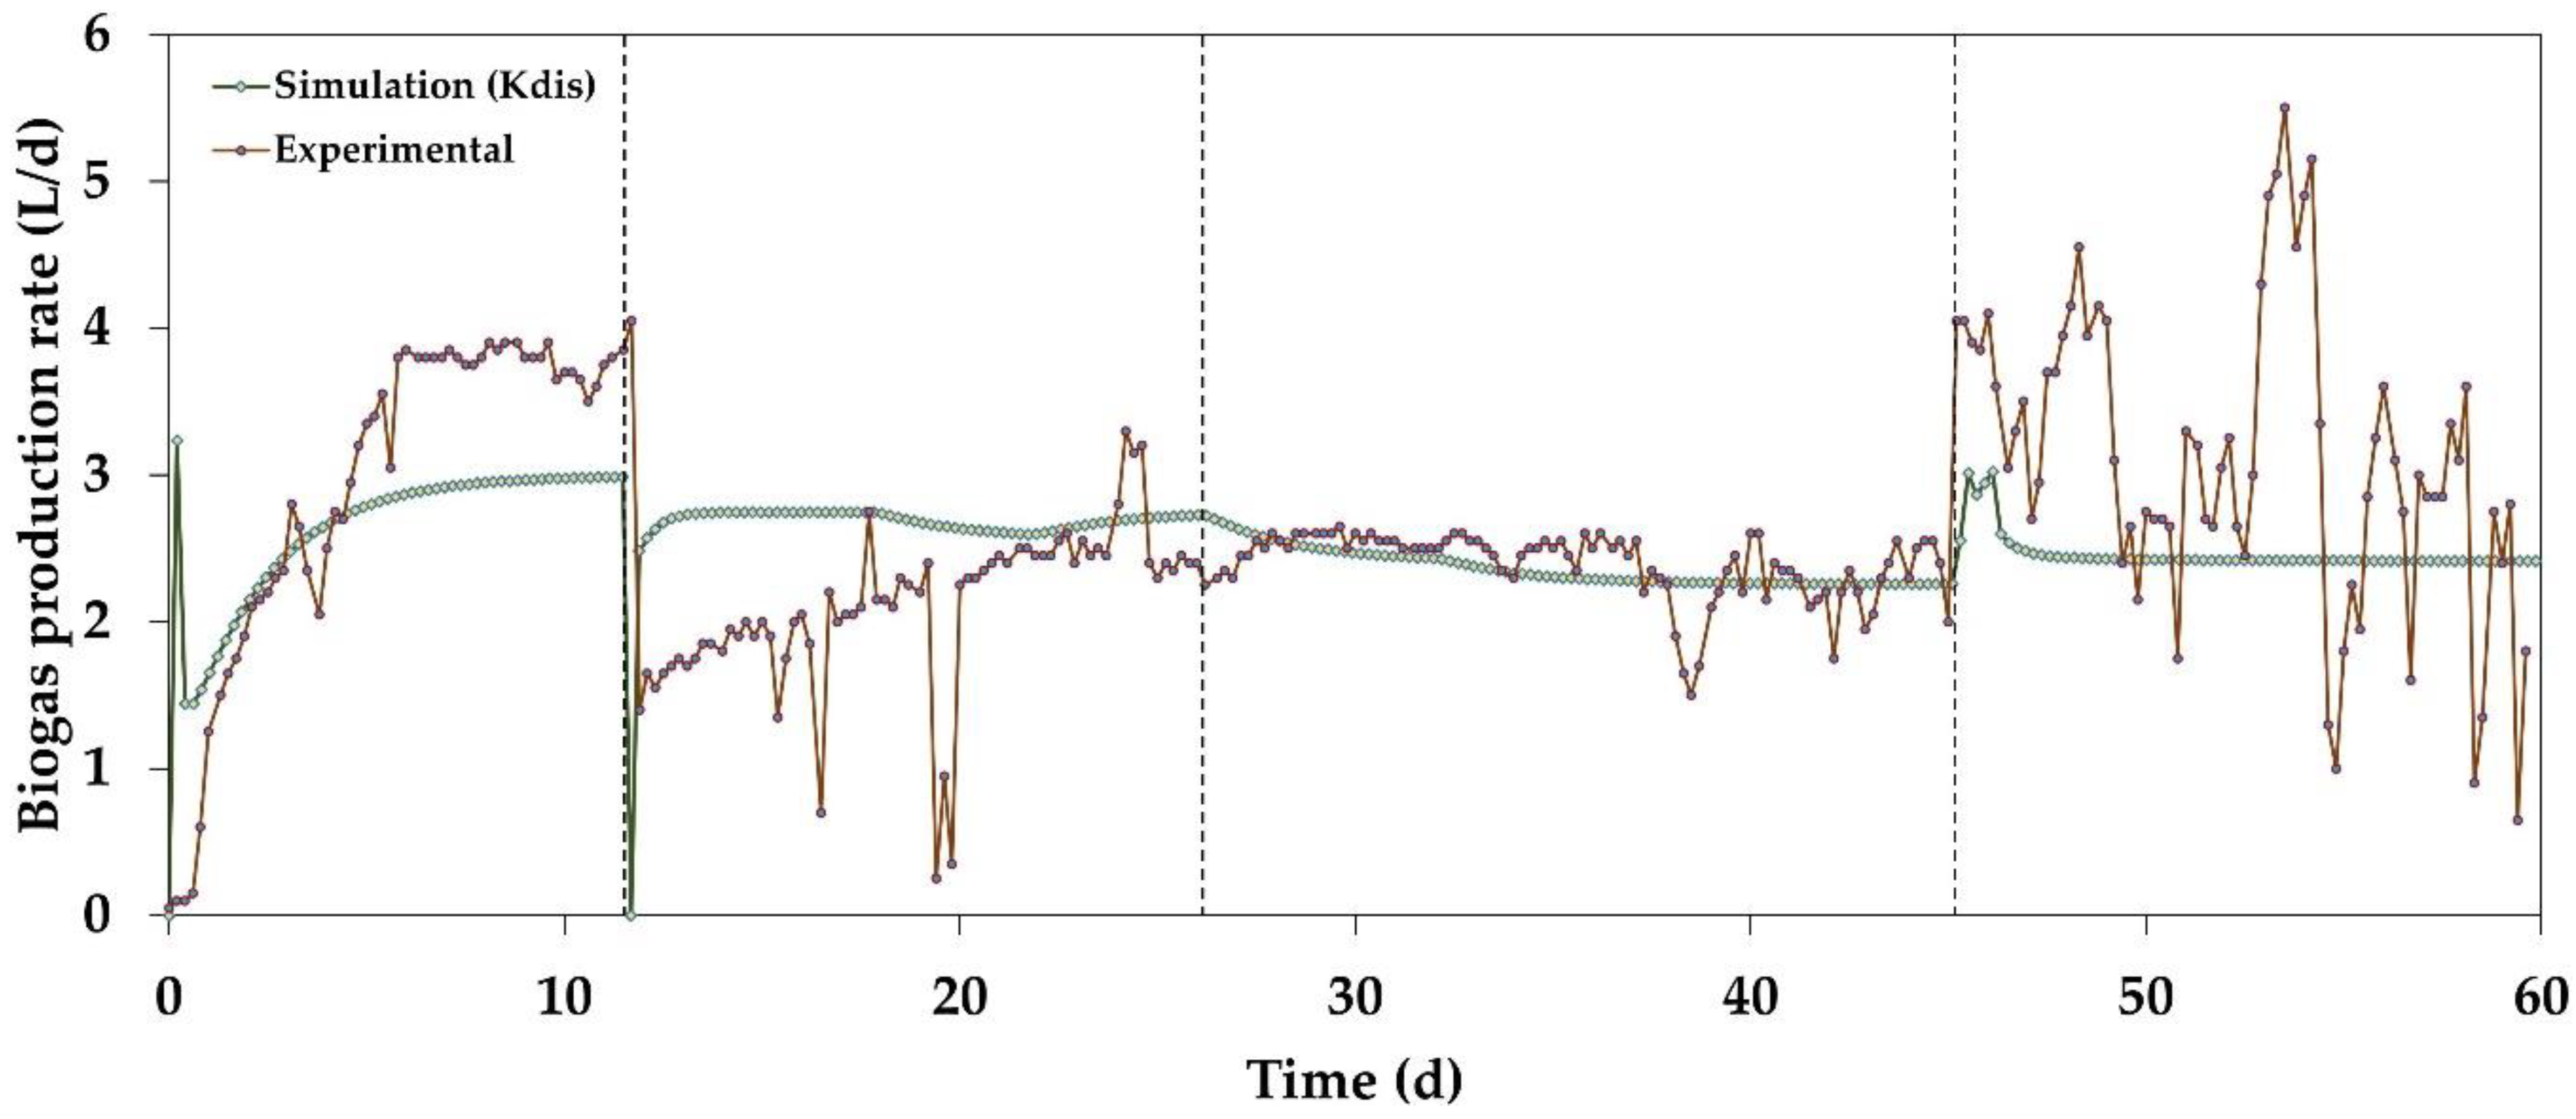
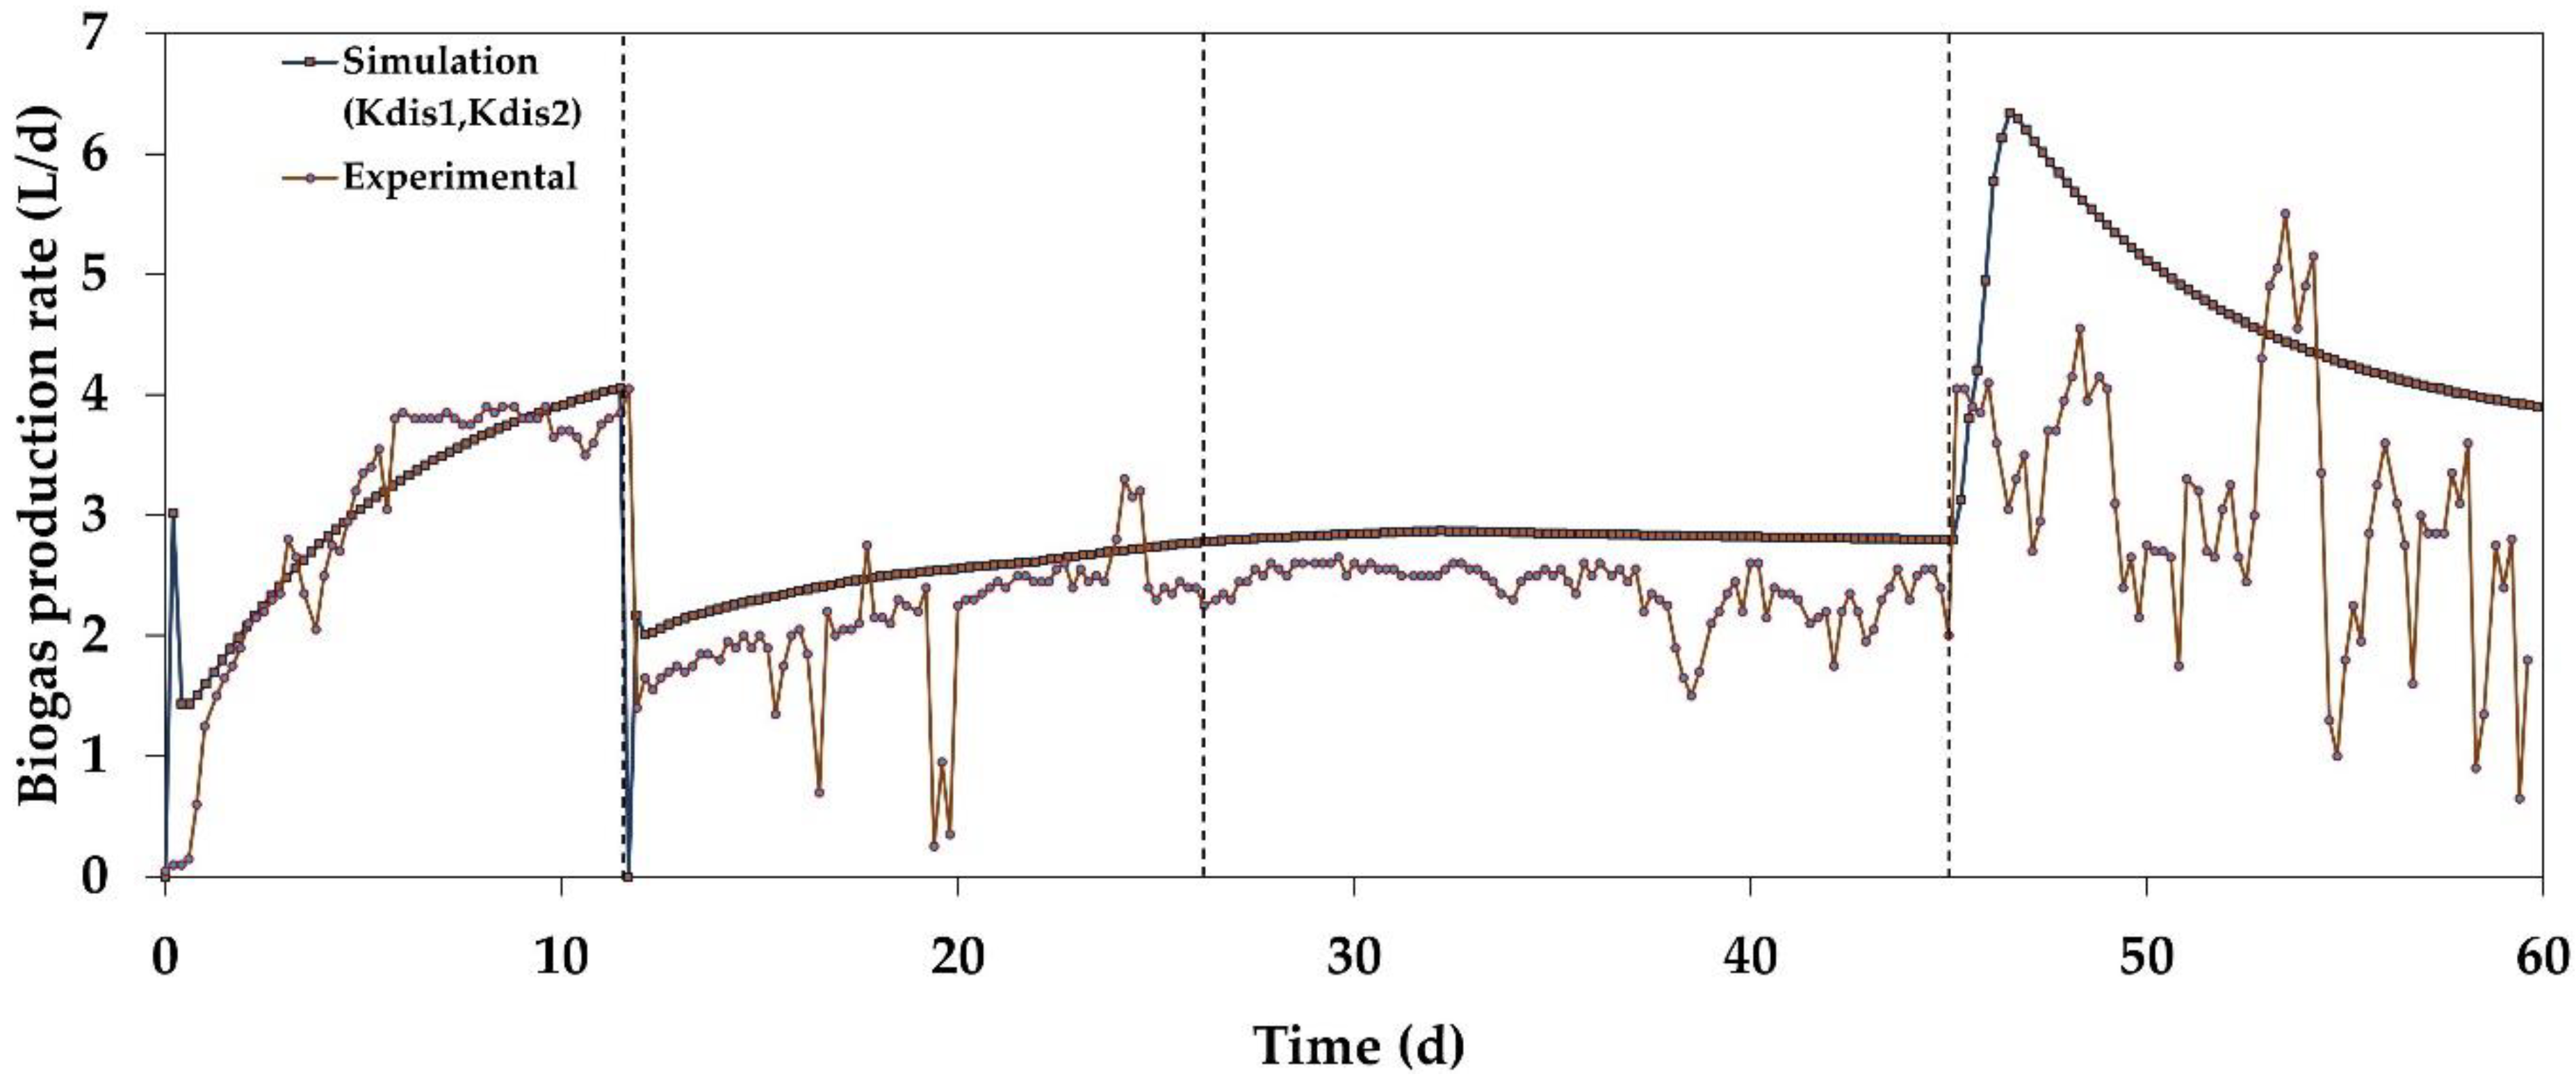
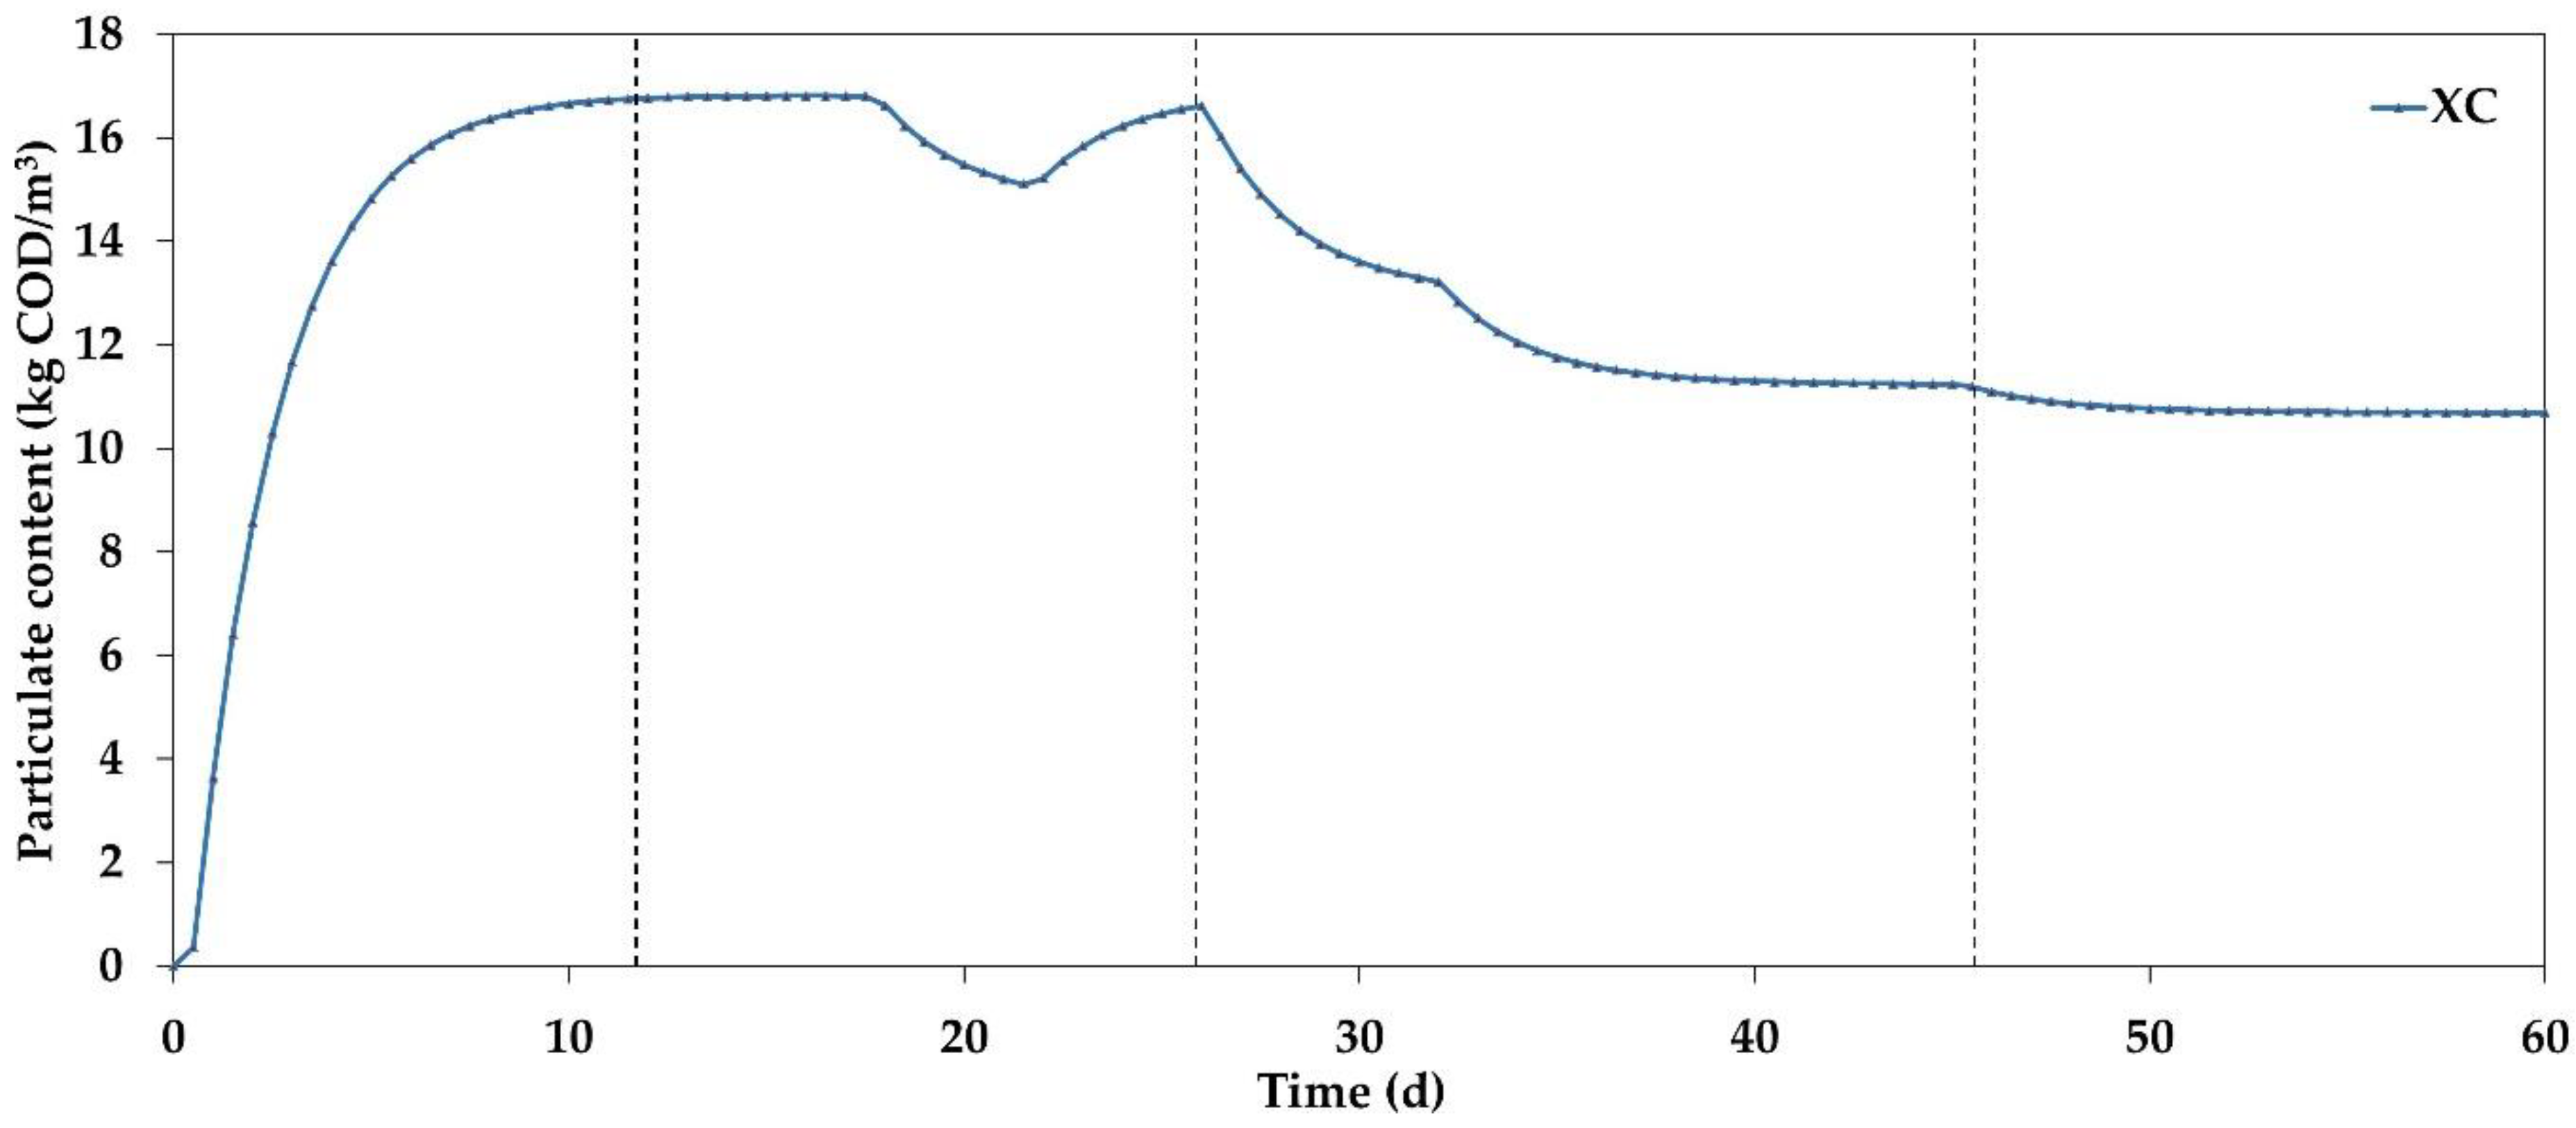
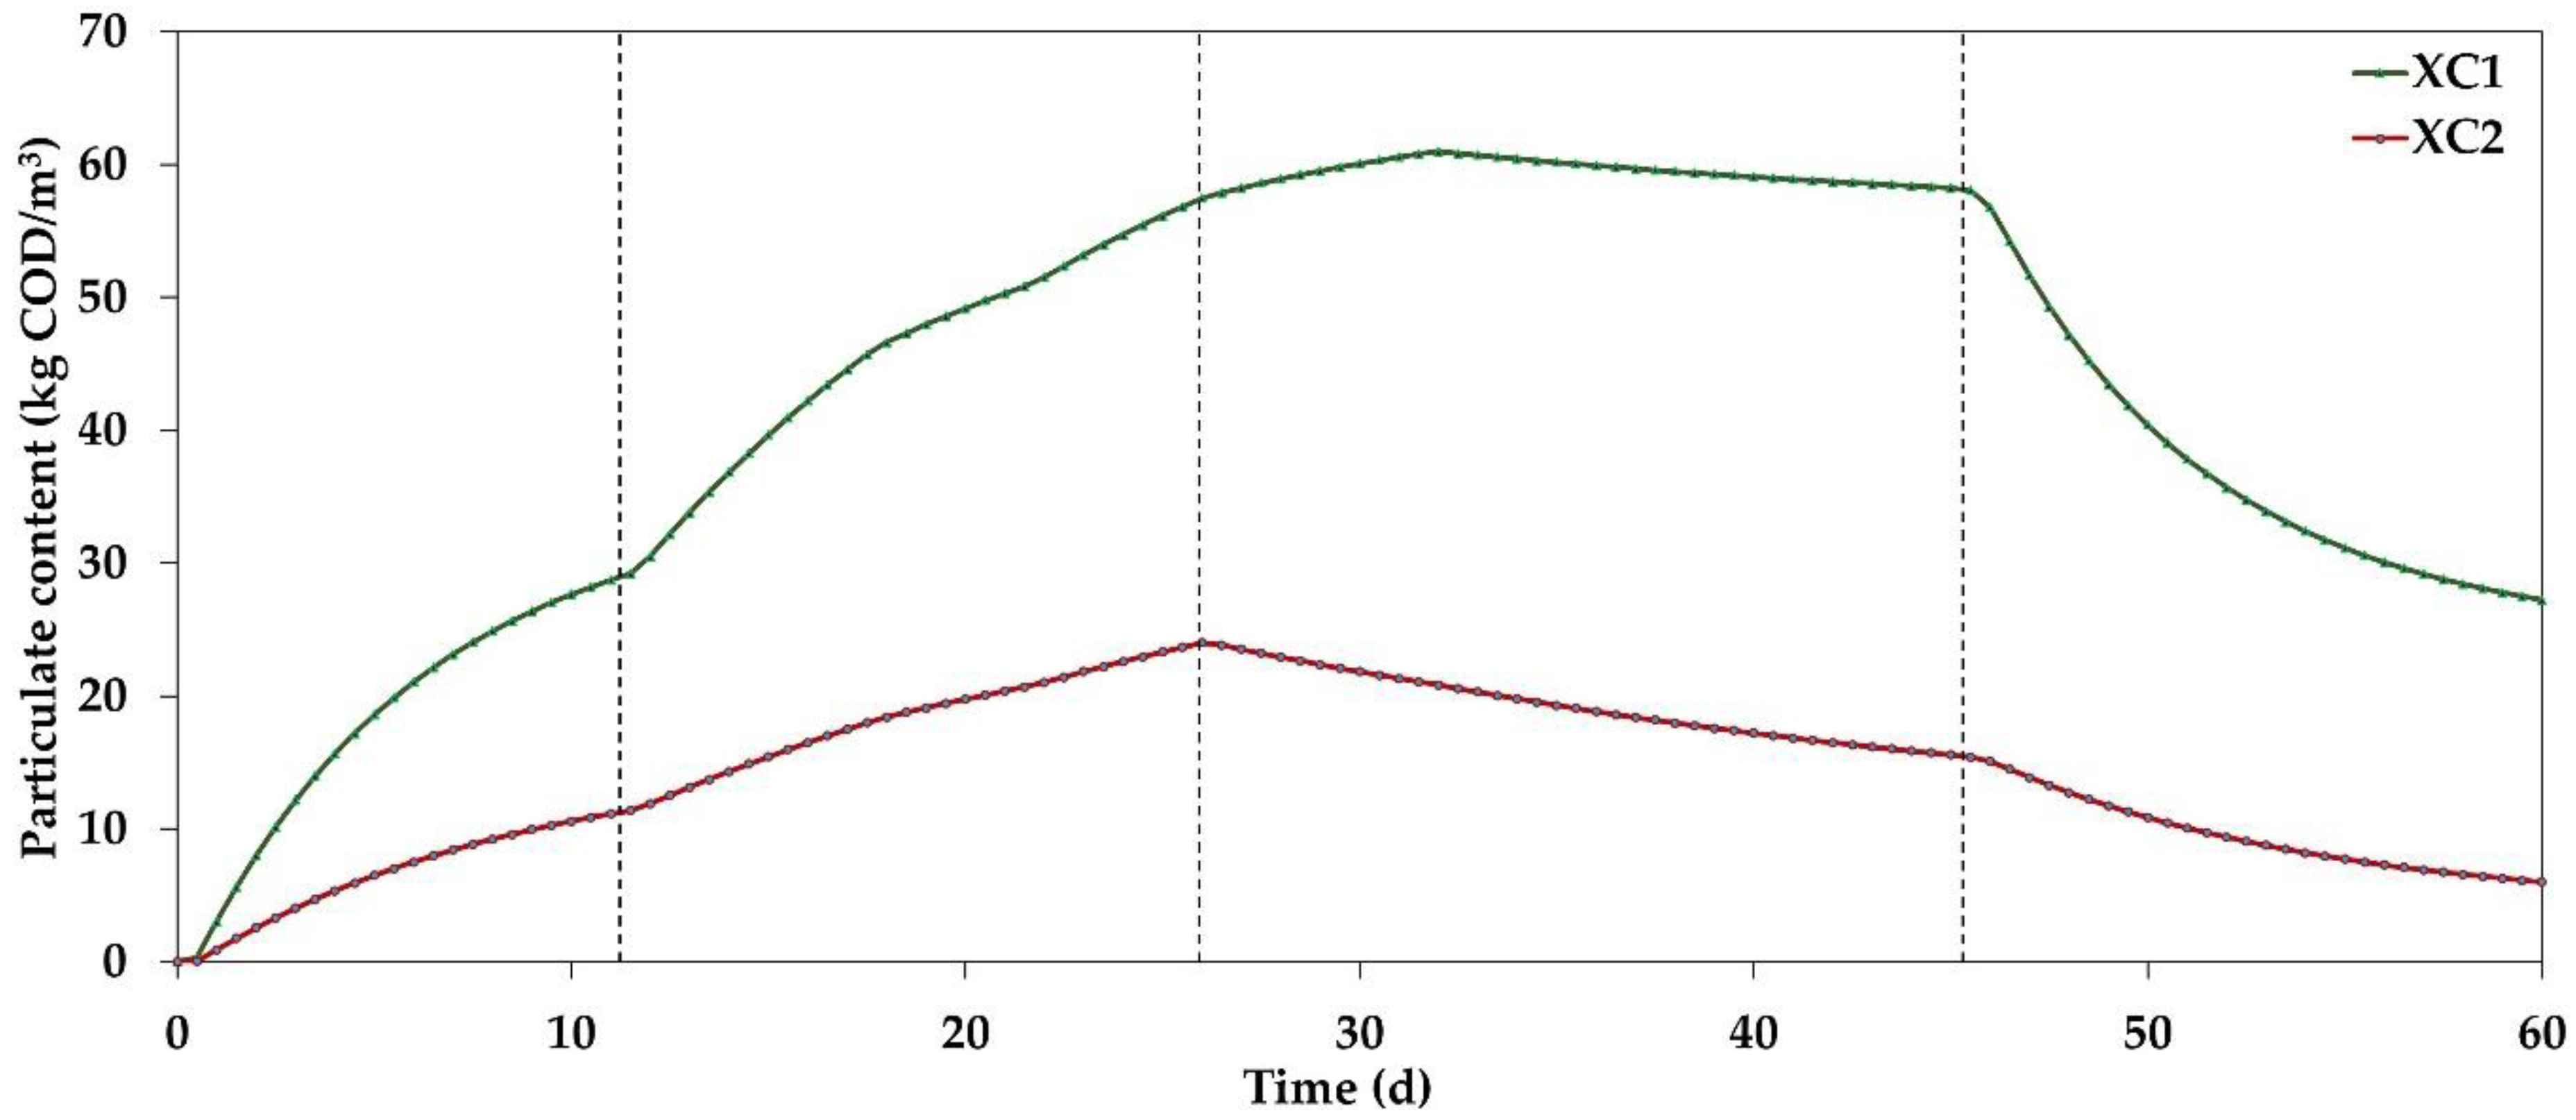
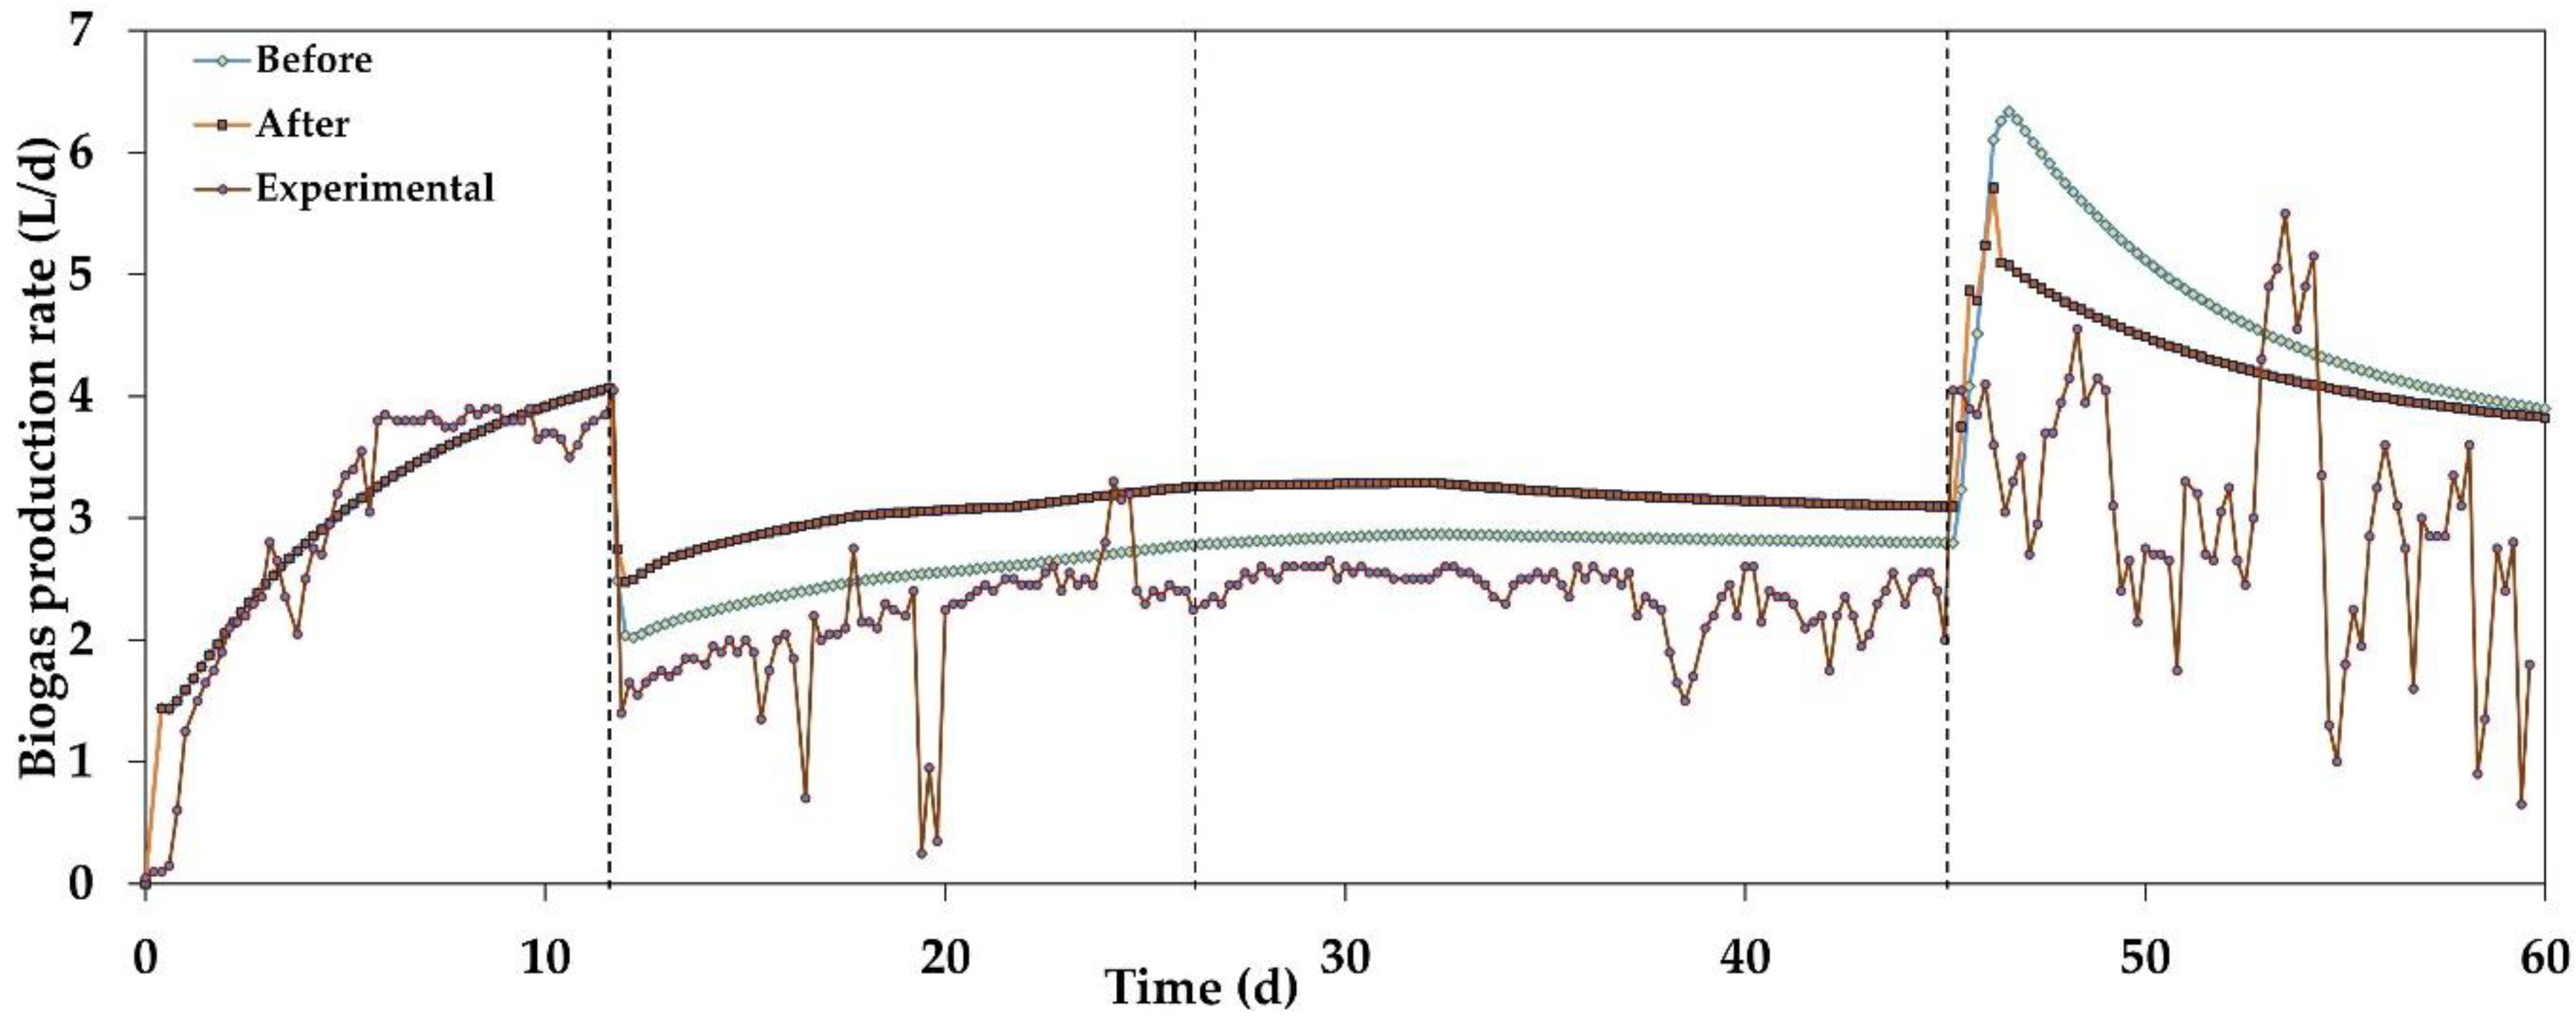
3.3. Simulation Results

Comparison of the two modes of simulations revealed that classification of particles into fast and slow disintegrating fractions (Mode 2) led to a better representation of the experimental data compared to Mode 1 simulation across all four phases of the experiment. Application of the same simulation approaches to batch reactors also revealed that Mode 2 simulation led to a better fit to experimental observations [9]. Mode 1 simulation assumed that all particulates possess fast disintegration potential, whereas Mode 2 assumed that a fraction of the particulates disintegrated at a slower rate based on Equation (4). The result from the Mode 1 simulation revealed that the rate of methane production was consistently lower than the experimental data. In the batch test experiments, we observed that the Mode 1 simulation overestimated the rate of methane production, which was expected considering that more particulates have higher disintegration rate which means more production of methane. Our initial explanation for this was an accumulation of VFA, but pH data did not support it. However, data from biomass concentration (Figure 4) showed that the growth of acetate (Xac), sugar (Xsu), and fatty acid (Xfa) degrading organisms declined quite fast in the Mode 1 simulation, likely affecting the rate of methane production (Figure 5 and Figure 6).
The Mode 2 simulation showed a more efficient particulate removal and sensitivity to changes in temperature and particulate content than the Mode 1 simulation (Figure 7 and Figure 8). In both modes of simulations, particulates accumulated regardless of whether they were fast or slow disintegrating, and this continued until the start of Phase 3 when CF was introduced. During Phases 1 and 2, the rate of addition of particulates into the reactor was faster than the rate of disintegration and hydrolysis. After Phase 2, the particulate content started to decline. At the start of Phase 3, the particulates that were let into the reactor during Phases 1 and 2 were in the reactor for several days, meaning that even slow disintegrating portions of the particulates would have started to disintegrate. The particulate content of CF was much lower than that of RF, leading to a slower rate of addition of particulates into the reactor. A combination of these factors contributed to the decline in the particulate content in the latter two phases of the experiment. However, in the Mode 1 simulation, the decline in particulate content was short; after an initial decline early in Phase 3, particulate content seemed to stay constant. By contrast, Mode 2 showed a considerable decline in particulate content, which continued until the end of the experiment.

4. Conclusions

We carried out anaerobic digestion experiments using a lab-scale UASB reactor on two sets of samples with varying levels of suspended solids and digestion temperature. Our goals were to examine influences of temperature and particulate content on sludge bed anaerobic digestion. Based on the experiments and simulations carried out and the results obtained, we made the following conclusions:
  • An increase in temperature increased the overall biogas production in both high- and low-particulate-content substrates, but the temperature effect was stronger on high-particle-content substrates.
  • Disintegration and hydrolysis of suspended solids were significantly enhanced by a temperature increase from 25 to 35 °C.
  • Methane yield was significantly higher for the low-particulate sample (CF) than for the high-particulate sample (RF) at both 25 and 35 °C.
  • Particulate and COD removal efficiencies were improved at a higher temperature. CODtotal removal efficiency improved from 44% at 25 °C to 73% at 35 °C for the high-particulate substrate and from 43% at 25 °C to 54% at 35 °C for the low-particulate substrate. CODsoluble removal efficiencies were also improved at higher temperatures, but they were approximately similar for both high- and low-particulate substrates.
  • Classifying particulates into fast and slow disintegrating and applying temperature-dependent disintegration constant values Kdis fit the experimental data better than the traditional ADM1 method of simulation.

Author Contributions

Conceptualization, F.A.T. and R.B.; methodology, F.A.T. and C.D.; software, F.A.T.; validation, F.A.T.; formal analysis, F.A.T.; investigation, F.A.T.; resources, F.A.T.; data curation, all authors; writing—original draft preparation, F.A.T.; writing—review and editing, all authors; visualization, F.A.T.; supervision, R.B. and W.H.B.; project administration, R.B.; funding acquisition, R.B. All authors have read and agreed to the published version of the manuscript.

Funding

This research was part of a PhD project funded by the European Regional Development Fund, Interreg BioGas2020.

Acknowledgments

The authors would like to thank Dag Øvrebø for his help during sample collection.

Conflicts of Interest

The authors declare no conflicts of interest.

Appendix A. Sensitivity Function of Biogas Production

Sensitivity analysis and parameter estimation were carried out on Ea values in the Mode 2 simulation (since Kdis is used as a formula variable, we could not use it for sensitivity analysis; we used Ea instead, from which the sensitivity of Kdis was determined). Sensitivity analysis, which combines identifiability and uncertainty analysis, is used to check if model parameters can be uniquely determined from available data and to estimate the uncertainty of the parameter estimates [32]. The sensitivity function of biogas production with respect to Ea values is shown in Appendix A. Parameter estimation of Ea revealed values of 51,444 and 150,000 J∙mol−1 for Ea1 and Ea2, respectively; a comparison of the simulation before and after the implementation of estimated parameters is presented in Figure A1 in Appendix B.
The absolute–relative sensitivity function was used in Aquasim software to measure the absolute change in y for a 100% change in p. In this case, y is biogas production, and p is parameter Ea1 or Ea2. It was calculated according to the following equation:
Absolute Relative   sensitivity   function = P y P .
In Table A1 and Table A2, the sensitivity function (SensAR) is expressed as root mean square (r(av(SensAR2))) and mean absolute (av(|SensAR|)), and for error contributions as (av(|ErrCont|)). S_CH4, S_CO2, and S_H2 are concentrations of CH4, CO2, and H2, respectively.
Table A1. Variables ranked based on sensitivity to Ea1 and Ea2 in the headspace.
Variabler(av(SensAR2))av(|SensAR|)av(|ErrCont|)
Ea1Ea2Ea1Ea2Ea1Ea2
S_CH40.2860.1630.0850.06800
S_CO20.0040.0030.0010.00100
S_H2000000
Table A2. Variables ranked based on sensitivity to Ea1 and Ea2 in the bulk reactor.
Variabler(av(SensAR2))av(|SensAR|)av(|ErrCont|)
Ea1Ea2Ea1Ea2Ea1Ea2
S_CH40.2330.0850.0250.01600
S_CO20.0050.0030.0010.00100
S_H2000000
Other parameters
Xc175.971.1531.534.800
Xc215.612.510.67.600

Appendix B. Simulation before and after Parameter Estimation

Figure A1. Comparison of the simulation before and after the implementation of parameter estimation.
Applsci 10 00136 g0a1

References

  1. FAO. FAO Report: Nitrogen Inputs to Agricultural Soils from Livestock Manure. Available online: http://www.fao.org/economic/ess/ess-events/faostat-manure/en/ (accessed on 15 February 2019).
  2. Zeeman, G.; Sanders, W.T.M.; Wang, K.Y.; Lettinga, G. Anaerobic Treatment of Complex Wastewater and Waste Activated Sludge–Application of an Upflow Anaerobic Solid Removal (UASR) Reactor for the Removal and Pre-Hydrolysis of Suspended COD. Water Sci. Technol. 1997, 35, 121–128. [Google Scholar] [CrossRef]
  3. Bergland, W.H.; Dinamarca, C.; Toradzadegan, M.; Nordgård, A.S.R.; Bakke, I.; Bakke, R. High Rate Manure Supernatant Digestion. Water Res. 2015, 76, 1–9. [Google Scholar] [CrossRef] [PubMed] [Green Version]
  4. Mahmoud, N.; Zeeman, G.; Gijzen, H.; Lettinga, G. Solids Removal in Upflow Anaerobic Reactors, a Review. Bioresour. Technol. 2003, 90, 1–9. [Google Scholar] [CrossRef]
  5. Batstone, D.J.; Keller, J.; Angelidaki, I.; Kalyuzhnyi, S.V.; Pavlostathis, S.G.; Rozzi, A.; Sanders, W.T.; Siegrist, H.; Vavilin, V.A. The IWA Anaerobic Digestion Model No 1 (ADM1). Water Sci. Technol. 2002, 45, 65–73. [Google Scholar] [CrossRef]
  6. Vavilin, V.A.; Fernandez, B.; Palatsi, J.; Flotats, X. Hydrolysis Kinetics in Anaerobic Degradation of Particulate Organic Material: An Overview. Waste Manag. 2008, 28, 939–951. [Google Scholar] [CrossRef]
  7. Vavilin, V.A.; Rytov, S.V.; Lokshina, L.Y. A Description of Hydrolysis Kinetics in Anaerobic Degradation of Particulate Organic Matter. Bioresour. Technol. 1996, 56, 229–237. [Google Scholar] [CrossRef]
  8. Cazier, E.A.; Trably, E.; Steyer, J.P.; Escudie, R. Biomass Hydrolysis Inhibition at High Hydrogen Partial Pressure in Solid-State Anaerobic Digestion. Bioresour. Technol. 2015, 190, 106–113. [Google Scholar] [CrossRef] [Green Version]
  9. Tassew, F.A.; Bergland, W.H.; Dinamarca, C.; Bakke, R. Effect of Particulate Disintegration on Biomethane Potential of Particle-Rich Substrates in Batch Anaerobic Reactor. Appl. Sci. 2019, 9, 2880. [Google Scholar] [CrossRef] [Green Version]
  10. Lin, C.Y.; Noike, T.; Sato, K.; Matsumoto, J. Temperature Characteristics of the Methanogenesis Process in Anaerobic Digestion. Water Sci. Technol. 1987, 19, 299–300. [Google Scholar] [CrossRef]
  11. Masse, D.I.; Masse, L.; Croteau, F. The effect of temperature fluctuations on psychrophilic anaerobic sequencing batch reactors treating swine manure. Bioresour. Technol. 2003, 89, 57–62. [Google Scholar] [CrossRef]
  12. Saady, N.M.C.; Massé, D.I. Psychrophilic anaerobic digestion of lignocellulosic biomass: A characterization study. Bioresour. Technol. 2013, 142, 663–671. [Google Scholar] [CrossRef] [PubMed]
  13. Moset, V.; Poulsen, M.; Wahid, R.; Højberg, O.; Møller, H.B. Mesophilic versus thermophilic anaerobic digestion of cattle manure: Methane productivity and microbial ecology. Microb. Biotechnol. 2015, 8, 787–800. [Google Scholar] [CrossRef] [PubMed]
  14. Lettinga, G.; Rebac, S.; Zeeman, G. Challenge of Psychrophilic Anaerobic Wastewater Treatment. TRENDS Biotechnol. 2001, 19, 363–370. [Google Scholar] [CrossRef]
  15. Massé, D.I.; Saady, N.M.C. Psychrophilic dry anaerobic digestion of dairy cow feces: Long-term operation. Waste Manag. 2015, 36, 86–92. [Google Scholar] [CrossRef] [PubMed]
  16. Zhu, G.; Jha, A.K. Psychrophilic dry anaerobic digestion of cow dung for methane production: Effect of inoculum. Sci. Asia 2013, 39, 500–510. [Google Scholar] [CrossRef] [Green Version]
  17. Rajagopal, R.; Bellavance, D.; Rahaman, M.S. Psychrophilic anaerobic digestion of semi-dry mixed municipal food waste: For North American context. Process. Saf. Environ. Prot. 2017, 105, 101–108. [Google Scholar] [CrossRef]
  18. Ge, H.; Jensen, P.D.; Batstone, D.J. Relative Kinetics of Anaerobic Digestion under Thermophilic and Mesophilic Conditions. Water Sci. Technol. 2011, 64, 848–853. [Google Scholar] [CrossRef]
  19. Chi, Y.Z.; Li, Y.Y.; Ji, M.; Qiang, H.; Deng, H.W.; Wu, Y.P. Mesophilic and Thermophilic Digestion of Thickened Waste Activated Sludge: A Comparative Study. In Advanced Materials Research; Trans Tech Publications: Zurich, Switzerland, 2010; Volume 113, pp. 450–458. [Google Scholar]
  20. Veeken, A.; Hamelers, B. Effect of Temperature on Hydrolysis Rates of Selected Biowaste Components. Bioresour. Technol. 1999, 69, 249–254. [Google Scholar] [CrossRef]
  21. Hashimoto, A.G. Ammonia Inhibition of Methanogenesis from Cattle Wastes. Agric. Wastes 1986, 17, 241–261. [Google Scholar] [CrossRef]
  22. Lukáš KRÁTKÝ, T.J. The Effect of Mechanical Disintegration on the Biodegradability of Wheat Straw. Inżynieria Apar. Chem. 2013, 52, 202–203. [Google Scholar]
  23. Sambusiti, C.; Monlau, F.; Ficara, E.; Musatti, A.; Rollini, M.; Barakat, A.; Malpe, F. Comparison of various post-treatments for recovering methane from agricultural digestate. Fuel Process. Technol. 2015, 137, 359–365. [Google Scholar] [CrossRef]
  24. Gioelli, F.; Dinuccio, E.; Balsari, P. Residual biogas potential from the storage tanks of non-separated digestate and digested liquid fraction. Bioresour. Technol. 2011, 102, 10248–10251. [Google Scholar] [CrossRef] [PubMed]
  25. Association, A.P.H.; Association, A.W.W. Standard Methods for the Examination of Water and Wastewater; American Public Health Association: Washington, DC, USA, 1989. [Google Scholar]
  26. Reichert, P. AQUASIM A Tool for Simulation and Data Analysis of Aquatic Systems. Water Sci. Technol. 1994, 30, 21. [Google Scholar] [CrossRef]
  27. Kunov-Kruse, A.J.; Riisager, A.; Saravanamurugan, S.; Berg, R.W.; Kristensen, S.B.; Fehrmann, R. Revisiting the Brønsted Acid Catalysed Hydrolysis Kinetics of Polymeric Carbohydrates in Ionic Liquids by in Situ ATR-FTIR Spectroscopy. Green Chem. 2013, 15, 2843–2848. [Google Scholar] [CrossRef] [Green Version]
  28. Galí, A.; Benabdallah, T.; Astals, S.; Mata-Alvarez, J. Modified Version of ADM1 Model for Agro-Waste Application. Bioresour. Technol. 2009, 100, 2783–2790. [Google Scholar] [CrossRef] [PubMed]
  29. Lin, Q.; He, G.; Rui, J.; Fang, X.; Tao, Y.; Li, J.; Li, X. Microorganism-regulated mechanisms of temperature effects on the performance of anaerobic digestion. Microb. Cell Fact. 2016, 15, 96. [Google Scholar] [CrossRef] [PubMed] [Green Version]
  30. Servio, P.; Englezos, P. Measurement of dissolved methane in water in equilibrium with its hydrate. J. Chem. Eng. Data 2002, 47, 87–90. [Google Scholar] [CrossRef]
  31. Chae, K.J.; Jang, A.; Yim, S.K.; Kim, I.S. The Effects of Digestion Temperature and Temperature Shock on the Biogas Yields from the Mesophilic Anaerobic Digestion of Swine Manure. Bioresour. Technol. 2008, 99, 1–6. [Google Scholar] [CrossRef]
  32. Reichert, P. AQUASIM 2.0-User Manual, Computer Program for the Identification and Simulation of Aquatic Systems; Switzerland Swiss Federal Institute for Environmental Science and Technology: Dübendorf, Switzerland, 1998. [Google Scholar]
Figure 1. Schematic diagram of applied up-flow anaerobic sludge bed reactor (UASB) reactor set-up.
Applsci 10 00136 g001
Figure 2. Anaerobic digestion model no.1 (ADM1) simulation scheme for Mode 1 and 2 simulations.
Applsci 10 00136 g002
Figure 3. Biogas flowrate during transitions between phases.
Applsci 10 00136 g003
Figure 4. Changes in acetate (Xac), sugar (Xsu), and fatty acid (Xfa) degrading organisms in the reactor during Mode 1 and Mode 2 simulations.
Applsci 10 00136 g004
Figure 5. Biogas flow rate when Kdis and Xc were used (Mode 1 simulation).
Applsci 10 00136 g005
Figure 6. Biogas flow rate when Kdis1, Kdis2, Xc1, and Xc2 were used (Mode 2 simulation).
Applsci 10 00136 g006
Figure 7. Particulate content in Mode 1 simulation.
Applsci 10 00136 g007
Figure 8. Particulate content in Mode 2 simulation.
Applsci 10 00136 g008
Table 1. Time, temperature, and feed types used during the experiment. RF—raw feed; CF—centrifuged feed.
ExperimentTime (days)Temperature (°C)Substrate
Phase 10–1135RF
Phase 211–2625RF
Phase 326–4525CF
Phase 445–6035CF
Table 2. Model settings for fast and slow disintegration parameters classified into fast and slow: ADM1 = anaerobic digestion model no.1.
VariableYield from DisintegrationValue
ModelADM1
f_ch_xc1Carbohydrates from complex particulates (fast)0.23050.2
f_ch_xc2Carbohydrates from complex particulates (slow)0.2305
f_li_xc1Lipids from complex particulates (fast)0.08050.25
f_li_xc2Lipids from complex particulates (slow)0.0805
f_pr_xc1Proteins from complex particulates (fast)0.1010.2
f_pr_xc2Proteins from complex particulates (slow)0.101
f_SI_xc1Soluble inerts from complex particulates (fast)0.07150.1
f_SI_xc2Soluble inerts from complex particulates (slow)0.0715
f_XI_xc1Particulate inerts from complex particulates (fast)0.01650.25
f_XI_xc2Particulate inerts from complex particulates (slow)0.0165
Table 3. Model settings for yield for acidogenesis. LCFA—long-chain fatty acid.
VariableYield from DegradationValue
ModelADM1
f_ac_aaAcetate from amino acids0.400.40
f_ac_suAcetate from sugars0.410.41
f_bu_aaButyrate from amino acids0.260.26
f_bu_suButyrate from monosaccharides0.130.13
f_fa_liLCFAs from lipids0.950.95
f_h2_aaHydrogen from amino acids0.060.06
f_h2_suHydrogen from monosaccharides0.190.19
f_pro_aaPropionate from amino acids0.080.05
f_pro_suPropionate from monosaccharides 0.270.27
f_va_aaValerate from amino acids0.230.23
Table 4. Model settings for input parameters. COD—chemical oxygen demand.
VariableDescription and UnitValue
input_Qin_dynFeed flow rate (m3/day)3.38 × 10−4
input_S_fa_inLong-chain fatty acids (kg COD∙m−3)2.0
input_S_aa_inAmino acids (kg COD∙m−3)2.83
input_S_IC_inTotal inorganic carbon (M)0.2
input_S_IN_inTotal inorganic nitrogen (M)0.2
input_S_I_inSoluble inert COD (kg COD∙m−3)2.3
input_S_su_inMonosaccharides (kg COD∙m−3)3.6
input_X_I_inParticulate inerts (kg COD∙m−3)2.7
Table 5. The average biogas flow rate of RF and CF samples.
SubstrateAverage Biogas Flow Rate (L/day)
ExperimentalSimulation
Mode 1Mode 2
25 °C35 °C25 °C35 °C25 °C35 °C
RF2.1 ± 0.53.7 ± 0.22.7 ± 0.32.6 ± 0.62.5 ± 0.43.0 ± 0.9
CF2.4 ± 0.23.3 ± 0.92.4 ± 0.12.5 ± 0.12.8 ± 0.04.7 ± 0.8
Table 6. Average methane yield of RF and CF samples. VSS—volatile suspended solids.
SubstrateMethane Yield
L CH4/g VSSL CH4/g CODtotalCODCH4/g CODtotal
25 °C35 °C25 °C35 °C25 °C35 °C
RF0.410.710.160.290.460.72
CF0.761.060.260.370.740.92
Table 7. Influent and effluent analysis of samples from the reactor fed raw and centrifuged manure. TS—total solids; VS—volatile solids; TDS—total dissolved solids; VDS—volatile dissolved solids; VFA—volatile fatty acids.
PropertyRFRF Effluent (Average)CFCF Effluent (Average)
25 °C 35 °C 25 °C 35 °C
TS (g/L)17.0 ± 3.012.0 ± 0.310.0 ± 0.012.0 ± 0.410 ± 0.38.7 ± 0.0
VS (g/L)10.0 ± 2.05.3 ± 0.34.2 ± 0.06.0 ± 14.6 ± 0.23.2 ± 0.0
TSS (g/L)9.4 ± 4.04.7 ± 0.63.0 ± 0.03.0 ± 0.43.5 ± 0.62.5 ± 0.0
VSS (g/L)7.0 ± 3.04.3 ± 0.42.9 ± 0.03.0 ± 0.33.2 ± 0.52.3 ± 0.0
TDS (g/L)8.0 ± 1.07.1 ± 0.07.0 ± 0.09.0 ± 0.56.7 ± 0.06.2 ± 0.0
VDS (g/L)3.0 ± 0.41.0 ± 0.01.3 ± 0.03.0 ± 0.41.4 ± 0.00.9 ± 0.0
CODtotal (g/L)24.0 ± 2.014 ± 2.46.7 ± 0.017.0 ± 0.29.8 ± 0.98.0 ± 0.0
CODsoluble (g/L)15.0 ± 2.06.5 ± 0.43.3 ± 0.013.0 ± 0.26.3 ± 0.34.0 ± 0.0
NH4+-N (g/L)1.9 ± 0.01.9 ± 0.01.5 ± 0.01.7 ± 0.11.9 ± 0.01.8 ± 0.0
pH7.0 ± 0.28.1 ± 0.18.4 ± 0.17.0 ± 0.38.2 ± 0.18.1 ± 0.1
Acetic acid (g/L)4.0 ± 1.01.1 ± 0.10.4 ± 0.03.0 ± 0.11.0 ± 0.20.2 ± 0.0
Propionic acid (g/L)1.0 ± 0.70.7 ± 0.30.1 ± 0.01.0 ± 0.31.0 ± 0.0LD 1
VFAtotal (g/L)6.0 ± 1.01.9 ± 0.30.5 ± 0.06.0 ± 22.0 ± 0.20.2 ± 0.0
1 LD: less than the detection limit.
Table 8. Removal efficiencies of the reactor (based on g/L measurements in Table 7).
PropertyAverage Removal (%)
Raw FeedCentrifuged Feed
25 °C 35 °C 25 °C 35 °C
TS31421729
VS47582347
TSS5068−1616
VSS4261−1917
TDS892833
VDS60485873
CODtotal 44734354
CODsoluble 58795068
VFAtotal 70916797

