Applications of Capacitive Imaging in Human Skin Texture and Hair Analysis


1
School of Engineering, London South Bank University, 103 Borough Road, London SE1 0AA, UK
2
Biox Systems Ltd., Technopark Building, 90 London Road, London SE1 6LN, UK
*
Authors to whom correspondence should be addressed.
†
These authors contributed equally to this work.
Appl. Sci. 2020, 10(1), 256; https://0-doi-org.brum.beds.ac.uk/10.3390/app10010256
Submission received: 1 August 2019
/
Revised: 21 December 2019
/
Accepted: 24 December 2019
/
Published: 29 December 2019
(This article belongs to the Special Issue Texture and Colour in Image Analysis)
Abstract
:This article focuses on the extraction of information from human skin and scalp hair for evaluation of a subject’s condition in the cosmetic and pharmaceutical industries. It uses capacitive images from existing hand-held research equipment and it applies image processing algorithms to expand their possible applications. The literature review introduces the readers into the field of skin research, and it highlights pieces of information that can be extracted by in vivo skin and ex vivo hair measurements. Then, the selected scientific equipment is presented, and Maxwell-based electrostatic simulations are employed to evaluate the measurement apparatus. Image analysis algorithms are suggested for (a) the detection of polygons on the human skin texture, (b) the estimation of wrinkles length and (c) the observation of hair water sorption capabilities by capacitive imaging systems. Finally, experiments are conducted to evaluate the performance of the presented algorithms and the results are compared with the literature. The results indicate that capacitive imaging systems can be used for skin age classification, detection and tracking of skin artifacts (e.g., wrinkles, moles or scars) and calculation of water content in hair samples.
1. Introduction
The electrical properties of skin and hair alongside their texture and anatomy provide information about a person’s health, efficiency of drug delivery and effects from application of cosmetic products. For these reasons, scientists from a variety of fields use non-invasive instruments to extract such information and achieve experimental results that strengthen their research. As part of this introduction, selected publications are illustrating the above points right after a summary of human skin structure and hair anatomy. Then, the use of capacitive imaging in various research fields is demonstrated by summarizing selected research in the literature.
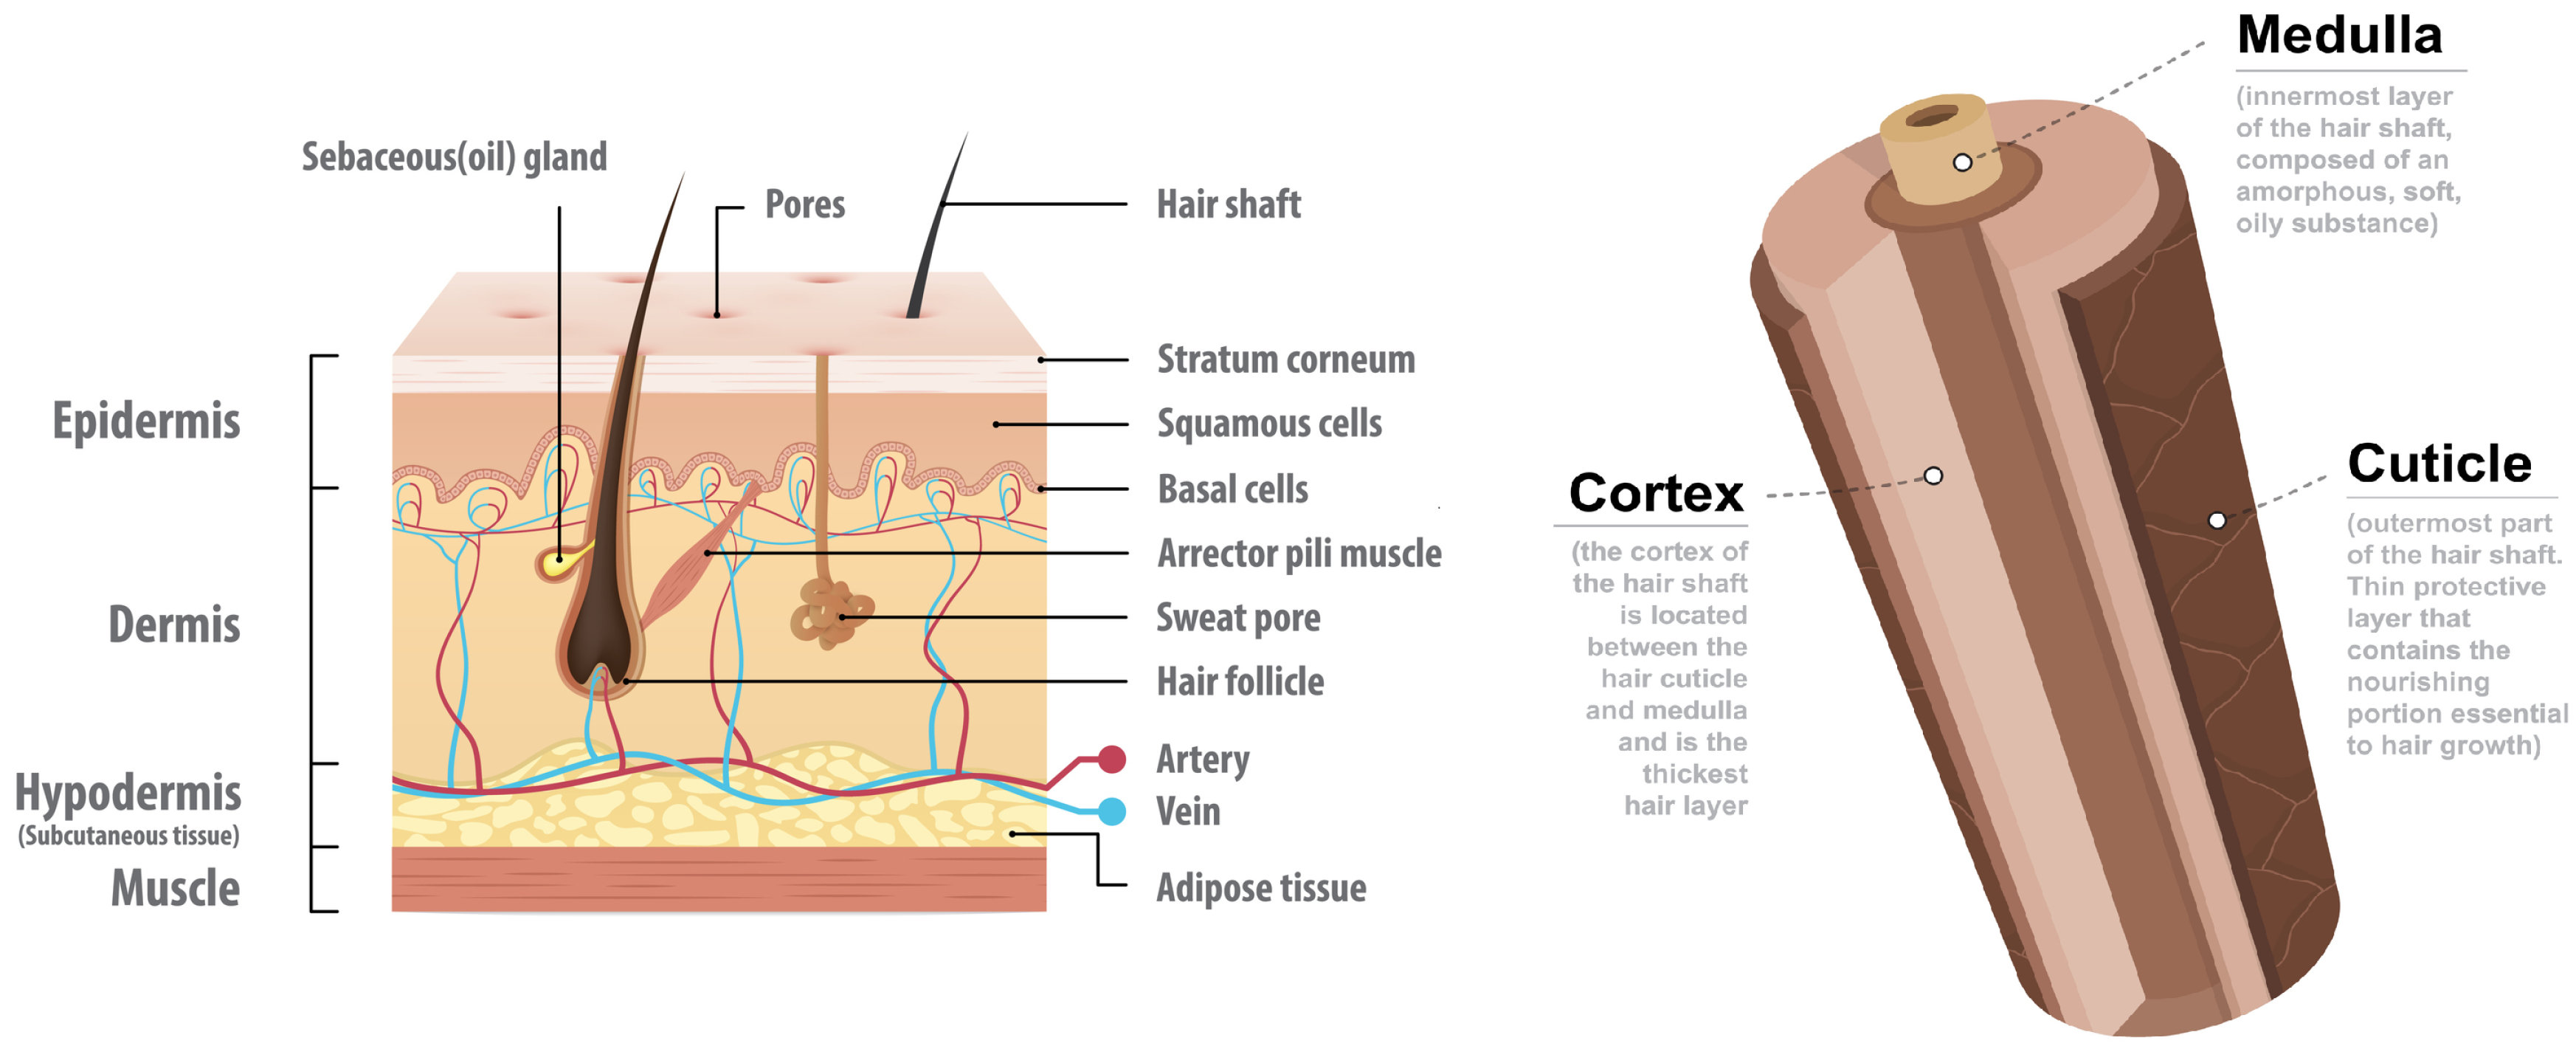
The skin is the largest human organ in terms of surface area and its thickness varies from 5 μm to 1 mm (or more) in different areas of the body [1]. It protects internal organs from environmental influences, and it regulates the water body loss. As illustrated in Figure 1 (left), the skin is separated into three main layers: epidermis, dermis and subcutis. Among other functions, the epidermis provides chemical and diffusion protection, the dermis protects from external mechanical forces and the subcutis connects the skin to the underlying tissue [1]. The outermost sublayer, target of non-invasive instruments, is called stratum coreum and consists mainly of dead keratinocytes. The textural information of this layer, or skin microrelief, is affected by the internal body health, age and living habits as well as by environmental influences [2]. The visible part of hair (Figure 1 right) is shaped as a three-layered shaft of dead protein filament: the cuticle, cortex and medulla [3]. The cuticle is a thin surrounding layer of roof tiles-like structures with about five degrees inclination from the hair shaft core. The cortex is the thickest layer of the hair, it consists of tightly packed keratin cells and it is responsible for the hair color as well as most of the water holding capabilities. Last, the medulla is a soft unstructured keratin that forms the core in the thicker human hair (e.g., scalp hair) [4].
In the literature, a variety of methods have been used to extract information from the human skin surface. Zhang et al. [7] used a capacitive imaging system to measure solvent concentration and penetration in human skin to demonstrate how such a system can support skin clinical trial studies. In the same work, skin damage by intense washing, tape stripping and SLS irritation was characterized. In the area of skin aging analysis, Corcuff et al. [8] studied the skin furrow response during arm extension based on image analysis of negative skin replicas. They provided evidence that younger people can buffer skin strain between primary and secondary line orientations while elderly subjects tend to have furrows only in one orientation that rotate during extension. In more recent years, Zahouani et al. [9] achieved better classification between primary and secondary skin lines by measuring their depth using three-dimensional confocal microscopy. Experimental results on 120 Caucasian women confirmed that secondary lines fade with age while the depth of primary lines increases. A different approach of evaluating skin aging was employed by [10,11], where the surface area of polygons shaped between skin furrow was measured and it was found to associate well with subjects’ chronological age.
As illustrated for the area of skin research, hair samples are also analyzed by scientists to detect health and cosmetic conditions. Wosu et al. [12] reviewed 39 studies that associate hair cortisol concentrations to stress psychiatric symptoms and disorders. This approach was found to be more accurate in detecting long-term stress because cortisol concentration measurements from blood, urine and saliva samples are influenced by living habits and environment conditions. Furthermore, Kristensen et al. [13] used hair samples from 266 women to determine that hair dyeing and frequent washing does not affect cortisol measurements. In a different scientific field, Boll et al. [14] employed ATR FT-IR spectroscopy to differentiate between dyed and undyed hair. Such information can be used in forensic hair analysis, given their static classification was found to be accurate in detecting whether a sample is dyed or not, but also in identifying the brand and the color of the dye. In the field of cosmetic science, Barba et al. [15] used thermogravimetric methodology to measure the water content of hair and to assess hair damage from bleaching and straightening. They found that bleached hair shown reduced water holding capabilities while the straighten hair .
In this work, a capacitive imaging system is used to extract information from skin and hair samples. To the best of our knowledge, Lévêque and Querleux [16] first used this technology for human skin characterization and surface hydration mapping in 2003. They used a fingerprint system to measure the distribution of skin surface capacitance in different body sites, to detect main microrelief orientation and density as well as to support the system’s usability in the field of skin research by performing side-by-side experiments with Corneometer CM812. Later on, Batisse et al. [17] demonstrated advantages of such technology over other skin hydration apparatuses by pointing out the importance of visually observing the contact of a capacitive sensor with the skin during lips moisturization and volar forearm inflammation experiments. Since then, capacitive imaging systems have been used in order to examine various skin conditions e.g., mapping of psoriasis and acne lesions, assessment of sun exposure, skin aging, damage or irritation [18,19,20,21,22]. Furthermore, it is worth mentioning successful attempts to improve the capacitive imaging technology. Bevilacqua and Gherardi [23] achieved depth profiling up to 50 μm by fusing the image with pressure information monitored by a subsystem attached on the back of the measurement apparatus. Also, Huang et al. developed a wearable capacitive imaging system using an “ultrathin, stretchable sheets with arrays of embedded impedance sensors for precise measurement and spatially multiplexed mapping” [24].
In the following sections, the measurement principle of capacitive imagining for non-invasive skin and hair measurements is analyzed. Then, image processing algorithms are suggested to extract quantitative values from skin and hair samples. Finally, three experiments are conducted to evaluate both the imaging system but also the integrity of the selected algorithms.
2. Materials and Methods
2.1. Measurement Apparatus
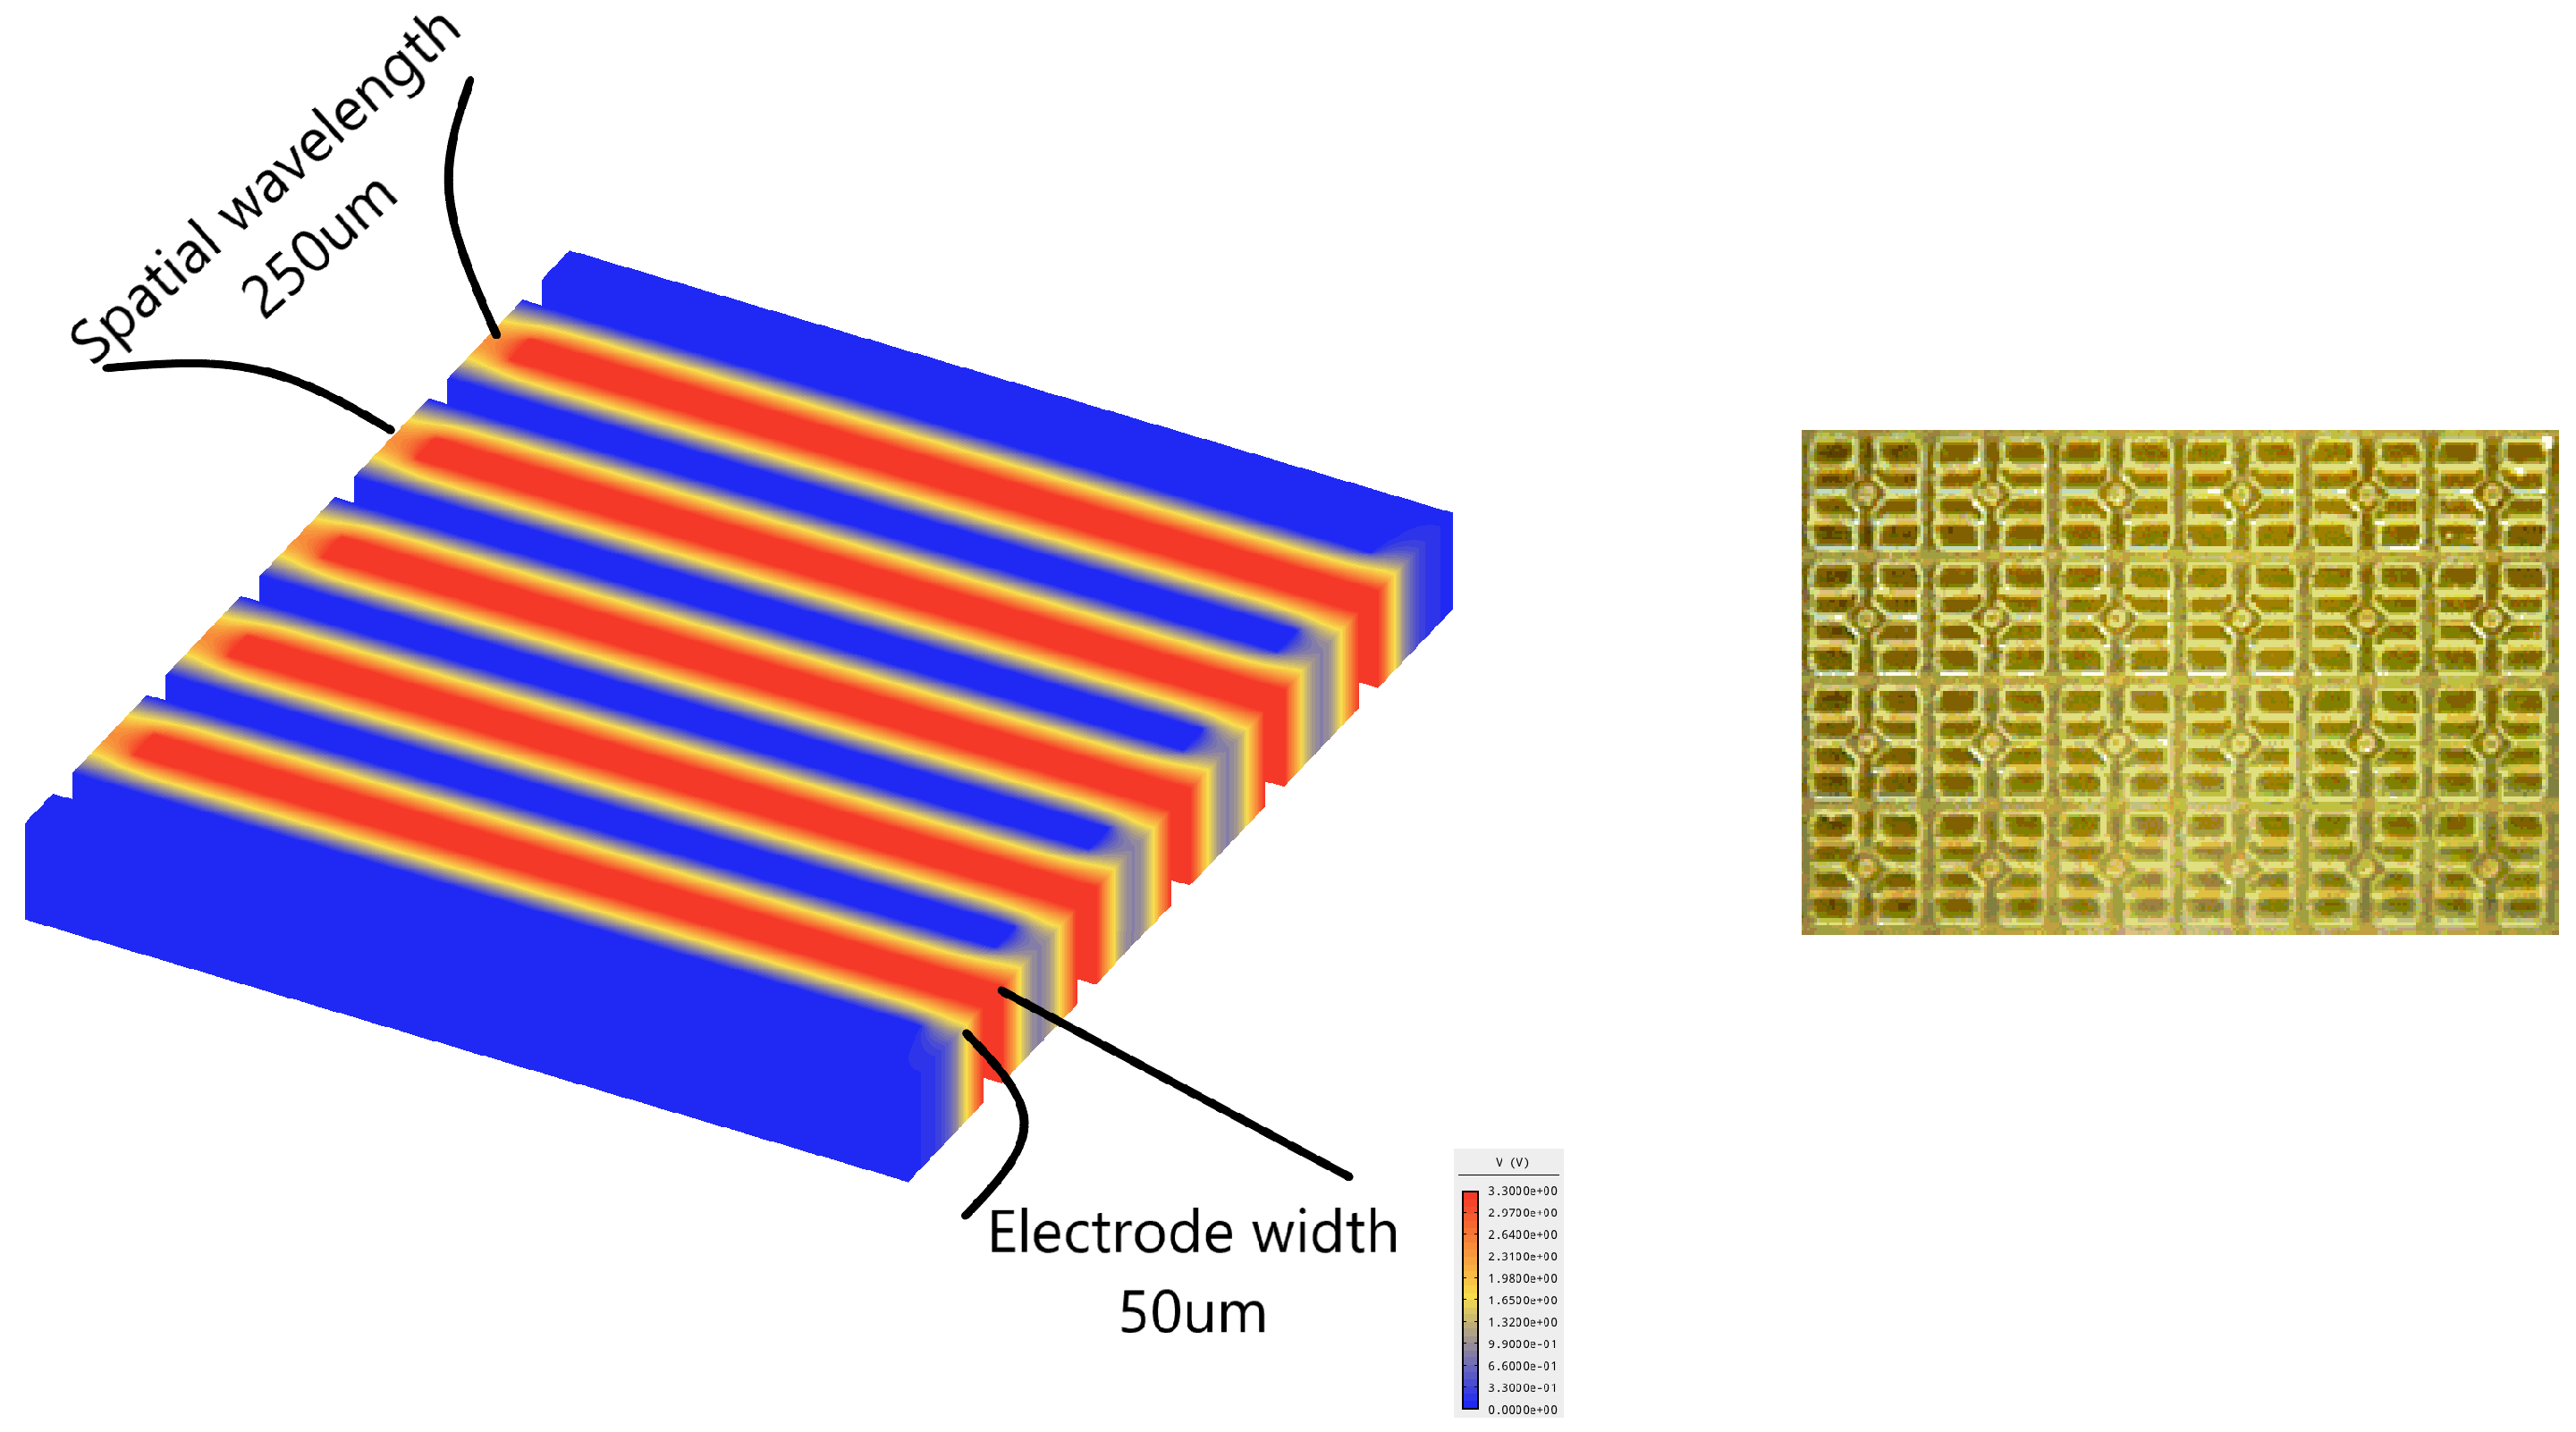
To capture hydration information in pharmaceutical and cosmetic industries non-invasive capacitance sensing systems are employed. In the field of skin research, the most widely known single pixel capacitive system is the Corneometer® CM825 (Courage+Khazaka, Cologne, Germany) [25]. This instrument has a 7 × 7 mm sensor in interdigital electrode geometry with 250 μm spatial wavelength and 50 μm electrode width (Figure 2). Its sensor is covered with a 20 μm thick layer of glass for galvanic contact protection [26]. The capacitive imaging sensors are based on the same technology with Corneometer and they are widely known as fingerprint sensors. Their sensing surface consists of a two-dimensional array of miniaturized capacitive pixels that capture the hydration map of the sample. In this work the Epsilon E100 (Biox Systems Ltd., London, UK) [27] is used. It has a sensing surface of 12.8 × 15 mm filled with 300 × 256 pixels and a 2 μm coat of silicon dioxide for galvanic contact protection. The accompanying software exports hydration information in a format of color-coordinated images. In those images, brighter pixels denote higher while darker pixels denote lower hydration levels.
2.2. Measurement Depth Simulation
In capacitive measurements, the image resolution and sensitivity are important as well as the measurement depth. For in vivo skin measurements, the penetration depth of the electric field should not exceed the thickness of stratum corneum, which consists of dead and keratinized cells [1]. Otherwise, the pixel readouts will saturate because of the higher conductance in deeper skin layers. By contrast, in hair measurements the depth should be sufficient to reach the medulla to capture information from all layers in the hair shaft. In this work, the measurement depth is defined as the distance from the sensor surface for which the electric potential drops by 97%. To the best of our knowledge, this comes in agreement with experimental and theoretical results achieved by Huanyu Cheng et al. [29], where the system capacity is used as a reference instead of the electric potential. Of course, in either approach, the system response changes with the hydration level of the sample, so the penetration depth of the electric field varies accordingly. In order to evaluate the performance of Epsilon E100, the penetration depth for different insulating materials is simulated using Maxwell’s equations for both E100 and CM825 and the results are compared.
A property of electromagnetics is that Maxwell’s equations are linear. As a result, we can refer to an arbitrary distribution of charges by simple addition of the relevant contributions. In the case of interdigital sensors, such as Corneometer, for the charge distribution residing on a strip , the electric potential at an arbitrary point is given by the expression in Equation (1). The simulation defined 6 driving and 5 sensing rectangular electrodes in the dimensions provided by CM825 literature. The electric potential was calculated for points on a line segment from the surface of the middle driving electrode to 60 μm perpendicular displacement.
where:
| = the electric potential |
| = the surface charge density and |
| = the dielectric of the insulating material under examination |
In the case of annular or disk sensors, such as Epsilon E100, Equation (2) calculates the electric potential in any given point perpendicular to the center of the electrode. For the purpose of this simulation, one driving electrode disk and one sensing electrode ring were used. The electric potential was measured from the center of the sensor surface to 60 μm distance on a perpendicular line segment.
where:
| = the outer electrode radius |
| = the inner electrode radius |
| z = the perpendicular point distance from the center of the sensor surface |
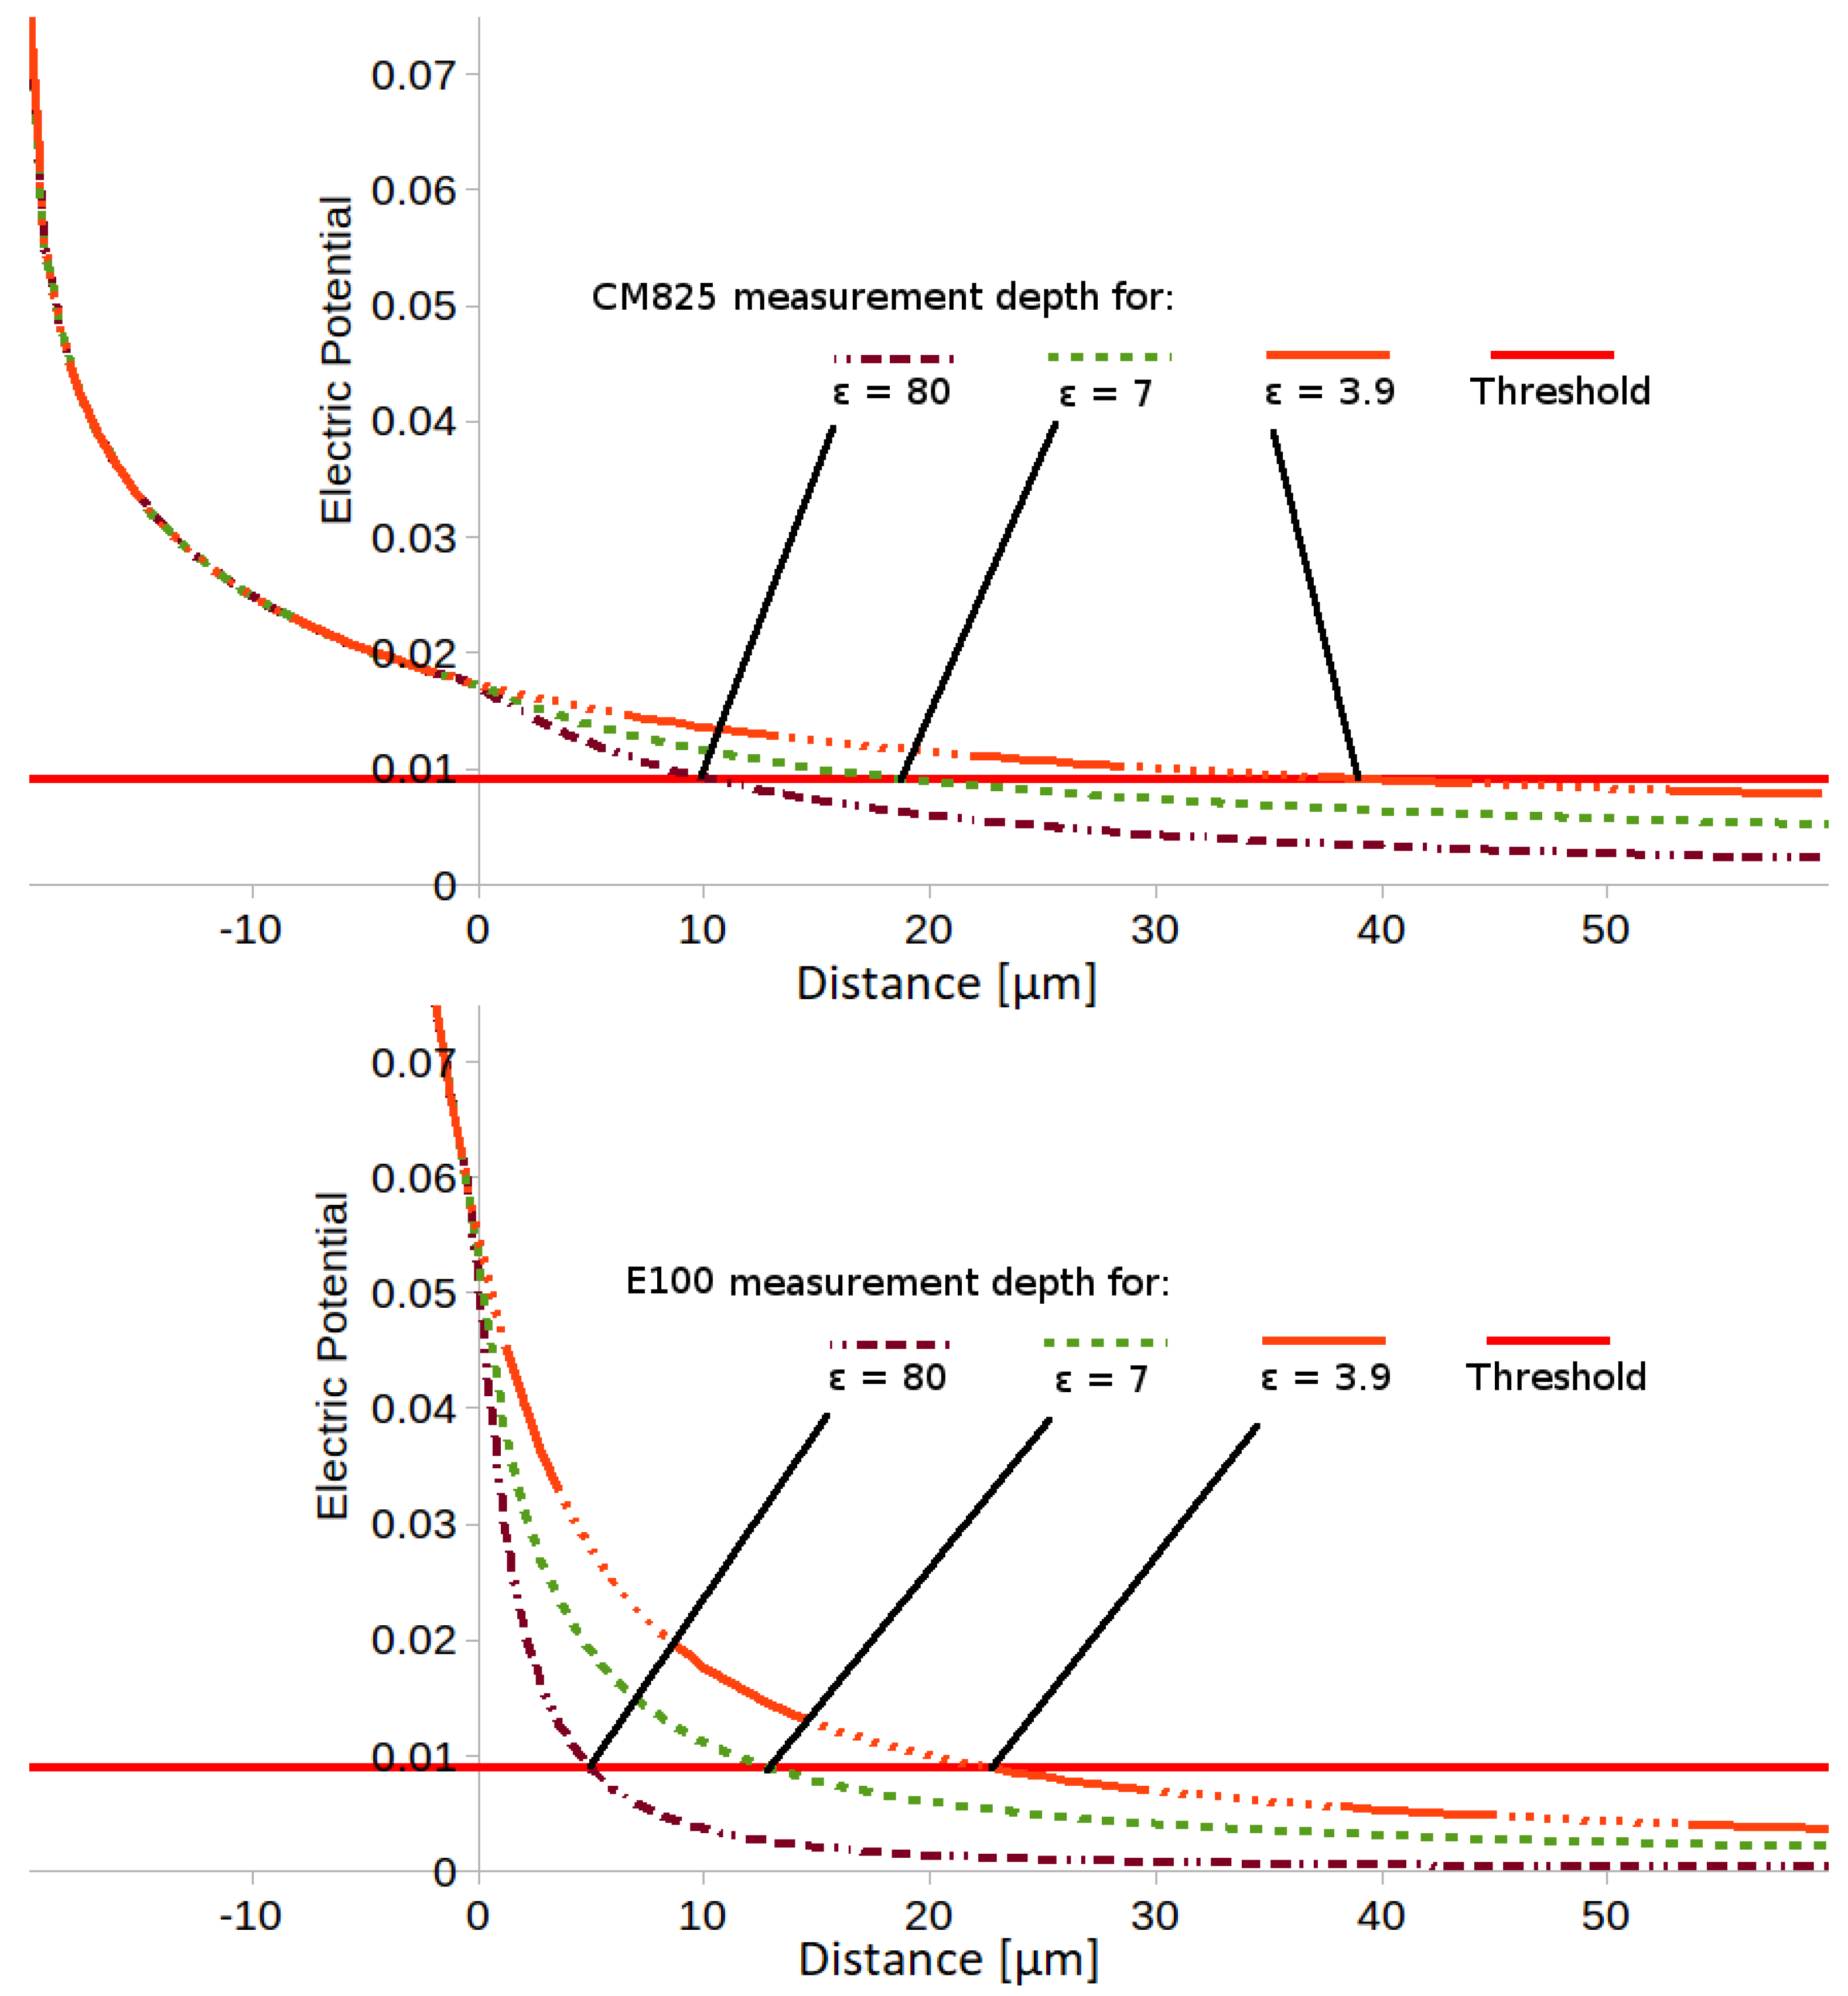
The hydration level of the samples is simulated by changing the dielectric permittivity parameter (). The latter ranges from 1 to 80.1 in 20 °C, where higher value denotes more hydrated samples. For both instruments, the dielectric permittivity of the protective layers is assumed 3.9 and the simulation is repeated for samples with dielectric permittivity of 80, 7 and 3.9. The simulation results in Figure 3 show the Corneometer CM825 measurement depth ranges from 10 to 40 μm, while for Epsilon E100 from 5 to 22 μm. Assuming that stratum corneum thickness is between 10 μm and 40 μm, the results validate that both instruments are appropriate for human skin measurements with Corneomenter with greater penetration depth. On hair measurements, assuming sample thickness 70–150 μm, both instruments have insufficient penetration depth but still reach fraction of the cortex layer.
2.3. Analysis of Capacitive Image
In this section, image processing algorithms are applied on skin and hair capacitive images to demonstrate how texture and color information can be used in cosmetic and pharmaceutical industries. More specifically, algorithms are presented: (a) to detect the average surface area of skin polygons and associate the results with the chronological age of the subject, (b) to estimate the length of skin furrows and track progression over the course of time and (c) to calculate the water content and loss rate in human hair.
2.3.1. Skin Polygons Detection
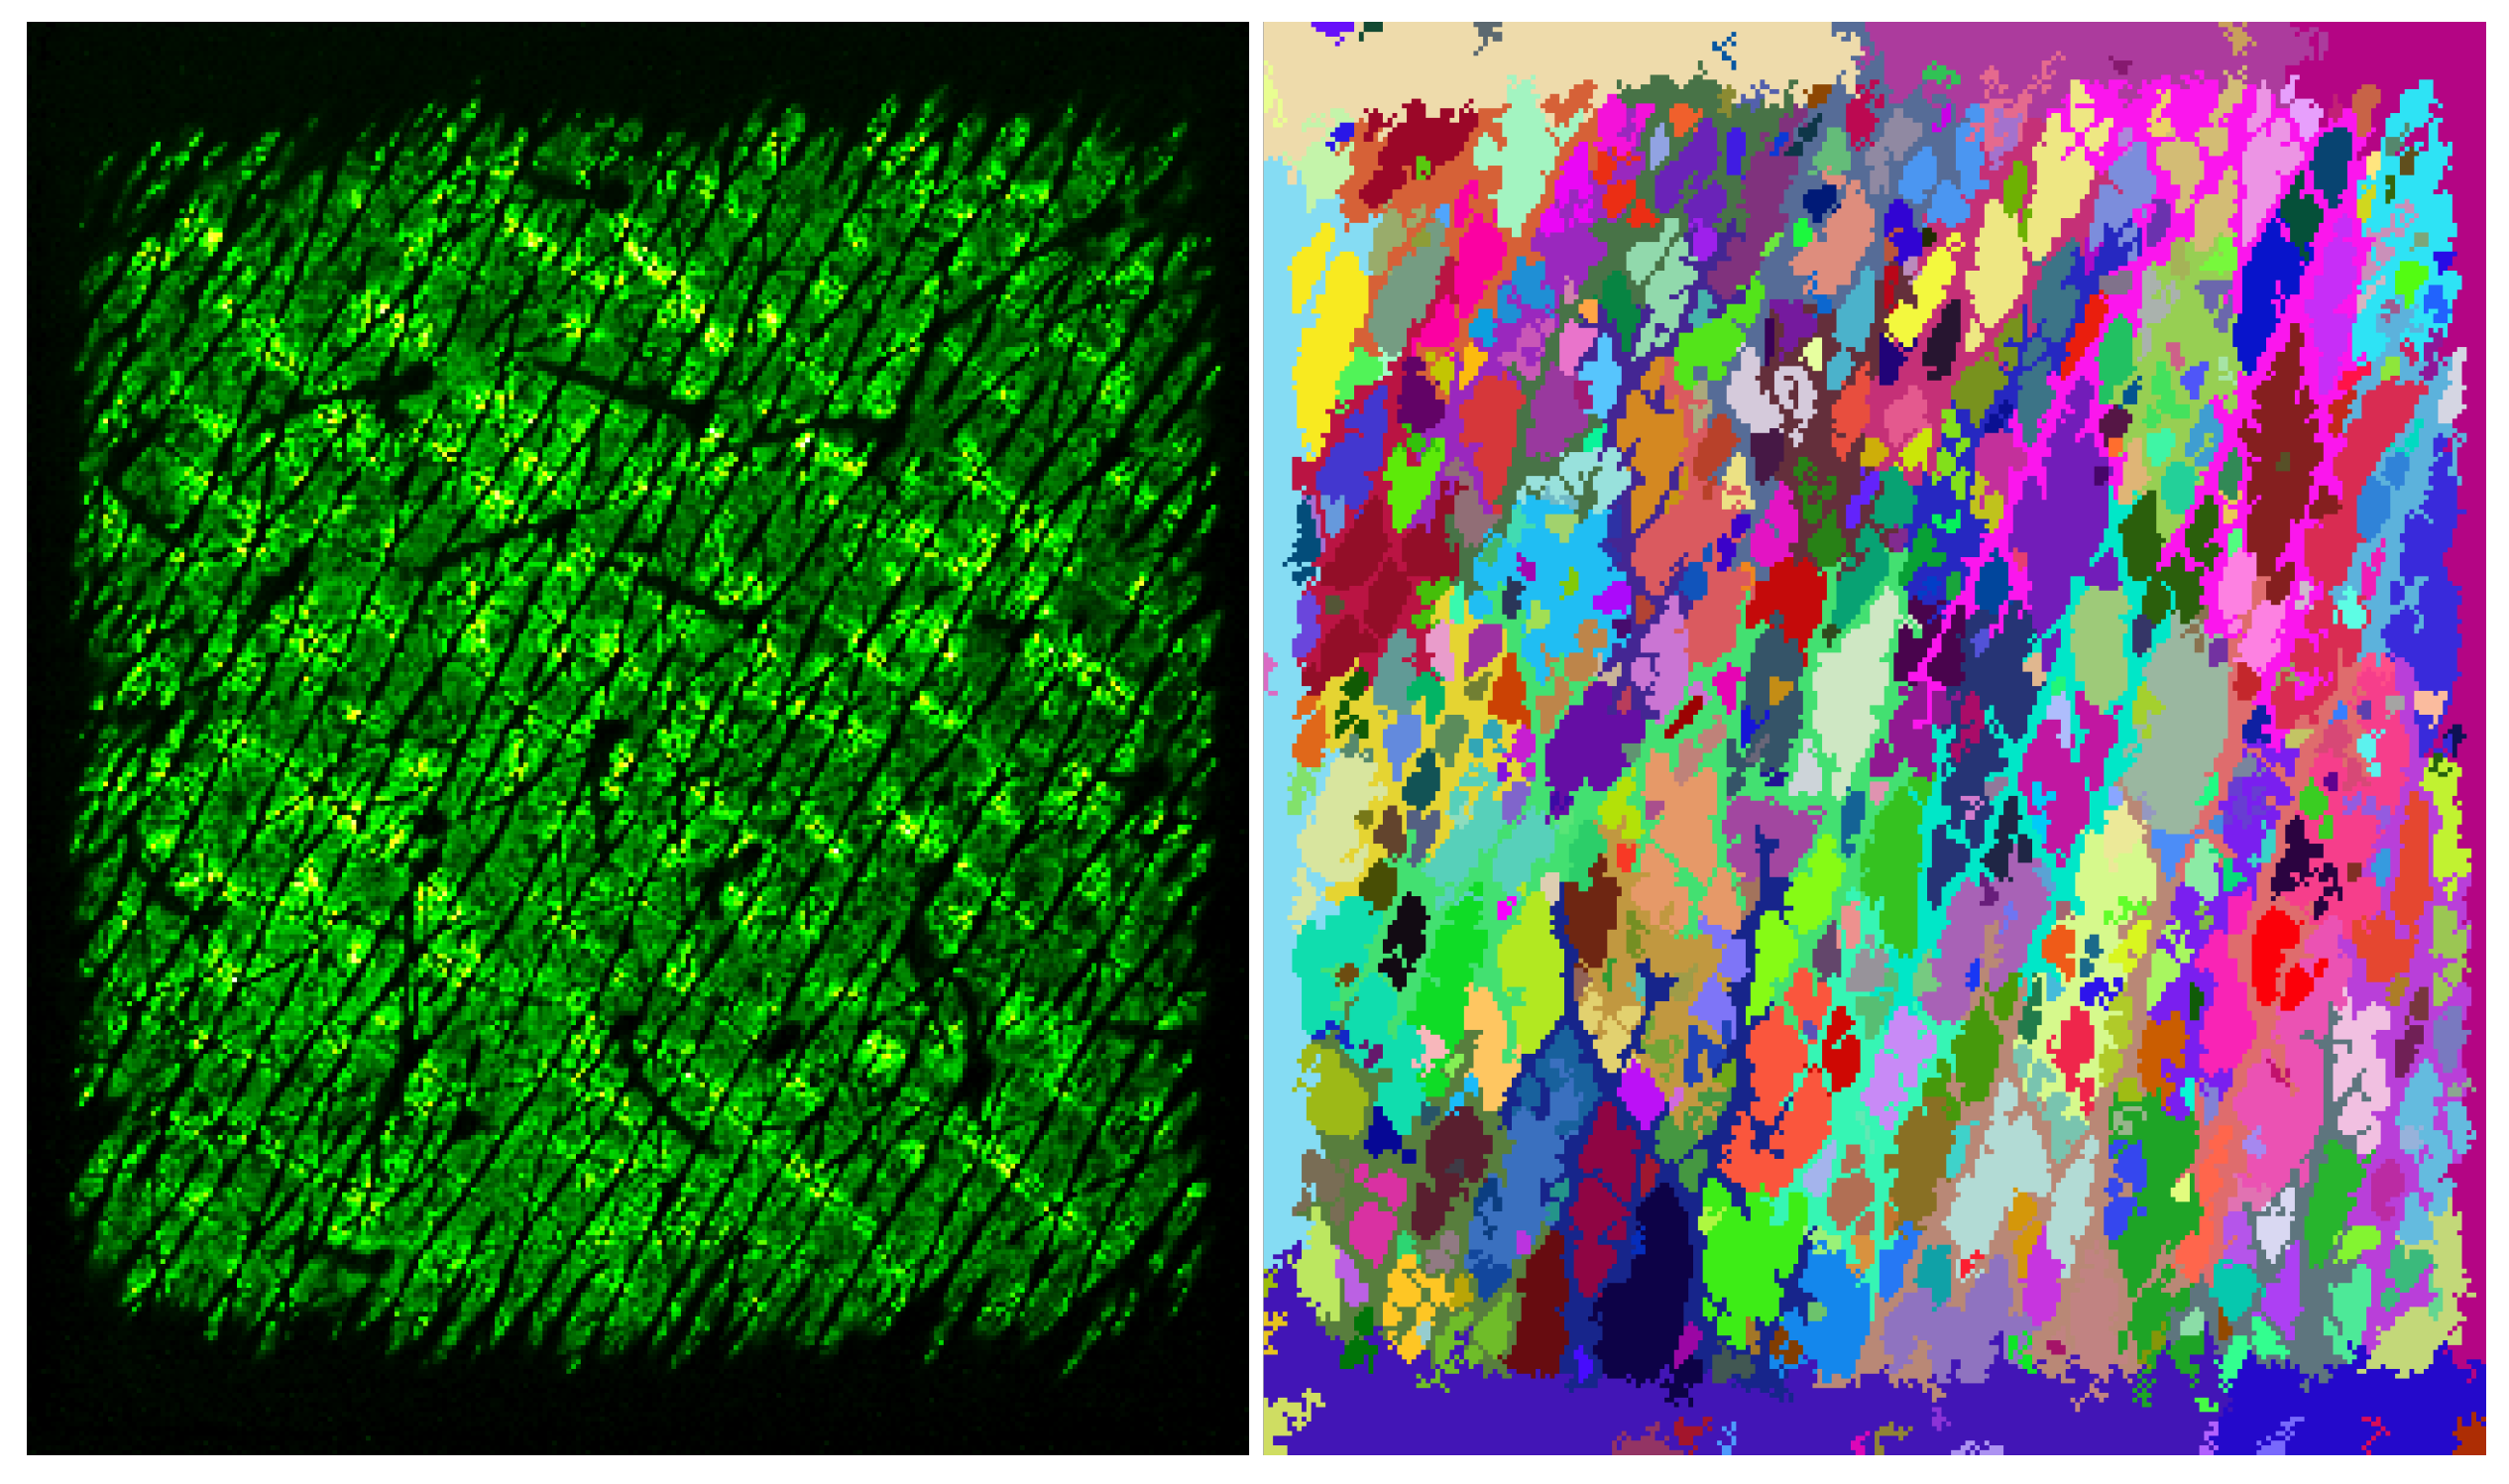
The human skin texture is highly inhomogeneous, and it worsens with age because the elasticity fibers network is weakening and the strain is not buffered efficiently [8,9]. Therefore, in order to detect the skin polygons across a wide range of age groups, a segmentation algorithm is required that focuses only on pixels in contact with the skin, it suppresses wrinkles until they become sizeless and it does not need predefined seeds. According to [30], segmentation algorithms may be separated into two categories, the graph-based and gradient-based segmentation. In graph-based segmentation, weights are calculated for each pair of neighboring pixels and superpixels are identified by minimizing a cost function. As it is illustrated in Figure 4, graph-based segmentation algorithms are not fit for this application because they do not suppress skin furrow.
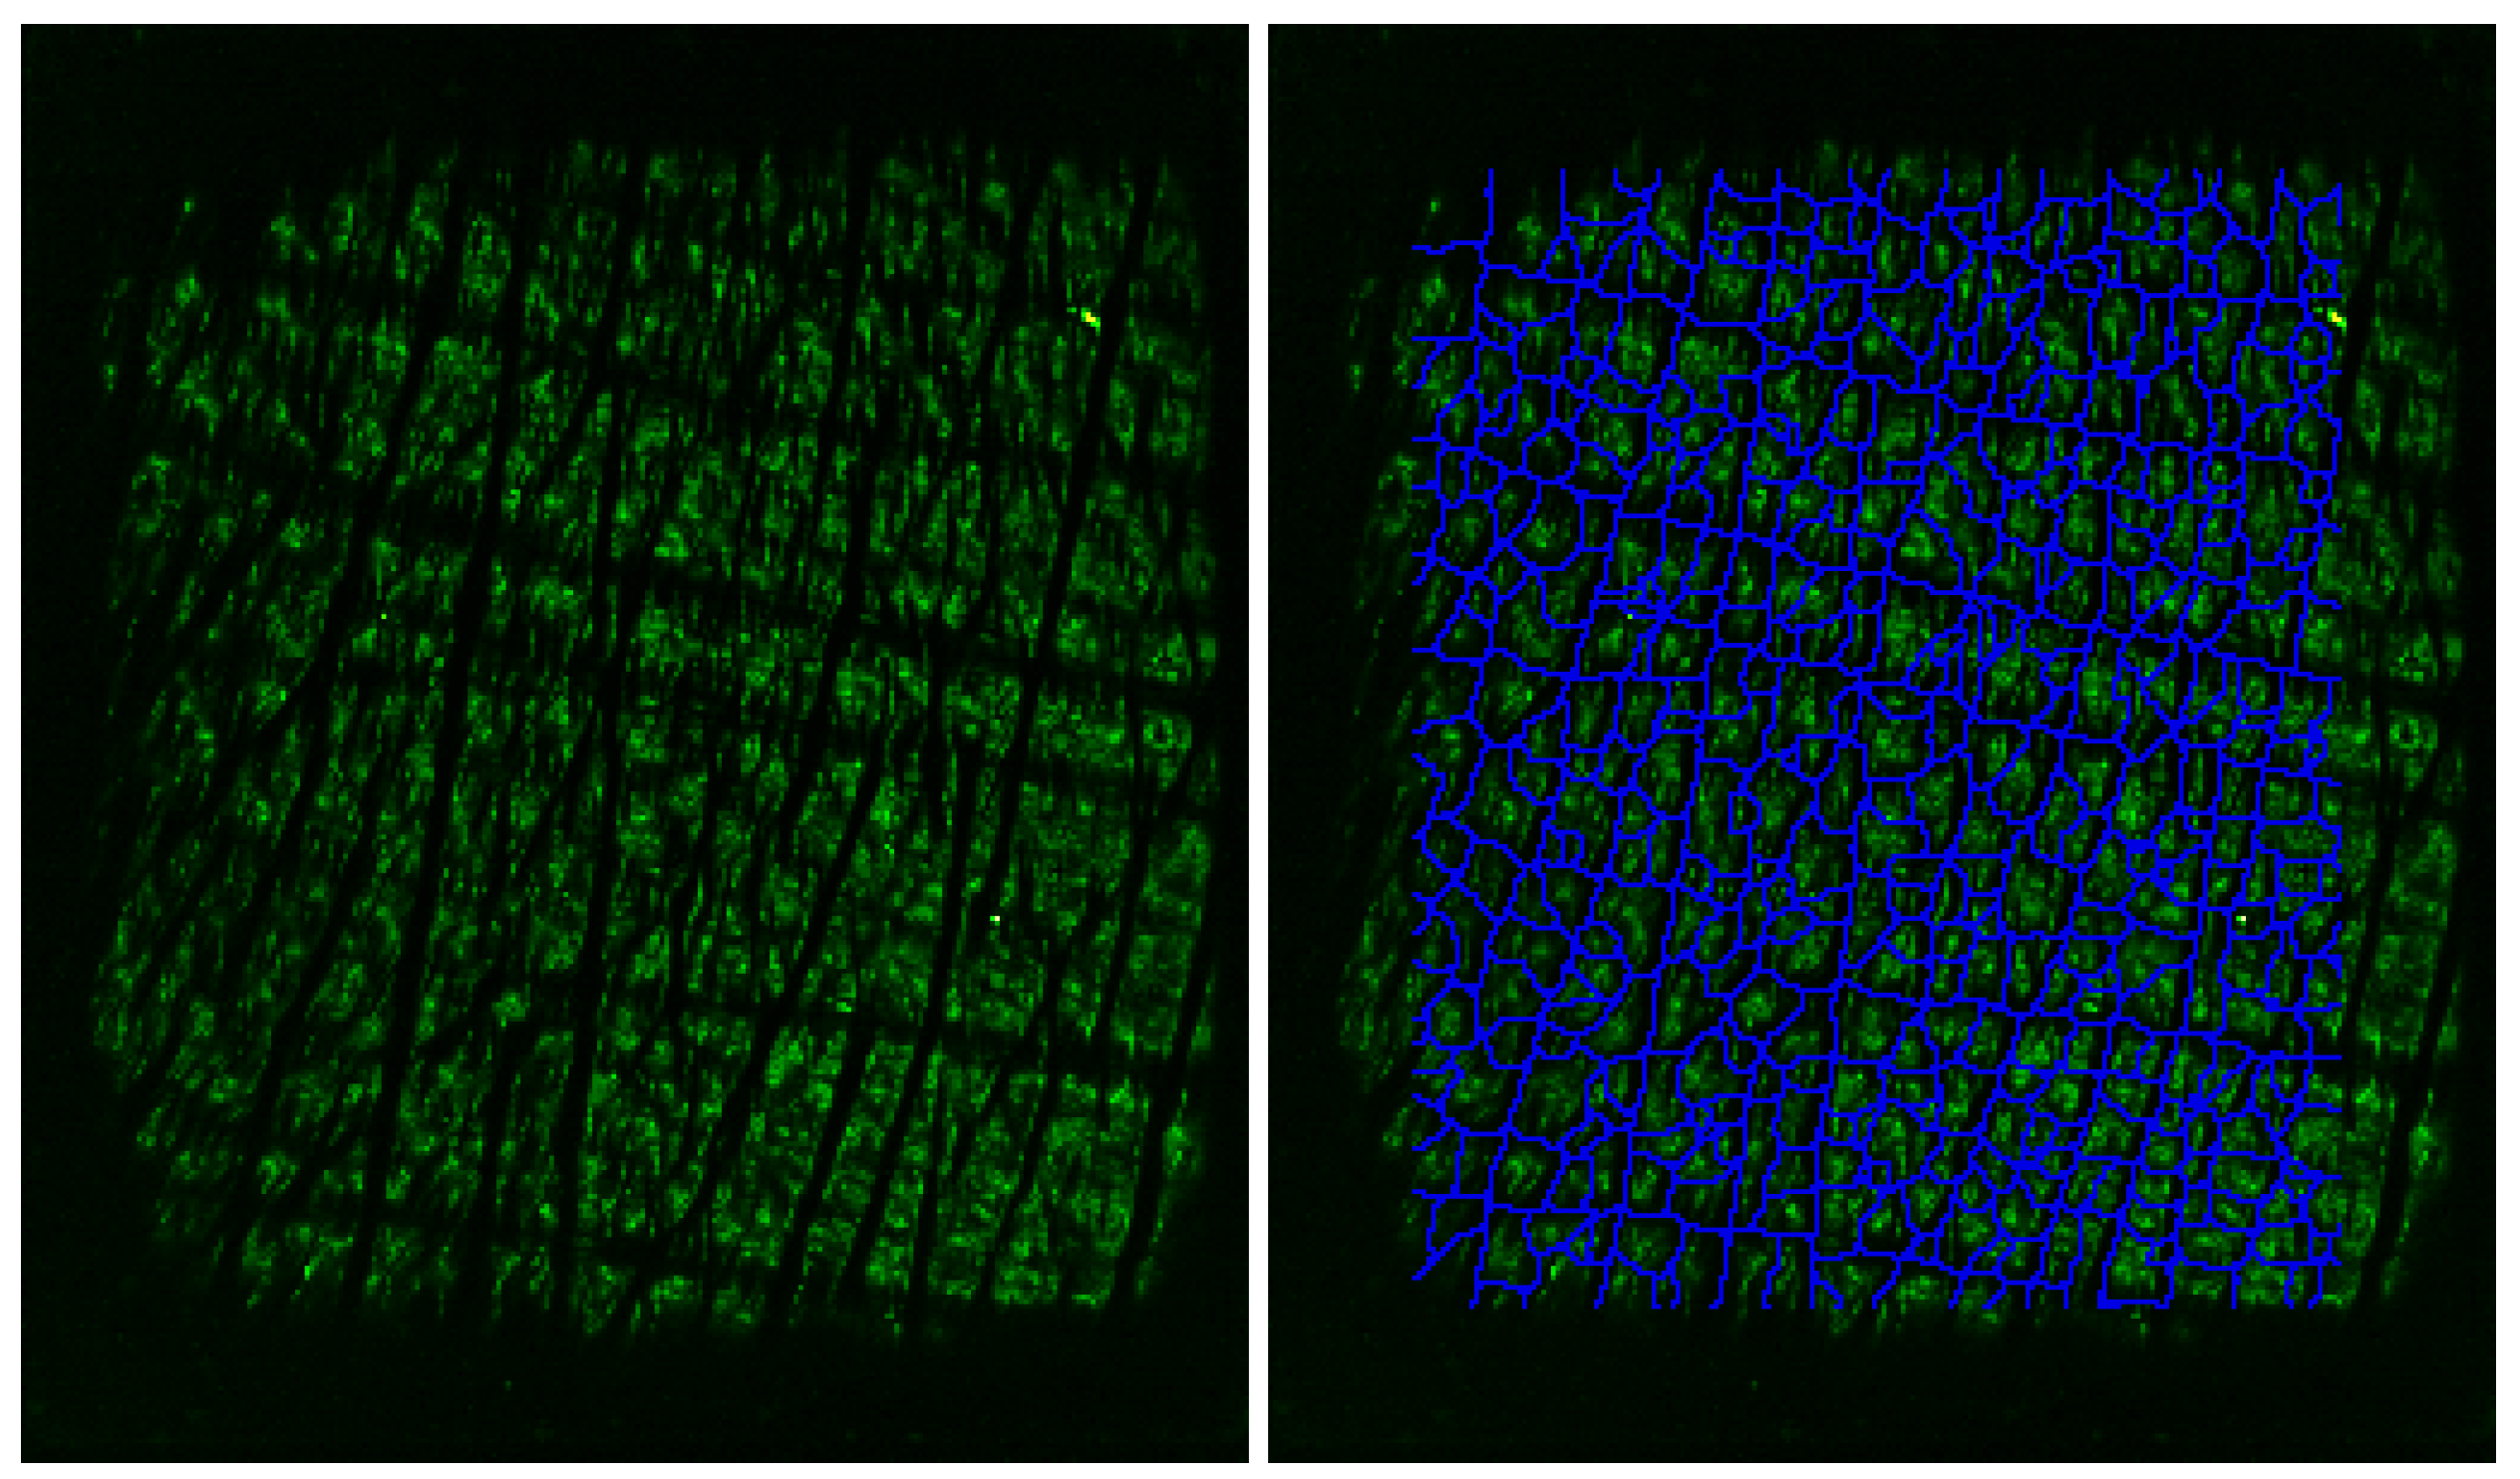
To the best of our knowledge, Bevilacqua A. and Gherardi A. [18] first apply the gradient-based segmentation algorithm by Vincent and Soille [32] on skin capacitive images. In order to cope with pixel noise and skin hydration inhomogeneity, the frames are pre-processed with a normalization filter. This filter controls the over-/under-segmentation of the sample but given the vast skin texture variety between subjects and sites a global configuration for absolute polygons’ count is not feasible. Thus, the reliability of this approach is experimentally strengthened by calculating the correlation between polygons density and subject age and comparing the results with these reported in the literature using manual polygons’ count [33]. An example output of this segmentation algorithm is shown in Figure 5.
2.3.2. Feature Length Estimation
Lévêque and Querleux [16] applied the Gray Level Co-Occurrence Matrix (GLCM) on capacitive images to calculate the angle between primary and secondary skin lines in the area of volar forearm and estimate the age of the subject. While this measurement apparatus has shown poor performance in calculating the skin anisotropy index compared to 3D confocal microscopy due to lack of depth profiling, it does not restrict the application on 2D feature extraction [33]. The GLCM is calculated by Equation (3) [34].
where:
| = Greyscale level |
| = Kronecker delta |
| = I(x,y) |
| = I(x + dcos, y + dsin) |
In this study, the greyscale levels of the image are reduced from 256 to three (i.e., below, target and over), with the drawback of reducing classification capabilities [35], to strengthen the correlation between pixels within the target level. The length of the target feature towards any discrete orientation is estimated by the displacement value d for which approaches zero (). The feature length is converted from pixels to SI units using the sensor DPI from the instrument’s specification (i.e., 50 μm). Of course, selecting a region of interest to eliminate effects from neighboring areas and using repositioning algorithms between frames to track the same wrinkle over the course of time are required [7].
2.3.3. Hair Water Content
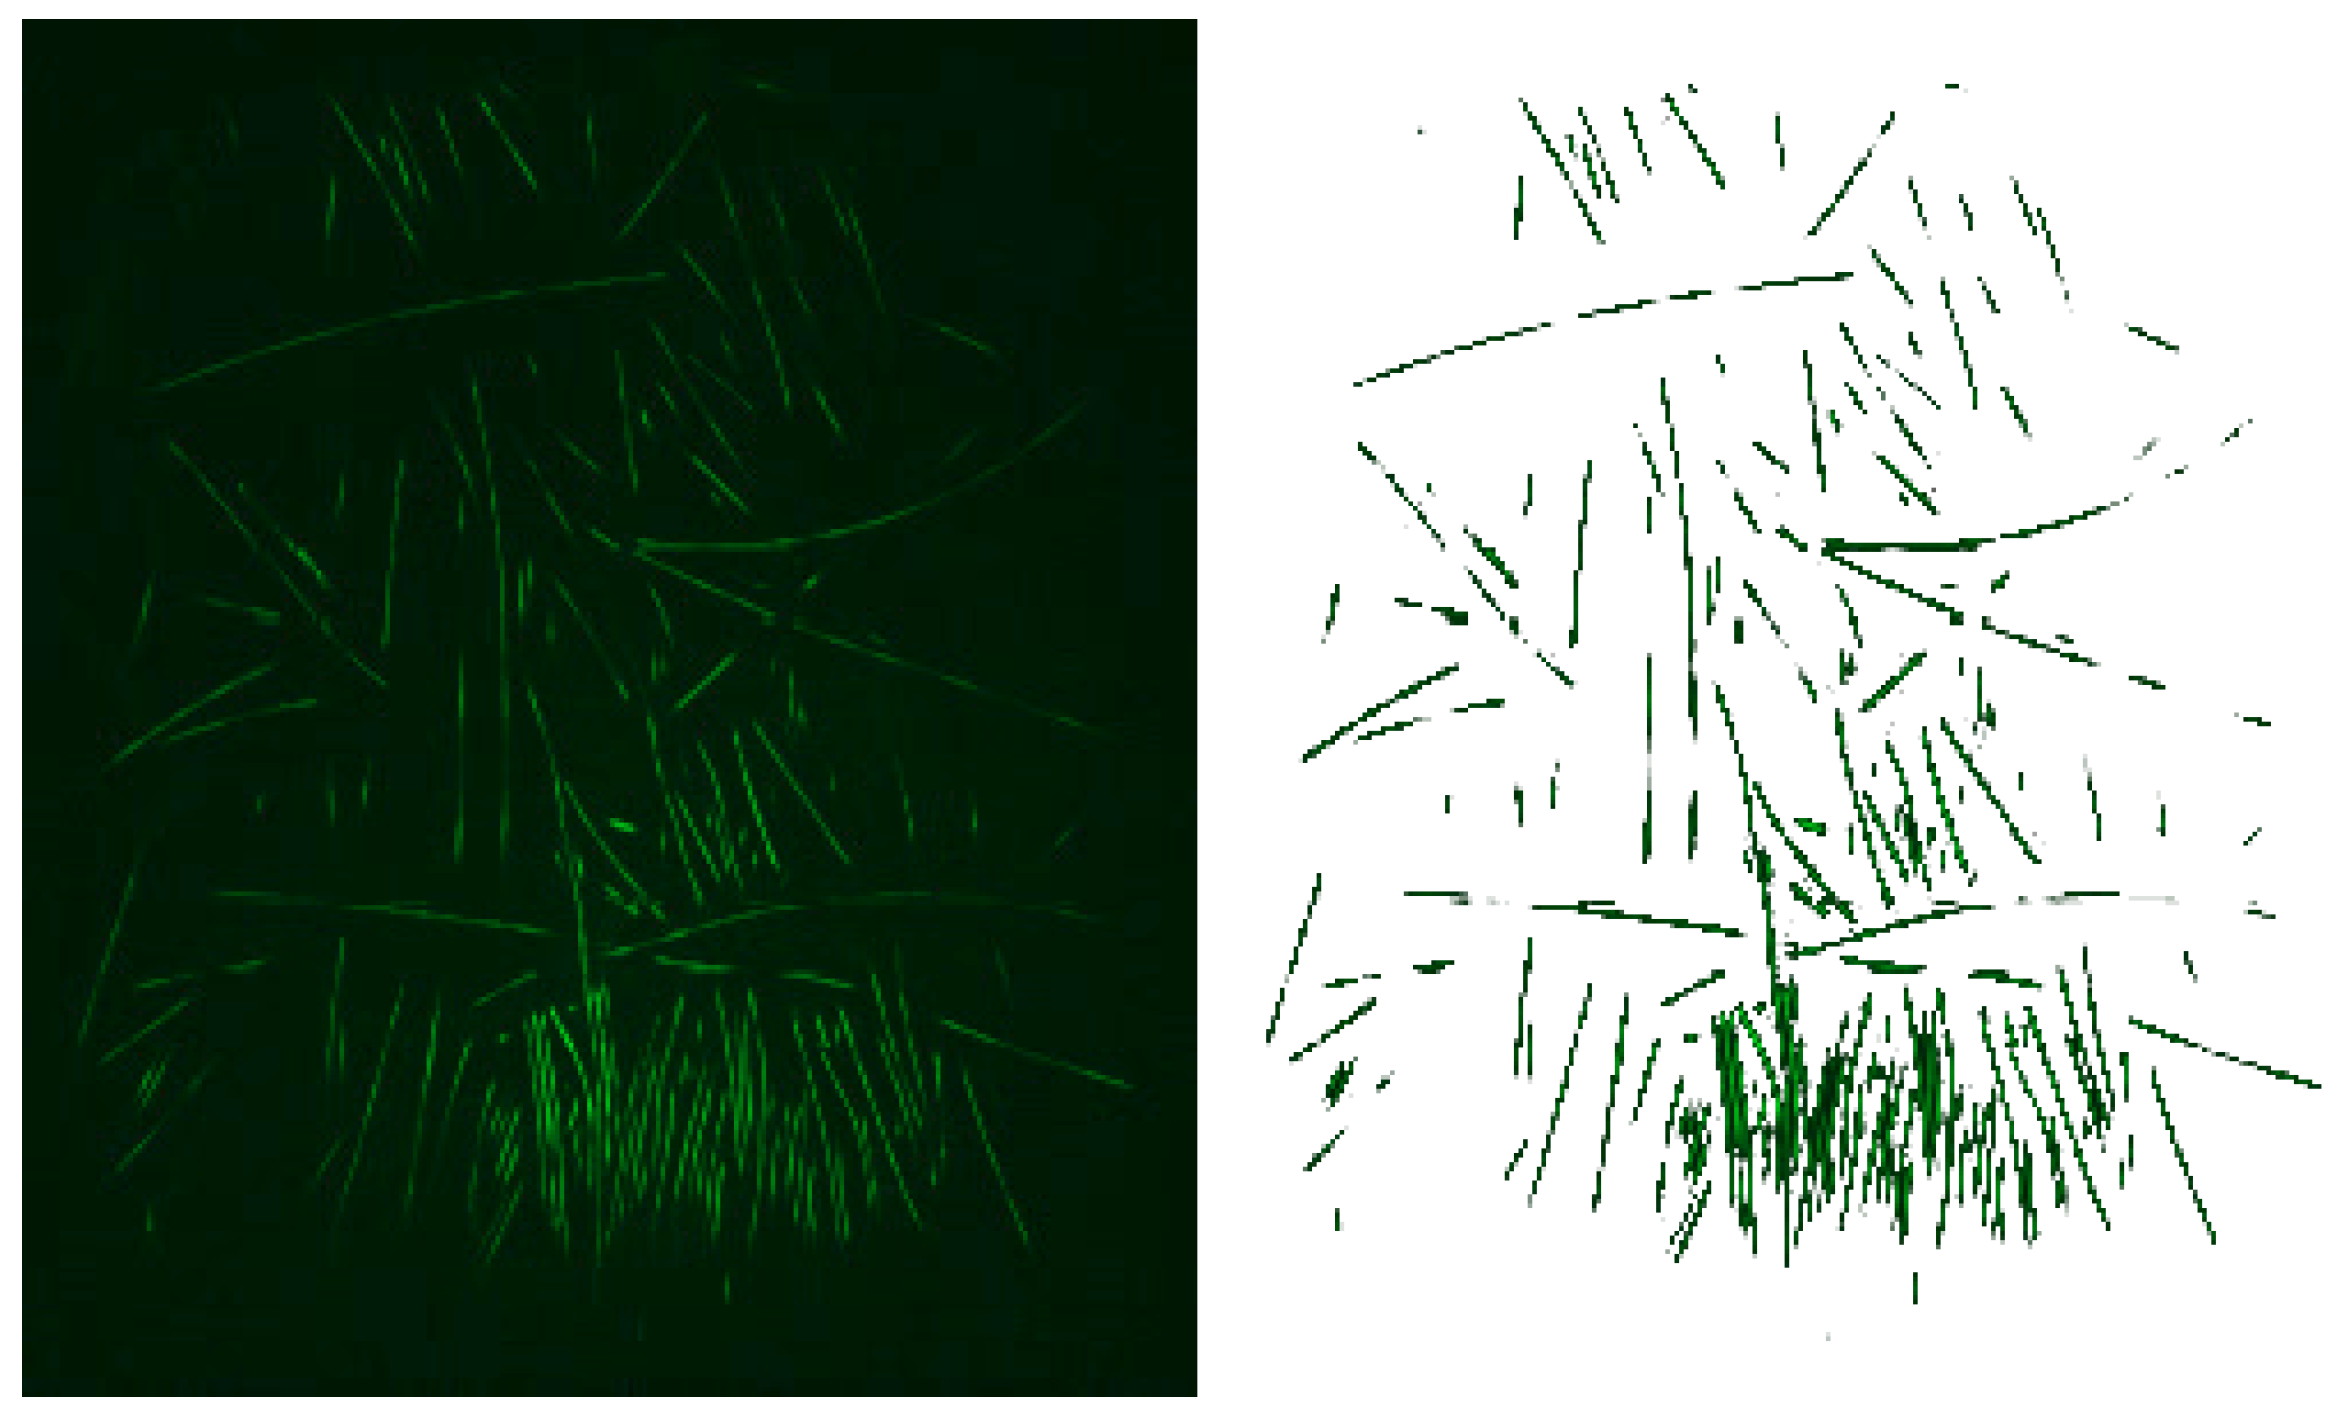
In previous work [7], the skin water content percentage and solvent concentration are calculated from capacitive images using Equation (4). In that study, a normalized cross-correlation algorithm detects the same skin area across measurements taken before and after the solvent application on the skin, which allows measurement of the solvent concentration in skin more accurately. In order to apply the same equation on hair samples, the repositioning algorithm is replaced with a range threshold [36]. In this way, only the pixels in contact with hair samples are isolated increasing the accuracy of water percentage calculation. Figure 6 demonstrates how this range threshold excludes pixels with bad contact on a single frame of hair sample.
where , and the dielectric permittivity of the sample, the dry sample and this of deionized water correspondingly.
3. Results
In this section, three experiments are conducted to examine the performance of the presented algorithms on capacitive images. The first experiment evaluates Vincent and Soille segmentation algorithm to automatically count the skin polygons, i.e., the skin areas shaped between wrinkles. For this purpose, capacitive images were recorded from 12 volunteers aging from 12 to 74 years old. The samples were taken from the middle volar forearm area while the arm was in resting position to reduce strain. Then, the segmentation algorithm was applied using Epsilon E100 software and the average number of polygons per square millimeter was correlated against the subjects’ age. The results in Table 1 demonstrate that the average number of polygons per surface area decreases with age. The calculated correlation (−0.71) comes in agreement with previous studies in the literature [10,11].
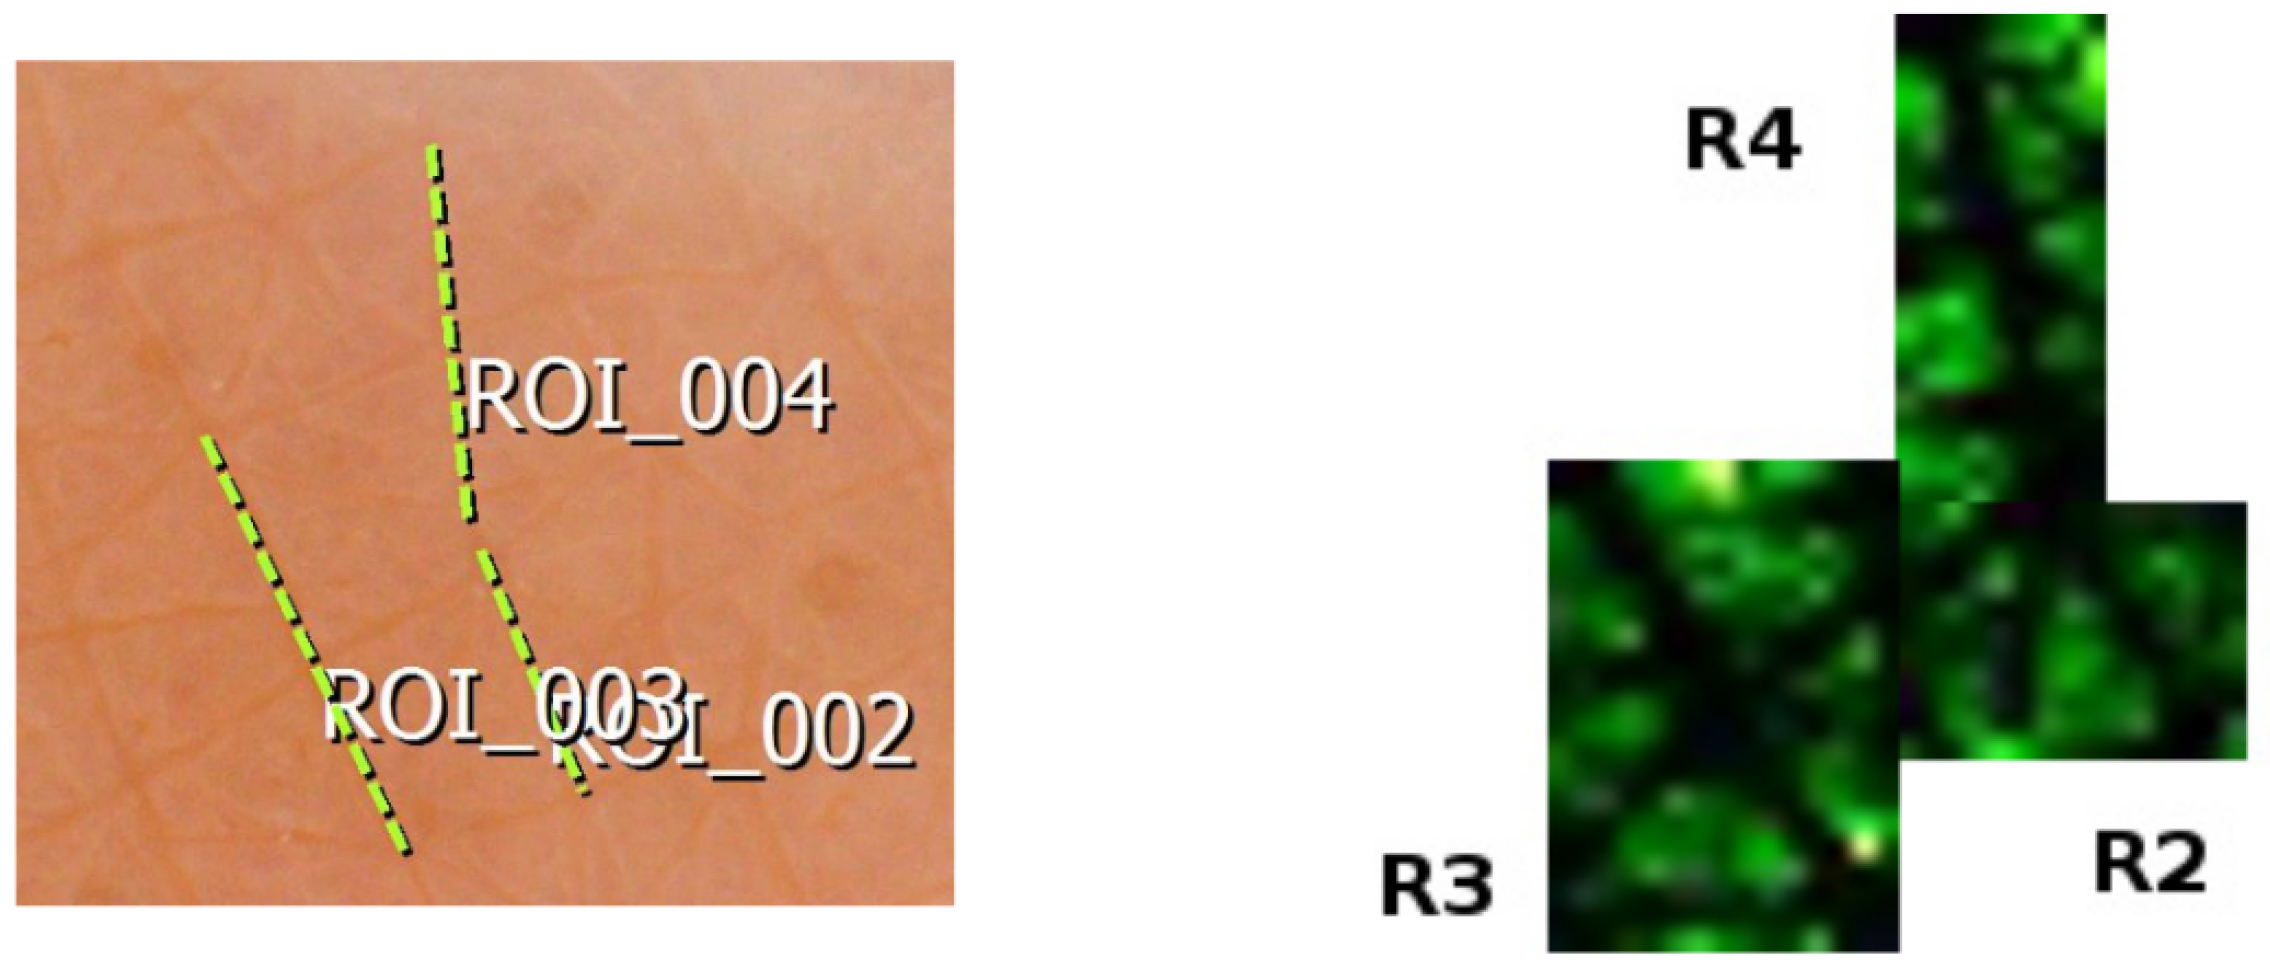
The second experiment consists of a short comparison between C-Cube, a calibrated digital spectroscope (Pixience, Toulouse, France) [37], and Epsilon E100 in feature length estimation. The same skin area of volar forearm was captured with both instruments and three furrows were randomly selected (Figure 7). C-Cube software provides the length measurement as a default feature by drawing the linear segment of interest on the captured frame (Figure 7 left). Epsilon E100 does not provide such feature, so the region of interest was cropped, and our length estimation algorithm was applied (Figure 7 right). The results in Table 2 suggest that if there are no neighboring artifacts in capacitive images, such systems can calculate the length of a furrow with good accuracy.
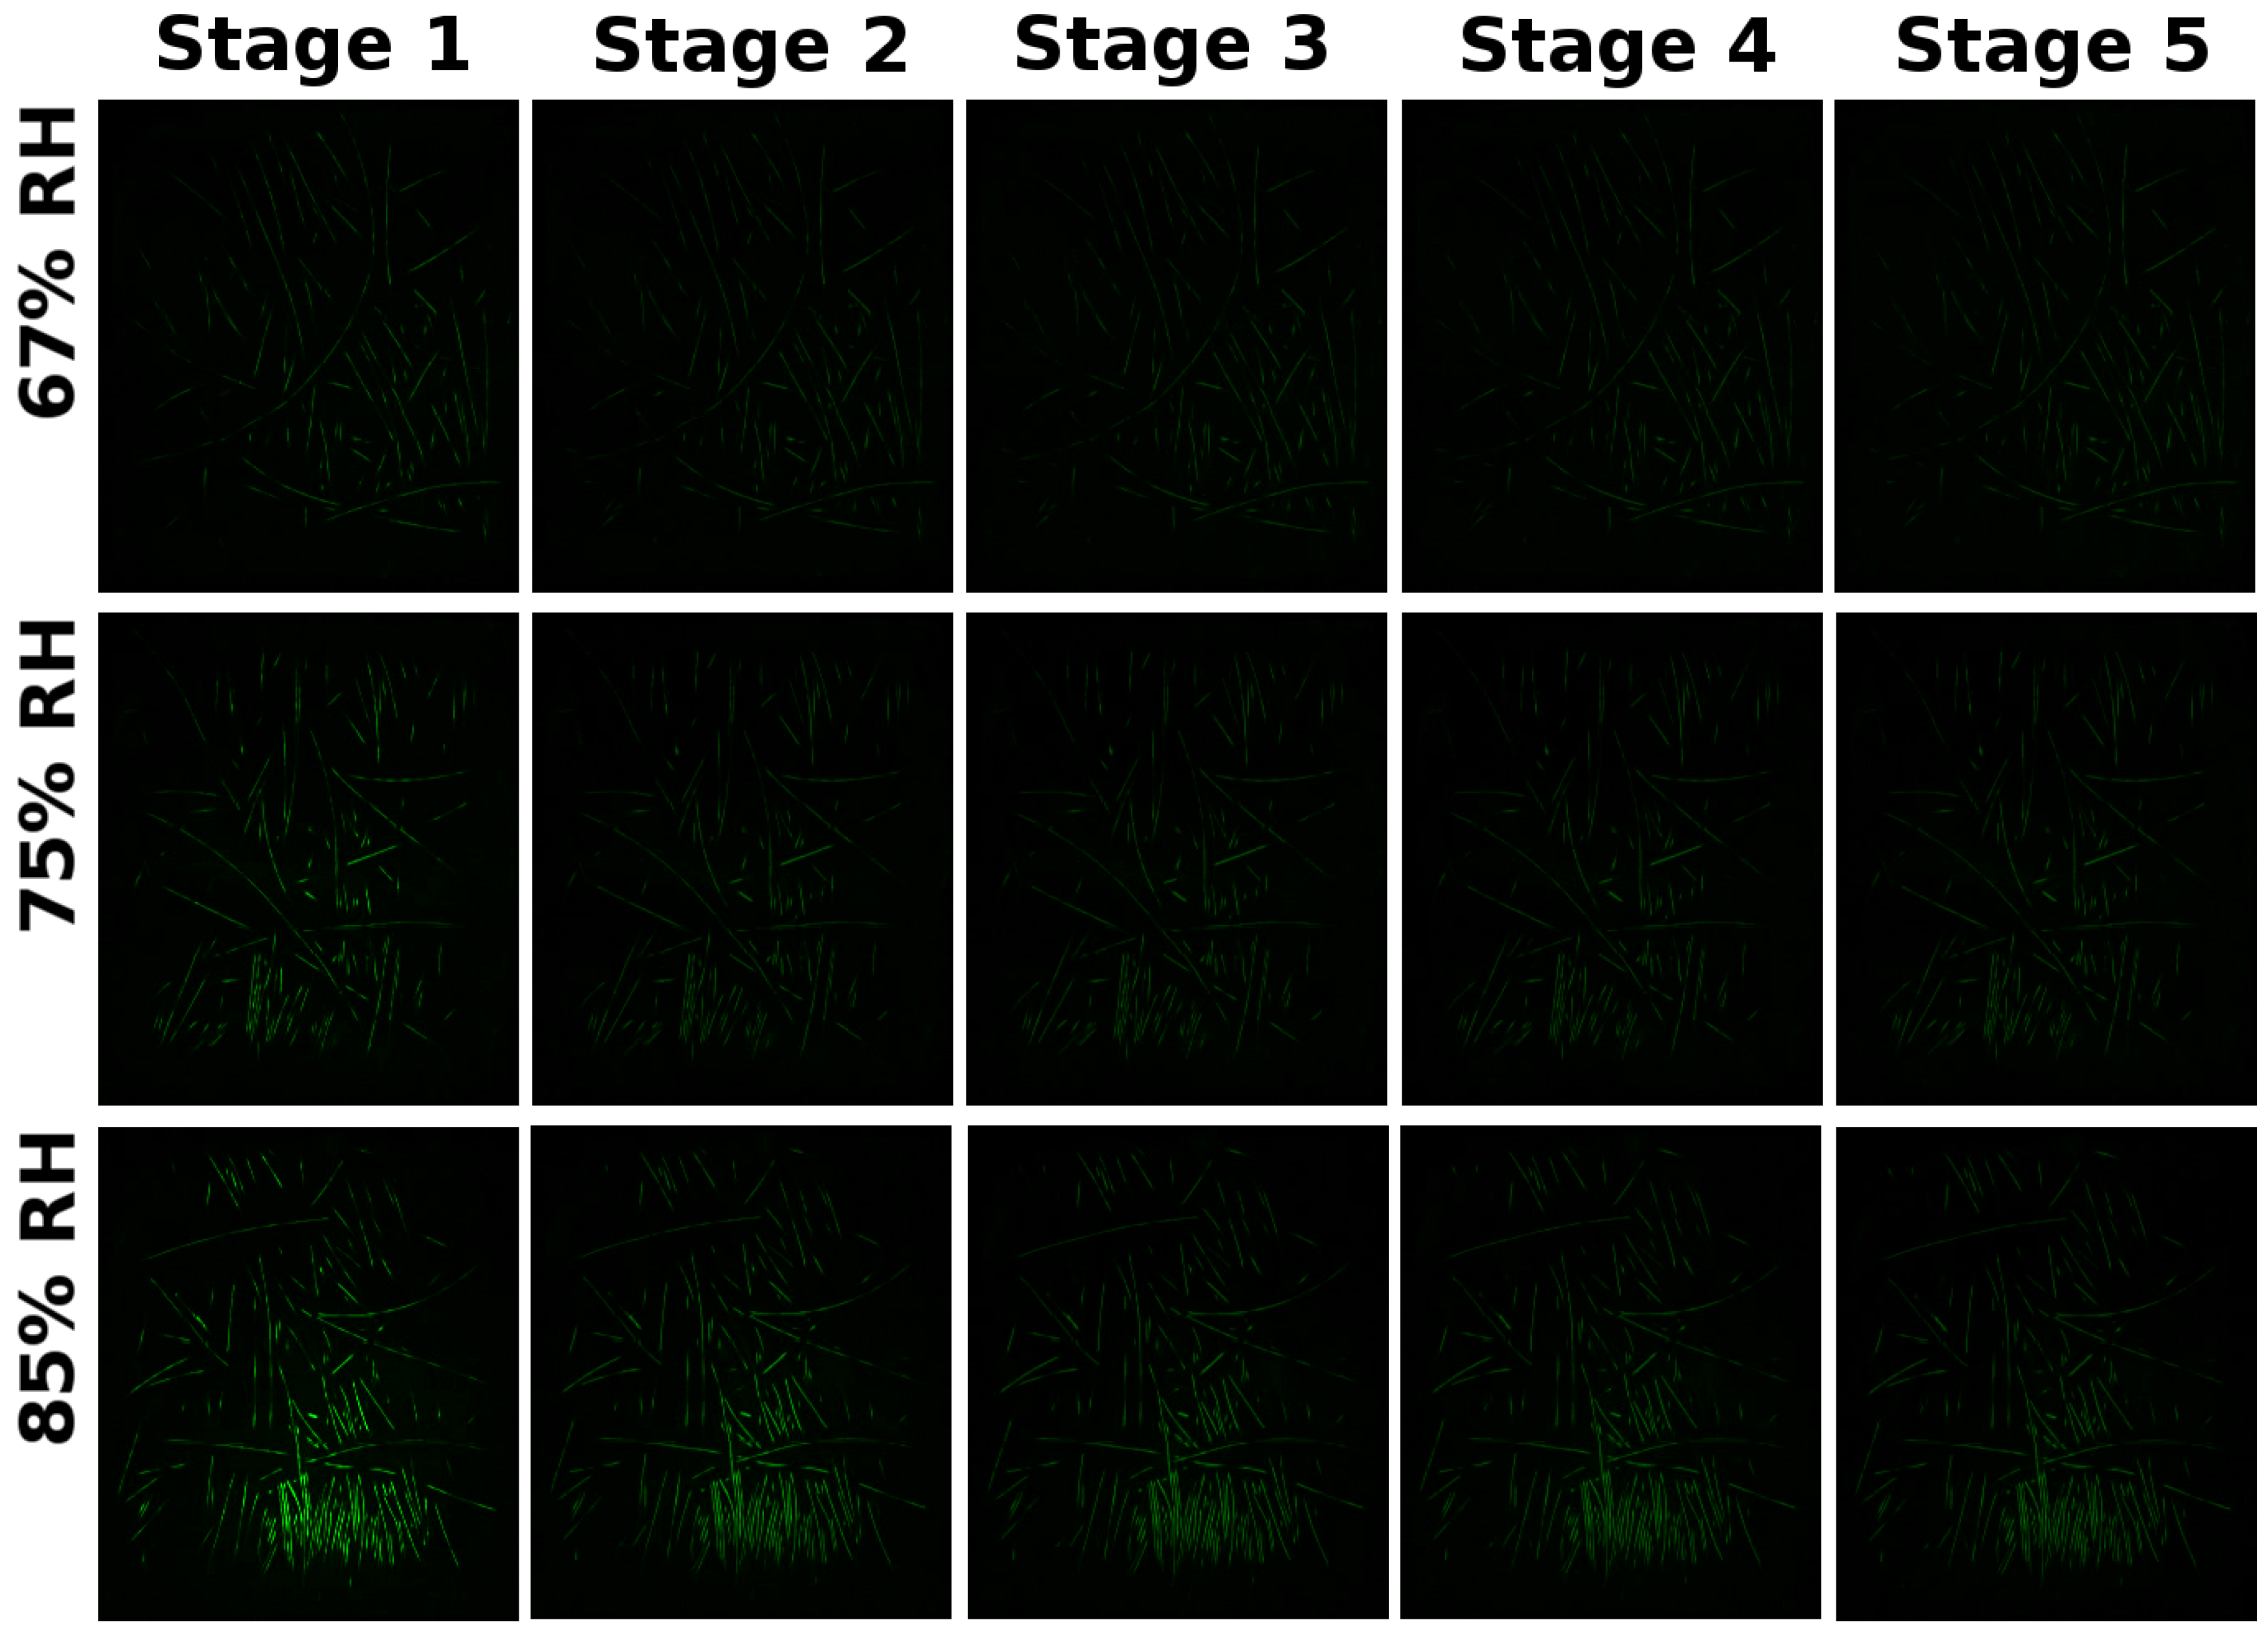
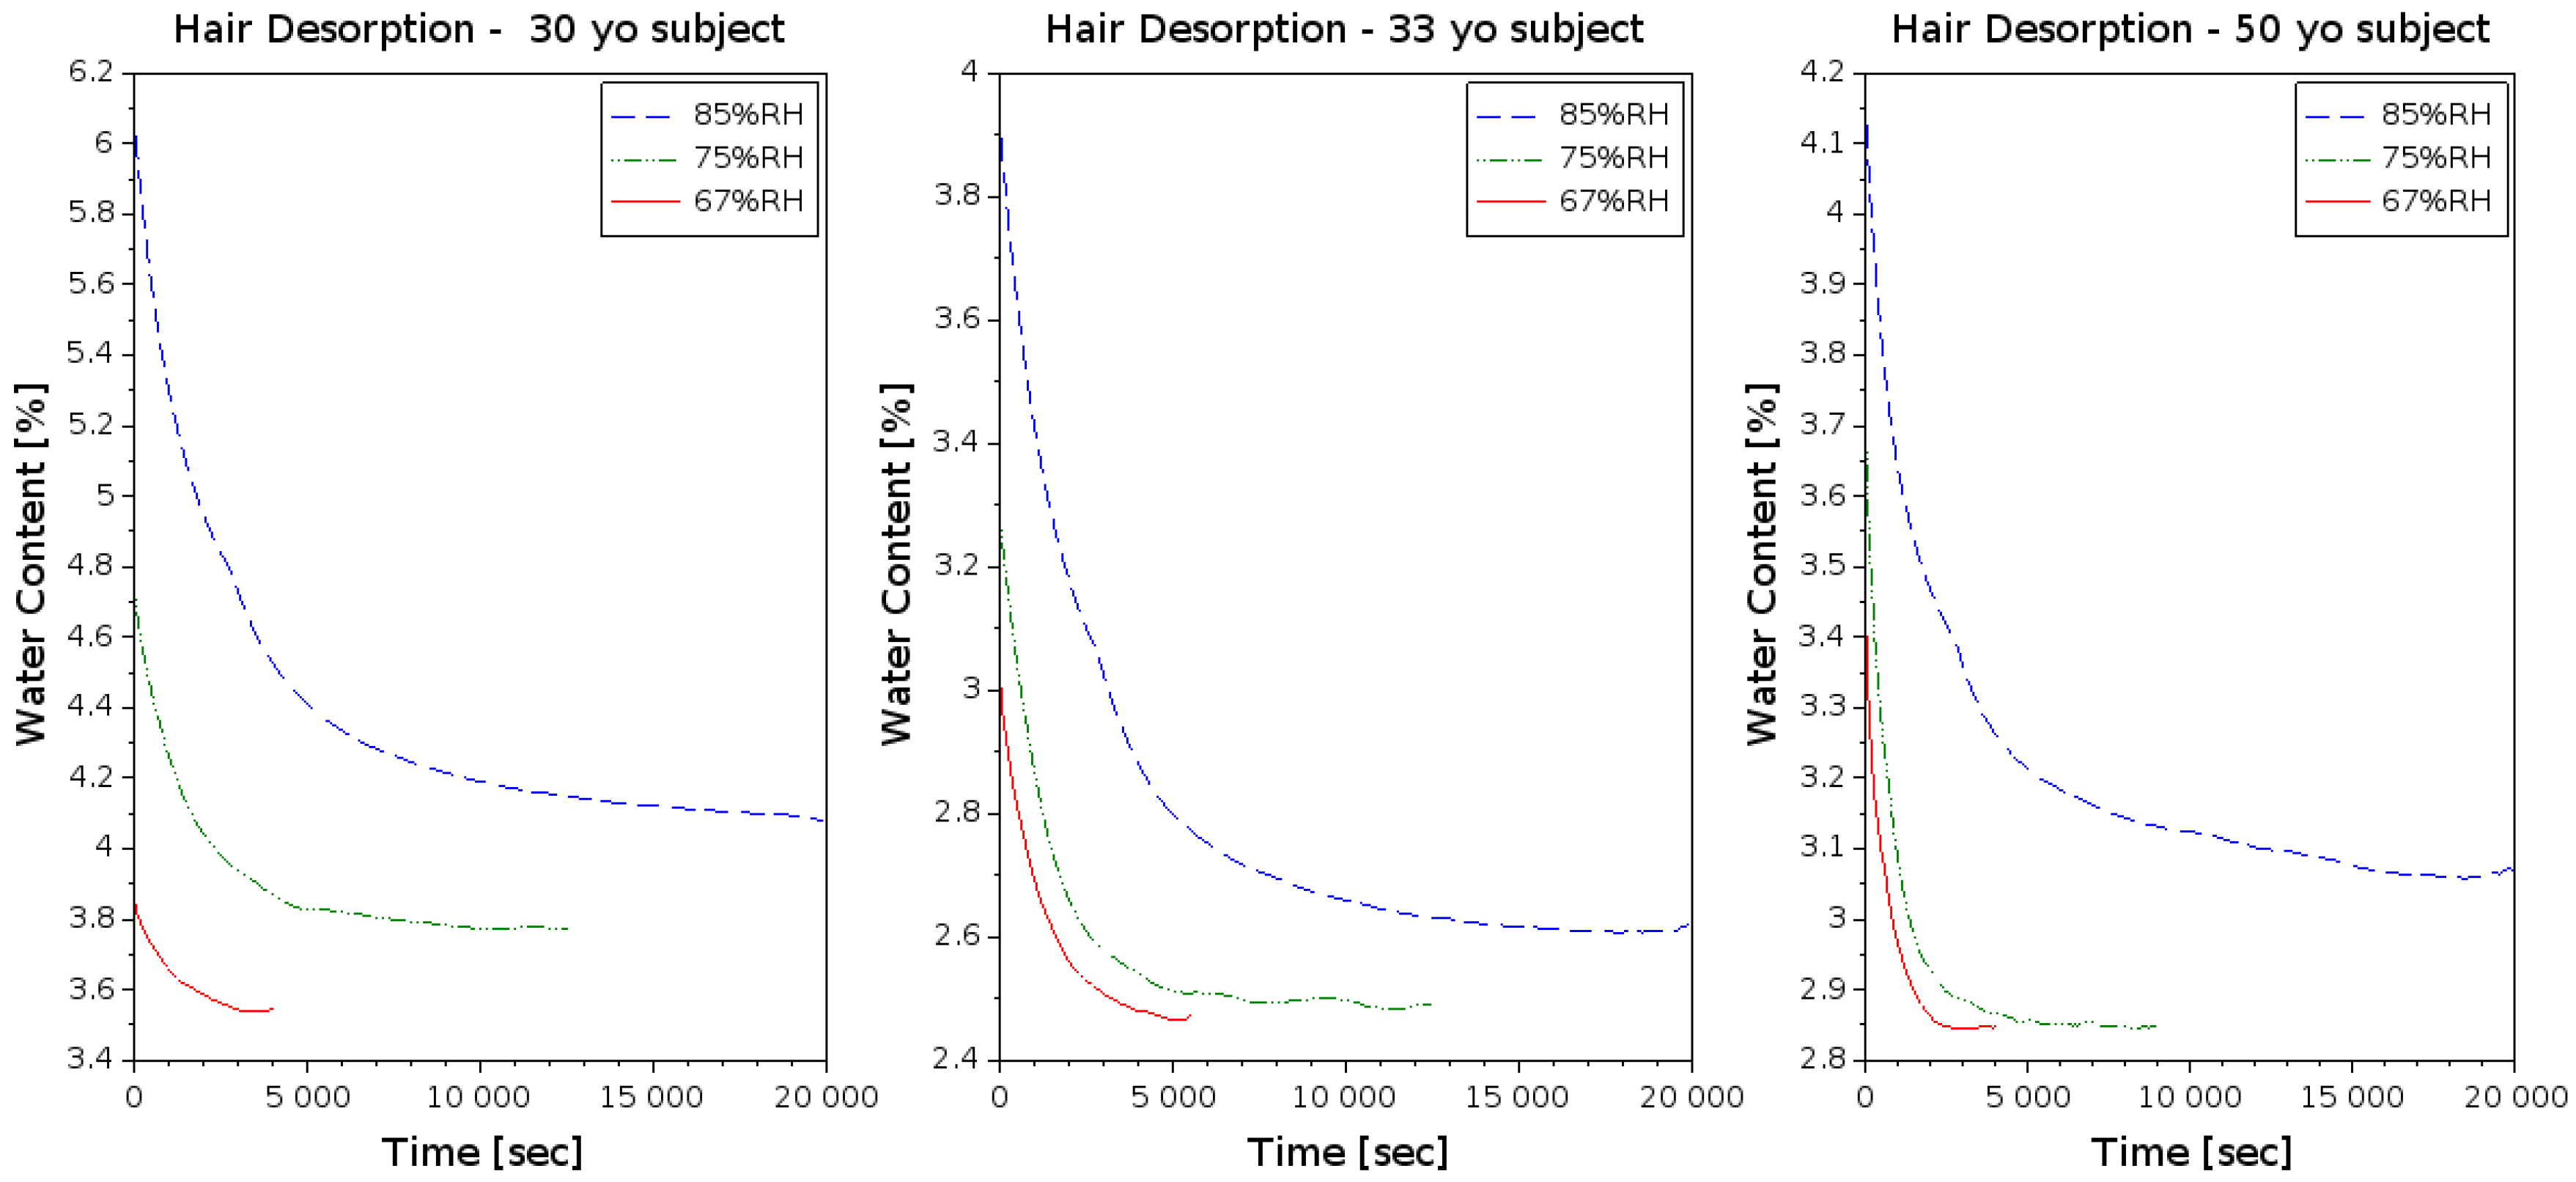
In the final experiment, the ability of capacitive imaging sensors to measure hair water content and desorption rate are examined. For this purpose, scalp hair samples from three volunteers were washed in deionized water and dried before left to acclimatize overnight in three different humidity chambers. Saturated salt solutions adjusted the relative humidity levels while both temperature and relative humidity were logged every 10 s using SHT35 by Sensirion [38]. The selected salts are potassium nitrate (85% RH), sodium chloride (75% RH) and magnesium nitrate (67% RH). After acclimatization, the samples were moved in 21 °C & RH conditions, side by side, and they were held against the sensor surface with a plastic plug provided by the manufacturer. The system was capturing video frames until the water loss rates reached a flat state or until the video exceeded 5.5 h. In order to target only the pixels in contact with hair, a range filter from 3.5 to 80 was applied on each frame. The selection of these limits is based on previous work with Epsilon E100 [39]. Five video instances from the same hair sample per acclimatization chamber are shown in Figure 8.
Two observations are made from the experimental results in Figure 9 and their summary in Table 3. First, the hair water content right after acclimatization correlates well with the relative humidity of the chamber. Second, the hair samples from younger subjects tend to hold water for a longer period of time. The latter comes in agreement with Xiao P. et al. [40], stating that lower diffusion rates are observed in younger subjects meaning better water holding capabilities. Note that in many occasions the sample never reached the expected baseline. In those cases, the lowest water content readout was used in the calculations for Table 3.
4. Discussion
In this study, we achieved to summarize the importance of skin and hair analysis in a variety of scientific fields, we introduced and analyzed the apparatus of capacitive imaging systems using a Maxwell-based simulation, we suggested algorithms for information extraction using such equipment and we conducted experiments to evaluate the overall system performance.
The simulation compared the penetration depth of the electric field between Corneometer C825 and Epsilon E100. The results show that both instruments have satisfactory penetration depth for skin measurements, with CM825 reaching twice the measurement depth. This implies that if stratum corneum thickness is less than 40 μm, errors should be found in a side-by-side comparative study. Such results have not been found in the literature and might be of interest to achieve in future work for validation of our simulation. Another conclusion we draw by this simulation is that both instruments have insufficient measurement depth for hair analysis. Their electric field reaches the shaft cortex and it will give some reasonable readouts, but it could not represent the absolute hair water content.
Our experiments focused on the evaluation of capacitive imaging systems in cosmetic and skin research studies. The first experiment demonstrated how capacitive images can be used to extract skin texture information. While this could be performed with any calibrated spectroscope, expanding applications of existing laboratory equipment is one of our goals. The suggested algorithm successfully detected the skin polygons and measured their average surface area. The results associate well with subjects’ age, giving −0.71 correlation with <0.0006 statistical significance. Furthermore, the achieved correlation value agrees with [10,11], where the correlation between age and polygons density were calculated to −0.64 and −0.65 in the dorsal hand and volar forearm correspondingly.
The second experiment used the GLCM to estimate the length of wrinkles. In order to determine the reliability of this method, we compared our results with calibrated spectroscopy for a small group of samples. The experiment was not extended further because the need to bring the capacitive sensor in contact with the sample results to skin deformation. This is enough to twist the frame and make repositioning algorithms to fail identifying the same wrinkle. Nevertheless, the same logic could be applied on objects with greater surface area (e.g., moles or scars) and track changes in their dimensions over time.
Our last experiment focused on measuring water desorption rate from scalp hair samples. The experimental results shown that the measurement apparatus is capable of differentiating desorption rates from young and elder subjects. This means that the comparative interpretation of the results between samples are in agreement with the literature [40], indicating that such systems can be used in hair analysis studies. Unfortunately, the observed desorption rates are lower than the ones reported in similar studies using different measurement methods (e.g., DVS or thermogravimetric) and for many of our samples the expected baseline was not reached. More specifically, Xiao et al. [40] found that it takes only 58 min for soaked hair samples to return to their baseline hydration using DVS.
To conclude, we believe that capacitive imaging sensors can be used for skin texture analysis and human skin age classification. We also believe that evidence is found for capacitive imaging application on hair water loss studies. This will require a sensor with greater penetration depth and a better sample-holding mechanism.
References
Author Contributions
Conceptualization, C.B. and P.X.; Methodology, C.B. and P.X.; Software, C.B.; Validation, C.B. and P.X.; Formal Analysis, C.B.; Investigation, C.B.; Resources, P.X.; Data Curation, C.B.; Writing—Original Draft Preparation, C.B.; Writing—Review & Editing, C.B. and P.X.; Visualization, C.B.; Supervision, P.X.; Project Administration, P.X.; Funding Acquisition, P.X. All authors have read and agreed to the published version of the manuscript.
Funding
This research received no external funding.
Conflicts of Interest
The authors declare no conflict of interest.
References
- Johnsen, G.K. Skin Electrical Properties and Physical Aspects of Hydration of Keratinized Tissues. Ph.D. Thesis, University of Oslo, Oslo, Norway, 2010. [Google Scholar]
- Isik, B.; Gurel, M.S.; Erdemir, A.T.; Kesmezacar, O. Development of skin aging scale by using dermoscopy. Skin Res. Technol. 2013, 19, 69–74. [Google Scholar] [CrossRef] [PubMed]
- Bontozoglou, C.; Zhang, X.; Patel, A.; Lane, M.E.; Xiao, P. In Vivo Human Hair Hydration Measurements by Using Opto-Thermal Radiometry. Int. J. Thermophys. 2019, 40, 22. [Google Scholar] [CrossRef] [Green Version]
- Wang, X.J.; Dhond, R.P.; Sorin, W.V.; Nelson, J.S.; Newton, S.A.; Milner, T.E. Characterization of human scalp hairs by optical low-coherence reflectometry. Opt. Lett. 1995, 20, 524. [Google Scholar] [CrossRef] [PubMed]
- iStock.com/Paladjai. Vol.2 Structure of the Skin Info Graphics Illustration Vector on White Background. Beauty Concept. Stock Illustration. Available online: https://www.istockphoto.com/ (accessed on 17 December 2019).
- iStock.com/Iv__design. Science of Hair. Anatomical Training Poster. Hair Structure. Detailed Medical Vector Illustration Stock Illustration. Available online: https://www.istockphoto.com/ (accessed on 17 December 2019).
- Zhang, X.; Bontozoglou, C.; Chirikhina, E.; Lane, M.E.; Xiao, P. Capacitive Imaging for Skin Characterizations and Solvent Penetration Measurements. Cosmetics 2018, 5, 52. [Google Scholar] [CrossRef]
- Corcuff, P.; de Lacharrière, O.; Lévêque, J.L. Extension-induced changes in the microrelief of the human volar forearm: Variations with age. J. Gerontol. 1991, 46, M223–M227. [Google Scholar] [CrossRef] [PubMed]
- Zahouani, H.; Djaghloul, M.; Vargiolu, R.; Mezghani, S.; Mansori, M.E.L. Contribution of human skin topography to the characterization of dynamic skin tension during senescence: Morpho-mechanical approach. J. Phys. Conf. Ser. 2014, 483, 012012. [Google Scholar] [CrossRef]
- Gao, Q.; Yu, J.; Wang, F.; Ge, T.; Hu, L.; Liu, Y. Automatic measurement of skin textures of the dorsal hand in evaluating skin aging. Skin Res. Technol. 2013, 19, 145–151. [Google Scholar] [CrossRef]
- Trojahn, C.; Dobos, G.; Schario, M.; Ludriksone, L.; Blume-Peytavi, U.; Kottner, J. Relation between skin micro-topography, roughness, and skin age. Skin Res. Technol. 2015, 21, 69–75. [Google Scholar] [CrossRef]
- Wosu, A.C.; Valdimarsdóttir, U.; Shields, A.E.; Williams, D.R.; Williams, M.A. Correlates of cortisol in human hair: Implications for epidemiologic studies on health effects of chronic stress. Ann. Epidemiol. 2013, 23, 797–811.e2. [Google Scholar] [CrossRef] [Green Version]
- Kristensen, S.K.; Larsen, S.C.; Olsen, N.J.; Fahrenkrug, J.; Heitmann, B.L. Hair dyeing, hair washing and hair cortisol concentrations among women from the healthy start study. Psychoneuroendocrinology 2017, 77, 182–185. [Google Scholar] [CrossRef]
- Boll, M.S.; Doty, K.C.; Wickenheiser, R.; Lednev, I.K. Differentiation of hair using ATR FT-IR spectroscopy: A statistical classification of dyed and non-dyed hairs. Forensic Chem. 2017, 6, 1–9. [Google Scholar] [CrossRef] [Green Version]
- Barba, C.; Méndez, S.; Martí, M.; Parra, J.L.; Coderch, L. Water content of hair and nails. Thermochim. Acta 2009, 494, 136–140. [Google Scholar] [CrossRef]
- Leveque, J.L.; Querleux, B. SkinChipR, a new tool for investigating the skin surface in vivo. Skin Res. Technol. 2003, 9, 343–347. [Google Scholar] [CrossRef] [PubMed]
- Batisse, D.; Giron, F.; Lévêque, J.L. Capacitance imaging of the skin surface. Skin Res. Technol. 2006, 12, 99–104. [Google Scholar] [CrossRef] [PubMed]
- Bevilacqua, A.; Gherardi, A. Age-related skin analysis by capacitance images. In Proceedings of the 17th International Conference on Pattern Recognition, ICPR 2004, Cambridge, UK, 26–26 August 2004. [Google Scholar]
- Xhauflaire-Uhoda, E.; Piérard, G.E. Skin capacitance imaging of acne lesions. Skin Res. Technol. 2007, 13, 9–12. [Google Scholar] [CrossRef]
- Bazin, R.; Laquieze, S.; Rosillo, A.; Lévêque, J.L. Photoaging of the chest analyzed by capacitance imaging. Skin Res. Technol. 2010, 16, 23–29. [Google Scholar] [CrossRef]
- Xhauflaire-Uhoda, E.; Mayeux, G.; Quatresooz, P.; Scheen, A.; Piérard, G.E. Facing up to the imperceptible perspiration. Modulatory influences by diabetic neuropathy, physical exercise and antiperspirant. Skin Res. Technol. 2011, 17, 487–493. [Google Scholar] [CrossRef]
- Pan, W.; Zhang, X.; Lane, M.; Xiao, P. The occlusion effects in capacitive contact imaging for in vivo skin damage assessments. Int. J. Cosmet. Sci. 2015, 37, 395–400. [Google Scholar] [CrossRef] [Green Version]
- Bevilacqua, A.; Gherardi, A. Characterization of a capacitive imaging system for skin surface analysis. In Proceedings of the 2008 First Workshops on Image Processing Theory, Tools and Applications, Sousse, Tunisia, 23–26 November 2008; IEEE: Piscataway, NJ, USA, 2008; pp. 1–7. [Google Scholar] [CrossRef]
- Huang, X.; Cheng, H.; Chen, K.; Zhang, Y.; Zhang, Y.; Liu, Y.; Zhu, C.; Chi Ouyang, S.; Kong, G.W.; Yu, C.; et al. Epidermal Impedance Sensing Sheets for Precision Hydration Assessment and Spatial Mapping. IEEE Trans. Biomed. Eng. 2013, 60, 2848–2857. [Google Scholar] [CrossRef]
- Bauer, H. Courage + Khazaka Electronic, Köln-Corneometer® CM 825 (E). Available online: https://www.courage-khazaka.de/en/scientific-products/all-products/16-wissenschaftliche-produkte/alle-produkte/183-corneometer-e (accessed on 1 July 2019).
- Barel, A.O.; Clarys, P. Skin Capacitance. In Non Invasive Diagnostic Techniques in Clinical Dermatology; Springer-Verlag: Berlin/Heidelberg, Germany, 2014; pp. 357–366. [Google Scholar]
- Biox Epsilon Model E100 Specifications. Available online: https://www.biox.biz/Products/Epsilon/E100PSpecs.php (accessed on 1 July 2019).
- Agros2D. Available online: http://www.agros2d.org/ (accessed on 18 December 2019).
- Cheng, H.; Zhang, Y.; Huang, X.; Rogers, J.A.; Huang, Y. Analysis of a concentric coplanar capacitor for epidermal hydration sensing. Sens. Actuators A Phys. 2013, 203, 149–153. [Google Scholar] [CrossRef]
- Achanta, R.; Shaji, A.; Smith, K.; Lucchi, A.; Fua, P.; Süsstrunk, S. SLIC superpixels compared to state-of-the-art superpixel methods. IEEE Trans. Pattern Anal. Mach. Intell. 2012, 34, 2274–2282. [Google Scholar] [CrossRef] [PubMed] [Green Version]
- Felzenszwalb, P.F.; Huttenlocher, D.P. Efficient Graph-Based Image Segmentation. Int. J. Comput. Vis. 2004, 59, 167–181. [Google Scholar] [CrossRef]
- Vincent, L.; Soille, P. Watersheds in digital spaces: An efficient algorithm based on immersion simulations. IEEE Trans. Pattern Anal. Mach. Intell. 1991, 13, 583–598. [Google Scholar] [CrossRef] [Green Version]
- Bontozoglou, C.; Zhang, X.; Xiao, P. Micro-relief analysis with skin capacitive imaging. Skin Res. Technol. 2019, 25, 165–170. [Google Scholar] [CrossRef]
- Bianconi, F.; Chirikhina, E.; Smeraldi, F.; Bontozoglou, C.; Xiao, P. Personal identification based on skin texture features from the forearm and multi-modal imaging. Skin Res. Technol. 2017, 23, 392–398. [Google Scholar] [CrossRef]
- Clausi, D.A. An analysis of co-occurrence texture statistics as a function of grey level quantization. Can. J. Remote Sens. 2002, 28, 45–62. [Google Scholar] [CrossRef]
- Pan, W.; Zhang, X.; Chirikhina, E.; Bontozoglou, C.; Xiao, P. Measurement of Skin Hydration with a Permittivity Contact Imaging System. In Proceedings of the IFSCC Conference Zurich 2015, Zurich, Switzerland, 21–23 September 2015. [Google Scholar]
- Pixience. The C-Cube: The New Standard for Digital Dermoscopy. Available online: https://www.pixience.com/products/presentation-2/?lang=en (accessed on 28 July 2019).
- SHT3x (RH/T)—Digital Humidity Sensor | Sensirion. Available online: https://www.sensirion.com/en/environmental-sensors/humidity-sensors/digital-humidity-sensors-for-various-applications/ (accessed on 31 May 2019).
- Xiao, P.; Bontozoglou, C. Capacitive contact imaging for in-vivo hair and nail water content measurements. H & PC 2015, 10, 62–65. [Google Scholar]
- Xiao, P.; Ciortea, LI.; Bontozoglou, C.; Imhof, R.E. Hair Water Content & Water Holding Capacity Measurements. In Proceedings of the 7th International Conference on Applied Hair Science, Red Bank, NJ, USA, 8–9 June 2016. [Google Scholar]

Figure 2.
Left, 3D representation of scalar potential for Corneometer’s electrodes as produced using Agros2D [28]. Right, representation of the fingerprint sensor pixels embedded in Epsilon E100 [27].

Figure 3.
Maxwell-based simulation results to compare measurement depth between Corneometer CM825 and Epsilon E100. The end of the protective layers is overlapping with the y-axis (x = 0). Therefore, electric potential readouts at the left of the y-axis (x < 0) are inside the protective layer, while readouts at the right of the y-axis (x > 0) are taken from within the sample under examination. Also, the electric potential on the electrode surface is configured to 0.3 V, but the upper part is cropped for better visualization of the results. The horizontal line at 0.09 V represents the 3% depth threshold.

Figure 4.
Example application of graph-based segmentation algorithm on capacitive image from volar wrist area. Left the original and right the segmented frame. For this demonstration, algorithm developed by Felzenszwalb and Huttenlocher is used [31].
Figure 4.
Example application of graph-based segmentation algorithm on capacitive image from volar wrist area. Left the original and right the segmented frame. For this demonstration, algorithm developed by Felzenszwalb and Huttenlocher is used [31].

Figure 5.
Example of gradient-based segmentation algorithm applied on capacitive image from the palm thenar. Right, the original and left the segmented frame. The lines that overlap with skin furrows represent the sizeless boundaries between segments. Reproduced with permission from [33], John Wiley and Sons, 2018.

Figure 6.
Example of threshold application on hair capacitive image. On the left the original frame, where acclimatized hair on bright green and air/bad contact on darker green shades. Right, the software output after a range threshold is applied to exclude pixels with bad contact before calculating water content.

Figure 7.
Area of volar forearm captured with C-Cube spectroscope (left) and Epsilon E100 capacitive imaging system (right). R2-4 the three randomly selected furrows for the comparative experiment.
Figure 7.
Area of volar forearm captured with C-Cube spectroscope (left) and Epsilon E100 capacitive imaging system (right). R2-4 the three randomly selected furrows for the comparative experiment.

Figure 8.
Video snapshots from water desorption in hair samples. The first row shows five frames from hair capacitive images over time after acclimatization in 67%RH. Rows two and three show the same sample after acclimatization in 75% and 85%RH chambers correspondingly. The contrast is modified to highlight hair samples.

Figure 9.
Hair water content desorption curves using samples from three volunteers and for three different humidity acclimatization chambers.
Figure 9.
Hair water content desorption curves using samples from three volunteers and for three different humidity acclimatization chambers.


Table 1.
Experimental results for skin polygons per surface area in middle volar forearm across 12 volunteers in different age groups using capacitive images. The correlation of the average number of polygons per mm2 against subjects age is calculated to −0.71. Reproduced with permission from [33], John Wiley and Sons, 2018.
| Age | 12 | 16 | 26 | 28 | 31 | 48 | 48 | 50 | 60 | 60 | 64 | 74 | p-Value | |
|---|---|---|---|---|---|---|---|---|---|---|---|---|---|---|
| Polygons/mm2 | 12.1 | 10.7 | 11.6 | 10.9 | 10.3 | 10.4 | 8.8 | 7.9 | 8.0 | 7.7 | 6.0 | 8.8 | −0.71 | <0.0006 |
Table 2.
Results of comparative study between C-Cube spectroscope and Epsilon E100 to examine accuracy of wrinkle length estimation using GLCM. The length of three wrinkles in the area of volar forearm was compared and the correlation between the two measurement methods is calculated to 0.9.
Table 2.
Results of comparative study between C-Cube spectroscope and Epsilon E100 to examine accuracy of wrinkle length estimation using GLCM. The length of three wrinkles in the area of volar forearm was compared and the correlation between the two measurement methods is calculated to 0.9.
| Apparatus | R2 | R3 | R4 | R2 |
|---|---|---|---|---|
| C-Cube [mm] | 0.6 | 0.9 | 1.1 | - |
| Epsilon E100 [mm] | 0.7 | 0.8 | 1.0 | 0.9 |
Table 3.
Results of scalp hair water loss experiment using Epsilon E100. The left side of the table shows that the water content % correlates well with the %RH in the acclimatization chamber. The right side of the table shows how long it takes for the sample to lose 75% of its initial water content.
| Water Content [%] | 75% Water Loss [s] | |||||
|---|---|---|---|---|---|---|
| %RH | Age 30 | Age 33 | Age 50 | Age 30 | Age 33 | Age 50 |
| 85 | 6.0 | 3.9 | 4.1 | 2625 | 2810 | 2377 |
| 75 | 4.7 | 3.3 | 3.7 | 1728 | 2135 | 1100 |
| 67 | 3.8 | 3.0 | 3.4 | 1490 | 1604 | 914 |
| 0.99 | 0.97 | 0.99 | - | - | - | |
© 2019 by the authors. Licensee MDPI, Basel, Switzerland. This article is an open access article distributed under the terms and conditions of the Creative Commons Attribution (CC BY) license (http://creativecommons.org/licenses/by/4.0/).
Share and Cite
MDPI and ACS Style
Bontozoglou, C.; Xiao, P. Applications of Capacitive Imaging in Human Skin Texture and Hair Analysis. Appl. Sci. 2020, 10, 256. https://0-doi-org.brum.beds.ac.uk/10.3390/app10010256
AMA Style
Bontozoglou C, Xiao P. Applications of Capacitive Imaging in Human Skin Texture and Hair Analysis. Applied Sciences. 2020; 10(1):256. https://0-doi-org.brum.beds.ac.uk/10.3390/app10010256
Chicago/Turabian StyleBontozoglou, Christos, and Perry Xiao. 2020. "Applications of Capacitive Imaging in Human Skin Texture and Hair Analysis" Applied Sciences 10, no. 1: 256. https://0-doi-org.brum.beds.ac.uk/10.3390/app10010256
Note that from the first issue of 2016, this journal uses article numbers instead of page numbers. See further details here.