Questionnaires or Inner Feelings: Who Measures the Engagement Better?
by
 ,
,
Francesca Nonis
* ,
,
Elena Carlotta Olivetti
,
Federica Marcolin
,
Maria Grazia Violante
, 
Enrico Vezzetti
and 
Sandro Moos

Department of Management and Production Engineering, Politecnico di Torino, 10129 Torino, Italy
*
Author to whom correspondence should be addressed.
Appl. Sci. 2020, 10(2), 609; https://0-doi-org.brum.beds.ac.uk/10.3390/app10020609
Submission received: 24 December 2019
/
Revised: 9 January 2020
/
Accepted: 10 January 2020
/
Published: 15 January 2020
(This article belongs to the Special Issue Applications of Emerging Digital Technologies: Beyond AI & IoT)
Abstract
:This work proposes an innovative method for evaluating users’ engagement, combining the User Engagement Scale (UES) questionnaire and a facial expression recognition (FER) system, active research topics of increasing interest in the human–computer interaction domain (HCI). The subject of the study is a 3D simulator that reproduces a virtual FabLab in which users can approach and learn 3D modeling software and 3D printing. During the interaction with the virtual environment, a structured-light camera acquires the face of the participant in real-time, to catch its spontaneous reactions and compare them with the answers to the UES closed-ended questions. FER methods allow overcoming some intrinsic limits in the adoption of questioning methods, such as the non-sincerity of the interviewees and the lack of correspondence with facial expressions and body language. A convolutional neural network (CNN) has been trained on the Bosphorus database (DB) to perform expression recognition and the classification of the video frames in three classes of engagement (deactivation, average activation, and activation) according to the model of emotion developed by Russell. The results show that the two methodologies can be integrated to evaluate user engagement, to combine weighted answers and spontaneous reactions and to increase knowledge for the design of the new product or service.
1. Introduction
Users’ involvement [1] is crucial in all the product development cycle, including the early conceptual stages of product or service design. Participation in the system development process by representatives of the target user group impacts each stage of the product development cycle, influencing their contributions in an aggregate way, thus maximizing their effects [2].
In today’s modern competitive market, user-centered design (UCD) [3] methods become more and more efficient in developing new consumer products. The UCD process is explicitly focused on the users, and consists of:
- -
- identifying the context of use and who are the primary users of the products;
- -
- specifying user requirements setting goals to make the product successful;
- -
- producing design solutions and prototype;
- -
- evaluating designs through usability tests to get users’ feedback.
Therefore, the term user-centered design, also known as human-centered design [4], indicates a precise design mentality focused on human needs. This approach originates from co-design [5], a wide range of creative techniques whose aim is to actively involve all stakeholders in generating ideas to support the process and to reach both immediate and longer-term benefits.
The evaluation and quantification of users’ engagement respond to this need, and, in particular, addresses the 4th step, i.e., “evaluating designs through usability tests to get users’ feedback”. In this sense, the main contribution of this paper is to propose a novel methodology for measuring the student’s engagement in a virtual learning environment, although it could fit the design of every type of product or service. According to Fredricks [6], there are three distinct yet interrelated types of engagement in learning: behavioral, cognitive, and affective. Behavioral engagement is defined in terms of persistence, effort, attention, participation, and involvement conduct towards the learning activity; cognitive engagement refers to psychological effort to learn, to understand, and to master intended knowledge and skills; lastly, affective or emotional engagement [7] involves interest, happiness, boredom, and other feelings in learning processes.
The more time students spend engaged during instruction, the more they learn [8]. First, researchers have studied and developed in-depth methods to measure students’ engagement to increase it [9]. E-learning systems have been introduced to facilitate and enhance the learning process [10,11].
The most popular methods of measuring engagement [12] can be divided into 3 categories, each of them with pros and cons. (1) Questioning methods: surveys, questionnaires, or self-reports. The interviewees describe their level of engagement by answering several open-ended or closed-ended questions in a set format [13]. Questionnaires are practical and affordable ways to gather data from a large audience, and they do not require the use of any instrument to perform the evaluation. Nevertheless, respondents may not be truthful with their answers, there is a chance that some questions will be left unanswered, and there is no way to observe facial expression, reactions or body language to fully capture the respondents’ feelings. (2) Physiological methods: physiological and neurological sensor readings [6,14]. Physiological measures such as galvanic skin response (GSR), electroencephalogram (EEG) [15], blood pressure [16] and heart rate can be used to evaluate students’ engagement and alertness [17,18]. These methodologies are alternative tools to provide feedback, but require specialized sensors and are difficult to use in large-scale studies. (3) Observational methods: analysis and interpretation of cues from face [19], body posture [20] and hand gestures [21]. Observation is a low-impact and flexible approach to collect data and can produce a mix of qualitative and quantitative data. It is often used in conjunction with other approaches in initial focus groups, interviews or surveys. Some limitations are the acquisition planning, and the work required for data collection and analysis.
Among the observational methods is the study of facial expressions for the automatic evaluation of users’ feedback. Facial expression analysis and recognition (FER) has been an active research topic in recent years, with applications in several different areas [22,23]. In particular, thanks to technological development, research is focusing on 3D facial data [24], both still images and video sequences, to perform recognition improving the accuracy and widening the application range. In addition to the main traditional methods for 3D facial expression recognition, deep-learning techniques [25] emerged and have been applied to FER for feature extraction, classification, and recognition tasks. One of the most used architectures to recognize objects or faces is the convolutional neural network (CNN), a deep-learning algorithm that takes an input image, processes it and classifies it under certain categories, for example, the seven emotions.
This paper proposes a methodology for evaluating a virtual reality environment aimed at learning. The proposed method consists of the integration between traditional methods of self-report and innovative ones of emotion recognition through face analysis. In particular, this work compares users’ engagement in the interaction with a virtual environment resulting from two different methods, a traditional closed-ended questionnaire, and an automatic FER system based on deep learning. The introduction of an observational method overcomes the common problems of questioning methods, obtaining more objective results deriving from a cross-analysis and a more realistic model for measuring user engagement. Therefore, the novelty of this work is the usage of the Bosphorus database (DB) to train CNN and assess user engagement, combining the FER with the User Engagement Scale (UES) in order to improve the measuring accuracy. Subsequently, the results obtained were embedded to offer a more complete evaluation.
2. Materials and Methods
The virtual environment used in this case study to evaluate the engagement of the participants was developed within the context of the European project “FARMER4.0—Farmer teaching and training laboratories”. The project aims at developing a training path for agricultural entrepreneurs so that they can approach 3D modeling software and 3D printing. The users, following the educational path, firstly undergo some teaching modules for learning how 3D modeling works, then they are job-shadowed in a virtual FabLab with a coworking scenario. This virtual reality (VR) supporting tool is a 3D simulator, hosted on a website, in which the users are in a fabrication laboratory and can see how an object is modeled with a 3D CAD (Computer-Aided Design) software (SolidWorks 2019, 3DS Dassault Systèmes Headquarters: Vélizy-Villacoublay, France), and then printed with fused-deposition modeling (FDM) technology. Appendix A reports a description of the virtual environment at issue.
An Intel® RealSense™ SR300 structured-light depth camera, placed above the personal computer (PC) station, was used to acquire in real-time the face of the 24 participants while browsing, one at a time, the virtual environment. The 3D videos depicting body posture and facial expressions in the form of depth maps were then analyzed, selecting and labeling with the corresponding feeling (for example, bored, happy, or surprised) the frames of greatest interest.
Following the acquisition, each participant was asked to complete the UES questionnaire, a specific tool developed to measure six dimensions of user engagement: aesthetic appeal, focused attention, novelty, perceived usability, felt involvement, and endurability.
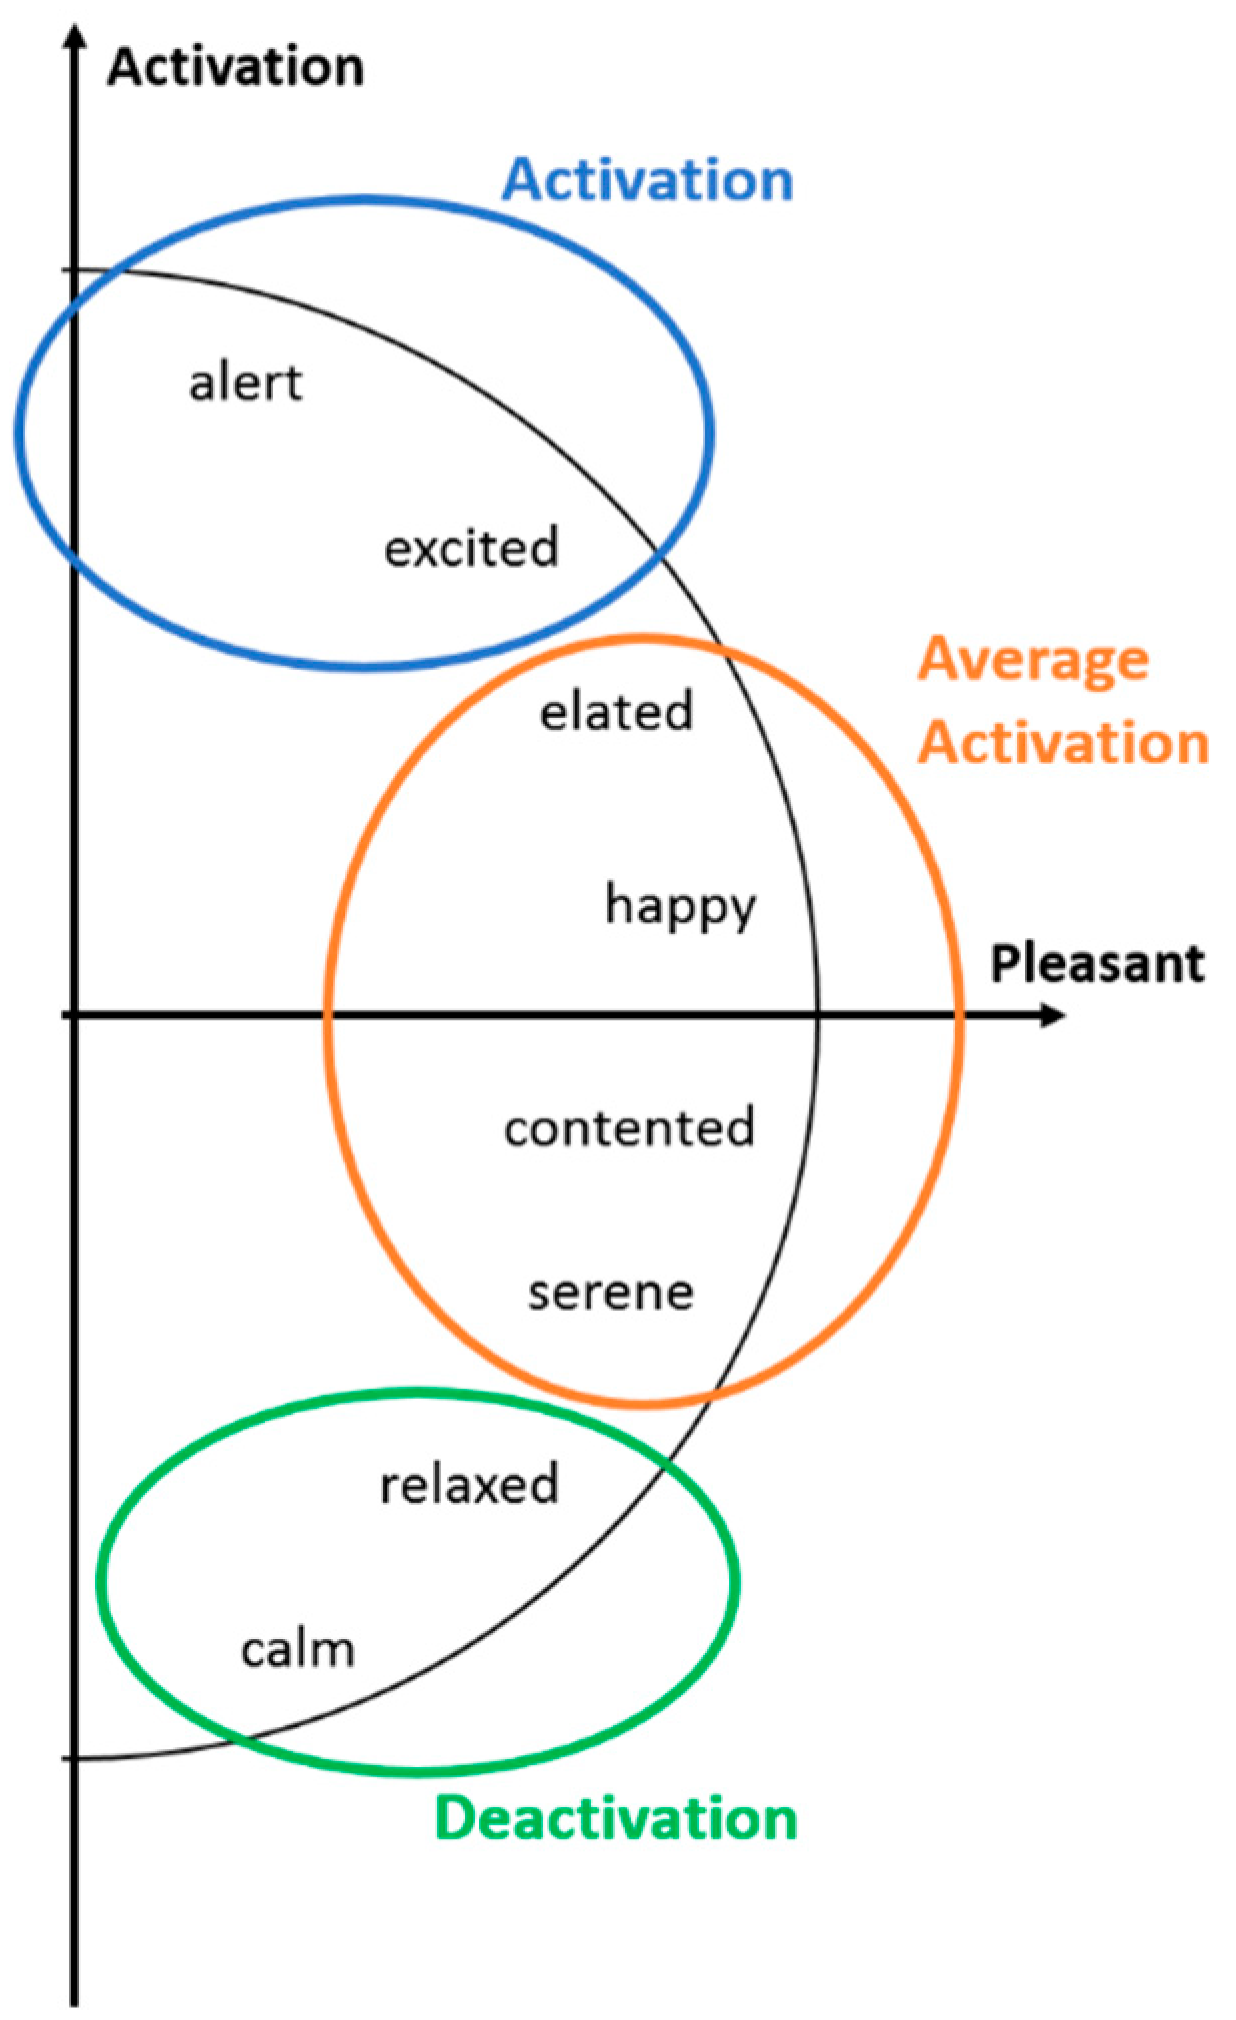
According to the circumplex model of emotions developed by James Russell [26], three classes of emotional activation were defined considering only the first and the fourth quadrants, with positive valence; the three classes considered to be the most significant to cluster different levels of engagement are deactivation, average activation, and activation.
The purpose of this work is, therefore, to compare the questionnaires with the emotional activation monitored in real-time by the sensor in order to measure the involvement and the engagement of users’ sample; it is assumed that the facial expressions are spontaneous. The main advantage of this approach is the comparison of two different methods, which can be integrated into a new methodology that captures the strengths of both. On the other hand, the implementation of the presented method still has some steps to improve, such as image processing, as now the procedure is not executable in real-time.
2.1. Convolutional Neural Network (CNN)
A deep-learning FER technique has been used to classify the data in the three classes of engagement [27,28]. We propose a methodology based on a relatively new CNN architecture, MobileNetV2, which is well-known for image classification as it has a low number of parameters to train compared to other networks.
In order to perform expression recognition and the classification of the selected frames, the network has been trained on the Bosphorus public database [29], which contains 752 images of 105 subjects referring to facial emotions (neutral, anger, disgust, fear, happiness, sadness, and surprise). Only this portion of the whole database is involved in our study, dividing it into a training dataset to train the network, and a validation dataset to assert the quality and to tune the hyperparameters. The selected facial depth maps given in output by the sensor, following a processing phase, will form the test set to draw a conclusion on how well the model performs and, at the same time, to evaluate users’ engagement.
2.2. Data Preparation and Pre-Processing
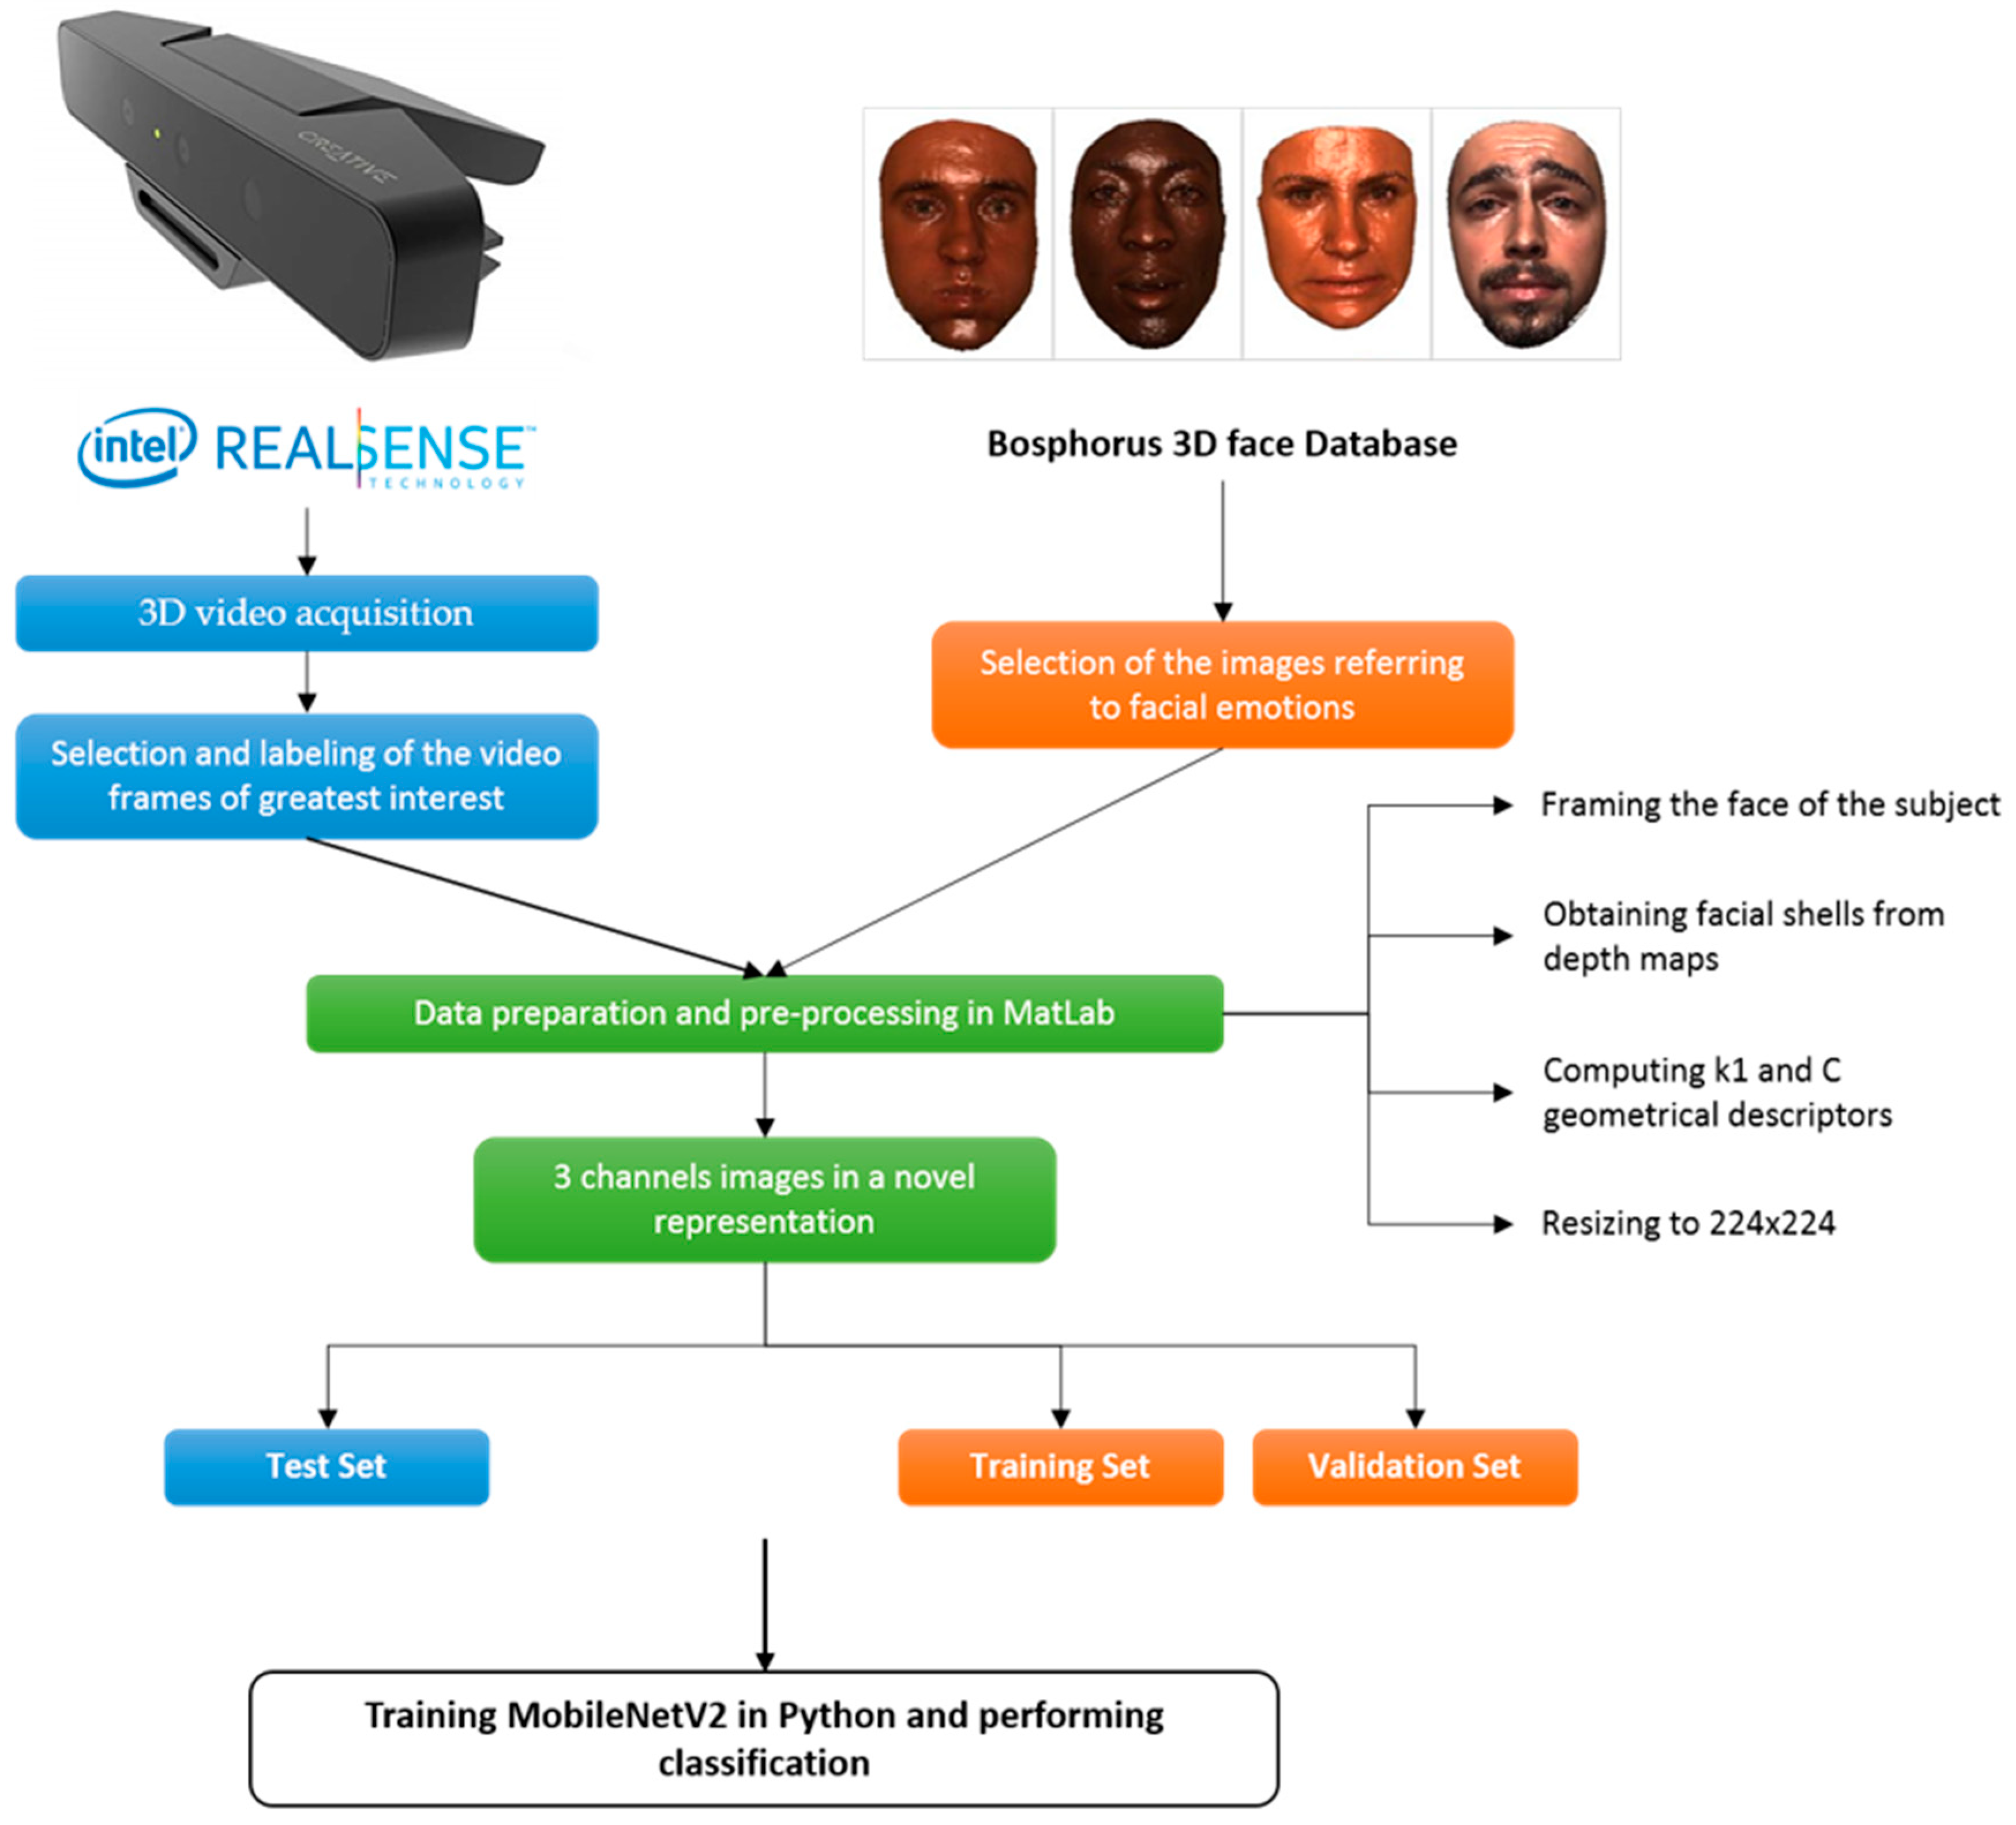
The default input size for MobileNetV2 is 224 × 224 with 3 channels, so a preprocessing step is required to adapt the data to the neural network input. Similarly to a preceding work [30], geometrical descriptors [31] have been computed from 3D depth maps, retrieved both from Bosphorus DB and from the sensor, to interpret RGB (red, green, blue) images with a novel representation. In this study, based on previous results [32], the first channel is the facial 3D depth map, the second channel is the first principal curvature (k1), and the third one is the curvedness (C).
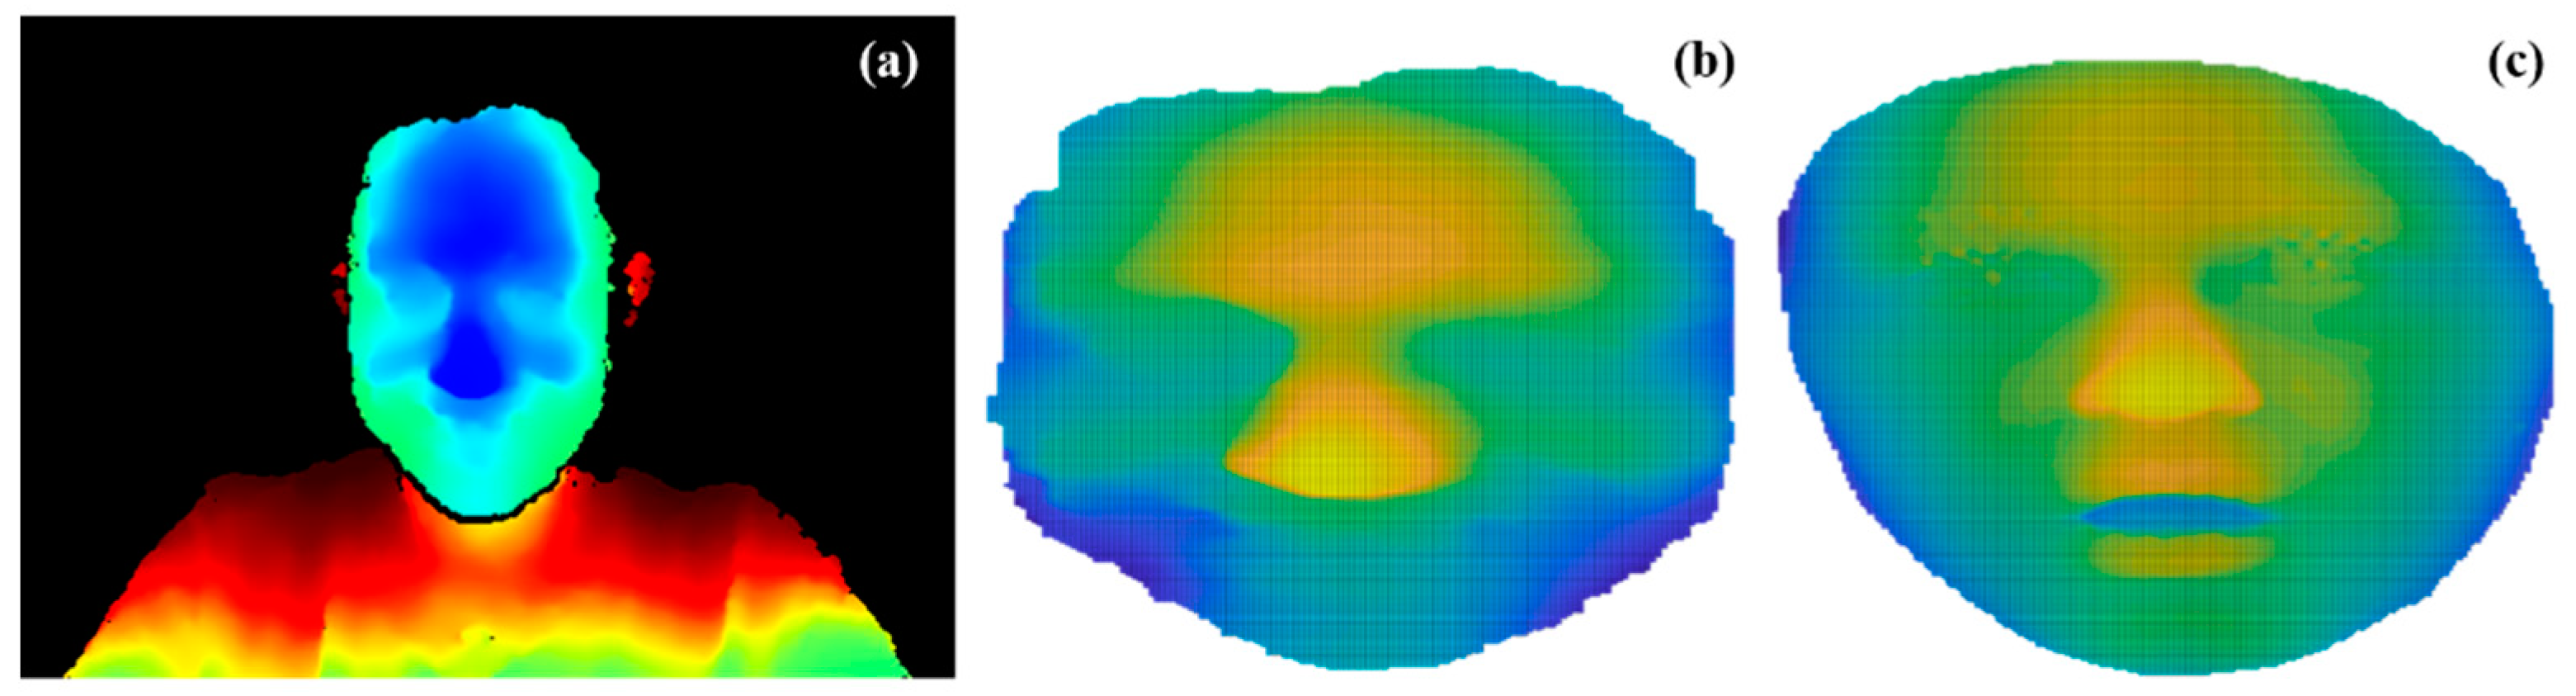
Images acquired by the sensor need an additional step to frame only the subject’s face and to obtain facial shells from depth maps. This operation is performed in MatLab providing raw data as input. Figure 1 shows an example of a facial depth map acquired by the sensor, the corresponding facial shell, and a 3D face image from Bosphorus. Geometrical descriptors k1 and C are computed on this data to obtain 3D Face Descriptors [31,33,34], used as input channels in addiction to facial depth maps. Then, as the last step to adapt the data to the input dimension of MobileNetV2, all the channels need to be resized to 224 × 224. The methodology is described in Figure 2.
The three classes of engagement are deactivation, average activation, and activation. The first one corresponds to a low level of engagement and collects neutral expressions. The second one gathers happy and contented expressions that, according to Russell’s circumplex model of affect [26], mirroring a medium level of engagement. Finally, the last one contains images corresponding to a high level of emotional engagement, labeled as surprise, astonishment, and embarrass (Figure 3).
2.3. User Engagement Scale (UES)
The User Engagement Scale (UES) [35,36] is a questionnaire developed to measure the quality of the user experience. The original UES consists of 31 items, but, in this work, a reduced version of 29 closed-ended questions on a scale of 1 to 7 is used, structured as summarized in Table 1.
To compare the results obtained following the training and testing of the neural network with the data collected from the questionnaires, it is necessary to define a relationship between the scores from 1 to 7 and the 3 classes chosen. For this purpose, the class “deactivation” is identified with a score ranging from 1 to 2, the class “average activation” from 3 to 5, while the class “activation” from 6 to 7, except for items PU. 1, PU. 2, PU. 3, PU. 4, PU. 5, PU. 6, PU. 8, and EN. 3, highlighted in Table 1, that require to reverse code the evaluation scale as they have a negative meaning.
3. Results
The results consist of two main issues. The first one is based on the analysis of the questionnaire and outlines an overall and individual components’ satisfaction rating of the simulator. The second consists in comparing these outcomes with the data obtained from the processing of the videos acquired on the participants with the sensor. A sample of 24 participants (students, postdocs students, PhD students and researchers) with an age from 20 to 30 years and without any payment for their participation, took part in the analysis.
3.1. Reliability of the Questionnaire
In order to assess the quality of the measurement procedure and to consider the results valid, Cronbach’s alpha [37] was computed by correlating the score for each dimension with the total score of user engagement. Cronbach’s alpha is for all the sub-scales higher than the minimum reliability threshold of 0.7, presenting a maximum value of 0.94 for the novelty factor. The answers given to the questionnaires, for all the factors, are consistent since their values ranging within the acceptability threshold above 0.7. Furthermore, mean, median and standard deviation were calculated for a more complete analysis; the means range from 4.03 (equivalent to 57.55%) to 5.54 (79.21%), and the standard deviations from 0.41 to 0.68, with an average value respectively of 4.80 and 0.39. Table 2 summarizes the results of statistical analyses [38,39].
3.2. Analysis of the Questionnaires’ Results
Farmer4.0 simulator has achieved an overall level of users’ engagement of 68.53%. Analyzing each contribution, the sub-scale with the highest level of involvement is perceived usability (PU), which reflects the perceived ease of navigating through the simulator by users. Conversely, the sub-scale with the lowest percentage value, only 57.55%, is focused attention (FA), suggesting that the application is slightly dispersive and not very involving.
From the analysis of the correlation between the different factors of users’ engagement, a “very weak” correlation between aesthetic appeal (AE)–PU, novelty (NO)–PU, and reward factor (RE)–PU, a “weak” correlation between endurability (EN)–PU, a “moderate” correlation between EN–FA, a “strong” correlation between AE–EN, AE–FA, AE–felt involvement (FI), AE–NO, AE–RE, EN–FI, EN–NO, FA–NO, and FA–RE, and a “very strong” correlation between FI–FA and FI–NO emerge. Instead, there is a very weak inverse correlation between PU–FA and PU–FI, and in general a low correlation between PU and all the other sub-scales. An explanation for this result could be that 7 of the 8 items in the perceived usability section have a negative meaning, and it may have been a nuisance to questionnaire participants. All positive and negative correlation values are shown in Table 3. The RE groups the EN, NO, and FI components, and for this reason, the correlation is calculated only among RE and the remaining FA, PU, and AE.
3.3. Deep-Learning Classification
The training of the network has been performed on the Bosphorus public database, dividing it between the training and validation dataset, using only the images referring to facial expressions. A preliminary attempt was made using the transfer learning technique starting from the pretrained network MobileNetV2 [40]. The poor results obtained due to the diversity of input data have made it necessary to train CNN from scratch.
Considering the size of the network and the not very large number of images, data augmentation techniques [41] have been performed to increase the size of the database. A clockwise rotation of 25 degrees and a counterclockwise rotation of 40 degrees for each original image have been performed. Then, the entire resulting database has been mirrored horizontally, obtaining the final database of six times its starting size.
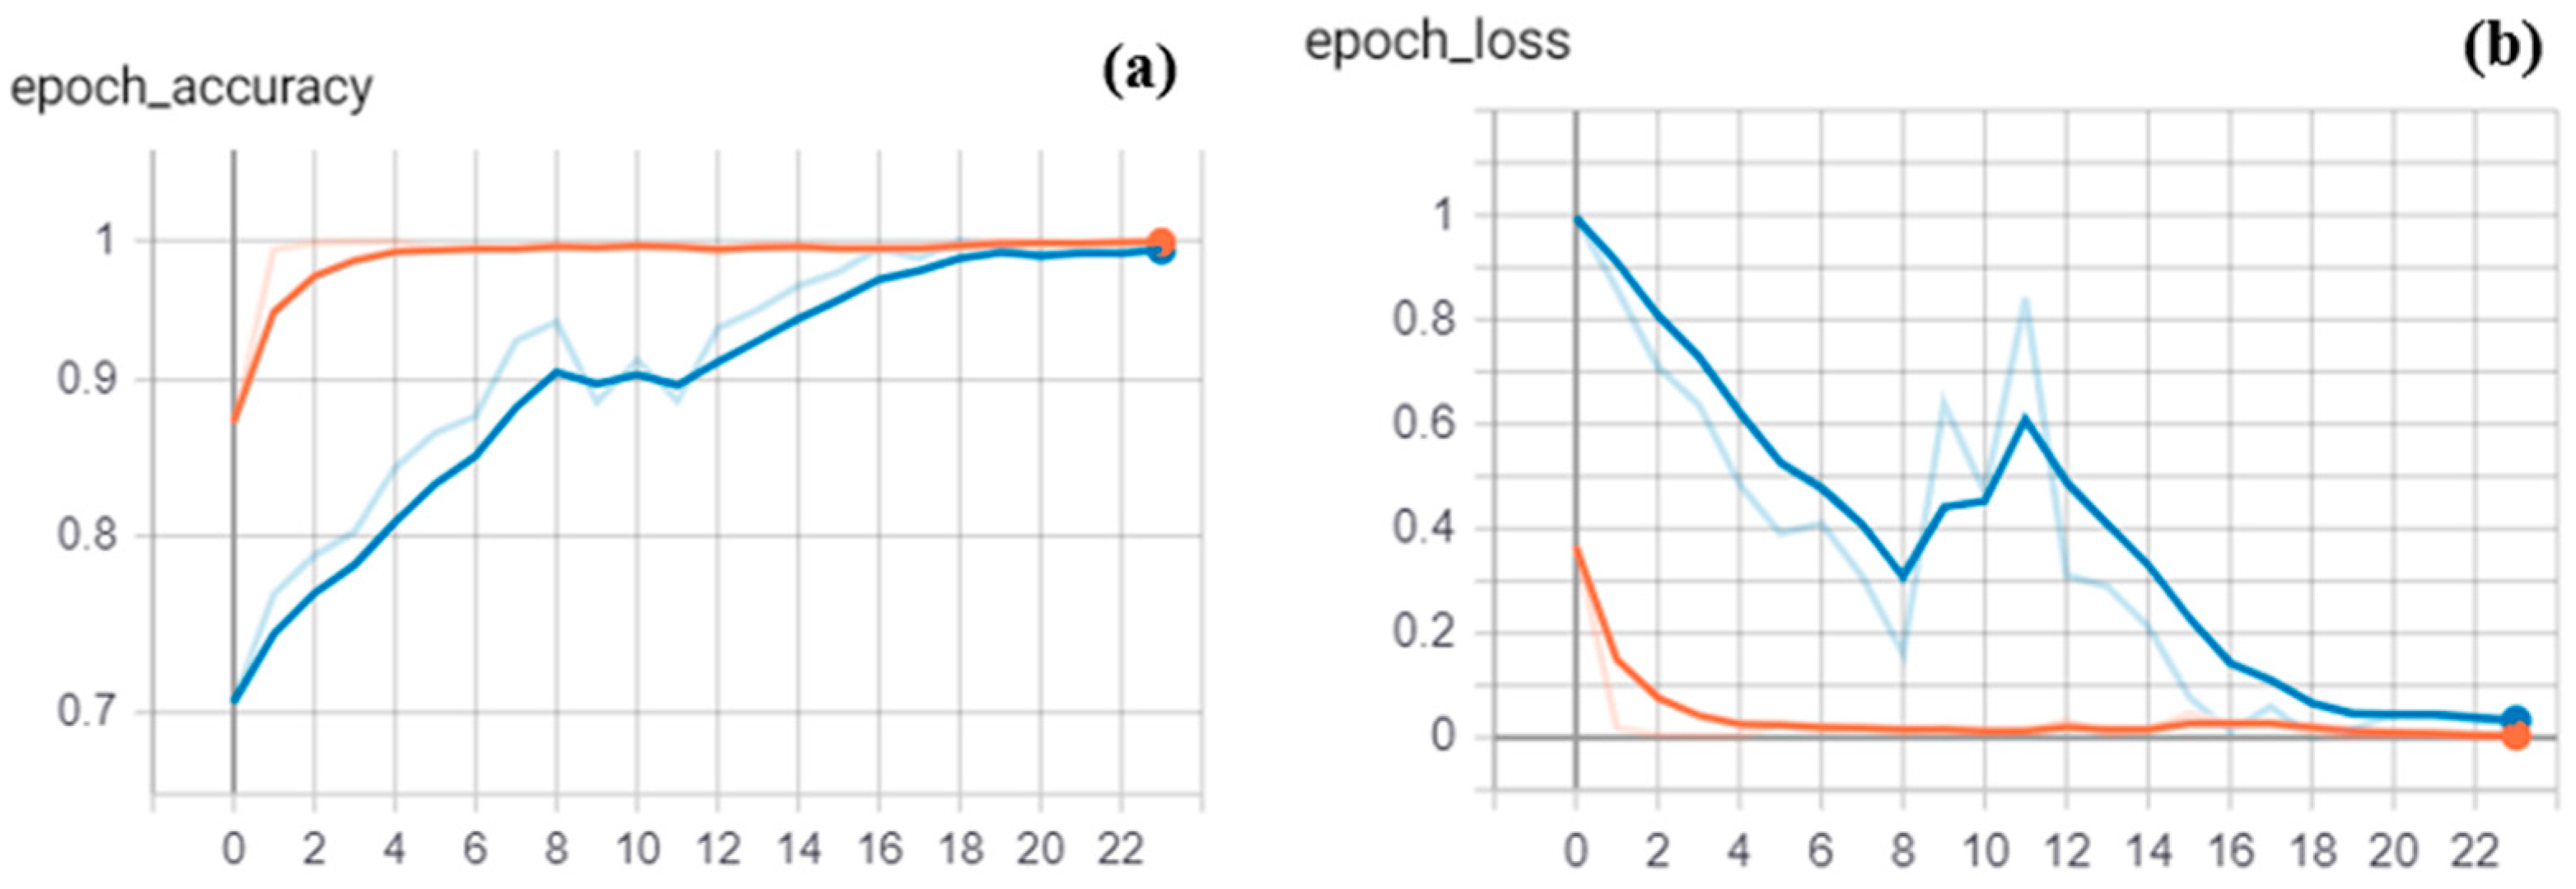
The network has reached a validation accuracy of 99.37%. Figure 4 shows the plots of accuracy and loss from the collected history data on the training (orange) and validation (blue) datasets over training epochs.
After having trained the network, it has been used on the test set to evaluate users’ engagement. The performance of the classification model is shown in Figure 5 by the confusion matrix. In this table, each column represents the predicted values, each row represents the real values, and the color-map indicates the prediction ratio. The number inside each box indicates the correct number of facial expressions recognized regarding the 3 classes of involvement. The accuracy of the testing phase is then calculated as the sum of the correct expressions (51 deactivated, 89 averagely activated, and 53 activated) divided by the total number of acquisitions, with a final score of 72.56%.
3.4. Comparison of Questionnaires and Deep-Learning Classification
The median values of the scores assigned by each user to the UES items on the 7-point Likert scale [42] were divided into the three classes of engagement used for the FER system based on deep learning, according to the following subdivision: deactivation class ranges from 1 to 2, average activation class ranges from 3 to 5, and activation class from 6 to 7. Thanks to this grouping, it is possible to compare the level of engagement emerging from the two methods.
Table 4 shows the median values computed on questionnaire scores for each of the 24 people who participated in this work and the activation class resulting from the trained neural network. The last column indicates if there is a correspondence between the UES method and the FER method.
4. Discussion
The work presented here aims to evaluate the level of engagement of a sample of users, who represent the target audience of the 3D simulator. To increase the involvement, a crucial point for the success of a new product or service, the contents must be interesting and useful for the final customers.
Recent technological development and advances in computer vision have enabled an optimized approach to guarantee an efficient and effective product life cycle, affecting the early stages of design. This research area includes the analysis of the human face and the recognition of facial expressions and emotions for the automatic evaluation of spontaneous feedback.
In this case study, facial analysis techniques were integrated with traditional questionnaires for two main purposes: first, starting from the videos acquired by the sensor, to develop a method capable of measuring involvement; second, to compare the results obtained from the two different methods and evaluate the advantages brought by the FER analysis.
We filmed 24 people taking part in the simulator test with a 3D sensor when replying to the UES questionnaire. The two methods classified 14 participants out of 24 with the same level of involvement. For the remaining users, the UES and FER methods were not in agreement with each other, with on average more positive feedback of the questionnaires. Based on the users’ answers, 8 were strongly activated, 15 were activated to an average extent and only 1 was poorly activated, while based on the images acquired by the sensor, they were 2, 19, and 3 respectively. Therefore, considering the median scores and the class classification of the images labeled for each user, user number 6 and user number 23 had the highest level of engagement.
The UES questionnaire for users 3, 7, 8, 10, 11, and 12 assessed a high level of engagement (a median score equal to 6 or 7), but from the FER analysis it resulted that the largest number of frames acquired for these subjects fell into the intermediate activation class. A similar situation was found for users 2, 16, 19 and 22. They fell into the averagely activated class considering only the results of the questionnaire, while they fell into the deactivated class by the analysis of facial expressions. This could indicate that the actual level of involvement perceived by these subjects was lower than as stated. By comparing the results obtained with those of the previous work on the evaluation of involvement in a virtual learning environment [43], the use of neural networks has led to an improvement of the method. In fact, the correspondence between UES and facial expressions has increased from 50% to 58%. However, the main aim was not to achieve a perfect correlation between UES and neural networks, but to develop a new approach in which the two methods support each other. The future goal is to improve the assessment of engagement through the study of facial expressions.
Questionnaires and FER systems can be integrated into an innovative method for evaluating user engagement, combining information and increasing knowledge for the design of the new product or service. If traditional methods are based on weighted answers, FER methods catch the spontaneous reactions in real-time.
5. Conclusions and Future Works
This preliminary study combines the analysis of facial expressions with the traditional methods of self-reporting, intending to develop a more realistic method for the evaluation of involvement felt by potential users of a 3D simulator. In particular, in this work the virtual environment realized for the European project “FARMER4.0” was used.
The results from the two different approaches coincide for most users, validating the proposed methodology. In some cases, however, they measured two different levels of involvement, attributable to different reasons such as the difficulty in recognizing some feelings, and the non-objectivity of the questionnaires.
Investments and developments in virtual reality technologies are bringing great benefits within the product life cycle in different domains, from industry to amusement. Future developments will allow a perfect integrated communication between the physical and the virtual reality, with a consequent improvement of the service/product in the early design phases and a reduction of costs associated with the production of physical prototypes. The next step will consist in developing a more precise and responsive neural network, able to give a more complete description of a user’s feedback, and to provide results in real-time.
Author Contributions
Conceptualization, M.G.V.; methodology, F.N. and F.M.; software, E.C.O.; validation, F.N., F.M.; formal analysis, F.N.; investigation, F.N.; resources, F.N.; data curation, F.N. and E.C.O.; writing—original draft preparation, F.N.; writing—review and editing, F.N., F.M. and M.G.V.; visualization, F.N. and F.M.; supervision, M.G.V., S.M. and E.V.; project administration, M.G.V., S.M. and E.V.; funding acquisition, M.G.V., S.M. and E.V. All authors have read and agreed to the published version of the manuscript.
Funding
The research undertaken for this work and the analysis of the case study has been possible thanks to the funds of the European Erasmus+ project “Farmer 4.0”, project number: 2018-1-IT01-KA202-006775.
Conflicts of Interest
The authors declare no conflict of interest. The funders had no role in the design of the study; in the collection, analyses, or interpretation of data; in the writing of the manuscript; or in the decision to publish the results.
Appendix A
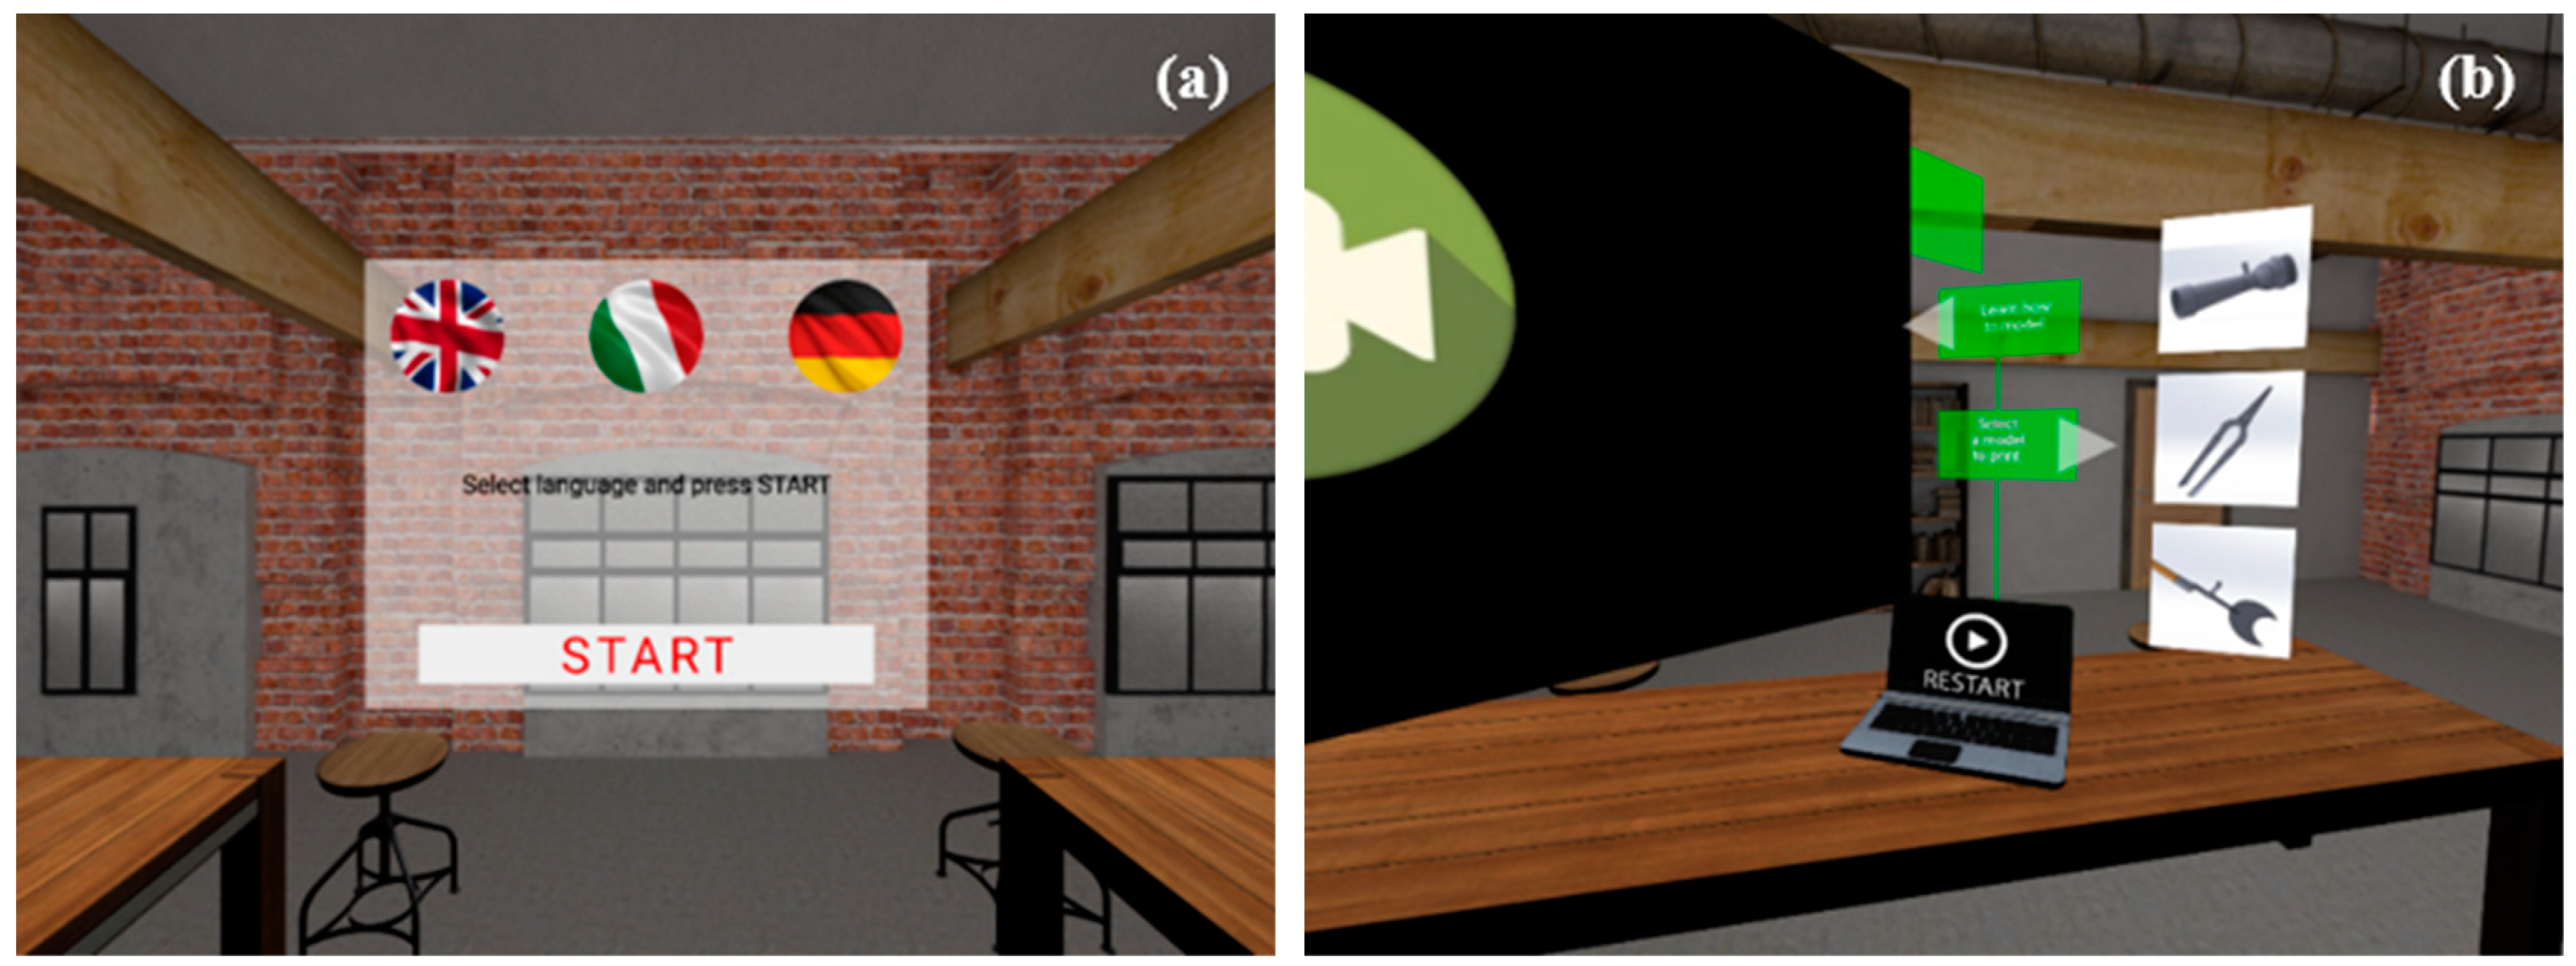
The virtual environment considered in this work is a 3D simulator, included in an e-learning path to be used by farmers and agricultural entrepreneurs who want to experience new technologies within the context of the European Erasmus+ project “Farmer4.0”. The user can approach 3D modeling software and 3D printing, directly interacting with objects in the room of the FabLab.
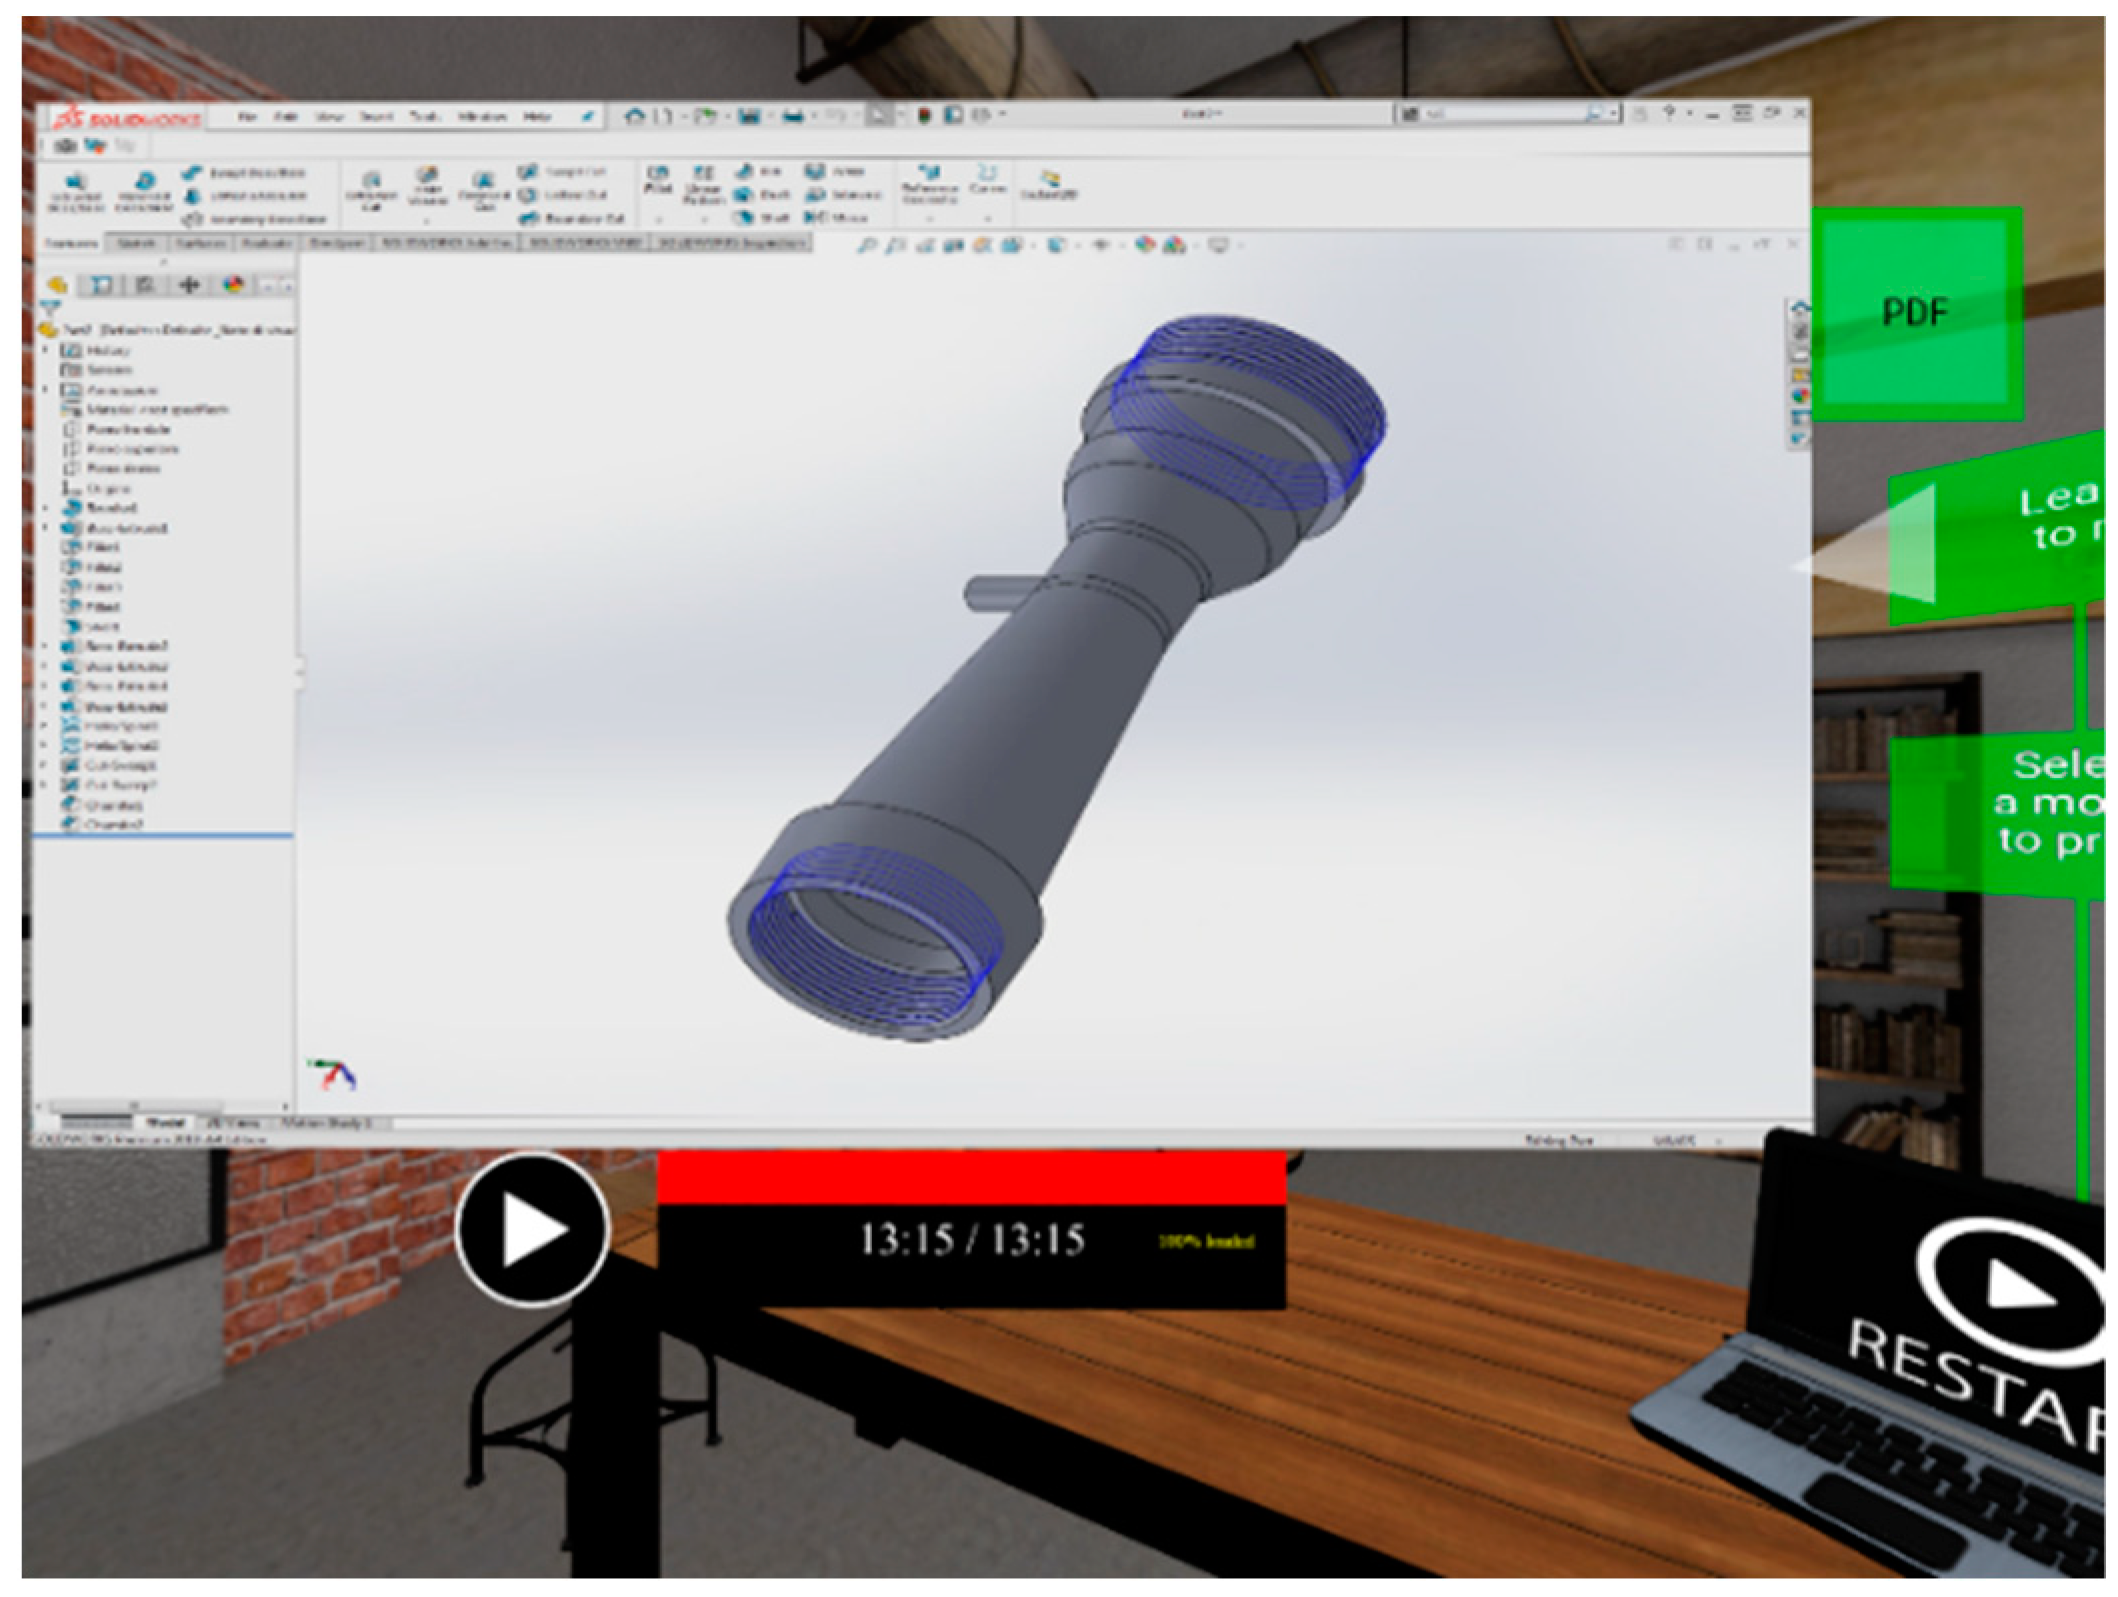
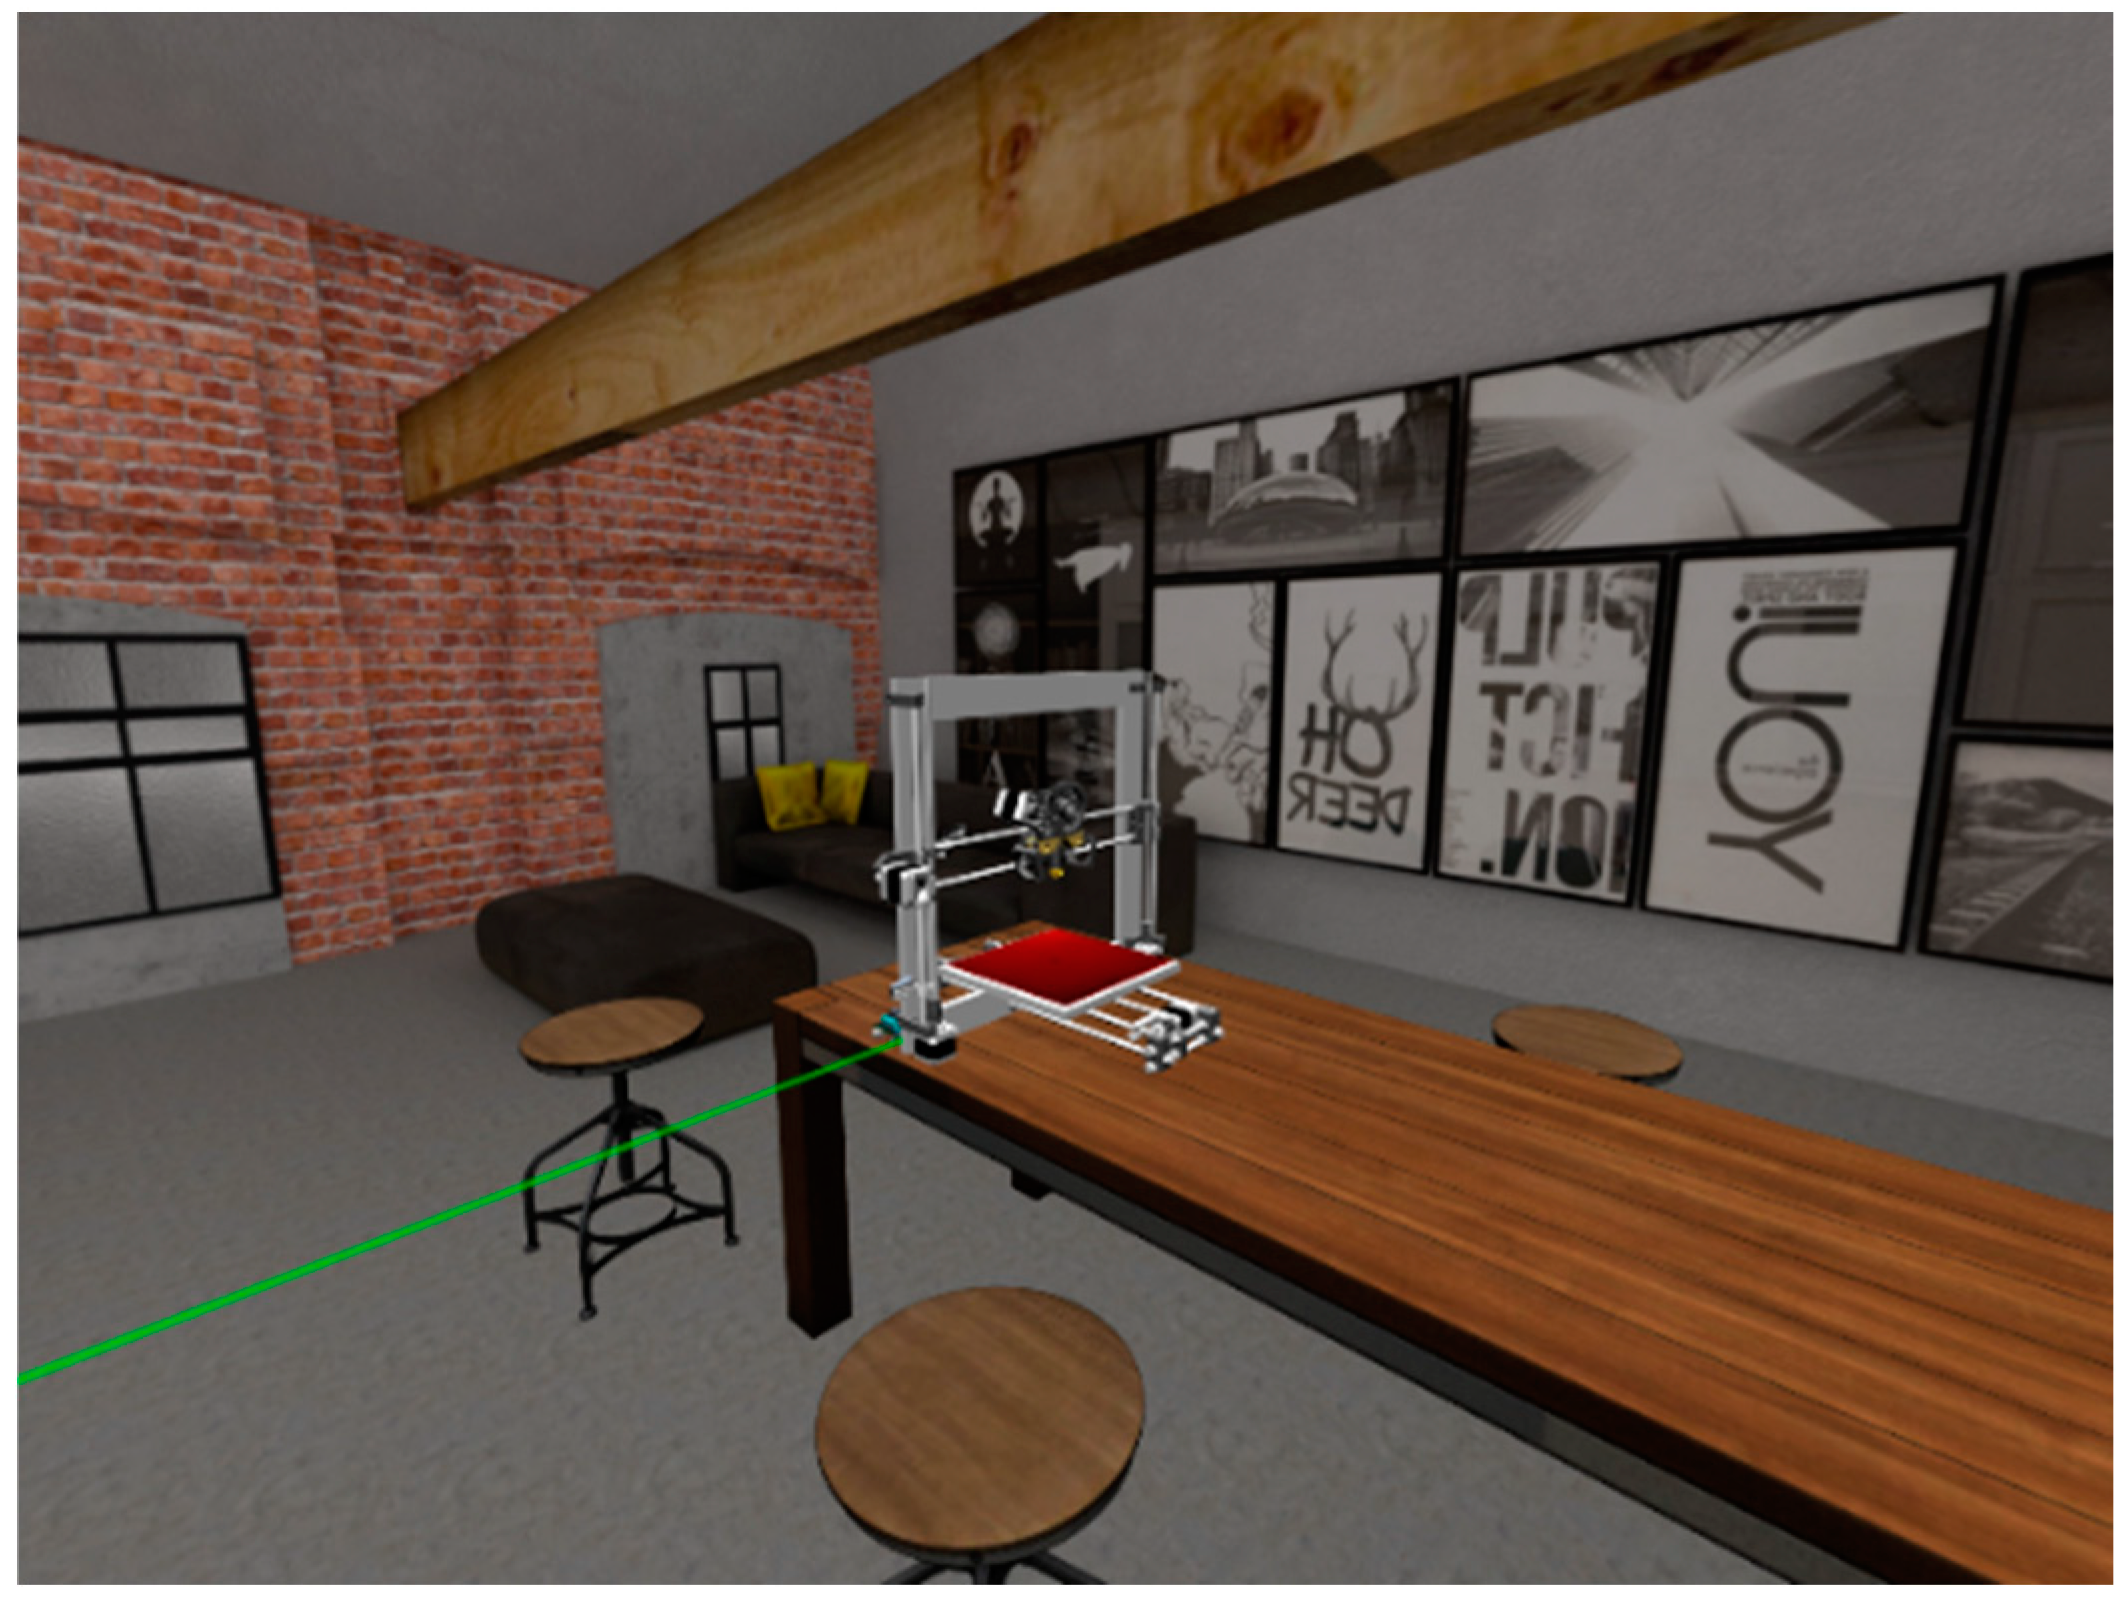
The starting point for the guided exploration of the environment is the computer positioned on the left (Figure A1). Clicking on it, the learner can choose one of the three proposed objects, see the video of the 3D modeling realized with SolidWorks and download the pdf file with the step-by-step explanation (Figure A2) at the same time. At the end of this learning phase, the selected component is printed with the FDM additive manufacturing technique by the printer located on the right of the virtual environment (Figure A3). In addition to the virtual 3D printer, the video recording the real fabrication is shown.
The user can repeat the same steps also for the remaining components, in order to learn the modeling and printing process.
Figure A1.
The main screen of the simulator (a), and the computer (b) with the three proposed objects.
Figure A1.
The main screen of the simulator (a), and the computer (b) with the three proposed objects.

Figure A2.
The video of 3D modeling in SolidWorks of the first object.

Figure A3.
The 3D printing to fabricate the chosen object.

References
- O’Brien, H.L.; Toms, E.G. The development and evaluation of a survey to measure user engagement. J. Am. Soc. Inf. Sci. Technol. 2010, 61, 50–69. [Google Scholar] [CrossRef] [Green Version]
- Shah, S.G.S.; Robinson, I. Benefits of and barriers to involving users in medical device technology development and evaluation. Int. J. Technol. Assess. Health Care 2007, 23, 131–137. [Google Scholar] [CrossRef] [PubMed]
- User Centered System Design: New Perspectives on Human-Computer Interaction. Available online: https://www.taylorfrancis.com/books/e/9780367807320 (accessed on 20 December 2019).
- Norman, D.A. Human-centered design considered harmful. Interactions 2005, 12, 14. [Google Scholar] [CrossRef]
- Benefits of Co-Design in Service Design Projects. Available online: http://www.ijdesign.org/index.php/IJDesign/article/view/890 (accessed on 20 December 2019).
- Fredricks, J.A.; Blumenfeld, P.; Friedel, J.; Paris, A. School Engagement. In What Do Children Need to Flourish: Conceptualizing and Measuring Indicators of Positive Development; The Search Institute series on developmentally attentive community and society; Springer Science + Business Media: New York, NY, USA, 2005; pp. 305–321. ISBN 978-0-387-23061-0. [Google Scholar]
- Bordegoni, M.; Faconti, G.; Feiner, S.; Maybury, M.T.; Rist, T.; Ruggieri, S.; Trahanias, P.; Wilson, M. A standard reference model for intelligent multimedia presentation systems. Comput. Stand. Interfaces 1997, 18, 477–496. [Google Scholar] [CrossRef]
- Gettinger, M.; Seibert, J.K. Best Practices in Increasing Academic Learning Time. Best Pract. Sch. Psychol. IV 2002, 1, 773–787. [Google Scholar]
- Violante, M.G.; Vezzetti, E. Design and implementation of 3D Web-based interactive medical devices for educational purposes. Int. J. Interact. Des. Manuf. IJIDeM 2017, 11, 31–44. [Google Scholar] [CrossRef] [Green Version]
- Violante, M.G.; Vezzetti, E. Virtual Interactive e-Learning Application: An Evaluation of the Student Satisfaction. Comput. Appl. Eng. Educ. 2015, 23, 72–91. [Google Scholar] [CrossRef] [Green Version]
- Violante, M.G.; Vezzetti, E. Implementing a new approach for the design of an e-learning platform in engineering education. Comput. Appl. Eng. Educ. 2014, 4, 708–727. [Google Scholar] [CrossRef] [Green Version]
- Lalmas, M.; O’Brien, H.; Yom-Tov, E. Measuring User Engagement; Synthesis Lectures on Information Concepts, Retrieval, and Services; Morgan Claypool: San Rafael, CA, USA, 2014; Volume 6, pp. 1–132. [Google Scholar]
- Kuh, G.D. The national survey of student engagement: Conceptual and empirical foundations. New Dir. Institutional Res. 2009, 2009, 5–20. [Google Scholar] [CrossRef]
- Parsons, S.A.; Nuland, L.R.; Parsons, A.W. The ABCs of Student Engagement. Phi Delta Kappan 2014, 95, 23–27. [Google Scholar] [CrossRef]
- Berka, C.; Levendowski, D.J.; Lumicao, M.N.; Yau, A.H.L.; Davis, G.; Zivkovic, V.T.; Olmstead, R.; Tremoulet, P.D.; Craven, P.L. EEG correlates of task engagement and mental workload in vigilance, learning, and memory tasks. Aviat. Space Environ. Med. 2007, 78, B231–B244. [Google Scholar] [PubMed]
- Sparacino, J.; Ronchi, D.; Brenner, M.; Kuhn, J.W.; Flesch, A.L. Psychological correlates of blood pressure: A closer examination of hostility, anxiety, and engagement. Nurs. Res. 1982, 31, 143–149. [Google Scholar] [CrossRef] [PubMed]
- Boekaerts, M. Engagement as an inherent aspect of the learning process. Learn. Instr. 2016, 43, 76–83. [Google Scholar] [CrossRef]
- Parsons, J.; Taylor, L. Improving Student Engagement. Curr. Issues Educ. 2011, 14, 745. [Google Scholar]
- Duraisamy, P.; Van Haneghan, J.; Blackwell, W.; Jackson, S.C.; Murugesan, G.; Tamilselvan, K.S. Classroom engagement evaluation using computer vision techniques. In Proceedings of the Pattern Recognition and Tracking XXX, International Society for Optics and Photonics, Baltimore, MD, USA, 15–16 April 2019; SPIE: Bellingham, WA, USA, 2019; Volume 10995, p. 109950R. [Google Scholar]
- Chanel, G.; Rebetez, C.; Bétrancourt, M.; Pun, T. Boredom, Engagement and Anxiety as Indicators for Adaptation to Difficulty in Games. In Proceedings of the 12th International Conference on Entertainment and Media in the Ubiquitous Era, New York, NY, USA, 7 October 2008; pp. 13–17. [Google Scholar]
- Latulipe, C.; Carroll, E.A.; Lottridge, D. Love, Hate, Arousal and Engagement: Exploring Audience Responses to Performing Arts. In Proceedings of the SIGCHI Conference on Human Factors in Computing Systems, Vancouver, BC, Canada, 7–12 May 2011; pp. 1845–1854. [Google Scholar]
- Nonis, F.; Dagnes, N.; Marcolin, F.; Vezzetti, E. 3D Approaches and Challenges in Facial Expression Recognition Algorithms—A Literature Review. Appl. Sci. 2019, 9, 3904. [Google Scholar] [CrossRef] [Green Version]
- Ekman, P.; Friesen, W.V. Constants across cultures in the face and emotion. J. Personal. Soc. Psychol. 1971, 17, 124–129. [Google Scholar] [CrossRef] [Green Version]
- Li, S.; Deng, W. Deep Facial Expression Recognition: A Survey. arXiv 2018, arXiv:1804.08348 Cs. [Google Scholar]
- LeCun, Y.; Bengio, Y.; Hinton, G. Deep learning. Nature 2015, 521, 436. [Google Scholar] [CrossRef]
- Russell, J.A. A circumplex model of affect. J. Personal. Soc. Psychol. 1980, 39, 1161–1178. [Google Scholar] [CrossRef]
- Feng, J.; Guo, Q.; Guan, Y.; Wu, M.; Zhang, X.; Ti, C. 3D Face Recognition Method Based on Deep Convolutional Neural Network. In Smart Innovations in Communication and Computational Sciences; Panigrahi, B.K., Trivedi, M.C., Mishra, K.K., Tiwari, S., Singh, P.K., Eds.; Springer: Singapore, 2019; pp. 123–130. [Google Scholar]
- Mollahosseini, A.; Chan, D.; Mahoor, M.H. Going deeper in facial expression recognition using deep neural networks. In Proceedings of the 2016 IEEE Winter Conference on Applications of Computer Vision (WACV), Lake Placid, NY, USA, 7–10 March 2016; pp. 1–10. [Google Scholar]
- Savran, A.; Alyüz, N.; Dibeklioğlu, H.; Çeliktutan, O.; Gökberk, B.; Sankur, B.; Akarun, L. Bosphorus Database for 3D Face Analysis. In Biometrics and Identity Management; Schouten, B., Juul, N.C., Drygajlo, A., Tistarelli, M., Eds.; Springer: Berlin, Germany, 2008; pp. 47–56. [Google Scholar]
- Ciravegna, G.; Cirrincione, G.; Marcolin, F.; Barbiero, P.; Dagnes, N.; Piccolo, E. Assessing Discriminating Capability of Geometrical Descriptors for 3D Face Recognition by Using the GH-EXIN Neural Network. In Neural Approaches to Dynamics of Signal Exchanges; Esposito, A., Faundez-Zanuy, M., Morabito, F.C., Pasero, E., Eds.; Smart Innovation, Systems and Technologies; Springer: Singapore, 2020; pp. 223–233. ISBN 9789811389504. [Google Scholar]
- Marcolin, F.; Vezzetti, E. Novel descriptors for geometrical 3D face analysis. Multimed. Tools Appl. 2017, 76, 13805–13834. [Google Scholar] [CrossRef] [Green Version]
- Olivetti, E.C.; Ferretti, J.; Cirrincione, G.; Nonis, F.; Tornincasa, S.; Marcolin, F. Deep CNN for 3D Face Recognition. In Design Tools and Methods in Industrial Engineering; Rizzi, C., Andrisano, A.O., Leali, F., Gherardini, F., Pini, F., Vergnano, A., Eds.; Springer International Publishing: Cham, Switzerland, 2020; pp. 665–674. [Google Scholar]
- Vezzetti, E.; Marcolin, F.; Fracastoro, G. 3D face recognition: An automatic strategy based on geometrical descriptors and landmarks. Robot. Auton. Syst. 2014, 62, 1768–1776. [Google Scholar] [CrossRef] [Green Version]
- Dagnes, N.; Marcolin, F.; Nonis, F.; Tornincasa, S.; Vezzetti, E. 3D geometry-based face recognition in presence of eye and mouth occlusions. Int. J. Interact. Des. Manuf. IJIDeM 2019, 13, 1617–1635. [Google Scholar] [CrossRef]
- O’Brien, H.L.; Toms, E.G. Examining the generalizability of the User Engagement Scale (UES) in exploratory search. Inf. Process. Manag. 2013, 49, 1092–1107. [Google Scholar] [CrossRef] [Green Version]
- O’Brien, H.L.; Cairns, P.; Hall, M. A practical approach to measuring user engagement with the refined user engagement scale (UES) and new UES short form. Int. J. Hum. Comput. Stud. 2018, 112, 28–39. [Google Scholar] [CrossRef]
- Cronbach, L.J. Coefficient alpha and the internal structure of tests. Psychometrika 1951, 16, 297–334. [Google Scholar] [CrossRef] [Green Version]
- DeVellis, R.F. Scale Development: Theory and Applications; SAGE Publications: Thousand Oaks, CA, USA, 2016; ISBN 978-1-5063-4157-6. [Google Scholar]
- Evans, J.D. Straightforward Statistics for the Behavioral Sciences; Straightforward statistics for the behavioral sciences; Thomson Brooks/Cole Publishing Co: Belmont, CA, USA, 1996; ISBN 978-0-534-23100-2. [Google Scholar]
- Sandler, M.; Howard, A.; Zhu, M.; Zhmoginov, A.; Chen, L.-C. MobileNetV2: Inverted Residuals and Linear Bottlenecks. In Proceedings of the 2018 IEEE/CVF Conference on Computer Vision and Pattern Recognition, Salt Lake City, UT, USA, 18–23 June 2018; pp. 4510–4520. [Google Scholar]
- Perez, L.; Wang, J. The Effectiveness of Data Augmentation in Image Classification using Deep Learning. arXiv 2017, arXiv:1712.04621. [Google Scholar]
- Joshi, A.; Kale, S.; Chandel, S.; Pal, D. Likert Scale: Explored and Explained. Br. J. Appl. Sci. Technol. 2015, 7, 396–403. [Google Scholar] [CrossRef]
- Carlotta Olivetti, E.; Violante, M.G.; Vezzetti, E.; Marcolin, F.; Eynard, B. Eynard Engagement Evaluation in a Virtual Learning Environment via Facial Expression Recognition and Self-Reports: A Preliminary Approach. Appl. Sci. 2019, 10, 314. [Google Scholar] [CrossRef] [Green Version]
Figure 1.
Depth map in output from the 3D sensor (a), the same data elaborated in MatLab (b), and the shell of a Bosphorus DB image (c).
Figure 1.
Depth map in output from the 3D sensor (a), the same data elaborated in MatLab (b), and the shell of a Bosphorus DB image (c).

Figure 2.
Scheme of the proposed methodology. Blue refers to the sensor, from acquisitions to test set, orange refers to the Bosphorus DB, and green to the common operations of data preparation and pre-processing.
Figure 2.
Scheme of the proposed methodology. Blue refers to the sensor, from acquisitions to test set, orange refers to the Bosphorus DB, and green to the common operations of data preparation and pre-processing.

Figure 3.
The position on the Russell’s model of the three classes of involvement considered: deactivation, average activation, and activation.
Figure 3.
The position on the Russell’s model of the three classes of involvement considered: deactivation, average activation, and activation.

Figure 4.
Tensorboard diagrams of accuracy (a) and loss (b) on the training and validation dataset, respectively orange and blue, over training epochs. The training and validation accuracy gradually increase to around 1, whereas the training and validation loss converges to 0.01 after 23 epochs. Overfitting does not occur during the training.

Figure 5.
Confusion matrix that describes the performance of the classification model on the test set. The rows of the confusion matrix correspond to the true labels and the columns to the predicted labels. The number of rows and column is equal to the number of the classes.
Figure 5.
Confusion matrix that describes the performance of the classification model on the test set. The rows of the confusion matrix correspond to the true labels and the columns to the predicted labels. The number of rows and column is equal to the number of the classes.


Table 1.
The 29-items of the User Engagement Scale (UES) questionnaire divided into the six dimensions of engagement: focused attention (FA), perceived usability (PU), aesthetic appeal (AE), endurability (EN), novelty (NO), and felt involvement (FI). The negative closed-ended questions are highlighted in red.
| Focused Attention | FA. 1 | I lost myself in this experience |
| FA. 2 | I was so involved in this experience that I lost track of time | |
| FA. 3 | I blocked out things around me when I was using “Farmer4.0 Simulator” | |
| FA. 5 | The time I spent using “Farmer4.0 Simulator” just slipped away | |
| FA. 6 | I was absorbed in this experience | |
| Perceived Usability | PU. 1 | I felt frustrated while using this “Farmer4.0 Simulator” |
| PU. 2 | I found this “Farmer4.0 Simulator” confusing to use | |
| PU. 3 | I felt annoyed while using “Farmer4.0 Simulator” | |
| PU. 4 | I felt discouraged while using this “Farmer4.0 Simulator” | |
| PU. 5 | Using this “Farmer4.0 Simulator” was mentally taxing | |
| PU. 6 | This experience was demanding | |
| PU. 7 | I felt in control while using this “Farmer4.0 Simulator” | |
| PU. 8 | I could not do some of the things I needed to do while using “Farmer4.0 Simulator” | |
| Aesthetic Appeal | AE. 1 | This “Farmer4.0 Simulator” was attractive |
| AE. 2 | This “Farmer4.0 Simulator” was aesthetically appealing | |
| AE. 3 | I liked the graphics and images of “Farmer4.0 Simulator” | |
| AE. 4 | “Farmer4.0 Simulator” appealed to be visual senses | |
| AE. 5 | The screen layout of “Farmer4.0 Simulator” was visually pleasing | |
| Endurability | EN. 1 | Using “Farmer4.0 Simulator” was worthwhile |
| EN. 2 | I consider my experience a success | |
| EN. 3 | This experience did not work out the way I had planned | |
| EN. 4 | My experience was rewarding | |
| EN. 5 | I would recommend “Farmer4.0 Simulator” to my family and friends | |
| Novelty | NO. 1 | I continued to use “Farmer4.0 Simulator” out of curiosity |
| NO. 2 | The content of “Farmer4.0 Simulator” incited my curiosity | |
| NO. 3 | I felt interested in my task | |
| Felt Involvement | FI. 1 | I was really drawn into my task |
| FI. 2 | I felt involved in this task | |
| FI. 3 | This experience was fun |
Table 2.
Sub-scales of User Engagement (UE), number of items corresponding, and results of the analyses performed: Cronbach’s alpha, mean, mean %, median, and standard deviation.
Table 2.
Sub-scales of User Engagement (UE), number of items corresponding, and results of the analyses performed: Cronbach’s alpha, mean, mean %, median, and standard deviation.
| User Engagement | Items | Cronbach’s α | Mean | Mean % 1 | Median | Standard Deviation |
|---|---|---|---|---|---|---|
| Focused Attention | 5 | 0.90 | 4.03 | 57.55 | 4 | 0.58 |
| Perceived Usability | 8 | 0.80 | 5.54 | 79.21 | 6.25 | 0.51 |
| Aesthetics | 5 | 0.93 | 4.71 | 67.24 | 5 | 0.41 |
| Endurability | 5 | 0.78 | 4.29 | 61.22 | 4 | 0.68 |
| Novelty | 3 | 0.94 | 4.98 | 71.09 | 5 | 0.53 |
| Felt Involvement | 3 | 0.90 | 4.90 | 70.07 | 5 | 0.43 |
| Reward | 11 | 0.92 | 4.64 | 66.33 | 5 | 0.48 |
| Total | 29 | 0.93 | 4.80 | 68.53 | 5 | 0.39 |
1 Corresponds to the percentage calculation of the mean (Mean/7*100).
Table 3.
Correlation among the six factors.
| FA | PU | AE | EN | NO | FI | RE | |
|---|---|---|---|---|---|---|---|
| FA | 1 | ||||||
| PU | −0.13 | 1 | |||||
| AE | 0.60 | 0.12 | 1 | ||||
| EN | 0.47 | 0.37 | 0.66 | 1 | |||
| NO | 0.71 | 0.02 | 0.75 | 0.70 | 1 | ||
| FI | 0.80 | −0.10 | 0.77 | 0.69 | 0.91 | 1 | |
| RE | 0.69 | 0.16 | 0.78 | - | - | - | 1 |
Table 4.
Results of the UES questionnaire and facial expression analysis and recognition (FER) classification. The last column shows for each user whether there is a correspondence between the two methods.
Table 4.
Results of the UES questionnaire and facial expression analysis and recognition (FER) classification. The last column shows for each user whether there is a correspondence between the two methods.
| User | UES Median Score | FER Classification | Correspondence |
|---|---|---|---|
| 1 | 4 | Average activation | Yes |
| 2 | 4 | Deactivation | No |
| 3 | 6 | Average activation | No |
| 4 | 4 | Average activation | Yes |
| 5 | 5 | Average activation | Yes |
| 6 | 7 | Activation | Yes |
| 7 | 7 | Average activation | No |
| 8 | 6 | Average activation | No |
| 9 | 5 | Average activation | Yes |
| 10 | 6 | Average activation | No |
| 11 | 6 | Average activation | No |
| 12 | 6 | Average activation | No |
| 13 | 5 | Average activation | Yes |
| 14 | 4 | Average activation | Yes |
| 15 | 5 | Average activation | Yes |
| 16 | 5 | Deactivation | No |
| 17 | 4 | Average activation | Yes |
| 18 | 4 | Average activation | Yes |
| 19 | 3 | Deactivation | No |
| 20 | 4 | Average activation | Yes |
| 21 | 3 | Average activation | Yes |
| 22 | 2 | Average activation | No |
| 23 | 6 | Activation | Yes |
| 24 | 5 | Average activation | Yes |
© 2020 by the authors. Licensee MDPI, Basel, Switzerland. This article is an open access article distributed under the terms and conditions of the Creative Commons Attribution (CC BY) license (http://creativecommons.org/licenses/by/4.0/).
Share and Cite
MDPI and ACS Style
Nonis, F.; Olivetti, E.C.; Marcolin, F.; Violante, M.G.; Vezzetti, E.; Moos, S. Questionnaires or Inner Feelings: Who Measures the Engagement Better? Appl. Sci. 2020, 10, 609. https://0-doi-org.brum.beds.ac.uk/10.3390/app10020609
AMA Style
Nonis F, Olivetti EC, Marcolin F, Violante MG, Vezzetti E, Moos S. Questionnaires or Inner Feelings: Who Measures the Engagement Better? Applied Sciences. 2020; 10(2):609. https://0-doi-org.brum.beds.ac.uk/10.3390/app10020609
Chicago/Turabian StyleNonis, Francesca, Elena Carlotta Olivetti, Federica Marcolin, Maria Grazia Violante, Enrico Vezzetti, and Sandro Moos. 2020. "Questionnaires or Inner Feelings: Who Measures the Engagement Better?" Applied Sciences 10, no. 2: 609. https://0-doi-org.brum.beds.ac.uk/10.3390/app10020609
Note that from the first issue of 2016, this journal uses article numbers instead of page numbers. See further details here.