Article

Demand Prediction Using a Soft-Computing Approach: A Case Study of Automotive Industry

by
Tomas Eloy Salais-Fierro
1,
Jania Astrid Saucedo-Martinez
1,
Roman Rodriguez-Aguilar
2,* and
Jose Manuel Vela-Haro
1
1
Facultad de Ingenieria Mecanica y Electrica, Universidad Autonoma de Nuevo Leon, Pedro de Alba S/N, Ciudad Universitaria, San Nicolás de los Garza, Nuevo Leon 66451, Mexico
2
Escuela de Ciencias Económicas y Empresariales, Universidad Panamericana, Augusto Rodin 498, Mexico, Mexico City 03920, Mexico
*
Author to whom correspondence should be addressed.
Submission received: 25 November 2019 / Revised: 17 December 2019 / Accepted: 19 December 2019 / Published: 24 January 2020
(This article belongs to the Special Issue Applied Optimization in Clean and Renewable Energy: New Trends)

Abstract

:
According to the literature review performed, there are few methods focused on the study of qualitative and quantitative variables when making demand projections by using fuzzy logic and artificial neural networks. The purpose of this research is to build a hybrid method for integrating demand forecasts generated from expert judgements and historical data and application in the automotive industry. Demand forecasts through the integration of variables; expert judgements and historical data using fuzzy logic and neural network. The methodology includes the integration of expert and historical data applying the Delphi method as a means of collecting fuzzy date. The result according to proposed methodology shows how fuzzy logic and neural networks is an alternative for demand planning activity. Machine learning techniques are techniques that generate alternatives for the tools development for demand forecasting. In this study, qualitative and quantitative variables are integrated through the implementation of fuzzy logic and time series artificial neural networks. The study aims to focus in manufacturing industry factors in conjunction time series data.

1. Introduction

The definition of supply chain is used to include activities the flow of goods from the suppliers to the final consumer [1]. There are many factors affect supply chain performance [2]. Some of the most important factors that affect the companies performance are the decisions made based on the planning and the demand forecasting process, because they are processes in which various areas of the companies are based on [3].
This document focuses on the conflicts that arise from suppliers to consumers when incorrect sales projections are generated. That is, to avoid a poor forecast, planners need to integrate activities related to transport, transformation and distribution of goods through good collaboration in the supply chain [4].
One of the effects of poor planning is the well-known whip effect that distorts the flow of materials along the supply chain channel [5]. This is reflected in the excessive supplying and obsolescing therefore the costs of each of the participating organizations increase.
Therefore, collaboration between the different areas of the company is an indispensable part for proper business administration, which results in effective decision making. However, a bias is generated when only one variable is considered in the preparation of the forecast, for example using only sales data. Because of this, an inadequate demand projection arises resulting in additional costs and operational inefficiencies [6].
Today, demand forecasting is a planning activity that includes new analytical tools that add to the known traditional methods. Some of the traditional methods are moving averages, weighted average, smoothing and exponential regression and other novel approaches such as Walsh—Fourier techniques [7]. The methods mentioned above are added techniques derived from the principles of artificial intelligence such as artificial neural networks, fuzzy logic, big data, among other new mathematical techniques. [3,8]. On the other hand, there are also qualitative techniques that consist of the empirical interpretation of future sales. Finally, current managers make decisions taking into account more than one methodology. Concluding that by applying two or more tools for decision-making it would be possible to increase efficiency in the planning process [9].
In addition, it is important to mention that the judgement issued by the experts discriminate against any type of mathematical method in the qualitative field, this allows generat projections that are adjusted according to intuition and evaluated in the same way [10]. This type of projection has the ability to generate high levels of certainty in the planning process because the expert requires better results than those obtained only with mathematical tools.
In summary, traditional techniques combined with new techniques become increasingly important in modern decision-making processes. Therefore, the use of mathematical and statistical models combined with tools that allow the integration of historical sales data with other relevant information. With this, sales projections can be generated for future periods, reducing forecast errors and generating more efficient decision and operational processes [11].
In this research, a fuzzy inference system is used to forecast the demand for light vehicles in the automotive industry. This model incorporates environmental factors that change the level of sales as input and demand as output. This paper is organized as follows: Section 2 presents a literature review of statistics and artificial intelligence techniques for forecasting in the supply chain. Section 3 explains the proposed methodology that integrates different techniques in the demand projection model based on the fuzzy inference system. Section 4 describes the application of the model in the industrial automotive industry. Finally, Section 5 presents the conclusion.

2. Literature Review

This section, literature review, is made up of the analysis of research surveys, the review of fuzzy logic methods and the explanation of artificial neural networks. With this, the main tools implemented in the proposed methodology are documented; such as the use of surveys and the application of fuzzy logic and artificial neural networks.

2.1. Expert Judgements

The data generated in the organizations are indispensable in the planning process, this information can contribute to generate adequate decisions for the commercial activities and provides support to the supply chain as long as they are analyzed correctly. Surveys are the most used tools for data collection, which are popular in areas and sectors such as the health, social and industrial sector [12,13,14]. The opinion in the medical sector has gained great relevance through the application of surveys to patients as they support a variety of research. Through this tool the data are standardized and homogenized [15,16].
Also, the surveys have also been applied in the social sector, focused on the study of population and government, allowing to generate information that can be used to take decisions [17]. In the same way they are applied in the business sector, focused on the analysis and seeking the opinions convergence [18].
Opinion-based collaboration also improves supply chain management and improves production orders, activity planning and decision making. Otherwise, a unique opinion does not always go well and generates bias by having only one perception. Through the combination it is possible to improve the planning process. The combination of perspectives helps enrich any task, address more environments and generate better approaches. For instance, [19] introduce a new approach of forecasting using a multi-criteria decision making (MCDM) model which integrates quality and cost type attributes.
In addition to the above mentioned, new technologies have been increasingly relevant in the planning process. These technologies can be carried out in the collection of information, telecommunications systems and artificial intelligence [20,21].

2.2. Fuzzy Logic

Fuzzy logic is a technique applied to the study of data sets belonging to different classifications or segments, allowing the study of relationships to different segments. In addition, fuzzy logic has been widely applied in the areas of fuzzy controller engineering, among other [22].
Diffuse logic is applied in different areas under study as a means of smoothing. That is, it reduces abrupt changes to generate smooth action curves. There are different methods in fuzzy logic, Mamdani and Sugeno are the most used. These are composed of four fundamental stages, fuzzyfication, background evaluation, aggregation and defuzzyfication [23].
The fuzzy logic technique in the planning process is also applied as a adjustment means. The methodology proposed by [24] contemplates the seasonal variables study, perception and competition as dynamic axes in the forecast. While the work elaborated by [25] envisages the fuzzy logic application as a adjustment means in the planning sector in electric energy consumption of Colombia, based only on the data of demand. In addition, the work developed by [26] also contemplates the development of electrical energy through the application of means C. It has also been applied by [27] in the stock market, with the aim of integrating environmental variables to adjust the dynamic behavior, this research considers the behavior of oil and market values.

2.3. Artificial Neural Network

Since demand forecasting is a topic widely studied by academia and industry, the application of traditional techniques combined with artificial intelligence (AI) has been considered. Some of the related AI techniques are artificial neural networks, fuzzy logic, genetic algorithms, among many others.
The classical methods implementation is commonly derived from the certainty generated in the predictions process. The work developed by [28], proposes the prediction methods integration with application in psychology, statistics and administrative sciences. On the other hand, [29] include integration collection techniques in times series and judgements of experts and [30] propose a forecasting methodology integrated by expert judgements and quality components, combining qualitative and quantitative forecasts at the same level or simultaneous action and establishing an entry to this type of model.
Artificial intelligence techniques have acquired great relevance in sales projection. Artificial intelligence techniques applied in the forecast of supply chain demand through multilayer neural networks and evaluation of learning algorithms have been one of the most popular applications. For example, in the multilayer perceptron artificial neural network presented by [31], the forecasted demand is made up of historical data and applies a backpropagation learning (BPN) rule, which shows its effectiveness.
In addition, artificial neural networks have been implemented in the prediction of demand by [32], in their work traditional methodologies are developed with a focus on the historical data of the textile industry. In addition, the research conducted by [33] makes the comparison of traditional mathematical techniques and statistics with the results of the artificial neural network and [34] propose an approach for comparison in evolutionary artificial neural networks by integrating genetic algorithms.
Access to the use of new technologies also allows the development of new methods for forecasting demand. These are fed through the study of qualitative variables that are weighted to understand the environmental and quantitative factors that are commonly known as historical data, billing, or sales. For example, the work of [32] studies the integration of statistical techniques and the opinions of experts. Its objective is to unite different tools to improve your certainty.
Research made by [35] replicates an adaptive neuro fuzzy inference system (ANFIS) implementing the method to develop a forecast approach that integrates quantitative and qualitative variables. The experts’ data are processed by hybrid artificial neural networks with fuzzy logic integrated.
The new techniques allow to integrate different tools, from qualitative and quantitative variables such as mathematical models that allow to generate projections with greater certainty in organizations and in their supply chains.

2.4. Forecasting in Supply Chain
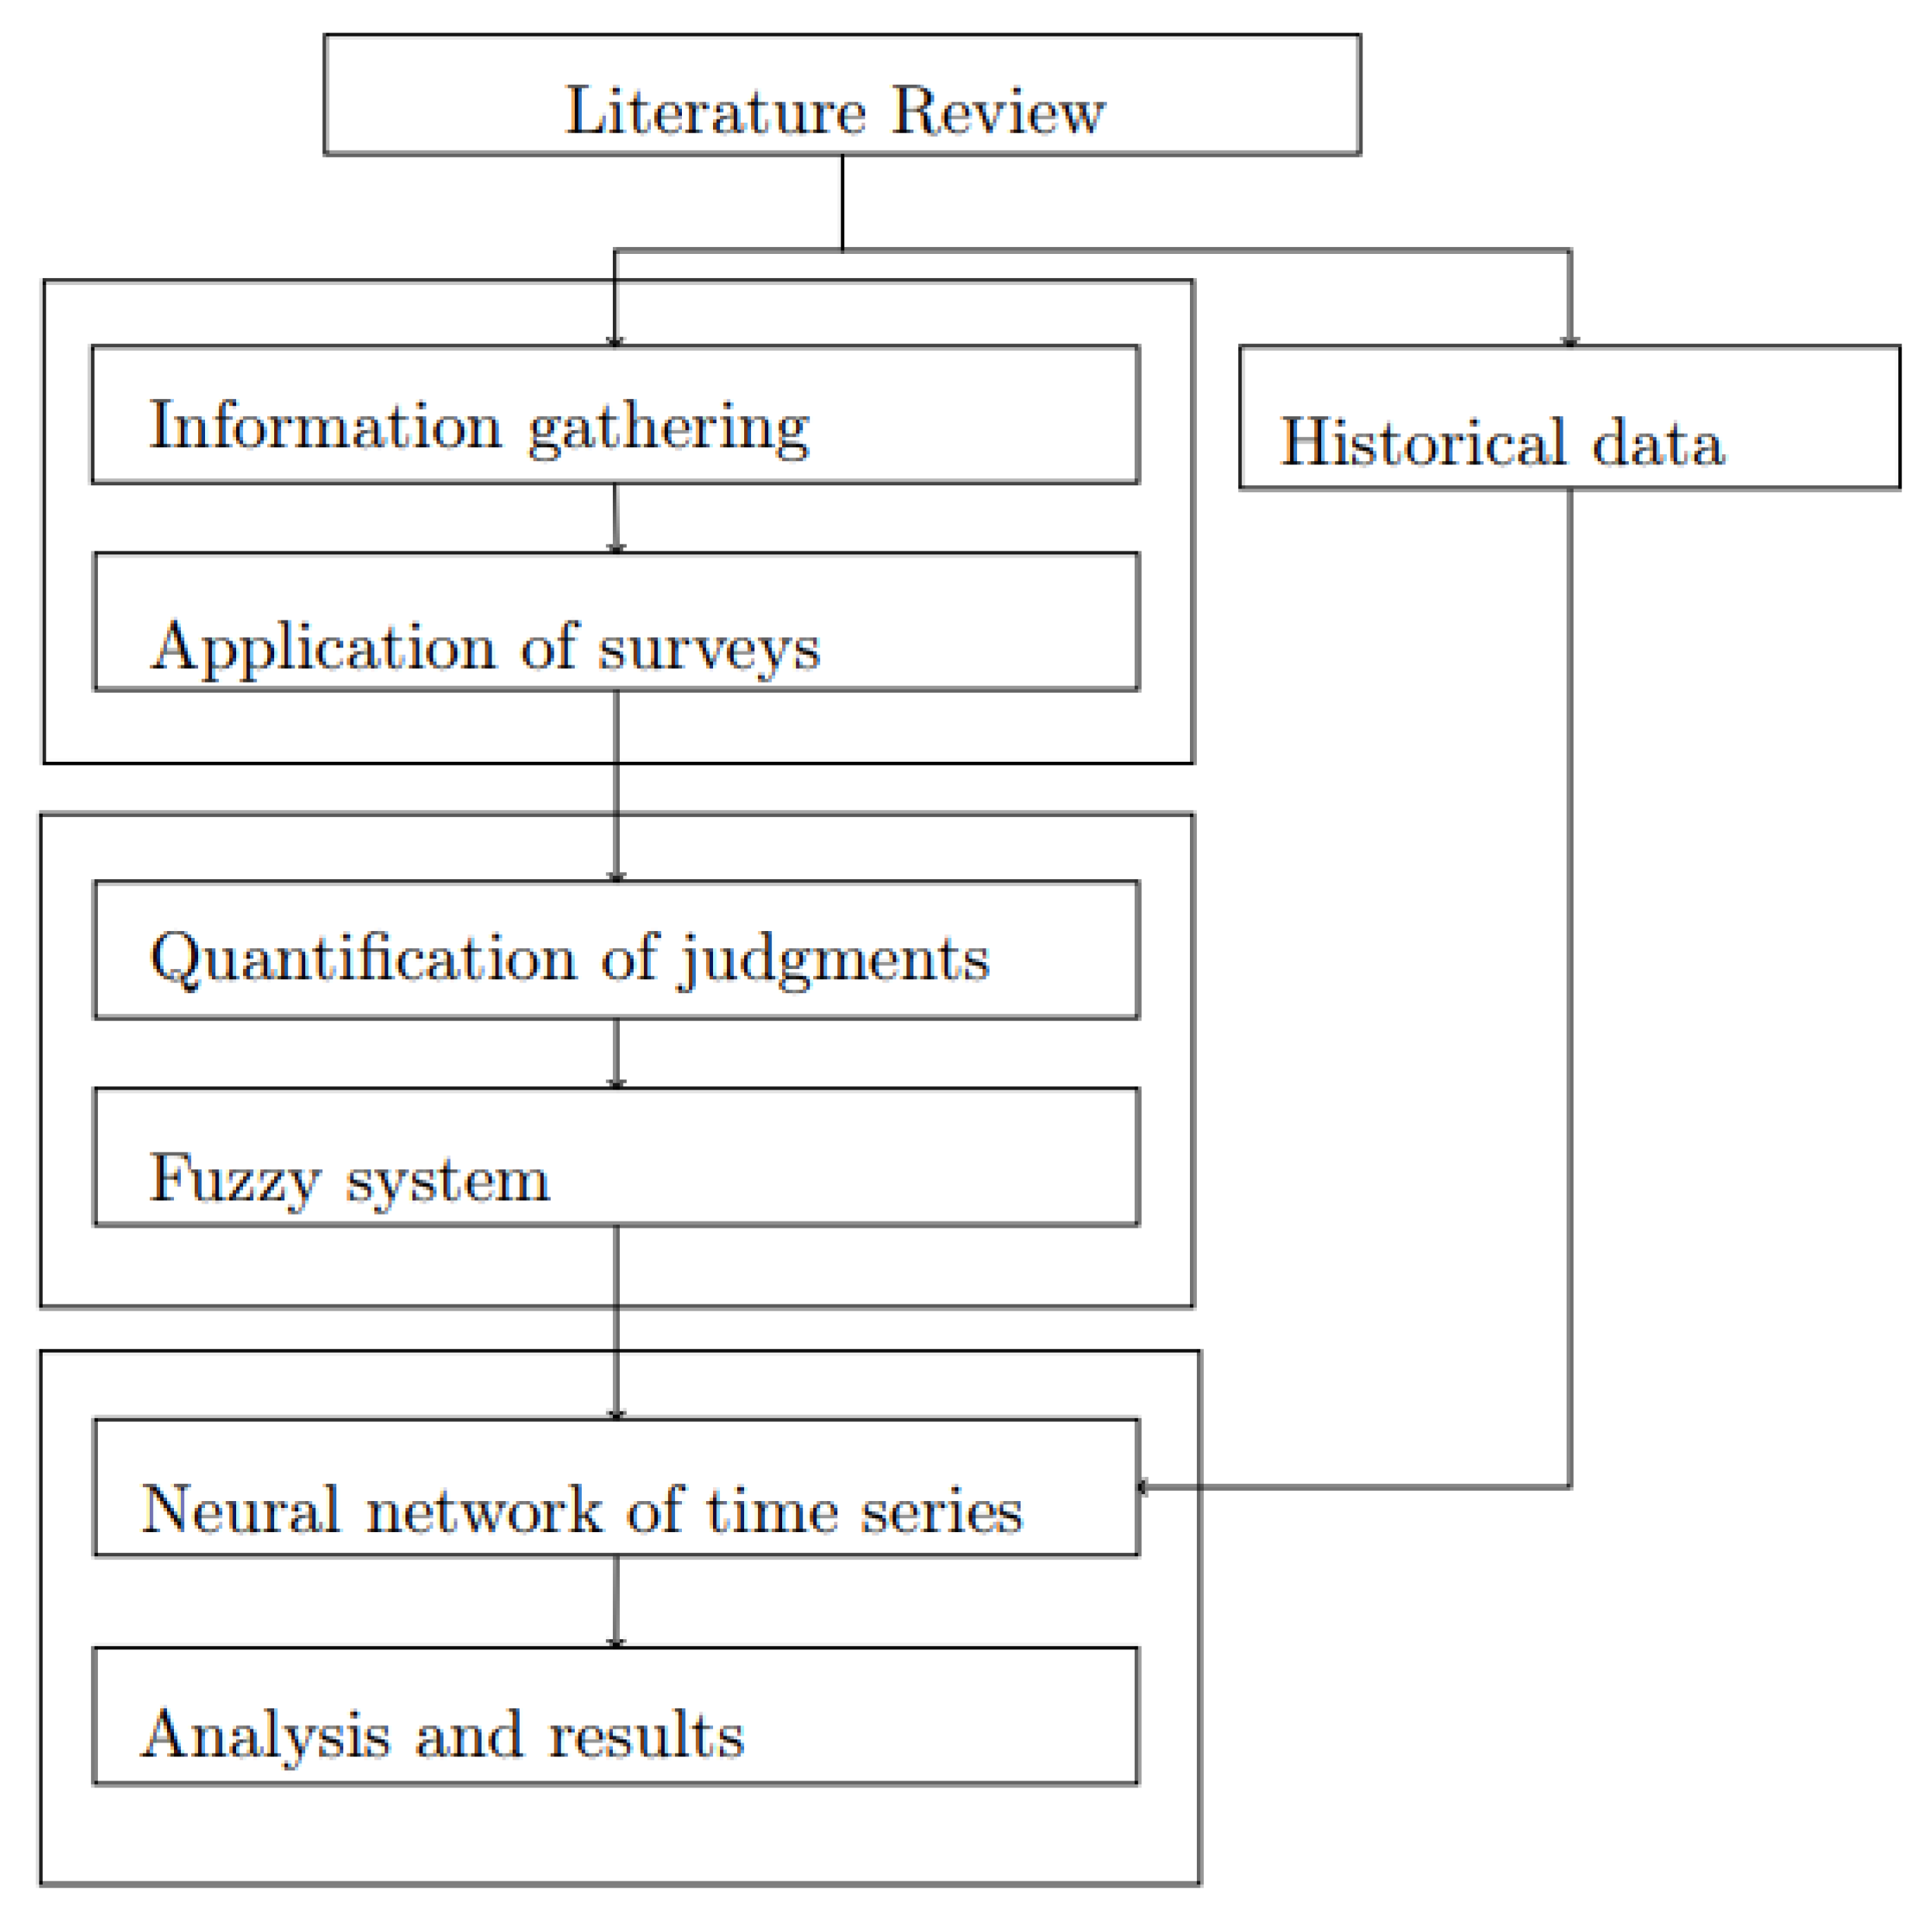
Demand planning is one of the most important tasks in the supply chain management. This process is integrated by decisions supported in mathematical and statistical tools.
In companies, the logistics department is also responsible for monitoring the demand, distribution, and management processes of the necessary resources [36]. One of the tasks it performs is to seek to meet service levels and keep low the operational costs through effective strategies. In the literature it is found that mathematical and statistical techniques such as mobil averages, exponential smoothing, and regression are the most popular ones [3,37]. These methods are feed with the sales, billing, and storage database. The data generated are analyzed and using in classic or hybrid forecasting tools [38].
As mentioned before, demand forecast is an essential activity in supply chain management. One of the lacks at the time of applying the methods is to contemplate a single qualitative or quantitative environment. The proposed method seeks to integrate these variable types and reduce bias [39].

3. Proposed Model

In this paper, it is proposed the incorporation techniques of fuzzy logic and artificial neural networks, fed by the information obtained from surveys. The demand forecast is one of the problems generated from information or inefficient methods and required improvement. Changes in demand levels do not conform to historical values on most occasions. The objective is to adjust demand projections when projected values do not contemplate a disruptive change in the industry [40]. Therefore, the use of artificial intelligence techniques can generate more robust alternatives in new demand forecasting integrating more than one historical variable.
This project is made from the experts’ opinions; this is achieved through the information gathering tools. As mentioned before, there is a wide variety of tools focused on gathering information, the Delphi method generates quality information and it allows for convergence in opinions through consensus perspectives [9]. The data collected are transformed by fuzzy logic numerical values based on the convergence of opinions and then it is implemented in a time series artificial neural network.
In the work produced by [35] a fuzzy artificial neural network application for forecasting demand is proposed. This system has a learning process of the artificial neural network based from the fuzzy rules. By other side, the work developed by [41] integrates experts’ judgement combining genetic algorithms and neural networks.
The proposed method consists of an approach made from three steps. The first one is gathering information that is recollected by the Delphi method which allows obtaining objective information through expert consensus. The next step, the data processing—in this step the experts’ opinions are transformed by applying an artificial neural network combining with fuzzy logic. The fuzzy logic allows softening the opinions and behavior on weighted data. Finally, the system integrates the information and generates a demand forecast, see Figure 1.

3.1. Expert Judgements (Delphi Method)

Gathering information by surveying experts in the area it is the first stage of the proposed methodology. This activity has as objective to generate information from the experts point of view, due to having a better perspective of the factors that affect the demand behavior. This activity is carried out through the application of surveys applying the Delphi methodology [42,43].
Information gathering by implementing this methodology is to conduct a series of successive surveys. The study consists of three stages. Through the application of this type of studies it seeks that opinions converge. A key characteristic is the feedback process by experts through clear tendencies examples. By means of graphs it manages to illustrate the behavior of the experts. In this way, the methodology seeks to provide feedback and contribute to the opinion convergence. The analysis of results should be performed by applying basic statistical tests such as average, median, and mode. It is noteworthy that the group of experts in research must be integrated between 7 and 30 persons [43,44,45].
Before carrying out this step, it is important to identify the variables to study for experts to contribute to the selection of them. This is done by a preliminary survey that facilitates the collection of variables with the greatest impact on the demand behavior.
Also, it has to be determined the features of the same instrument such as structure, elements to be analyzed, validation, testing, and Cronbach’s alpha. This activity can be done by a specialist in the surveys preparation [46,47]. By collecting data from experts, the variables are weighted. That is, it has to be established a range in each of the variables that must be weighted by the experts. Then, through the convergence level, the quality of the information is evaluated.
Therefore, it is possible to reflect the behavior of the demand and this stage concludes with the weighting of variables. Subsequently, the analysis is performed through machine learning and fuzzy logic [48].

3.2. Information Softening (Fuzzy Logic)

The next stage is composed by the construction of the fuzzy logic mechanism that develops and characterized inputs of the weighted values of each variable. All this, to determine the degree of impact to the demand levels. Into this study is proposed the Mamdani fuzzy method. This technical usually applied in fuzzy controllers and these mechanisms are applied in different industries to improve the performance of systems with the aim to reduce sudden changes and to soften their impacts. [22,49].
Some parameters that are evaluated in this study method are the range, the type of membership function, the discourse universe and building scenarios [50]. This is generated from rules with operators AND and OR:
  • If x is A1 and y is B1 then z is C1.
  • If x is A2 and y is B2 then z is C2.
The membership function considers the behavior of the variables [49]. Because it is required a suitable tool with capacity for precision and interpretation and that generates an automatic data derivation while incorporating of human expert knowledge. Beside, it integrates numerical and symbolic processing into a common scheme, fuzzy linguistic models are considered as tools that have these capabilities. Therefore this study proposes to apply the Mamdani method [51,52].

Mamdani Method

This methodology contemplates the analysis of the opinions of the experts, through this method it is sought to measure the impact on the level of demand. It is a tool implemented in a wide variety of investigations due to its simplicity and the results generated. It is structured in four stages: background evaluation, conclusions, aggregation of conclusions, and defuzzification.
Evaluate the preceding for each rule (input fuzzyfication). It corresponds to the evaluation of the input variables. These entries are assessed by rankings and membership functions that follow a particular trend. These functions can be smooth or abrupt depending on the study. At this stage, they are experimented with different input values and the variation in each rule behavior is interpreted as in the Equation (1), the Gaussian membership function, it is a soft function, seeking to minimize abrupt changes in the level of demand.
μ A h ( x ) = e x p x m h σ h 2
Obtain each rule’s conclusion. The background evaluation allows to generate consequents that correspond to the results of the study of the fuzzy rules. This can study two or more variables to which the type of diffuse AND operator is applied, which contemplates the minimum values according to [53]. This is represented in the Equation (2).
μ A u B = m i n μ A ( x ) , μ B ( x )
Aggregate conclusions. This process aims to unify results. The output rules are combined to obtain a result as a consequence cut resulting from the output variable. The development of the method corresponds to the integration of the set of consequents of the total fuzzy rules. Aggregation is the overall integration of fuzzy values through unification, the goal is to generate only one.
Defuzzyfication. The final result of this method corresponds to the output value. There are different defuzzyfication methods. The area center method (COA) is one of the most commonly used defuzzification methods, which is also known as the centroid method. This method determines the center of the fuzzy set area and returns the corresponding crisp value. The sums center method (COS) and the maximum mean method are two alternative methods in defuzzification [54]. For convenience, in this study the centroid is used, Equation (3) [55,56,57].
c e n t r o i d = x = a b μ A ( x ) x x = a b μ A ( x )
Once the fuzzy values are obtained, the next stage is to execute the time series artificial neuronal network. Through this machine learning technique, it allows to integrate the factors and the historical data.

3.3. Time Series Artificial Neural Network

The network inputs include the variables obtained in the Delphi method and the fuzzy inference system. In addition, this contemplates the standardized information. That is, to homogenize the values that are integrated into the network database [58]. Also, some of the parameters to contemplate in the network construction are the inputs number, topology, number of neurons for each hidden layer and the output values [59].
The mathematical interpretation network is represented in the following way, input value x j , weights values w i j , bias values b i and output value y i , as in the Equation (4).
y i = ϕ i j 1 n w i j x j + b i
with i = 1 , , h activation function of the neuron i is represented as ϕ i . This represents the operations performed between the input layer and the hidden layer, while the relationship that saves the hidden layer and output layer is calculated as the Equation (5).
y s = ϕ s i 1 h w s i y i + b s
with s = 1 , , g . In the training process different algorithms are proposed to the experimentation. Also, it is important to mention that this can be modified based on the results obtained from what stands out the algorithms Levenberg–Marquardt (TRAINLM) and scaled conjugate gradien (TRAINSCG) [60,61].

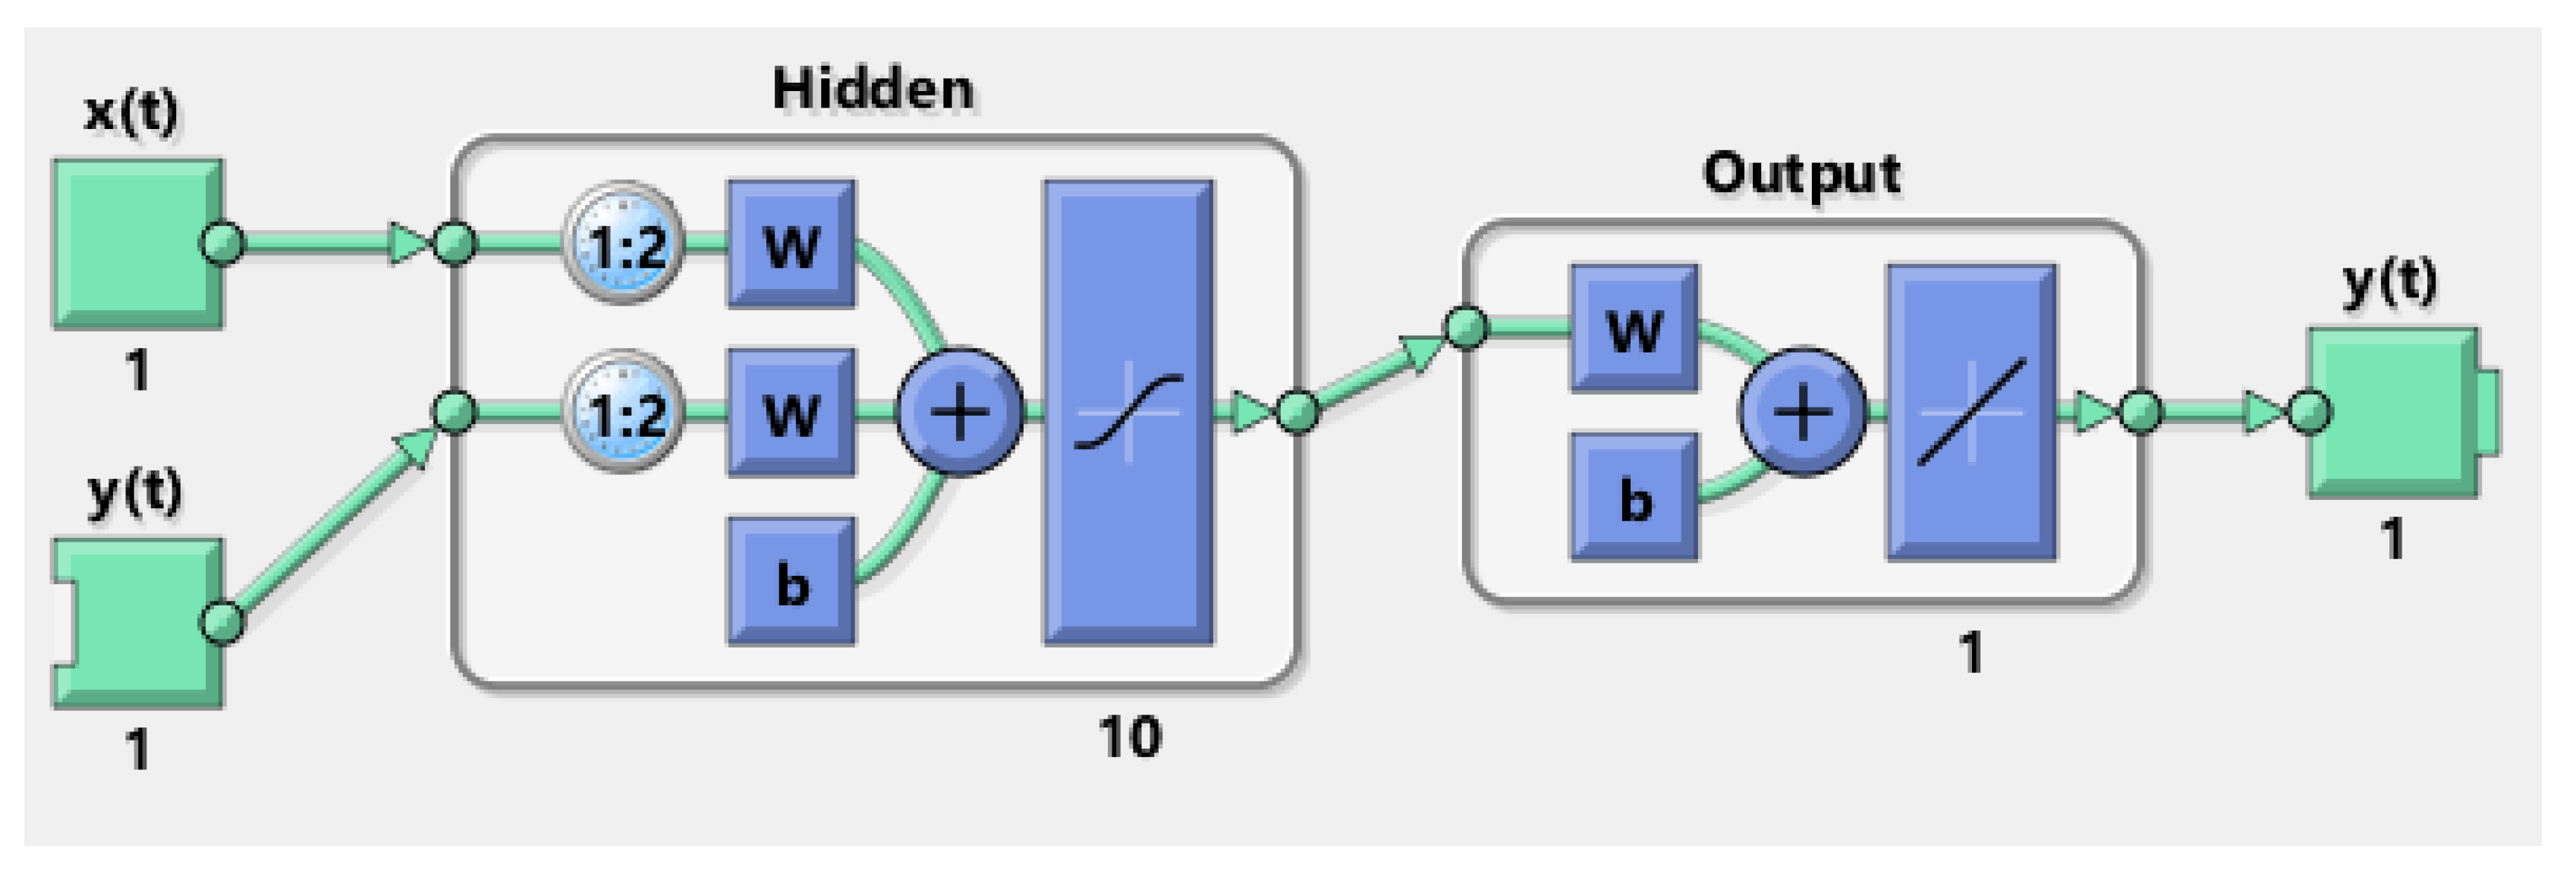
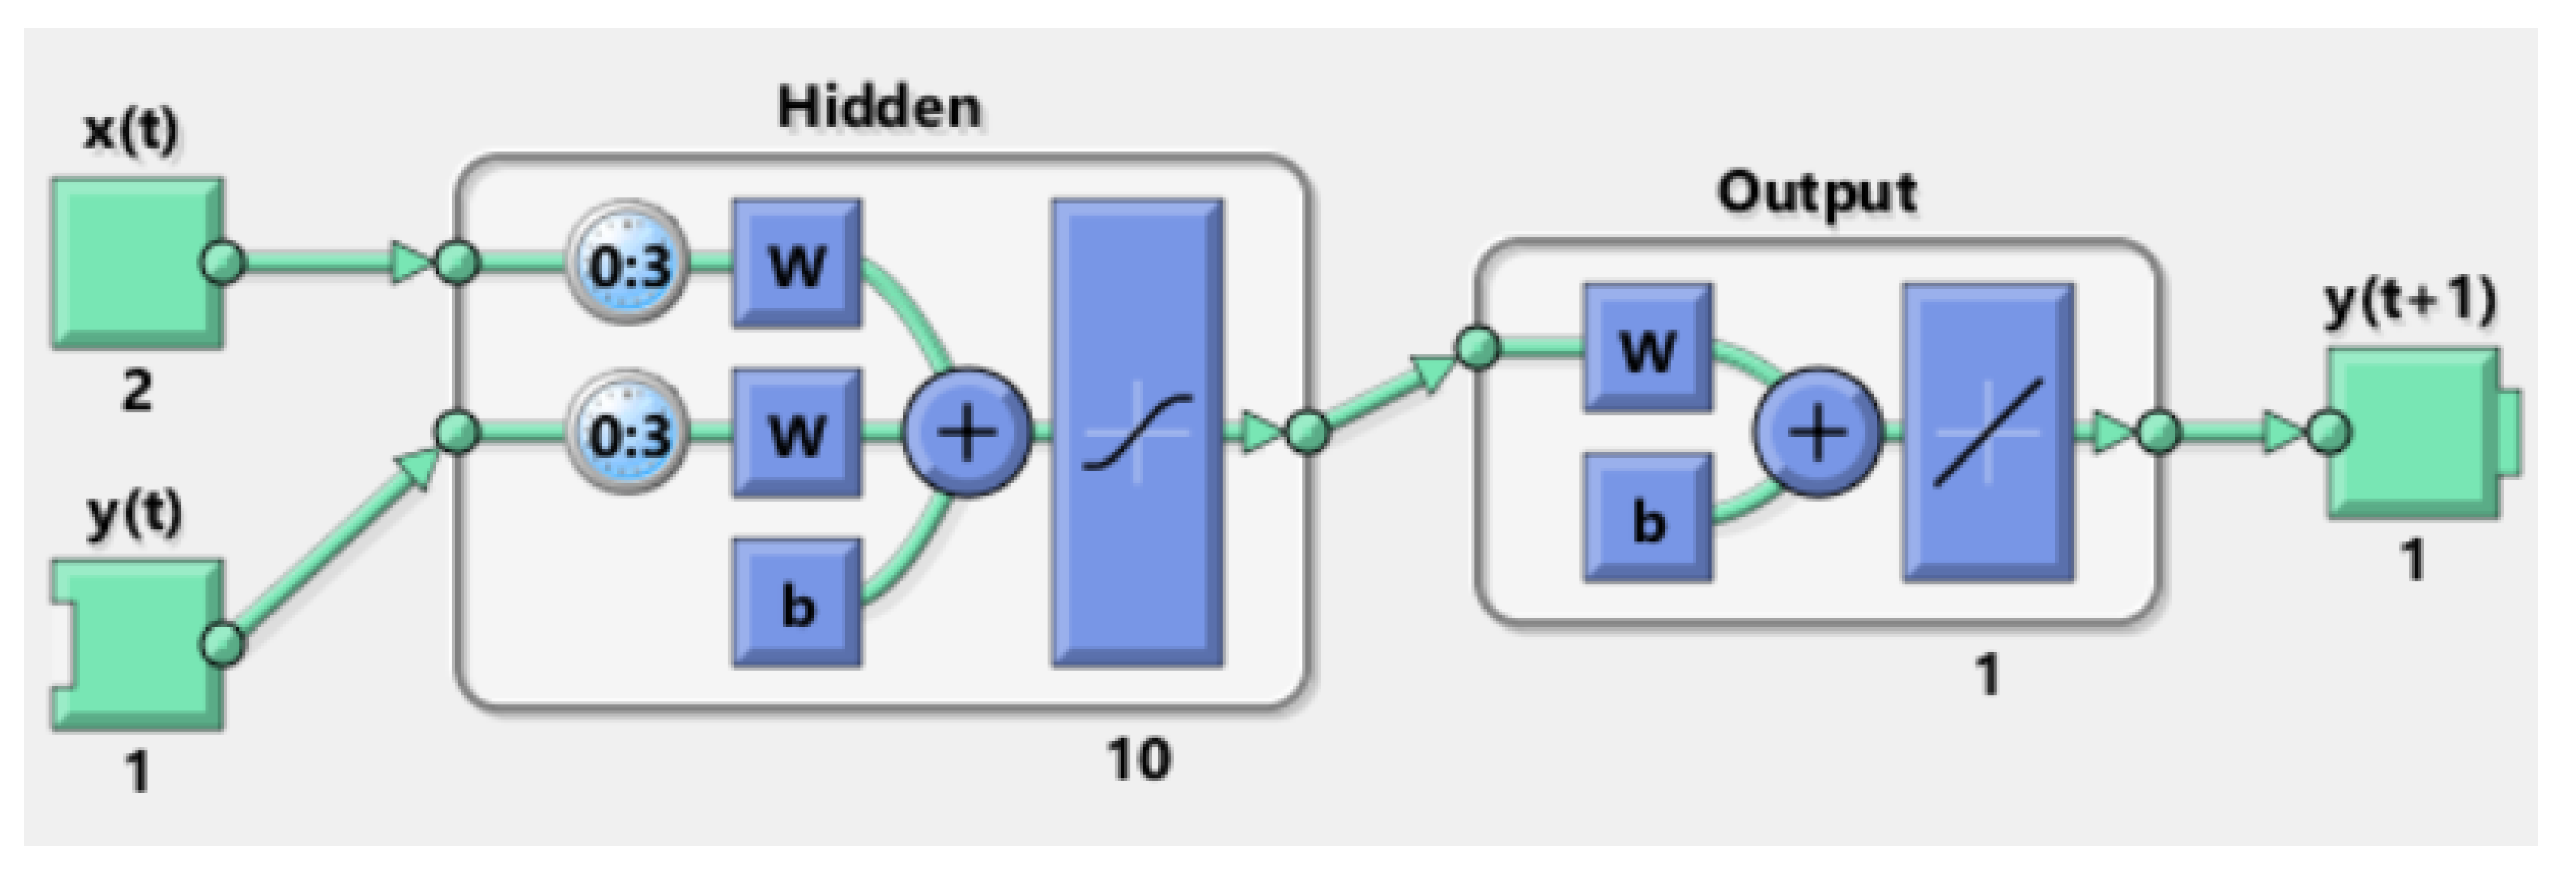
3.4. Nonlinear Autoregressive Neural Network with External Input

The application of artificial neural networks can generate future data reflecting the historical data trend. The projection of the demand allows generating future data and it is an essential activity in the organizational planning process. It is an activity that is usually done using mathematical and statistical techniques. It also generates hybrid models that integrate different machine learning techniques with classical methodologies.
Make forecasts are made by some mathematical technologies, among them the perceptron multilayer, feed forward or nonlinear autoregressive neural network or in its variant with inputs in parallel. One of the main features is the recursive process in which past values are taken in the future prediction. There are two variations; normal projection one-step without performing the recursion or openloop and multi-steps in which a feedback loop or closeloop is established [62,63,64]. Another feature in the type of network is recurrence, while the feedback is adjusted and trained with the output values.
The NARX application is characterized to incorporate two or more vectors, two types of sigmoid and linear functions. This network type is broken down from the ARX [65]. The application of the NARX type network is characterized to incorporate two or more vectors, two types of sigmoid and linear functions that are trained by the output values. The application of the proposed methodology is then performed.

4. Application

Incorporating expert judgements is an essential investigation. The treatment is carried out with the use of Matlab Toolbox through the use of Fuzzy logic Designer and Time Series Neural Networks with the result to generate forecast demand in the automotive industry.

4.1. Delphi Method Application

Delphi method is a technique applied in the variables analysis phase and experts’ opinion gathering. It consists in the application of an instrument with open questions. This technique is characterized by anonymity, opinions convergence and consecutive application:
  • Anonymity: This feature seeks to minimize the exchange of views among experts consulted. It is understood how to limit the bias in its valuation.
  • Interaction and continuous feedback: continuous development activity, the application consists of a questionnaire to be analyzed and the feedback is aimed at improving its evaluation.
  • Heterogeneity: It is a characteristic applicable to different types to profiles that maintain direct relation with the study phenomenon.
  • Statistical work: It is the activity that consists of basic statistics techniques of central tendency, data normality and correlation [42].
The collecting expert judgements is an indispensable part in demand planning process. The opinions correspond to the expert valuation from the experience and these variables are assessed directly related to market behavior. This section is integrated in three stages. First, it corresponds to the expert committee conformation. Second, the questionnaires application is done with the corresponding feedback, this activity is carried out between two or three times. Third, the analysis of the information is carried out.
This stage consists of the evaluation of a dependent variable that corresponds to the demand and an independent variable in study and the objective is to evaluate some variables that have influence on sales. Some of them are described below [35]. Some representative variables in the planning process:
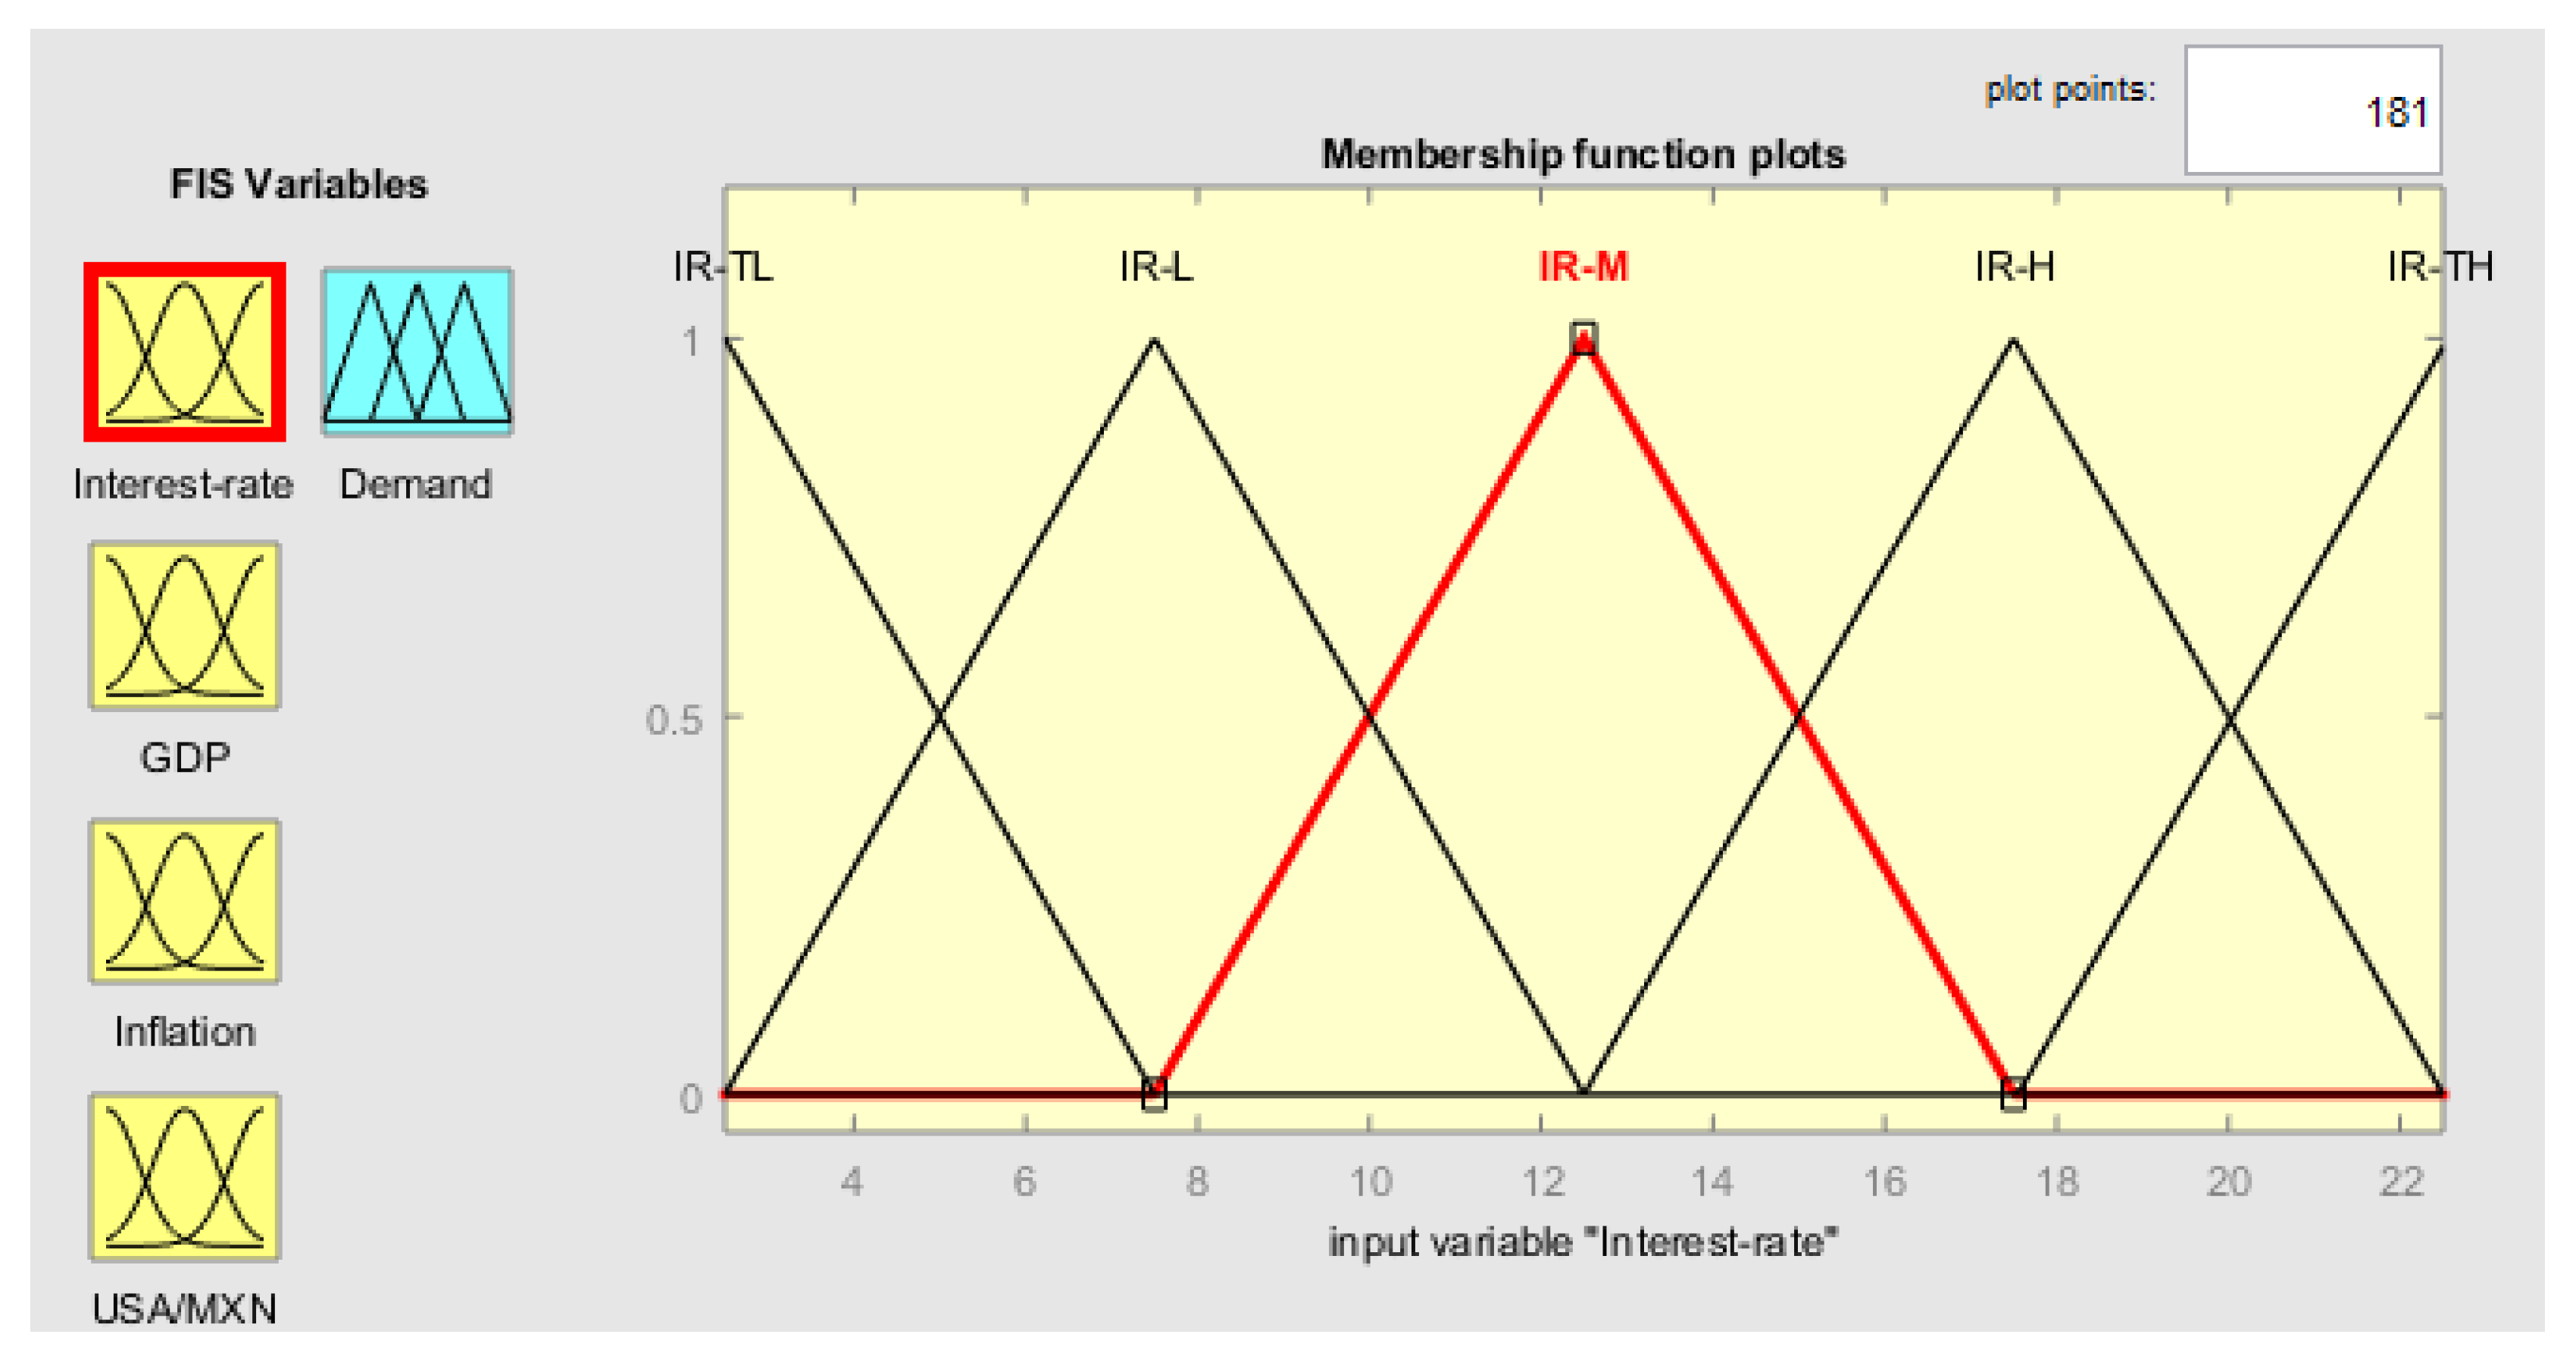
  • Interest-rate. The car purchase is motivated by large number of financial institutions, the level of interest is high impact factor in sales performance.
  • Gross domestic product. National growth is a representative indicator that maintains direct connection with the vehicles sales, decreasing this can generate notes or record damages to the automotive sector.
  • Inflation. Purchasing power is directly related to the value of the currency and is measured by the inflation factor which is represented as the ability to purchase certain good.
  • Mexican currency. Corresponds to the currency value referring to the United States currency, this variable is directly represented in the national exchange of goods.
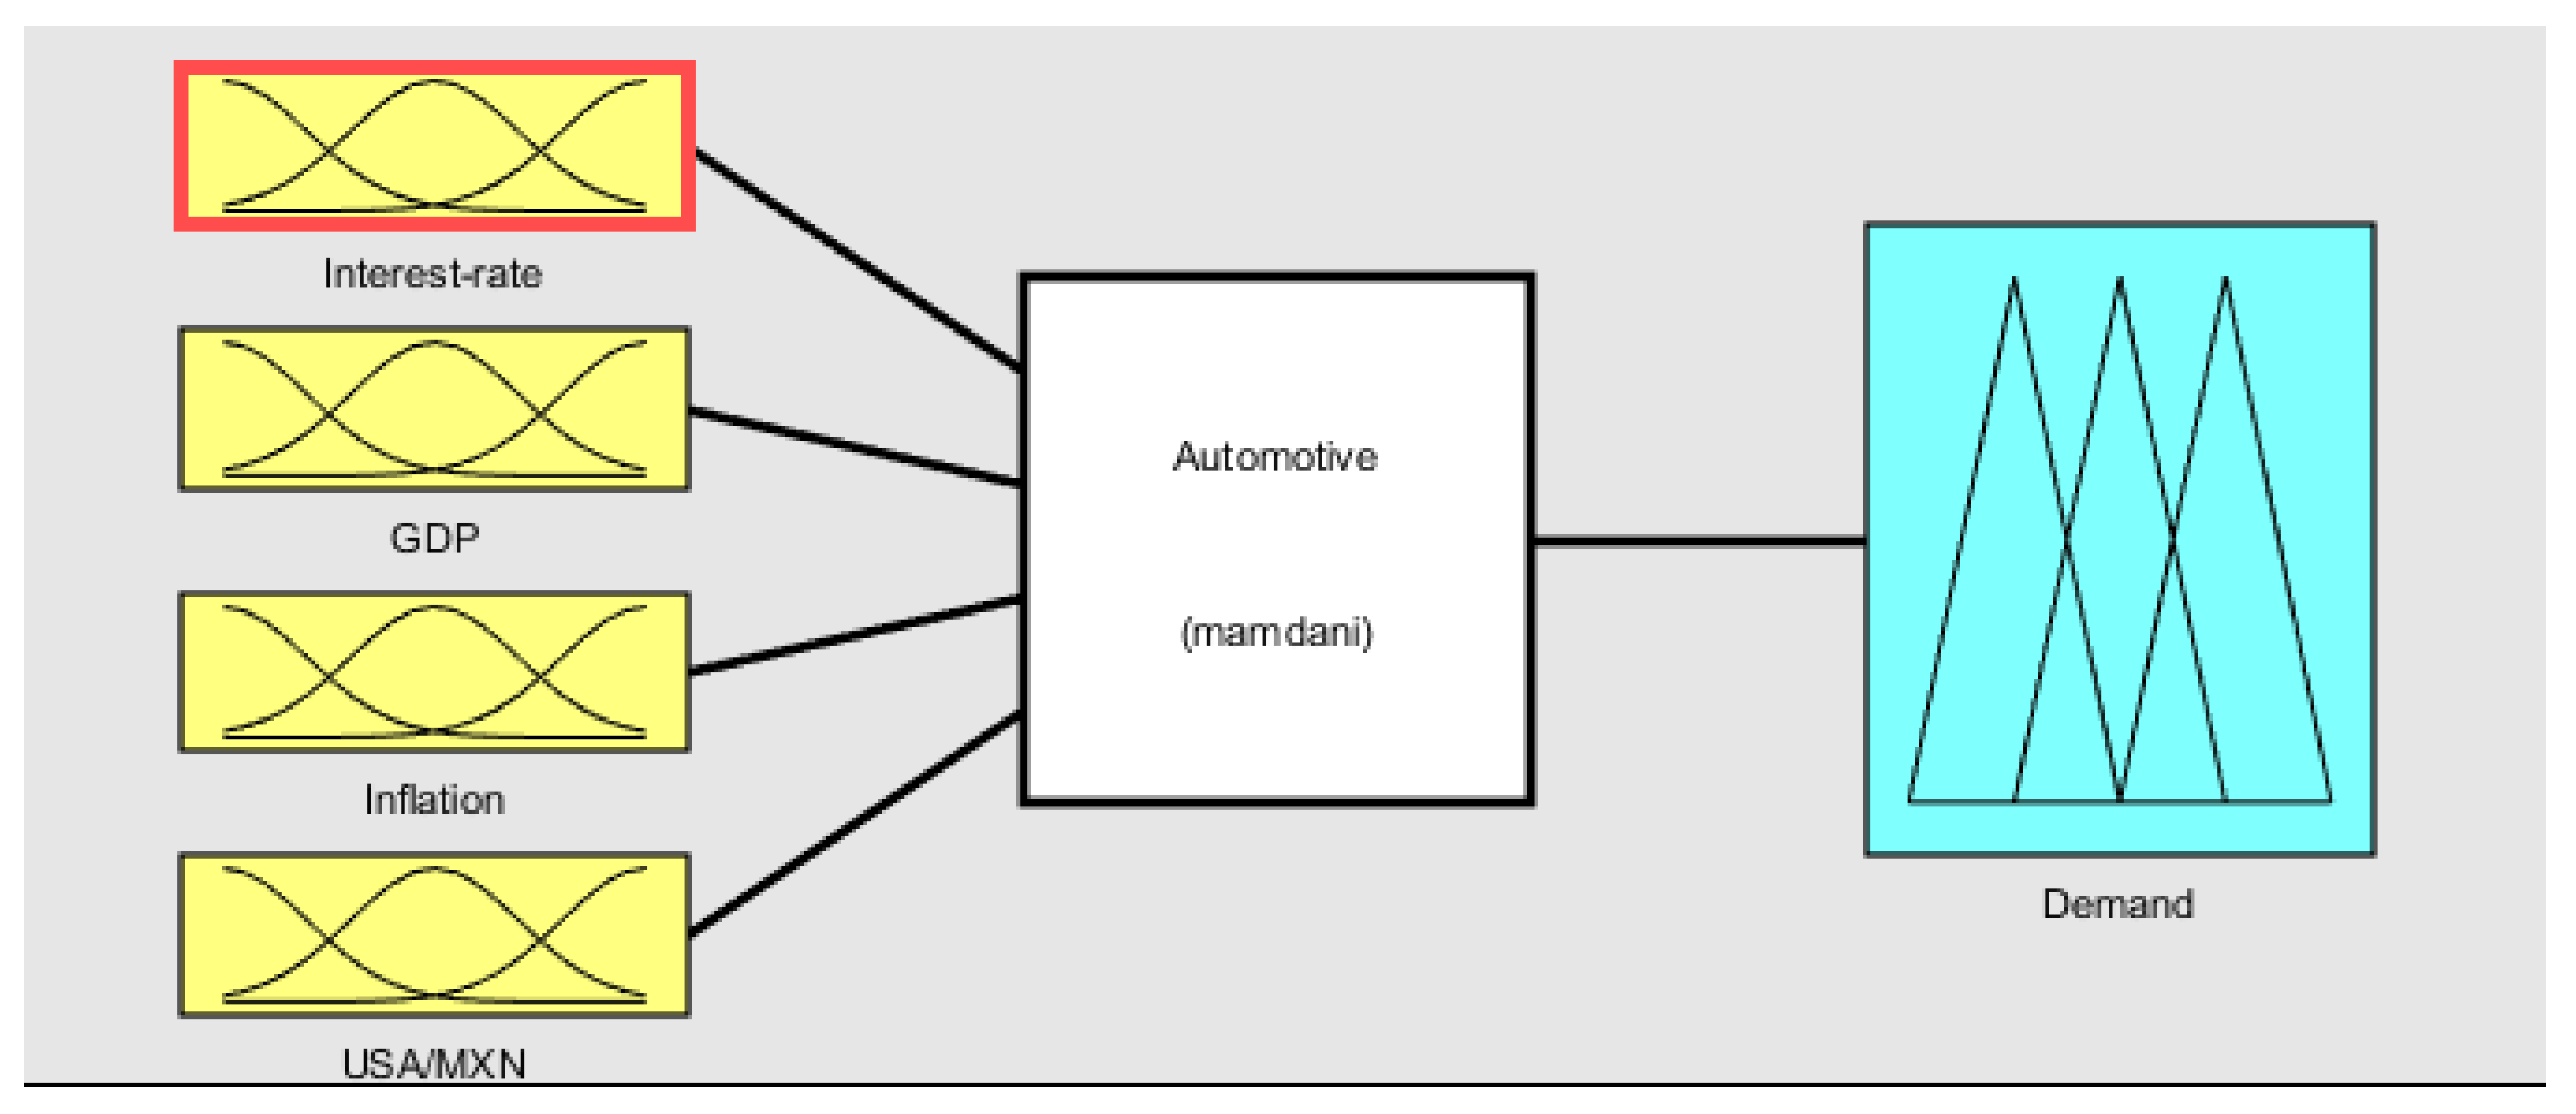
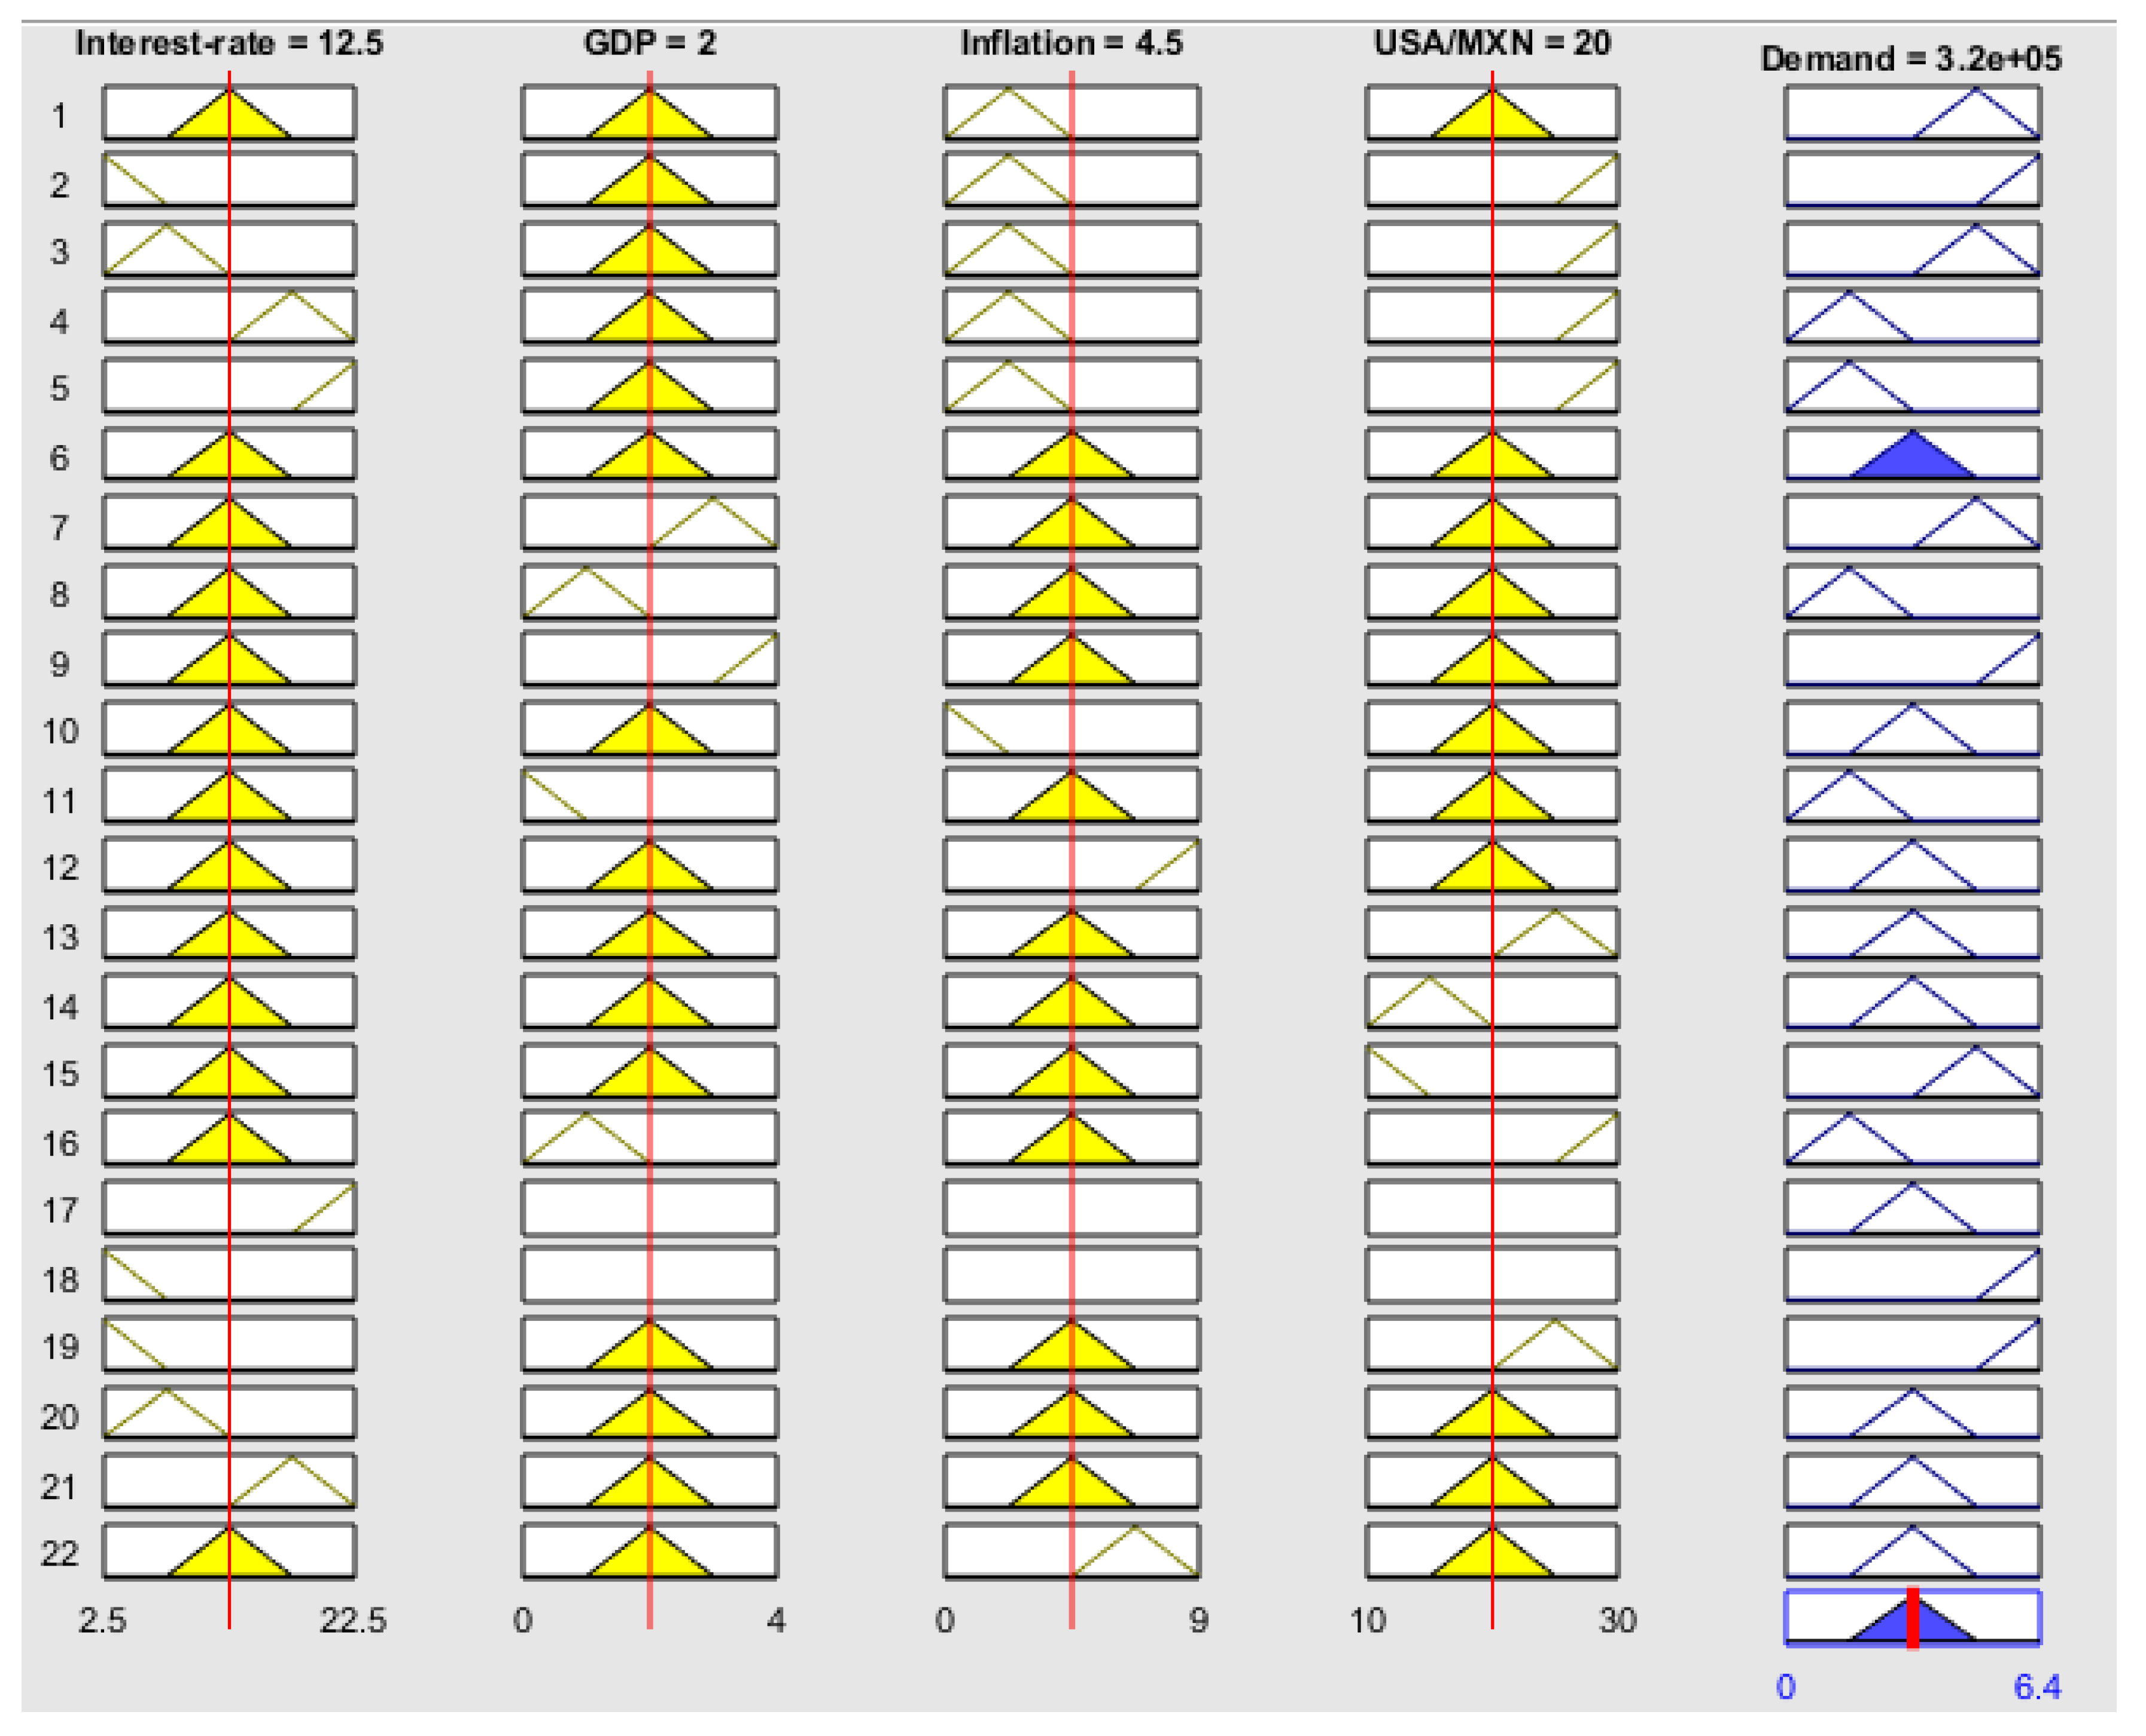
The factors identification is the Delphi method objective, the next stage includes the analysis of these variables with respect to the automotive demand.

4.2. Fuzzy Analysis

The Mamdani method application contemplate the implementation AND and OR operator, therefore the antecedent’s relation both in whole is evaluated. These are also known as independent variables.
Fuzzy logic aims to establish dependency relationships between variables, this tool can implement an indefinite variable set. Also, the attributes of each set, the coherence and the behavior. In addition to this activity, They are done through Matlab 2015 in its Fuzzy Logic Designer Toolbox application. it is chosen for development and implementation activities.
An important part of the fuzzy process is the construction of rules. These should reflect the expert’s opinions, through this process it is possible to develop a decision analysis of demand, as it’s shown in the following fuzzy rules [66].
  • Interest-rate is A and GDP is B and inflation is C and USA/MXN is D then is Z.
  • Interest-rate is A or GDP is B or inflation is C or USA/MXN is D then is Z.
The fuzzy mechanism construction is used in the fuzzy logic designer toolbox application using the Matlab software. This includes four variables such as antecedents and demand consequently. This study has the capacity to add four or more antecedents that affect the demand, as shown in the Figure 2. It is also important to mention that the purpose of the rules is evaluating four antecedents and generate one consequent.
In addition, fuzzy mechanism elaboration contemplated the rules construction that integrate each one of the selected variables, the membership function is chosen that reflects the demand behavior and reflects its decision boundaries and the triangular membership function is chosen.
The membership functions construction contemplates the discussion universe values, in other words, maximum and minimum levels, besides this may be integrated by a membership functions set and may have specific characteristics, as show in the Figure 3.
The decision behavior can be represented in a clear graphic way. The three coordinates choices represent the demand level, it evaluates the demand projections without the need to carry out the Delphi methodology once that the fuzzy mechanism itself is carried out, which already contains the expert’s perception.
Once the study of weighted variables has been done, numerical values can be obtained through an established convergence of all experts. Through this tool, the creation of projections from the opinion is simplified. Therefore, people who work in a planning area can integrate more information more easily. The system allows to evaluate fuzzy relationships when the behavior of the variables increases or decreases, as shown in the Figure 4, and this allows to forecast demand values from the fuzzy values, as shown in the Table 1.
This research integrates more than a qualitative data variable, in other words, they are represented as factors that influence the demand for behavior. Through the Matlab 2015 Toolbox application and the use of neural net time series 2.2.21, both types of information can be integrated; expert judgements and historical data. The sales projection for a future period is generated by integrating the market behavior perceived by the experts.

4.3. Qualitative and Quantitative Data Integration Using Narx

Forecasting demand is a fundamental activity in the planning process, this support the entire supply chain, from suppliers to marketing and consumption. Companies tend to use tools applied to generation the future sales projections through the past data implementation with the aim of generating possible future values. It is usually used mathematical techniques and classical statistics and even some hybrid methods such as ARIMA among the most used.
The proposed methodology is contemplated the artificial neural networks application that belongs to the machine learning area that derives from computer science. This can be understood as the mathematical aspect inspired by the human being learning processes. These tools are have countless applications, from the pattern analysis processes or classification to the projection’s generation. This is widely applied in the planning process and they go on to generate relevant results for the people who manage the companies.
Study envisages integrating two variables in the process forecasting the demand. First variable corresponds to the historical data, the sales records, billing, production, etc., and the second are the staff working opinions with fuzzy logic. This study that includes two input variables is chosen the implementation of NARX that was derived from the structure ARX with the modification activation function types non-linear, as show in the Figure 5 [67].
This tool can generate projections to one or more future periods. This network is also characterized by integrating two activation functions, linear and non-linear, as show in the Figure 6.
This application can be made to a future period, in which historical data are implemented. Multiple periods are also projected when the neural network is closed-loop in which they are trained with output values, as show in the Figure 6 and Figure 7.
The final methodology stage includes the integration of the data obtained from the fuzzy analysis Table 2 and the historical sales records that includes 168 periods, from 2005 to 2018 corresponding to the data from [68]. The data are processed using X / X m a x .
The study included experimentation through a nonlinear autoregressive network with exogenous inputs (NARX) and Nonlinear autoregressive (NAR) neural network and holt statistical model from which the following results are obtained.
The information implementation from different sources allows generating a robust, flexible and adaptable tool to changes, as show in the Table 3 and Table 4. This research shows that NARX allows that fuzzy analysis is integrated and make appropriate adjustments in the weightings and training, this allows to generate an efficient forecast with low error level.
Therefore, the methodology is capable of generating a tool that contributes to the work plan in organizations and individual suppliers. It is important to say that the tools focused mainly on a single variable, also the new technologies allow the application of hybrid tools in a wide variety of industries.

5. Discussion and Conclusions

Managing the supply chain is a complex activity and maintains great relevance. The flow products control in organizations are complex because the demand for products is not predictable in its entirety. This generates conflict in the supply, production, inventories, and distribution levels [1]. The new technologies allow contributing in the administrative processes in the organizations, making it possible to analyze robust information sets through the soft-computing systems.
There are many computer systems that support decision-making and these allow the development and demand planning with greater certainty as enterprise resource planning (ERP) and material requirements planning (MRP) and customer relationship management (CRM) [69,70]. It is important to mention that these systems do not guarantee the bias elimination in demand forecast because they are people the administer them and the information systems not always information generated adequate.
Forecast of demand is an activity it is supported in computer systems and this do not always adhere to the dynamic reality of the market and its sudden fluctuations [38]. Therefore people experience becomes relevant because they have a perception from another prospective. it can identify variations with suppliers or customers in advance or by implicit signals. These signals can be used in order to generate more efficient planning.
Derived from the biases generated when making decisions based on numerical data are that it is decided to propose a methodology that integrates expert judgements, fuzzy logic, and artificial neural network of time series [71]. Some reasons why proposed this methodology:
  • This methodology is possible to identify variables that are not reflected in the planning and supply chain management.
  • Integrate expert judgements through tools that presently offer advantages to developing new planning and prediction strategies by analyzing variables.
  • Planning is one of the activities that help to control the products flow in an appropriate way, mitigating the error and the losses in order to minimize the risk.
  • The uncertainty on markets the requires new strategies to be efficient in the demand planning process through new artificial intelligence technologies.
Planning process is one of the activities with greater relevance, through the proposed methodology is contemplated the integration the qualitative and quantitative variables contributing in decision making in the dynamic markets and it allows to have better reaction to changes and increase visibility in the supply chain.
Some considerations that must be taken in the collection information. In other words, the validated data and the applied questionnaires must be evaluated. This is achieved through an adequate analysis by applying statistical measures. Also, in the process of fuzzy logic applied, fuzzy rules construction, operator type and membership function as an essential part of the study should be considered in principle. In other words, use the functions that recognize study properties. In addition, the artificial neural network must consider the percentages of training, test, validation.
For future work, it is expected to apply the Sugeno method and the adaptive neuro fuzzy inference system (ANFIS) to assess performance by comparing the methods applied in different real scenarios.

Author Contributions

Conceptualization and methodology, T.E.S.-F., J.A.S.-M. and J.M.V.-H.; data curation and validation, J.A.S.-M. and R.R.-A.; writing—original draft preparation, T.E.S.-F., J.A.S.-M. and J.M.V.-H.; writing—review and editing, J.A.S.-M., R.R.-A. and T.E.S.-F. All authors have read and agreed to the published version of the manuscript.

Funding

This research received no external funding.

Conflicts of Interest

The authors declare no conflict of interest.

References

  1. Chopra, S.; Meindl, P. Administración de la Cadena de Suministro, 3rd ed.; Person Education: Mexico, Mexico, 2008. [Google Scholar]
  2. Ardila, W.; Romero, D.; González, F. Estrategias para la Gestión de Riesgos en la Cadena de Suministros. In Proceedings of the Latin American and Caribbean Conference for Engineering and Technology, Guayaquil, Ecuador, 21–24 July 2014; pp. 22–24. [Google Scholar]
  3. Heizer, J.; Render, B. Principios de Administración de Operaciones; Pearson Educacion: Mexico, Mexico, 2004. [Google Scholar]
  4. Chiu, M.; Lin, G. Collaborative supply chain planning using the artificial neural network approach. J. Manuf. Technol. Manag. 2004, 15, 787–796. [Google Scholar] [CrossRef]
  5. Villamizar, J.C.M.; León, Ó.P.; Jaimes, W.A. Efecto látigo en la planeación de la cadena de abastecimiento, medición y control. Ciencia e Ingeniería Neogranadina 2013, 23, 3. [Google Scholar] [CrossRef] [Green Version]
  6. Stevens, G.C. Integrating the supply chain. Int. J. Phys. Distrib. Mater. Manag. 1989, 19, 3–8. [Google Scholar] [CrossRef] [Green Version]
  7. Bajalinov, E.; Duleba, S. Seasonal time series forecasting by the Walsh-transformation based technique. Cent. Eur. J. Oper. Res. 2019. [Google Scholar] [CrossRef]
  8. Gupta, A.; Maranas, C.D. Managing demand uncertainty in supply chain planning. Comput. Chem. Eng. 2003, 27, 1219–1227. [Google Scholar] [CrossRef]
  9. Landeta, J. El Método Delphi. Una técnica de Previsión del Futuro; Ariel: Barcelona, Spain, 1999. [Google Scholar]
  10. Astigarraga, E. El Método Delphi; Universidad de Deusto: San Sebastián, Spain, 2003. [Google Scholar]
  11. Winston, W.L.; Goldberg, J.B. Investigación de Operaciones: Aplicaciones y Algoritmos; Thomson: Mexico, Mexico, 2005. [Google Scholar]
  12. Casas, M.; Franco, M.; Goikolea, J.; Jiménez-Arriero, M.; Martínez-Raga, J.; Roncero, C.; Szerman, N. Trastorno bipolar asociado al uso de sustancias adictivas (patología dual). Revisión sistemática de la evidencia científica y consenso entre profesionales expertos. Actas Españolas de Psiquiatría 2008, 36, 350–361. [Google Scholar]
  13. Chao, J.M.S.C. Análisis por el método Delphi de la idea de ciudad. Anuario de la Universidad Internacional SEK 2000, 6, 89–102. [Google Scholar]
  14. Soberón, C.G.; Bautista, L.A.B.; Cid, D.M. Metodología de estimación preliminar de la vulnerabilidad de puentes basada en procedimientos de la Secretaría de Comunicaciones y Transportes. Aplicación a puentes carreteros del Pacífico. In Proceedings of the XV Congreso Nacional de Ingeniería Estructural, Puerto Vallarta, México, 1–4 November 2006; pp. 1–14. [Google Scholar]
  15. Cabello, E.; Chirinos, J.L. Validación y aplicabilidad de encuestas SERVQUAL modificadas para medir la satisfacción de usuarios externos en servicios de salud. Rev. Medica Hered. 2012, 23, 88–95. [Google Scholar] [CrossRef] [Green Version]
  16. Díaz-Ricardo, Y.; Pérez-del Cerro, Y.; Proenza-Pupo, D. Sistema para la Gestión de la Información de Seguridad Informática en la Universidad de Ciencias Médicas de Holguín. Ciencias Holguín 2014, 20, 1–4. [Google Scholar]
  17. Tolosa, H.A.M.; Bustos, W.O.P.; Nieto, C.A.B. Encuesta de opinión para la evaluación de la gestión pública en colombia: Una propuesta de medición. Semestre Económico 2012, 15, 77–102. [Google Scholar] [CrossRef] [Green Version]
  18. León, A.M.; Fleitas, N.P.; Rivera, D.N.; Nariño, A.H.; Alonso, A.R.; Moya, J.V. Estudio de la construcción de Índices Integrales para el apoyo al Control de Gestión Empresarial. Enfoque UTE 2011, 2, 1–38. [Google Scholar] [CrossRef]
  19. Alkharabsheh, A.; Moslem, S.; Duleba, S. Evaluating Passenger Demand for Development of the Urban Transport System by an AHP Model with the Real-World Application of Amman. Appl. Sci. 2019, 9, 4759. [Google Scholar] [CrossRef] [Green Version]
  20. Hsieh, K.L. Process improvement in the presence of qualitative response by combining fuzzy sets and neural networks. Integr. Manuf. Syst. 2001, 12, 449–462. [Google Scholar] [CrossRef]
  21. Sugeno, M. An introductory survey of fuzzy control. Inf. Sci. 1985, 36, 59–83. [Google Scholar] [CrossRef]
  22. Medina, M.A.P.L.; Saba, M.G.H.; de Guevara Durán, M.E.L.; Silva, M.J.H. Controladores PID y controladores difusos. Revista de Ingeniería Industrial 2011, 5, 1–13. [Google Scholar]
  23. Zimmermann, H.J. Fuzzy control. In Fuzzy Set Theory—and Its Applications; Springer: Berlin/Heidelberg, Germany, 1996; pp. 203–240. [Google Scholar]
  24. Escobar-Gómez, E.; Díaz-Núñez, J.; Taracena-Sanz, L. Modelo para el ajuste de pronósticos agregados utilizando lógica difusa. Ingeniería, Investigación y Tecnología 2010, 11, 289–302. [Google Scholar] [CrossRef] [Green Version]
  25. Tabares, H.; Hernández, J. Aproximación por lógica difusa de la serie de tiempo “demanda diaria de energía eléctrica”. Revista Facultad de Ingeniería 2013, 209–217. [Google Scholar]
  26. Blancas, J.; Noel, J. Pronóstico de la demanda eléctrica a corto plazo con lógica difusa. ENERLAC. Revista de energía de Latinoamérica y el Caribe 2018, 2, 8–27. [Google Scholar]
  27. Arango Londoño, A. Pronóstico del Índice General de la Bolsa de Valores de Colombia (IGBC) Usando Modelos de Inferencia Difusa. Ph.D. Thesis, Universidad Nacional de Colombia, Medellín, Antioquia, 2012. [Google Scholar]
  28. Clemen, R.T. Combining forecasts: A review and annotated bibliography. Int. J. Forecast. 1989, 5, 559–583. [Google Scholar] [CrossRef]
  29. Armstrong, J.S.; Collopy, F. Integration of Statistical Methods and Judgment for Time Series Forecasting: Principles from Empirical Research. 1998. Available online: http://repository.upenn.edu/marketing_papers/2 (accessed on 10 September 2019).
  30. Sanders, N.R.; Ritzman, L.P. Integrating judgmental and quantitative forecasts: Methodologies for pooling marketing and operations information. Int. J. Oper. Prod. Manag. 2004, 24, 514–529. [Google Scholar] [CrossRef]
  31. Kochak, A.; Sharma, S. Demand forecasting using neural network for supply chain management. Int. J. Mech. Eng. Robot. Res. 2015, 4, 96. [Google Scholar]
  32. Toro, O.; GIRALDO, D.A.M.; Isaza, H.S. Pronóstico de ventas usando redes neuronales. Sci. Tech. 2004, 10, 25–30. [Google Scholar]
  33. Thiesing, F.M.; Vornberger, O. Sales forecasting using neural networks. In Proceedings of the IEEE International Conference on Neural Networks, Houston, TX, USA, 12 June 1997; Volume 4, pp. 2125–2128. [Google Scholar]
  34. Chang, P.C.; Wang, Y.W.; Tsai, C.Y. Evolving neural network for printed circuit board sales forecasting. Expert Syst. Appl. 2005, 29, 83–92. [Google Scholar] [CrossRef]
  35. Asli, A.; Nursel, Ö.; Eric, S. Demand forecasting for apparel manufacturers by using neuro-fuzzy techniques. J. Model. Manag. 2014, 9, 18–35. [Google Scholar]
  36. Jüttner, U. Supply chain risk management: Understanding the business requirements from a practitioner perspective. Int. J. Logist. Manag. 2005, 16, 120–141. [Google Scholar] [CrossRef]
  37. Shahrabi, J.; Mousavi, S.; Heydar, M. Supply chain demand forecasting: A comparison of machine learning techniques and traditional methods. J. Appl. Sci. 2009, 9, 521–527. [Google Scholar]
  38. Ediger, V.Ş.; Akar, S. ARIMA forecasting of primary energy demand by fuel in Turkey. Energy Policy 2007, 35, 1701–1708. [Google Scholar] [CrossRef]
  39. Witt, S.F.; Song, H.; Louvieris, P. Statistical testing in forecasting model selection. J. Travel Res. 2003, 42, 151–158. [Google Scholar] [CrossRef] [Green Version]
  40. Thomassey, S.; Fiordaliso, A. A hybrid sales forecasting system based on clustering and decision trees. Decis. Support Syst. 2006, 42, 408–421. [Google Scholar] [CrossRef]
  41. Kuo, R.; Tseng, Y.; Chen, Z.Y. Integration of fuzzy neural network and artificial immune system-based back-propagation neural network for sales forecasting using qualitative and quantitative data. J. Intell. Manuf. 2016, 27, 1191–1207. [Google Scholar] [CrossRef]
  42. Figueroa, G.A.; Montilla, M.A.C.; Melo, R.M. Método DELPHI: Aplicaciones y posibilidades en la gestión prospectiva de la investigación y desarrollo. Rev. Venez. Anal. Coyunt. 2012, 18, 41–52. [Google Scholar]
  43. Reguant Álvarez, M.; Torrado Fonseca, M. El método Delphi. REIRE Revista d’Innovació i Recerca en Educació 2016, 9, 87–102. [Google Scholar]
  44. Gil-Gómez de Liaño, B.; Pascual-Ezama, D. La metodología Delphi como técnica de estudio de la validez de contenido. Anales de Psicología 2012, 28, 1011–1020. [Google Scholar]
  45. Riaño, C.E.; Palomino, M. Diseño y elaboración de un cuestionario acorde con el método Delphi para seleccionar laboratorios virtuales (LV). Sophia 2015, 11, 129–141. [Google Scholar]
  46. Reyes, G.; Enrique, C.; Trujillo Liñán, L. Aplicación del Método Delphi Modificado para la Validación de un Cuestionario de Incorporación de las TIC en la Práctica Docente. RIEE Revista Iberoamericana de Evaluación Educativa 2018, 11, 113–134. [Google Scholar] [CrossRef]
  47. Anguita, J.C.; Labrador, J.R.; Campos, J.D.; Casas Anguita, J.; Repullo Labrador, J.; Donado Campos, J. La encuesta como técnica de investigación. Elaboración de cuestionarios y tratamiento estadístico de los datos (I). Atención Primaria 2003, 31, 527–538. [Google Scholar] [CrossRef]
  48. Cortina, I.B.; Robaina, R.A. Lógica difusa aplicada a la toma de decisiones. Ingeniería Industrial 2010, 31, 1–5. [Google Scholar]
  49. Guzmán, D.; Castaño, V. La lógica difusa en ingeniería: Principios, aplicaciones y futuro. Revista de Ciencia y Tecnología 2009, 24, 87–107. [Google Scholar]
  50. Martínez, C.; Colmenares, G.; Pachano, F. Uso de Las técnicas de Preprocesamiento de Datos e Inteligencia Artificial (lógica Difusa) en la Clasificación/Predicción del Riesgo Bancario. Ph.D. Thesis, Universidad de los Andes, Santiago, Chile, 2007. [Google Scholar]
  51. De Vito, E.L.; Eduardo, C. Introducción al razonamiento aproximado: Lógica difusa. Revista Americana de Medicina Respiratoria 2006, 6, 126–136. [Google Scholar]
  52. Cordon, O. A historical review of evolutionary learning methods for Mamdani-type fuzzy rule-based systems: Designing interpretable genetic fuzzy systems. Int. J. Approx. Reason. 2011, 52, 894–913. [Google Scholar] [CrossRef] [Green Version]
  53. Mamdani, E.H.; Assilian, S. An experiment in linguistic synthesis with a fuzzy logic controller. Int. J. Man Mach. Stud. 1975, 7, 1–13. [Google Scholar] [CrossRef]
  54. Wang, K. Computational Intelligence in Agile Manufacturing Engineering. In Agile Manufacturing: The 21st Century Competitive Strategy; Gunasekaran, A., Ed.; Elsevier Science Ltd.: Oxford, UK, 2001; pp. 297–315. [Google Scholar] [CrossRef]
  55. Pérez, R.A.M. Sistemas de inferencia basados en Lógica Borrosa: Fundamentos y caso de estudio. Rev. Investig. Sist. e Informática 2010, 7, 91–104. [Google Scholar]
  56. Vanegas, G.; Botero, C.; Restrepo, A. Una aproximación mediante lógica difusa al análisis de la competitividad empresarial. Administration Y Organizations 2014, 17, 14. [Google Scholar]
  57. Delgado, G.B.; Delgado, J.B. Metodología para la implementación de sistemas difusos tipo mamdani en lenguajes de programación de propósito general. In Proceedings of the Congreso Internacional en Ingeniería Electrónica, Chihuahua, Mexico, 10 October 2014; Volume 36, pp. 318–323. [Google Scholar]
  58. Brown, K.M.; Dennis, J. Derivative free analogues of the Levenberg-Marquardt and Gauss algorithms for nonlinear least squares approximation. Numer. Math. 1971, 18, 289–297. [Google Scholar] [CrossRef]
  59. Salazar Aguilar, M.A.; Cabrera Ríos, M. Pronóstico de demanda por medio de redes neuronales artificiales. Ingenierías 2007, 10, 6–12. [Google Scholar]
  60. Hippert, H.S.; Pedreira, C.E.; Souza, R.C. Neural networks for short-term load forecasting: A review and evaluation. IEEE Trans. Power Syst. 2001, 16, 44–55. [Google Scholar] [CrossRef]
  61. Saini, L.; Soni, M. Artificial neural network based peak load forecasting using Levenberg–Marquardt and quasi-Newton methods. IEE-Proc.-Gener. Transm. Distrib. 2002, 149, 578–584. [Google Scholar] [CrossRef]
  62. Lin, C.T.; Lee, C.S.G. Neural-network-based fuzzy logic control and decision system. IEEE Trans. Comput. 1991, 40, 1320–1336. [Google Scholar] [CrossRef]
  63. Mitrea, C.; Lee, C.; Wu, Z. A comparison between neural networks and traditional forecasting methods: A case study. Int. J. Eng. Bus. Manag. 2009, 1, 11. [Google Scholar] [CrossRef]
  64. Andalib, A.; Atry, F. Multi-step ahead forecasts for electricity prices using NARX: A new approach, a critical analysis of one-step ahead forecasts. Energy Convers. Manag. 2009, 50, 739–747. [Google Scholar] [CrossRef]
  65. Wang, D.; Lum, K.Y.; Yang, G. Parameter estimation of ARX/NARX model: A neural network based method. In Proceedings of the IEEE 9th International Conference on Neural Information Processing, ICONIP’02, Singapore, 18–22 November 2002; Volume 3, pp. 1109–1113. [Google Scholar]
  66. Altunkaynak, A.; Özger, M.; Çakmakci, M. Water consumption prediction of Istanbul city by using fuzzy logic approach. Water Resour. Manag. 2005, 19, 641–654. [Google Scholar] [CrossRef]
  67. Alippi, C.; Piuri, V. Experimental neural networks for prediction and identification. IEEE Trans. Instrum. Meas. 1996, 45, 670–676. [Google Scholar] [CrossRef]
  68. INEGI. Indice de Precios. From Internet. 2018. Available online: https://www.inegi.org.mx/temas/inpp/ (accessed on 9 May 2019).
  69. Kale, P.; Banwait, S.; Laroiya, S. Performance evaluation of ERP implementation in Indian SMEs. J. Manuf. Technol. Manag. 2010, 21, 758–780. [Google Scholar] [CrossRef]
  70. Hwa Chung, S.; Snyder, C.A. ERP adoption: A technological evolution approach. Int. J. Agil. Manag. Syst. 2000, 2, 24–32. [Google Scholar] [CrossRef]
  71. Jou, Y.T.; Wee, H.M.; Chen, H.C.; Hsieh, Y.H.; Wang, L. A neural network forecasting model for consumable parts in semiconductor manufacturing. J. Manuf. Technol. Manag. 2009, 20, 404–412. [Google Scholar] [CrossRef]
Figure 1. Proposed model.
Applsci 10 00829 g001
Figure 2. Fuzzy mechanism.
Applsci 10 00829 g002
Figure 3. Fuzzy construction.
Applsci 10 00829 g003
Figure 4. Fuzzy rules.
Applsci 10 00829 g004
Figure 5. Integration of historical data and experts judgements in ARX, external variable.
Applsci 10 00829 g005
Figure 6. Integration of historical data and experts judgements in NARX, closed-loop network.
Applsci 10 00829 g006
Figure 7. Integration of historical data and experts judgements in NARX, predict one step ahead.
Applsci 10 00829 g007
Table 1. Demand forecasting.
InputOutput
DateInterest rateGDPInflationUSA/MXNDemand
2018/0113.151.25.5518.60205,000
2018/0213.151.25.3418.84202,000
2018/0313.151.25.0418.16206,000
2018/0413.152.64.5518.71360,000
2018/0513.192.64.5119.91413,000
2018/0613.192.64.6519.91413,000
2018/0713.902.54.8218.64400,000
2018/0813.902.54.9019.08400,000
2018/0913.242.55.0218.71400,000
2018/1013.241.74.9020.33266,000
2018/1113.321.74.7020.40266,000
2018/1213.321.74.8019.64266,000
Table 2. Historical data.
Data Variables
Historical... 0.80, 0.86, 0.87, 0.77, 0.93, 0.92, 0.77, 0.98, 0.84, 0.97, 0.90, 0.62.
Variables... 0.50, 0.49, 0.50, 0.87, 1.00, 1.00, 0.97, 0.97, 0.97, 0.64, 0.64, 0.64.
Table 3. Models NARX and NAR: scaled conjugate gradient.
NARXNAR
Input layer2Input layer2
Hidden layer10Hidden layer10
Output layer1Output layer1
Activation functiontansigActivation functiontansig
Training algorithmtrainscgTraining algorithmtrainscg
Interactions16Interactions13
MSE0.0070MSE0.071
Correlation0.9882Correlation0.9215
Max-error6Max-error6
Table 4. Comparative results.
Performance models
ModeloMADMAPEMSE
NARX17,6618561,742,971
NAR16,4468584,297,989
Holt23,35912996,544,938

