Modelling a Safety Management System Using System Dynamics at the Bhopal Incident


1
Department of Materials Engineering and Operations Management, University of Naples Federico II, 80138 Naples, NA, Italy
2
National Institute for Insurance against accidents at work (INAIL)—Operational Territorial Unit of Naples, 80138 Naples, NA, Italy
3
Department of Industrial Engineering, University of Naples Federico II, 80138 Naples, NA, Italy
*
Author to whom correspondence should be addressed.
Appl. Sci. 2020, 10(3), 903; https://0-doi-org.brum.beds.ac.uk/10.3390/app10030903
Submission received: 17 November 2019
/
Revised: 30 December 2019
/
Accepted: 18 January 2020
/
Published: 30 January 2020
(This article belongs to the Special Issue Managing Innovation and Sustainable Development in the Era of Industry 4.0)
Abstract
:In a safety management system (SMS), risk management plays a key role for the prevention of accidents. This study aims to propose a safety management model by using a system dynamics approach applied to the Bhopal incident. The model proposed in this paper discusses the relationships among the main causes that have contributed to the occurrence of the incident studied, such as broken safety devices, inadequate personnel experience, operator decisions, manager production strategy, policy decision, as deduced from the relevant literature about the Bhopal incident dynamics. The simulation and the results clarify how to manage the key factors to make the plant safe. Moreover, we want to underline how these key modern aspects of safety could be enhanced by using the enabling technologies of industry 4.0.
1. Introduction
In 1984, the well-known Bhopal disaster involved the chemical plant of the American multinational Union Carbide, specialized in production of pesticides. The explosion of a methyl isocyanate storage tank inside the plant caused the death of about 3000 people and poisoned tens of thousands more. The incident started a long process of research and investigation concerning the causes and effects [1], which led to the consideration that the accident could have been be avoided. In fact, a lack of maintenance and precautions in safety operations was detected. Moreover, according to these studies the large multinational Union Carbide had little concern for safety in an emerging country where the technology used was untested and faulty. Though a rare incident, Bhopal was not a random event; rather, it was predictable, and the causes were accessible and the events potentially avoidable [2].
The Bhopal incident is one of the most important examples of the lack of safety due to no maintenance policies, no human continuous training and no plan investments. For these reasons, the Bhopal accident is well suited to highlight the impact that maintenance and the human factor have on the safety management system.
In particular, if the maintenance was efficient, the extent of the accident would have been more contained [3].
The Bhopal disaster has led to regulations and awareness of process safety-related activities worldwide. The whole scientific community has focused on the causes and consequences of the disaster, with particular attention to the topic of maintenance and safety [4].
These studies have developed a new safety culture [5] with different proposed approaches. Yang et al. proposed a Bayesian approach [6] while Garbolino [7] managed safety by using a different methodological approach based on system dynamics (SD).
According to Lane’s paradox [8], “the results of quantitative system dynamic study are qualitative insights”, this paper aims to highlight, by using a quantitative model based on Bhopal accident data, that the technical, organizational and human factors that could have been managed effectively with a safety management system (SMS).
System dynamics are used to highlight the interrelations among the factors that mainly affect maintenance and its effects on safety. This leads to consideration of the impact that maintenance and human factors could have on the safety of a high-risk plant, thus being key factors in an appropriate management system.
It is true that one of the key points implemented in industry 4.0 is how to reduce environmental pollution, as shown by Abdul Moktadir et al. in a recent paper [9], but also to increase safety by receiving real time inputs about hotspots of the system; for example, in a high-risk industrial sector such as the petrochemical one, the industry 4.0 approach is used to monitor big data from a variety of sources, as highlighted by Hongfang Lu et al. [10].
Literature, as well as Process Safety and Environmental Protection (PSEP), tries to support the integration among concepts and industry 4.0 technologies for sustainable production systems [11]. Undoubtedly, receiving data in real time allows the optimization of the enterprise resource planning (ERP) [12].
The paper is organized as follows: Section 2 presents the methodological approach, in Section 3 the model is analyzed through a real case study concerning the Bhopal incident and results are analyzed in Section 4. A discussion about how industry 4.0 could reduce system failure probability is presented in Section 5. Finally, conclusion of the research is summarized in Section 6.
2. Assumptions Methodology Description
In order to develop and implement an effective safety management system, many factors have to be considered to represent the whole system. Many authors in literature [13,14,15] have supported the effectiveness of system dynamics as a useful tool to highlight the interrelations among the components of a system: People, things, business functions, socio-technical elements, psychophysical characteristics, etc.
System dynamics could be associated to a dynamic Bayesian network (DBN), which would allow association of a priority scale based on the temporal evolution of faults (as if a weight factor was associated with each fault) [16].
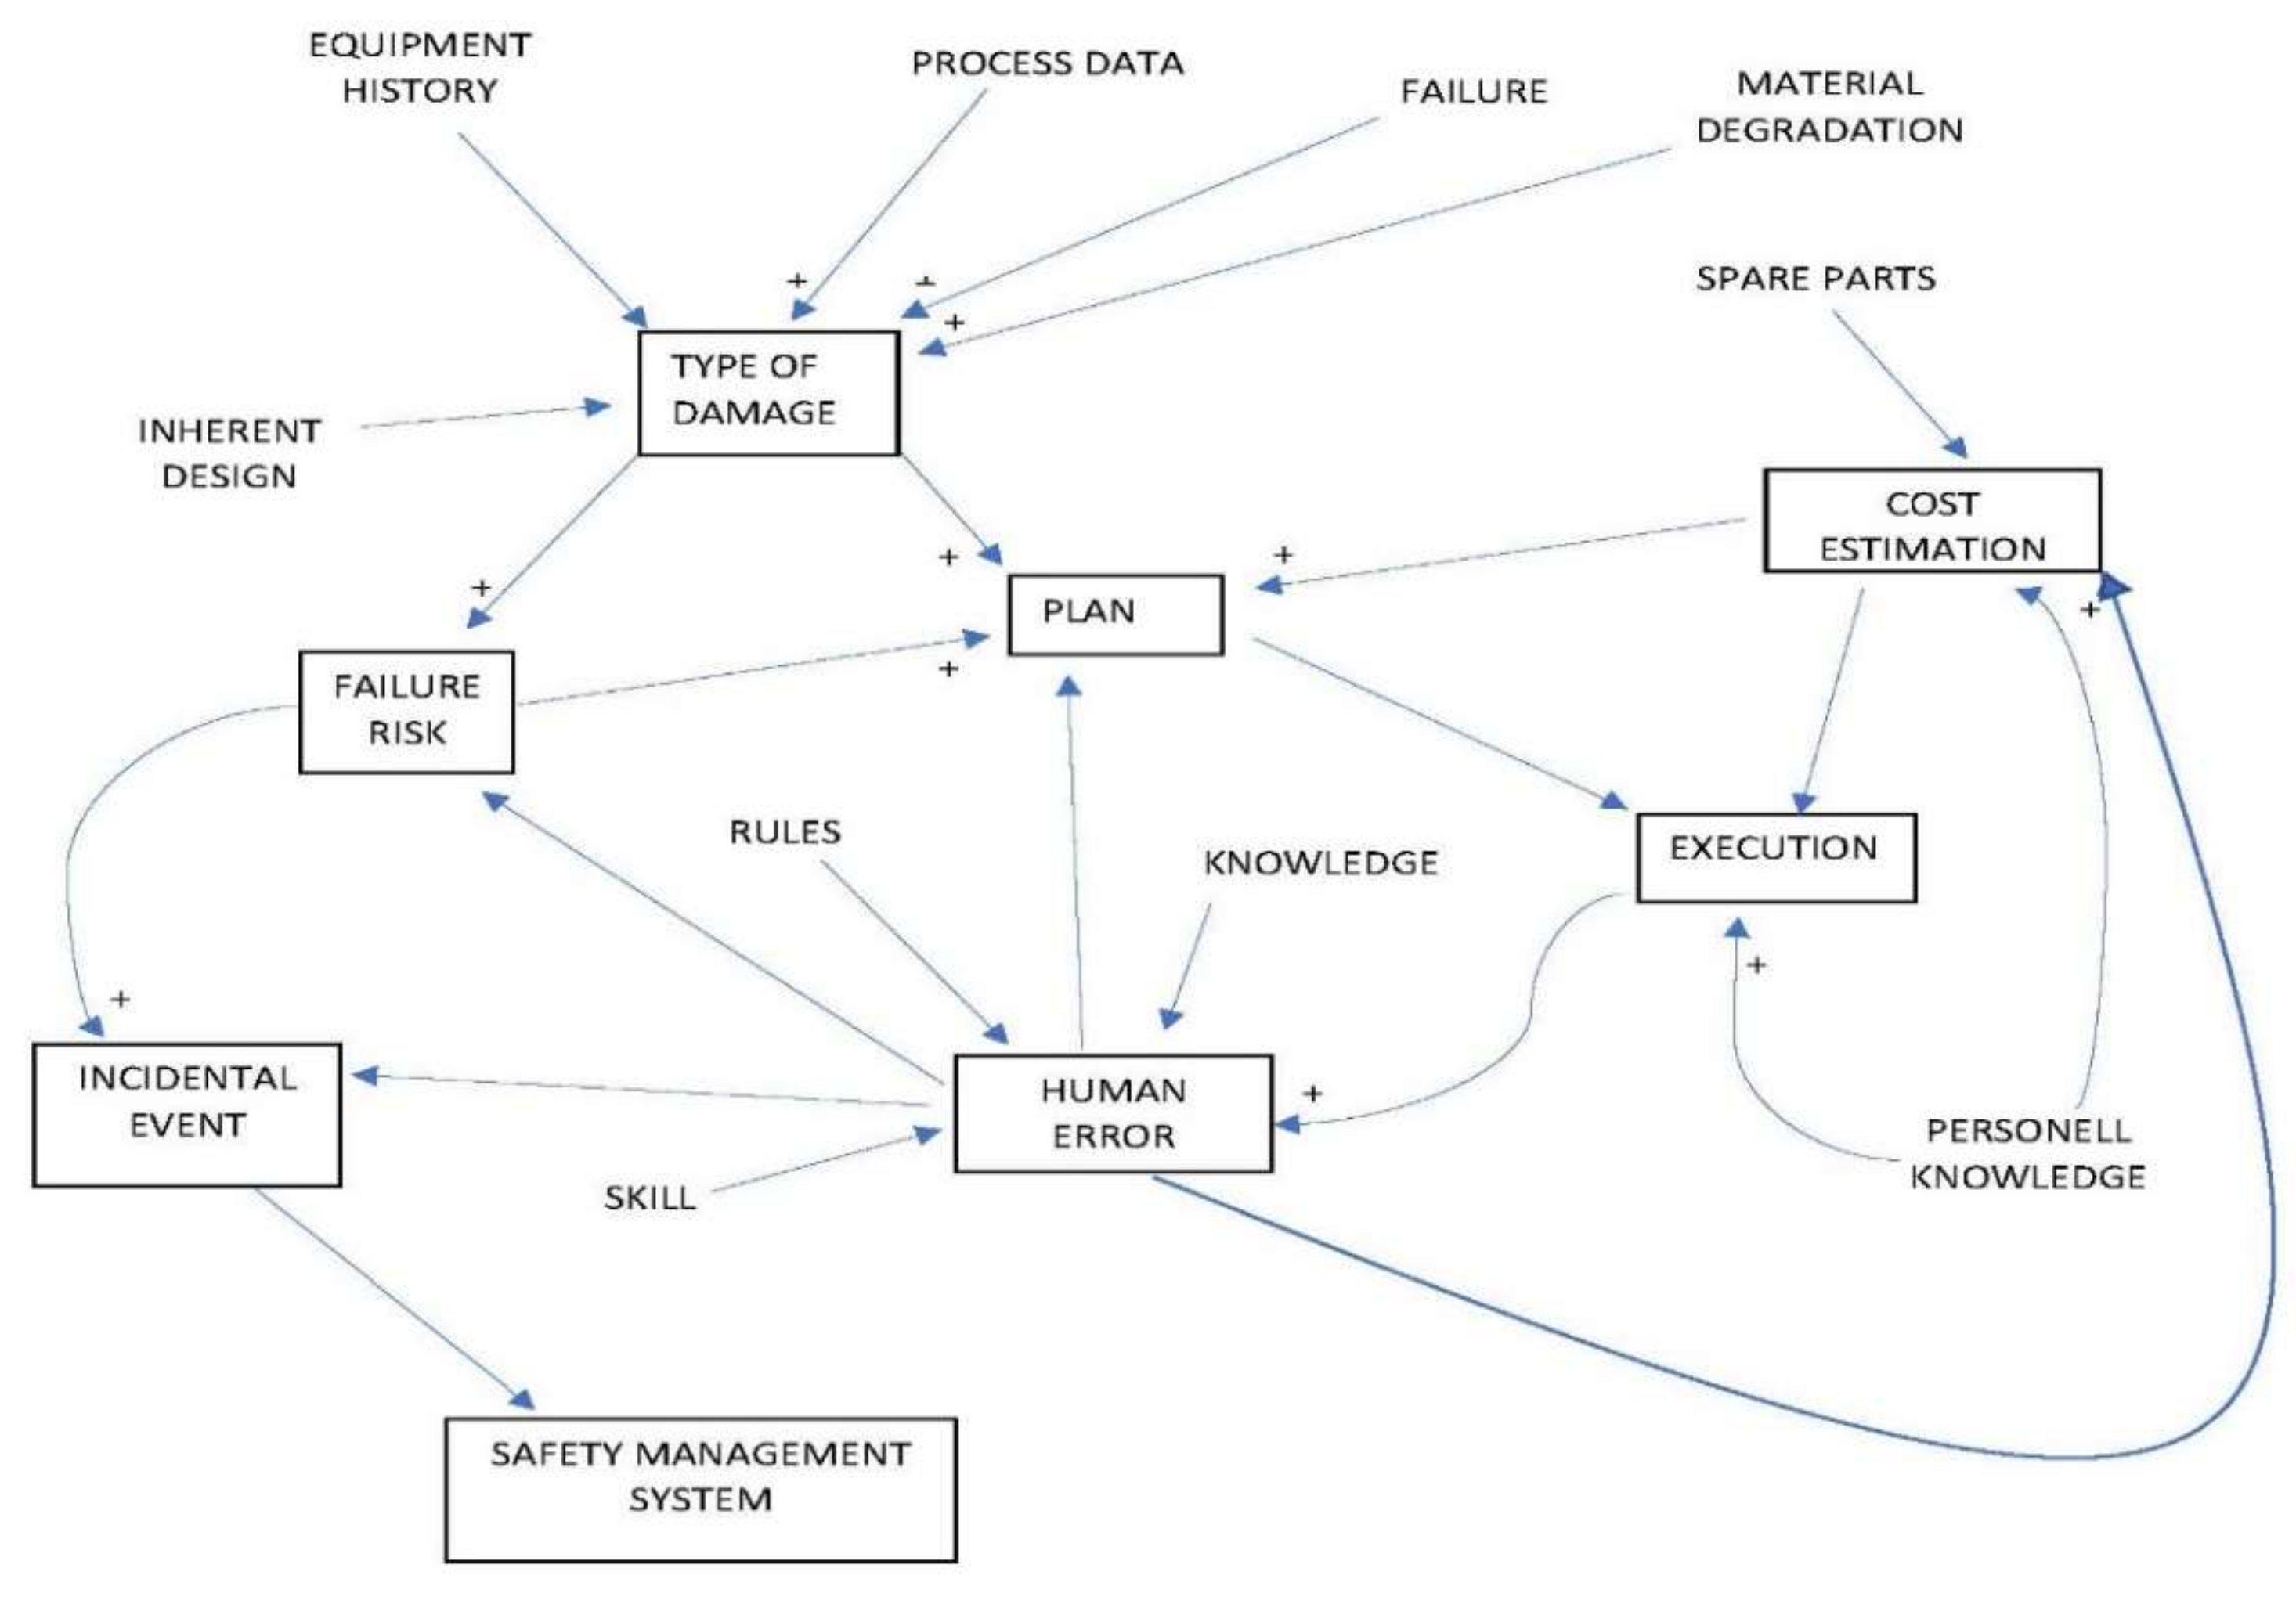
The causal loop diagram (CLD) is the graphical tool used to make cause and effect relationships among these elements immediately visible, so it is the starting point for the subsequent construction of the model.
According to the aim of this paper and starting from the literary review, a causal loop diagram is proposed. The model highlights the main factors that influenced the Bhopal incident.
The elements of the causal loop diagram and the cause–effect relations of each of them with the other elements of the system are described in Figure 1, in which the following variables are reported:
- Failure risk: The risk of failure/breakage is based on probability of failure of an equipment/plant and the consequences deriving from it. This estimate is more accurate if the information about it is more precise relative to the type of failure/break (type of damage) [14]. This will depend on information derived from the historian of the inspections and maintenance carried out, on the planning data for inspection, on process data (temperature, pressure, etc.), on the type of degradation to which the construction material is mostly subjected as well as the fault data. The risk of failure becomes the criteria of the decision-making process that leads to planning maintenance and inspection activities (plan). The more realistic risk estimation is, the more reliable the maintenance and inspection plans will be.
- Type of damage: The type of damage that could occur on an equipment/plant depends significantly on the characteristics of construction, in terms of materials used and the history of breakdowns of the same type of equipment [15]. Based on the knowledge of the type of failure that could occur, it is possible to decide which inspection technique may be used. In this sense, the knowledge of the type of damage directly affects planning, in particular, with regard to the tools and specialized personnel used in conducting particular non-destructive tests.
- Plan: In the planning phase, the decision-making process should lead to the optimal selection of interventions, considering the criteria of risk (risk failure) and the constraints of badges, which in turn are the result of an estimation process (cost estimation). As it is the time during which decisions are planned, it cannot be detached from human error that in turn could affect the reliability and the effectiveness of the maintenance activities [16].
- Execution: The execution of the maintenance/inspection plan is influenced by the planning (plan) in terms of priority of intervention and of personnel employed (cost estimation), as well as the knowledge of who conducts maintenance and inspection activities. Poor knowledge and experience, together with other factors such as cost reduction related to the acquisition of suitable instrumentation for conducting inspections, increases the probability of human error.
- Cost estimation: The cost estimation sets constraints on the planning and the execution of maintenance and inspection activities. This process, if not supported by an adequate knowledge of the person who performs it, could have negative repercussions during both planning and execution. Vice versa, adequate capacity in estimating costs could lead to optimal planning in terms of cost–benefit [16].
- Human error: Human error could materialize in routine activities that require acquisition of specific capabilities (skills), or in the execution of wrong procedures (rules) or in following a wrong reasoning. In the latter case, the errors that occur at knowledge level can undermine the planning process (plan) and the phase of cost estimation. An incident might derive directly from the incorrect execution of the activities of maintenance and/or inspection or might be the result of an inadequate decision-making process [16].
- INCIDENT: the incident is the manifestation of an occurred error in the decision-making process or in the execution of the maintenance/inspection activities. The number of incidents as well as the arising consequences become the parameters by which the safety management must measure to implement all strategies to try to avoid them [17].
- Safety management system: The International Civil Aviation Organization (ICAO) defines the safety management system as an organized approach to managing safety, which includes the necessary organizational structure, the definition of the politics and procedures [18]. The deployment of a management system requires human and financial resources, time and equipment. Top management decides the amount and allocation of these resources (cost estimation). The SMS needs a series of data to be proactive in order to measure performance and make forecasts. As a result, the occurrence of an incident updates the knowledge of the SMS and allows it to implement actions to prevent future accidents [19].
3. System Dynamics Applied to the Bhopal Incident
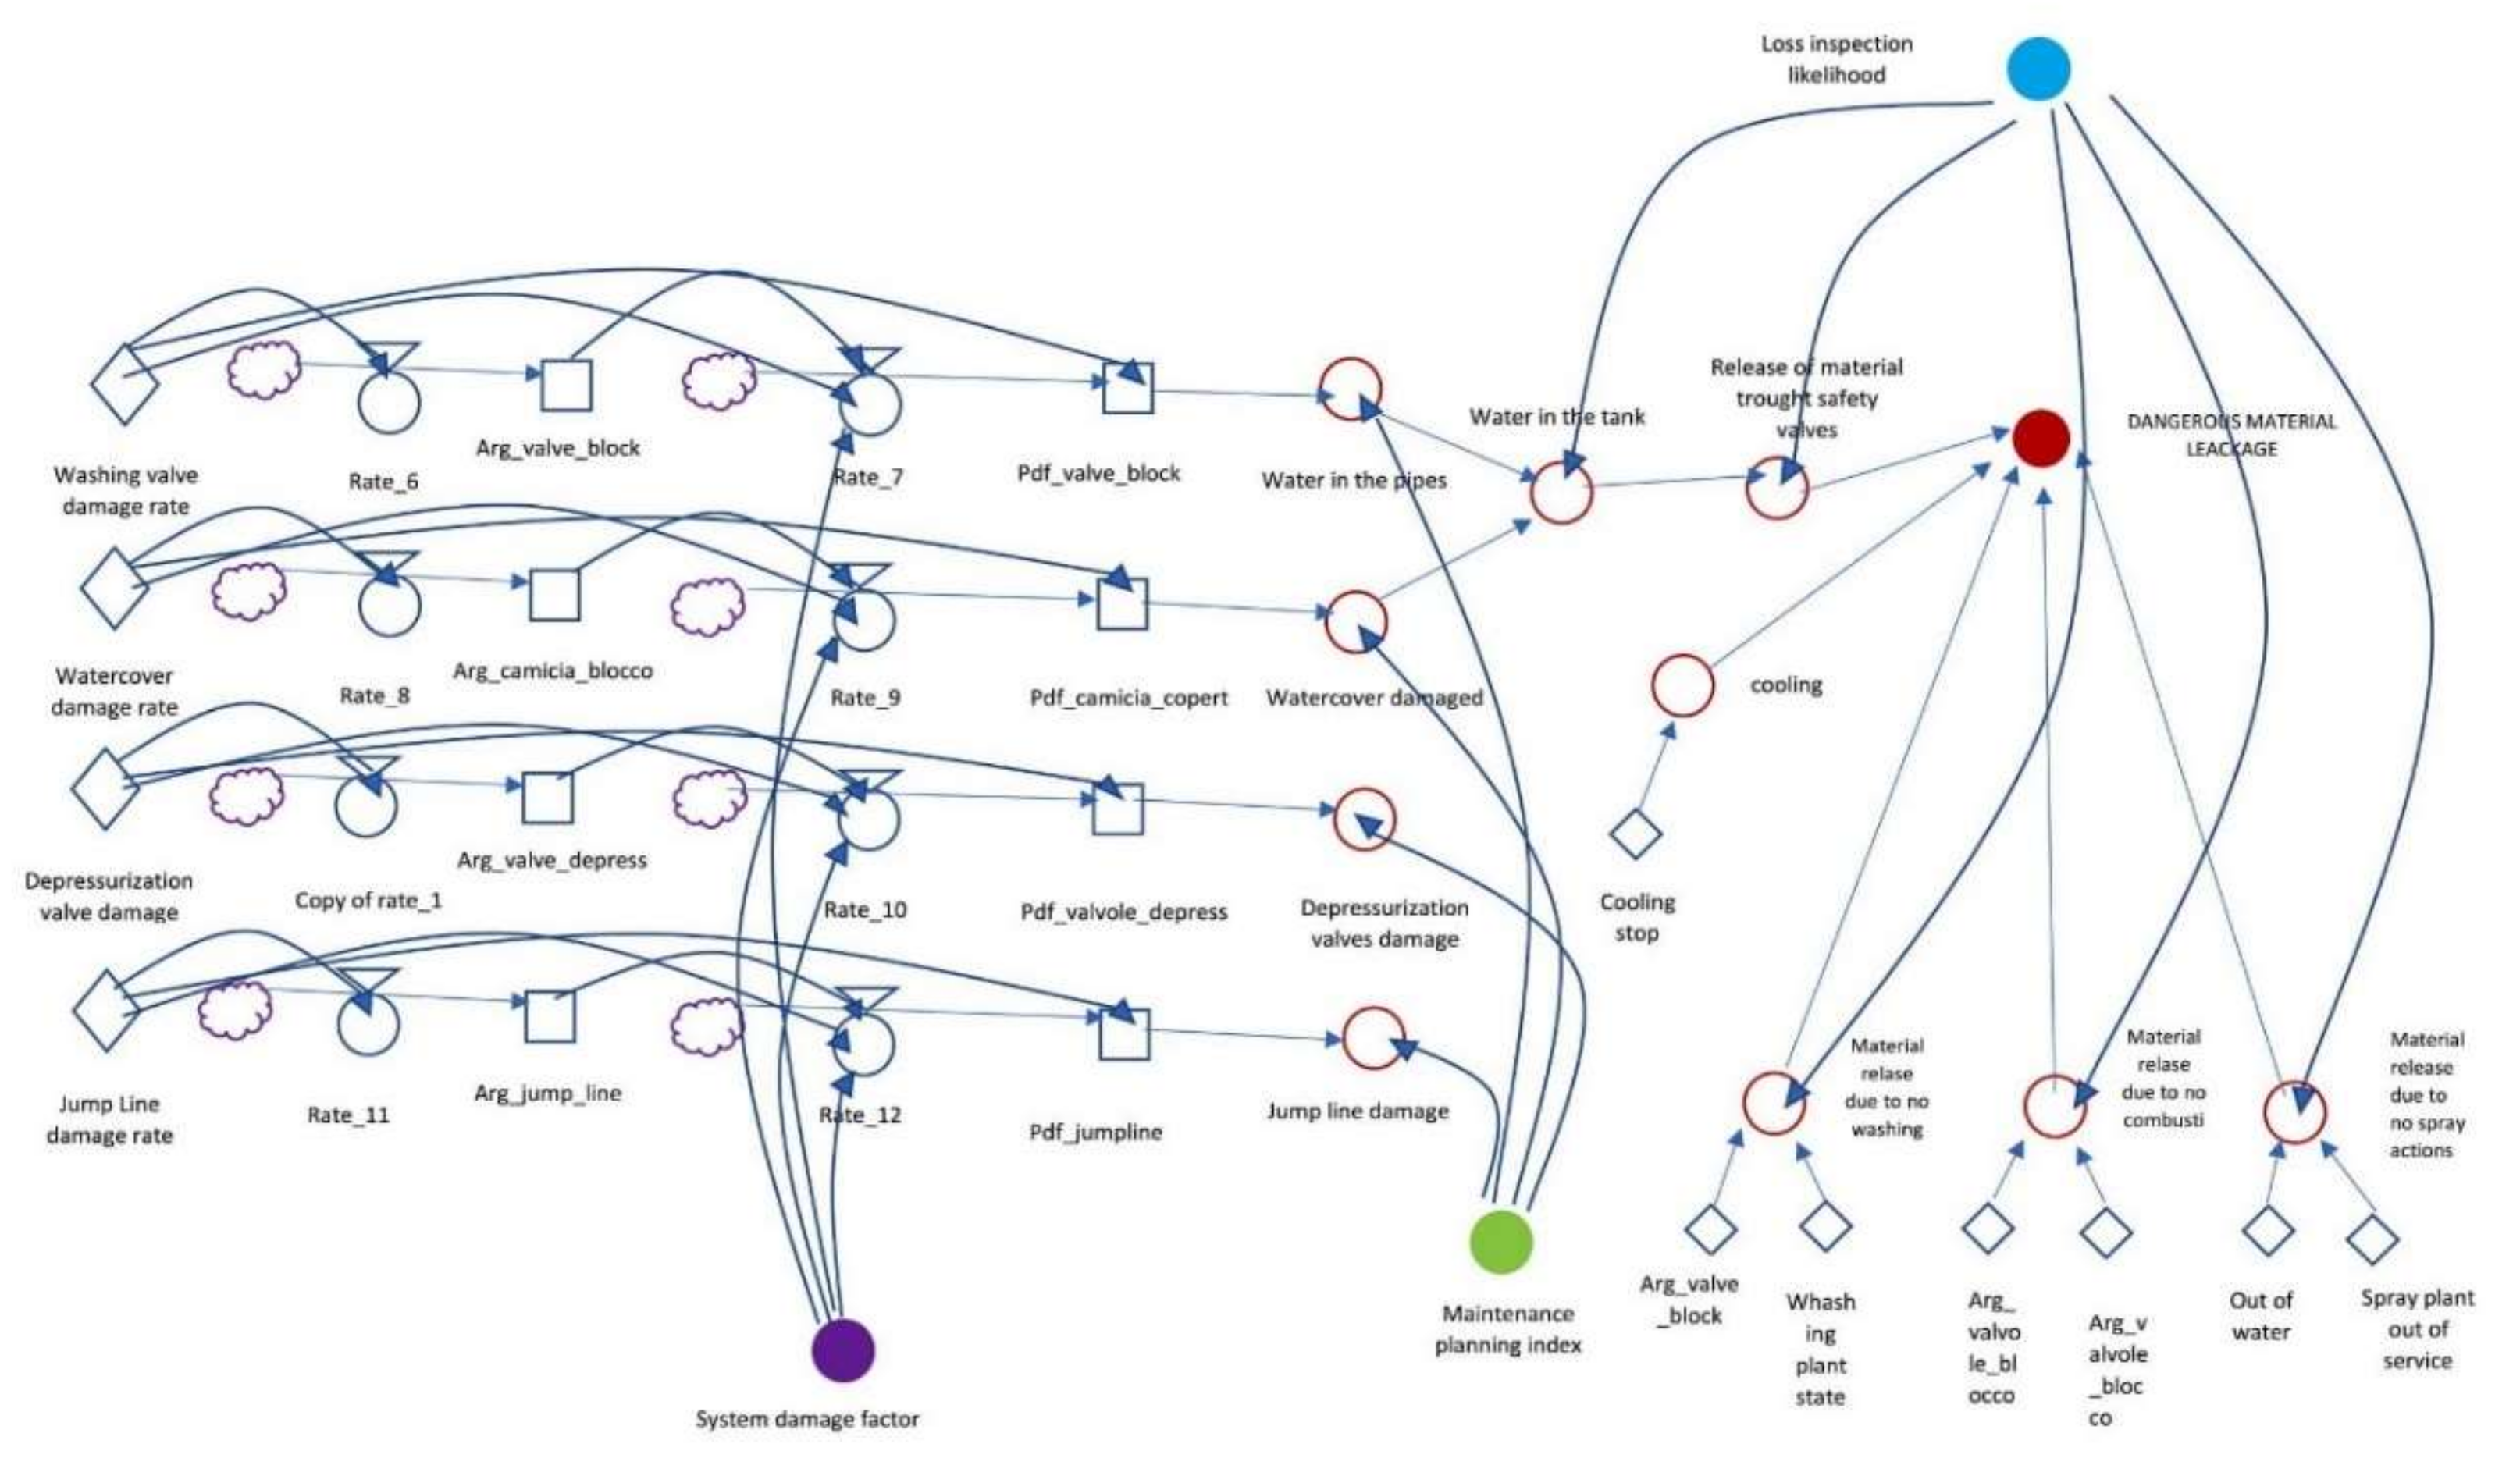
Starting from the causal loop diagram (CLD) developed above, a model in Powersim Studio was built. In order to validate the model proposed, all the data used for the simulation referred to the Bhopal incident, as they are available in the literature [20,21,22].
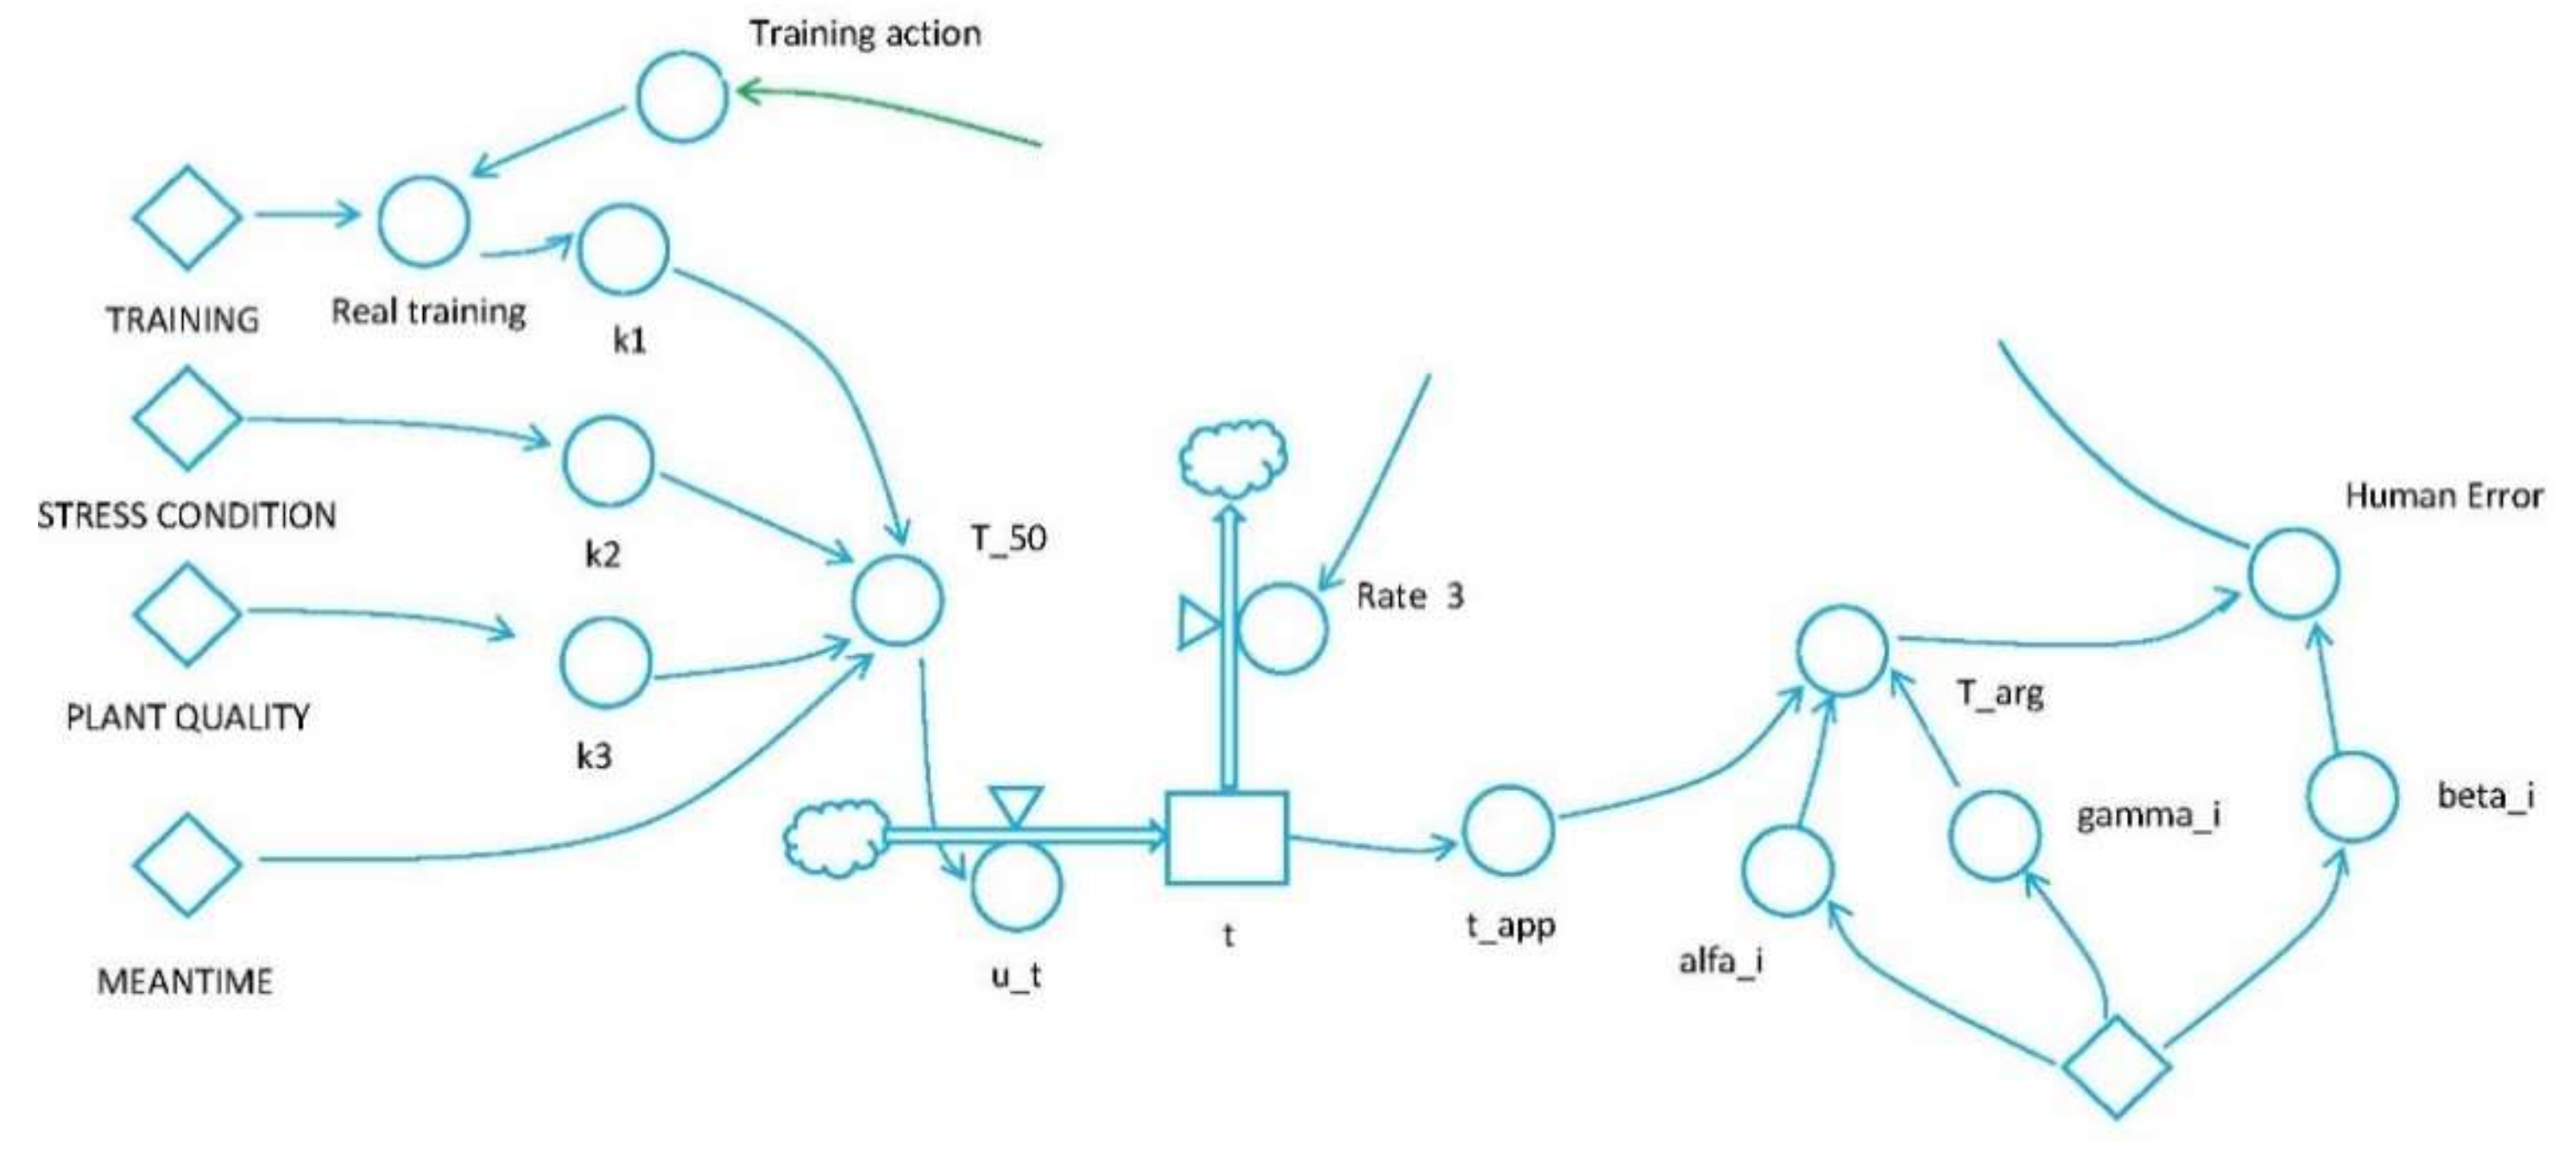
The probabilities of mechanical failure of the safety protection system have been expressed through appropriate aging functions, as in Figure 2. The following functions were introduced:
- (1)
- Maintenance planning index, which considers the maintenance schedule on the plant.
- (2)
- Loss inspection likelihood, which takes into account human error in doing visual inspections that may be due to many variables (training, information, etc.) and certain conditions (stress, daytime, etc.) [16].
- (3)
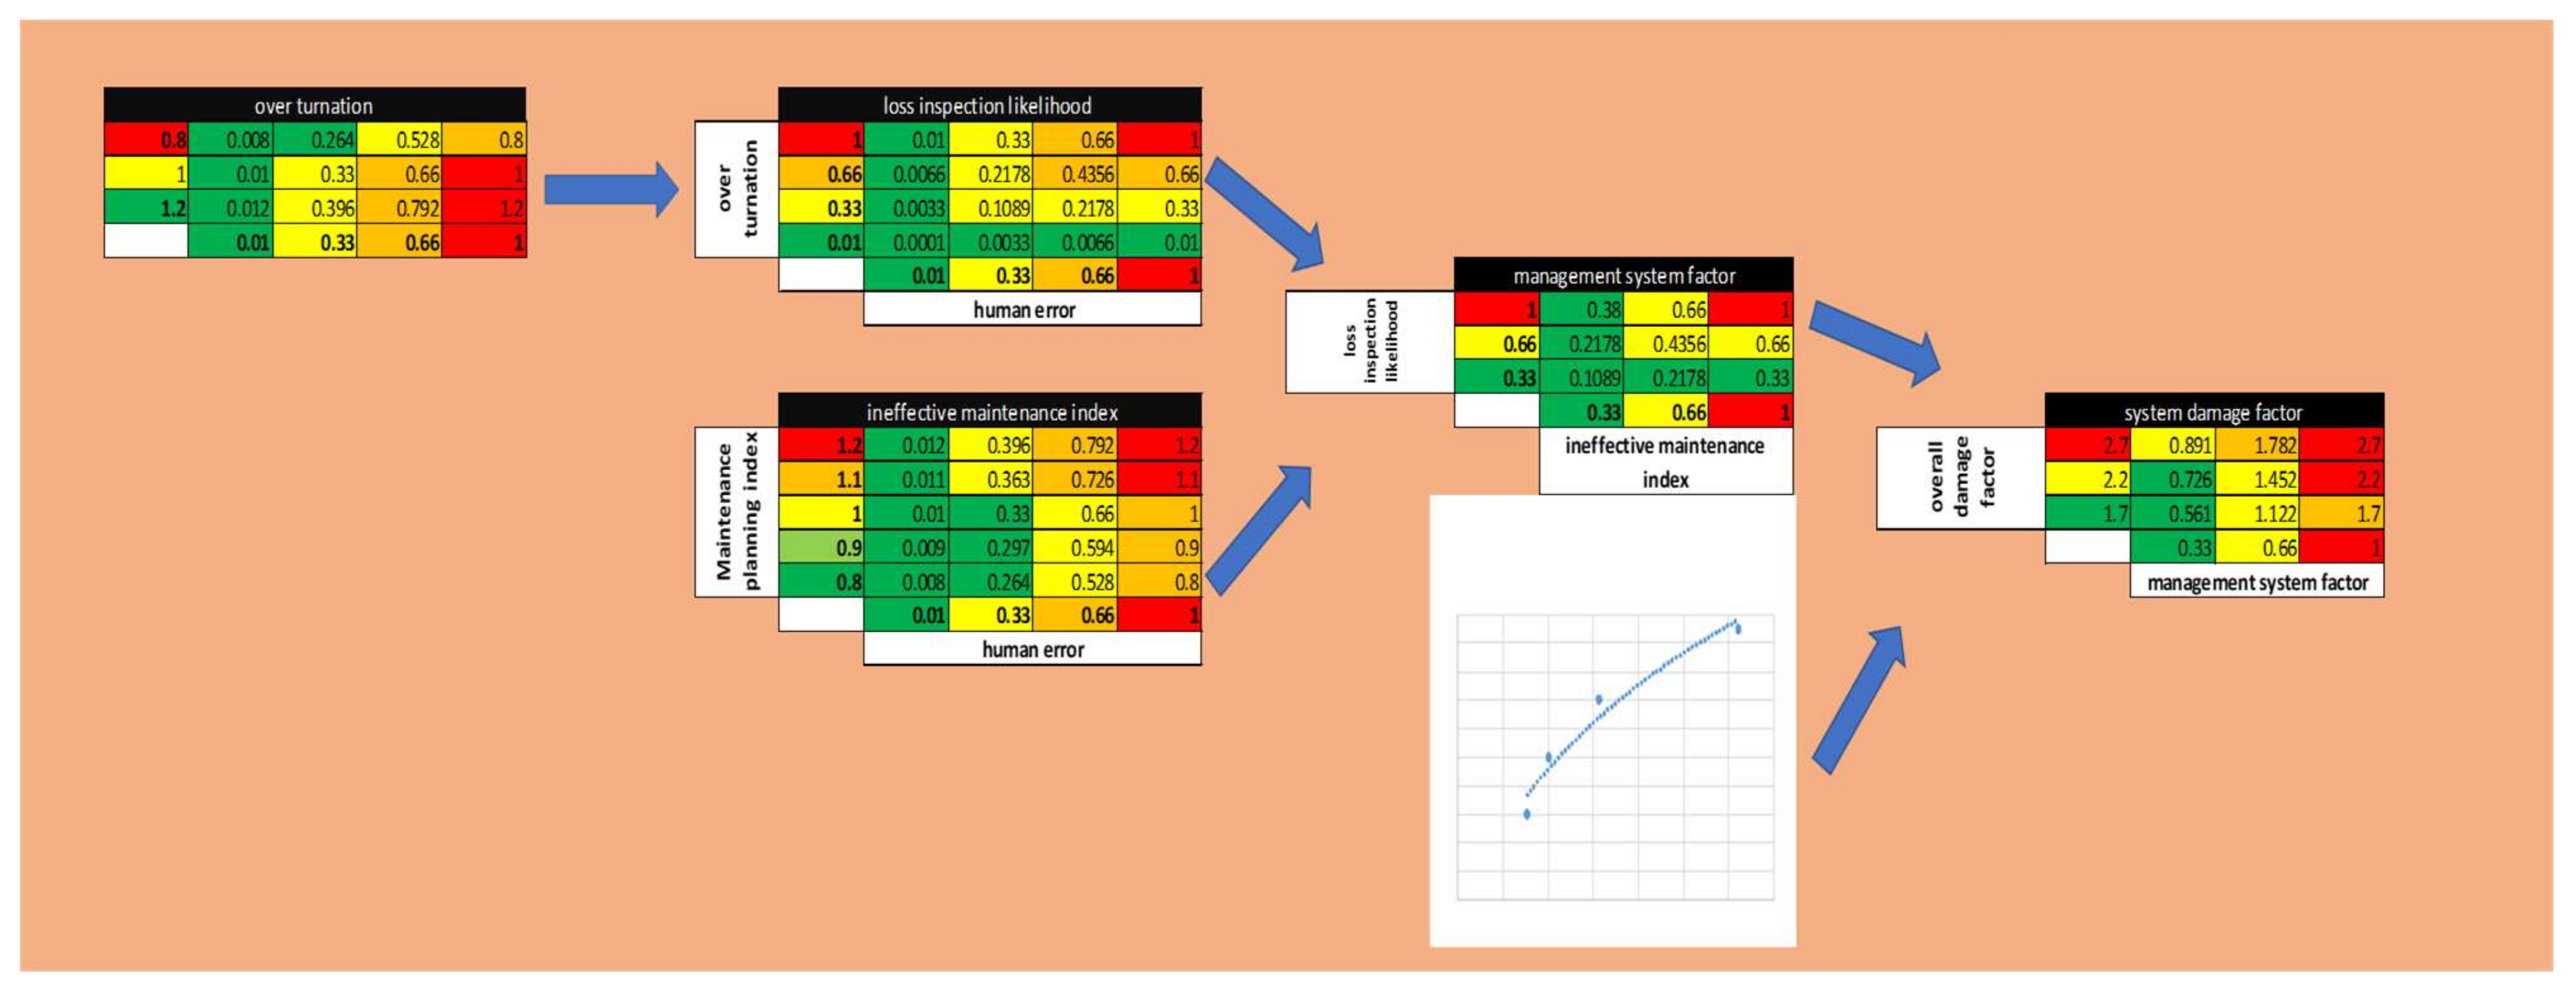
- System damage factor, which considers the impact of management on the production system.
The interaction of all these variables, described above, led to the creation of the dangerous material leakage function.
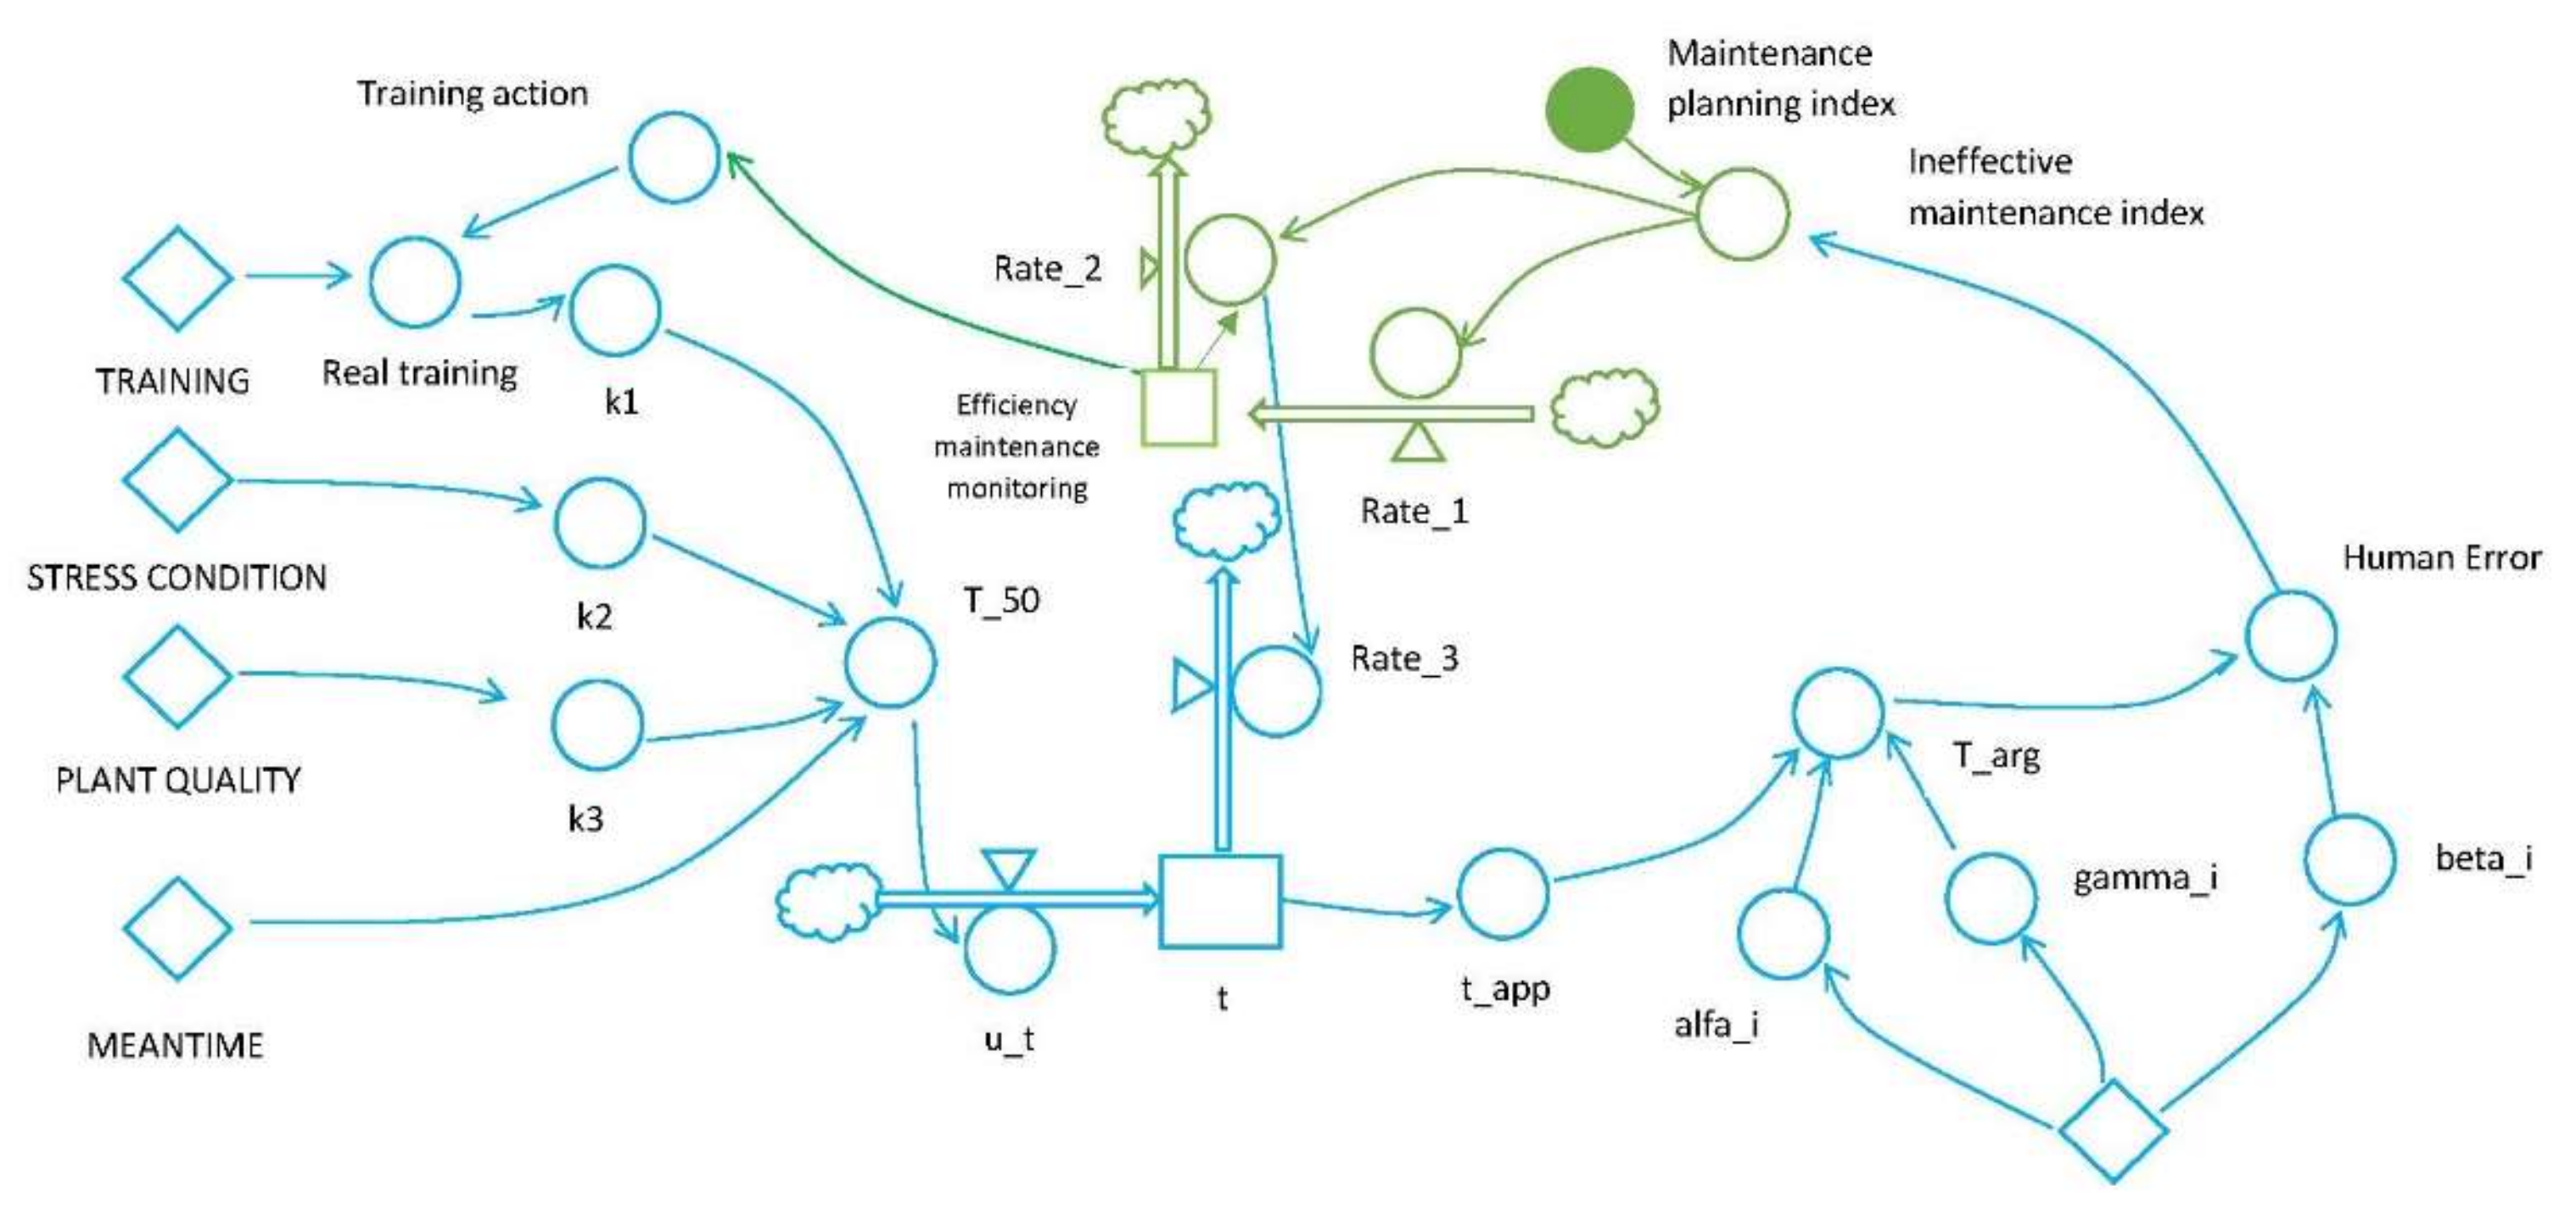
The main part of the model moved to the probability of loss of containment of hazardous material (Figure 3).
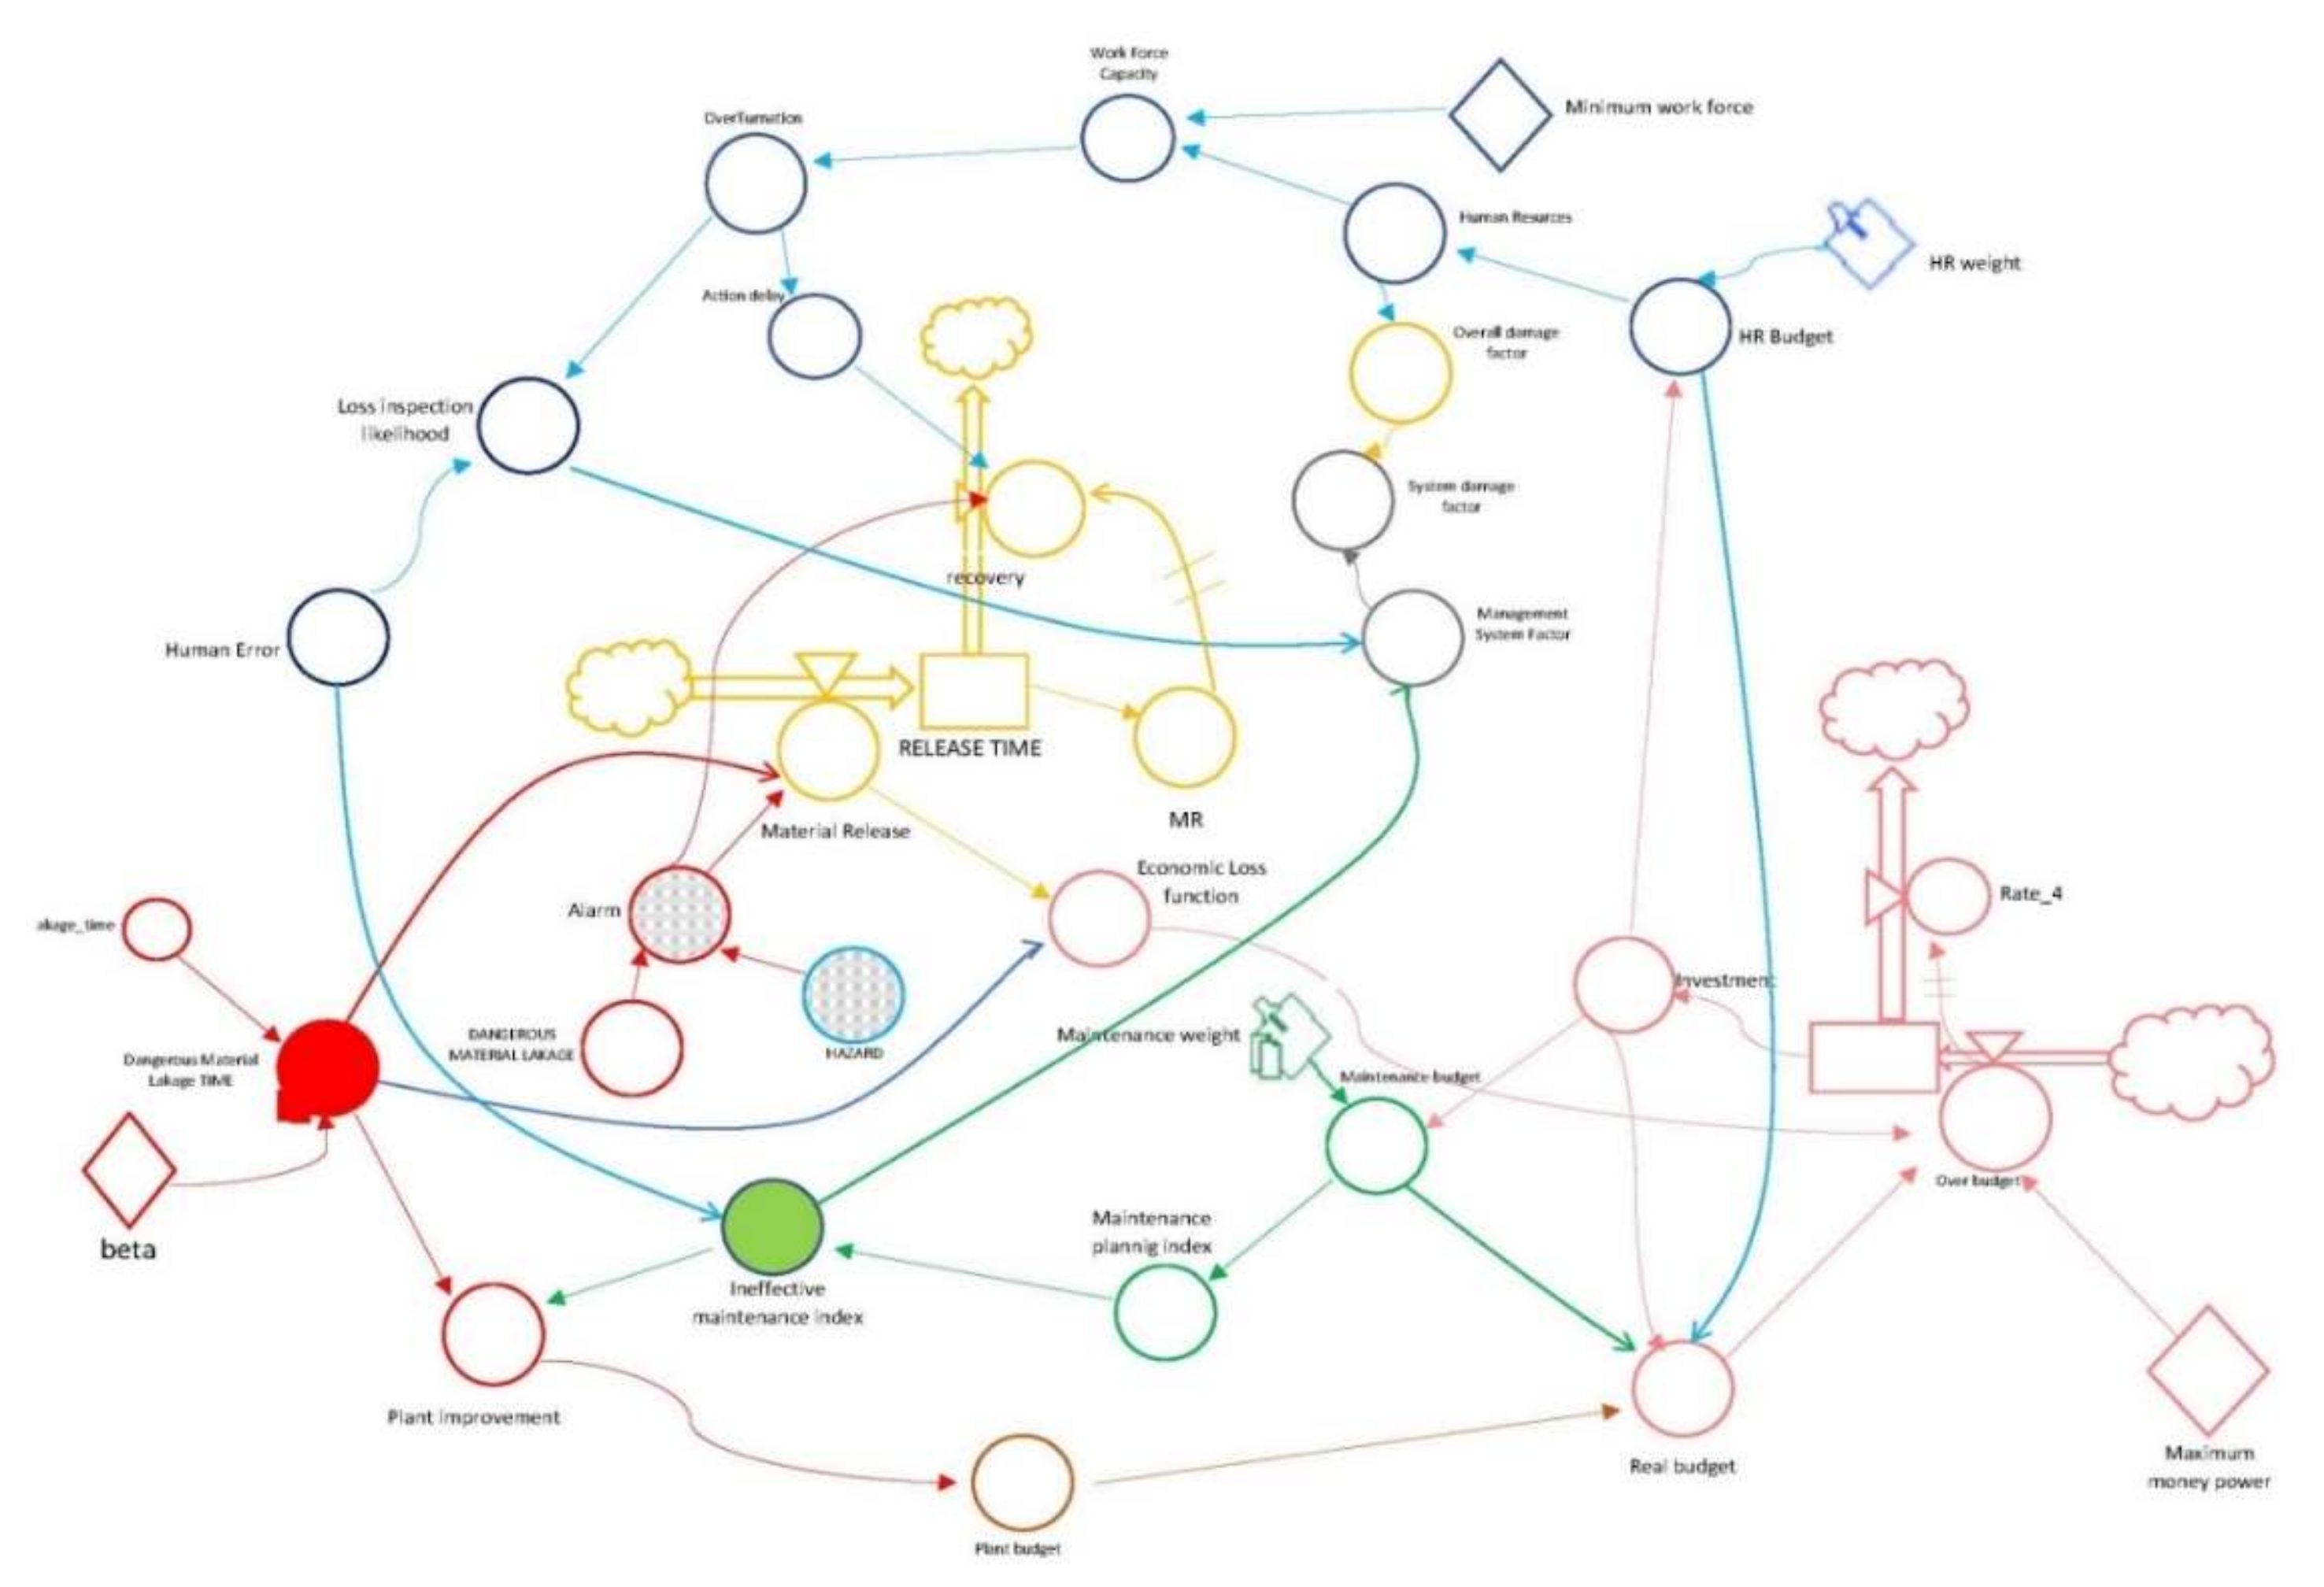
The impending industry and safety 4.0 and the development of the related technologies, such as Internet of Things (IOT), Industrial Internet of Things (IIOT), digital twin, augmented reality and wireless communication technologies, will allow better data collection and in less time [9].
The model proposed describes comprehensive plant safety systems (lock valves, cover jacket, depressurization valves), which are linked in Figure 3 with protection measures (refrigeration, washing systems, release valves, sprinklers).
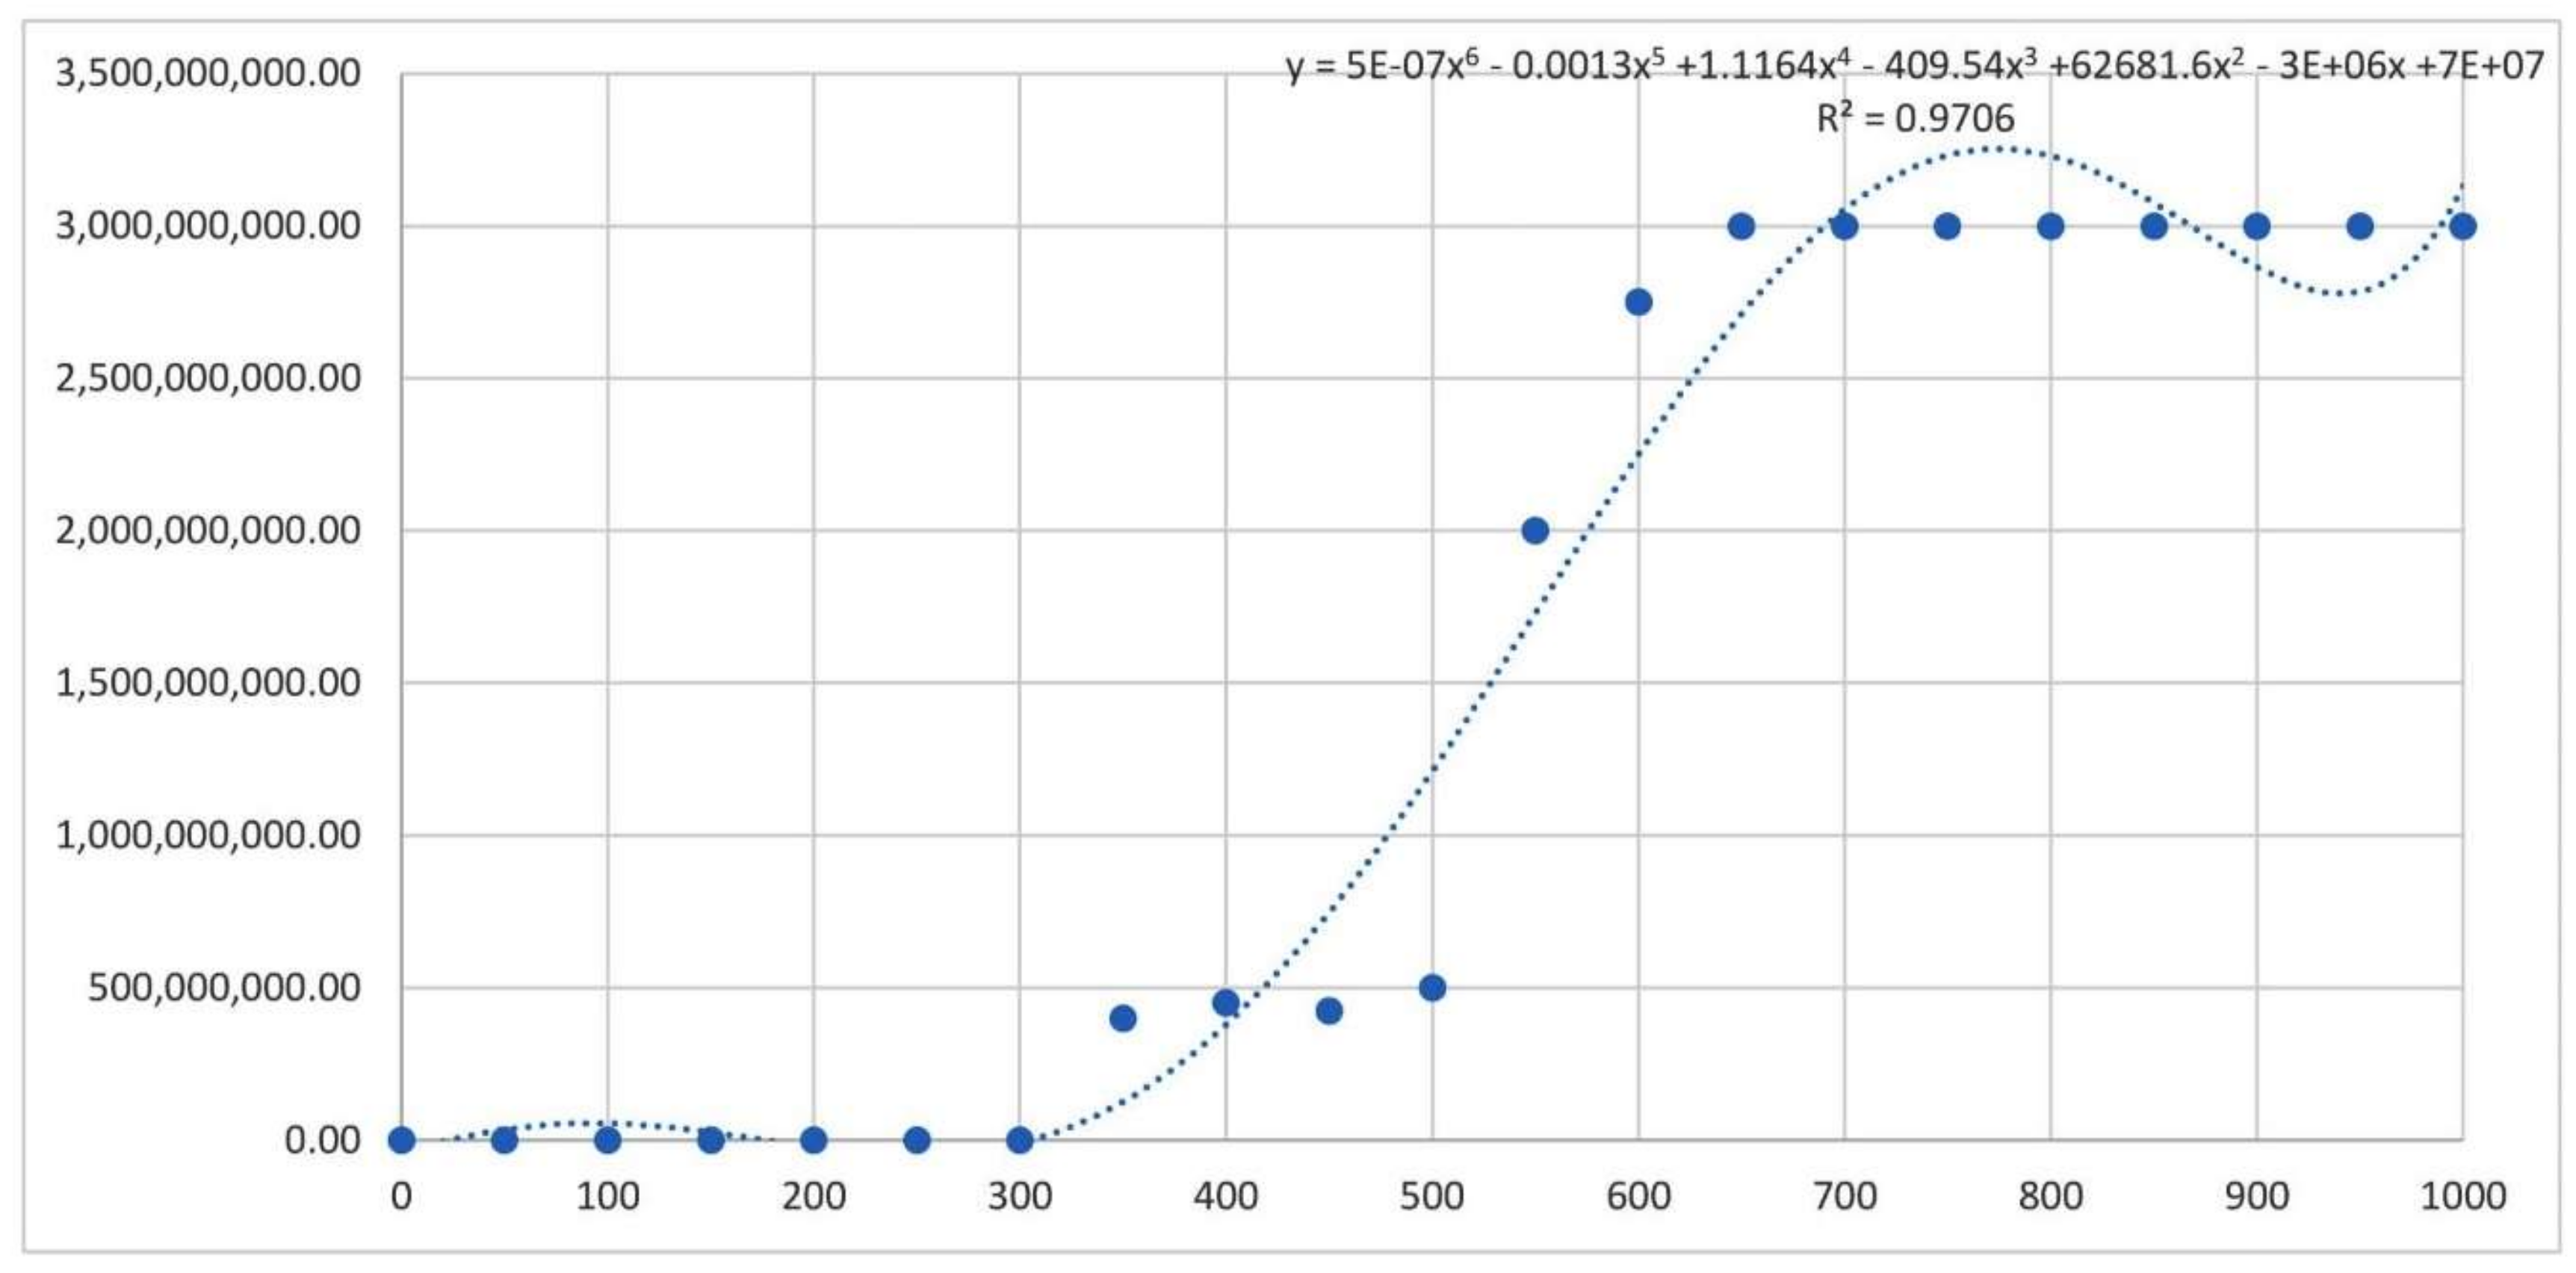
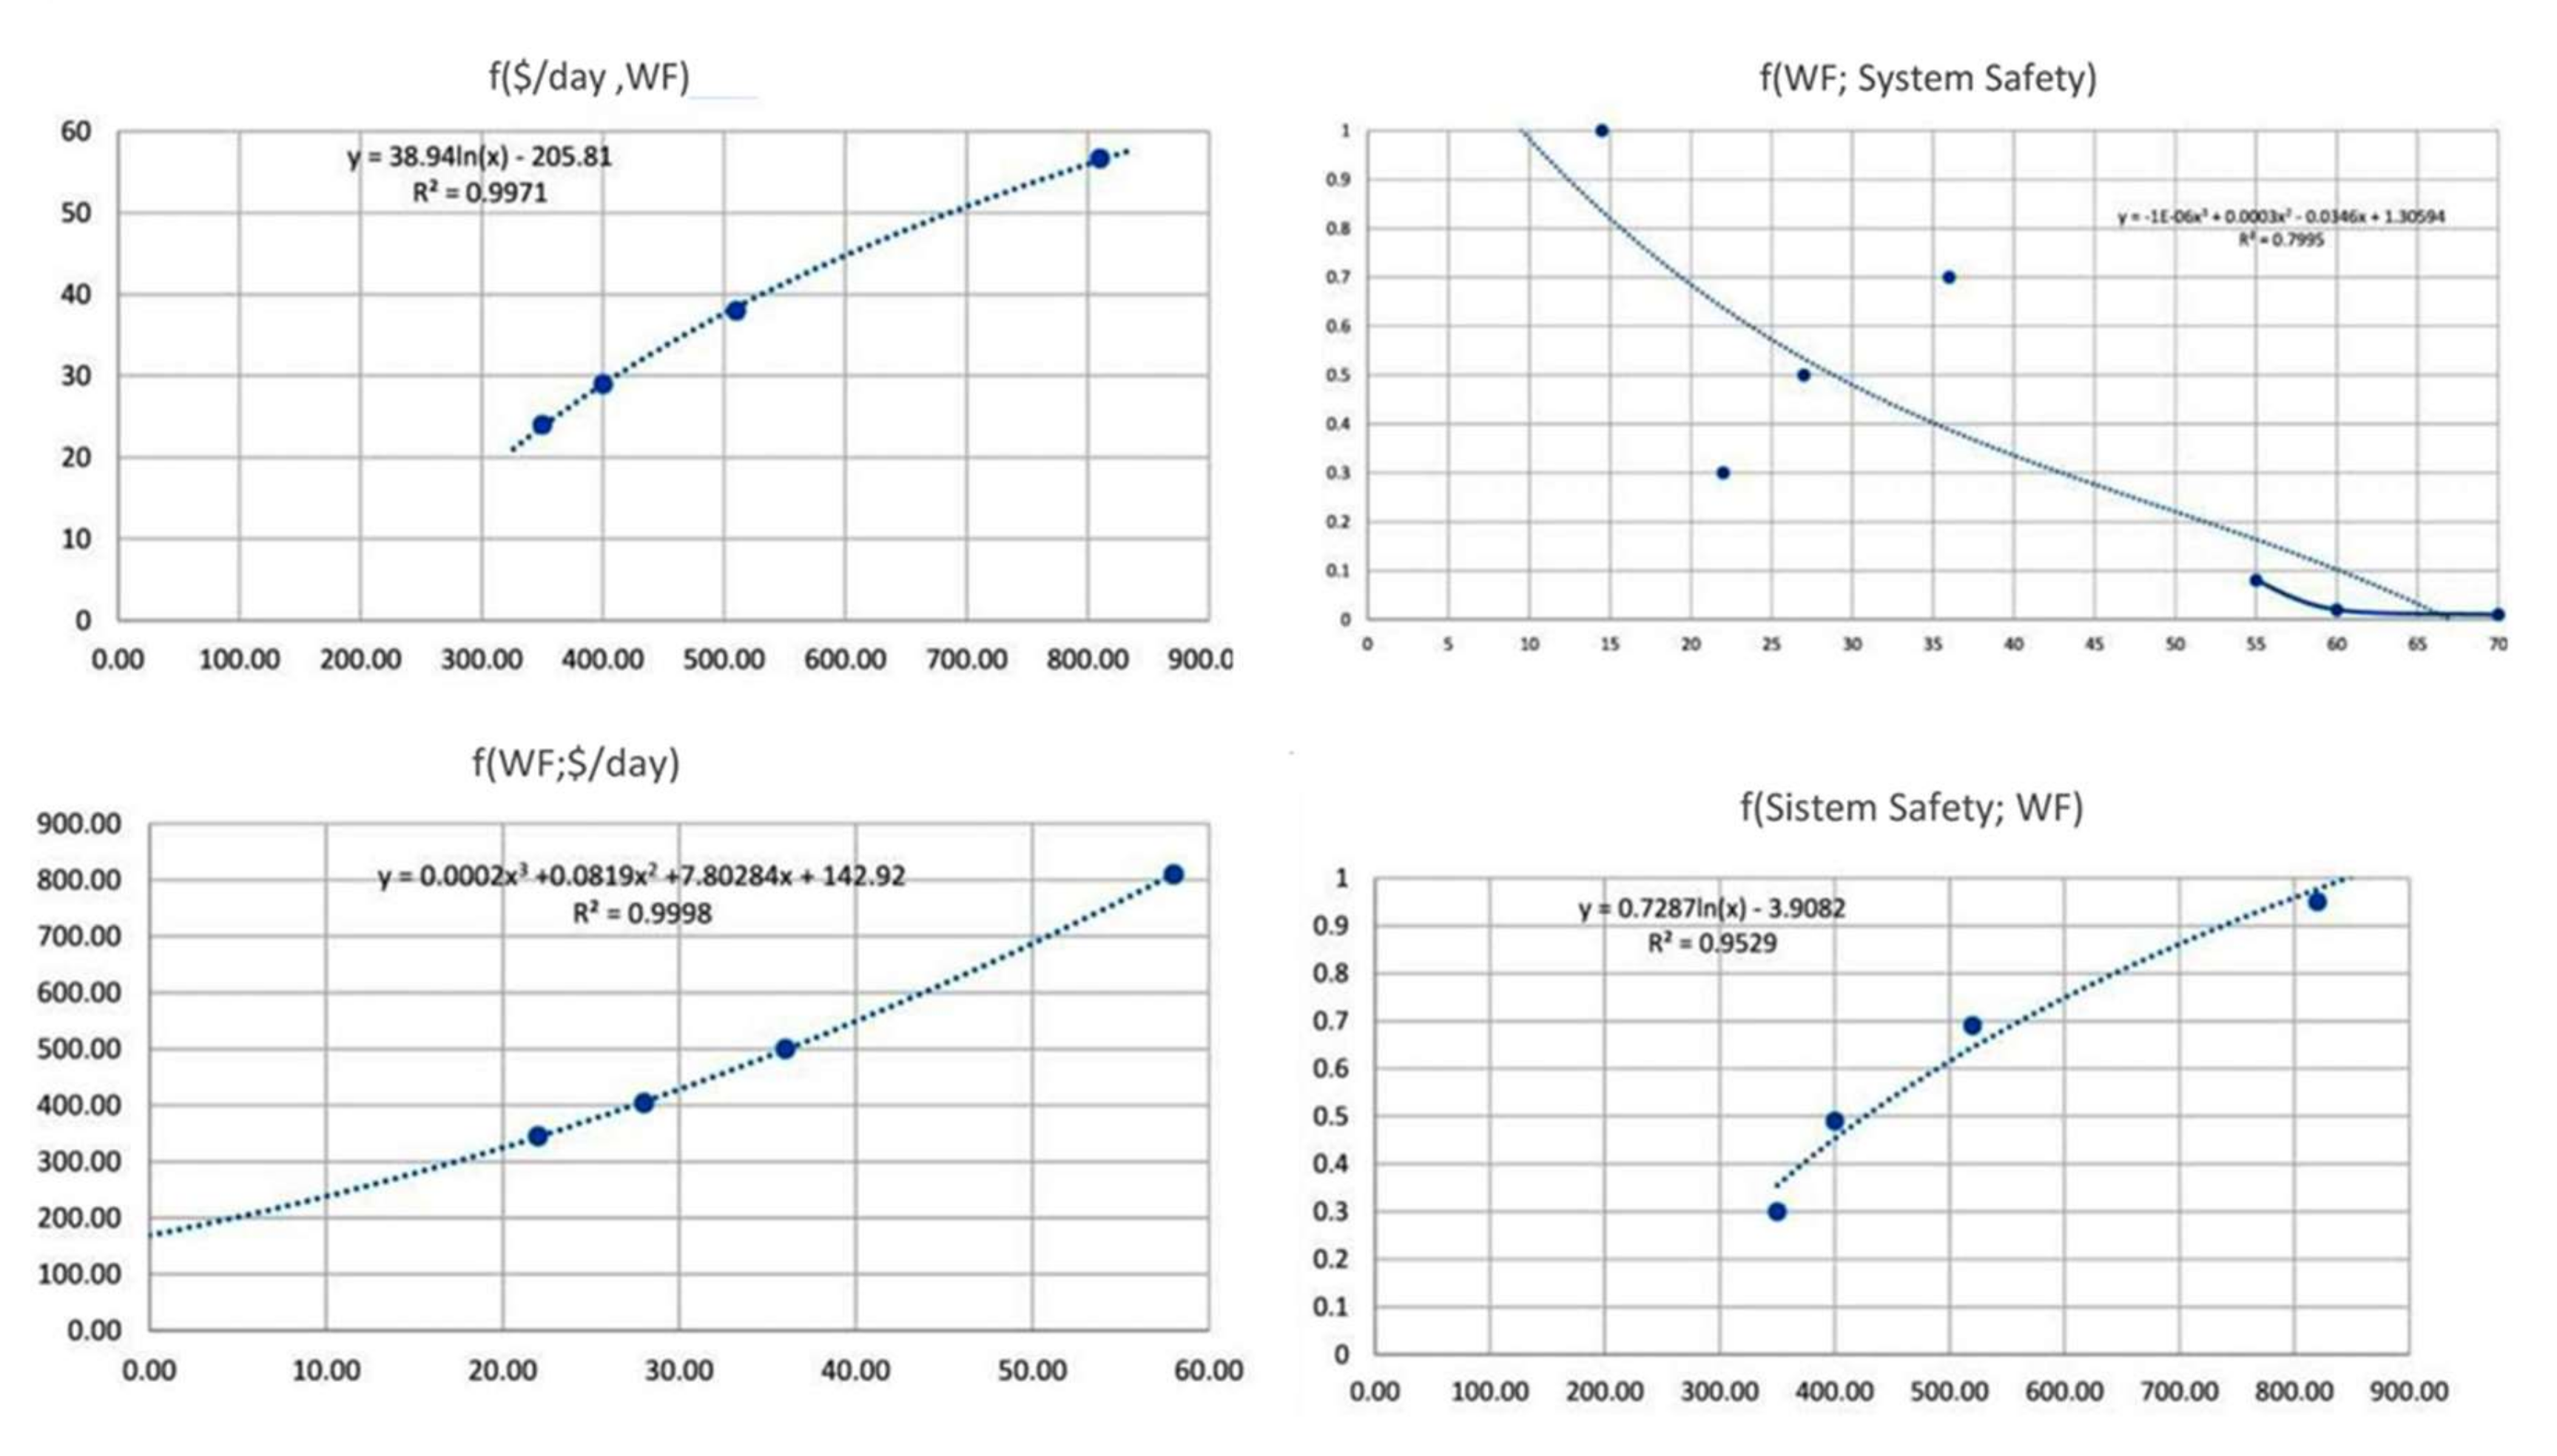
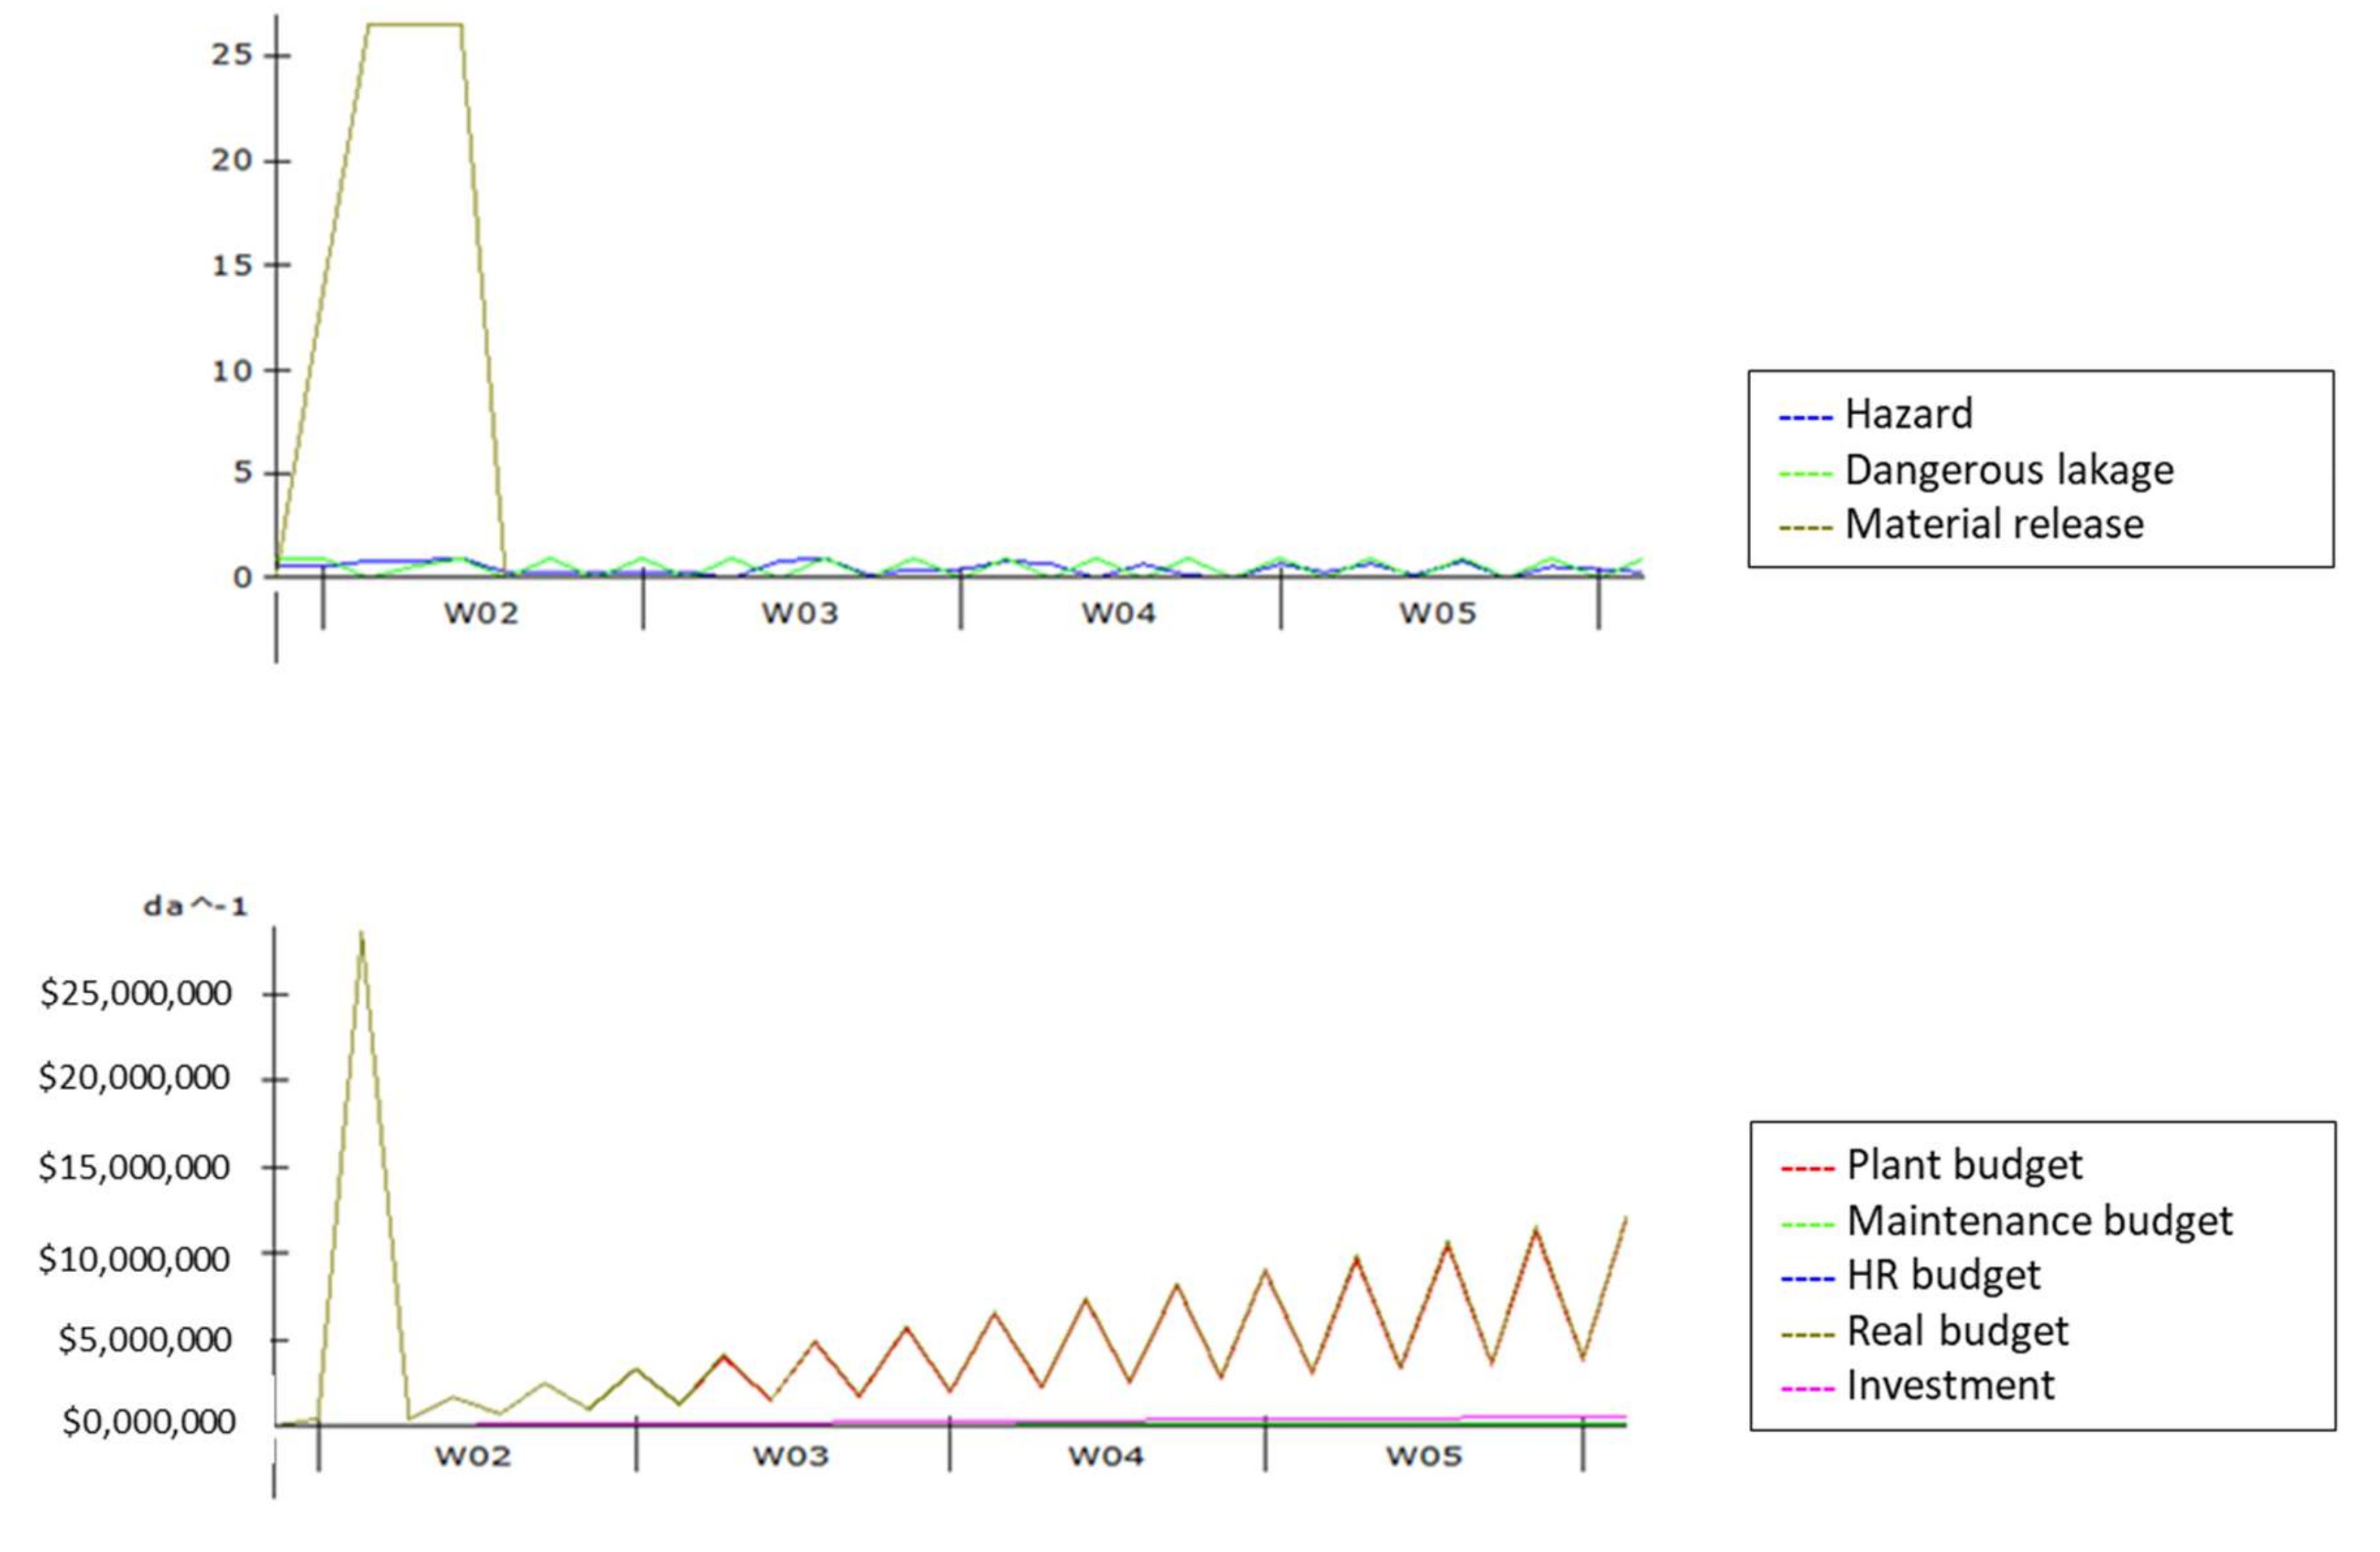
According to the values considered in [6], thanks to the development of the simulation methodology [21] in (Figure 4) an initial loss of about 300 min leading to an outlay of about $250,000 is shown.
In the model, the function that links the labor force to the available capital has been obtained by interpolating available data in [20]. The Table 1 and Table 2 show the human resources data in terms of educational level of operators and system safety.
The relationship between the safety plant level and its workforce (WF) is shown in Figure 5. The capacity of carrying out all the ordinary tasks in time decreases while the workforce goes down.
In Figure 6, the value of the minimum workforce required under standard conditions, in order to prevent accidents in the plant, is also shown. This value function has been defined in order to prevent the possibility of non-inspection of the plant.
The function of human error has been defined separately using the human cognitive reliability (HCR) method (Figure 6) [23].
It is necessary also to consider the effects/actions on the maintenance plan to close the loop of this subsystem. In fact, operators could make errors by carrying out maintenance. These errors may be reduced by improving the operators’ skills (Figure 7).
4. Results
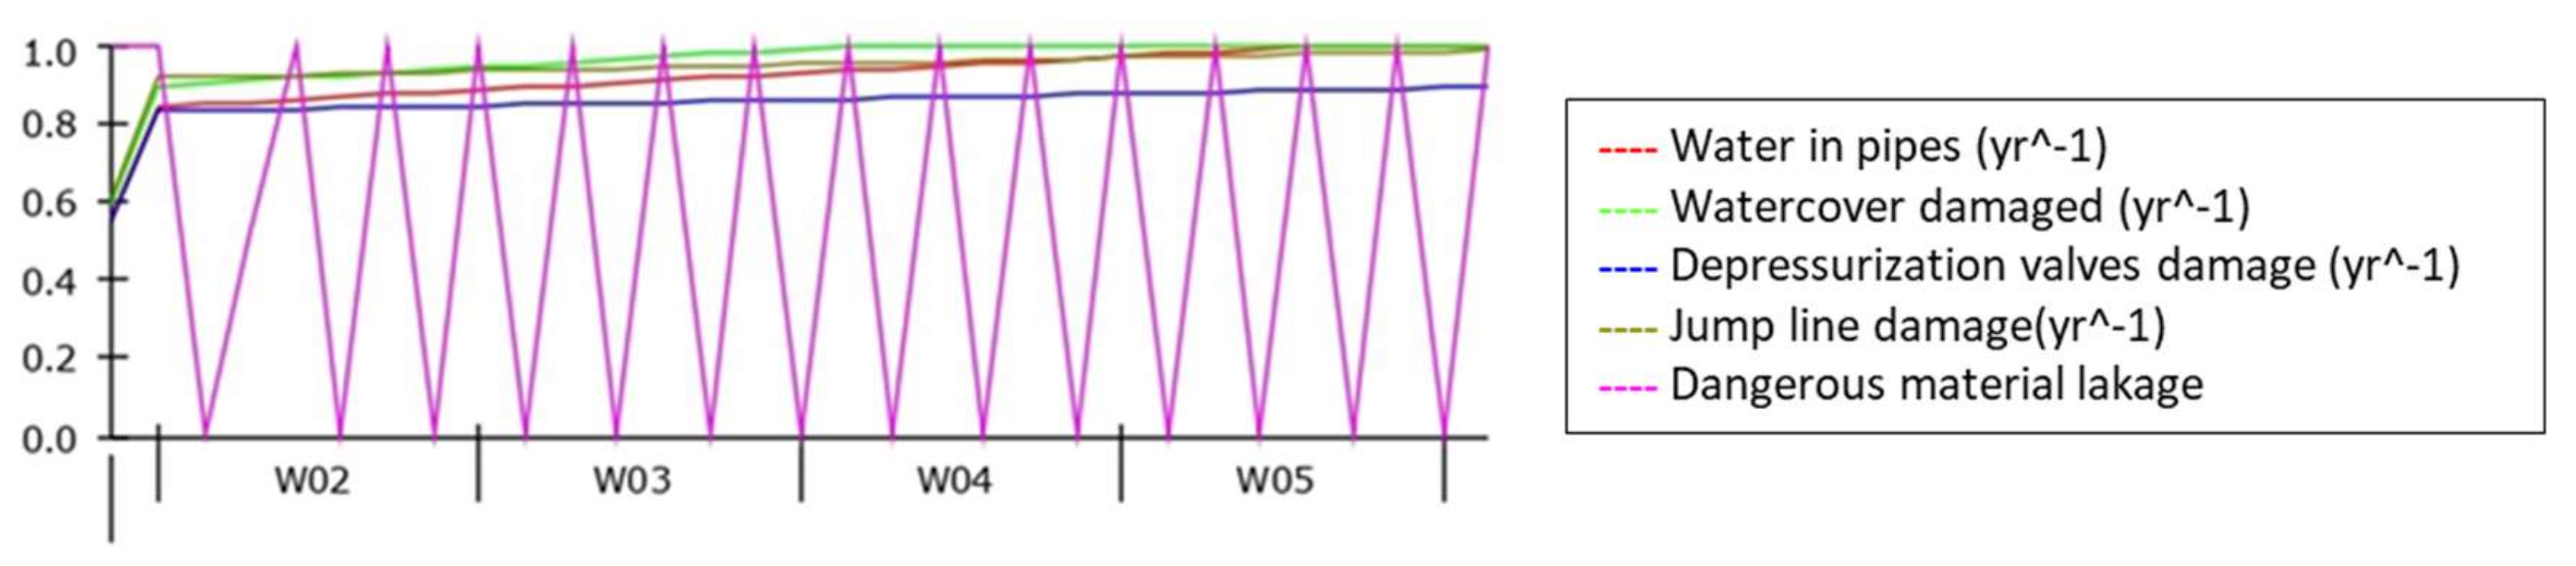
The results analysis permits focus on different aspects of the Bhopal plant. As shown in Figure 10, referring to the production plant and the mechanical part of the SD model proposed, the system breakdown probability of the prevention systems is already critical in the first days of the system operation. In fact, the Bhopal structures were crumbling and not maintained in the months before the accident.
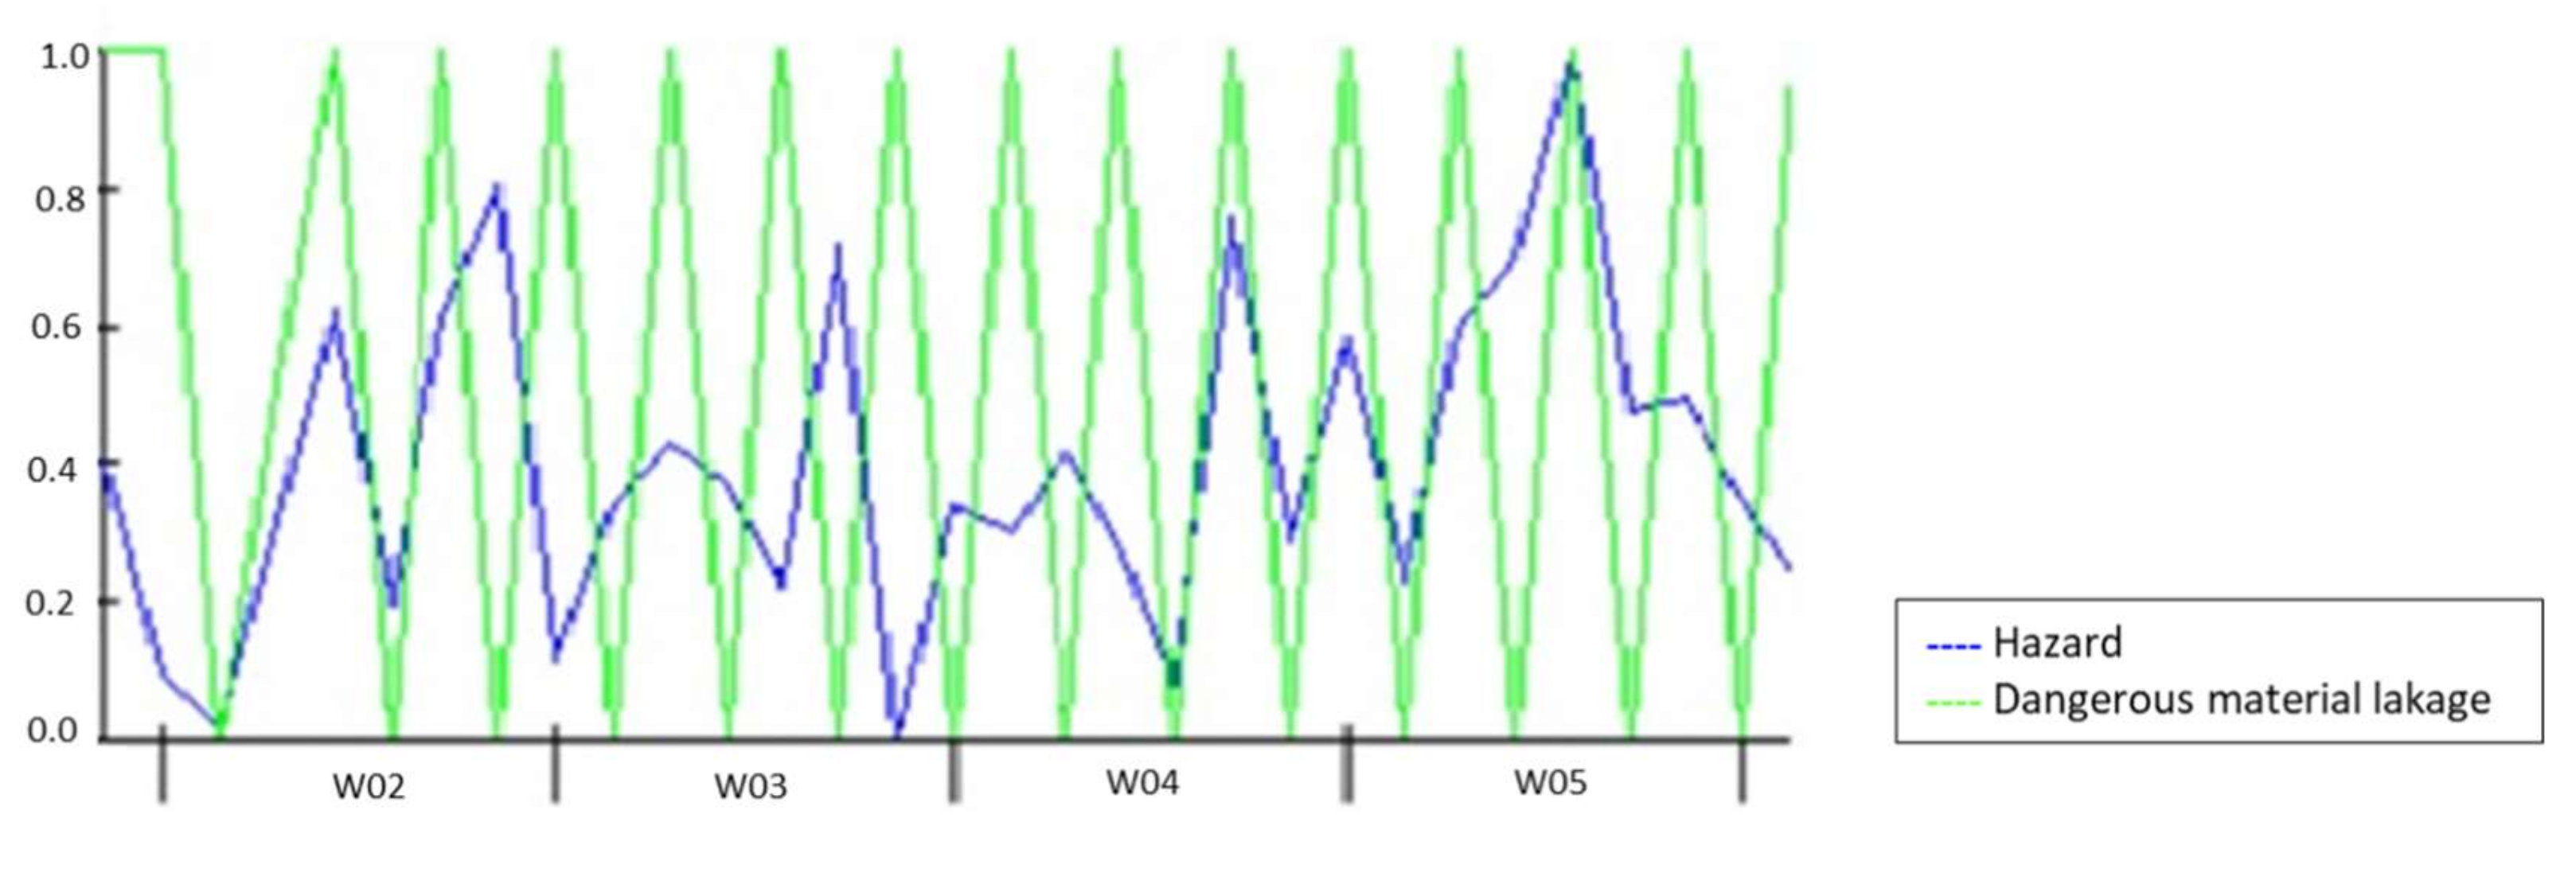
The simulation (Figure 11) of the possible loss of containment of dangerous material allows a realistic prediction of hazards (i.e., the hazard “generated randomly” activates an alarm of the loss of material).
The system suffers from frequent breakdowns (the blue line is often below the green line representing the probability of loss of dangerous material); moreover, the generation of random numbers of the hazard variable is carried out without considering the average value of accident risk at the beginning of random generation.
Obviously, the quantities released will not always be the same; the greater quantity of material will be released in the first days of activity. This leads to the greater outlay of money in order to support the costs of restoring the plant, insurance and image.
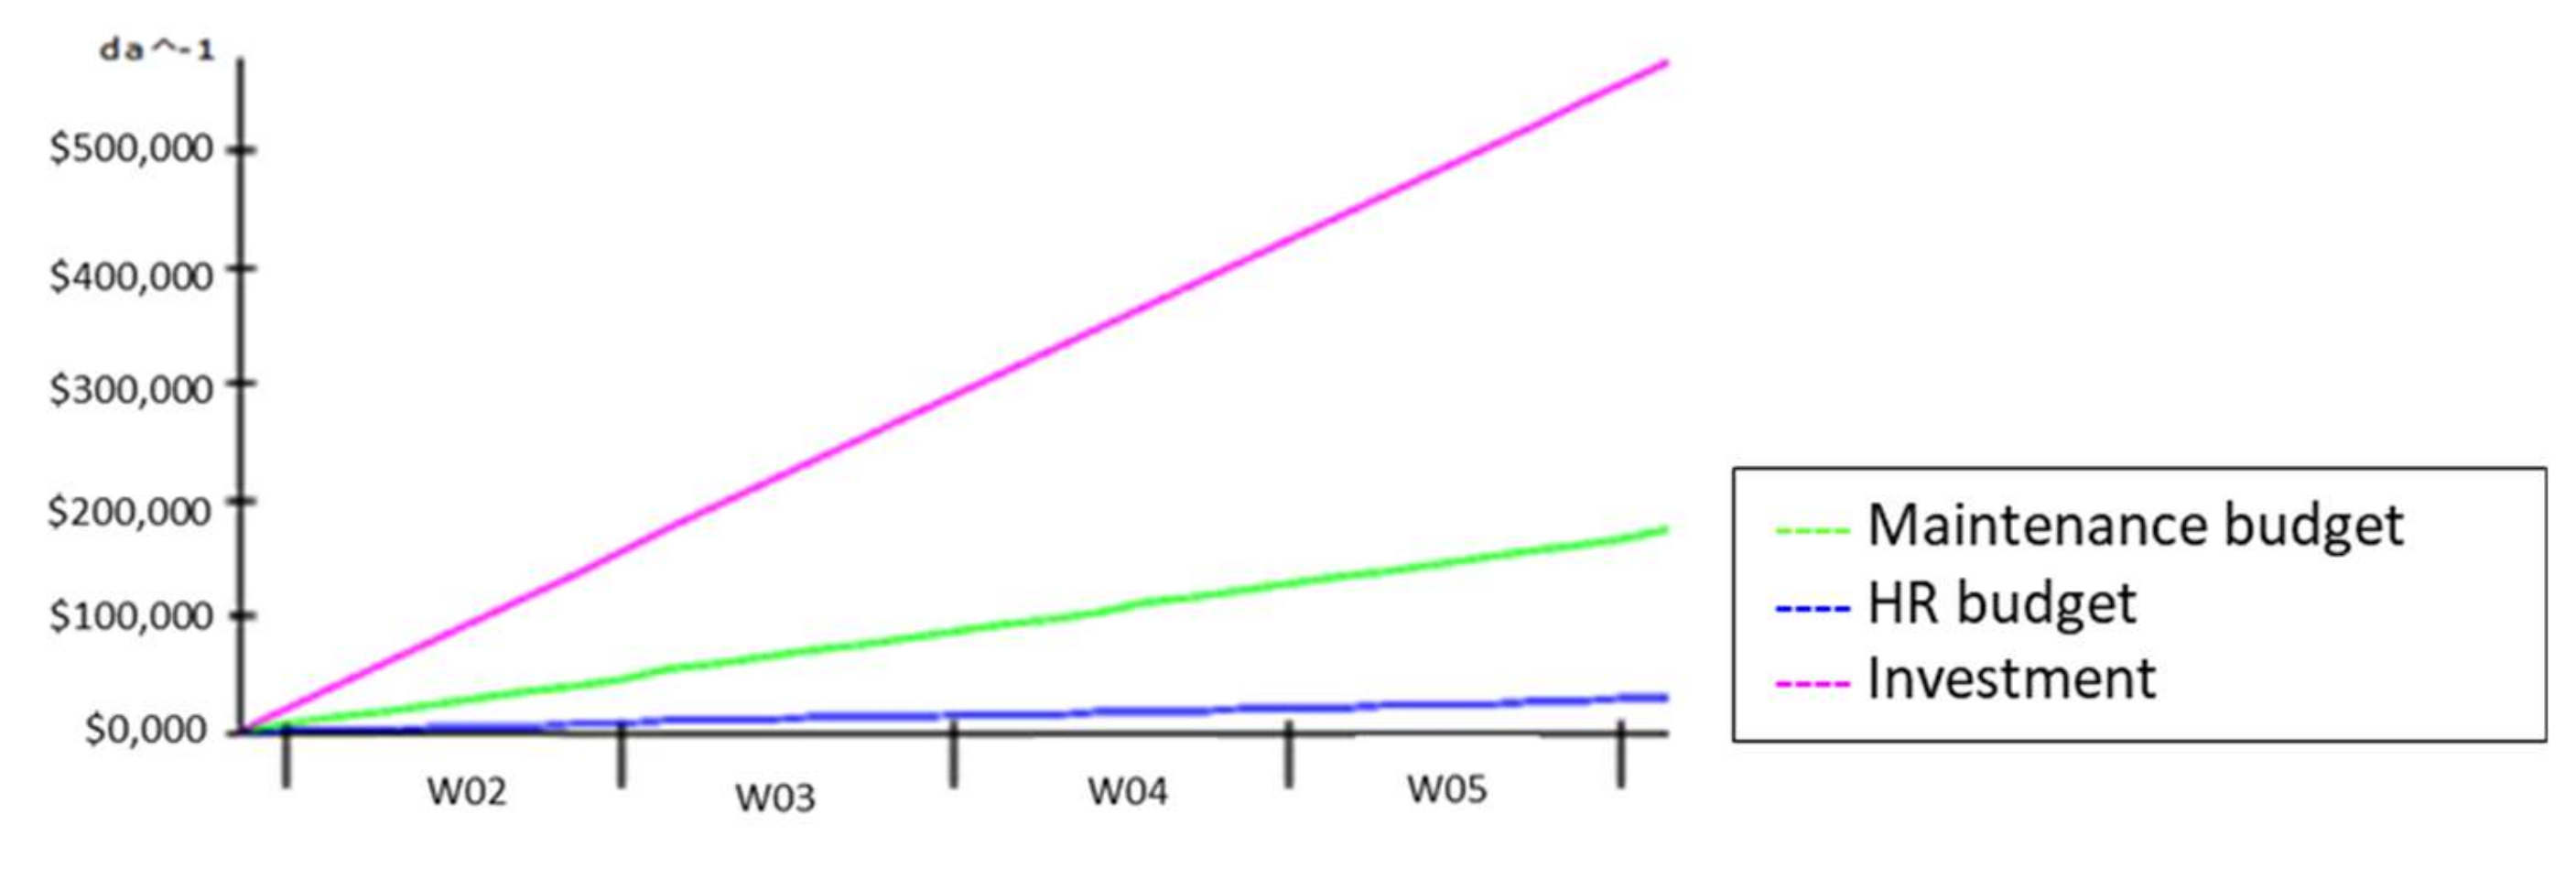
As shown in Figure 12, these costs are significantly higher than the costs normally planned to support for the standard maintenance and personal management activities.
On the other hand, as is noticeable in Figure 13, the ordinary costs of the plant (maintenance, personnel) are linear and are much lower than the plant losses due to accidents at a 1:50 ratio.
After the first major release, many micro losses generate daily costs derived from loss function that still significantly increases the costs that the plant must support with a 1:20 ratio.
While the loss function turns out to the end of the economic loop of this model, the investments in maintenance and human resources are at the starting points by influencing downstream the whole operation of the plant.
As far as human management is concerned, the total workforce is defined by the investments made for staff.
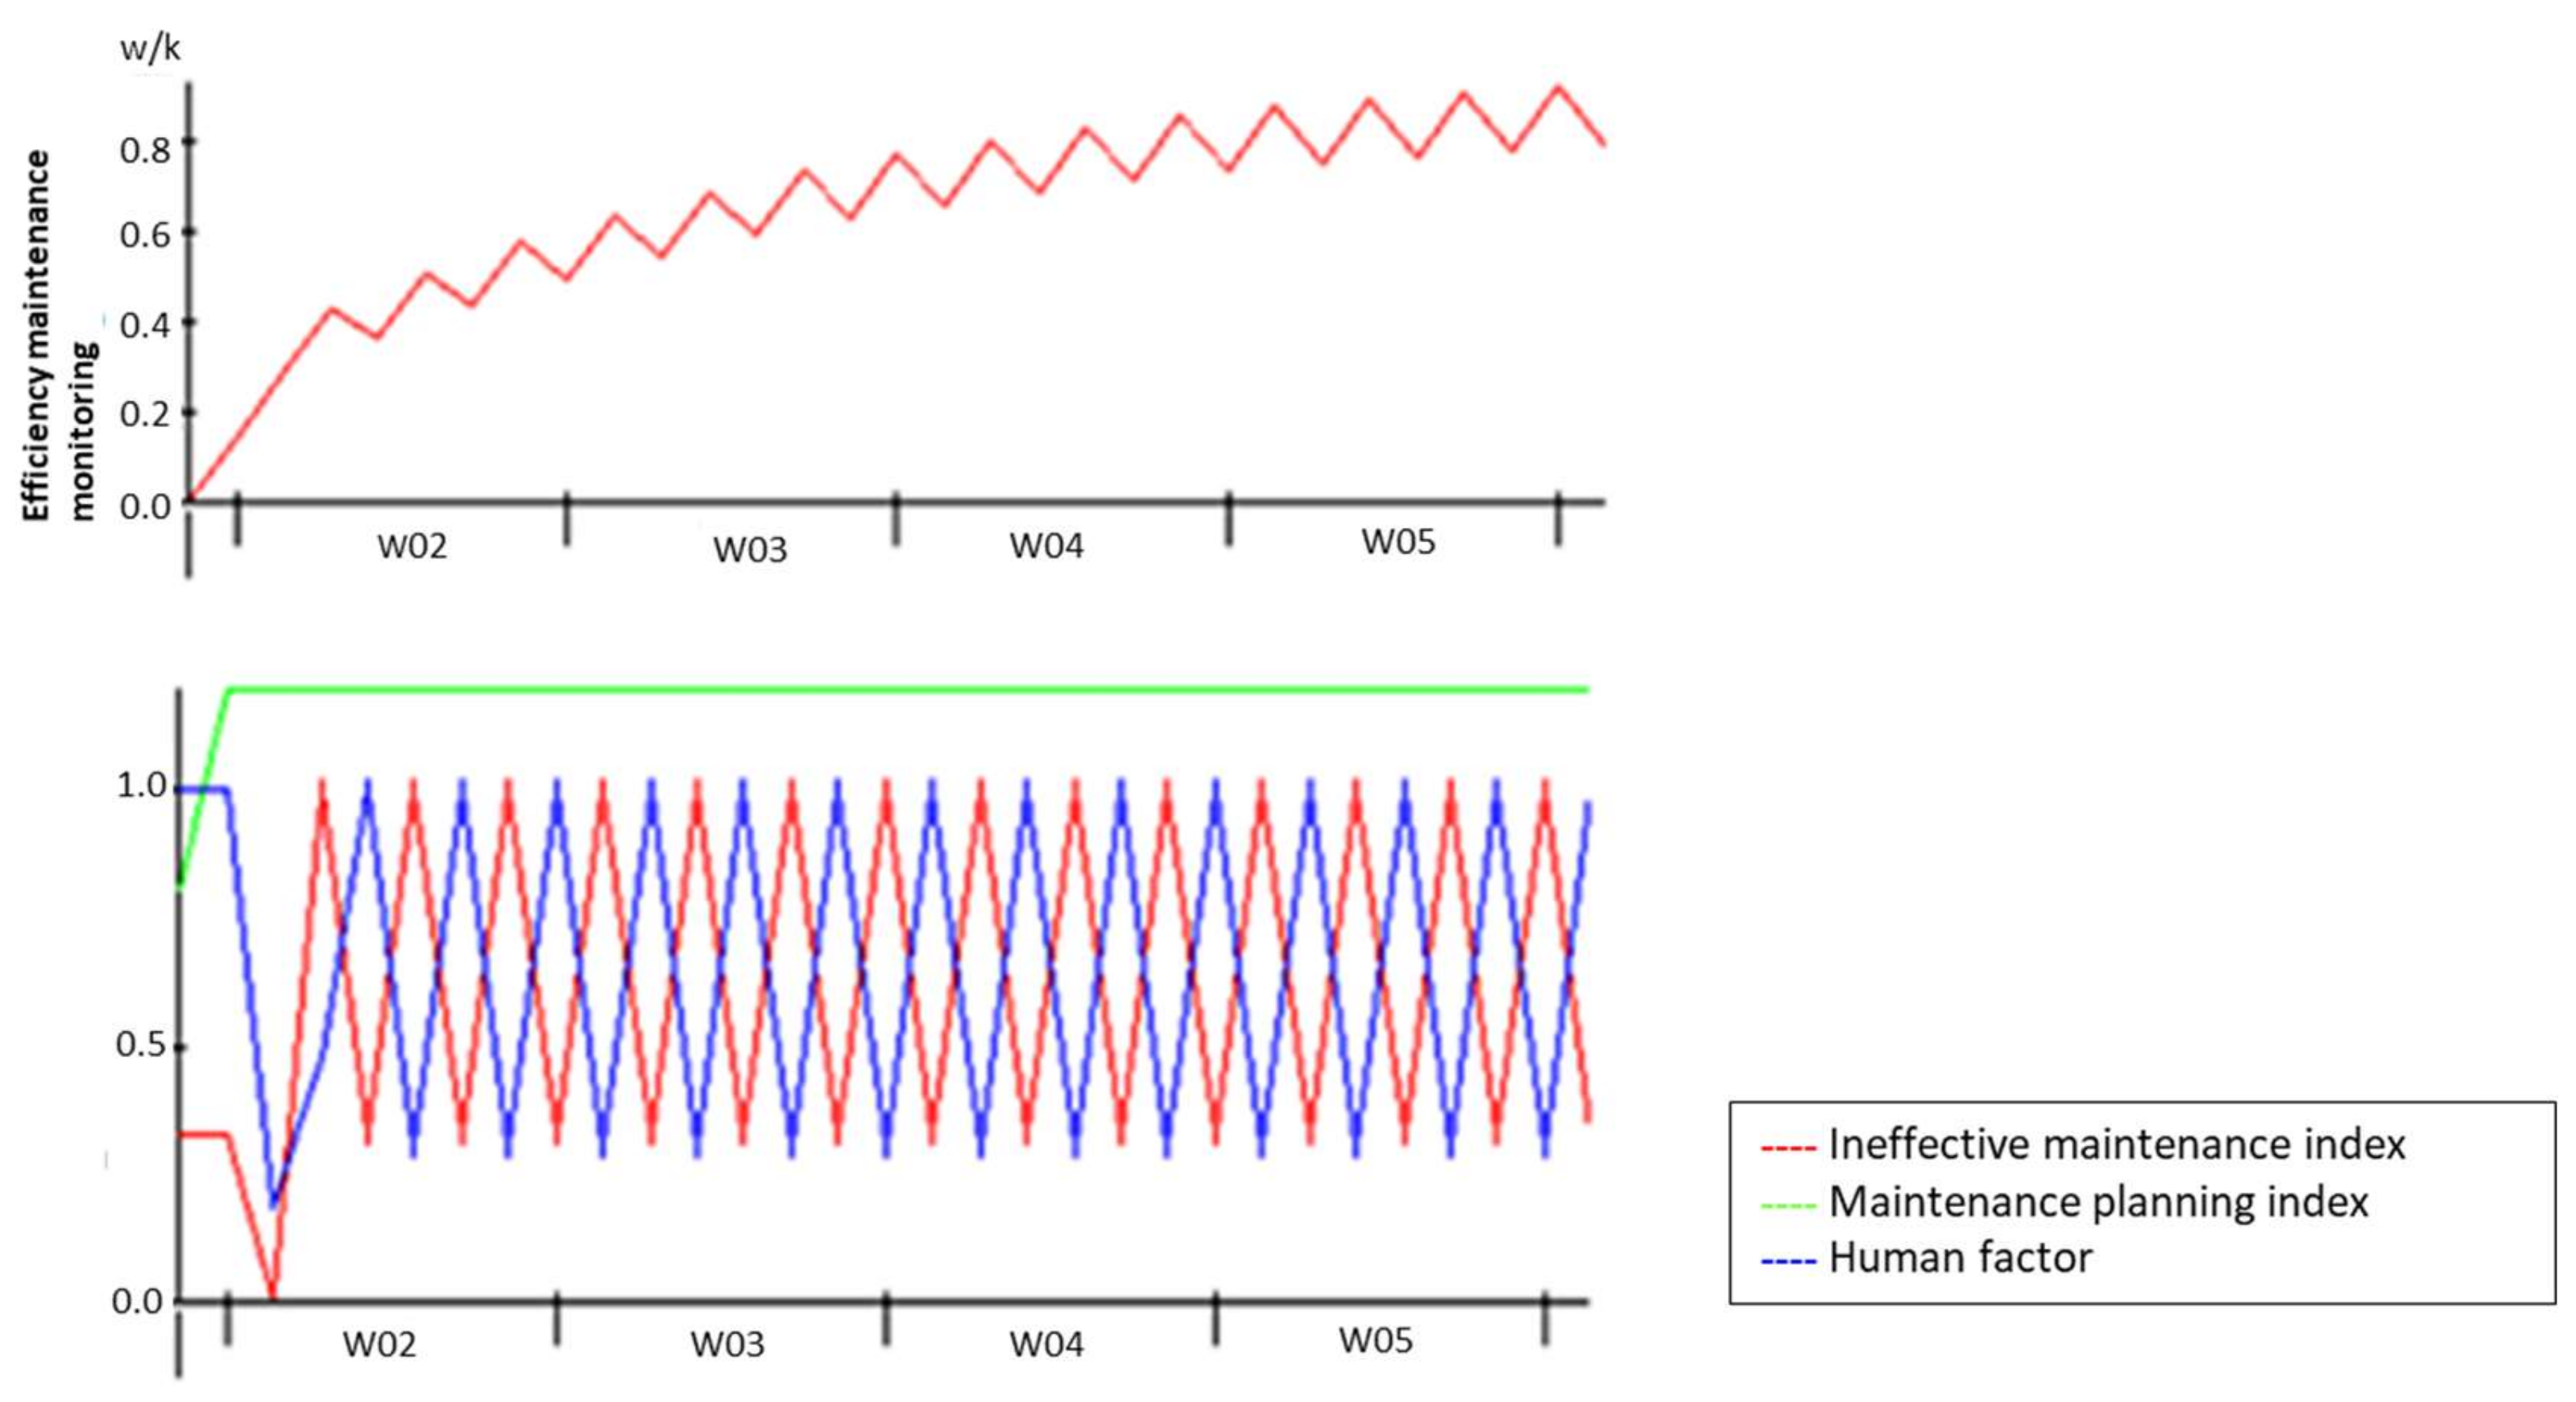
Figure 14 shows the maintenance-planning index following the trends of human error according to the planning.
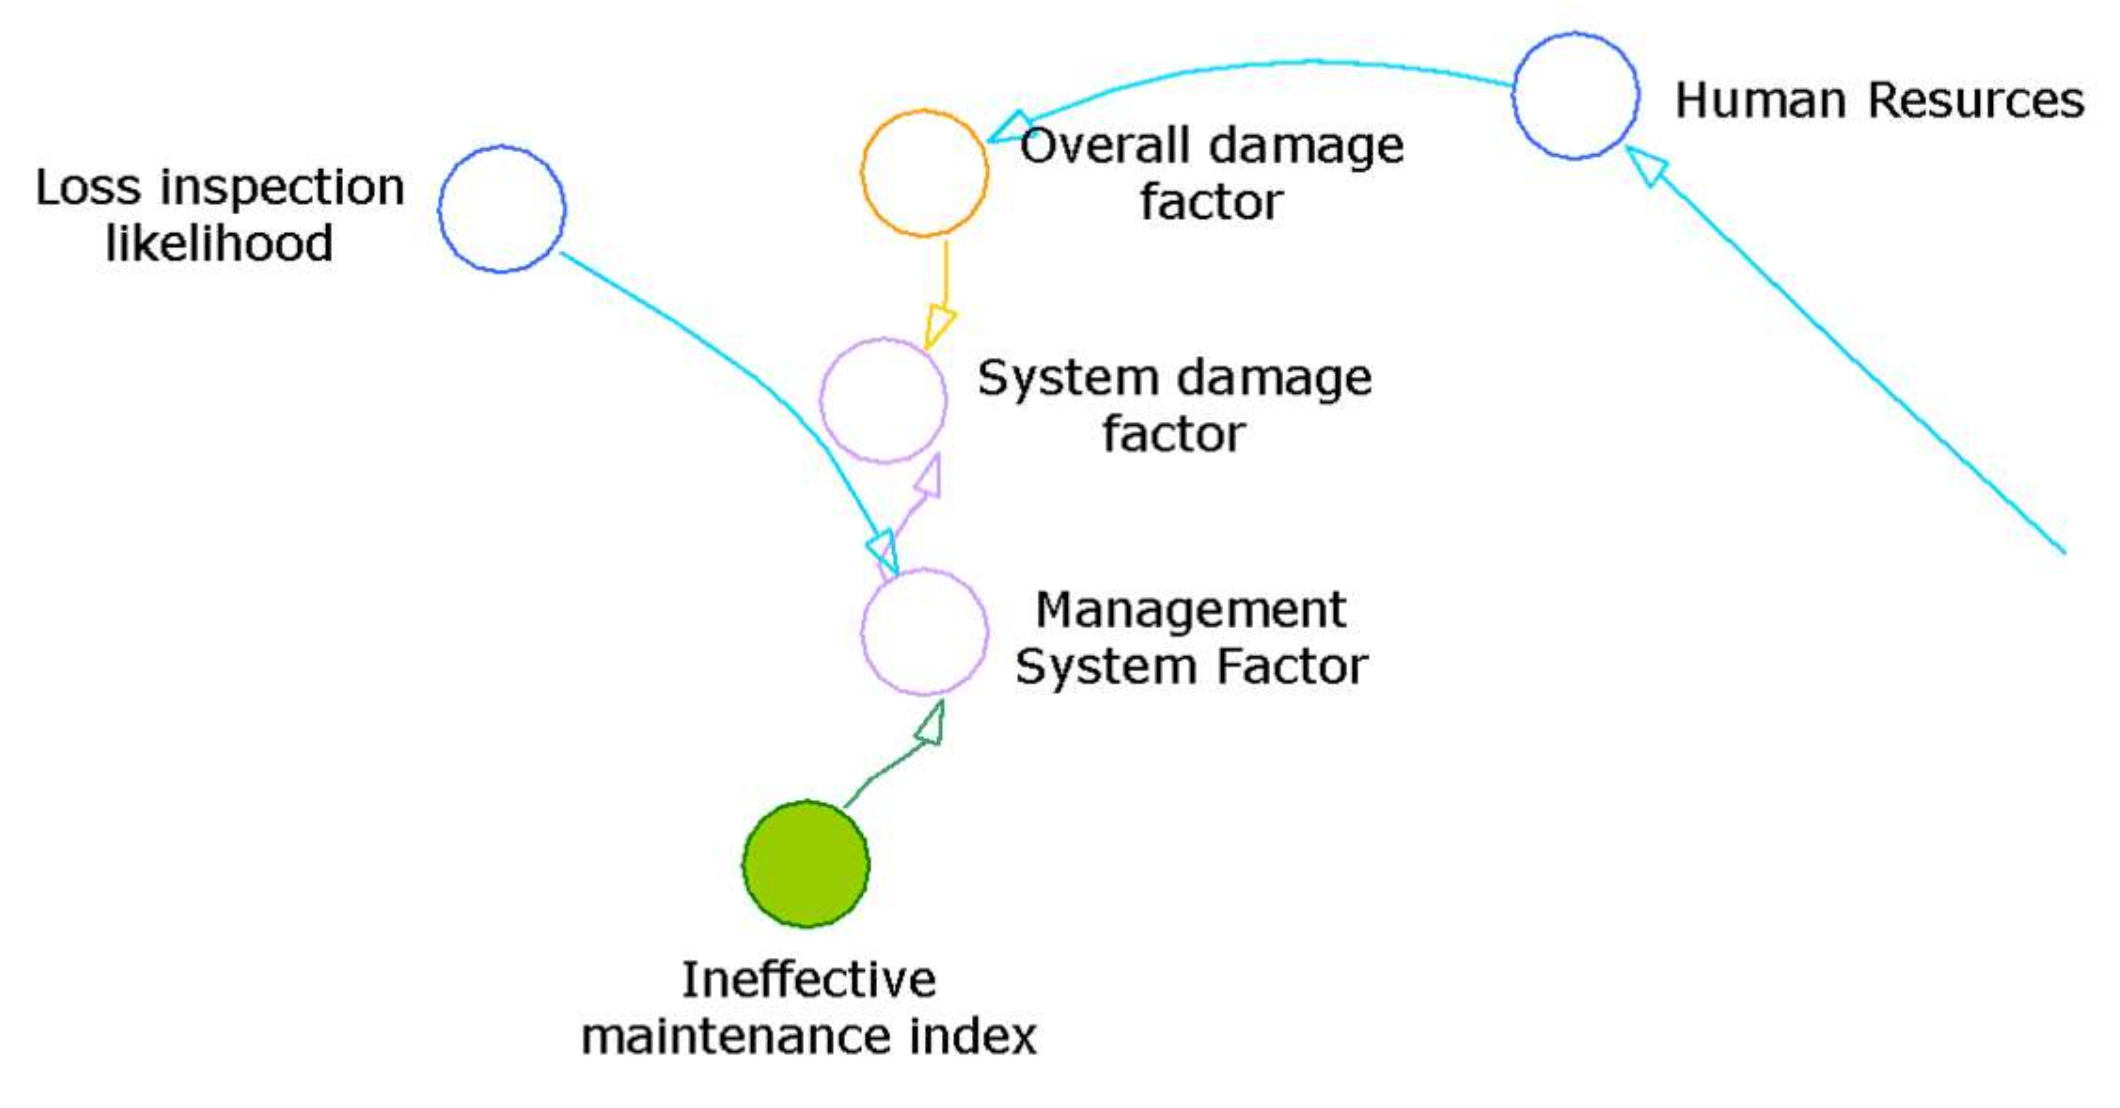
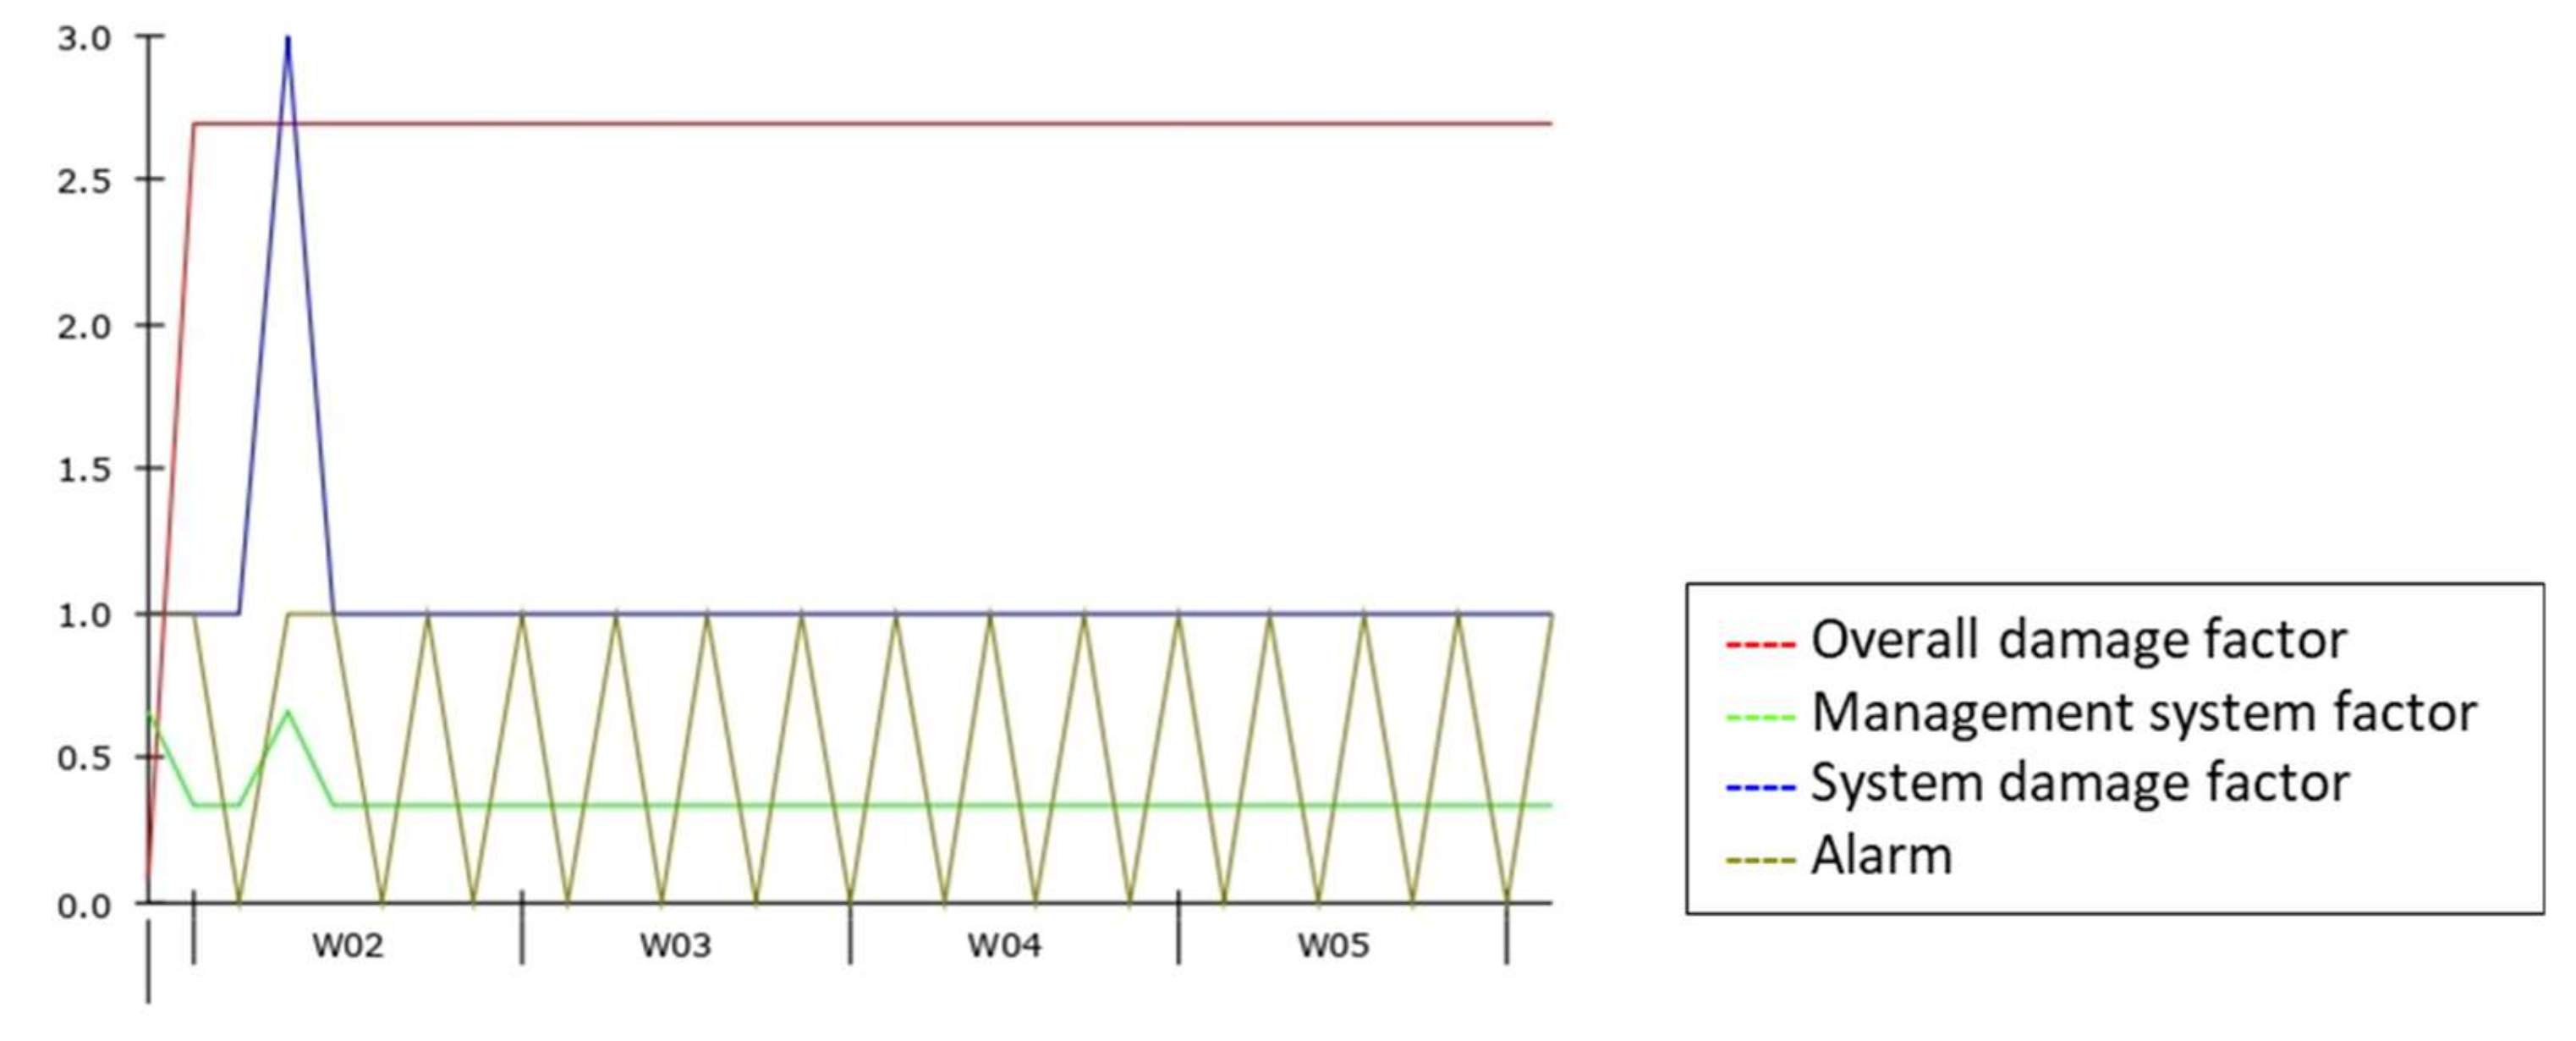
The system damage factor (Figure 15) reaches a peak value with the release of the greatest quantity of material, which also corresponds to a peak of the management system factor, in which loss inspection likelihood and effectiveness maintenance index flow, while the overall damage factor immediately settles at maximum alert values even before the accident occurs.
Finally, it is possible to highlight that both factors, the budget related to the maintenance and to the operators training, are critical. This leads to an increase in the probability of system failure and to having non-trained personnel who are not able to intervene in emergencies.
5. Improving the Safety Management System through Industry 4.0 Technologies
The new industry 4.0 scenario, characterized by innovative technologies and the strong interconnection between resources, offers a series of solutions to a great number of problems spread out from the Bhopal incident analysis.
The casual loop diagram in Section 2 has shown the interrelations between the main aspects that had influenced the Bhopal incident. Some of these aspects, such as failure risk, nowadays might be controlled in a smarter way by using sensors that monitor the status of health of machines and plants. In fact, the oil and gas industry widely uses big data analysis to realize real-time risk management [9].
The human error also might be avoided by investing both in training and in smart technologies. In particular, many enabling technologies of industry 4.0, as well as augmented reality (AR), could make maintenance activities safer. As referred to in Masoni et al. [24], the augmented reality visors can be used by operators to access the information necessary for performing the maintenance activities directly in the working area, without the need to refer to the printed traditional manual.
A safety management system, in order to be proactive, must be able to measure performance and make future forecasts, so it requires a series of precise and numerous data [25]. In this perspective, the paradigm of industry 4.0 is able to collect, through a dense network of sensors, an quantity of data and is able to manage and analyze them, allowing the forecast of possible accident scenarios. For example, the support of sensors and new technologies allows the detection of a series of data necessary to make predictions as reliable as possible on the health status of the equipment that leads to targeted interventions.
According to Ansaldi et al. [26], the impact of industry 4.0 on industrial and occupational safety has not yet been adequately investigated, but smart systems technologies seem to offer a lot of potential in prevention of major accidents.
6. Conclusions
In this paper, a safety management system model is proposed by using a system dynamics approach. This study highlights the lack of safety and maintenance in the Bhopal plant. A model has been developed and validated thanks to the well-known data in literature about the incident.
The safety management system can be also improved by letting different departments communicate with each other faster and smarter, according to Taylor et al. [27].
Badri, Boudreau-Trudel and Souissi, after focusing on the importance of industry 4.0 and the technological change, invite the research to overcome, in future, the lack of regulation regarding the management of change in order to assure safe work in the transition into the new era [28].
In this study, the use of system dynamics enables the understanding of the importance of a complex system, underlines the interactions among different management areas and can help to prevent possible critical events.
However, the proposed complex system may increase the operators’ economic expenditure in terms of specific technical training [29].
In future, the general model proposed could be adapted to different complex plants according to a safety management approach towards safety 4.0. Industry 4.0 technologies allow users to obtain the availability of a huge quantity of data, the detection of which is carried out thanks to a network of sensors.
It will be very important to analyze the data properly to design increasingly effective models. These models, thanks to system dynamics, may be useful to detect potential hazardous situations and to control risk.
Author Contributions
Conceptualization, M.D.N. and M.M.; Methodology, M.D.N. and M.M.; Software, M.D.N.; Validation, M.D.N., M.M.; Formal Analysis, M.D.N. and M.M.; Investigation, M.D.N., M.M., T.M. and F.C.; Data Curation, M.D.N., T.M. and F.C.; Writing-Original Draft Preparation, M.D.N. and M.M.; Writing-Review & Editing M.D.N. and M.M.; Supervision, T.M.; Project Administration, T.M. All authors have read and agreed to the published version of the manuscript.
Funding
This research received no external funding.
Conflicts of Interest
The authors declare no conflicts of interest.
References
- A C&EN Special Issue—Bhopal the continuing story. Chemical & Engineering News 1985, 63, 1–78.
- Khan, F. Guest perspective on Bhopal. J. Loss Prev. Process Ind. 2016, 39, 181–182. [Google Scholar]
- Palazzi, E.; Currò, F.; Fabiano, B. A critical approach to safety equipment and emergency time evaluation based on actual information from the Bhopal gas tragedy. Process Saf. Environ. Prot. 2015, 97, 37–48. [Google Scholar] [CrossRef]
- Saraf, S.; Karanjikar, M. Literary and economic impact of the Bhopal gas tragedy. J. Loss Prev. Process Ind. 2005, 18, 274–282. [Google Scholar] [CrossRef]
- Zhang, M.; Wang, X.; Mannan, M.S.; Qian, C.; Wang, J.Y. System dynamical simulation of risk perception for enterprise decision-maker in communication of chemical incident risks. J. Loss Prev. Process Ind. 2017, 46, 115–125. [Google Scholar] [CrossRef]
- Yang, M.; Khana, F.; Amyotte, P. Operational risk assessment: A case of the Bhopal disaster. Process Saf. Environ. Prot. 2015, 97, 70–79. [Google Scholar] [CrossRef]
- Garbolino, E.; Chery, J.P.; Guarnieri, F. A Simplified Approach to Risk Assessment Based on System Dynamics: An Industrial Case Study. Risk Anal. 2016, 36, 16–29. [Google Scholar] [CrossRef] [Green Version]
- Lane, D.C. Should System Dynamics be described as “hard” or “deterministic” system approach? Syst. Res. Behav. Sci. 2000, 17, 3–22. [Google Scholar] [CrossRef]
- Moktadir, M.A.; Ali, S.M.; Kusi-Sarpong, S.; Shaikh, M.A.A. Assessing challenges for implementing Industry 4.0: Implications for process safety and environmental protection. Process Saf. Environ. Prot. 2018, 117, 730–741. [Google Scholar] [CrossRef]
- Lu, H.; Guo, L.; Azimi, M.; Huang, K. Oil and Gas 4.0 era: A systematic review and outlook. Comput. Ind. 2019, 111, 68–90. [Google Scholar] [CrossRef]
- Junior, J.A.G.; Busso, C.M.; Gobbo, S.C.O.; Carreão, H. Making the links among environmental protection, process safety, and industry 4.0. Process Saf. Environ. Prot. 2018, 117, 372–382. [Google Scholar]
- Telukdarie, A.; Buhulaiga, E.; Bag, S.; Gupta, S.; Luo, Z. Industry 4.0 implementation for multinationals. Process Saf. Environ. Prot. 2018, 118, 316–329. [Google Scholar] [CrossRef]
- Gregoriades, A. Human error assessment in complex socio-technical systems system dynamic versus Bayesian belief network. In Proceedings of the System Dynamics Conference, Athens, Greece, 20–24 July 2008; University of Manchester Institute of Science and Technology: Manchester, UK, 2008. [Google Scholar]
- Accou, B.; Reniers, G. Developing a method to improve safety management systems based on accident investigations: The SAfety FRactal ANalysis. Saf. Sci. 2019, 115, 285–293. [Google Scholar] [CrossRef]
- Li, Y.; Guldenmund, F.W. Safety management systems: A broad overview of the literature. Saf. Sci. 2018, 103, 94–123. [Google Scholar] [CrossRef]
- Di Nardo, M.; Gallo, M.; Madonna, M.; Santillo, L.C. A conceptual model of human behaviour in socio-technical systems. In Intelligent Software Methodologies, Tools and Techniques; Springer: Cham, Switzerland, 2015. [Google Scholar]
- Mancuso, A.; Compare, M.; Salo, A.; Zio, E. Portfolio optimization of safety measures for the prevention of time-dependent accident scenarios. Reliab. Eng. Syst. Saf. 2019, 190, 106500. [Google Scholar] [CrossRef]
- API 580, Risk Based Inspection, Washington, DC, USA. 2009. Available online: https://www.api.org/products-and-services/individual-certification-programs/certifications/api580 (accessed on 1 July 2019).
- Di Nardo, M.; Madonna, M.; Santillo, L.C. Safety Management System: A system dynamics approach to manage risks in a process plant. Int. Rev. Model. Simul. 2016, 9, 256–264. [Google Scholar] [CrossRef]
- Chouhan, T.R. The unfolding of Bhopal disaster. J. Loss Prev. Process Ind. 2005, 18, 205–208. [Google Scholar] [CrossRef]
- Di Nardo, M.; Gallo, M.; Murino, M.; Santillo, L.C. System Dynamics Simulation for Fire and Explosion Risk Analysis in Home Environment. Int. Rev. Model. Simul. 2017, 10, 43–54. [Google Scholar] [CrossRef]
- Goh, Y.M.; Tan, T. Learning from the Bhopal disaster to improve process safety management in Singapore. Process Saf. Environ. Prot. 2015, 97, 102–108. [Google Scholar] [CrossRef]
- Petrillo, A.; Falcone, D.; De Felice, F.; Zomparelli, F. Development of a risk analysis model to evaluate human error in industrial plants and in critical infrastructures. Int. J. Disaster Risk Reduct. 2017, 23, 15–24. [Google Scholar] [CrossRef]
- Masoni, R.; Ferrise, F.; Bordegoni, M.; Gattullo, M.; Uva, A.E.; Fiorentino, M.; Di Donato, M. Supporting remote maintenance in industry 4.0 through augmented reality. Procedia Manuf. 2017, 11, 1296–1302. [Google Scholar] [CrossRef]
- Gerede, E. A qualitative study on the exploration of challenges to the implementation of the Safety Management System in aircraft maintenance organizations in Turkey. J. Air Transp. Manag. 2015, 47, 230–240. [Google Scholar] [CrossRef]
- Ansaldi, S.M.; Agnello, P.; Bragatto, P. Smart Safety System: Are they ready to control the hazard of major accidents? Wit Trans. Built Environ. 2018, 174, 169–180. [Google Scholar]
- Taylor, P.M.; Boxall, P.; Chen, J.J.; Xu, X.; Liew, A.; Adeniji, A. Operator 4.0 or Maker 1.0? Exploring the implications of Industrie 4.0 for innovation, safety and quality of work in small economies and enterprises. Comput. Ind. Eng. 2018. [Google Scholar] [CrossRef]
- Badri, A.; Boudreau-Trudel, B.; Souissi, A.S. Occupational health and safety in the industry 4.0 era: A cause for major concern? Saf. Sci. 2018, 109, 403–411. [Google Scholar] [CrossRef]
- Madonna, M.; Monica, L.; Anastasi, S.; Di Nardo, M. Evolution of cognitive demand in the human–machine interaction integrated with industry 4.0 technologies. Wit Trans. Built Environ. 2019, 189, 13–19. [Google Scholar]
Figure 1.
Causal loop diagram of the Bhopal plant.

Figure 2.
System dynamics diagram of mechanical system.

Figure 3.
System dynamics diagram—management loops.

Figure 4.
Economic loss function.

Figure 5.
System dynamics diagram—human cognitive reliability (HCR) loop.

Figure 6.
Prediction curve related to human resources.

Figure 7.
System dynamics diagram—HCR and maintenance variables.

Figure 8.
System dynamics elements.

Figure 9.
Values referred to management variables.

Figure 10.
Mechanical system result.

Figure 11.
Loss of dangerous material and prediction of leakage of hazardous material.

Figure 12.
Economic results.

Figure 13.
Zoom on ordinary economic value.

Figure 14.
HCR results.

Figure 15.
Management results.


Table 1.
Human resources data.
| Operators | Year | 1979/1980 [1] | 1981-1982 [3] | 1984 [5] | November 1984 [7] | ||||||||||
|---|---|---|---|---|---|---|---|---|---|---|---|---|---|---|---|
| Weight | $/month | $/Year | # | WF | $/Year | # | WF | $/Year | # | WF | $/Year | # | WF | $/Year | |
| operators BSC/diploma | 1 | 800 | 9600 | 2 | 2 | 19,200 | 8 | 8 | 76,800 | 2 | 2 | 16,000 | 2 | 2 | 1600 |
| Operators High school | 2 | 1000 | 12,000 | 15 | 30 | 180,000 | 0 | 0 | 0 | 6 | 12 | 60,000 | 6 | 12 | 6000 |
| Shift Supervisors | 3 | 1200 | 14,400 | 3 | 9 | 43,200 | 2 | 6 | 28,800 | 1 | 3 | 12,000 | 1 | 3 | 1200 |
| Maintenance Supervisors | 5 | 1600 | 19,200 | 3 | 15 | 57,600 | 2 | 10 | 38,400 | 1 | 5 | 16,000 | 0 | 0 | 0 |
| Plant Suptd | 6 | 1800 | 211,600 | 0 | 0 | 0 | 2 | 12 | 43,200 | 1 | 6 | 18,000 | 1 | 6 | 1800 |
| Total Work Force | 56 | 30,000 | 36 | 187,200 | 28 | 122,000 | 23 | 10,600 | |||||||
| Variatio than 1979–1980 | 0.00% | 35.71% | 50.00% | 58.93% | |||||||||||
| Variatio than 1981–1982 | - | 0.00% | 22.22% | 36.11% | |||||||||||
| Variatio than 1984 | - | - | 0.00% | 17.86% | |||||||||||
Table 2.
Resources data.
| WF | $/day | System Safety | $/(WF*day) |
|---|---|---|---|
| 56 | 821.92 | 0.95 | 14.68 |
| 36 | 512.88 | 0.70 | 14.25 |
| 28 | 401.32 | 0.50 | 14.33 |
| 23 | 353.33 | 0.30 | 15.36 |
© 2020 by the authors. Licensee MDPI, Basel, Switzerland. This article is an open access article distributed under the terms and conditions of the Creative Commons Attribution (CC BY) license (http://creativecommons.org/licenses/by/4.0/).
Share and Cite
MDPI and ACS Style
Di Nardo, M.; Madonna, M.; Murino, T.; Castagna, F. Modelling a Safety Management System Using System Dynamics at the Bhopal Incident. Appl. Sci. 2020, 10, 903. https://0-doi-org.brum.beds.ac.uk/10.3390/app10030903
AMA Style
Di Nardo M, Madonna M, Murino T, Castagna F. Modelling a Safety Management System Using System Dynamics at the Bhopal Incident. Applied Sciences. 2020; 10(3):903. https://0-doi-org.brum.beds.ac.uk/10.3390/app10030903
Chicago/Turabian StyleDi Nardo, Mario, Marianna Madonna, Teresa Murino, and Francesco Castagna. 2020. "Modelling a Safety Management System Using System Dynamics at the Bhopal Incident" Applied Sciences 10, no. 3: 903. https://0-doi-org.brum.beds.ac.uk/10.3390/app10030903
Note that from the first issue of 2016, this journal uses article numbers instead of page numbers. See further details here.