Article

Side-Scan Sonar Image Fusion Based on Sum-Modified Laplacian Energy Filtering and Improved Dual-Channel Impulse Neural Network

1
College of Marine Science and Technology, China University of Geosciences, Wuhan 430074, China
2
Institute of Geological Survey, China University of Geosciences, Wuhan 430074, China
3
China Railway Siyuan Survey and Design Group Co., LTD, Wuhan 430063, China
*
Author to whom correspondence should be addressed.
Submission received: 15 November 2019 / Revised: 28 January 2020 / Accepted: 31 January 2020 / Published: 4 February 2020
(This article belongs to the Collection Optical Design and Engineering)

Abstract

:
The operation mode of a single strip provides incomplete side-scan sonar image in a specific environment and range, resulting in the overlapping area between adjacent strips often with imperfect detection information or inaccurate target contour. In this paper, a sum-modified Laplacian energy filtering (SMLF) and improved dual-channel pulse coupled neural network (IDPCNN) are proposed for image fusion of side-scan sonar in the domain of nonsubsampled contourlet transform (NSCT). Among them, SMLF energy is applied to extract the fusion coefficients of the low frequency sub-band, which combines the characteristics of energy information, human visual contrast, and guided filtering to eliminate the pseudo contour effect of block flow. In addition, the IDPCNN model, which utilizes the average gradient, soft limit function, and novel sum-modified Laplacian (NSML) to adaptively represent the corresponding excitation parameters, is applied to improve the depth and activity of pulse ignition, so as to quickly and accurately select the image coefficients of the high frequency sub-band. The experimental results show that the proposed method displays fine geomorphic information and clear target contour in the overlapping area of adjacent strips. The objective index values are generally optimal, which reflect the information of image edge, clarity, and overall similarity.

1. Introduction

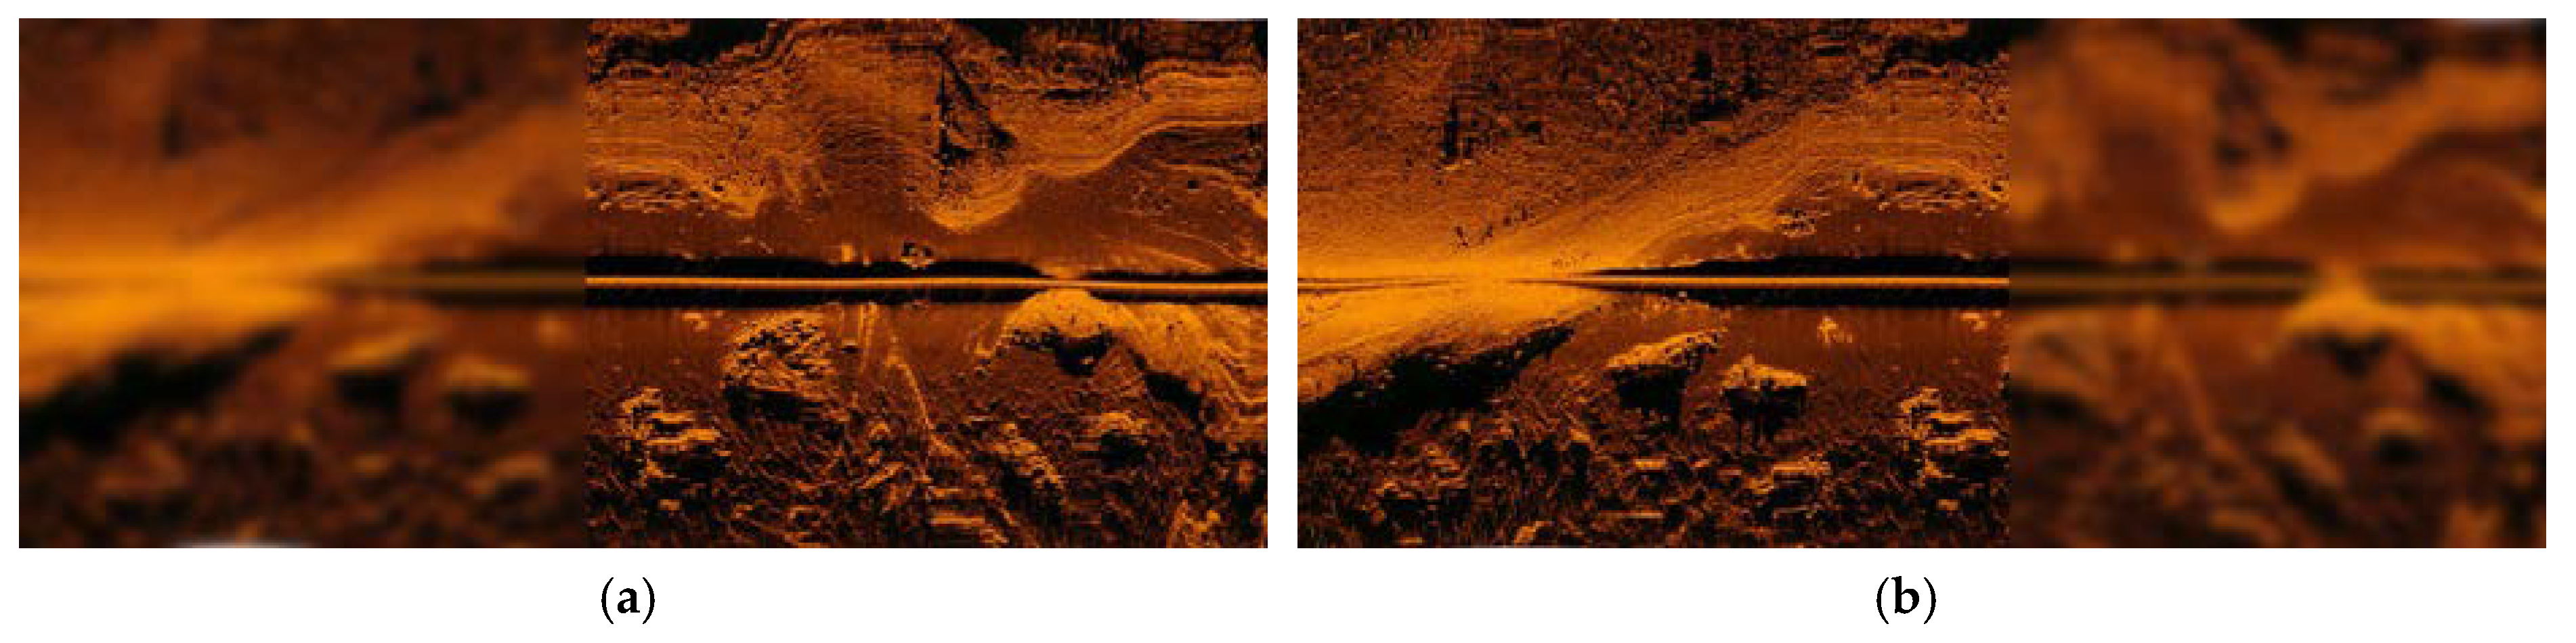
With the excellent propagation characteristics of sound waves in the water, side-scan sonar provides high-resolution and high-accuracy image information for underwater operations. Full sea area survey is general carried out by means of strip measurement, which requires the adjacent strip to have a certain width of overlapping area [1]. However, owing to the effect of imaging time, hull attitude, and ocean reverberation [2], underwater target and terrain texture in the overlapping area have a certain degree of distortion. The overlapping area of a single strip image has incomplete information detection, and the contours of underwater targets do not match. Therefore, the information fusion of overlapping area between adjacent strips is of great significance, which lays a foundation for the research of underwater target detection and distribution in public areas and classification of sediment types [3,4,5].
In recent years, the effective combination of multi-scale transform domain and other intelligent optimization methods has become a research hotspot of image fusion, especially the domain of nonsubsampled contourlet transform (NSCT) [6]. Anandhi used NSCT and statistical fusion rules for the information fusion of a multi-sensor image, which effectively preserved texture and image edge information [7]. Zhang et al. combined NSCT and texture information for forward-looking sonar image fusion, which weakened the effect of the registration error [8]. The image characteristics of side-scan sonar are similar to forward-looking sonar, and NSCT can be applied to the side-scan sonar image fusion of adjacent strips.
Generally, NSCT serves as a basis for multi-scale image fusion to decompose into low and high frequency sub-band images [9]. After that, it is very important for image fusion to make a reasonable fusion criterion for a low and high frequency image, respectively. For the sub-band coefficients of a low frequency image, the weighted average strategy was a conventional fusion criterion, which resulted in partial energy loss of the source image [10]. As for the fusion criterion of modified weighted saliency, the threshold selection of matching degree in this model is more skillful [11]. Moreover, sparse representation and its combination with dictionary learning were applied to select low frequency sub-band coefficients [12,13]. Their scheme effectively avoided smoothing the texture, edge, and other details of the original image, but the processing of the sliding window might interfere with the correlation between the images, and the latter model involved a lot of training images in the process of iterative learning. Hence, sum-modified Laplacian (SML) energy can be used to characterize the clarity of the sub-band image, and it also reflects the gradient information to a certain extent. Huang and Jing [14] introduced SML energy into the coefficient selection of a low frequency sub-band, which eliminated the interference of fuzzy background region availably. Yong et al. combined visual effects with SML to guide the selection of low frequency [15], which enhanced the judgment depth of multi focus image fusion. However, the overlapping area image of adjacent strips is relatively noisy, and the coefficient selection of a low frequency sub-band based on the above criteria can easily cause false judgment, as well as the pseudo-contour of block flow at the target edge.
For the sub-band coefficients of the high frequency image, the previous fusion criteria include maximum energy [16], regional variance [17], and direction contrast maximum [18], but they are easily susceptible to noise interference, making the edge contour of the target blurred. Pulse coupled neural network (PCNN) has been widely applied to guide the coefficient selection of high frequency [19]. Although the PCNN model has a good fusion effect, it contains a lot of non-linear parameters, and the region discrimination of image darkening is not very sensitive. Moreover, Wang and Ma [
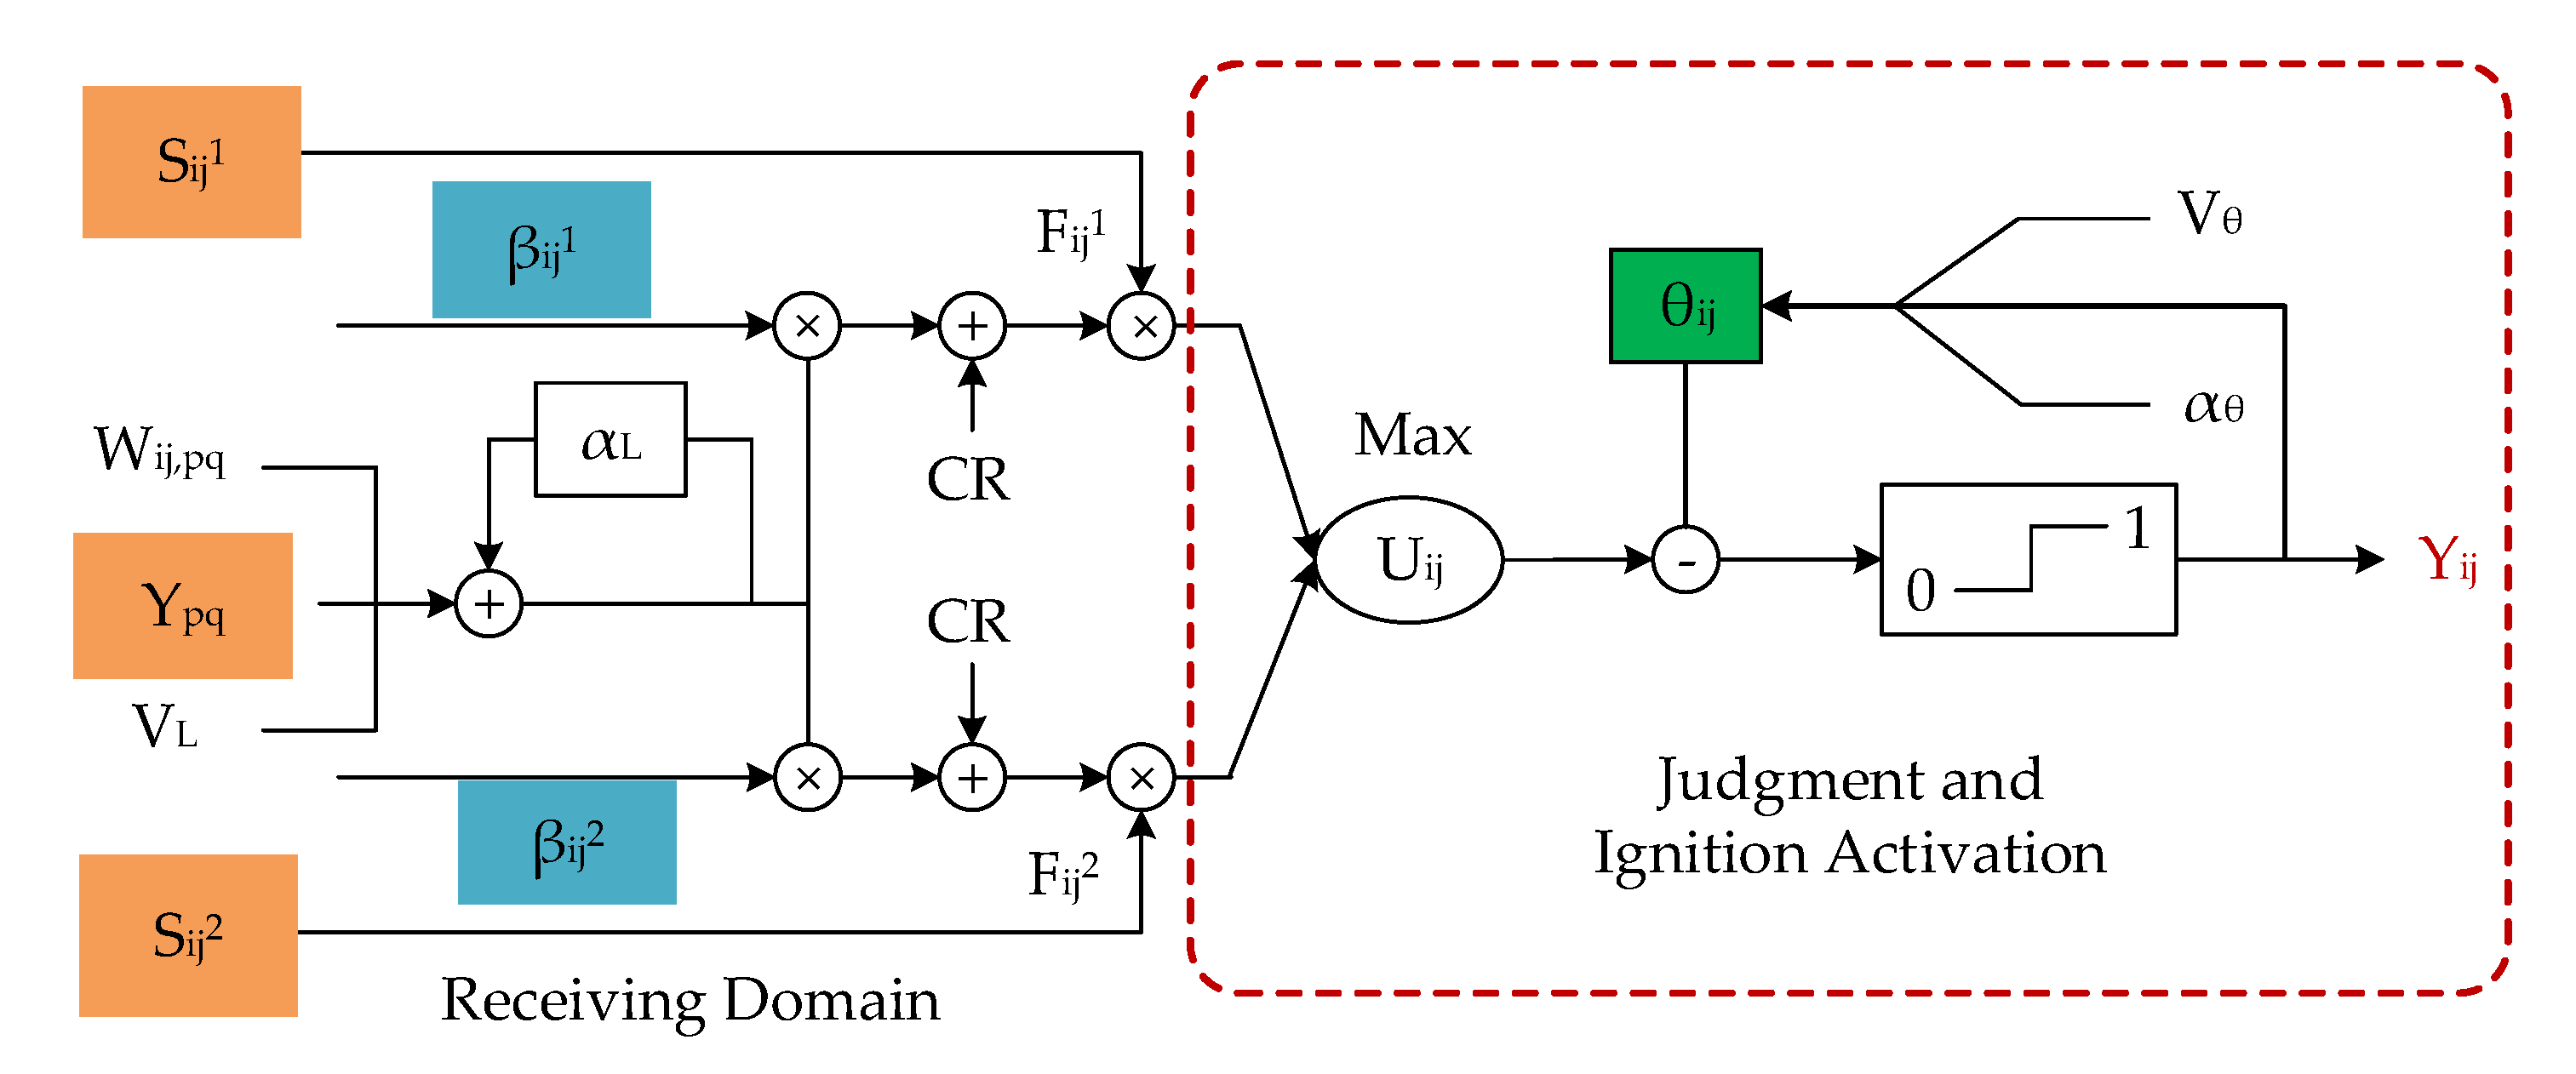
20] pioneered a dual-channel PCNN (DPCNN) model to enhance the selection and diffusion ability of feature information, which was faster and simpler than single channel PCNN coupling judgment. In the DPCNN model, some key parameters affected the quality and calculation efficiency of sub-band coefficients to a certain extent, such as link strength, external excitation, and ignition output value. So, the literature [21,22,23,24,25] has improved the model parameters of DPCNN. In essence, link strength was usually set as local standard deviation [21], and Yang et al. calculated the fuzzy membership of each pixel to adapt to the link strength of DPCNN, which obtained the fused image with high contrast [22]. El-taweel and Helmy adopted spatial frequency (SF) as the external excitation, which was capable of effectively overcoming the Gibbs phenomenon at the target boundary [23]. The morphological gradient of the sub-band was used as the external excitation value, which could availably judge the detailed edge information of the high frequency sub-band [24]. Xiang et al. took the average gradient as the link strength, and modified spatial frequency (MSF) as the external excitation value, which enabled the DPCNN to achieve the extraction of rich details [25].
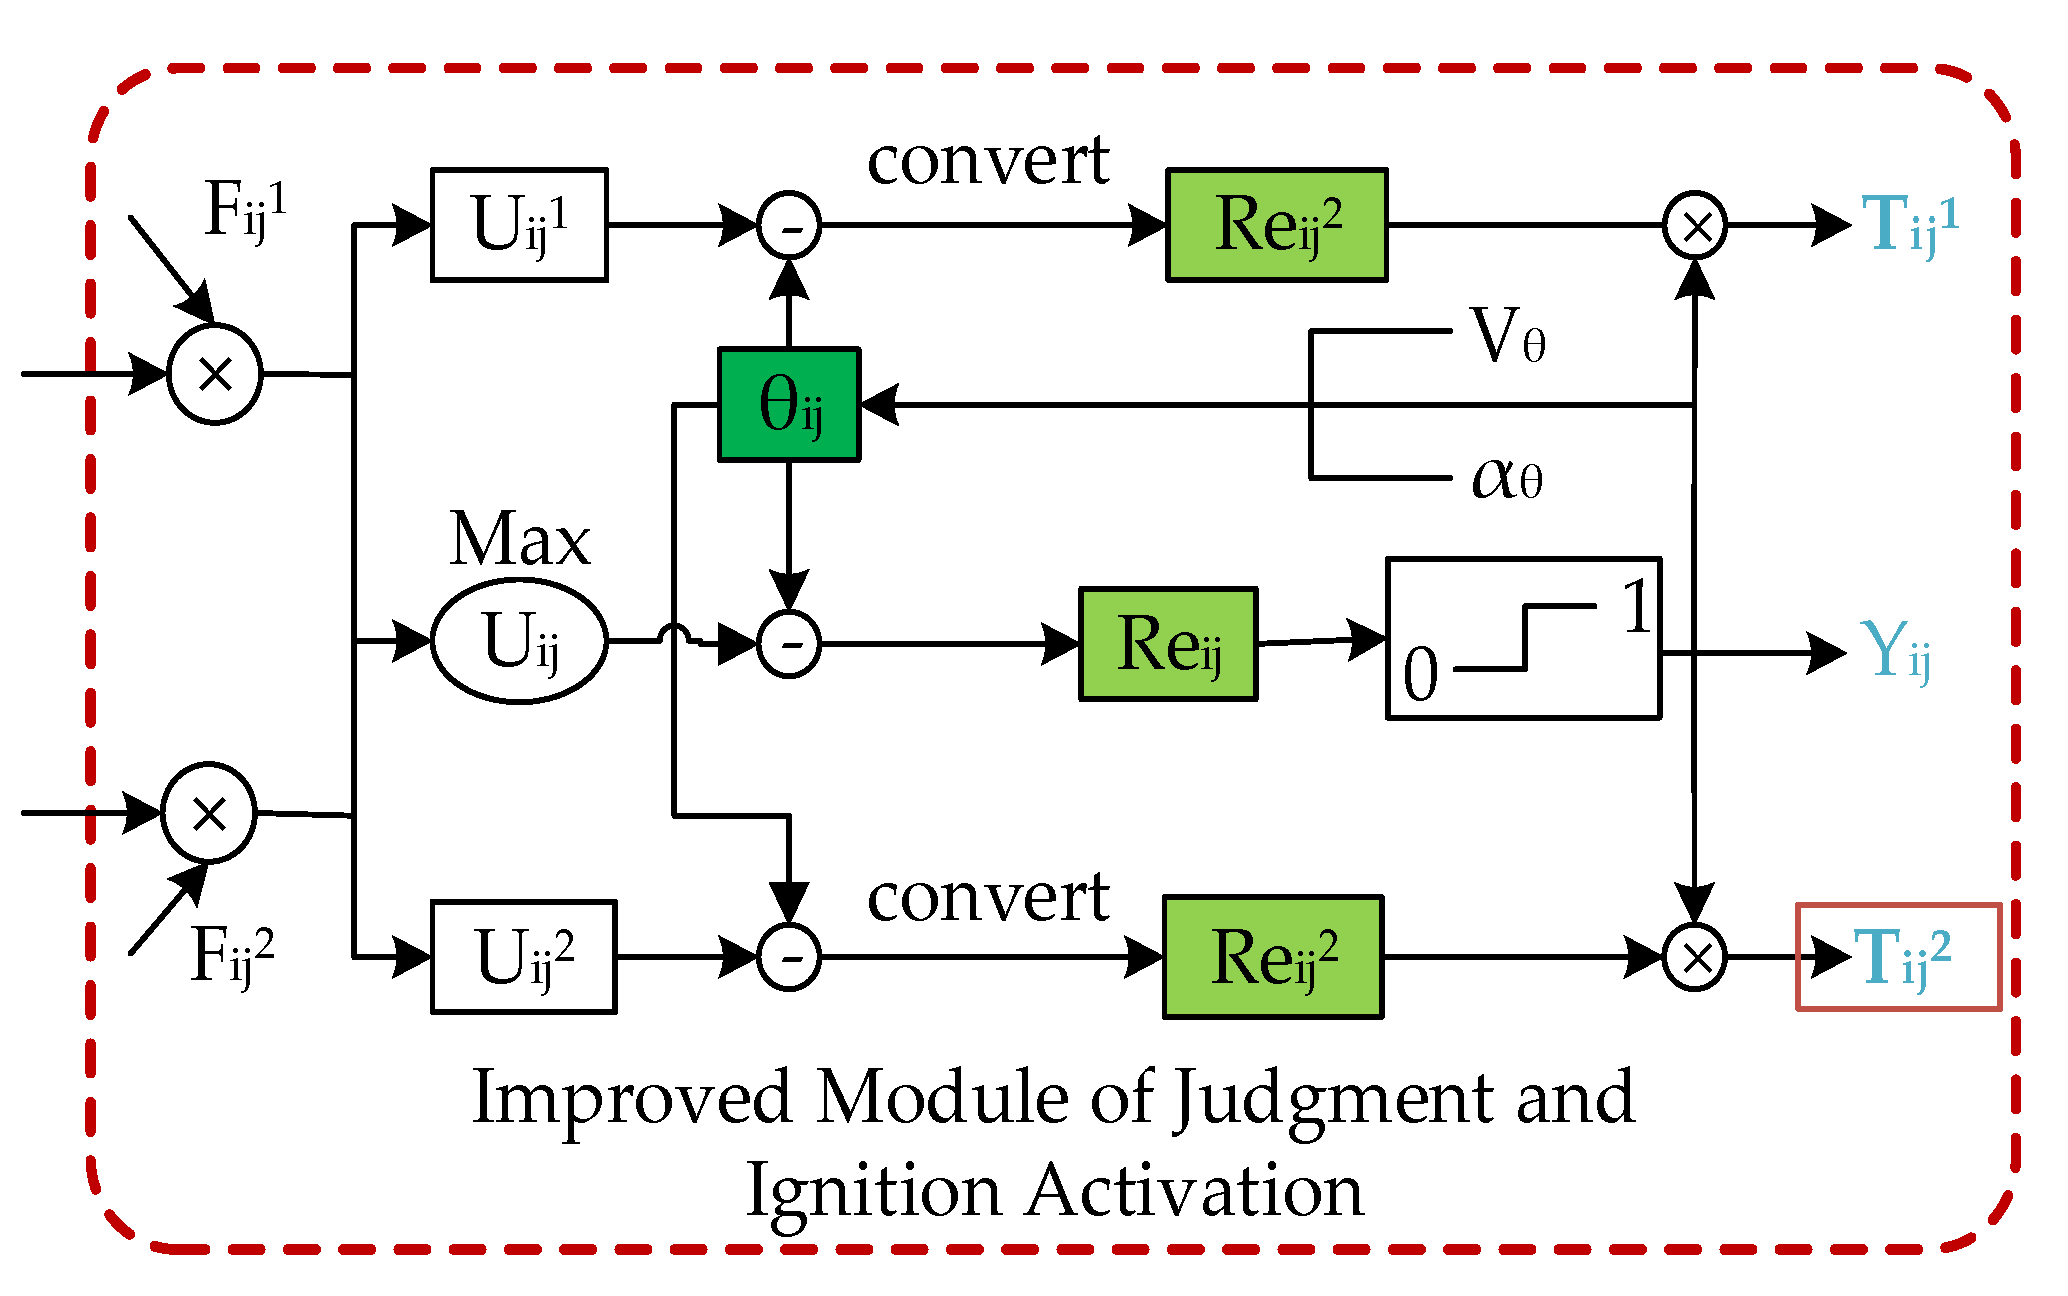
The above DPCNN model achieves an excellent judgment of sub-band coefficients, but the traditional DPCNN model [20] must wait for all sub-band coefficients to be activated before judging, which may result in false fired pulses. Besides, the ignition output value was set to 1 or 0 in this model [
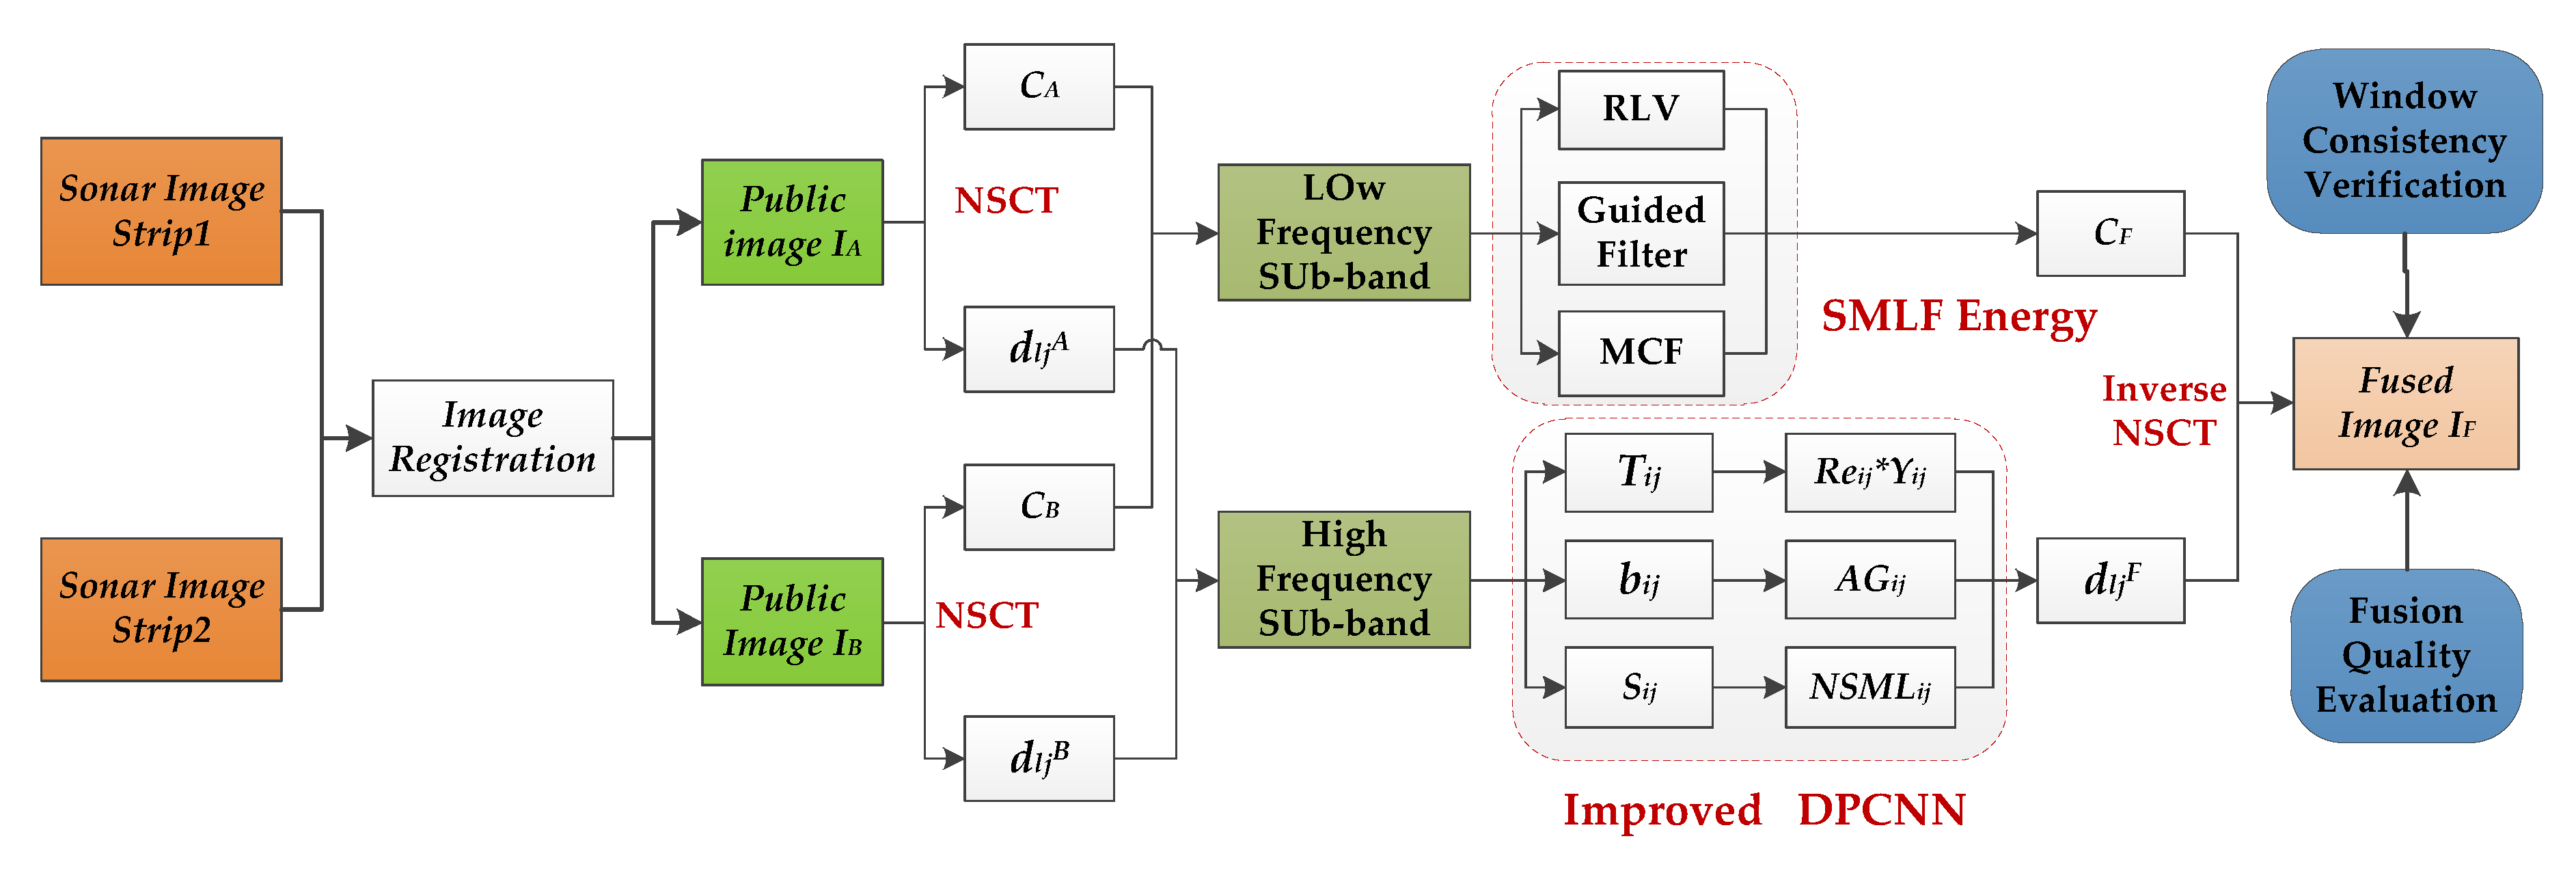
21], which made the active judgment unable to reflect the grade difference. Hence, a method of selecting low and high frequency sub-band coefficients in NSCT domain is proposed for side-scan sonar image fusion of adjacent strips. The frame design is shown in Figure 1.
In this work, we have made the following progress: (1) SML energy filtering (SMLF) with multiple parameters and technologies, such as relating sum-modified Laplacian energy with visual contrast value (RLV), guide filter and multi-channel filter (MCF), is used to eliminate block flow in low frequency sub-band images; (2) Improved DPCNN (IDPCNN) model is employed to increase the depth and activity of pulse ignition, which can quickly and accurately select high frequency image coefficients; and (3) multiple fusion metrics are applied to evaluate the performance of single and combined fusion criteria.
The remaining of this paper is organized as follows. Section 2 introduces the proposed image fusion method and process in detail. The experimental results and analysis are illustrated in Section 3. Finally, the conclusions are presented in Section 4.

2. The Proposed Image Fusion Method

2.1. Fusion Pretreatment

The sonar image fusion in the overlapping area is to make full use of the complementary information from the source image to enhance the feature information, such as the size and edge outline of underwater target, the landform, and texture. The sonar image fusion pre-processing includes noise filtering, image registration, multi-scale decomposition, and reconstruction. In general, median filtering is used to de-noise the side-scan sonar image [26]. In addition, the method of speeding up robust features is registered to obtain images of the overlapping area. Moreover, in order to enhance the directional selectivity and obtain better spectral characteristics of image information, NSCT transformation is used to decompose the source image into low frequency and high frequency sub-band components. Then, different low frequency and high frequency fusion criteria are adopted to select and determine the signal source. Finally, a new fusion image is generated according to the combined signal reconstruction.

2.2. SML and SMLF Energy

2.2.1. SML Energy

The low frequency sub-band image retains most of the energy information from the source image, so the selection of its fusion criterion is crucial for the reconstructed fusion image. The work of [14] showed that SML can provide better performance than other focus functions for guiding the selection of low frequency sub-bands, such as variance, energy of image gradient (EOG) [27], energy of Laplacian (EOL), SF, and so on. SML represents the Laplacian energy in the horizontal and vertical directions of the image [28], and its parameter is defined as follows:
SML ( x , y ) = p = 1 1 q = 1 1 EOL ( x + p , y + q ) 2 EOL ( x , y ) = | 2 c ( x , y ) c ( x 1 , y ) c ( x + 1 , y ) | +        | 2 c ( x , y ) c ( x , y 1 ) c ( x , y + 1 ) |
where EOL (x, y) is the energy of Laplacian. c (x, y) denotes as the low frequency sub-band coefficient.
For a pair of the low frequency sub-band images obtained by NSCT decomposition, the difference between the clear object and the fuzzy object in the image is relatively large, which reflects the feature information in the local neighborhood by calculating its Laplace energy. Therefore, SML energy is utilized to judge the low frequency sub-band coefficient, and the coefficient with larger SML energy is taken as the low frequency coefficient after fusion.

2.2.2. SMLF Energy

Side-scan sonar image is characterized by uneven brightness and severe speckle noise [29], which makes the SML energy unable to reflect the difference in image contrast and leads to false contours in the fused low frequency images. Therefore, SMLF energy is applied to improve the above problems. Its strategy can be described below. SML and the visual adjustment value α are nonlinearly combined into the RLV value. RLV(x,y) is defined as follows:
RLV ( x , y ) = { SML ( x , y ) c ¯ ( x , y ) ( 1 + α ) c ¯ ( x , y ) 0 SML ( x , y ) c ¯ ( x , y ) = 0
where c ¯ (x, y) is the coefficient mean of centered on the pixels (x, y). α is the brightness value of the visual adjustment, and α ∈ (0.6, 0.7) [30] and α = 0.65 are used in this paper.
Taking RLV as the guide map, the guided image coefficients GfA and GfB are obtained by the guided filter (GF) [31]. The decision map can be obtained by judging the size of GfA and GfB and filtering twice with multi-channel filters. p × q is 3 × 3 window size.
map = { 1 G f A G f B 0 others and , map 1 = { 1 p q map ( i , j ) 6 0 others
According to the value of dp, the low frequency coefficient matrix of fused image cF is finally generated. cA and cB are the low frequency sub-band coefficients, respectively.
c F = m a p 1 c A + ( 1 m a p 1 ) c B

2.3. DPCNN and Its Improved Model

2.3.1. DPCNN Model

Wang and Ma introduced a dual-channel PCNN (DPCNN) model to guide the fusion of high frequency sub-band images, which keeps the coupling characteristics of PCNN model, and simplifies parameter setting [20]. DPCNN model (Figure 2) is a simulation process in which cerebral cortex cells respond to visual pulse signals. Its bidirectional excitation and global characteristics can enhance the important information extraction from source images, which is conducive to the selection of detailed features [32]. Its mechanism is defined as shown below.
The neuron (i, j) receives external excitation value and coupling values of peripheral neurons Lij in the receiving domain, and internal activity items Uijk are nonlinear modulated by link strength βijk.
F i j k ( n ) = | S i j k ( n ) | , k = { 1 , 2 } L i j ( n ) = e α L L i j ( n 1 ) + V L p q ω i j , p q Y i j , p q ( n 1 ) U i j k ( n ) = F i j k ( n ) ( C R + β i j k L i j ( n ) ) , k = { 1 , 2 }
where n is the iteration number. Sijk (k = 1, 2) is the external excitation. αL is the attenuation constant of link input. VL is the amplification factor of link input. p × q is the neighborhood range. ωij,pq is the connection weight. CR is the non-linear coefficient ratio between link input and external excitation. Yij,pq is pulse activation value (1 or 0).
The maximum active item Uij is taken in the information fusion domain, and the dynamic threshold θij is judged with it to generate a corresponding output activation signal.
U i j ( n ) = max { U i j 1 ( n ) , U i j 2 ( n ) } Y i j ( n ) = { 1 U i j ( n ) θ i j ( n 1 ) 0 others
where Yij is the output of neurons (1 or 0).
When the neuron is activated, the channel corresponding to the maximum activity item is selected as the fusion coefficient. Besides, dynamic threshold is updated to promote the activation of adjacent neurons, and the method of iterative updating is adopted until all neurons are ignited.
θ i j ( n ) = e α θ θ i j ( n 1 ) + V θ Y i j ( n )
where αθ is an attenuation constant of threshold. Vθ is a magnification factor of threshold.

2.3.2. Improved DPCNN Model

(1) Theory of improved DPCNN model
By analyzing the mechanism of the DPCNN model, it can be found that the setting of some default constants is very skillful for activating all neurons [33], which often affects the fusion performance and running time, such as maximum iteration Kn, αθ, Vθ, and so on. Therefore, an improved DPCNN (IDPCNN) model is proposed to select the coefficients of high frequency sub-band images. The improved pulse activation process mainly occurs in the information judgment and pulse activation domain, as shown in Figure 3. The amplitude value Reij (k = 1, 2) is calculated by the soft limit function [34], which is in conjunction with the dynamic threshold to determine whether the pulse is activated and record each ignition time. After Kn iterations, the channel coefficients corresponding to the larger cumulative output time ∑Tijk are served as the fused high frequency sub-band coefficients.
R e i j k ( n ) = 1 / ( 1 + e ( θ i j ( n 1 ) U i j k ( n ) ) ) , k = { 1 , 2 } Y i j ( n ) = { 1 max { R e i j k ( n ) } 0.5 0 others T i j k ( n ) = R e i j k ( n ) Y i j ( n ) , k = { 1 , 2 }
where Tijk denotes as the pulse ignition time.
(2) Key parameter settings of IDPCNN model
In the traditional DPCNN model, the parameters mainly depend on experience and massive attempts [32]. A set of parameters that achieves good performance may be unsuitable for other data. Therefore, key points in the IDPCNN model are as follows for the image fusion of side-scan sonar, 1) pulse ignition time Tijk; 2) link strength βijk; and 3) external excitation Sijk.
In this IDPCNN model, the soft limiting function is applied to reflect the amplitude difference of the total ignition time (see Equation (9)). Moreover, considering that local gradient energy is also one of image sharpness indicators, which can reflect the target edge and other detailed features, average gradient [35] is adapted to the characterization of link strength. The average gradient d ¯ (x,y) is defined as follows:
d ¯ ( x , y ) = 1 9 p = 1 1 q = 1 1 sqrt ( [ g 1 ( x + p , y + q ) + g 2 ( ( x + p , y + q ) ) ] / 2 ) { g 1 ( x , y ) = [ d ( x , y ) d ( x + 1 , y ) ] 2 g 2 ( x , y ) = [ d ( x , y ) d ( x , y + 1 ) ] 2
where d (x, y) is the high frequency sub-band coefficient. g1 (x, y) and g2 (x, y) represent the gradient difference in the horizontal and vertical directions, respectively.
Moreover, a novel sum-modified Laplacian (NSML) is set as external excitation, and denotes as:
nml ( x , y ) = | 2 × d ( x , y ) d ( x 1 , y ) d ( x + 1 , y ) | + | 2 × d ( x , y ) d ( x , y 1 ) d ( x , y 1 ) | + | 2 × d ( x , y ) ( 2 / 2 ) × d ( x 1 , y 1 ) ( 2 / 2 ) × d ( x + 1 , y + 1 ) | + | 2 × d ( x , y ) ( 2 / 2 ) × d ( x 1 , y + 1 ) ( 2 / 2 ) × d ( x + 1 , y 1 ) | N S M L ( x , y ) = p = 1 1 q = 1 1 n m l ( x + p , y + q ) 2

2.4. Quality Evaluation of Fused Image

The evaluation of a fused image is usually performed by subjective visual and objective indexes. Subjective vision is mainly used to judge the fused effect of image contrast, ambiguity, noise elimination, target edge and texture features. Furthermore, objective indexes is able to accurately reflect the overall effect of the fused image and the visual information content of important targets, which is a complementary to the subjective visual effect. Therefore, some objective evaluation indexes of a fused image and its mathematical formula are listed in Table 1. Combining the characteristics of underwater sonar images, average gradient (AG) [36], figure definition (FD), information entropy (E) [37], root mean square cross entropy (RCE) [38], mutual information (MI) [9], edge-based similarity measure (QAB/F) [14], structural similarity index (SSIM) [39], and indexes of Piella [40] are applied to objectively evaluate the fused image.

2.5. Implementation of Fused Technique

The scheme process of the proposed fusion method is discussed in detail, as shown in Algorithm 1. The fusion framework based on the NSCT domain includes image preprocessing and registration, decomposed acquisition of the low and high frequency sub-band image, coefficient selection of the sub-band image, reconstruction of the fused image, and quality evaluation. First, the adjacent sonar images are registered using the speed up robust features (SURF) [41] method to obtain the information images of the overlapping area. NSCT is subsequently applied to decompose the pair of overlapping area images into low and high frequency sub-band images.
Moreover, the sub-band coefficients of low and high frequency images are determined by the SMLF and IDPCNN model, respectively. However, after the above fusion criteria are applied, there are some random discrete or isolated pixels in the small neighborhood of sub-band coefficient matrices, which are obviously different from the adjacent pixel source images [42]. Therefore, consistency verification (CV) [43] is carried out through a window size of 3 × 3 to ensure the consistency relationship between adjacent coefficient sources.
Finally, according to the selected sub-band images of low and high frequency, the fused image is reconstructed by inverse transformation of NSCT, and the effect of fused image is quantitatively analyzed and evaluated from subjective vision and multiple objective indexes.
Algorithm 1 Sonar Image Fusion Based on SMLF energy and IDPCNN Model
Input: Read in two sonar images of adjacent strip. Set some constant item values, Kn, αL, VL, αθ, Vθ, CR = 1. Initialize some parameters and matrices, Yij is zero matrix, ωij,pq is ones matrix, the iteration number n = 1.
Output: Fused image, difference image and objective evaluation indexes
 1: Image registration to obtain overlapped area image I1, I2;
 2: Acquisition of low and high frequency image matrix CA/B, dijA/B with NSCT transform;
 3: Calculate the SML energy of low frequency sub-band coefficient by Equation (1);
 4: Relate SML energy with visual adjustment value to obtain RLV parameter values based on Equation (2);
 5: Decision map is obtained by the guided filter and multiple filters based on Equation (3);
 6: Determine the coefficient source of low frequency sub-band by using Equation (4);
 7: while (iteration number n ≤ maximum iteration Kn)
 8: Average gradient d ¯ (x, y) and NSML (x, y) is obtained by Equations (9) and (10);
 9: Get Fijk (n), Lij (n), Uijk (n) of each neuron in the receiving domain by Equation (5);
10: Judge whether the pulse signal is activated by Equation (8);
11: if Amplitude value Re (i, j) ≤ 0.5
12:  The neuron (i, j) is activated, Yij = 1. Record the ignition time of each iteration Tijk (n), and update dynamic threshold θij (n) by Equation (7);
13: end if
   n = n + 1;
14: end while
15: After Kn iterations, high frequency sub-band coefficients are selected according to the total ignition time;
16: Sub-band coefficients of low and high frequency pass the window verification to ensure the consistency of adjacent coefficient sources;
17: The fused image of overlapping area is reconstructed by NSCT inverse transform;
18: return Fused image is subtracted from overlapping image to obtain the difference image, and the objective evaluation indexes of fused image are obtained by Table 1.

3. Experiments and Analysis

3.1. Data Description

To evaluate the proposed low and high frequency fusion criteria and their performance in the NSCT domain, three sets of side-scan sonar images are used to verify the performance of the fusion criteria. Data 1 is a small-scale image of aircraft debris with clear target profile features. Data 2 is a medium-scale pipeline detection image, which contains more information, such as oil pipeline targets, rich terrain texture, and different types of sediment characteristics. The above source images were subjected to median filtering, and local Gaussian blurring (sigma = 5) is performed on the left and right sides, as shown in Figure 4 and Figure 5. This procedure is an imitation process that the overlapping area image generated by the echo intensity of adjacent strips is not relatively clear in complex waters. The phenomenon of clear underwater topography and small noise interference exists in the right strip, but the image information of left strip is the opposite.
Data 3 is the sonar images with a high overlap rate, which is collected from the port area of Rhode Island, USA, in 2011. Two sonar images are processed by seabed tracking, time variable gain, image de-noising, and image registration to obtain the large-scale overlapping areas. Stacking the overlapped area image together reflects the information differences between two images (Figure 6). Partially enlarged areas of Figure 6 indicate that underwater protective embankment and the position of underwater target reef have basically overlapped after strict registration. In addition, image color values display that the amount of information is different with the overlapped area of adjacent strips, and local area information is missing. Moreover, the emphasis of the measured underwater target is different and the terrain relief texture details are diverse in the local area.

3.2. Comparison of Fusion Criteria

NSCT transform is adopted to decompose the images into low and high frequency sub-band images, and the information extraction influence of different fusion criteria is analyzed. Among them, the shared parameters of the PCNN or IDPCNN model are set as follows: max iteration Kn is 200, link input attenuation constant αL =1, link input amplification factor VL = 1, threshold attenuation constant αθ = 0.2, threshold amplification factor Vθ = 20, and non-linear combination coefficient ratio between link input and external excitation CR = 1. The specific design schemes are as follows.

3.2.1. Low Frequency Fusion

The low frequency sub-band image inherits a large amount of energy information from the source image, so Data 1 is applied to analyze the influence of different fusion criteria on information extraction. Selection criteria include the following: (1) Mean; (2) Local_STD; (3) PCNN; (4) SML; (5) EOL Filtering; (6) SMLF. The parameter descriptions of low frequency fusion criteria are shown in Table 2, and the experimental results are shown in Figure 7.
Figure 7a illustrates that the low frequency sub-band image processed by the Mean criterion is relatively blurred. The criterion of Mean smoothens the whole low frequency image and is not able to reflect the streamline profile of the aircraft wreck. Although the sub-band images (Figure 7b–d) maintain the advantages of high contrast and clear brightness, there is a pseudo-contour effect of block flow around the edges of the aircraft wreckage, especially, the sub-band image processed by the criterion of Local_STD leaves the most, followed by the result of the PCNN criterion. This is the reason that PCNN model is not adopted to select the sub-band coefficients of low frequency in the early processing of subsequent experiments, so as to avoid the interference of the analysis. Figure 7e shows that the fused image processed by the criterion of EOL filtering possesses distinct brightness on the whole aircraft (nose, wings, tail), but insufficient brightness exists in the shadow of the aircraft wreckage. This fusion criterion results in a reduced visual contrast of low frequency sub-band image. Figure 7f displays that the low frequency sub-band image processed by the SMLF energy criterion has a clear contour, relatively high contrast; the brightness is roughly the same as the source image; and no false fusion pseudo-contour effect is generated. In general, the visual effect of the sub-band image processed by the proposed low frequency fusion criterion is superior to other fusion strategies.

3.2.2. High Frequency Fusion

The high frequency sub-band image contains the detailed feature information from the source image, such as target contour and terrain texture. On the basis of the optimal low frequency fusion criterion of SMLF energy, experiments are conducted with Data 1 and 2, and the performance of high frequency fusion criteria is evaluated by the fused image and difference image (Figure 8 and Figure 9). The fusion criteria include the following: (1) Energy_Max; (2) Direction contrast maximum (Dire_Contrast_Max); (3) PCNN (NSML); (4) IDPCNN (MSF) [25]; (5) IDPCNN (NSML). Among the PCNN and IDPCNN model, ignition time and link strength are represented by the soft limiting function and AG value, respectively, which are the optimal choice directly. It mainly discusses the influence of external excitation value on these models, which are represented by MSF and NSML, respectively.
Figure 8b shows that the contrast of fused image is reduced and the feature of detail changes is smoothed, while other fused images are basically consistent with the source image, with good subjective visual effects. In addition, the difference image of Figure 8b displays that the remaining information leaves a lot on the left side, and the information extraction of the aircraft contour edge is not sufficient, which indirectly indicates that the Dire_Contrast_Max criterion is not applicable to sonar image fusion. The difference image of Figure 8a shows that there still exists an insufficient partial integration. The remaining information of Figure 8c–e is almost 0, which corresponds to the clear left area and blurred right area of source image. Better visual effects illustrate that the high frequency fusion model of the PCNN family (criterion 3, 4, 5) can fully extract the source image favorable information, which is more suitable for sonar image fusion.
Figure 9b shows that the information extraction of texture and features is not sufficient, but other fused images have good visual effects. In addition, the difference images display that the residual error in Figure 9b is the greatest, followed by the fusion criterion of Energy_Max, which fully reflects the poor ability of the two criteria in processing strip fusion. On the contrary, the residual errors on the left side of Figure 9c, d are almost 0. The terrain and geomorphology texture of the fused image are clear, and the peripheral contour of the petroleum pipeline has no false contour phenomenon, which basically inherits the detail information features from the source image.
From the perspective of subjective vision, the fused images of criteria 3, 4, and 5 meet the requirements of high information retention. In order to further evaluate the performance of the criterion, some objective indexes are analyzed quantitatively, as shown in Table 3 and Table 4.
Table 3 and Table 4 show that each index value based on the criterion of Dire_Contrast_Max is the smallest. For example, the index values of AG, FD, and QAB/F are only 3.9657, 5.3125, and 0.4134 in Data 1, which indicates that the fused image deviates greatly from the source image and exhibits the phenomenon of distortion. The index value of maximum energy is not as good as that of the PCNN family. The quality of the fused image can be improved by using the PCNN family model to select the coefficients. Moreover, compared with the traditional PCNN model, the index values of the IDPCNN series are relatively larger. This is because the IDPCNN model combines the input of information from both source images, which reduces the ability of misjudging the information source. Compared with the IDPCNN model with the MSF parameter, most indicator values of the IDPCNN model with the NSML value are larger, which demonstrates that the IDPCNN model with the NSML value can better reflect the energy information of the sonar image, and conform to its own characteristics of the source image.

3.2.3. Combination of Low and High Frequency Fusion Criteria

In order to verify the combined performance of the superior low and high frequency fusion criteria mentioned above, experiments are performed using measured Data 3. The combined fusion criteria are shown in Table 5. The fused image (Figure 10) is highlighted by L1–L6 areas, and the characteristics of each region are used to analyze the performance of the combined fusion criteria. In addition, some objective indexes are applied to evaluate the algorithm’s ability, as shown in Table 6.
Compared with each area in Figure 10, different features and information are displayed comprehensively. In the image edge area L1 and the terrain fluctuation area L4, the phenomenon of incomplete fusion and discontinuous shadows are generated by the processing of combined technique 1, 2, and 3, and the combined technique 4 is unable to availably extract the information and topographic relief change characteristics of this area. For the L2 and L3 areas with incomplete detection information, the combined technique 4 and 5 fully absorb the complementary information of the two strips, showing a clear overview of the slope and boundary characteristics. In addition, the combined technique 1, 2, and 3 have no capacity for weakening the interference effect of residual error in the L5 area, and the fused image still retains the error traces after the subsea tracking processing. As for the edge contour area L6, the combined technique 5 proposed in this paper can effectively fuse the missing information of adjacent strips in the overlapping area, and the shadow trace of fused discontinuous discrimination is not produced.
Table 6 shows that many objective indexes of the proposed technique 5 are close to or better than other methods, for example, the indexes of AG, FD, RCE, and IFQI are 1.3042, 1.4708, 0.1290, and 0.2027, respectively, which demonstrate that the proposed method can better integrate the overlapping area information of adjacent strips. The larger value of AG and FD reflects the contour of reef, subtle features of geographic texture, and clarity of the fused image. Moreover, the image edge index QAB/F and EFQI reflect that the edge details of the fused image generated by the proposed method carry more information. Furthermore, the greater similarity indexes (MI, SSIM) demonstrate that the fused image processed by the proposed method fully combines the respective feature information of the multi-source image. Therefore, the evaluation results of multiple indexes objectively demonstrate that the proposed fusion criteria of SMLF energy and IDPCNN (NSML) is more suitable for the sonar image fusion processing of adjacent strips.

4. Conclusions

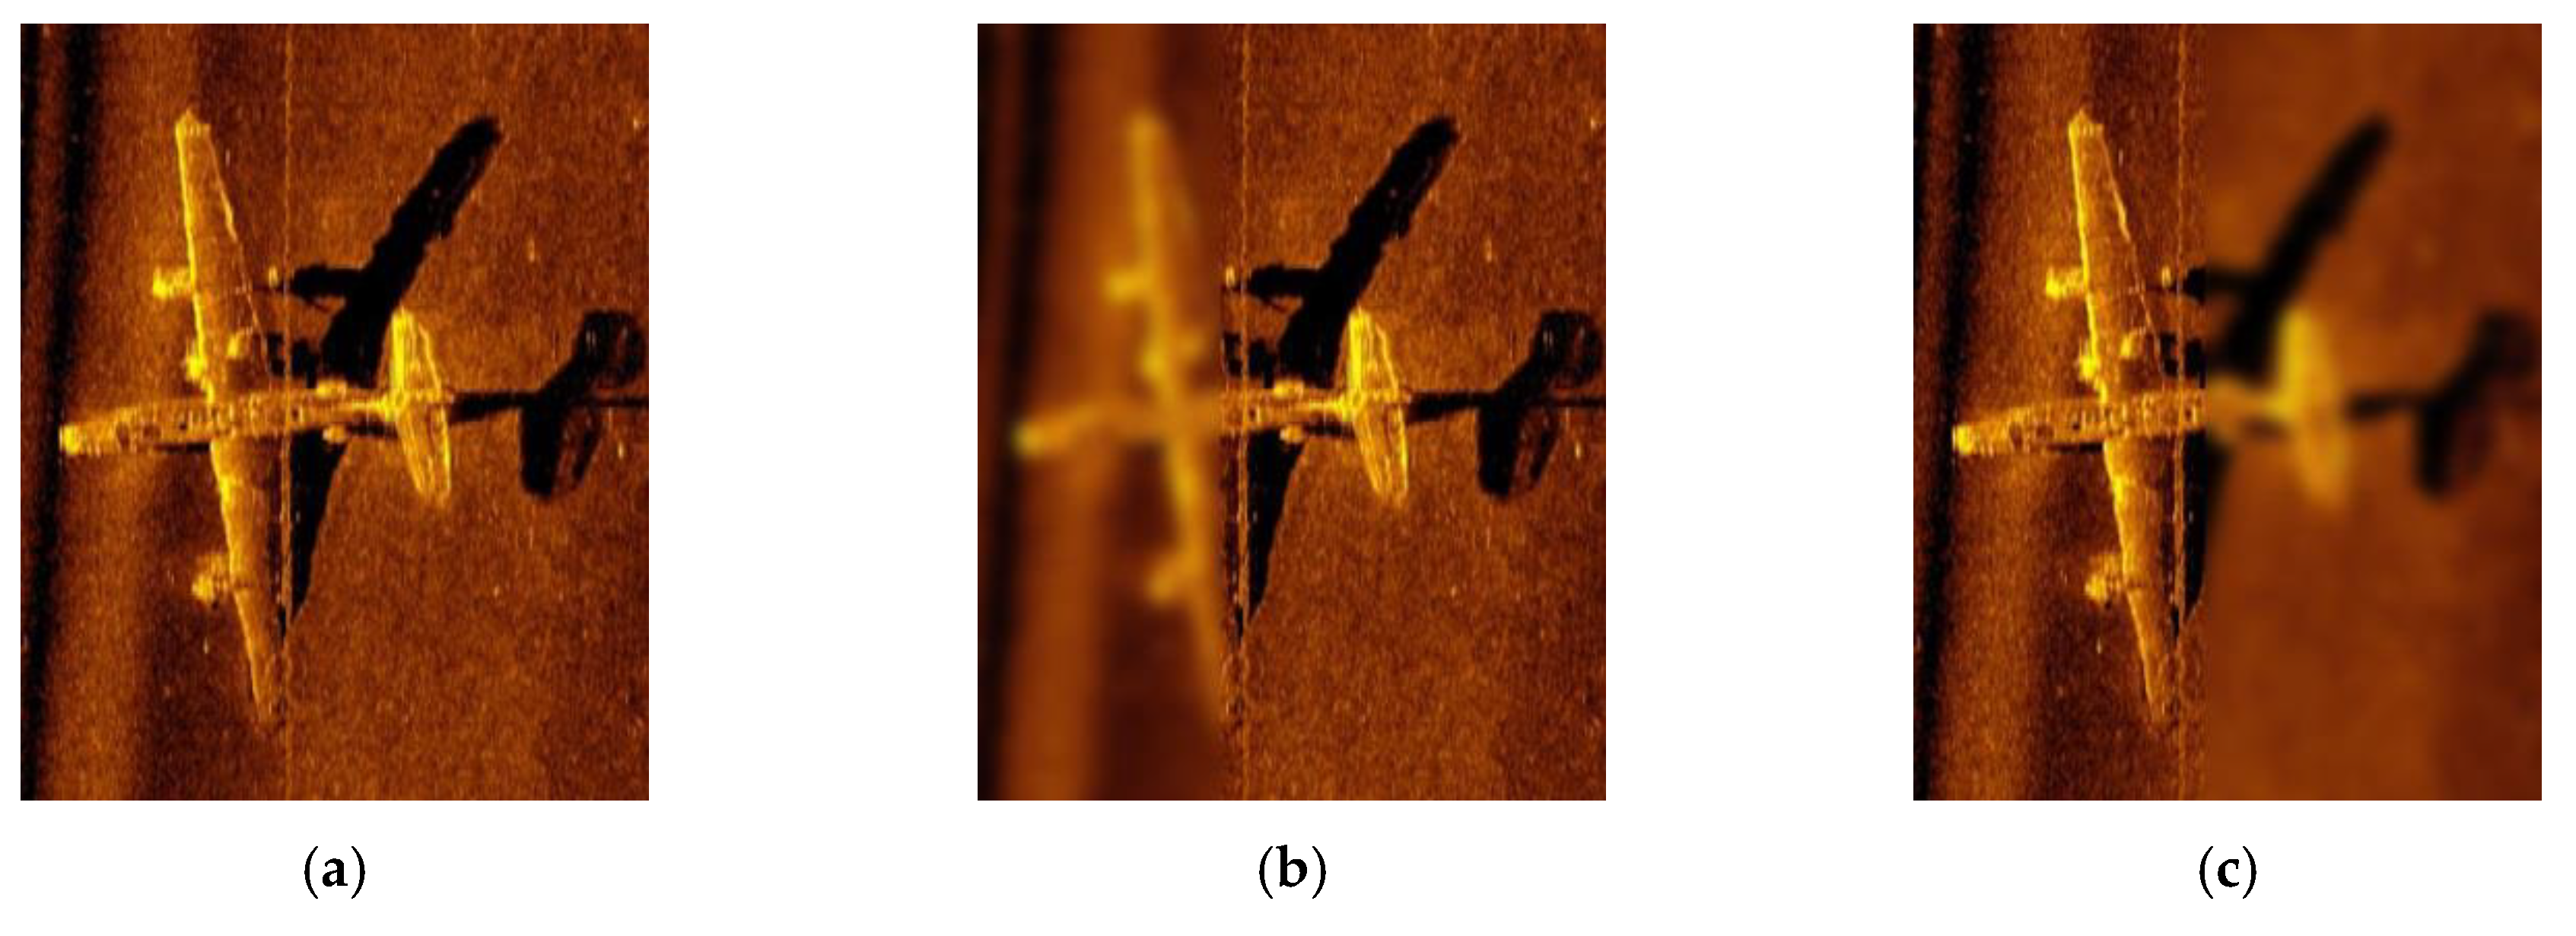
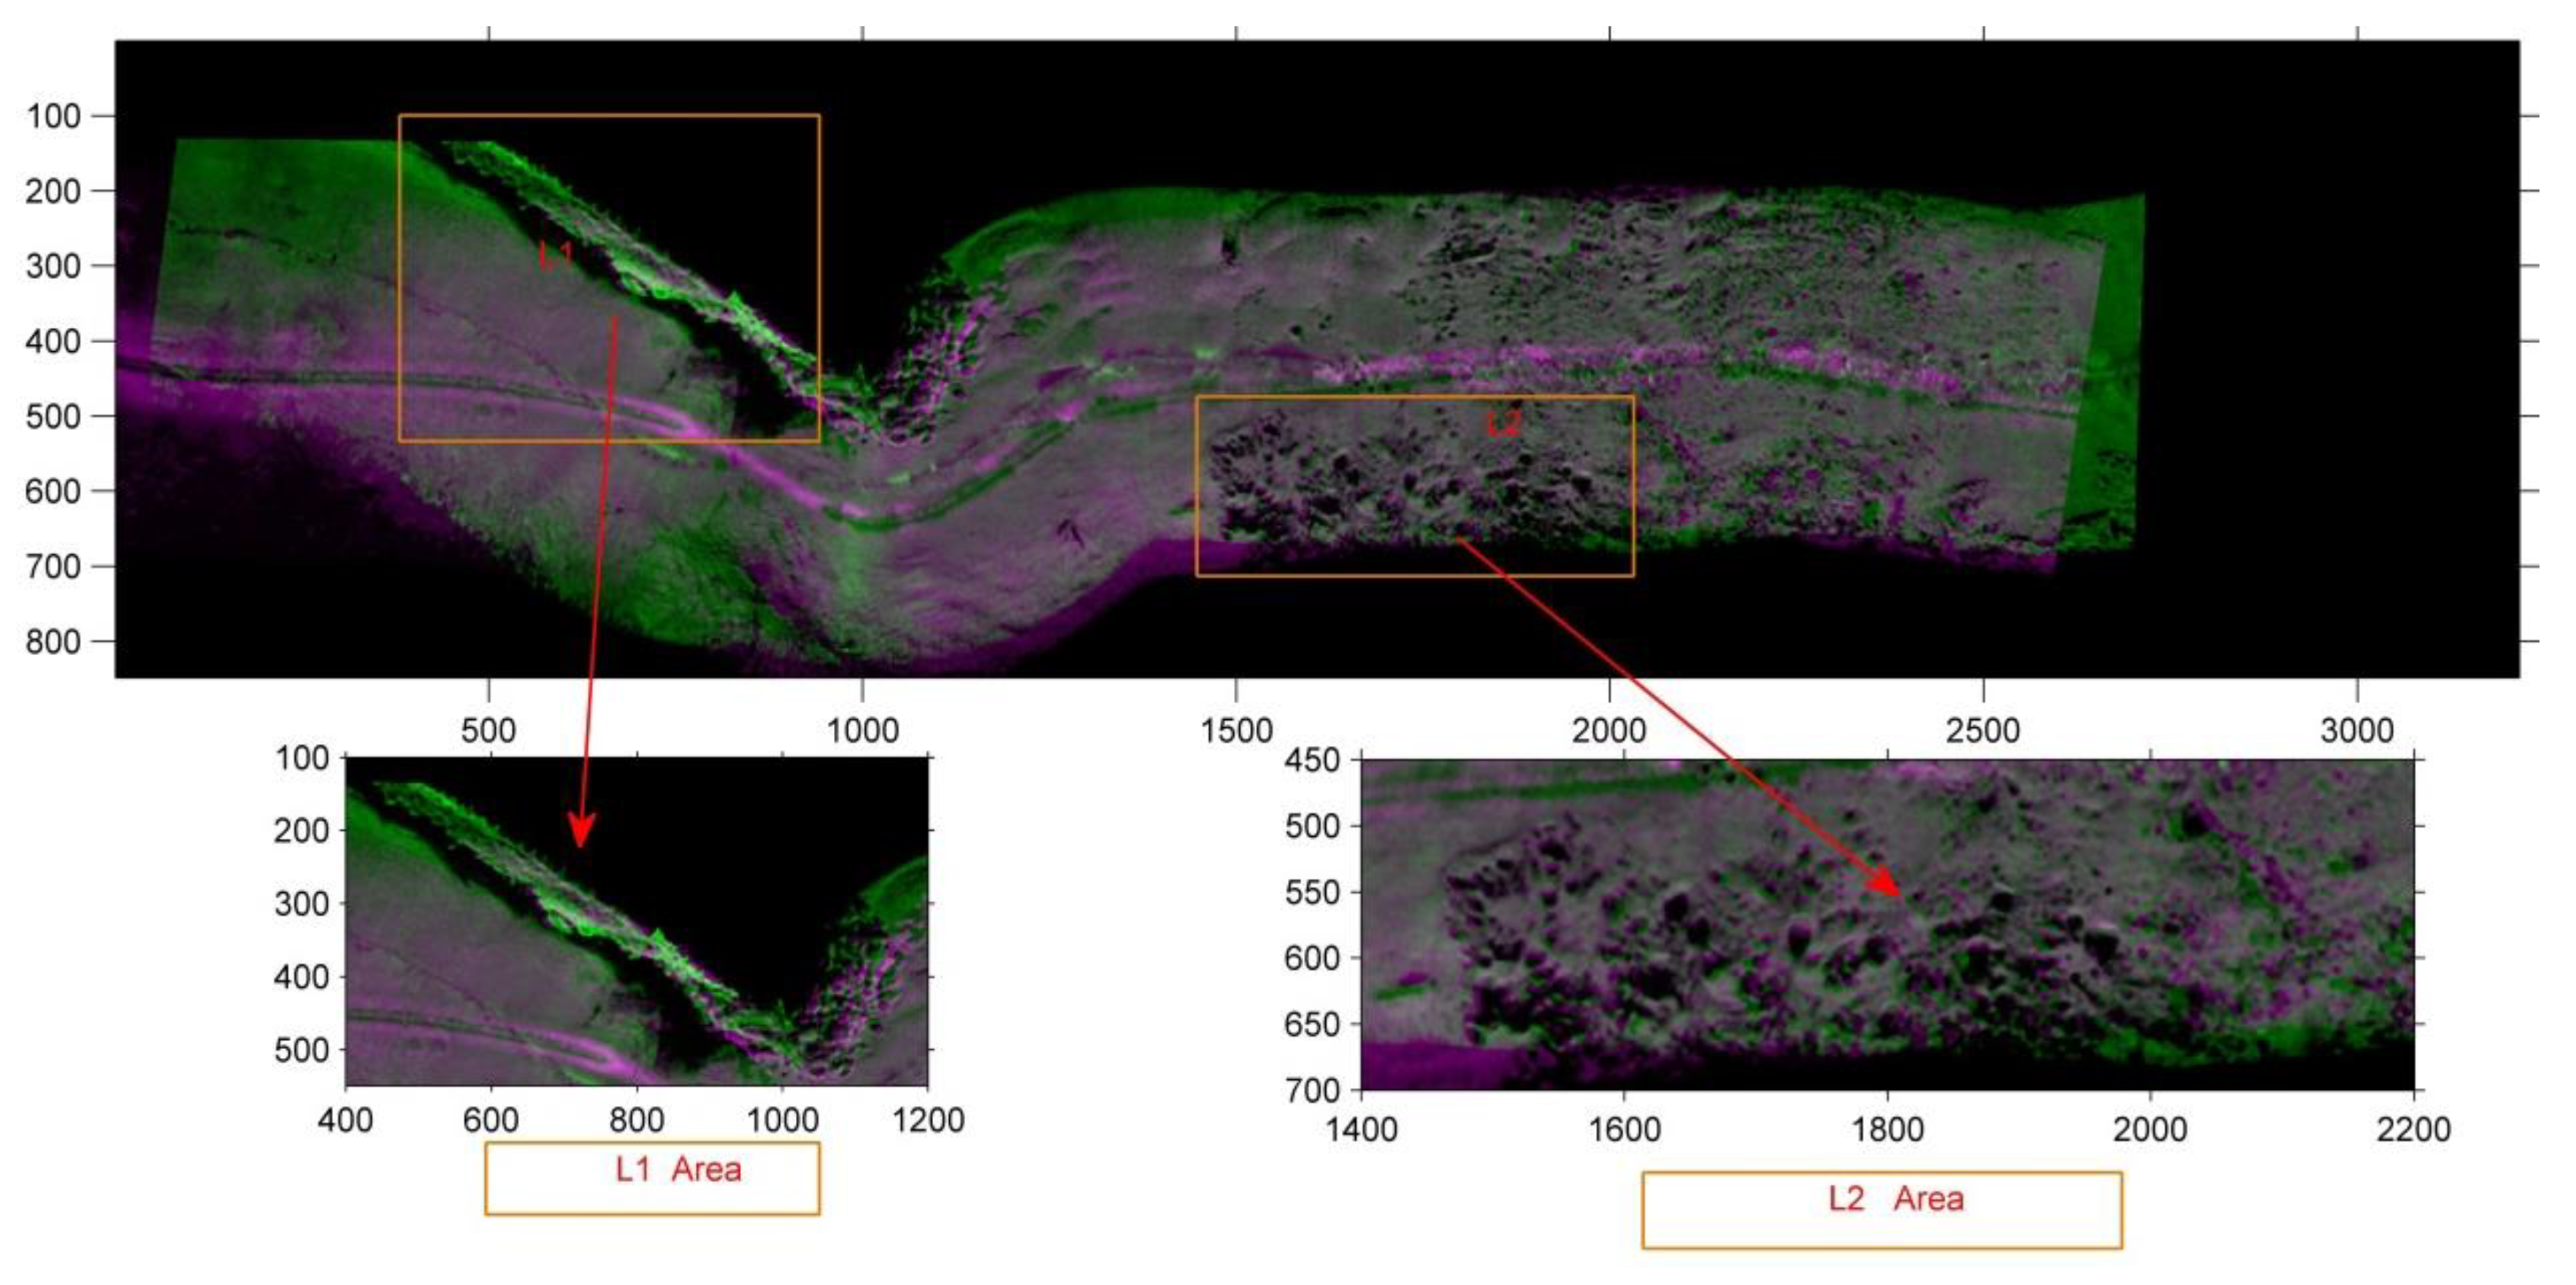
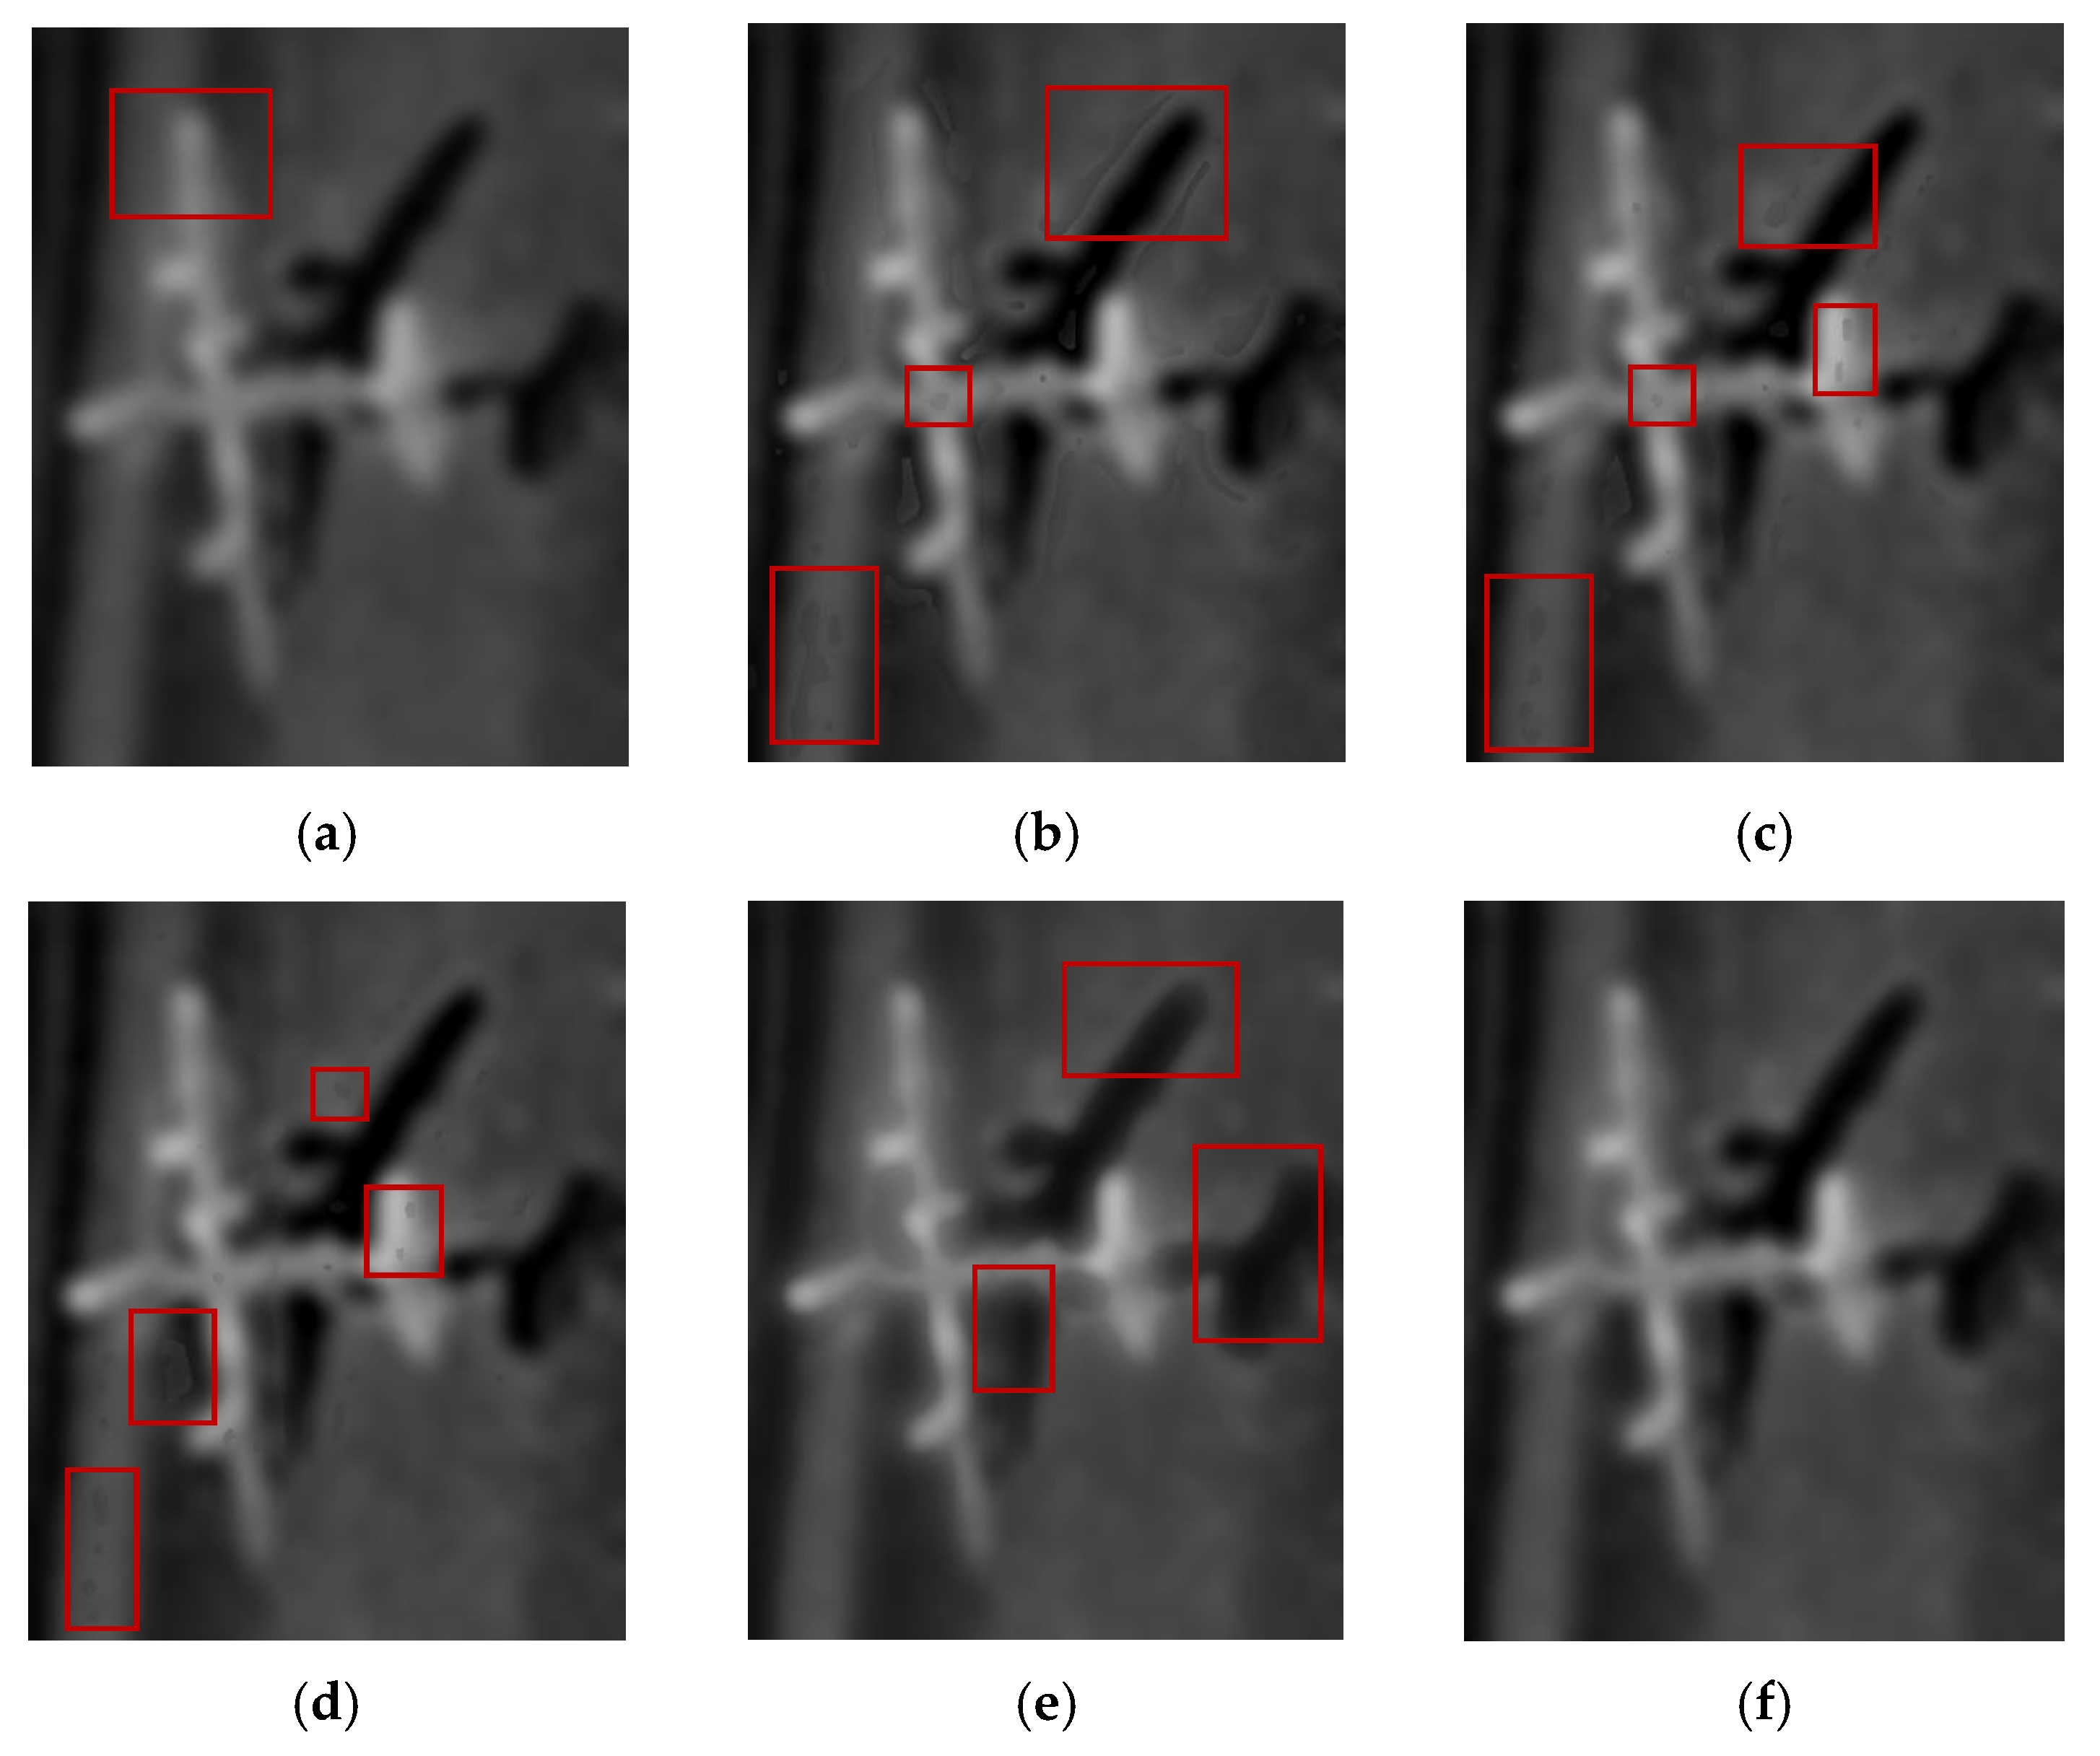
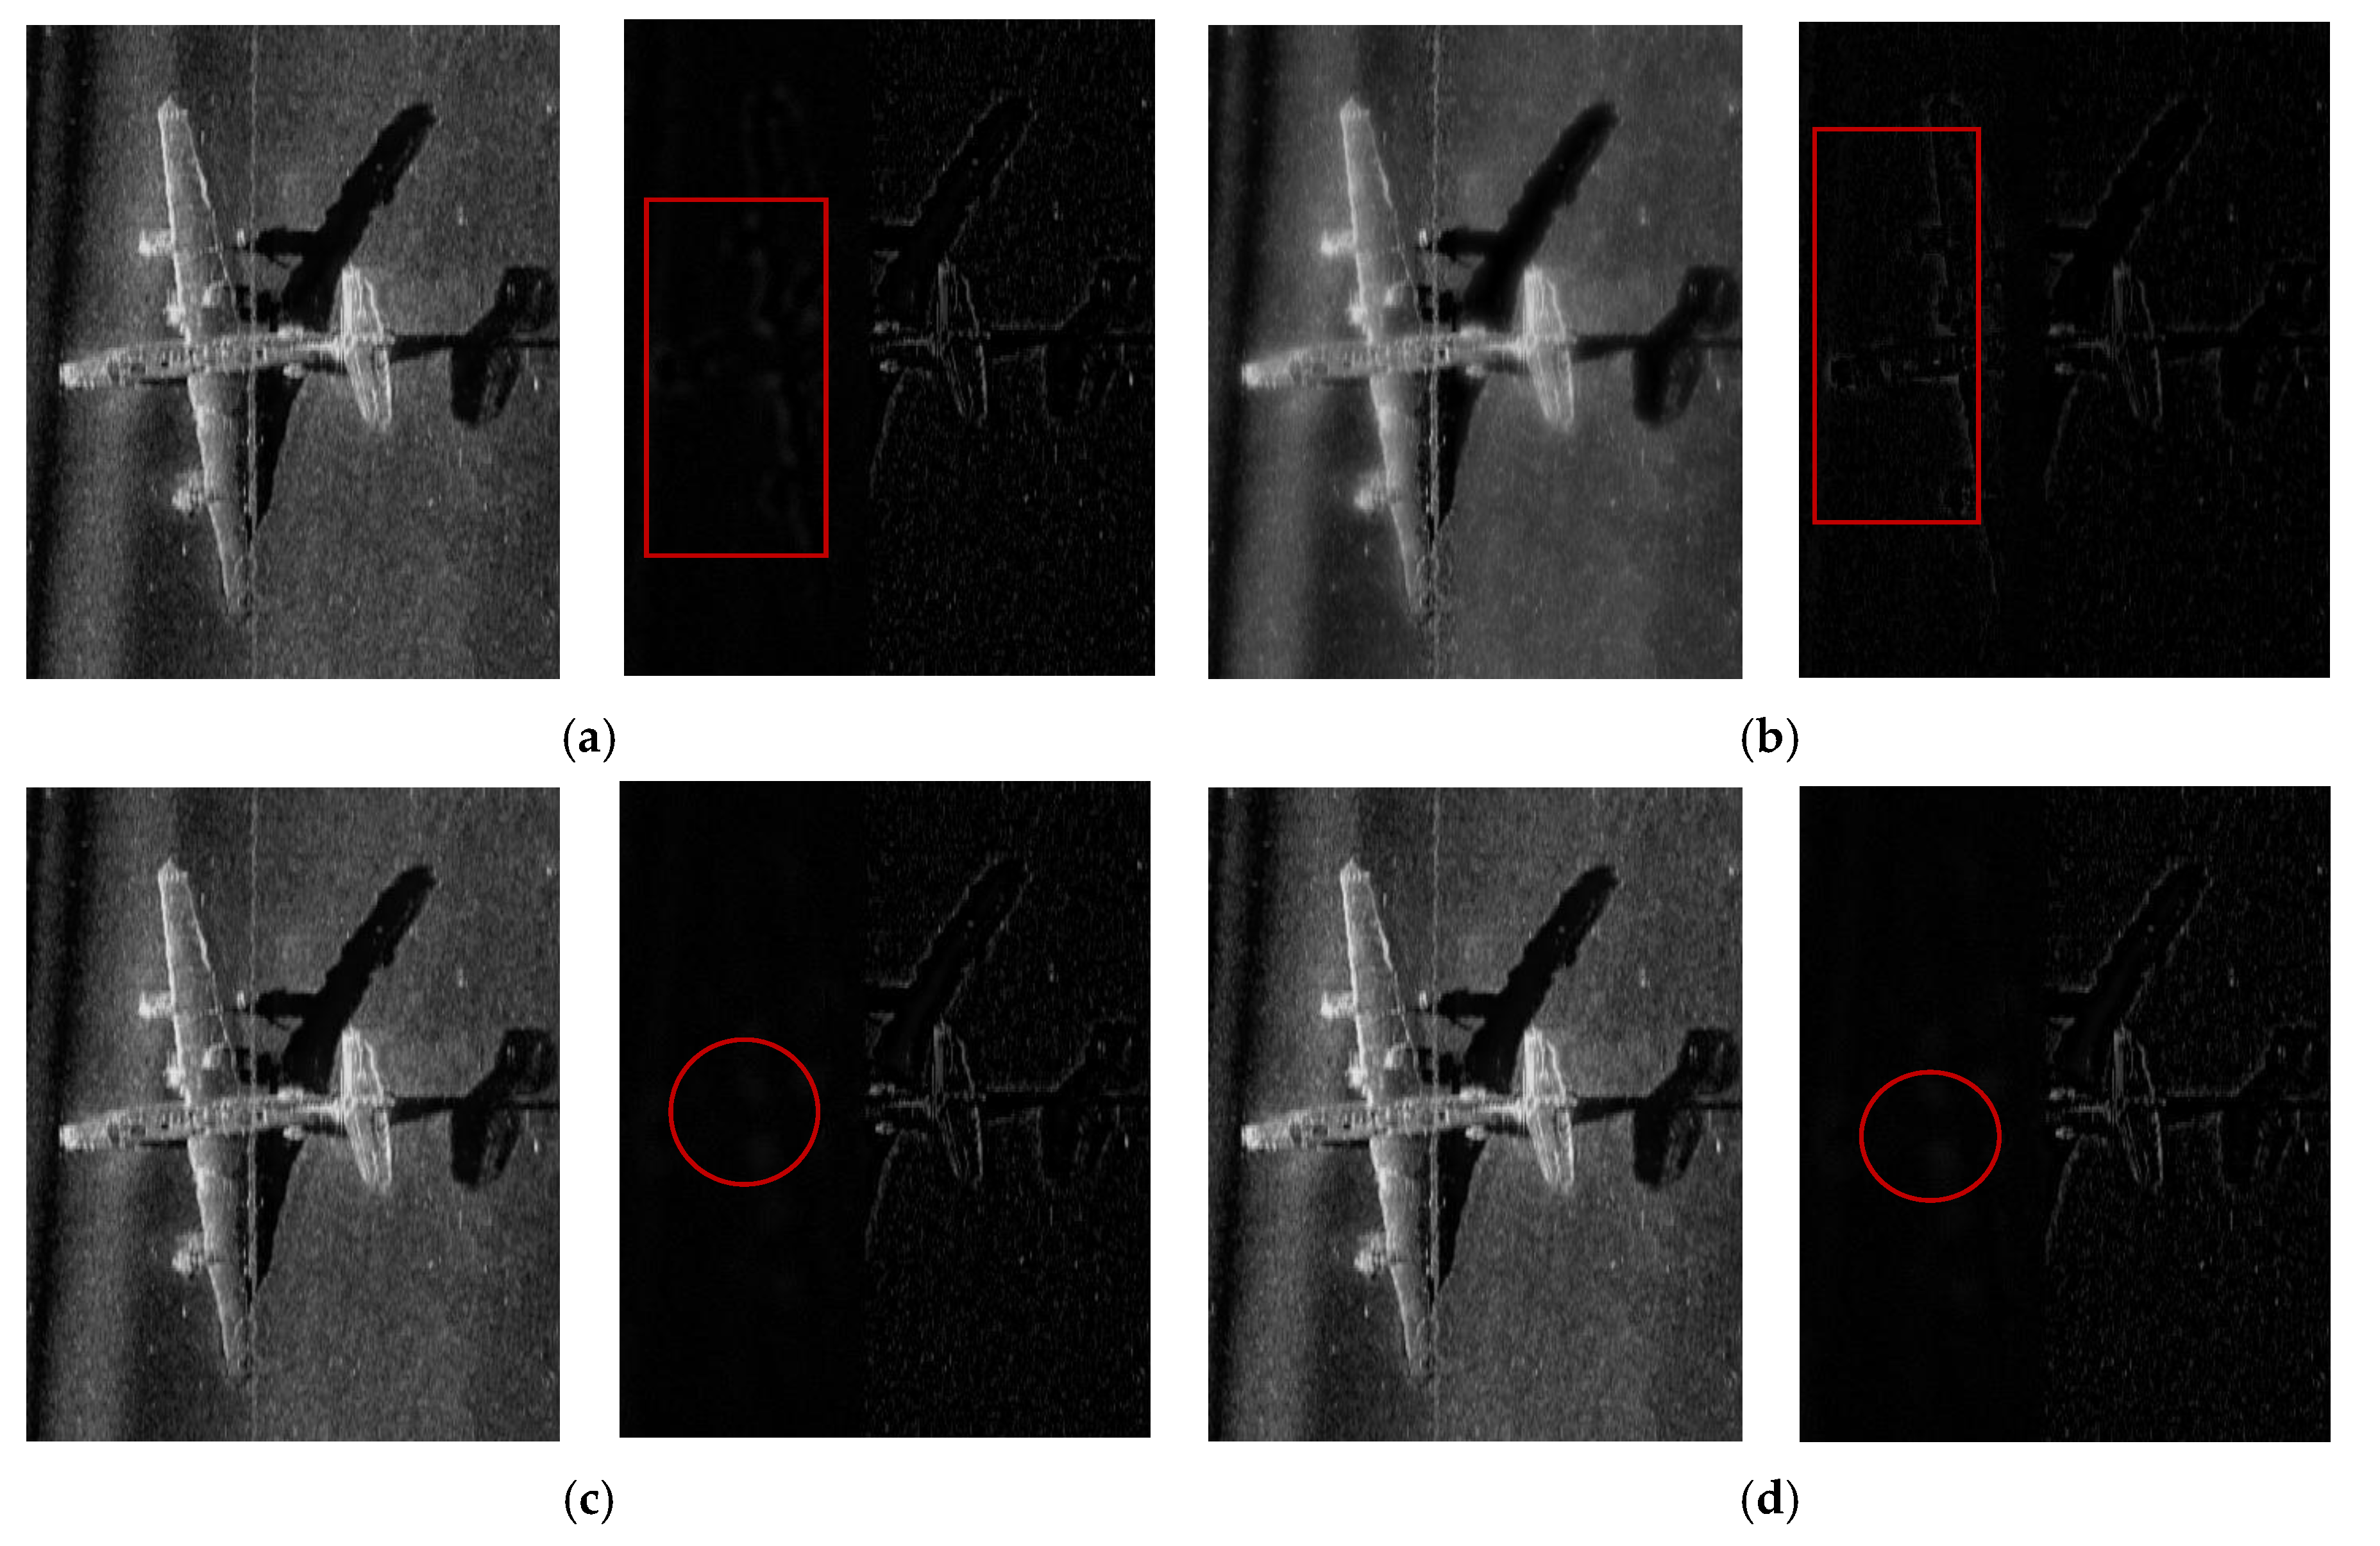
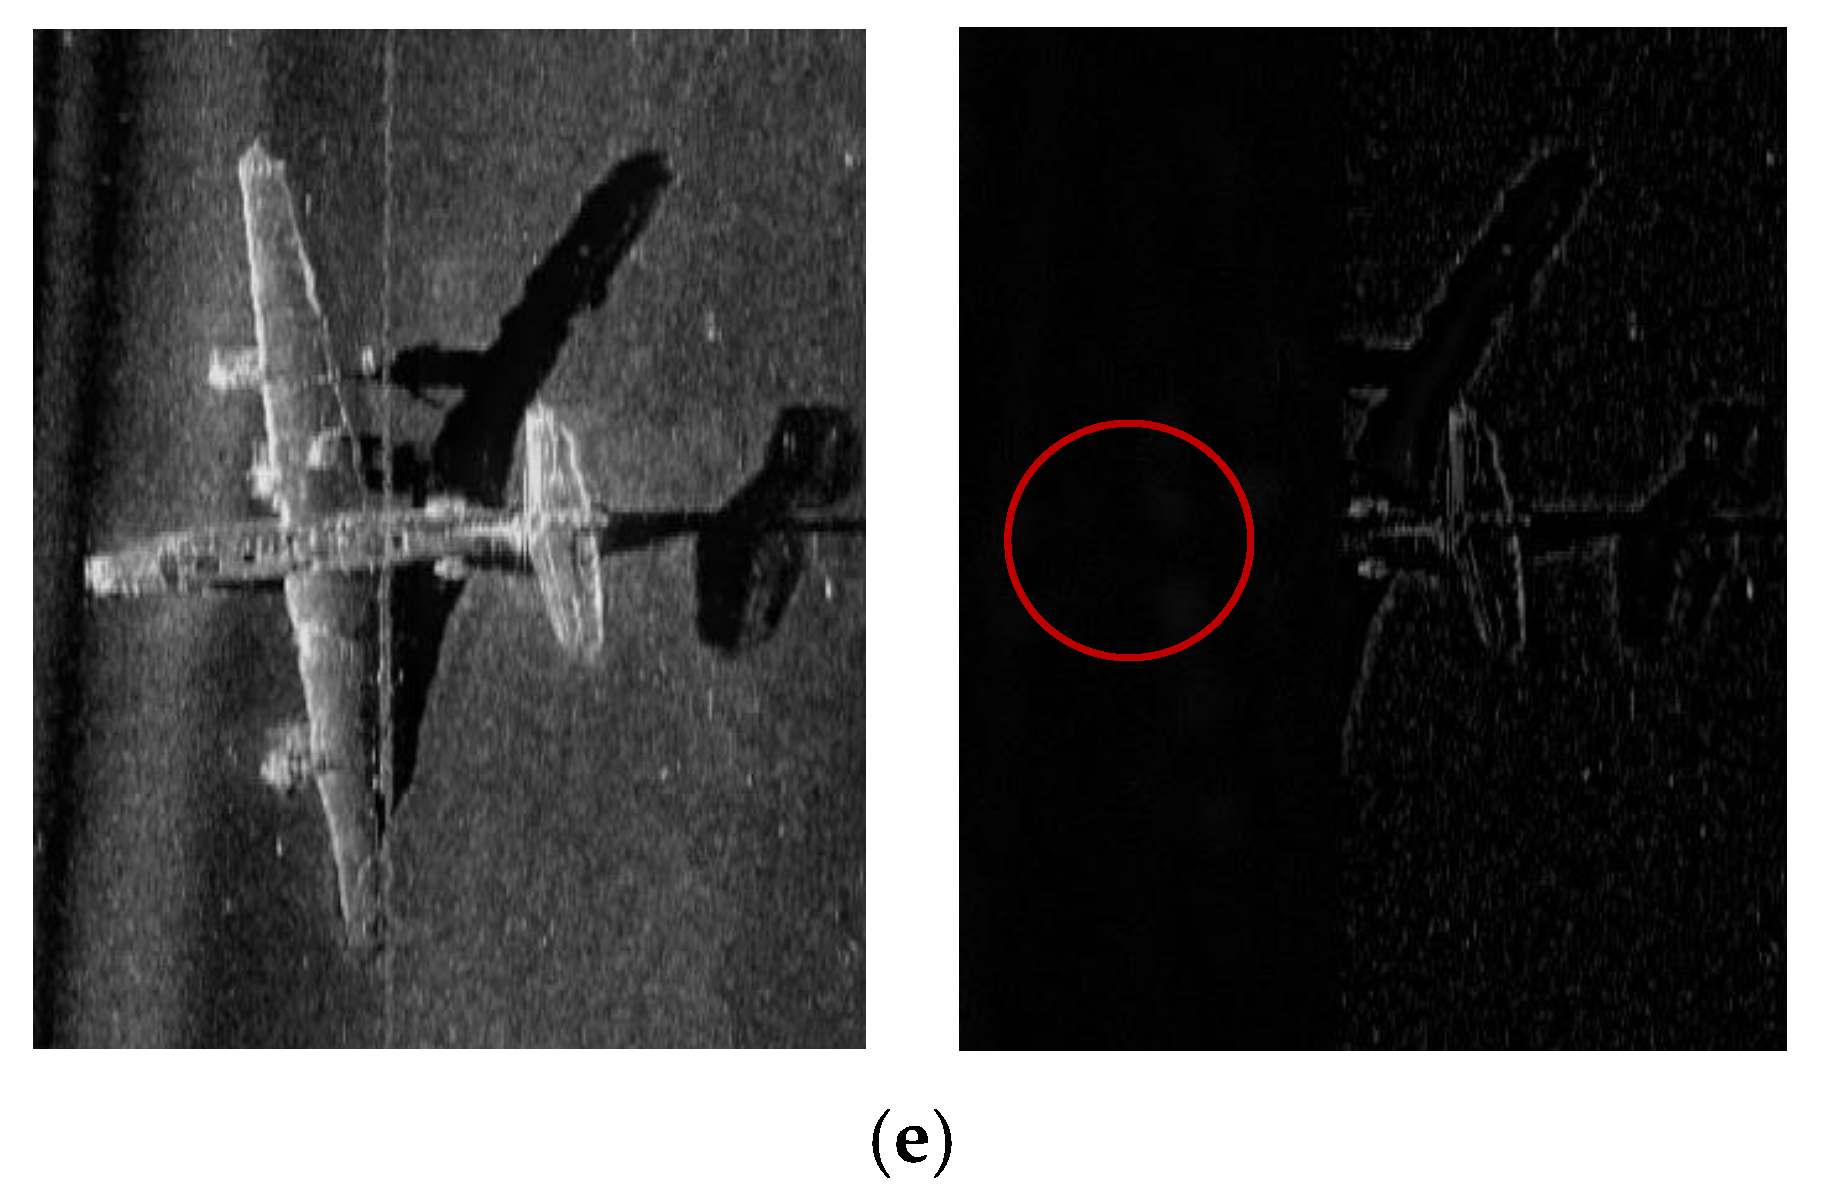
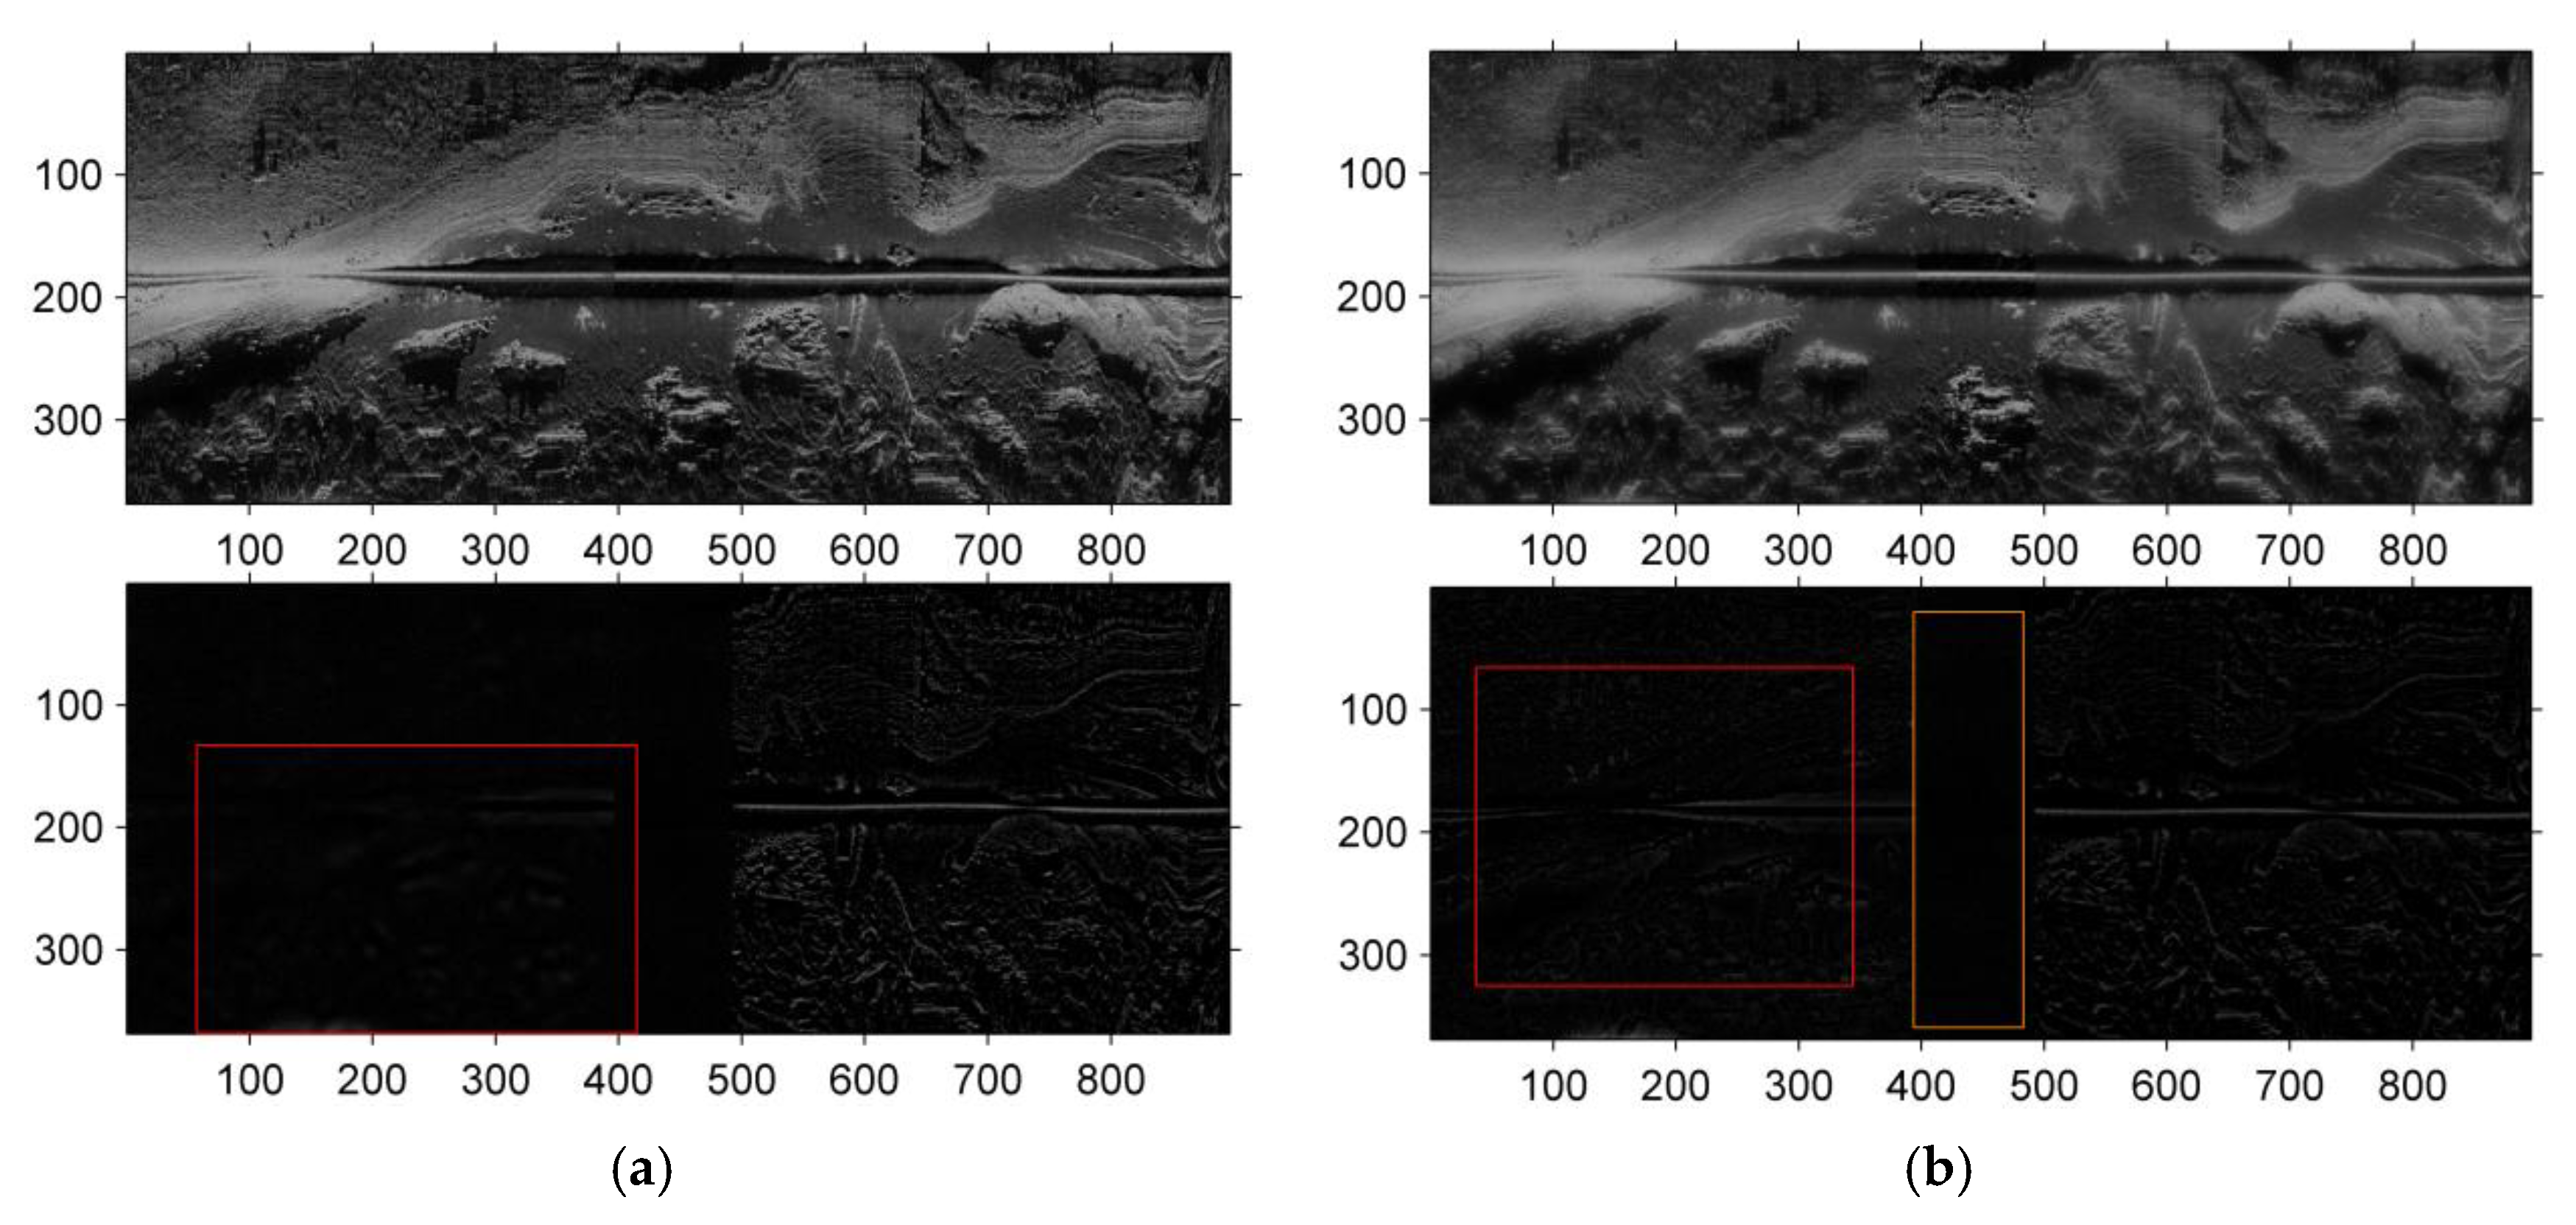
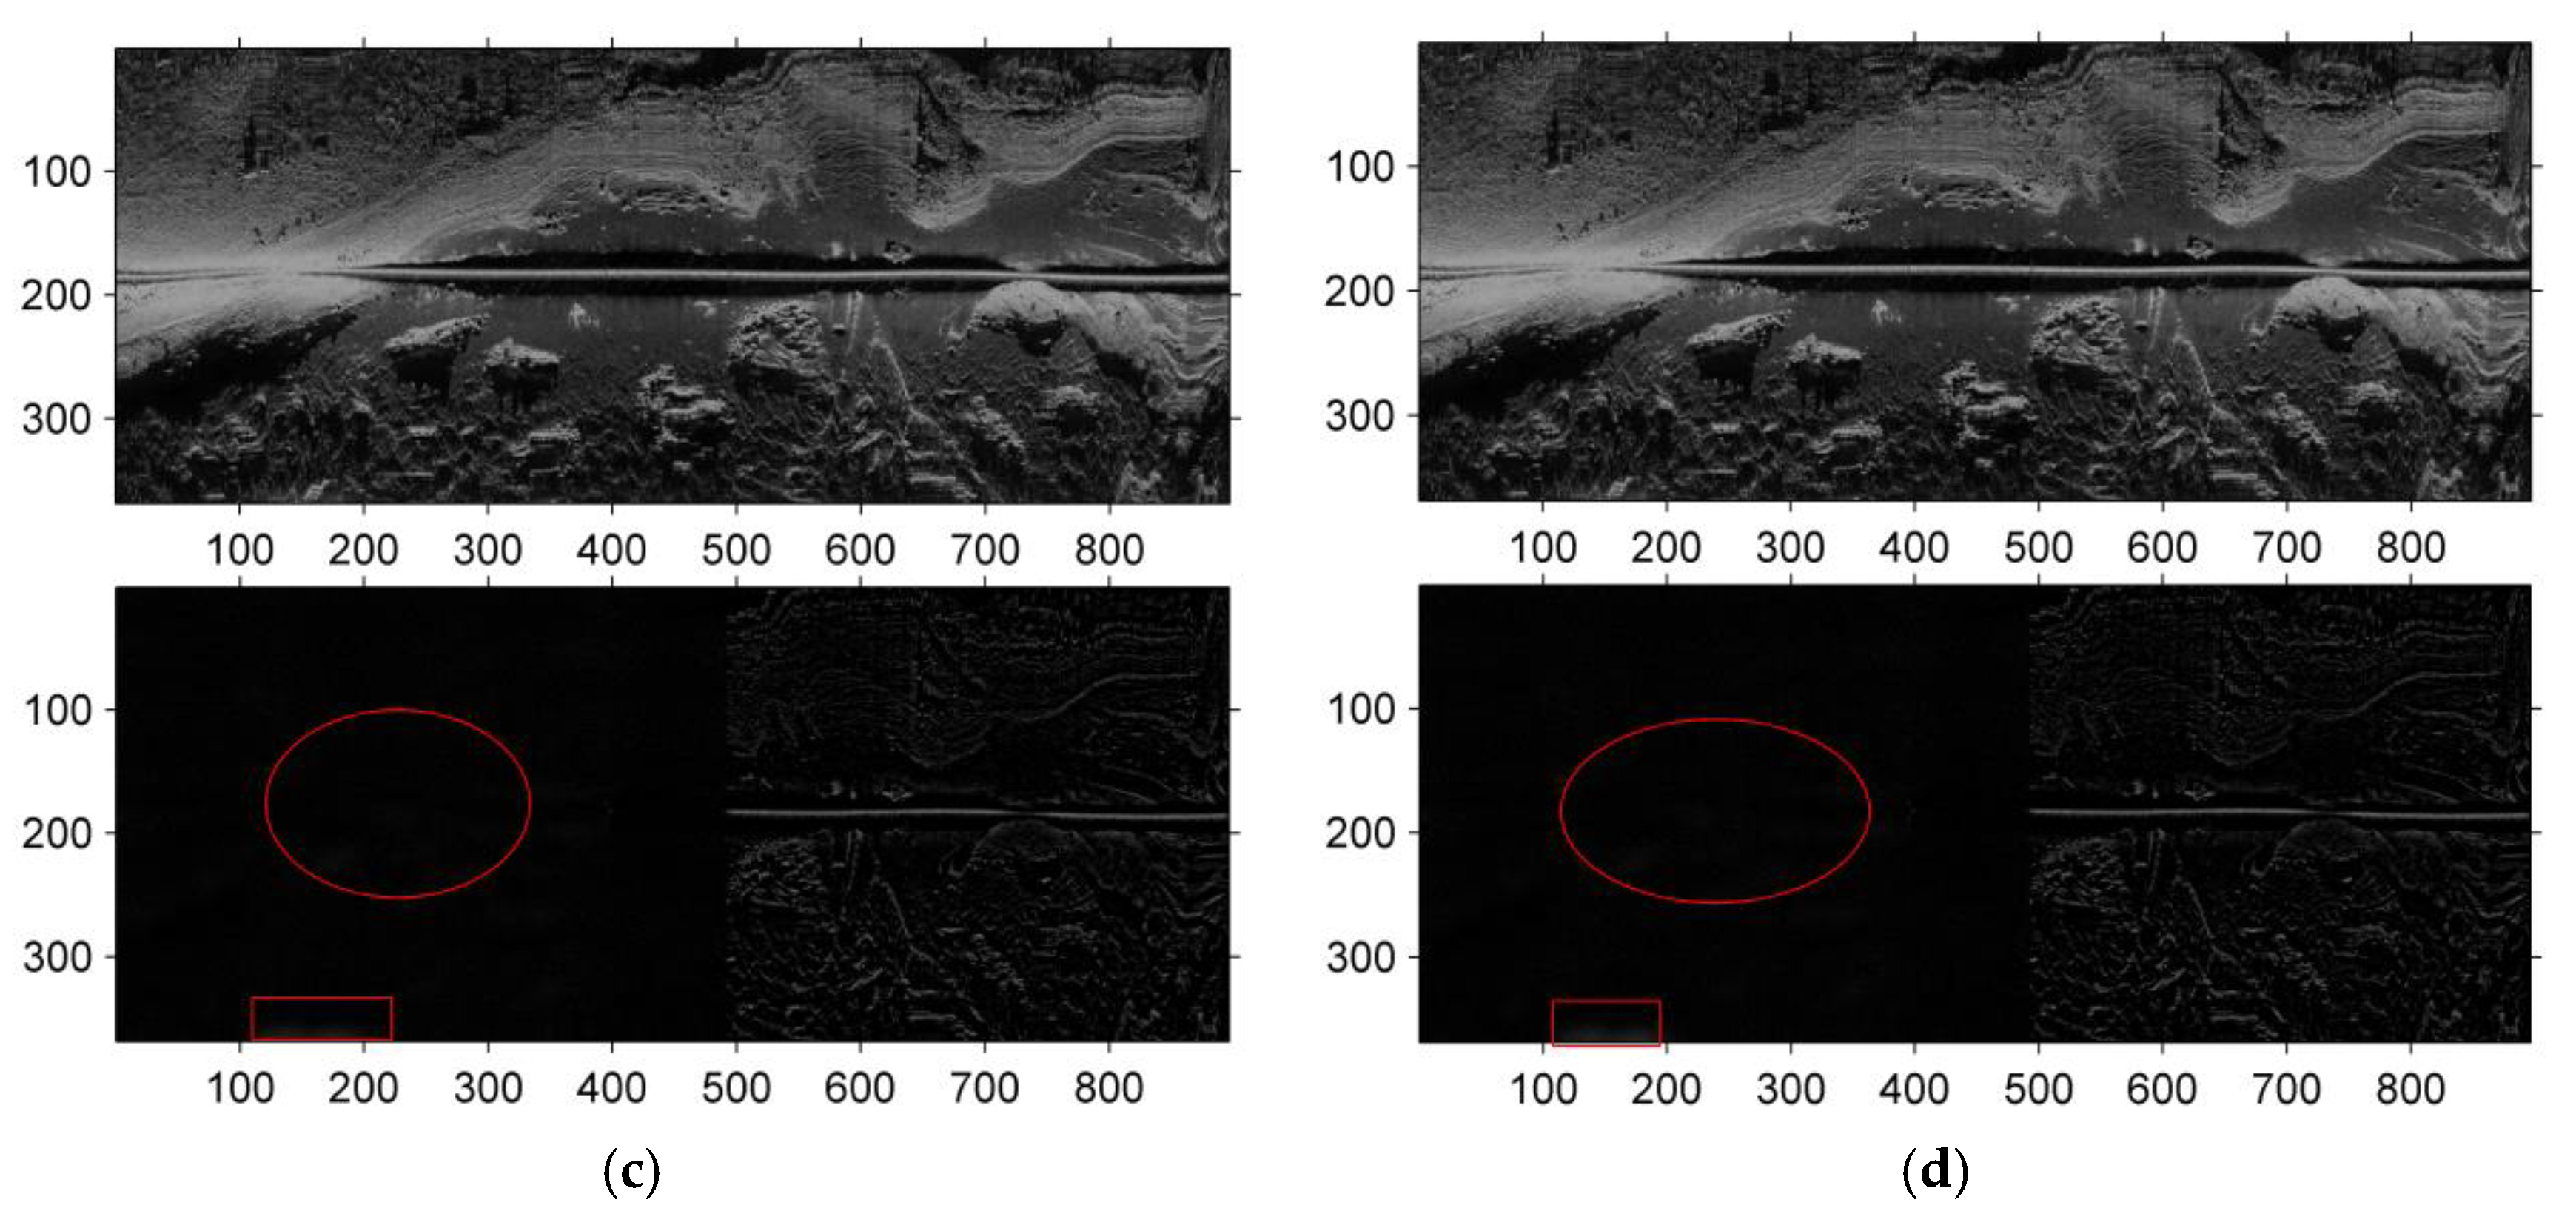
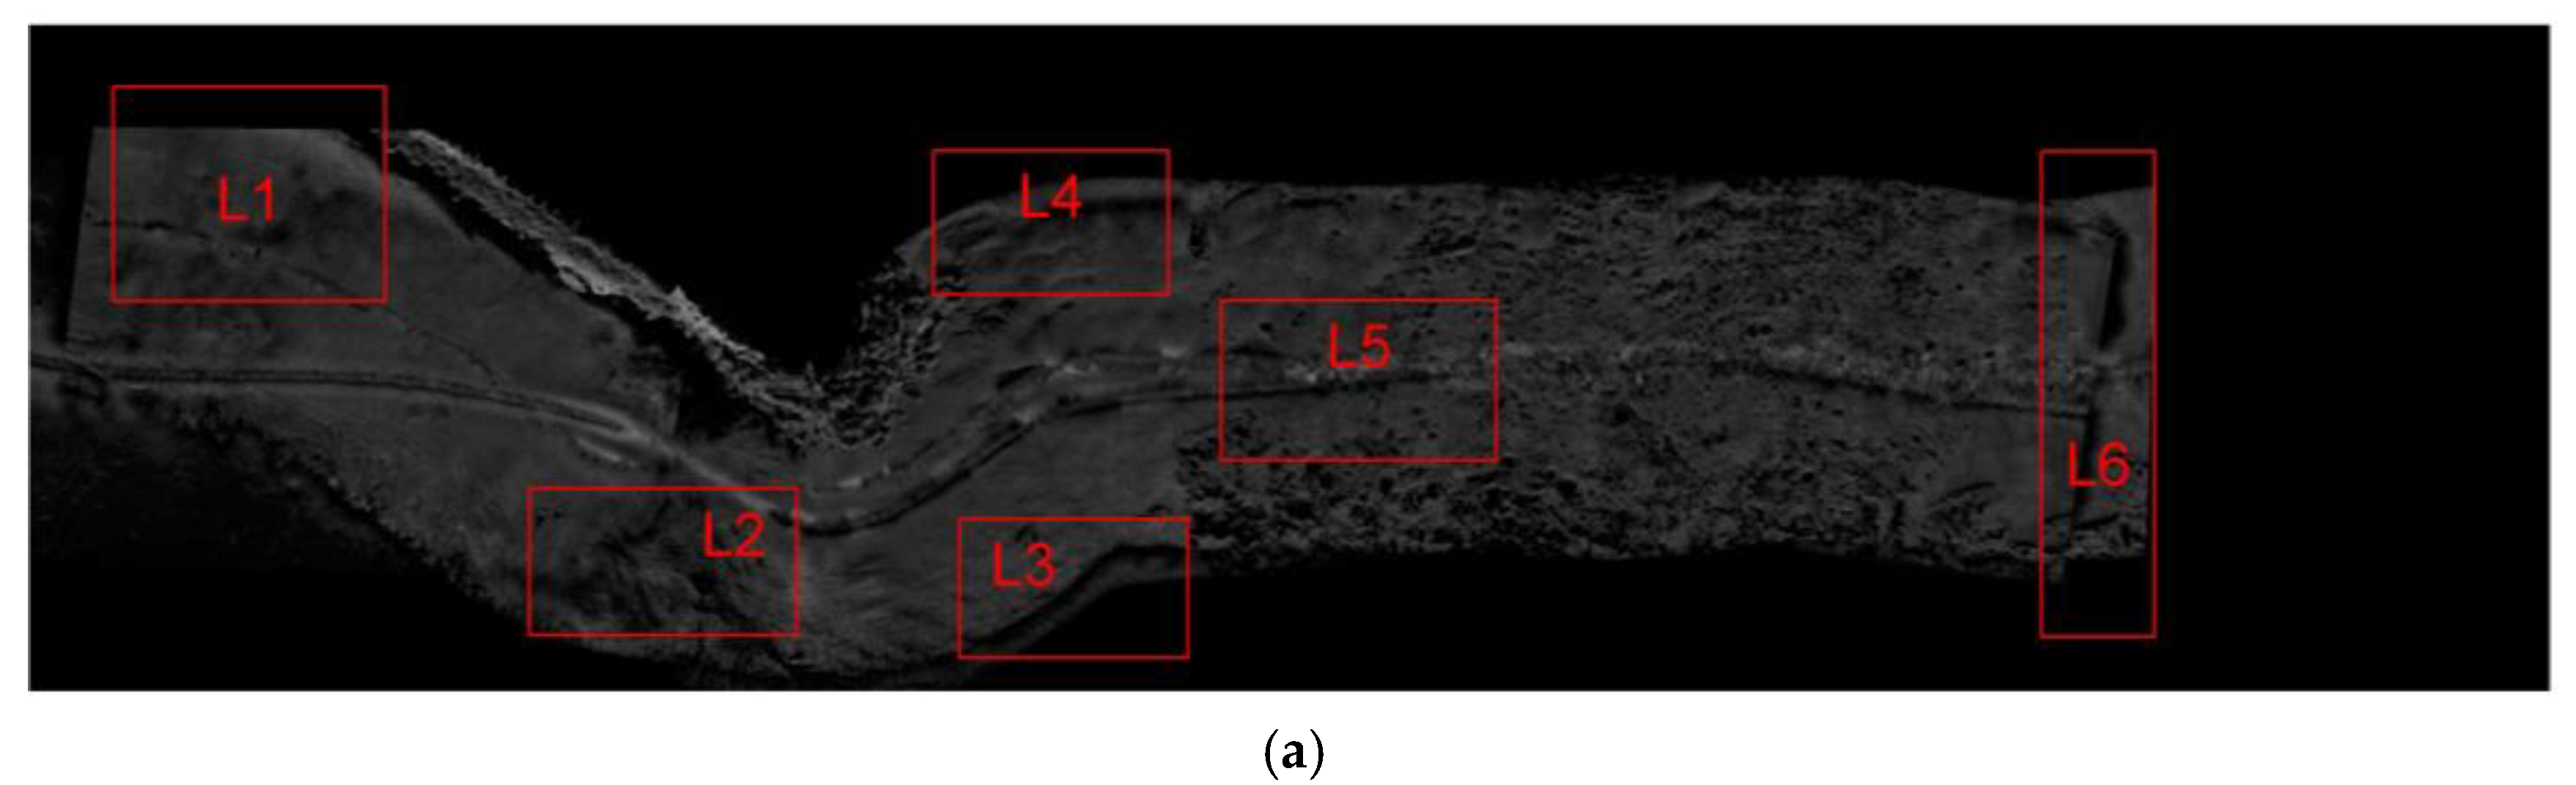
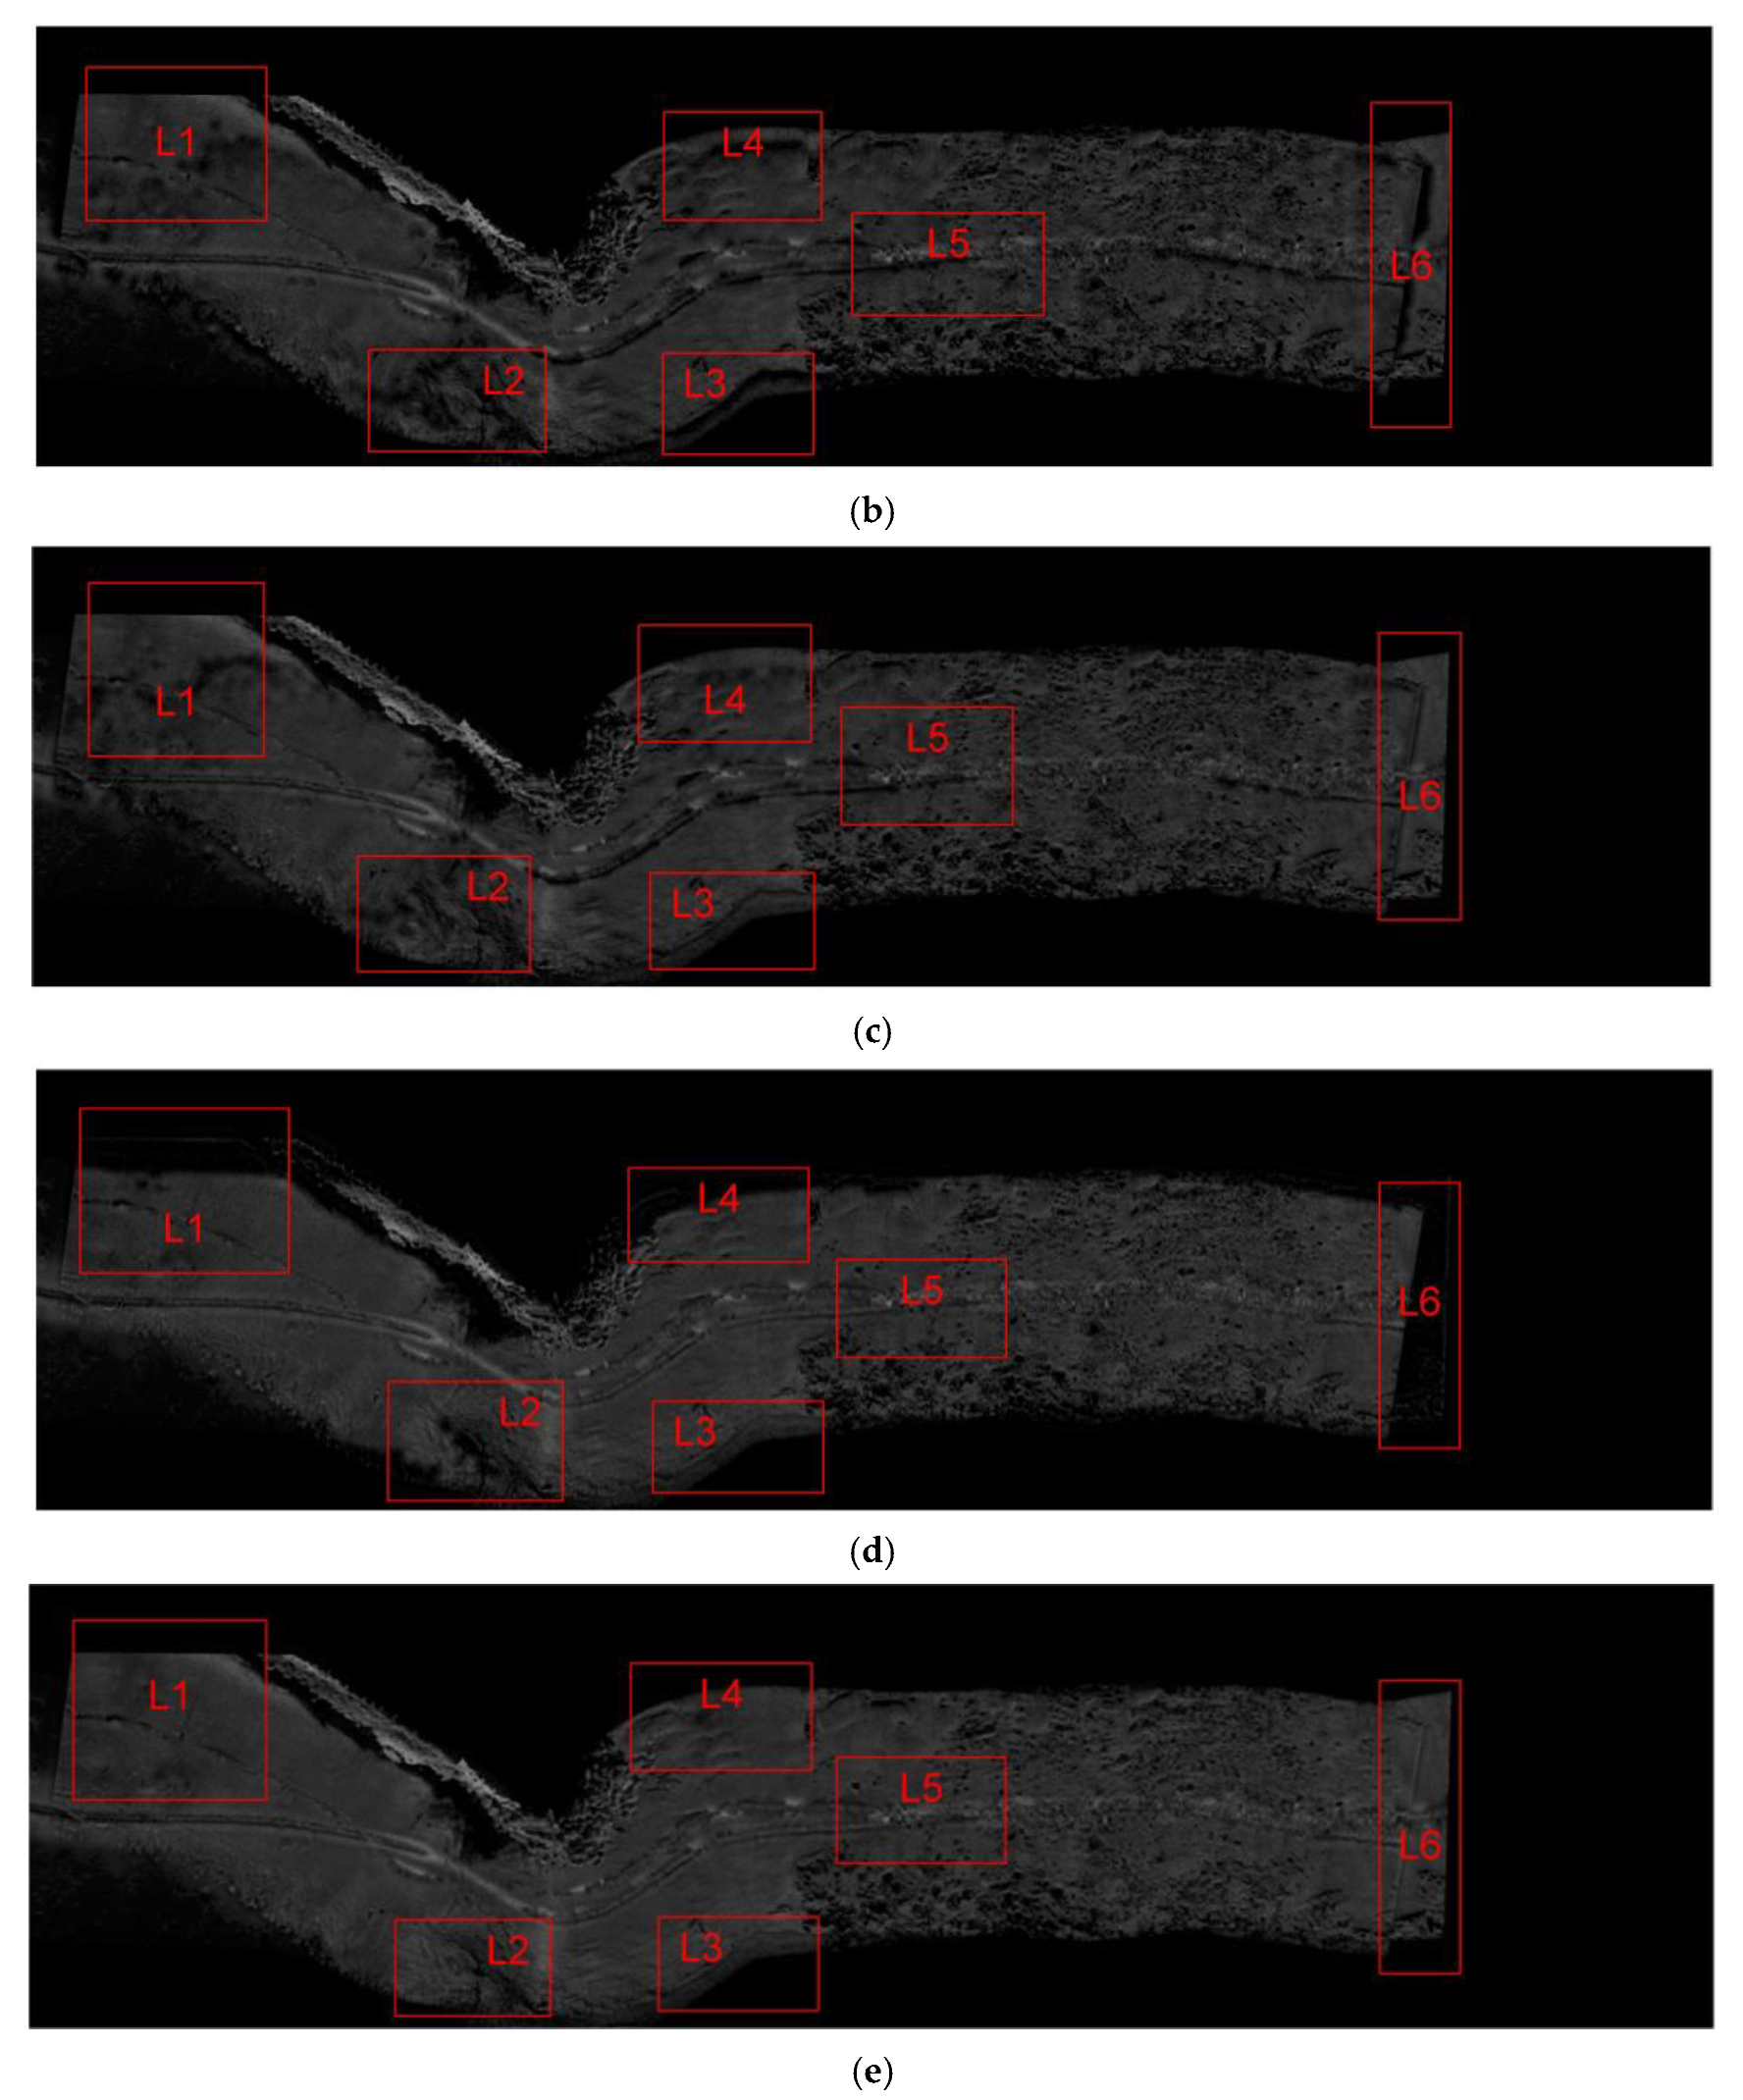
This paper details a method combining SMLF energy and the IDPCNN model for side-scan sonar image fusion in the NSCT domain. Compared with the common fusion criteria, such as mean, STD, SML, and PCNN, the optimal selection of low frequency fusion criteria is analyzed using the aircraft debris data. The experimental results demonstrate that SMLF energy can effectively eliminate the pseudo-contour effect of block flow from the target edge. In addition, in order to analyze the high frequency fusion criteria more comprehensively, experiments are carried out with aircraft debris and rich geomorphic data, and maximum energy, local directional contrast, and PCNN are utilized. It is revealed that the IDPCNN model can extract more detailed feature information from the source image and reduce the ability of misjudgment. Finally, the superiority of combined fusion criterion in the NSCT domain is demonstrated by using the measured sonar data of the port. Multiple areas display that the overall and detailed information processed by the proposed method were effectively integrated, which reflect the complete target contour and rich features of seabed topography fluctuation. In addition, the fused image clearly shows the stitching conversion line left by the image registration. In the future, in order to ensure the image brightness on both sides is the same, the image fusion of eliminating the stitching conversion line is the next topic to be further studied.

Author Contributions

P.Z. and G.C. conceived the model methodology. M.W. helped to build the paper framework. S.C. collected the data. P.Z. and M.W. wrote the initial draft. X.L. and R.S. revised the manuscript. All authors have read and agreed to the published version of the manuscript.

Funding

The project was supported by the National Natural Science Foundation of China under Grant No. 41674015, 41901296.

Acknowledgments

Data 1 is originated from the sonar imagery library of JaWS MARINE. Data 2 is derived from products in Chesapeake Technology’s image library. Data 3 is collected from Edgetech JSF 4125 side-scan sonar data for the 2011 Port Area of Rhode Island, USA. The author thanked Jake Gann of Chesapeake Technology for his help and provision of his company’s processing software for image pre-processing, which made an important contribution to the preliminary experiment.

Conflicts of Interest

The authors declare no conflict of interest.

References

  1. Wilken, D.; Wunderlich, T.; Feldens, P.; Coolen, J.; Preston, J.; Meehler, N. Investigating the Norse Harbour of Igaliku (Southern Greenland) Using an Integrated System of Side-Scan Sonar and High-Resolution Reflection Seismics. Remote Sens. 2019, 11, 1889. [Google Scholar] [CrossRef] [Green Version]
  2. Zhao, J.; Shang, X.; Zhang, H. Side-Scan Sonar Image Mosaic Using Couple Feature Points with Constraint of Track Line Positions. Remote Sens. 2018, 10, 953. [Google Scholar] [CrossRef] [Green Version]
  3. Azimi-Sadjadi, M.R.; Klausner, N.; Kopacz, J. Detection of underwater targets using a subspace-based method with learning. IEEE J. Ocean. Eng. 2017, 42, 869–879. [Google Scholar] [CrossRef]
  4. Kumar, N.; Mitra, U.; Narayanan, S.S. Robust object classification in underwater sidescan sonar images by using reliability-aware fusion of shadow features. IEEE J. Ocean. Eng. 2014, 40, 592–606. [Google Scholar] [CrossRef]
  5. Reed, S.; Ruiz, I.T.; Capus, C.; Petillot, Y. The fusion of large scale classified side-scan sonar image mosaics. IEEE Trans. Image Process. 2006, 15, 2049–2060. [Google Scholar] [CrossRef]
  6. Da Cunha, A.L.; Zhou, J.; Do, M.N. The nonsubsampled Contourlet transform: Theory, design, and applications. IEEE Trans. Image Process. 2006, 15, 3089–3101. [Google Scholar]
  7. Anandhi, D.; Valli, S. An algorithm for multi-sensor image fusion using maximum a posteriori and nonsubsampled contourlet transform. Comput. Electr. Eng. 2018, 65, 139–152. [Google Scholar] [CrossRef]
  8. Zhang, J.; Sohel, F.; Bennamoun, M.; Bian, H.; An, S. NSCT-based fusion method for forward-looking sonar image mosaic. IET Radar Sonar Navig. 2017, 11, 1512–1522. [Google Scholar] [CrossRef] [Green Version]
  9. Liu, Y.; Liu, S.; Wang, Z. A general framework for image fusion based on multi-scale transform and sparse representation. Inf. Fusion. 2015, 24, 147–164. [Google Scholar] [CrossRef]
  10. Li, S.; Kang, X.; Fang, L.; Hu, J.; Yin, H. Pixel-level image fusion: A survey of the state of the art. Inf. Fusion. 2017, 33, 100–112. [Google Scholar] [CrossRef]
  11. Vishwakarma, A.; Bhuyan, M.K.; Iwahori, Y. Non-subsampled shearlet transform-based image fusion using modified weighted saliency and local difference. Multimed. Tools Appl. 2018, 77, 32013–32040. [Google Scholar] [CrossRef]
  12. Yang, B.; Li, S. Multifocus image fusion and restoration with sparse representation. IEEE Trans. Instrum. Meas. 2009, 59, 884–892. [Google Scholar] [CrossRef]
  13. Nejati, M.; Samavi, S.; Shirani, S. Multi-focus image fusion using dictionary-based sparse representation. Inf. Fusion. 2015, 25, 72–84. [Google Scholar] [CrossRef]
  14. Huang, W.; Jing, Z. Evaluation of focus measures in multi-focus image fusion. Pattern Recognit. Lett. 2007, 28, 493–500. [Google Scholar] [CrossRef]
  15. Yang, Y.; Tong, S.; Huang, S.; Lin, P. Multifocus image fusion based on NSCT and focused area detection. IEEE Sens. J. 2014, 15, 2824–2838. [Google Scholar]
  16. Yang, J.; Guo, L.; Yang, H. A new multi-focus image fusion algorithm based on BEMD and improved local energy. IEEJ Trans. Electr. Electron. Eng. 2015, 10, 447–452. [Google Scholar] [CrossRef]
  17. Zhang, Q.; Maldague, X. An adaptive fusion approach for infrared and visible images based on NSCT and compressed sensing. Infrared Phys. Technol. 2016, 74, 11–20. [Google Scholar] [CrossRef]
  18. Adu, J.; Xie, S.; Gan, J. Image fusion based on visual salient features and the cross-contrast. J. Vis. Commun. Image. Represent. 2016, 40, 218–224. [Google Scholar] [CrossRef]
  19. Subashini, M.M.; Sahoo, S.K. Pulse coupled neural networks and its applications. Expert Syst. Appl. 2014, 41, 3965–3974. [Google Scholar] [CrossRef]
  20. Wang, Z.; Ma, Y. Medical image fusion using m-PCNN. Inf. Fusion. 2008, 9, 176–185. [Google Scholar] [CrossRef]
  21. Lang, J.; Hao, Z. Novel image fusion method based on adaptive pulse coupled neural network and discrete multi-parameter fractional random transform. Opt. Lasers Eng. 2014, 52, 91–98. [Google Scholar] [CrossRef]
  22. Yang, Y.; Que, Y.; Huang, S.; Lin, P. Technique for multi-focus image fusion based on fuzzy-adaptive pulse-coupled neural network. Signal Image Video Process. 2017, 11, 439–446. [Google Scholar] [CrossRef]
  23. El-taweel, G.S.; Helmy, A.K. Image fusion scheme based on modified dual pulse coupled neural network. IET Image Process. 2013, 7, 407–414. [Google Scholar] [CrossRef]
  24. Ramlal, S.D.; Sachdeva, J.; Ahuja, C.K.; Khandelwal, N. Multimodal medical image fusion using non-subsampled shearlet transform and pulse coupled neural network incorporated with morphological gradient. Signal Image Video Process. 2018, 12, 1479–1487. [Google Scholar] [CrossRef]
  25. Xiang, T.; Yan, L.; Gao, R. A fusion algorithm for infrared and visible images based on adaptive dual-channel unit-linking PCNN in NSCT domain. Infrared Phys. Technol. 2015, 69, 53–61. [Google Scholar] [CrossRef]
  26. Stolojescu-Crisan, C.; Isar, A. Denoising and inpainting SONAR images. In Proceedings of the 2015 38th International Conference on Telecommunications and Signal Processing, Prague, Czech Republic, 9–11 July 2015; pp. 1–5. [Google Scholar]
  27. De, I.; Chanda, B. Multi-focus image fusion using a morphology-based focus measure in a quad-tree structure. Inf. Fusion. 2013, 14, 136–146. [Google Scholar] [CrossRef]
  28. Cheng, B.; Jin, L.; Li, G. Infrared and visual image fusion using LNSST and an adaptive dual-channel PCNN with triple-linking strength. Neurocomputing 2018, 310, 135–147. [Google Scholar] [CrossRef]
  29. Zhao, J.; Wang, X.; Zhang, H.; Hu, J.; Jian, X. Side scan sonar image segmentation based on neutrosophic set and quantum-behaved particle swarm optimization algorithm. Mar. Geophys. Res. 2016, 37, 229–241. [Google Scholar] [CrossRef]
  30. Wang, B.; Zeng, J.; Lin, S.; Bai, G. Multi-band images synchronous fusion based on NSST and fuzzy logical inference. Infrared Phys. Technol. 2019, 98, 94–107. [Google Scholar] [CrossRef]
  31. Wang, Z.; Wang, S.; Zhu, Y. Multi-focus image fusion based on the improved PCNN and guided filter. Neural Process. Lett. 2017, 45, 75–94. [Google Scholar] [CrossRef]
  32. Zhang, B.; Lu, X.; Jia, W. A multi-focus image fusion algorithm based on an improved dual-channel PCNN in NSCT domain. Optik 2013, 124, 4104–4109. [Google Scholar]
  33. Cheng, B.; Jin, L.; Li, G. A novel fusion framework of visible light and infrared images based on singular value decomposition and adaptive DUAL-PCNN in NSST domain. Infrared Phys. Technol. 2018, 91, 153–163. [Google Scholar] [CrossRef]
  34. Ravi, V.; Pramodh, C. Threshold accepting trained principal component neural network and feature subset selection: Application to bankruptcy prediction in banks. Appl. Soft. Comput. 2008, 8, 1539–1548. [Google Scholar] [CrossRef]
  35. Kong, W.; Zhang, L.; Lei, Y. Novel fusion method for visible light and infrared images based on NSST–SF–PCNN. Infrared Phys. Technol. 2014, 65, 103–112. [Google Scholar] [CrossRef]
  36. Chai, P.; Luo, X.; Zhang, Z. Image fusion using quaternion wavelet transform and multiple features. IEEE Access. 2017, 5, 6724–6734. [Google Scholar] [CrossRef]
  37. Latreche, B.; Saadi, S.; Kious, M.; Benziane, A. A novel hybrid image fusion method based on integer lifting wavelet and discrete cosine transformer for visual sensor networks. Multimed. Tools Appl. 2018, 78, 10865–10887. [Google Scholar] [CrossRef]
  38. Miao, Q.; Shi, C.; Xu, P.F.; Yang, M.; Shi, Y.B. A novel algorithm of image fusion using shearlets. Opt. Commun. 2011, 284, 1540–1547. [Google Scholar] [CrossRef]
  39. Wang, Z.; Bovik, A.C.; Sheikh, H.R.; Simoncelli, E.P. Image quality assessment: From error visibility to structural similarity. IEEE Trans. Image Process. 2004, 13, 600–612. [Google Scholar] [CrossRef] [Green Version]
  40. Piella, G.; Heijmans, H. A new quality metric for image fusion. In Proceedings of the International Conference on Image Processing (Cat. No. 03CH37429), Barcelona, Spain, 14–17 September 2003; pp. 111–173. [Google Scholar]
  41. Tao, W.; Liu, Y. Combined imaging matching method of side scan sonar images with prior position knowledge. IET Image Process. 2018, 12, 194–199. [Google Scholar] [CrossRef]
  42. Yuk, E.H.; Park, S.H.; Park, C.S.; Baek, J.G. Feature-learning-based printed circuit board inspection via speeded-up robust features and random forest. Appl. Sci. 2018, 8, 932. [Google Scholar] [CrossRef] [Green Version]
  43. Dogra, A.; Goyal, B.; Agrawal, S. From multi-scale decomposition to non-multi-scale decomposition methods: A comprehensive survey of image fusion techniques and its applications. IEEE Access. 2017, 5, 16040–16067. [Google Scholar] [CrossRef]
Figure 1. Flowchart of the proposed fusion method. CA/B/F is represented as the low frequency sub-band image. dljA/B/F is denoted as the high frequency sub-band image. The characters in the matrix are representative values of key parameters in the proposed fusion criteria. NSCT, nonsubsampled contourlet transform; NSML, novel sum-modified Laplacian; SMLF, SML energy filtering; DPCNN, dual-channel pulse coupled neural network; RLV, relating sum-modified Laplacian energy with visual contrast value; MCF, multi-channel filters.
Applsci 10 01028 g001
Figure 2. DPCNN model. Multiplication, summation, and difference between two sides are represented by symbols ⊗, ⊕, and ⊝, respectively.
Applsci 10 01028 g002
Figure 3. Improved DPCNN model.
Applsci 10 01028 g003
Figure 4. Aircraft wreckage. (a) Original image. (b) Left region blurred. (c) Right region blurred.
Applsci 10 01028 g004
Figure 5. Oil pipelines. (a) Left region blurred. (b) Right region blurred.
Applsci 10 01028 g005
Figure 6. Overlapping image of underwater port. Purple is the left strip and green is the right strip.
Applsci 10 01028 g006
Figure 7. Low frequency sub-band images with different fusion criteria in Data 1. (a) Mean. (b) Local_STD. (c) PCNN. (d) SML. (e) Energy of Laplacian (EOL) filtering. (f) SMLF.
Applsci 10 01028 g007
Figure 8. Fused image (left) and difference image (right) of Data 1. (a) Energy_Max. (b) Dire_Contrast_Max. (c) PCNN (NSML). (d) Improved DPCNN (IDPCNN) (modified spatial frequency (MSF)). (e) IDPCNN (NSML).
Applsci 10 01028 g008aApplsci 10 01028 g008b
Figure 9. Fused image (top) and difference image (bottom) of Data 2. (a) Energy_Max. (b) Dire _Contrast_Max. (c) IPCNN (MSF). (d) IDPCNN (NSML).
Applsci 10 01028 g009aApplsci 10 01028 g009b
Figure 10. Fused image information of overlapping areas between adjacent strips. (a) Criterion 1. (b) Criterion 2. (c) Criterion 3. (d) Criterion 4. (e) Proposed criterion 5.
Applsci 10 01028 g010aApplsci 10 01028 g010b
Table 1. Objective index and mathematical description of the fused image. AG, average gradient; RCE, root mean square cross entropy; FD, figure definition; E, information entropy; MI, mutual information; QAB/F, edge-based similarity measure; SSIM, structural similarity index.
Objective IndexesMathematical Formulation
AG A G = 1 M × N i = 1 M j = 1 N ( | f ( x , y ) f ( x 1 , y ) | 2 + | f ( x , y ) f ( x , y 1 ) | 2 ) / 2
FD F D = 1 M × N x = 1 M y = 1 N ( | f ( x + 1 , y ) f ( x , y ) | 2 + | f ( x , y + 1 ) f ( x , y ) | 2 ) / 2
E E = - i = 0 L 1 p i log 2 p i
RCE R C E = ( C E A , F 2 + C E B , F 2 ) / 2 , C E A / B , F = i = 0 L 1 p A / B ( i ) log 2 p A / B ( i ) p F ( i )
MI M I = ( a , b ) : f p ( A , B ) : F ( f , ( a , b ) ) log 2 p ( A , B ) : F ( f , ( a , b ) ) p F ( f ) · p ( A , B ) ( a , b )
QAB/F Q A B / F = m , n ( Q m , n A F w m , n A + Q m , n B F w m , n B ) m , n ( w m , n A + w m , n B )
SSIM S S I M ( A , B , F ) = ( S S I M ( A , F ) + S S I M ( B , F ) ) / 2 S S I M ( A / B , F ) = ( 2 μ A / B μ F + C 1 ) ( 2 σ A / B , F + C 2 ) ( μ A / B 2 + μ F 2 + C 1 ) ( μ A / B 2 + μ F 2 + C 2 )
Table 2. Parameter description of low frequency fusion criteria. NSML, novel sum-modified Laplacian; SMLF, SML energy filtering; PCNN, pulse coupled neural network; EOL, energy of Laplacian; RLV, relating sum-modified Laplacian energy with visual contrast value; GF, guided filter; CV, consistency verification.
CriterionParameter Description
MeanAverage process
Local_STDMaximum value of local standard deviation
PCNNTij: soft limiting function. βij: average gradient. Sij: NSML
SMLMaximum of SML value
EOL FilteringGuidance map: EOL. Edge detection: GF. Source consistency: CV.
SMLFGuidance map: RLV. Edge detection: GF. Source consistency: CV.
Table 3. Objective evaluation indexes of the fused aircraft debris image (Data 1).
CriterionEnergy_MaxDire_Contrast_MaxPCNN (NSML)IDPCNN (MSF)IDPCNN (NSML)
AG6.66223.96576.70276.70256.7031
E6.92636.82916.92616.92616.9263
RCE0.08950.05270.08250.08220.0822
FD9.50845.31259.53649.53669.5373
QAB/F0.63620.41340.64140.64170.6417
IFQI 10.77320.37690.78340.78260.7834
WFQI 20.90920.50740.92420.92470.9247
EFQI 30.45450.37930.47560.47930.4813
1 IFQI denotes as the overall similarity with source image. 2 WFQI denotes as local regional significance. 3 EFQI is described as edge image similarity. MSF, modified spatial frequency. The parameter settings of following categories are similar, and they are not repeated for comment.
Table 4. Objective evaluation indexes of the rich terrain fused image (Data 2).
CriterionEnergy_MaxDire_Contrast_MaxPCNN (NSML)IDPCNN (MSF)IDPCNN (NSML)
AG9.79835.62679.85739.85659.8580
E7.07766.96637.08357.08357.0836
RCE0.04090.04290.04380.04410.0439
FD13.31847.307813.359613.358213.3608
QAB/F0.67830.40310.68140.68170.6818
IFQI0.73610.35850.74700.74740.7474
WFQI0.88940.46040.90030.90030.9004
EFQI0.04090.04290.04380.04410.0439
Table 5. Combination method of low and high frequency fusion criteria.
Fusion TechniqueLow FrequencyHigh Frequency
Technique 1IDPCNN (NSML)IDPCNN (NSML)
Technique 2EOL FilteringIDPCNN (MSF)
Technique 3EOL FilteringIDPCNN (NSML)
Technique 4SMLFIDPCNN (MSF)
Proposed Technique 5SMLFIDPCNN (NSML)
Table 6. Objective evaluation indexes of fused underwater port image.
IndexesTechnique 1Technique 2Technique 3Technique 4Proposed Technique 5
AG1.30411.30361.30451.23421.3042
E3.95773.96264.05993.93464.0776
FD1.46261.46141.46671.38941.4708
RCE0.06410.06410.07300.10970.1290
MI1.55941.56311.62431.52811.6661
QAB/F0.42720.42590.42850.39220.4302
SSIM0.84090.83900.83970.83130.8624
IFQI0.19670.20010.20070.16060.2027
WFQI0.60590.61000.62690.45350.5781
EFQI0.27650.27600.27900.26490.2862

