Performance Analysis of the Supercritical Carbon Dioxide Re-compression Brayton Cycle


School of Mechanical Engineering & IEDT, Kyungpook National University, Daegu 41566, Korea
*
Author to whom correspondence should be addressed.
†
Present Address: Mechanical Engineering Department, Khalifa University of Science and Technology, SAN Campus, P.O. Box 2533, Abu Dhabi, UAE.
Appl. Sci. 2020, 10(3), 1129; https://0-doi-org.brum.beds.ac.uk/10.3390/app10031129
Submission received: 30 December 2019
/
Revised: 4 February 2020
/
Accepted: 5 February 2020
/
Published: 7 February 2020
(This article belongs to the Special Issue Recent Advancement of Thermal Fluid Engineering in the Supercritical CO2 Power Cycle)
Abstract
:This paper presents performance analysis results on supercritical carbon dioxide () re-compression Brayton cycle. Monthly exergy destruction analysis was conducted to find the effects of different ambient and water temperatures on the performance of the system. The results reveal that the gas cooler is the major source of exergy destruction in the system. The total exergy destruction has the lowest value of when the compressor inlet temperature is near the critical point (at °C) and the compressor outlet pressure is comparatively low (). The optimum mass fraction (x) and efficiency of the cycle increase with turbine inlet temperature. The highest efficiency of 49% is obtained at the mass fraction of x = 0.74 and turbine inlet temperature of 700 °C. For predicting the cost of the system, the total heat transfer area coefficient () and size parameter (SP) are used. The value has the maximum for the split mass fraction of 0.74 corresponding to the maximum value of thermal efficiency. The SP value for the turbine is 0.212 dm at the turbine inlet temperature of 700 °C and it increases with increasing turbine inlet temperature. However the SP values of the main compressor and re-compressor increase with increasing compressor inlet temperature.
1. Introduction
The main cause of pollution is the combustion of fossil fuels to create energy for heavy industrialization and urbanization. Fossil fuel reserves are diminishing due to this process; thus, a big demand for power generation from green energy sources at high efficiency has been created. Global warming is another big concern, as has been pointed out by the United Nations Framework Convention on Climate Change (UNFCC). The proposal from the conference was to undertake efforts so that the rise in global average temperature increase could be limited to well below 2 °C above preindustrial levels. Due to the use of fossil fuels and harmful working fluids, significantly harmful effects on the environment are causing problems such as global warming and acid rain. The effects of pollution tend to bring unpredictable changes in the global climate, as has been asserted by the Intergovernmental Panel on Climate Change (IPCC), and rising sea levels are making large parts of the Earth uninhabitable [1]. Thus, green sources of energy are the need of the hour to solve these issues, which has led to research being conducted on different forms of green energy, such as biogas [2,3], geothermal energy [4,5], energy from human excreta [6] and solar energy [7]. In order to cope with the aforementioned global climate challenges, carbon dioxide ()-based power systems present an environmentally friendly option and are capable of providing power at high efficiency.
The Rankine cycle and the air-standard Brayton cycle are well-known thermodynamic cycles. The benefit of the Rankine cycle is that high efficiency can be achieved because the pump consumes a very small amount of work, since compression is carried out when the working fluid is in the liquid state [8]. The advantage of the Brayton cycle is that the turbine inlet temperature is high; thus, it can achieve high efficiency, but the disadvantage is that the work consumed by the compressor is very large. Due to this, the air-standard Brayton cycle’s efficiency is not significantly higher than that of the steam-based Rankine cycle. The primary advantage of the supercritical () Brayton cycle is that the positive points of the steam-based Rankine cycle and air-standard Brayton cycle are both combined. The turbine inlet temperature in the Brayton cycle is high. Moreover, since the compressor operates near the critical point at very high pressure at which the density is significantly high and the compressibility factor is small, the work that is consumed by the compressor is significantly low. The Brayton cycle operates above the critical point, so the need for condensing the system is removed and the system has a simple layout. Since the re-compression Brayton cycle has very high operating pressures compared to the steam-based Rankine cycle, the size of the -based power system’s components is considerably smaller [9].
Currently, extensive research is being conducted on -based power systems, and the Brayton cycle can be found in a variety of arrangements in the literature, such as in reheated and intercooled re-compression layouts [10]. Crespi et al. [11] reviewed the different single and combined layouts of Brayton cycle power systems with efficiencies of 40%–50% and 50%–60%, respectively, while Saeed and Kim [8] analyzed a re-compression Brayton cycle power system with an integrated turbine design and optimization algorithm. In their study, they proposed that the cycle performs best when the inlet temperature of the compressor is set near the critical temperature (i.e., °C) and the compressor inlet pressure is set slightly above the critical pressure (i.e., 7.8–8.1 MPa) along with a moderate pressure ratio (i.e., 2.9–3.1). Saeed et al. [12] carried out a design optimization and performance analysis of the re-compression Brayton cycle. They developed detailed mathematical models of the cycle components and simulation codes for the turbine, compressor and heat exchanger. These codes were used to analyze the performance of the cycle under the design conditions as well as off-design conditions.
To analyze the performances of thermal power systems, researchers have used different performance parameters, including thermal efficiency (ηth) and exergy efficiency (ηex). Moreover, to indicate the cost and size of the thermodynamic system, parameters such as the total heat transfer area coefficient (UATotal) and size parameter (SPTotal) have also been used to indicate the heat exchanger and turbomachinery sizes, respectively [13,14,15]. Patel et al. [16] studied the optimization of a waste-heat-based organic Rankine cycle (ORC)-powered cascaded vapor compression-absorption refrigeration system. They used the log mean temperature difference (LMTD) to determine the UA value of each heat exchanger in the system. The purpose was to minimize the UA value in order to minimize the area required for heat exchange, and thus minimize the cost of the heat exchangers in the system.
This paper presents the various benefits of power systems. A detailed investigation has been conducted for the performance of the system with regard to key performance parameters such as UA and size parameter (SP) of the turbomachinery. The system analysis also has been performed on the basis of the changing ambient temperature () and water temperature () values to signify how the system’s exergetic performance changed on a monthly basis. To the author’s best knowledge, monthly/seasonal analysis using for -based power systems are not available in the literature. Moreover, the performance of the system at different turbine inlet temperatures (), compressor inlet temperatures () and compressor outlet pressures () is also presented to signify the effect of each variable on various performance parameters of the system, and to indicate which values are best for use as the cycle’s design points.
2. Methodology
2.1. Cycle Processes
Figure 1 shows a cycle layout and temperature-entropy (T-s) diagram of the system considered in the study. As shown in Figure 1a, the system consists of a turbine, a primary heat exchanger, high and low-temperature recuperators, the main compressor, a re-compression compressor and a gas cooler. In comparison with the recuperated cycle, the re-compression Brayton cycle includes an added intermediate compressor, an additional recuperator and split/mixing flow values. A fraction of mass is taken from the mainstream and fed to the re-compression compressor bypassing the low-temperature recuperator (LTR). This fraction of flow enters the mainstream again increases its temperature before entering into the high-temperature recuperator (HTR). This arrangement in turns increases the thermal efficiency of the cycle (42% to 50% for cycles operating with the lowest and highest temperatures, °C and °C respectively [10]) by reducing heat rejection in the pre-cooler.
The stream exiting the re-compressor in State 5 and the stream exiting the recuperator in State 3 are combined in State 4. This stream then passes the HTR where its temperature further increases to State 6. After this, the heat addition process takes place at the main heat exchanger and the stream reaches T7 in State 7. In the turbine, the expansion process takes place until State 8. From State 8 to State 9, the HTR recuperates heat, and then, from State 9 to State 10, the LTR recuperates heat. After this, cooling takes place in the gas-cooler in State Point 1. The gas cooling process from State 10 to State 1 is used to transfer heat to the coolant (water) which is input to the gas cooler at the monthly temperature value (see Figure 2) and has to be heated to 40 °C for domestic uses, such as floor heating.
2.2. Design Parameters
2.3. Energy and Exergy Analysis
To simplify the analysis, the following assumptions are made:
- Pressure drops in the heat exchangers and pipes are neglected.
- Steady-state operation is assumed for all the devices in the system.
- Heat loss from the components is negligible.
The following set of governing equations represent the energy analysis for the cycle:
Thermal efficiency ( is a parameter that takes into account how much of the energy input from the heat source is converted into the net shaft work by the turbine, but it does not reflect the irreversibilities that are involved in the re-compression Brayton cycle. The exergy analysis of the system is significantly useful, since energy is conserved but exergy is destroyed by the irreversibility [20]. The second law (exergy) efficiency of the system is an indicator of the maximum theoretical work that can be generated as the system is brought to equilibrium with the environment.
The specific exergy of flow at any state in the system is given by
By applying exergy balance over each component, the exergy destruction in the different components of the system can be defined as follows.
Primary heat exchanger:
where ms is the mass flow rate of the heat transfer fluid.
Main compressor:
Re-compressor:
Gas cooler:
Turbine:
High-temperature recuperator:
Low-temperature recuperator:
The total exergy destruction in the system is given by
The heat rejection from the system in the gas cooling process, which can be utilized for district heating purposes, is determined from the following equation:
By balancing the exergy throughout the whole system, the exergy input to the system is
The exergy efficiency of the system is given by
The total irreversibility ratio (IR) of the system can be written as
2.4. Total Heat Transfer Area Coefficient and Total Size Parameter Value (SPTotal)
UATotal and SPTotal are useful parameters for estimating the cost of the system. UATotal indicates the total area required for the heat exchangers in the re-compression Brayton cycle, and thus the cost associated with the investment and maintenance of the heat exchangers. The hypothesis is that differences between the heat transfer coefficients in the cycle heat exchangers are not significant. The total heat transfer area in the heat exchangers increases as a result of increasing UATotal, thereby increasing the investment and maintenance costs of the heat exchangers, and thus the system [21]. A smaller value of UATotal is desirable for a cost-effective design.
For a heat exchanger in general, we have
where ΔTM is logarithmic mean temperature difference and ΔTmax and ΔTmin are the maximum and minimum temperature differences, respectively, at the two ends of the heat exchanger. However, in the case of supercritical carbon dioxide Brayton cycle (-BC), properties of the working fluid change swiftly, and the definition of the ΔTM is not applicable in this case. In order to cope with the situation, the length of the heat exchanger was divided into N number of segments. The length of each segment was kept small enough that the variation within a particular small segment can be ignored, as shown in Figure 3. The value of the number of segments (N) depends upon the operation region of the heat exchanger. For the pre-cooler and LTR, the numbers of segments will be large, as these two heat exchangers operate close to the critical point, and properties of change at high rates. For HTR, in contract with LTR and pre-cooler, but operating away from the critical point where variation in the properties is small, a lesser number of segments would be required. Further details on the model can be found in the previous studies [8,12,22,23].
Based on the discretized model definition of the logarithmic mean temperature difference , the segment is given by the Equation (23)
Thus, UA value through the segment could be computed as given by the following equation.
And UA value associated with the whole heat exchanger can be calculated using the following relation.
Later, combining the UA values for the system, we obtain
SP indicates the size of the turbomachinery in the system, and a high SPTotal means comparatively large sizes of the turbine and compressors. Consequently, the investment and maintenance costs of the turbomachinery will increase, which, in turn, will increase the total cost of the system. Because of this, a small SPTotal is desirable.
Macchi and Perdichizzi [14] used the turbine SP to determine the expander size, which for the re-compression Brayton cycle, is given by
where V8s is the isentropic value of the volume flow rate of the working fluid at the turbine exit, and is the isentropic specific enthalpy drop.
The main compressor and re-compression compressor SP values can be respectively defined as
For the system under study,
Hence,
2.5. Properties of
The selection of the working fluid has an important role in optimizing the performance of the system. Efficiency, cost and environmental aspects are key performance metrics that need to be considered before selecting a working fluid. Amongst the desired characteristics are an ozone depletion potential (ODP) of 0 and a low global warming potential (GWP) value. Table 2 lists the properties of , which is the working fluid used for the system in the study. Moreover, is a non-toxic, cheap and easily available substance. A point of interest is that has a critical temperature that is very close to the ambient temperature; thus, it is relatively easy for it to be used in the supercritical state, and it can be matched to a number of power cycles. The properties of show large variations near their critical points, which is highly advantageous for the compression process. With a small increase in temperature, the energy of the fluid increases significantly during the compression process, thereby making it highly efficient [10].
3. Results and Discussion
3.1. Thermal Efficiency (ηth)
Figure 4 shows thermal efficiency, ηth of the system. As expected, the increment of T7 increases the efficiency of the system, meaning that more power output can be derived for the same heat input. The optimal value for the split mass fraction (x) is the one for which the thermal efficiency shows the maximum value for each T7 case. Moreover, as T7 increases, the optimal value of x slightly shifts to the right. The best efficiency is at x = 0.74 and T7 = 700 °C.
3.2. Exergy Efficiency (ηex) and Irreversibility Ratio (IR)
Figure 5 presents the IR and the ηex values for the T7 of 700 °C. The optimal value for x is the one for which ηex shows the maximum value. The IR is the minimum, and at the same time, ηex is the maximum at x = 0.74.
3.3. Exergy Destruction in Different Components
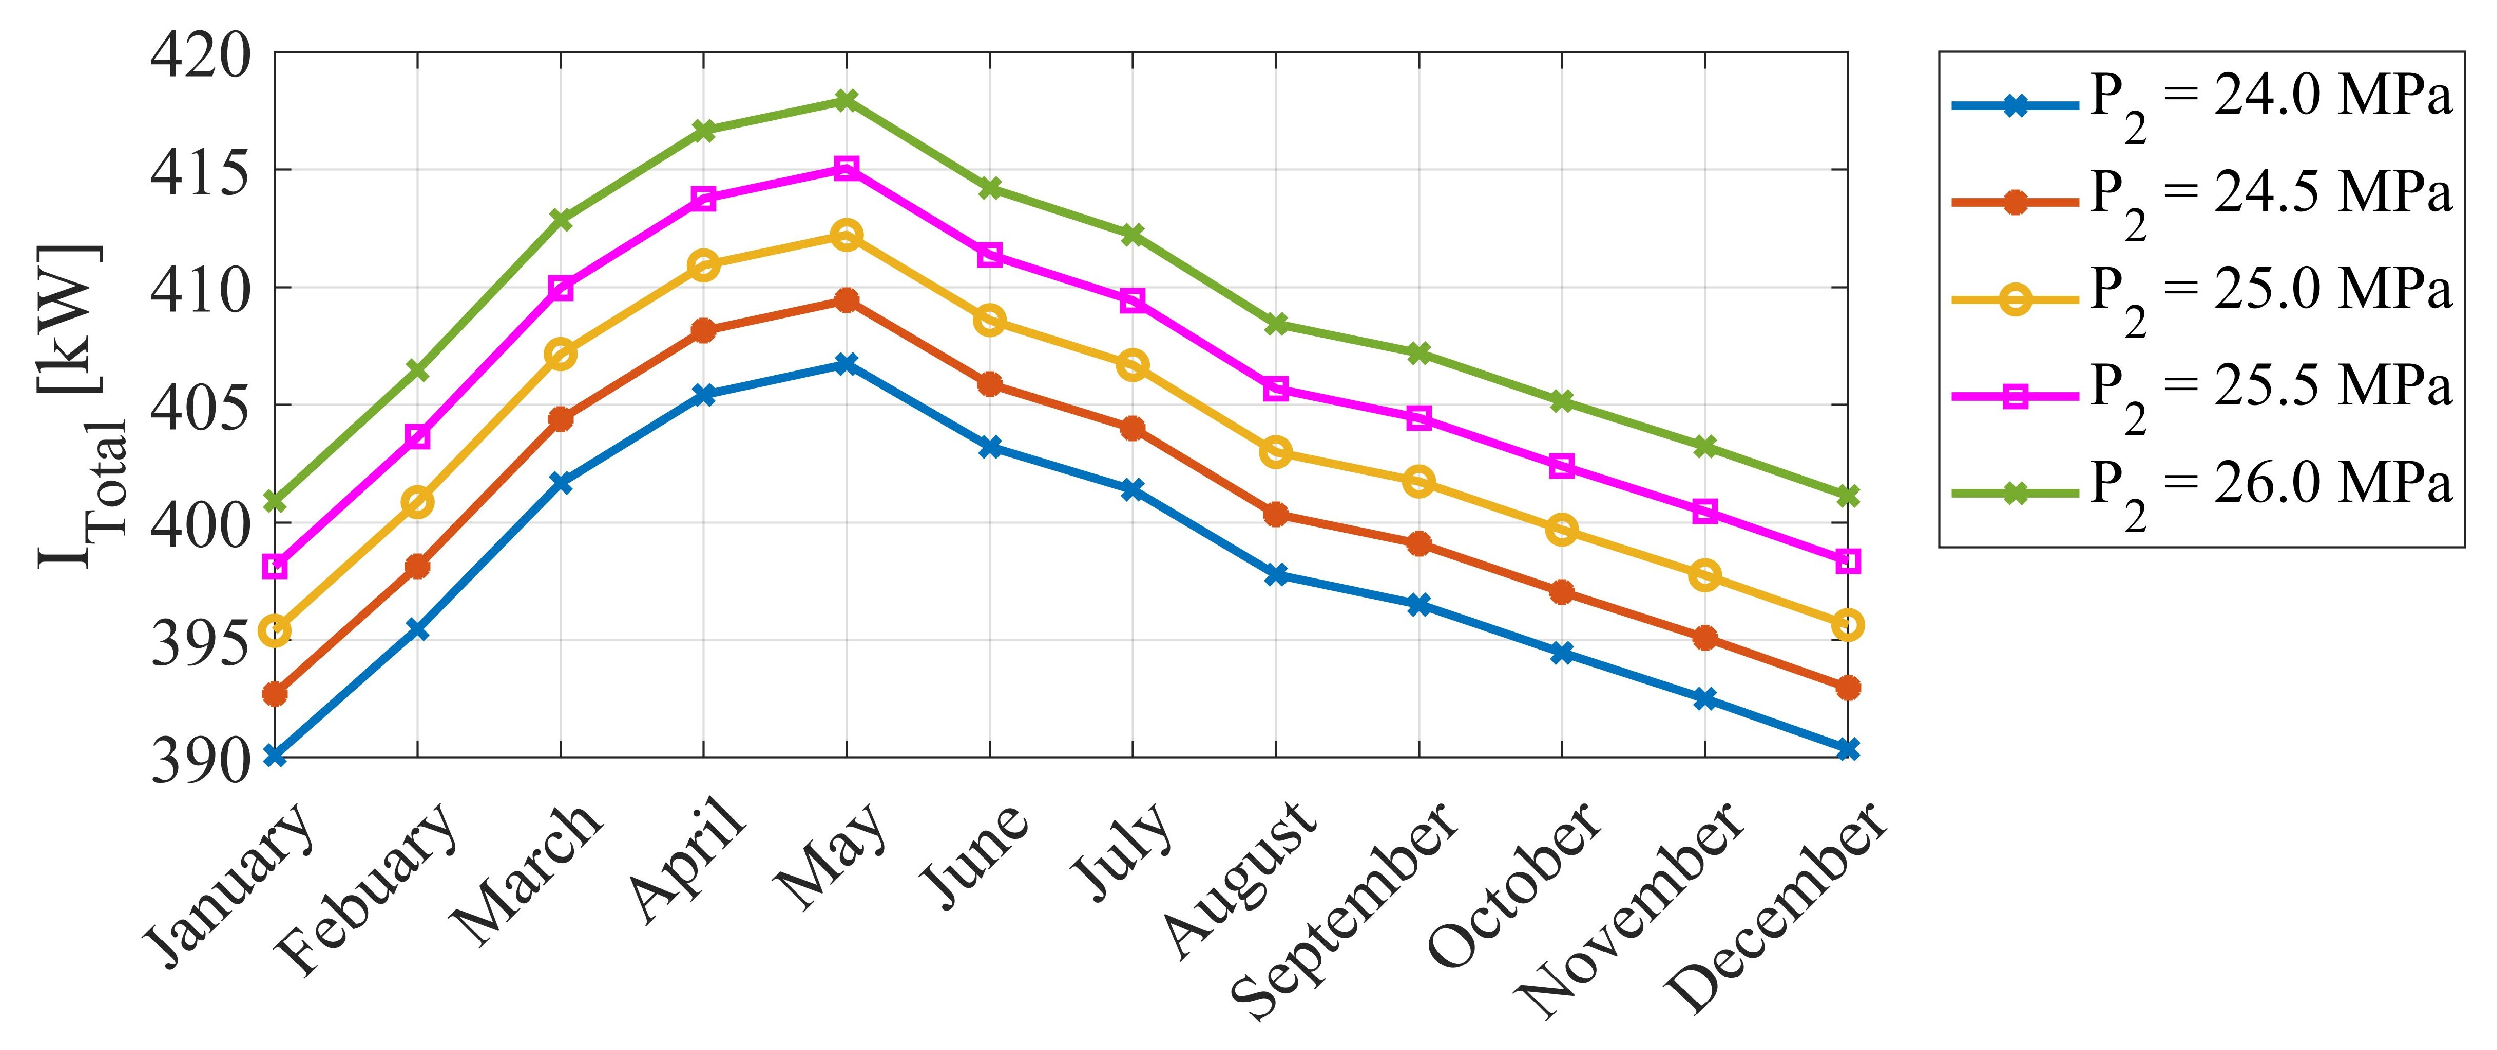
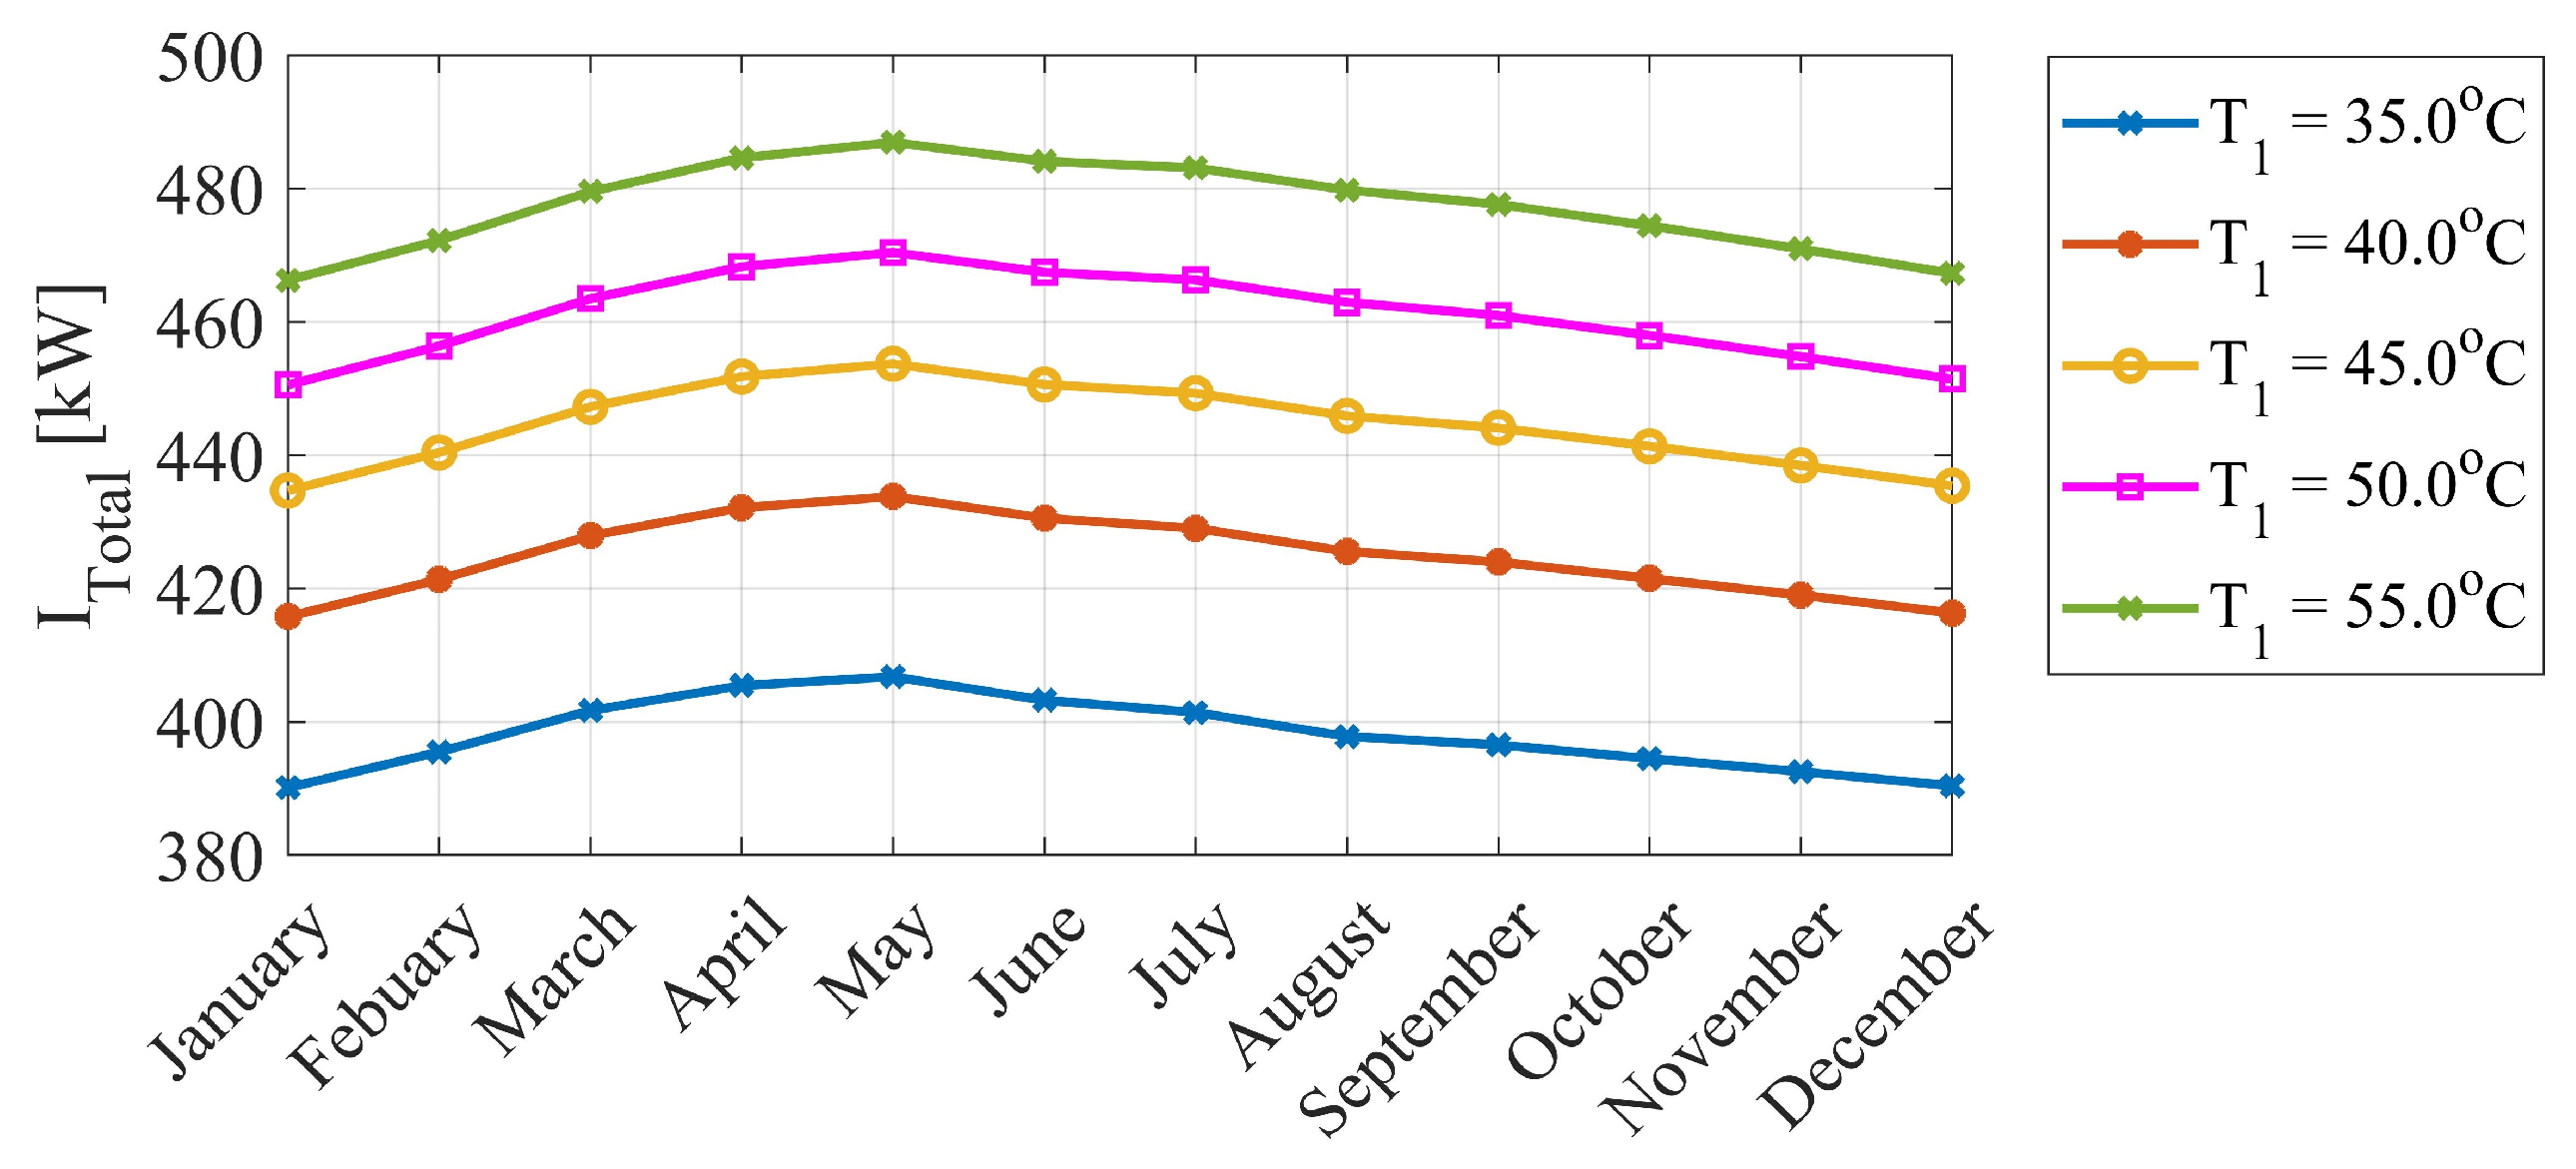
The total exergy destruction of the re-compression Brayton cycle increased with an increase in T7, as shown in Figure 6. One of the reasons for this is the higher entropy generation at higher T7 values causing comparatively higher exergy destruction in the turbine. Figure 7 presents the exergy destruction in different components of the cycle at T7 = 700 °C and x = 0.74. It can be observed that the gas cooler shows the maximum exergy destruction because a lot of exergy is destroyed when the is cooled down from State 10 to State 1. Figure 8 shows that when the outlet pressure of the compressor is high, the exergy destruction is also comparatively high. Moreover, in the summer months, the exergy destruction was high because of high ambient and water temperatures. Figure 9 shows that as the compressor inlet temperature is kept to a lower value (near the critical point), the exergy destruction is minimized. The minimum exergy destruction of 390 kW was observed in January at a compressor inlet temperature of 35 °C and a compressor outlet pressure of 24 MPa.
3.4. Heat Transfer Area Coefficient (UA) and Turbomachinery Size (SP) Values
UA and SP values are the parameters for the estimation of the cost of the system. UA value indicates the area required for heat exchangers, and thus indicates their cost. As the UA value increases, the total heat transfer area in the heat exchangers also increases, thereby increasing the investment and maintenance costs of the heat exchangers, and thus the system [21]. SP values indicate the size of the turbomachinery in the system; thus, a lower value is desirable.
Figure 10 illustrates the relationship of UA with the different heat exchangers in the re-compression Brayton cycle with different T7 values. It should be noted that the UA value for the primary heat exchanger was the highest and increased at an increasing rate, whereas the UA value for the HTR showed a linear increase with respect to T7. The net result is that for a high T7 value, a large heat exchange area is required when considering all of the heat exchangers in the system. The gas cooler showed the lowest UA value and was not sensitive to T7.
Figure 11 shows the effect of T1 on the heat exchanger sizes, as indicated by the UA value for each heat exchanger. It should be noted that the UA values of the primary heat exchanger, gas cooler and LTR all decrease with increasing T1, whereas that of HTR shows only a slight increase. As shown in Figure 12, the net result was a decrease in the UATotal value with increasing T1, which implies that the total area required for heat exchange decreases, and smaller heat exchanger sizes will be required for higher compressor inlet temperatures (which are much higher than the critical temperature value).
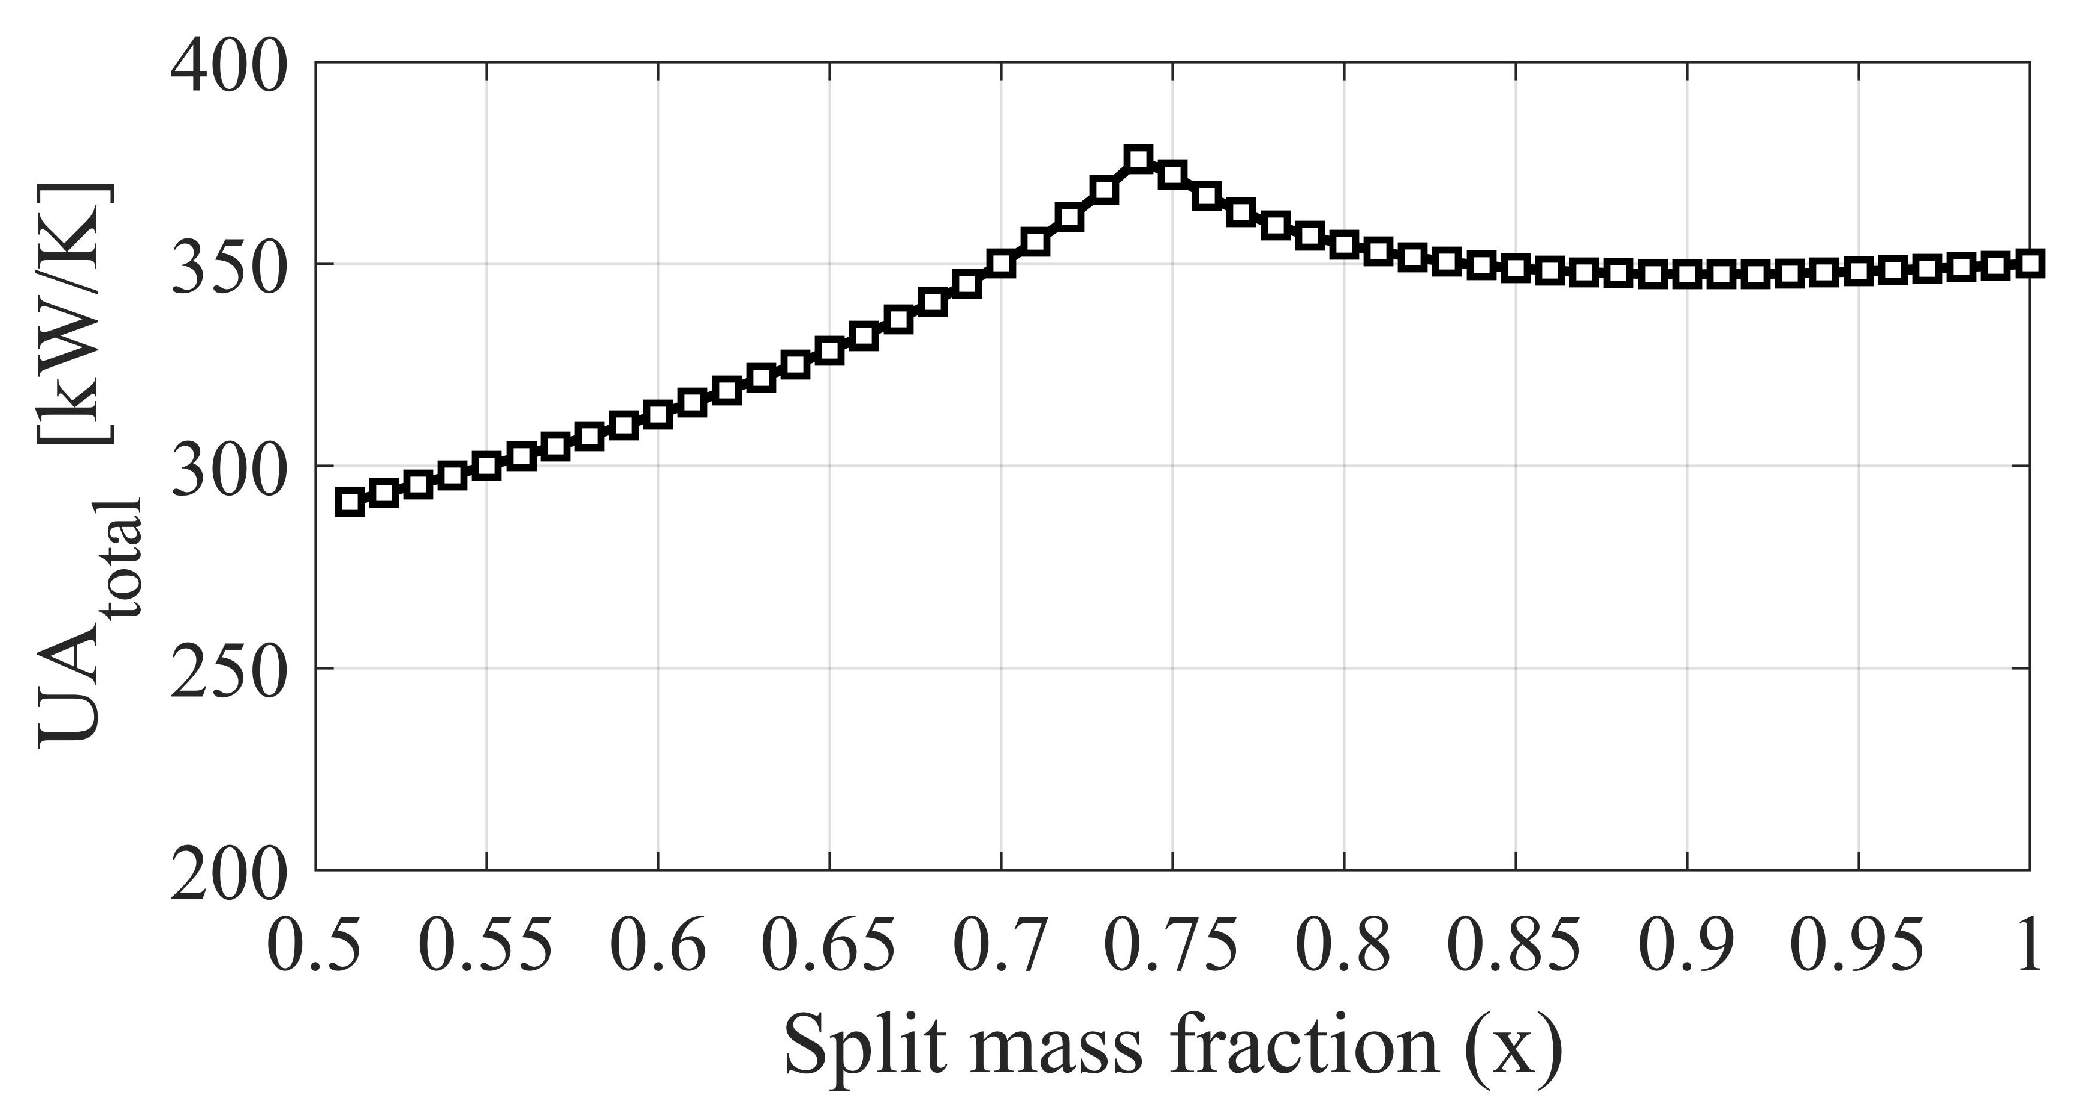
Figure 13 shows the relationship between and x in the re-compression Brayton cycle. The plot shows a maximum value at x = 0.74, which is the same point at which was maximum. This implies that the size, and thus, the cost of the heat exchangers in the system, will need to be high to achieve the maximum efficiency.
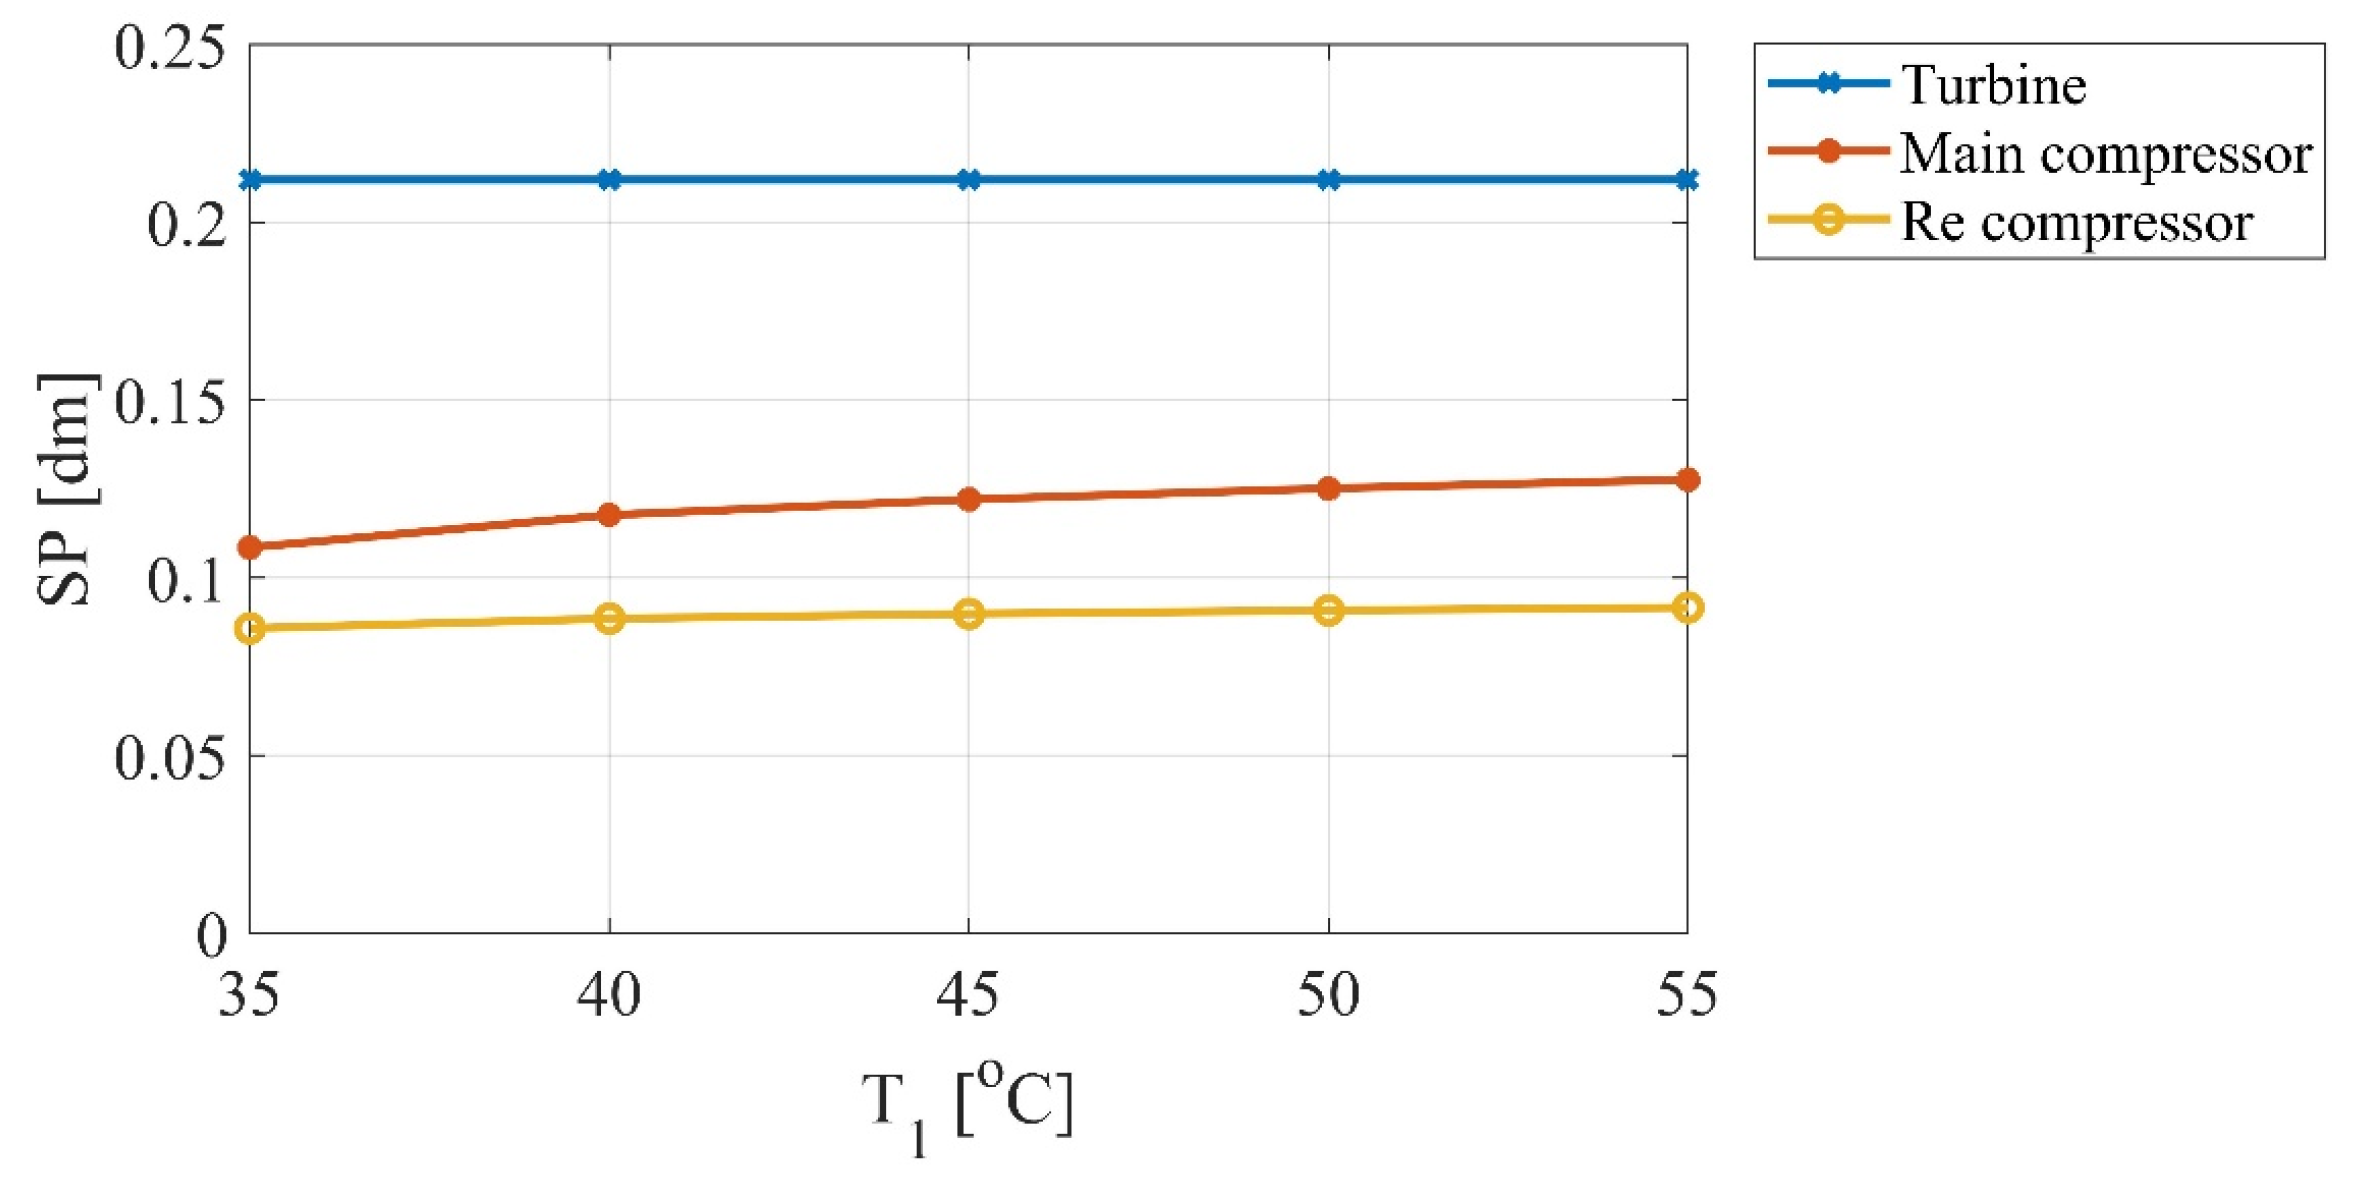
Figure 14 and Figure 15 show the SP values for the turbine, main compressor and re-compressor in the cycle. The SP of the turbine increases at higher T7 values, implying that a large turbine should be used for high T7 values. Moreover, the SP values of the main compressor and re-compressor are much less sensitive to T7, meaning that the same compressor size can be used when T7 is either low or high. The main compressor has a higher SP value than the re-compressor. Figure 15 shows the variation in SP of the different turbomachinery components with T1. The SP of the turbine does not depend on T1, as can be seen by the straight line. However, the SP values of the main compressor and re-compressor increase with an increase in T1. Moreover, the increase in the SP value for the main compressor is more pronounced than that of the re-compressor. Hence, relatively large compressor sizes will be required at a high T1.
4. Conclusions
The present study investigated seasonal performance analysis of -based re-compression Brayton power system. From the analysis, the following conclusions were drawn:
- The thermal performance of the considered system is highly sensitive to the turbine’s inlet temperate and split mass fraction. For every set of imposed boundary conditions, there exists an optimal value of split mass fraction that tends to minimize the temperature difference between LTR outlet and HTR inlet. It can be concluded that the optimal values of split mass fraction increase with the increase of turbine inlet temperature. Furthermore, the optimal value of the split mass fraction is found as 0.74, corresponding to the turbine inlet temperature of °C for which cycle’s efficiency () is 4.
- The maximum of the cycle’s efficiency comes at high total heat transfer area coefficient () values that in turn increase the cost of the heat exchanger. On the other hand, the cost of the heat exchanger can be reduced by moving the compressor’s inlet temperature away from the critical temperature or by lowering the turbine inlet temperature. However, in both scenarios, the cycle’s thermal efficiency shall be compromised. Therefore, an optimal trade-off can be established between and depending on the design objective.
- Exergy destruction is high for high turbine and main inlet temperatures and compressor inlet pressures. The gas cooler is the biggest source of exergy destruction in the cycle. Moreover, exergy destruction for the summer seasons was higher than the winter seasons. The system exergy destruction ( has the lowest value of 390 kW at 35 °C and 24 MPa in the month of January.
- The size parameter (SP) of the turbine increases with increasing turbine inlet temperature, whereas that of the compressor shows an increase when the main compressor inlet temperature increases. This implies that the total size parameter () value of the system increases with increasing turbine and compressor inlet temperatures, which the increase the cost of the turbomachinery under these conditions.
5. Future Work
- For the re-compression Brayton cycle, the thermal efficiency can be further increased if the heat available at the gas cooler is utilized to generate more power. This can be achieved by using the cycle in a cascade arrangement with an ORC as a bottoming cycle.
- A tri-generation system can be designed such that the multiple benefits of power, heating and cooling can be obtained from the system. Combined power and heating/cooling systems have the advantage of increasing efficiency by bringing multiple benefits into play.
- The performance of the system can be further improved if the system is optimized using a genetic algorithm such that the investment/maintenance costs of the system are minimized, and at the same time, the efficiency of the system is maximized. For this purpose, multi-objective optimization can be used using variables such as and to minimize the cost of the heat exchangers and turbomachinery in the system. Furthermore, and can be used to maximize the efficiency of the system whilst minimizing the exergy destruction due to irreversibilities. The input variables within the most suitable bounded constraints can be defined in the optimization code.
Author Contributions
M.S.S. did the simulation analysis and drafted the manuscript. M.S. did heat exchanger analysis and edited the manuscript. M.-H.K. supervised the research and edited the manuscript. The authors read and approved the manuscript. All authors have read and agreed to the published version of the manuscript.
Funding
This research received no external funding.
Conflicts of Interest
The authors declare no conflict of interest.
Nomenclature
| Symbols and abbreviations | |
| Specific heat capacity | |
| e | Specific exergy of flow [J/kg] |
| E | Exergy rate [W] |
| h | Specific enthalpy [J/kg] |
| I | Exergy destruction [W] |
| IR | Irreversibility ratio of the system |
| m | Mass flow rate [kg/s] |
| P | Pressure [Pa] |
| Q | Heat rate [W] |
| s | Specific entropy [J/kg.K] |
| SP | Turbomachinery size factor |
| SP | Size parameter [m] |
| T | Temperature [K] |
| UA | Heat transfer area coefficient [W/K] |
| W | Power [W] |
| x | Split mass fraction |
| Abbreviations | |
| GC | Gas cooler |
| HTR | High temperature recuperator |
| HX | Primary heat exchanger |
| LTR | Low temperature recuperator |
| max | Maximum |
| min | Minimum |
| Supercritical Carbon dioxide | |
| ΔTM | Log mean temperature difference |
| Greek symbols | |
| η | Efficiency |
| ε | Recuperator effectiveness |
| Temperature difference | |
| Subscripts | |
| c | Cold side |
| Carbon dioxide | |
| h | Hot side |
| HTR | High temperature recuperator |
| HX | Primary heat exchanger |
| in | Property at inlet |
| LTR | Low temperature recuperator |
| MC | Main compressor |
| out | Property at outlet |
| ex | Exergy |
| RC | Re-compressor |
| s | Isentropic process |
| th | Thermal |
| T | Turbine |
| w | Water |
| 0 | Dead state |
| 1,2,3, | State points |
References
- IPCC. Climate Change 2014: Synthesis Report. Contribution of Working Groups I, II and III to the Fifth Assessment Report of the Intergovernmental Panel on Climate Change; IPCC: Geneva, Switzerland, 2014; ISBN 9789291691432. [Google Scholar]
- Mudasar, R.; Aziz, F.; Kim, M.-H. Thermodynamic analysis of organic Rankine cycle used for flue gases from biogas combustion. Energy Convers. Manag. 2017, 153, 627–640. [Google Scholar] [CrossRef]
- Yağli, H.; Koç, Y.; Koç, A.; Görgülü, A.; Tandiroğlu, A. Parametric optimization and exergetic analysis comparison of subcritical and supercritical organic Rankine cycle (ORC) for biogas fuelled combined heat and power (CHP) engine exhaust gas waste heat. Energy 2016, 111, 923–932. [Google Scholar] [CrossRef]
- Nasir, M.T.; Kim, K.C. Working fluids selection and parametric optimization of an Organic Rankine Cycle coupled Vapor Compression Cycle (ORC-VCC) for air conditioning using low grade heat. Energy Build. 2016, 129, 378–395. [Google Scholar] [CrossRef]
- Liu, X.; Wei, M.; Yang, L.; Wang, X. Thermo-economic analysis and optimization selection of ORC system configurations for low temperature binary-cycle geothermal plant. Appl. Therm. Eng. 2017, 125, 153–164. [Google Scholar] [CrossRef]
- Mudasar, R.; Kim, M.-H. Experimental study of power generation utilizing human excreta. Energy Convers. Manag. 2017, 147, 86–99. [Google Scholar] [CrossRef]
- Singh, H.; Mishra, R.S. Performance evaluation of the supercritical organic rankine cycle (SORC) integrated with large scale solar parabolic trough collector (SPTC) system: An exergy energy analysis. Environ. Prog. Sustain. Energy 2018, 37, 891–899. [Google Scholar] [CrossRef]
- Saeed, M.; Kim, M. Analysis of a recompression supercritical carbon dioxide power cycle with an integrated turbine design/optimization algorithm. Energy 2018, 165, 93–111. [Google Scholar] [CrossRef]
- Ahn, Y.; Bae, S.J.; Kim, M.; Cho, S.K.; Baik, S.; Lee, J.I.; Cha, J.E. Review of supercritical CO2 power cycle technology and current status of research and development. Nucl. Eng. Technol. 2015, 47, 647–661. [Google Scholar] [CrossRef] [Green Version]
- Brun, K.; Friedman, P.; Dennis, R. (Eds.) Fundamentals and Applications of Supercritical Carbon Dioxide (sCO2) Based Power Cycles; Woodhead Publishing, Elsevier Science: Cambridge, UK, 2017; ISBN 9780081008058. [Google Scholar]
- Crespi, F.; Gavagnin, G.; Sánchez, D.; Martínez, G.S. Supercritical carbon dioxide cycles for power generation: A review. Appl. Energy 2017, 195, 152–183. [Google Scholar] [CrossRef]
- Saeed, M.; Khatoon, S.; Kim, M.-H. Design optimization and performance analysis of a supercritical carbon dioxide recompression Brayton cycle based on the detailed models of the cycle components. Energy Convers. Manag. 2019, 196, 242–260. [Google Scholar] [CrossRef]
- Aziz, F.; Mudasar, R.; Kim, M.-H. Exergetic and heat load optimization of high temperature organic Rankine cycle. Energy Convers. Manag. 2018, 171, 48–58. [Google Scholar] [CrossRef]
- Macchi, E.; Perdichizzi, A. Efficiency prediction for axial-flow turbines operating with non conventional fluids. J. Eng. Power 1981, 103, 718–724. [Google Scholar] [CrossRef]
- Aziz, F.; Salim, M.S.; Kim, M.-H. Performance analysis of high temperature cascade organic Rankine cycle coupled with water heating system. Energy 2019, 170, 954–966. [Google Scholar] [CrossRef]
- Patel, B.; Desai, N.B.; Kachhwaha, S.S. Optimization of waste heat based organic Rankine cycle powered cascaded vapor compression-absorption refrigeration system. Energy Convers. Manag. 2017, 154, 576–590. [Google Scholar] [CrossRef]
- MATLAB—MathWorks-R2017a (Version 9.2). 2017. Available online: https://www.mathworks.com/products/new_products/release2017a.html(accessed on 12 February 2020).
- Lemmon, E.; Mc Linden, M.; Huber, M. NIST Reference Fluid Thermodynamic and Transport Properties Database: REFPROP Version 9.1, NIST Standard Reference Database 23. 2013. Available online: http://www.boulder.nist.gov (accessed on 25 December 2017).
- Busan Ambient Temperature Data. Available online: https://en.climate-data.org/asia/south-korea/busan/busan-4114/ (accessed on 15 September 2019).
- Moran, M.J.; Shapiro, H.N.; Boettner, D.D.; Bailey, M.B. Principles of Engineering Thermodynamics, 7th ed.; John Wiley & Sons: Hoboken, NJ, USA, 2012. [Google Scholar]
- Gao, H.; Liu, C.; He, C.; Xu, X.; Wu, S.; Li, Y. Performance analysis and working fluid selection of a supercritical organic Rankine cycle for low grade waste heat recovery. Energies 2012, 5, 3233–3247. [Google Scholar] [CrossRef]
- Saeed, M.; Kim, M.-H. Thermal and hydraulic performance of SCO2 PCHE with different fin configurations. Appl. Therm. Eng. 2017, 127, 975–985. [Google Scholar] [CrossRef]
- Dostal, V.; Driscoll, M.J.; Hejzlar, P. A Supercritical Carbon Dioxide Cycle for Next Generation Nuclear Reactors, MIT-ANP-TR-100, Advanced Nuclear Power Technology Program Report; Massachusetts Institute of Technology: Cambridge, MA, USA, 2004. [Google Scholar]
Figure 1.
Schematic of re-compression Brayton cycle.

Figure 2.
Ambient and water temperature data for the city of Busan [19].
Figure 2.
Ambient and water temperature data for the city of Busan [19].

Figure 3.
Discretized model of the heat exchanger to capture the effect of variation in the properties of .
Figure 3.
Discretized model of the heat exchanger to capture the effect of variation in the properties of .

Figure 4.
The thermal efficiency of the cycle at different turbine inlet temperatures (T7).

Figure 5.
Exergy efficiency (ηex) and irreversibility ratio (IR) of the cycle at a turbine inlet temperature (T7) of 700 °C.
Figure 5.
Exergy efficiency (ηex) and irreversibility ratio (IR) of the cycle at a turbine inlet temperature (T7) of 700 °C.

Figure 6.
Total exergy destruction vs. turbine inlet temperature (T7).

Figure 7.
Exergy destruction in different components of the cycle at T7 = 700 °C.

Figure 8.
Total exergy destruction at different compressor outlet pressures (P2).

Figure 9.
Total exergy destruction at different compressor inlet temperatures (T1).

Figure 10.
Heat transfer area coefficient (UA) vs. turbine inlet temperature (T7).

Figure 11.
Heat transfer area coefficient (UA) vs. compressor inlet temperature (T1).

Figure 12.
Total heat transfer area coefficient () vs. compressor inlet temperature (T1).

Figure 13.
Total heat transfer area coefficient () vs. split mass fraction (x) at = °C.

Figure 14.
Size parameter (SP) vs. turbine inlet temperature (T7).

Figure 15.
Size parameter (SP) vs. compressor inlet temperature (T1).


Table 1.
Design parameters used in cycle simulations.
| Parameter | Symbol | Value |
|---|---|---|
| mass flow rate, kg/s | 10 | |
| Main compressor inlet temperature, °C | 35 | |
| Main compressor inlet pressure, MPa | 7.8 | |
| Main compressor outlet pressure, MPa | 24 | |
| Main compressor isentropic efficiency | 0.85 | |
| Re-compressor isentropic efficiency | 0.85 | |
| Turbine isentropic efficiency | 0.93 | |
| Effectiveness of the HTR | 0.90 | |
| Effectiveness of the LTR | 0.90 | |
| Ambient temperature (other than seasonal exergy analysis), °C | T0 | 24.5 |
| Ambient pressure, MPa | P0 | 0.1 |
| Water inlet temperature in the gas cooler (other than seasonal exergy analysis), °C | 23.7 | |
| Water outlet temperature in the gas cooler, °C | 40 |
Table 2.
Typical properties of .
| Molar Mass (g/mol) | Critical Pressure (MPa) | Critical Temperature (°C) | ODP | GWP |
|---|---|---|---|---|
| 44.01 | 7.4 | 31.0 | 0 | 1 |
© 2020 by the authors. Licensee MDPI, Basel, Switzerland. This article is an open access article distributed under the terms and conditions of the Creative Commons Attribution (CC BY) license (http://creativecommons.org/licenses/by/4.0/).
Share and Cite
MDPI and ACS Style
Salim, M.S.; Saeed, M.; Kim, M.-H. Performance Analysis of the Supercritical Carbon Dioxide Re-compression Brayton Cycle. Appl. Sci. 2020, 10, 1129. https://0-doi-org.brum.beds.ac.uk/10.3390/app10031129
AMA Style
Salim MS, Saeed M, Kim M-H. Performance Analysis of the Supercritical Carbon Dioxide Re-compression Brayton Cycle. Applied Sciences. 2020; 10(3):1129. https://0-doi-org.brum.beds.ac.uk/10.3390/app10031129
Chicago/Turabian StyleSalim, Mohammad Saad, Muhammad Saeed, and Man-Hoe Kim. 2020. "Performance Analysis of the Supercritical Carbon Dioxide Re-compression Brayton Cycle" Applied Sciences 10, no. 3: 1129. https://0-doi-org.brum.beds.ac.uk/10.3390/app10031129
Note that from the first issue of 2016, this journal uses article numbers instead of page numbers. See further details here.