1. Introduction
Modern surveying technologies in cultural heritage (CH) offer new perspectives of application both as regards the acquisition of metric data and the representation or analysis of objects of historical and artistic interest [
1]. In this way, it is possible to obtain a digital representation of objects or structures belonging to the CH environment in terms of position, shape, geometry and description of each element. Geomatics surveys are the primary step in the process of conservation, enhancement and management of CH. A geomatics survey can be performed using image-based 3D modelling (IBM) or range-based modelling (RBM).
IBM methods use 2D images (generated by passive sensor) measurements in order to obtain 3D models. In the last few years, a very successful approach in the construction of 3D models has been that based on the structure from motion (SfM) and multi-view stereo (MVS) algorithms. Using these approaches, a 3D model or 2D orthophotos can be obtained in a rapid and automatic way using photogrammetric software. In general, the several processing steps that lead to the construction of the model are: (i) alignment of the images; (ii) building a dense point cloud (PC); (iii) building mesh and; (iv) building an orthomosaic. Furthermore, the passive sensors used in the IBM method may be used even on mobile platforms (such as cranes, unmanned aerial vehicles (UAVs), hot-air balloons, etc.). In this way, it is possible to acquire data even in big, complex and inaccessible structures, such as upper parts of buildings, aqueducts, bridges etc.
Range-based modelling is based on active sensors, which provide a highly detailed and accurate representation of a 3D object or structure. An example of active sensor is the terrestrial laser scanner (TLS). TLS is a ground-based method that rapidly acquires accurate 3D dense point clouds of a scene through laser range-finding [
2].
While in the past these two techniques have been often treated as two separate methodologies, comparing them in terms of accuracy, cost and flexibility [
3], only in recent times, they have started to be considered as complementary [
4]. The benefit of integrating these two technologies is to take advantage of the TLS capability to directly acquire a dense coloured cloud, with the flexibility of photogrammetry to operate even in exceptional conditions.
By an adequate post-processing of geomatics survey data, it is possible to obtain a georeferenced point cloud of the structure (or object) under investigation.
Next, it is necessary to transform the point cloud into objects for BIM (building information modelling) and FEM (finite element method) analysis. Recently, many studies have been focusing on the possibility of managing point clouds within BIM or structural analysis software and/or identifying a suitable pipeline in order to obtain 3D model for these purposes [
5]. While allowing the import of data, the current BIM and structural analysis software does not provide flexible and manageable procedures such as transforming them into models suitable for subsequent processing. Indeed, this is the main challenge pertaining to modelling, as it is necessary to develop simple methods to obtain BIM or HBIM (historic building information modelling) models that still guarantee accuracy, precision and quality of representation consistent with the acquired data. In addition, the model must be enriched with data and information that are not strictly geometric, such as historical information, analysis of degradation or deformation, and levels of detail not granted by the complete model.
1.1. Related Works
HBIM for the integration of contemporary technology and the BIM approach in the field of CH documentation was introduced by Murphy et al., 2009 [
6]. The purpose of this research was to identify a new methodology for creating full engineering models from laser scan and image survey data for historic structures. Therefore, the identification of a suitable procedure able to obtain a BIM model from the survey is key, especially in the management of structures of particular historical-architectural interest. A comprehensive review of the several BIM software types for CH is reported in López et al., 2018 [
7] where some information, such as functionality, tools, object structure, interoperability and links are addressed.
Fregonese et al., 2015 [
8] developed a procedure to obtain a 3D model for BIM purposes. Once the model from the 3D survey is obtained, solid model software was recreated directly in Autodesk Revit, where each single element was modelled using a system family or “Model in Place”. This BIM software has allowed to model historical and complex elements in a parametric way which allowed it to be connected with a database. However, due to the limitations of BIM commercial software, the authors have developed software for the management and planning of restoration operations.
Barazzetti et al., 2015 [
9] have showed a procedure for BIM generation from point clouds via BIM parameterization of NURBS (non-uniform rational B-spline) curves and surfaces using Revit software. In the case study, the authors suggest a procedure that provides BIM objects of complex elements by using the NURBS surface turned into specific BIM families. Using this approach, some problems were found in the modelling of complex objects and in the building of the layer-based reconstruction from the intrados to the extrados.
Eigenraam et al., 2016 [
10] presents a method in order to obtain free-form shell structures from point cloud to finite element model. In the paper, special attention is given to the geometric accuracy, considering that shape and force interact. The method was applied to Heinz Isler’s models for reverse engineering purposes.
Furno et al., 2017 [
11] compared two different modelling methods: one based on the use of NURBS and the parametric one on BIM objects, using Rhinoceros and Revit software. The “direct” modelling of Rhinoceros made it possible to process the survey data and obtain a model divided into blocks, with the possibility of modifying the intrinsic parameters of the individual elements using the Grasshopper plug-in (included in Rhinoceros). However, the model obtained in this way does not add information of any kind to the elements. For this reason, the modelling of the same structure was also performed with the Revit software and applied to Milan Cathedral in Italy.
León-Robles et. al, 2019 [
12] discussed HBIM applied to a masonry bridge using Revit commercial BIM software, but they encountered great difficulties in doing so because only a few families of libraries are dedicated to the modelling of complex civil constructions such as bridges. Moreover, in this case study, an analysis of the deformations between the designed model of the bridge and that surveyed was carried out.
Bassier et al., 2019 [
13] suggest a fast and accurate procedure to capture the spatial information required using FEM. The workflow involves two parallel methods: the former converts the point cloud to a complex FEM mesh (through a series of semi-automated procedures) while the second extracts crack information and enhances the FEM mesh to incorporate the crack geometry.
1.2. Organization of the Article
This paper is organized as follows. The first part describes the several approaches used in order to reconstruct the surface of the object from a point cloud generated through geomatics surveys. Subsequently, after describing the method that allows obtaining a 3D model for HBIM and FEM from 3D a point cloud, two case studies are discussed. In particular, the method developed is applied to a historical church featuring a rather simple shape, and an old masonry bridge with a complex structure. Conclusions are summarized at the end of the paper.
2. Surface Reconstruction from Point Cloud
2.1. Three-Dimensional (3D) Surface
To generate a surface model from a point cloud, the reconstruction technique implemented in dedicated software conventionally uses: tessellation, 3D reconstruction using Delaunay triangulation or NURBS surfaces. This procedure may show poor accuracy near the edges or with sudden surface changes from normal. Furthermore, the representation of such surfaces could require numerous pieces and, consequently, greater computational capabilities. By decimating the triangulation, information could be lost on the geometry of the structure under examination. This is the reason why many commercial software products are not able to use mesh models, but use precise analytical models in which surfaces are represented mathematically [
14]. In the following sections, the triangular irregular network (TIN) and NURB are described in detail.
2.2. Triangular Irregular Network (TIN)
TIN generation is a way to obtain surface reconstruction. Triangulation may be performed in two or in three dimensions, in accordance with the geometry of the input data. TIN utilizes the original sample points to create many non-overlapping triangles that cover the entire region according to a set of rules. The surface is described (approximately) with these triangles [
15]. The computer graphics community tends to call this polygonal model “
mesh”. A mesh contains vertices, edges and faces and its easiest representation is a single face. For triangular meshes, an indexed face list consists of an array of vertices each having three coordinates, and an array of faces each having three indices in the vertex array [
16]. The criterion for triangulation division is often used to construct the non-overlapping triangles based on the discrete sampling points. Delaunay is the most common triangulation algorithm.
2.3. Non-Uniform Rational B-Spline (NURBS)
The NURBS are mathematical representations of 3D geometry that accurately define a generic geometric entity, such as simple or more complex shapes. The NURBS curve is mathematically defined by the following equation:
where the
are the weights, the
are the control points, and the
are the normalized B-Spline basis functions of degree
recursively as [
17,
18]:
where
are the knots forming the knot vector
.
Therefore, a NURBS curve is defined by four characteristics: the degree, the control vertices, the knot vectors and the weights. The degree of the NURBS (a positive integer) defines mathematically the piecewise polynomial blending function. The higher the degree of the polynomial, the more flexible the curve and surface. The control vertices are a row of points at least equal to (degree + 1). The knot vectors define how the polynomial pieces are blended together with the proper smoothness. Generally, there are two kinds of knot vector definition: uniform (i.e., with constant spacing between the knots) and non-uniform (i.e., with varying spacing between knot vectors).
A weight is associated with each control point (i.e., its ability to attract the curve). Excluding some exceptions, weights are positive numbers. When the control points of a curve all have the same weight (usually equal to 1), the curve is called “non-rational” and the NURBS curve is reduced to a B-spline curve; otherwise, it is called “rational.” For this reason, the letter R of the acronym NURBS stands for “rational” and indicates that a NURBS curve can be rational.
3. Method
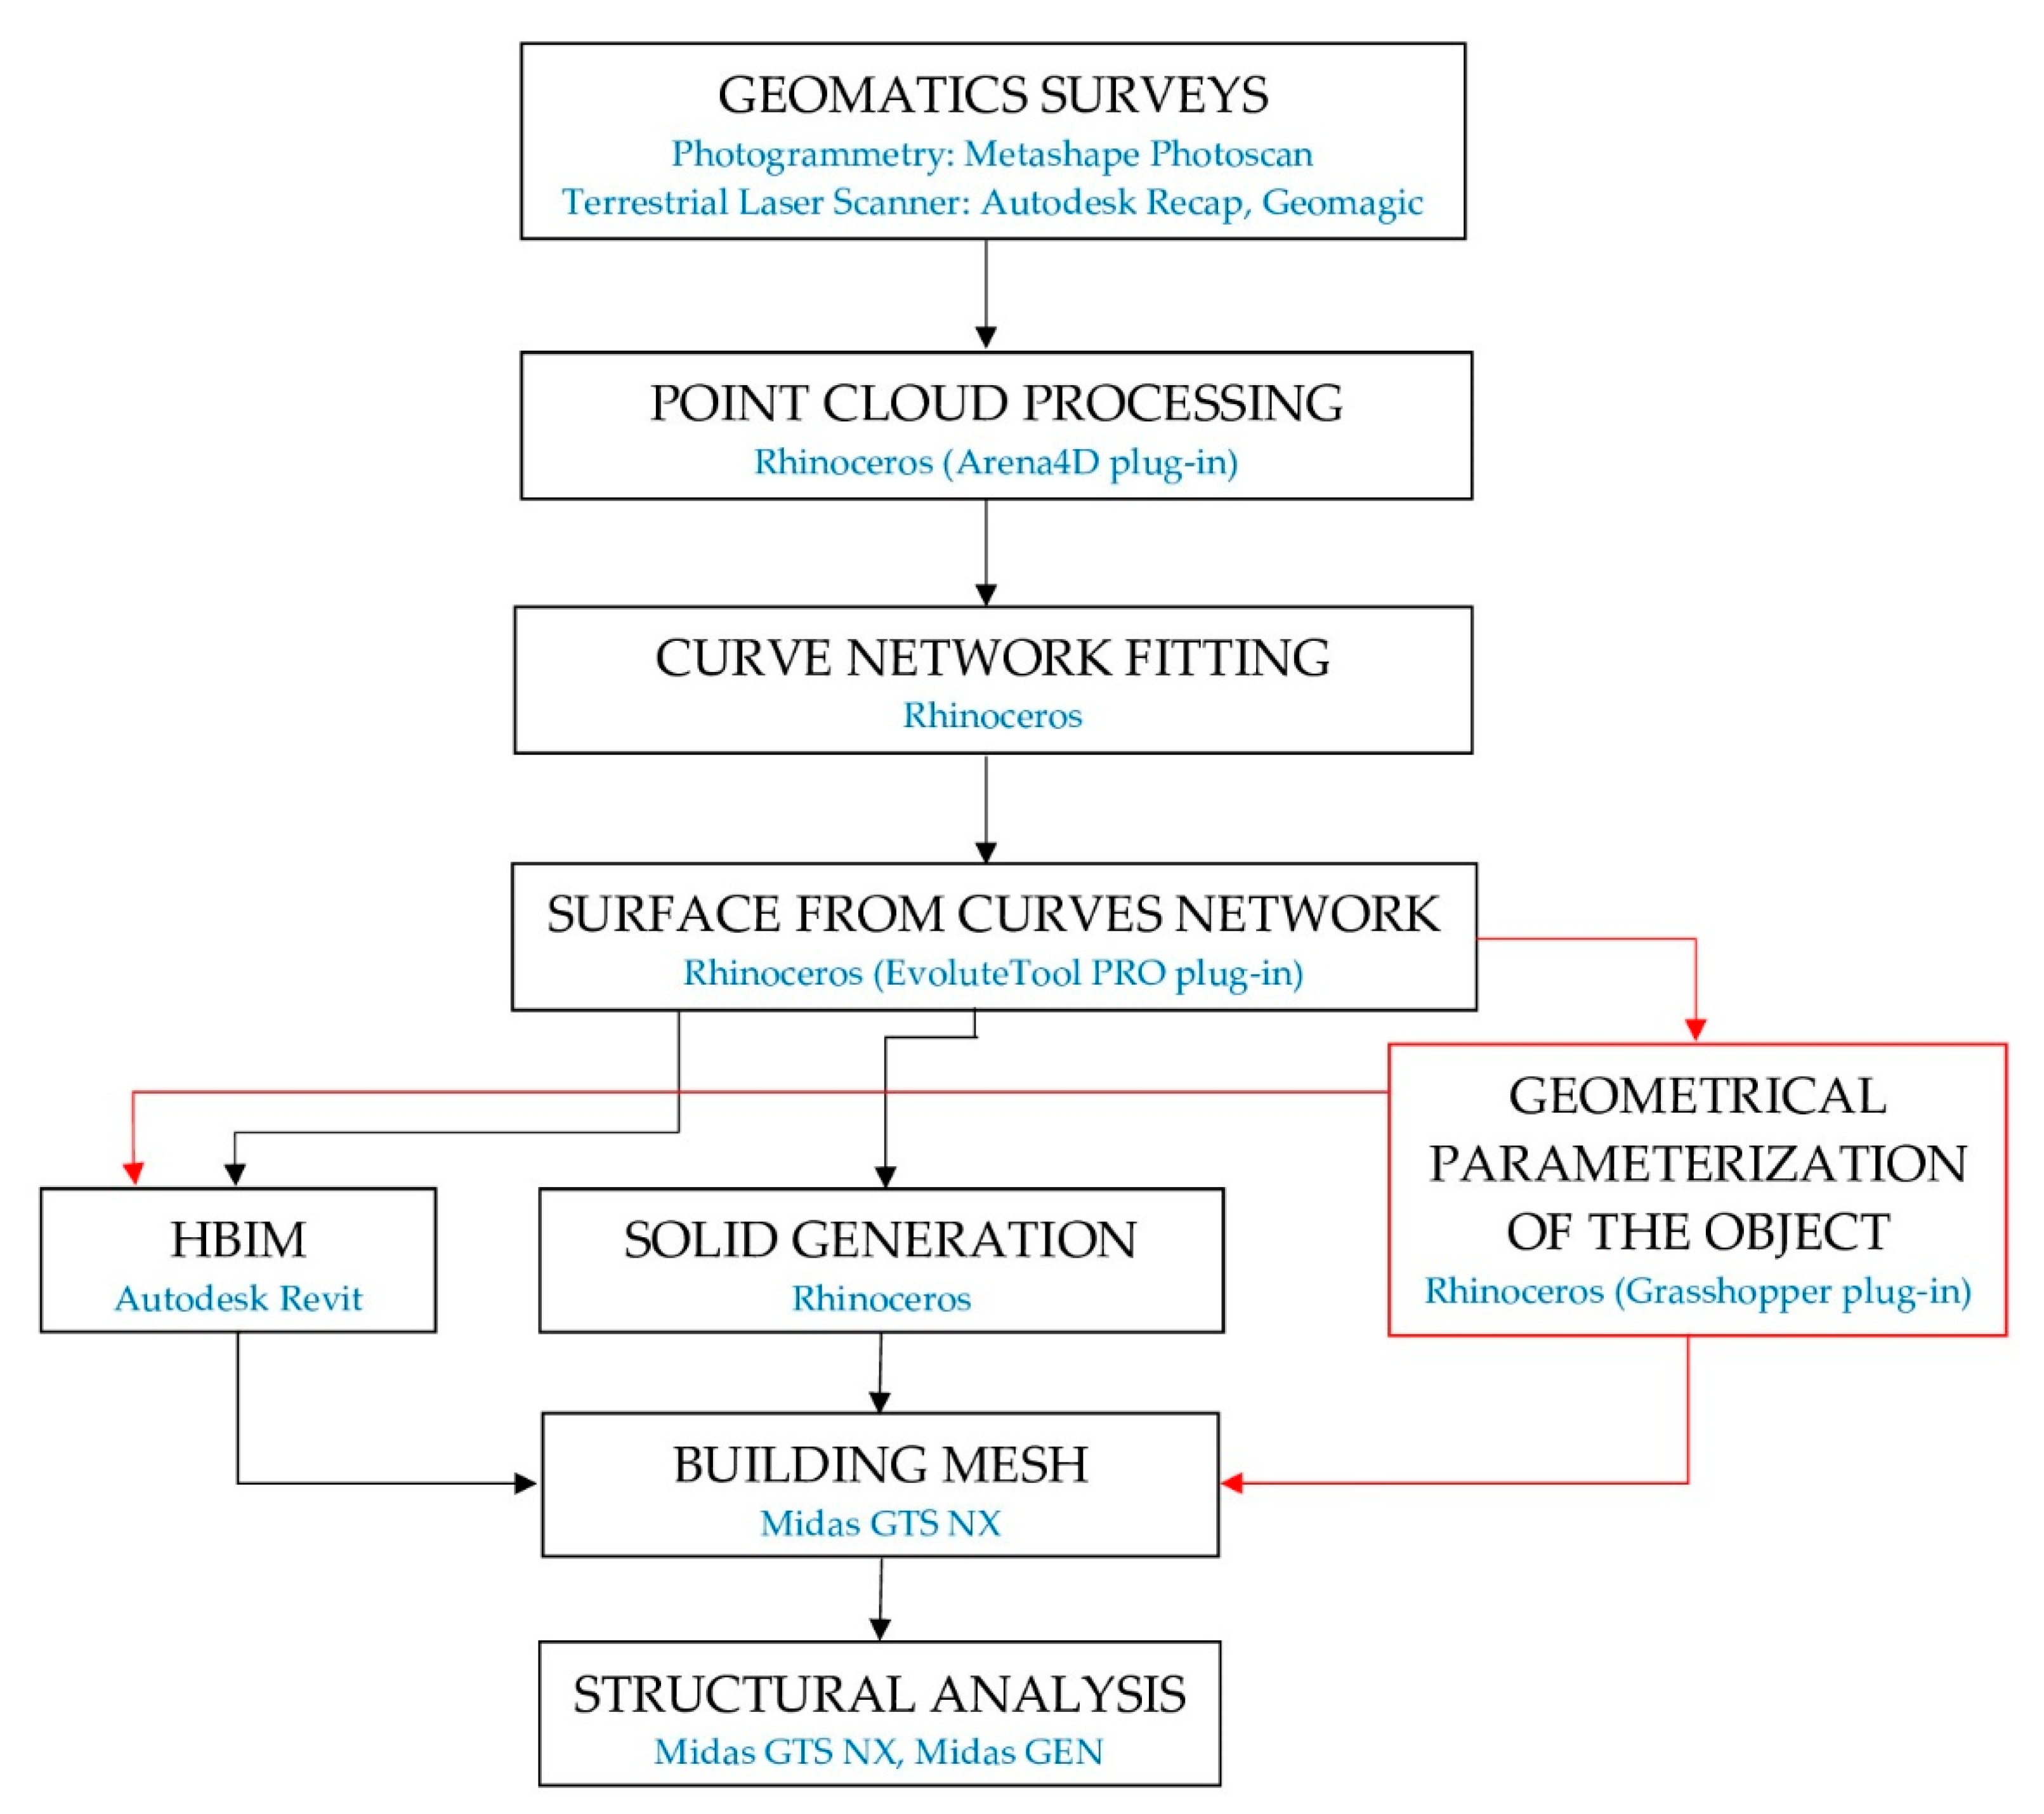
The creation of surfaces suitable for the modelling of objects or structures starting from a 3D “dense point cloud” model (obtained through geomatics surveys) can take place in different ways. Several pipelines have been examined [
1,
19]: the most efficient of these (in terms of linearity of the method, accuracy, processing times) can thus be schematized (
Figure 1). In fact, should the model generation take place in Revit, it would require the generation of families responding to the geometric characteristics of the object. The generation of the same model in Rhinoceros is “semi-automatic” because it requires the adaptation of any complex surface from the point cloud. This task can be carried out using the different plug-ins within the Rhinoceros software. The processing times for model generation in Revit are considerably longer than those required in Rhinoceros, primarily because complex surfaces do not always find adaptive models in BIM, while in Rhinoceros surfaces can be generated to adapt to the point cloud.
As showed in the pipeline (
Figure 1), the first step, after performing geomatics surveys, is to import the point cloud into the Rhinoceros software. Through the Arena4D plug-in, implemented in Rhinoceros software, it is possible to obtain optimal management of the point cloud. In other words, this plug-in creates a series of filters on the point cloud such as the elimination of outliers, etc.
In Rhinoceros software, it was also possible to create detailed profiles in the specific part of the structure and, consequently, to build complex and irregular shapes according to NURBS-type geometries. In this way, it is possible to differentiate the several elements of a structure, such as that of a bridge (geometry of the pylons, vaults, retaining walls, etc.). The characterization of each structural element allows each of them to be assigned a specific material.
If the structure shows irregular geometries, it is possible to use an additional plug-in developed in Rhinoceros, called “EvoluteTools PRO”, which is able to generate highly complex and sophisticated NURBS surfaces.
Subsequently, the surfaces can be imported into the software of HBIM or structural analysis. In the latter case, NURBS surfaces cannot be imported directly into the software, but it is necessary to build solids. As a result, each NURBS surface can be transformed into a solid through modelling in Rhinoceros. Once solid geometric objects are exported into Midas GTS NX software, the structural mesh can be built.
The transformation from NURBS into solid is performed through solid generation commands such as “offset surface”, “loft evolut”, “revolution”, “extrusion” (i.e., Boolean commands)”. Obviously, this phase can be achieved knowing the thicknesses of the structural elements that have been detected and identified through the use of multi-sections on the structure. Consequently, structural objects can be constrained and subjected to loads (permanent and accidental); in this way, it is possible to perform the analysis of stresses and deformations of the structure taken into consideration. However, depending on the structure under investigation, it is possible to use the Grasshopper plug-in, implemented within the Rhinoceros software. This plug-in allows the problem of repeatability of similar objects to be overcome or “parameterization” from time to time of structural elements that have similar geometric characteristics. The programming in Grassopher starts from the insertion of the (surveyed) surfaces generated by the point cloud and adapted in Rhinoceros, which then allows the geometric parameterization. The latter allows us to define any geometric parameter of the object (length, height, thickness, etc.). These geometric elements can be modified and managed according to the space-time use (duplication of the object, comparison with temporal deformations, cracking) using commands such as “number slider” or “Nurbs Curve” (insertable and manageable within the “canvas”). A further advantage of using the Grasshopper plug-in is the possibility to parameterize any type of surface. This is particularly useful in the 4D monitoring activity since it is possible to update the parameterized model according to the deformations detected in different eras. Therefore, the different structural elements generated in this way can be imported into HBIM software or used in structural analysis, as previously described.
Furthermore, all plug-ins and software used in this paper require (commercial) user licenses and support interchange formats. In the Revit environment, the processing requires more manual interventions on the part of the operator than the semi-automatism provided by Rhinoceros. Moreover, if the goal of the process is the complete geometrical parameterization of the object (up to foreseeing temporal modifications or similarities between the objects) it is necessary to have more programming knowledge (Grasshopper) and, consequently, greater manual intervention on behalf of the operator.
4. Case Studies
4.1. Brief History and Location of the Structures Taken under Investigation
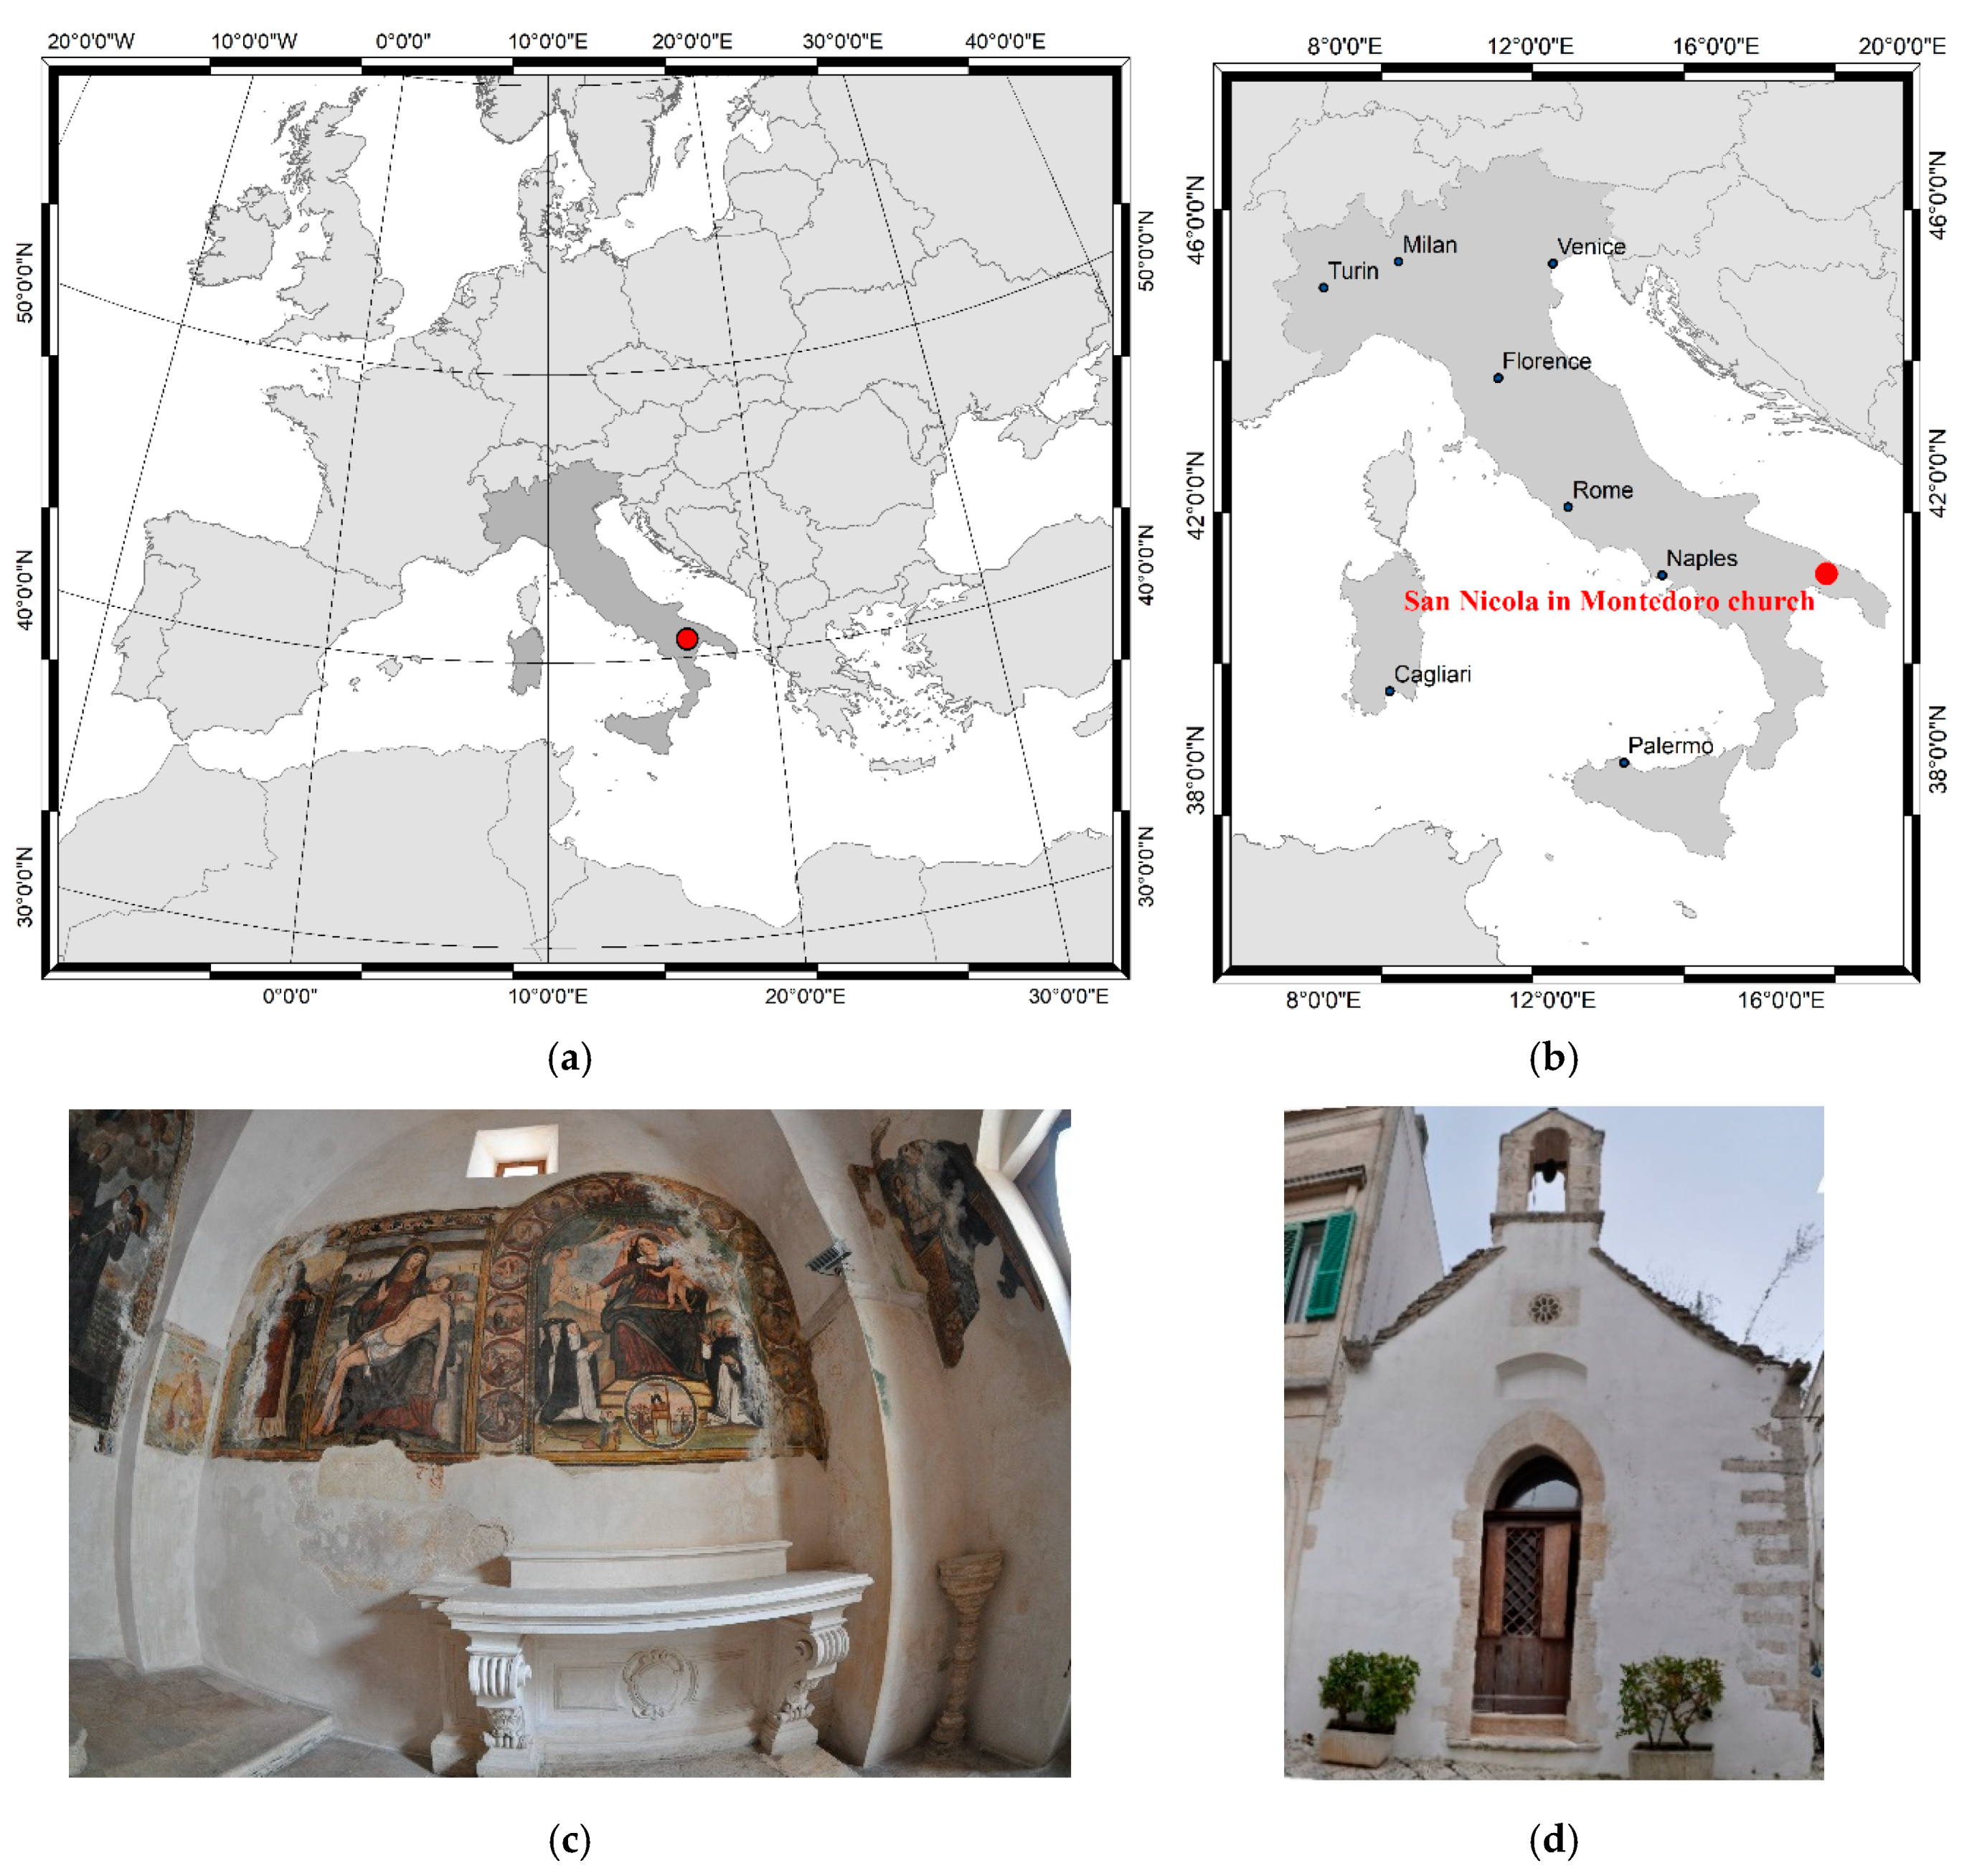
4.1.1. The Church of San Nicola in Montedoro
The church of San Nicola in Montedoro is one of the oldest in the town of Martina Franca in the province of Taranto (Italy) (see
Figure 2a,b). The construction of the church presumably dates back to the 14th century, the period of the Angevin foundation of the city. It is located in the Montedoro district, hence “San Nicola di Montedoro” [
20]. The church preserves its original structure, despite the internal transformations of the seventeenth century. The structure is characterized by a modest rectangular hall and late medieval architectural elements visible especially on the outside. The simplicity of the external façade is embellished only by the roof with raised pitches that intersect and form two gables with cladding made with the typical “
chiancarelle” (a type of limestone slab). The portal is surmounted by a lunette and a small radial rose window, while on the tympanum of the main façade stands a graceful bell tower (
Figure 2c). The interior consists of a single room and has two baroque altars in stone. On the walls, frescoes are visible, painted on two layers (
Figure 2d) [
1].
4.1.2. San Cono Bridge
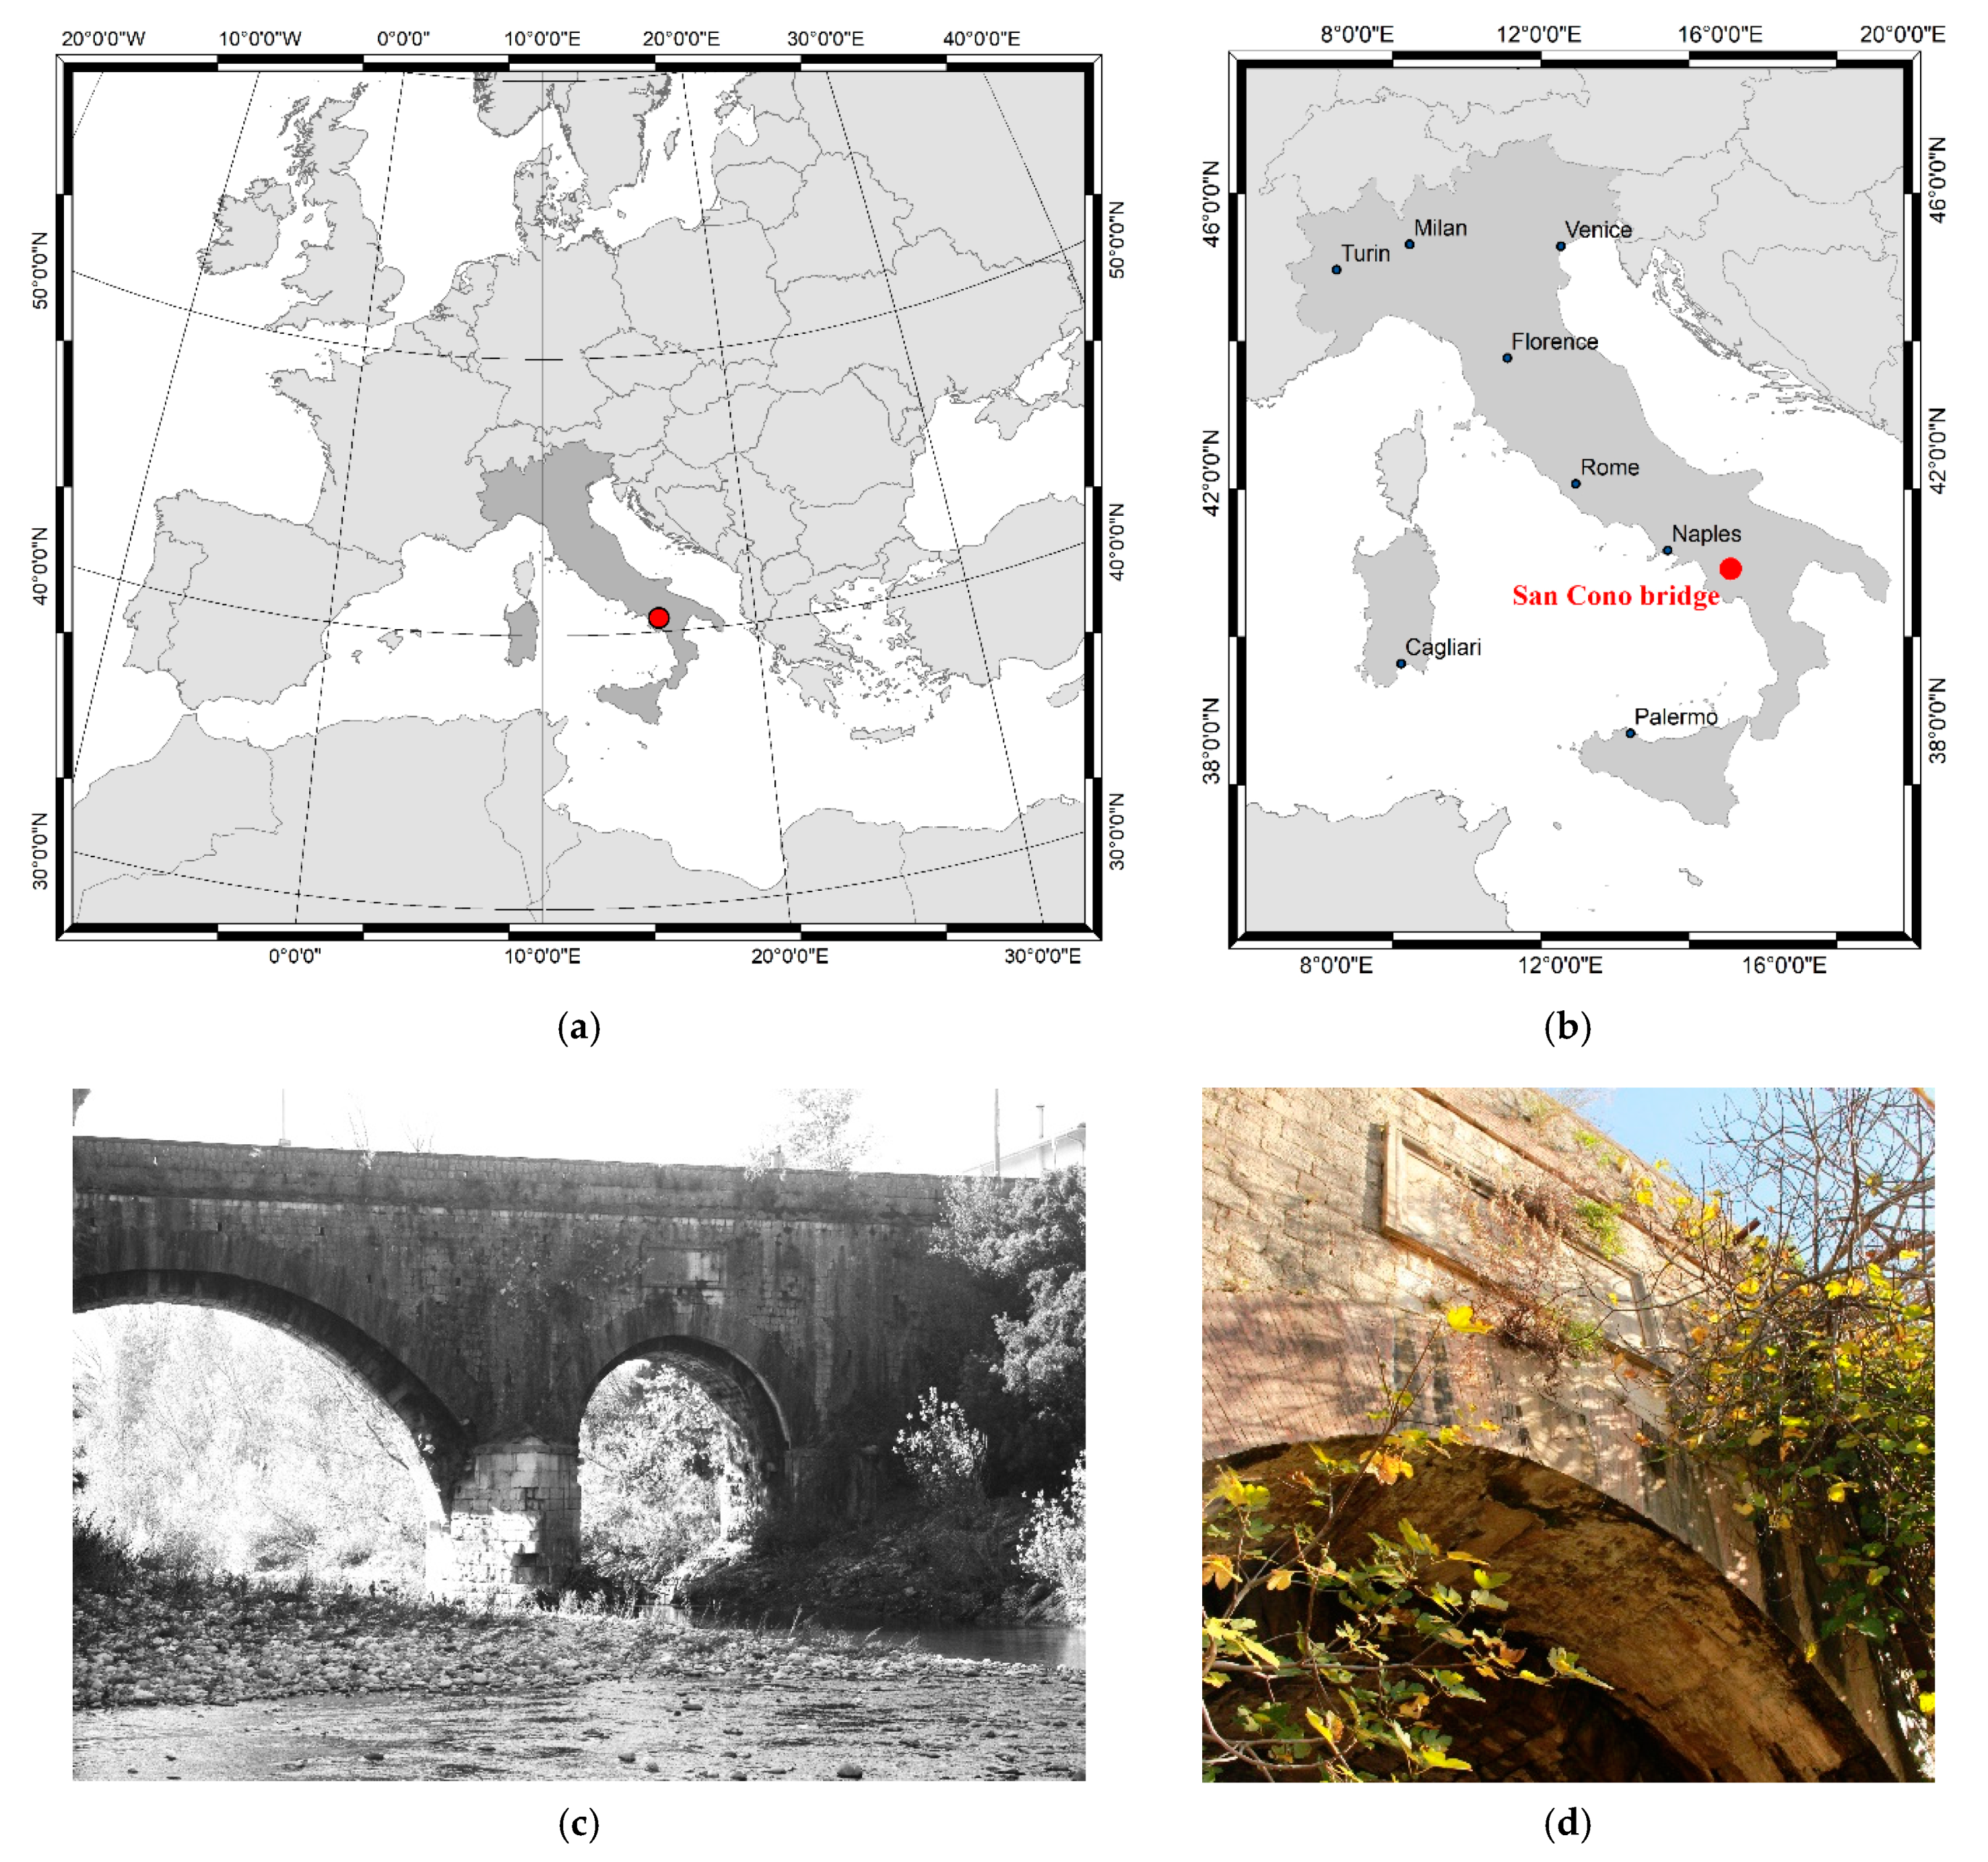
San Cono bridge spans the Bianco river located in the municipality of Buccino, in southern Italy (
Figure 3a,b). As reported by the inscription on the bridge, the construction of San Cono bridge can be dated to the Augustan age (
Figure 3c).
Originally, the bridge had a pronounced donkey-back profile with two shoulders and a steep slope at the ends and a pylon with a triangular rostrum [
20]. Now, the current shape of the bridge is incorporated into a new bridge, which in 1872 levelled the road and widened the site (taking it from 3.20 m to 6.45 m), covering it, so as to leave only the original arches visible, below the new ones. In this way, the intervention represented an exceptional example of respect for the ancient monument. As for the bridge architecture, it has two spans of unequal light, for a total length of 40 m. Part of the ancient arches can still be seen below the nineteenth-century one, which changes its profile. The central round arch has a light of 17.3 m and at the base there are five projecting brackets with three others at a higher altitude to complete the support of the rib; the minor arc has a light of 5.9 m with three shelves.
The original vestments of the tympani were in square work; today they are inserted in the new 19th-century vestments, with an upper parapet that modifies the original donkey back profile [
20] (
Figure 3d).
4.2. Three-Dimensional Point Cloud of San Nicola in Montedoro Church
4.2.1. Three-Dimensional Survey of the Church
The survey of the church was carried out through the use and integration of active and passive sensors, terrestrial and aerial. In particular, the external façade was surveyed using a TLS, the inner part using a digital single-lens reflex (DLSR) camera with fish-eye lens and the upper part of the building (i.e., the roof and other architectural elements not visible through a terrestrial survey) through the use of a camera mounted on a UAV platform.
Before performing the surveys with photogrammetric techniques and laser scanners, a survey with a total station was performed. The survey was carried out by TS30 Leica Geosystems. This total station allows discrete points to be acquired with an angular precision of 0.5” (0.15 mgon) and to acquire distance with prism (precision of 0.6 mm + 1 ppm) and without prism (2 mm + 2 ppm).
In this case study, the survey was carried out by two base stations. In this way, it was possible to obtain horizontal and vertical angular observations of the ground control points (GCPs). The GCPs, inside and outside the building, were chosen so as to be easily recognizable even on the image (
Figure 4). The post processing of the data was carried out in LGO (Leica Geo Office) developed by the Leica Geosystem company.
4.2.2. Survey of the Terrestrial Laser Scanner of the External Part of the Structure
Regarding the generation of the model for the external part of the church, the survey was carried out by a terrestrial laser scanning survey. In this case study, FARO FocusS 350 instruments were used because specially designed for outdoor applications. HDR imaging and HD photo resolution (overlay up to 165-megapixel colour) ensure true-to-detail scan results with high data quality (distance accuracy up to ± 1 mm). The main features of this scanner are summarized in the following
Table 1:
In order to cover the entire external surface of the church, three acquisition stations were built.
The post-processing of the TLS scans was performed in Autodesk Recap software. This software, where the word “Recap” stands for Reality Capture, allows a fully automatic recording of the scans. In the case the procedure is partially successful, the software allows manual identification of targets and natural homologous points, to reduce distance among contiguous scans, improving their alignment using the iterative closest point (ICP) algorithm [
21].
4.2.3. Unmanned Aerial Vehicle (UAV) Photogrammetry to Obtain the 3D Point Cloud of the Upper Part of the Church
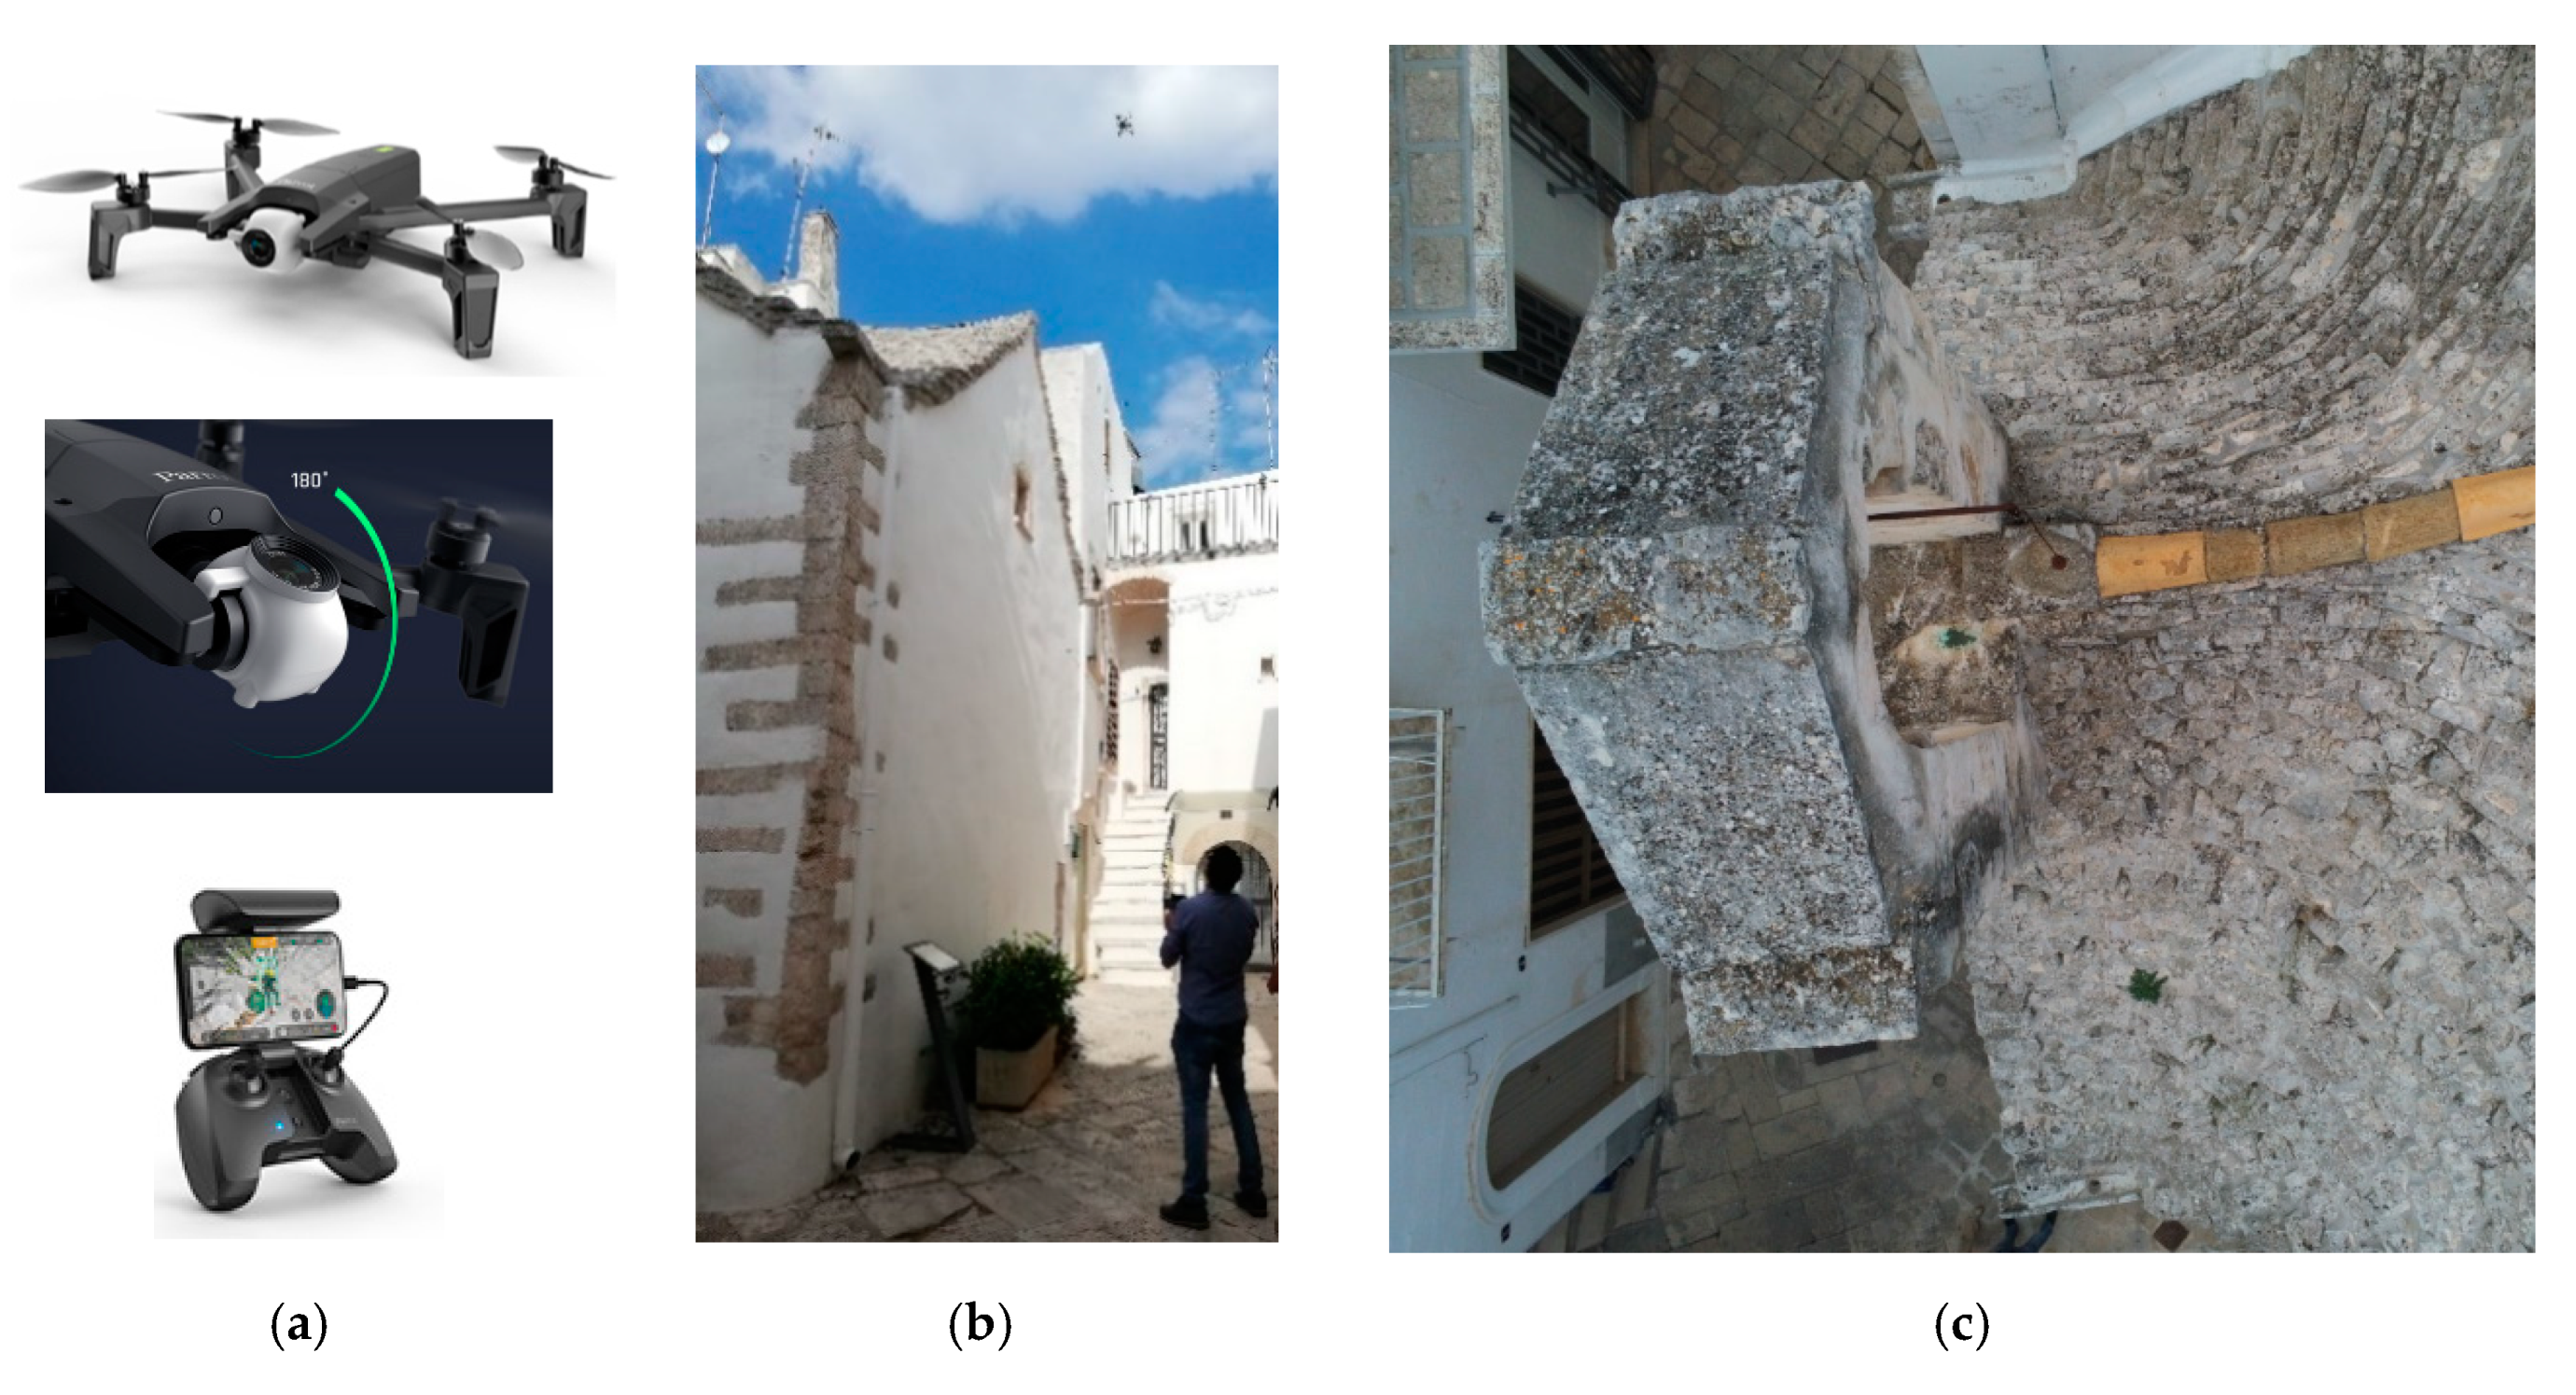
The aerial survey was carried out using a Parrot Anafi, a UAS (unmanned aerial system) quadcopter equipped with a Sony Sensor
® 1/2.4” 21MP (5344 × 4016) CMOS (complementary metal-oxide semiconductor), which allows obtaining, thanks also to a 3-axis stabilizer, clear and detailed images (
Figure 5a). The distance between the UAV and the building was really close due to the presence of many obstacles in the old town where the church is located. Consequently, the images were acquired with high geometric resolution (
Figure 5b). In any case, the photogrammetric survey was carried out with a high degree of overlap between the images. In addition, by varying the tilt angle of the camera, it was possible to acquire images of every part of the building. In this way, it was possible to build a network of the 97 images with a high degree of overlap and convergent image configuration (
Figure 5c).
Taking into account 5 GCPs, the root mean square error (RMSE) for spatial coordinates, evaluated on the cameras used in this dataset, was of 0.009 m; in particular, this RSME refers to the georeferencing process of the images and not to the resolution of the model. In addition, the modelling of the roof was obtained through the insertion of its own and accidental load.
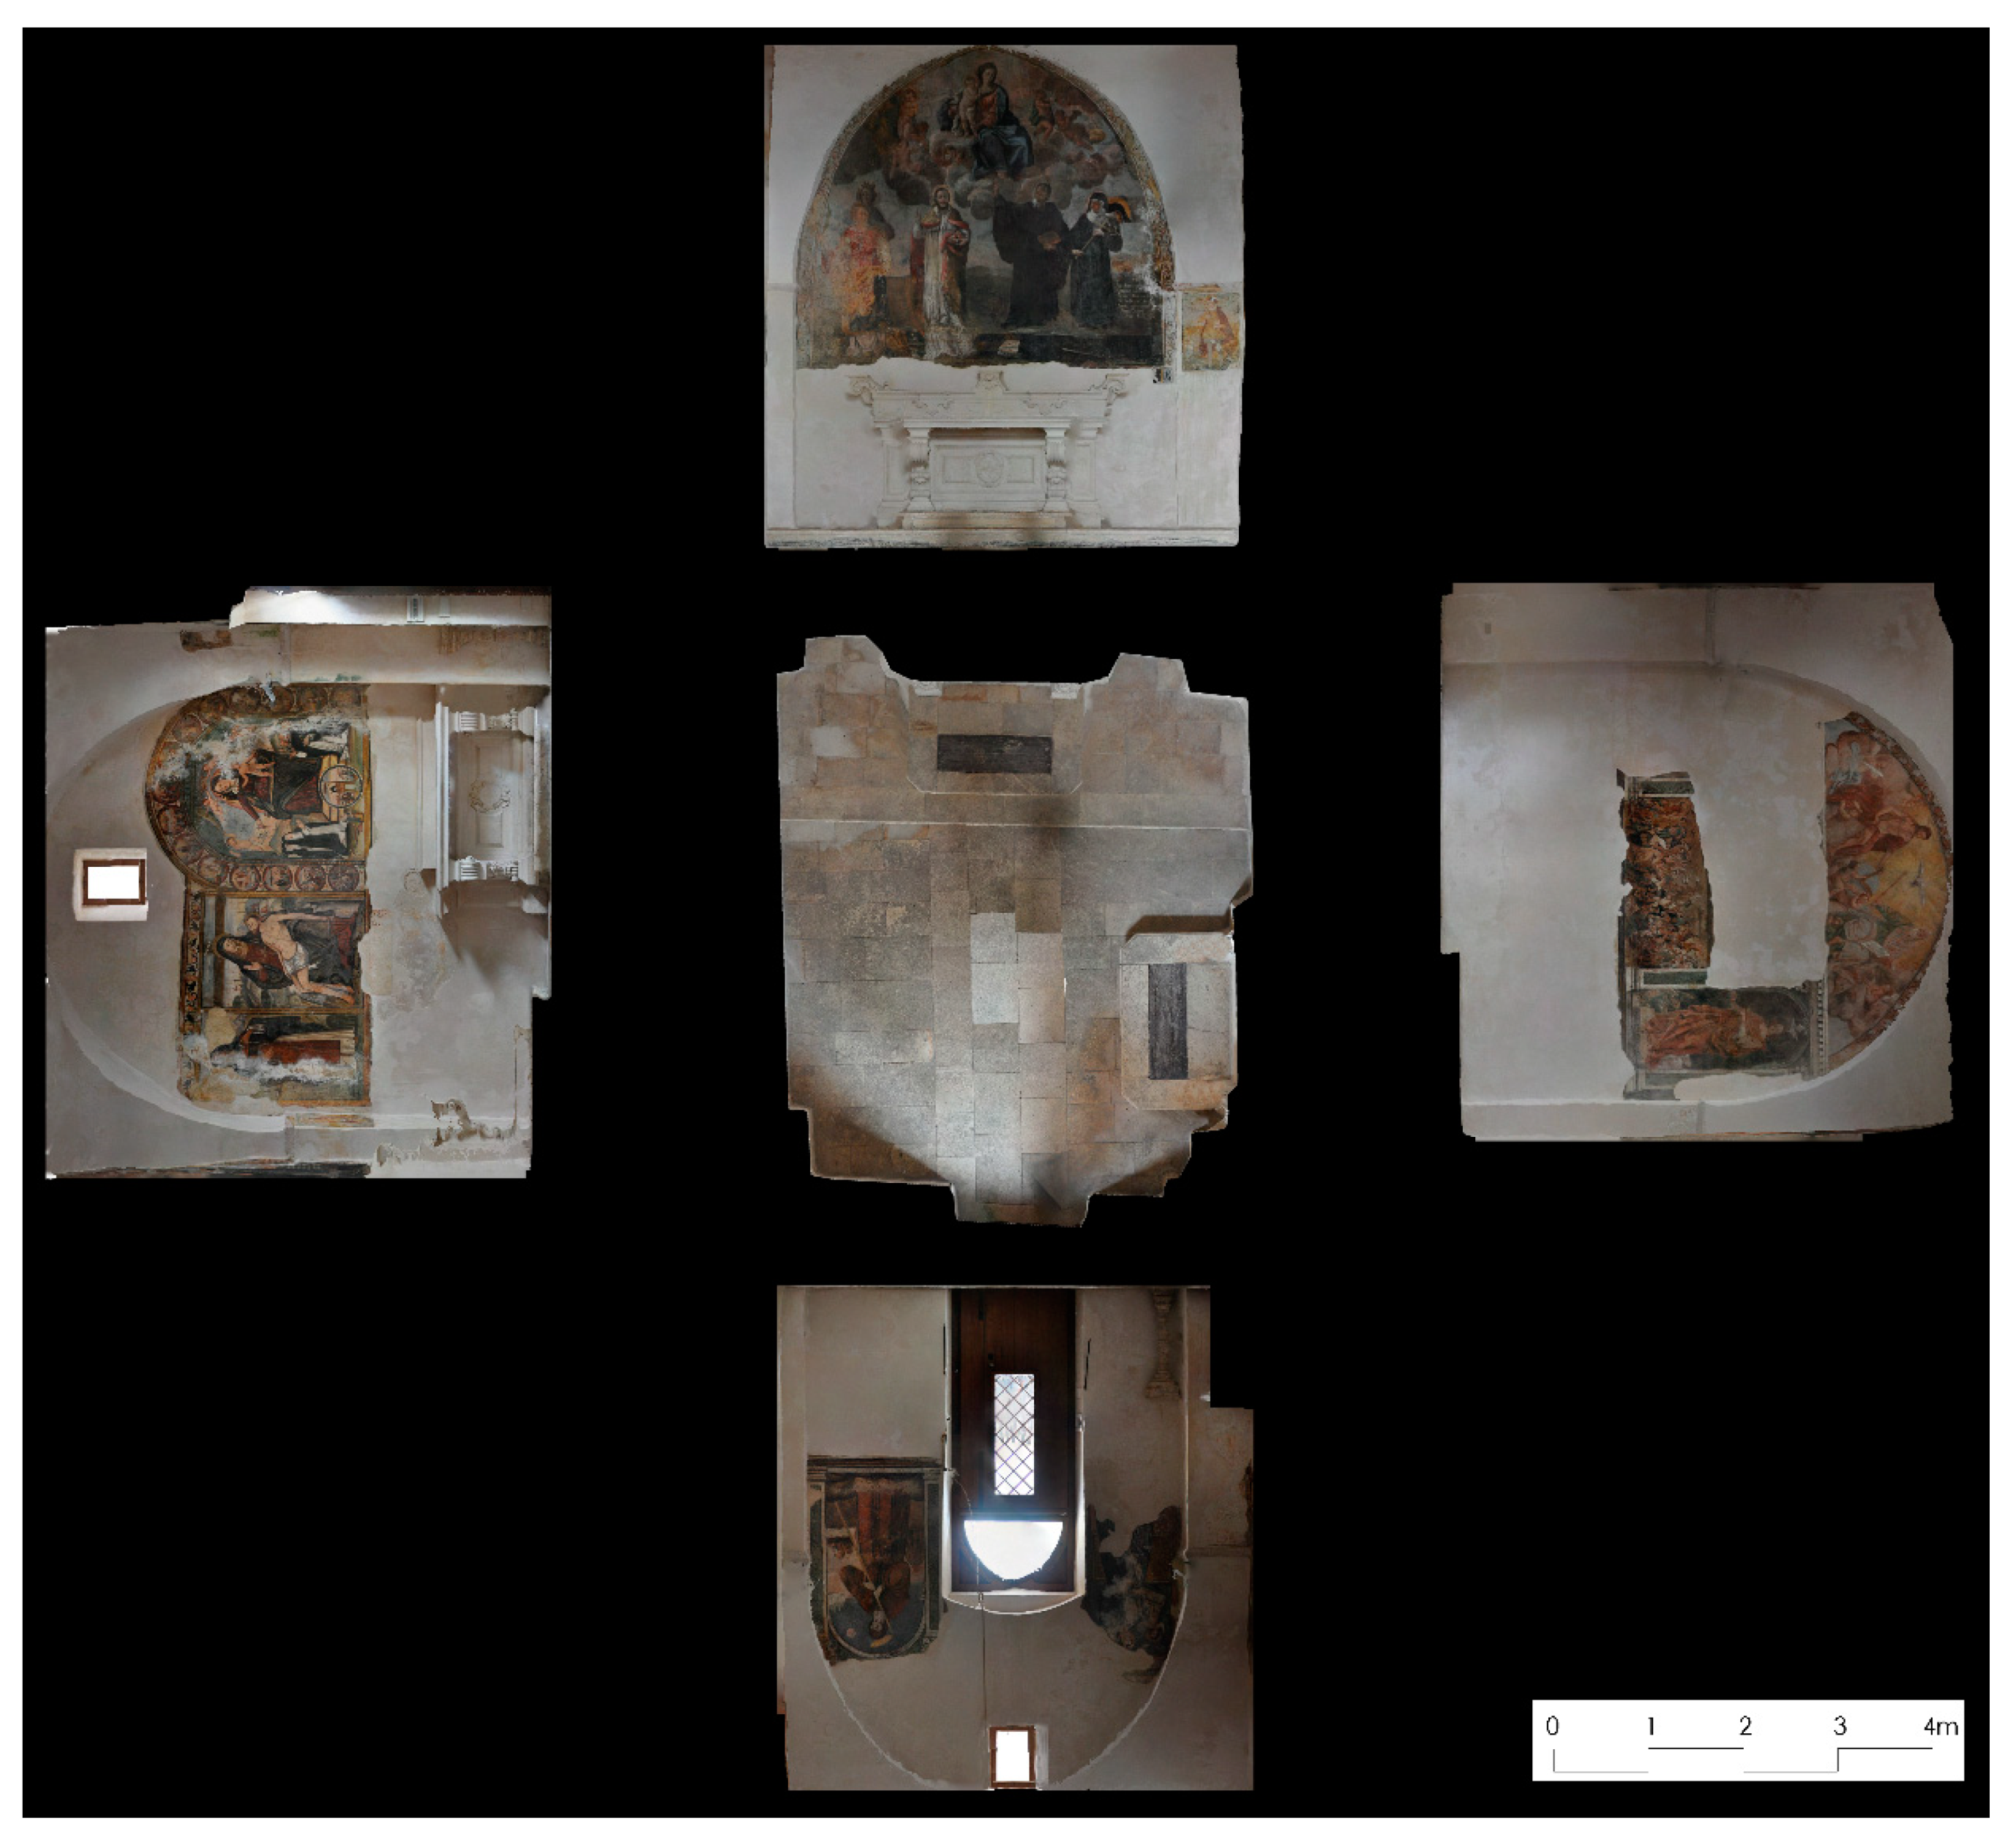
4.2.4. Photogrammetry of the Internal Part of the Structure Using a Fisheye Lens
For the interior of the church, since there are also frescoes of great historical and cultural value and considering the rather restricted environment, a photogrammetric survey was carried out using a Nikon D5000 DSLR camera with a calibrated fisheye lens (focal length 10 mm). The fisheye is a wide-angle photographic lens that allows a wide scene to be observed. This type of lens has been used successfully in the photogrammetry field, as shown in Kannala and Brandt, 2006 [
22], especially in narrow spaces. In self-calibration mode, the dataset of the 22 images was processed in Agisoft Metashape software. The total error, i.e., standard deviation evaluated on 6 GCPs, was 0.003 m.
Considering the high value of the frescoes and the architecture of the small altars inside the structure, orthophotos of each single façade and floor were taken. In order to carry out this task, it was necessary to build a mesh of the interior of the structure. Subsequently, identifying the planes of the single façade, the orthophotos with a geometric resolution of 0.1 mm of the interior of the church were built (
Figure 6).
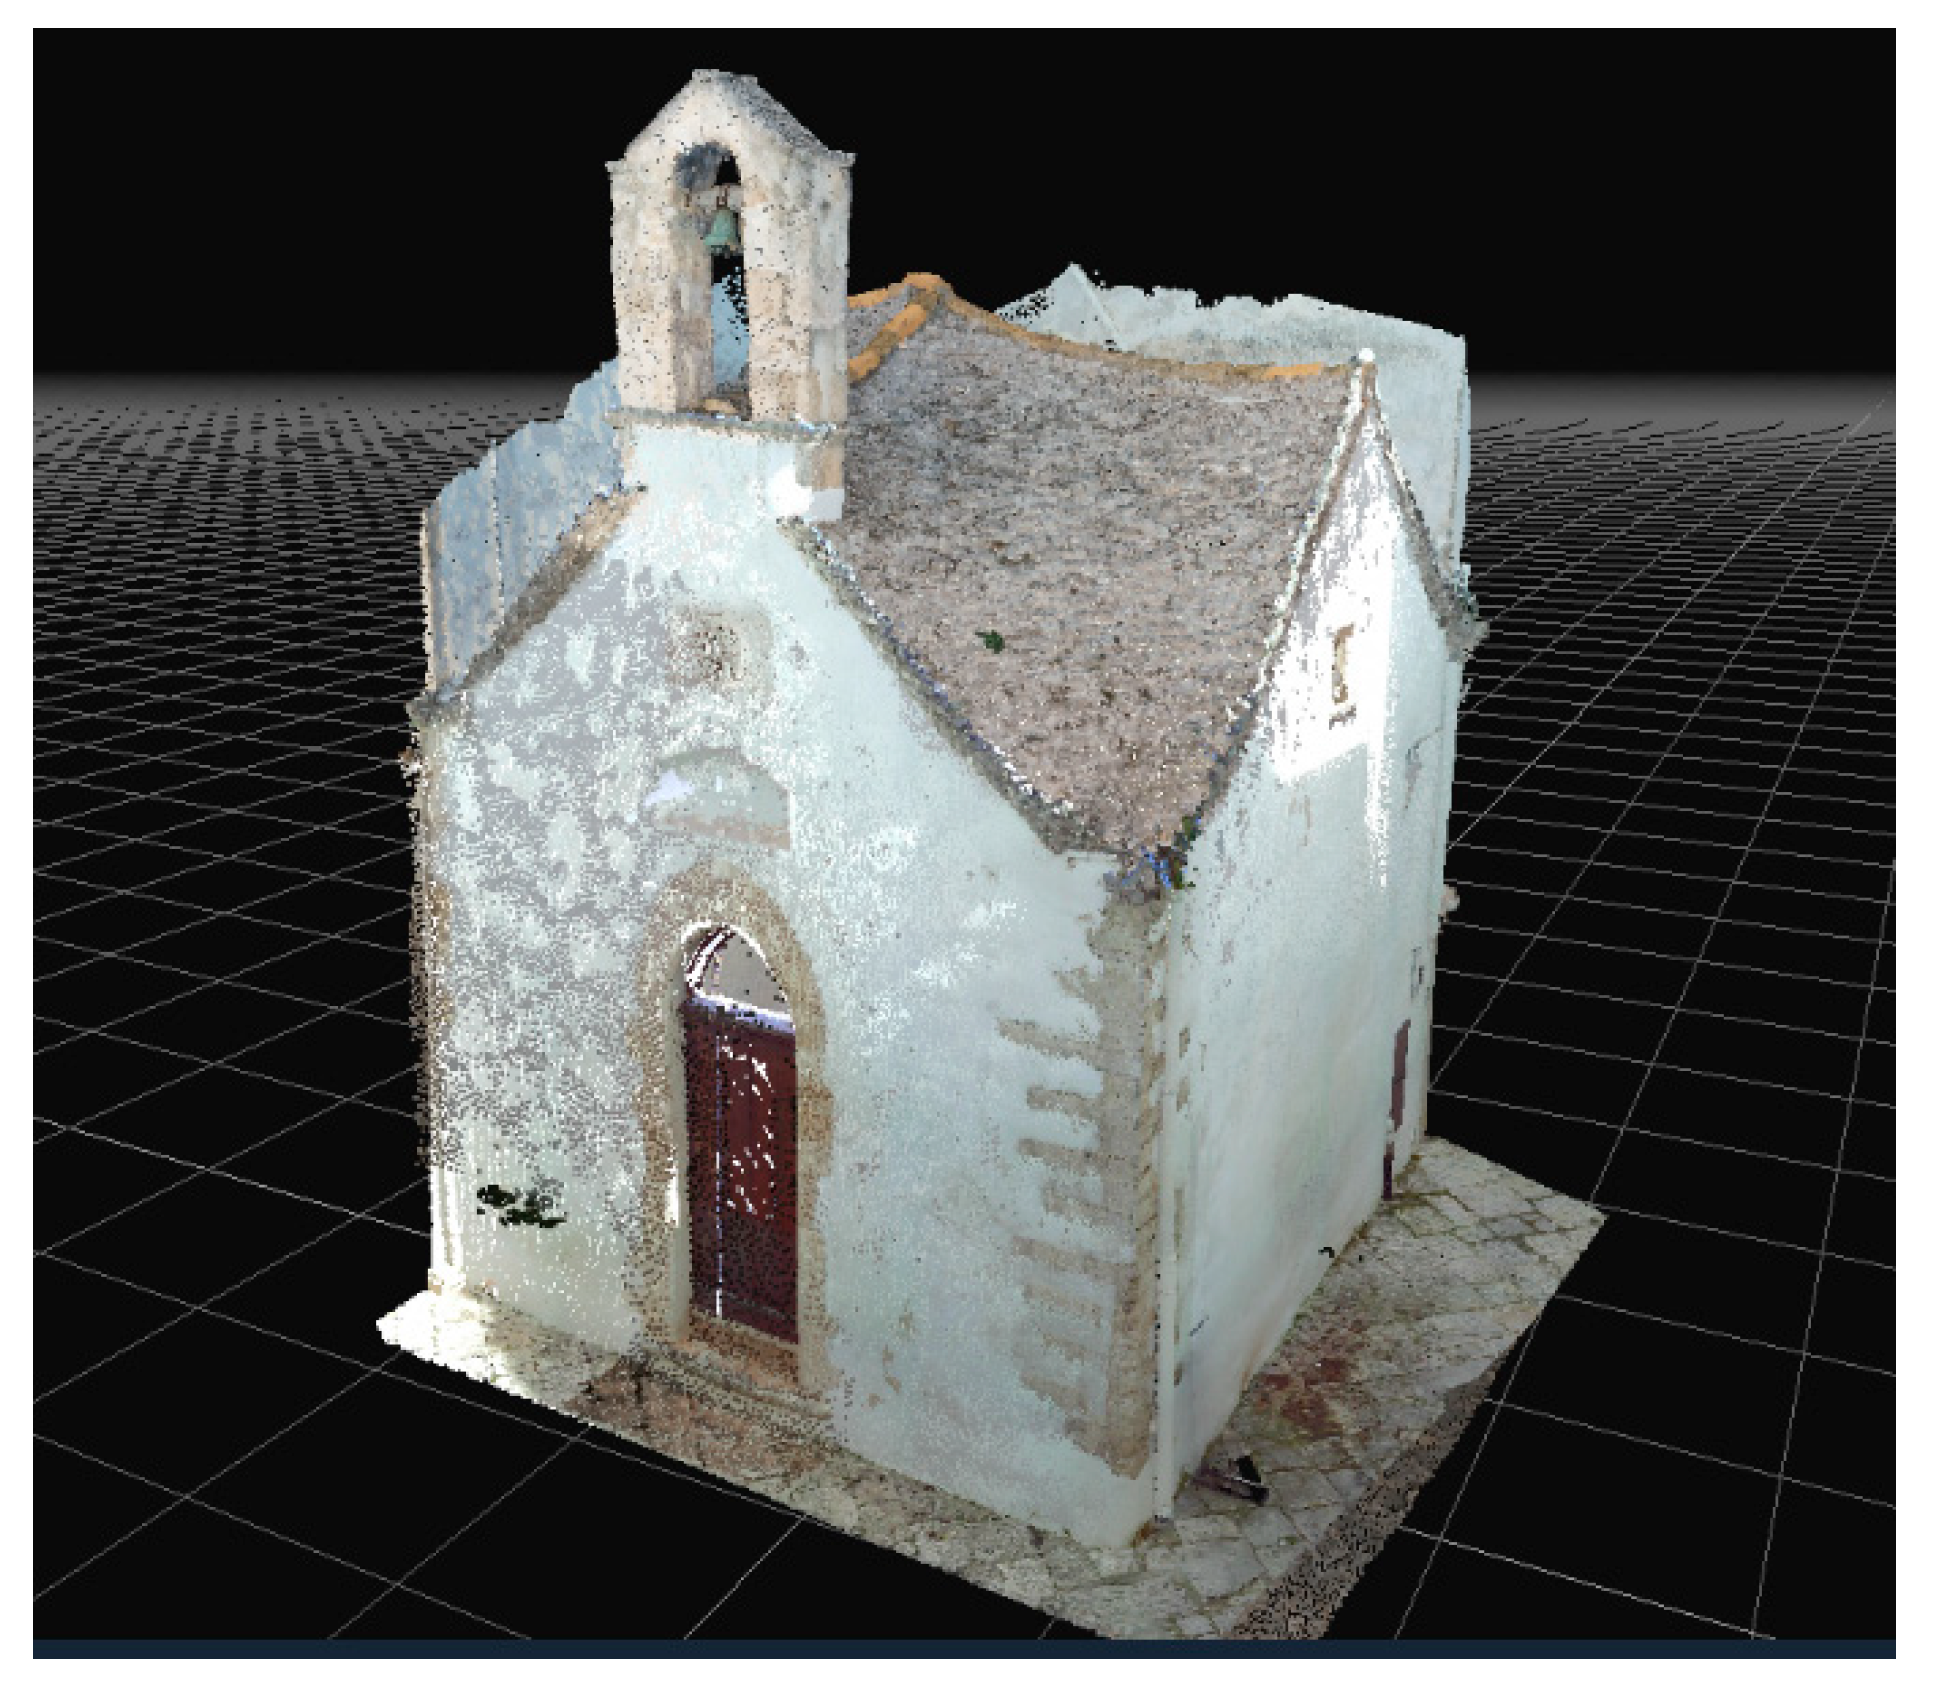
4.2.5. Merging of the Datasets (Point Clouds)
Through the survey activity and post processing of the data obtained either with IBM or RBM methods, it was possible to obtain three datasets, as shown in
Table 2.
The several point clouds were merged in a single point cloud on the base of common point. This task was carried out in 3DF Zephyr environment, which is a commercial photogrammetry software, developed and marketed by the Italian software house 3DFLOW. A representation of the whole structure according to point cloud is shown in
Figure 7.
4.3. Three-Dimensional Point Cloud of San Cono Bridge
In order to build the 3D model of the bridge, the photogrammetric survey was divided into an aerial and a terrestrial one. Taking into account the scale of representation (SR) and the aim of the project, a Ground Sample Distance (GSD) equal to 1 cm was chosen as reference for the survey. The terrestrial survey was carried out in order to survey the lower part of the bridge using a Canon EOS 100D DSLR camera (Charged Coupled Device -CCD size = 4.29 μm) with a focal length of 18 mm. A total amount of 400 terrestrial images was acquired. As regards the aerial survey, this was carried out using a UAS Xiaomi Mi 4K, a multi-copter rotary wing weighing less than 1.5 kg and whose declared maximum speed is 18 m per second (about 65 km/h). This UAV was developed and produced by Flymi, a company of Mi Ecosystem. The photogrammetric features of the camera mounted on UAV platform were: CCD size = 4.29 μm and focal length of 3.5 mm. The aerial survey was designed using a software called Mission Planner, which is developed by Oborne for the open-source APM autopilot project. The flight plan was designed with the following characteristics [
23]: 80% longitudinal (end-lap) and 60% transversal overlap (sidelap). In addition, flight lines (FLs) inclined at 30° and 45° were designed in a direction longitudinal to the bridge in order to increase the rigidity of the aerial photogrammetric block and, at the same time, to increase the redundancy of information with the data obtained from the terrestrial survey. In total, 285 images were taken during the aerial survey.
The post-processing of terrestrial and aerial images was carried out using Agisoft Metashape software. In this case study, two separate chunks were built: one involving aerial (UAV) surveying and another involving terrestrial surveying. To evaluate the quality of image matching (alignment step), the number of the projections and the error achieved on the single chunk were taken into account.
Table 3 shows the high quality of the image matching and, consequently, the correctness in the phase of acquisition, for both the aerial and the terrestrial surveys.
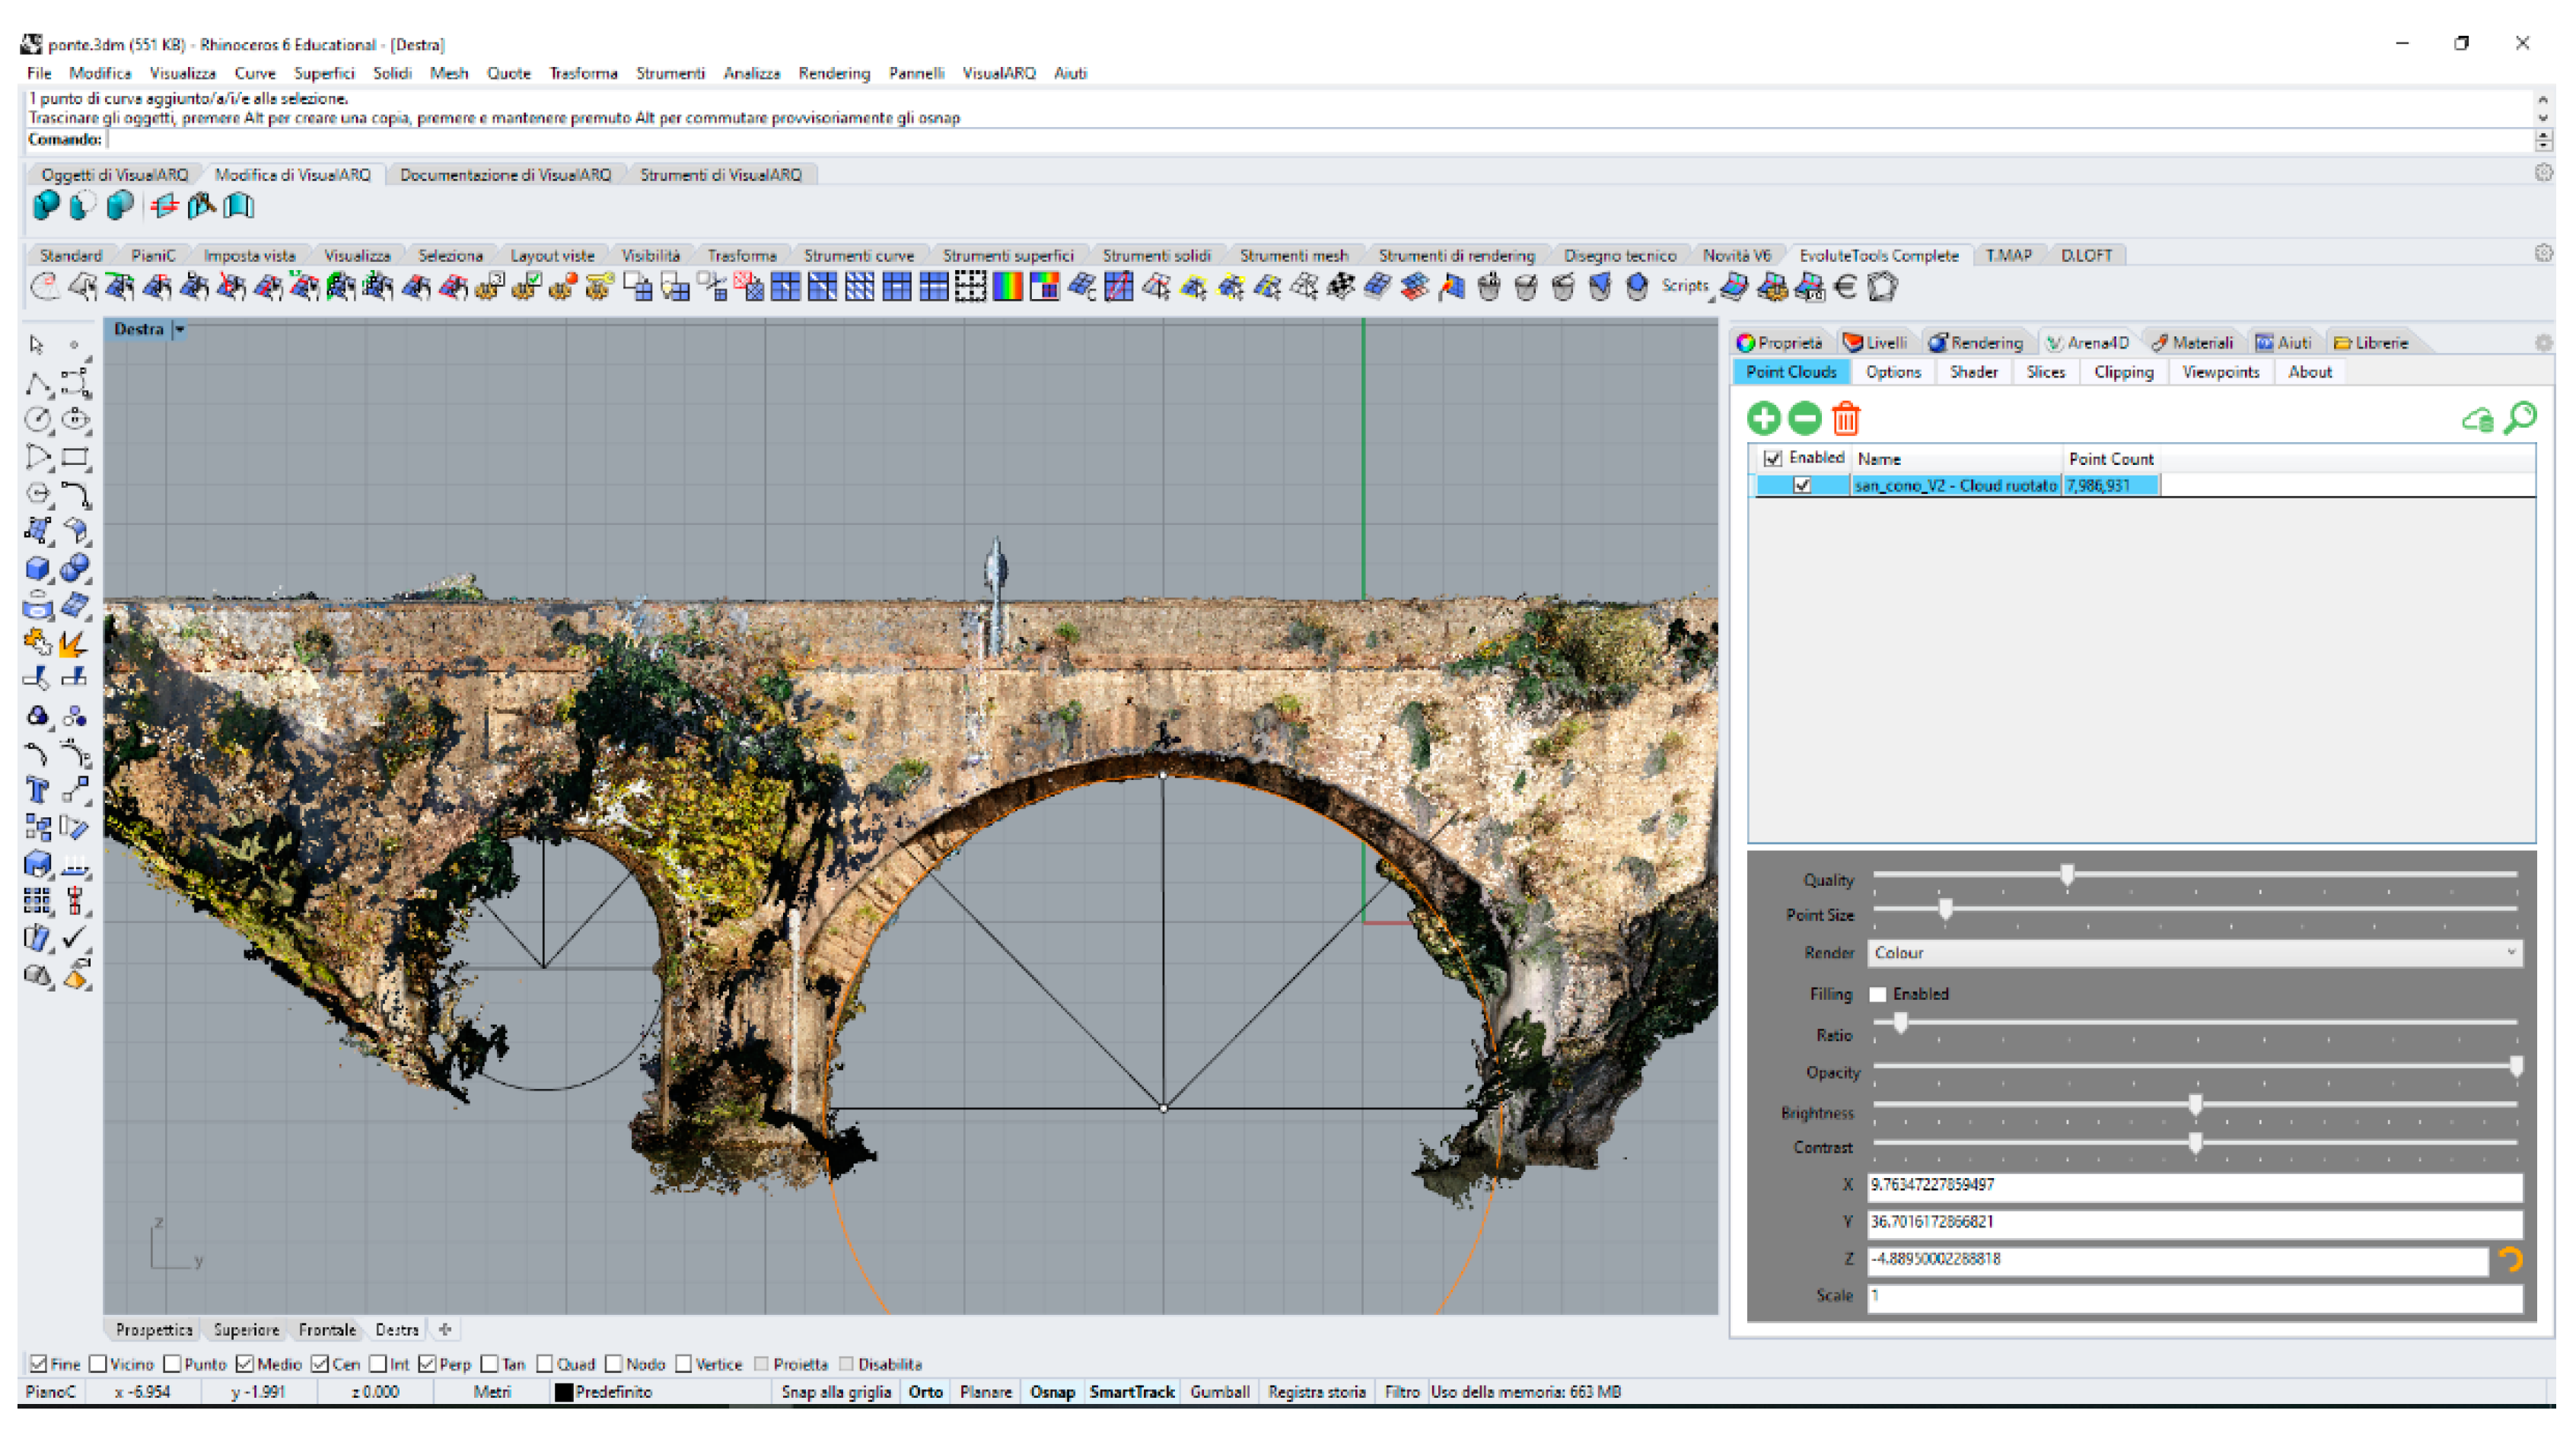
According to the photogrammetric pipeline, a dense point cloud was built for both datasets. Consequently, in order to obtain the model of the bridge under investigation, it was necessary to integrate the two datasets on the basis of common points. In total, the final 3D point cloud consisted of approximately 8 million points (
Figure 8). Subsequently, the model was scaled using 12 Ground Control Points obtained through a traditional topographic survey.
4.4. Three-Dimensional Reconstruction of the Models
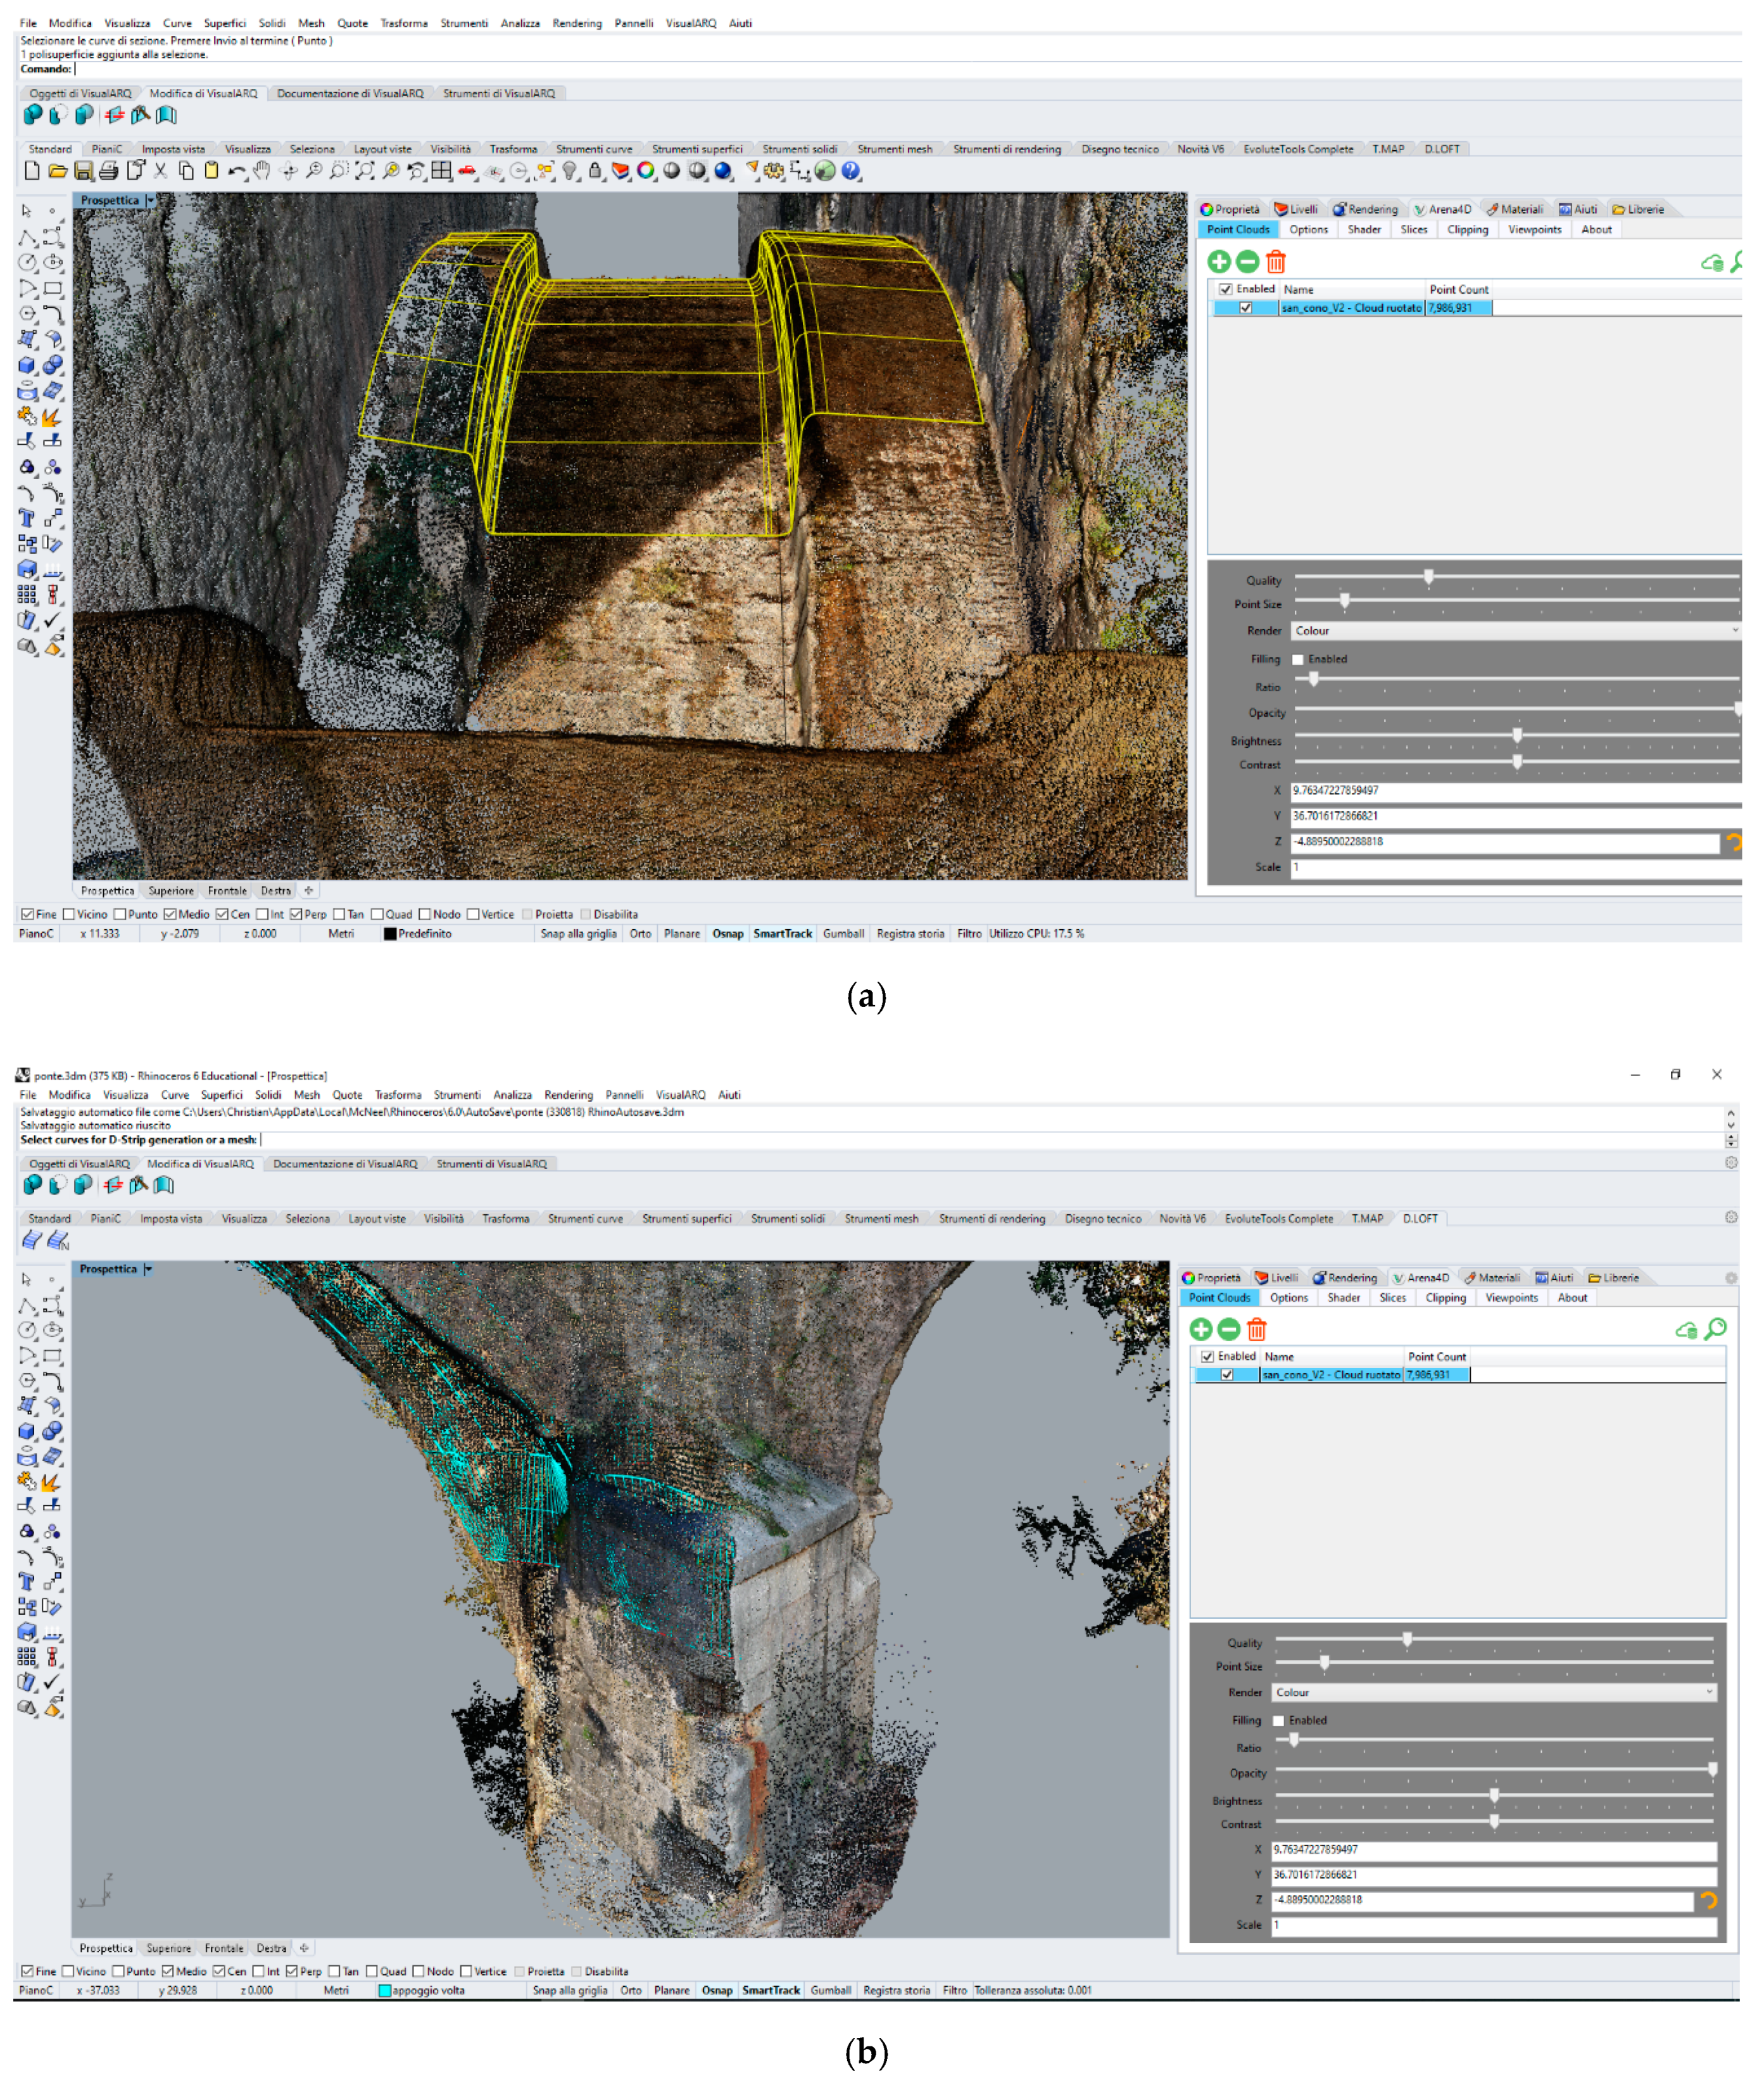
The point cloud obtained from the geomatics surveys must be classified in objects which the structure under examination consists of. The processes necessary to perform this task must take into consideration several parameters, such as noise, occlusions, the association between faces of neighbouring objects, etc. We carried out this task in Rhinoceros software because it has more tools and plug-ins for 3D modelling. The key point of this software application is the possibility of generating a profile of the structure and, especially, to build a surface that can be adapted to the point cloud obtained in geomatics surveys. Once the point cloud was imported into Rhinoceros, it was possible to reanalyse it using the Arena plug-in. In this way, the density of the points of the PC was decreased and, consequently, it was possible to assess if there were any holes in the 3D model. Within the Rhinoceros software, the tools available to users are quality, point size and the visual analysis tools (render, ratio, opacity). This allowed for editing the point cloud of the structure. Subsequently, the point cloud was dissected into several planes in space. This operation allowed sections in strategic points of the structure, such as the arches of the bridge (
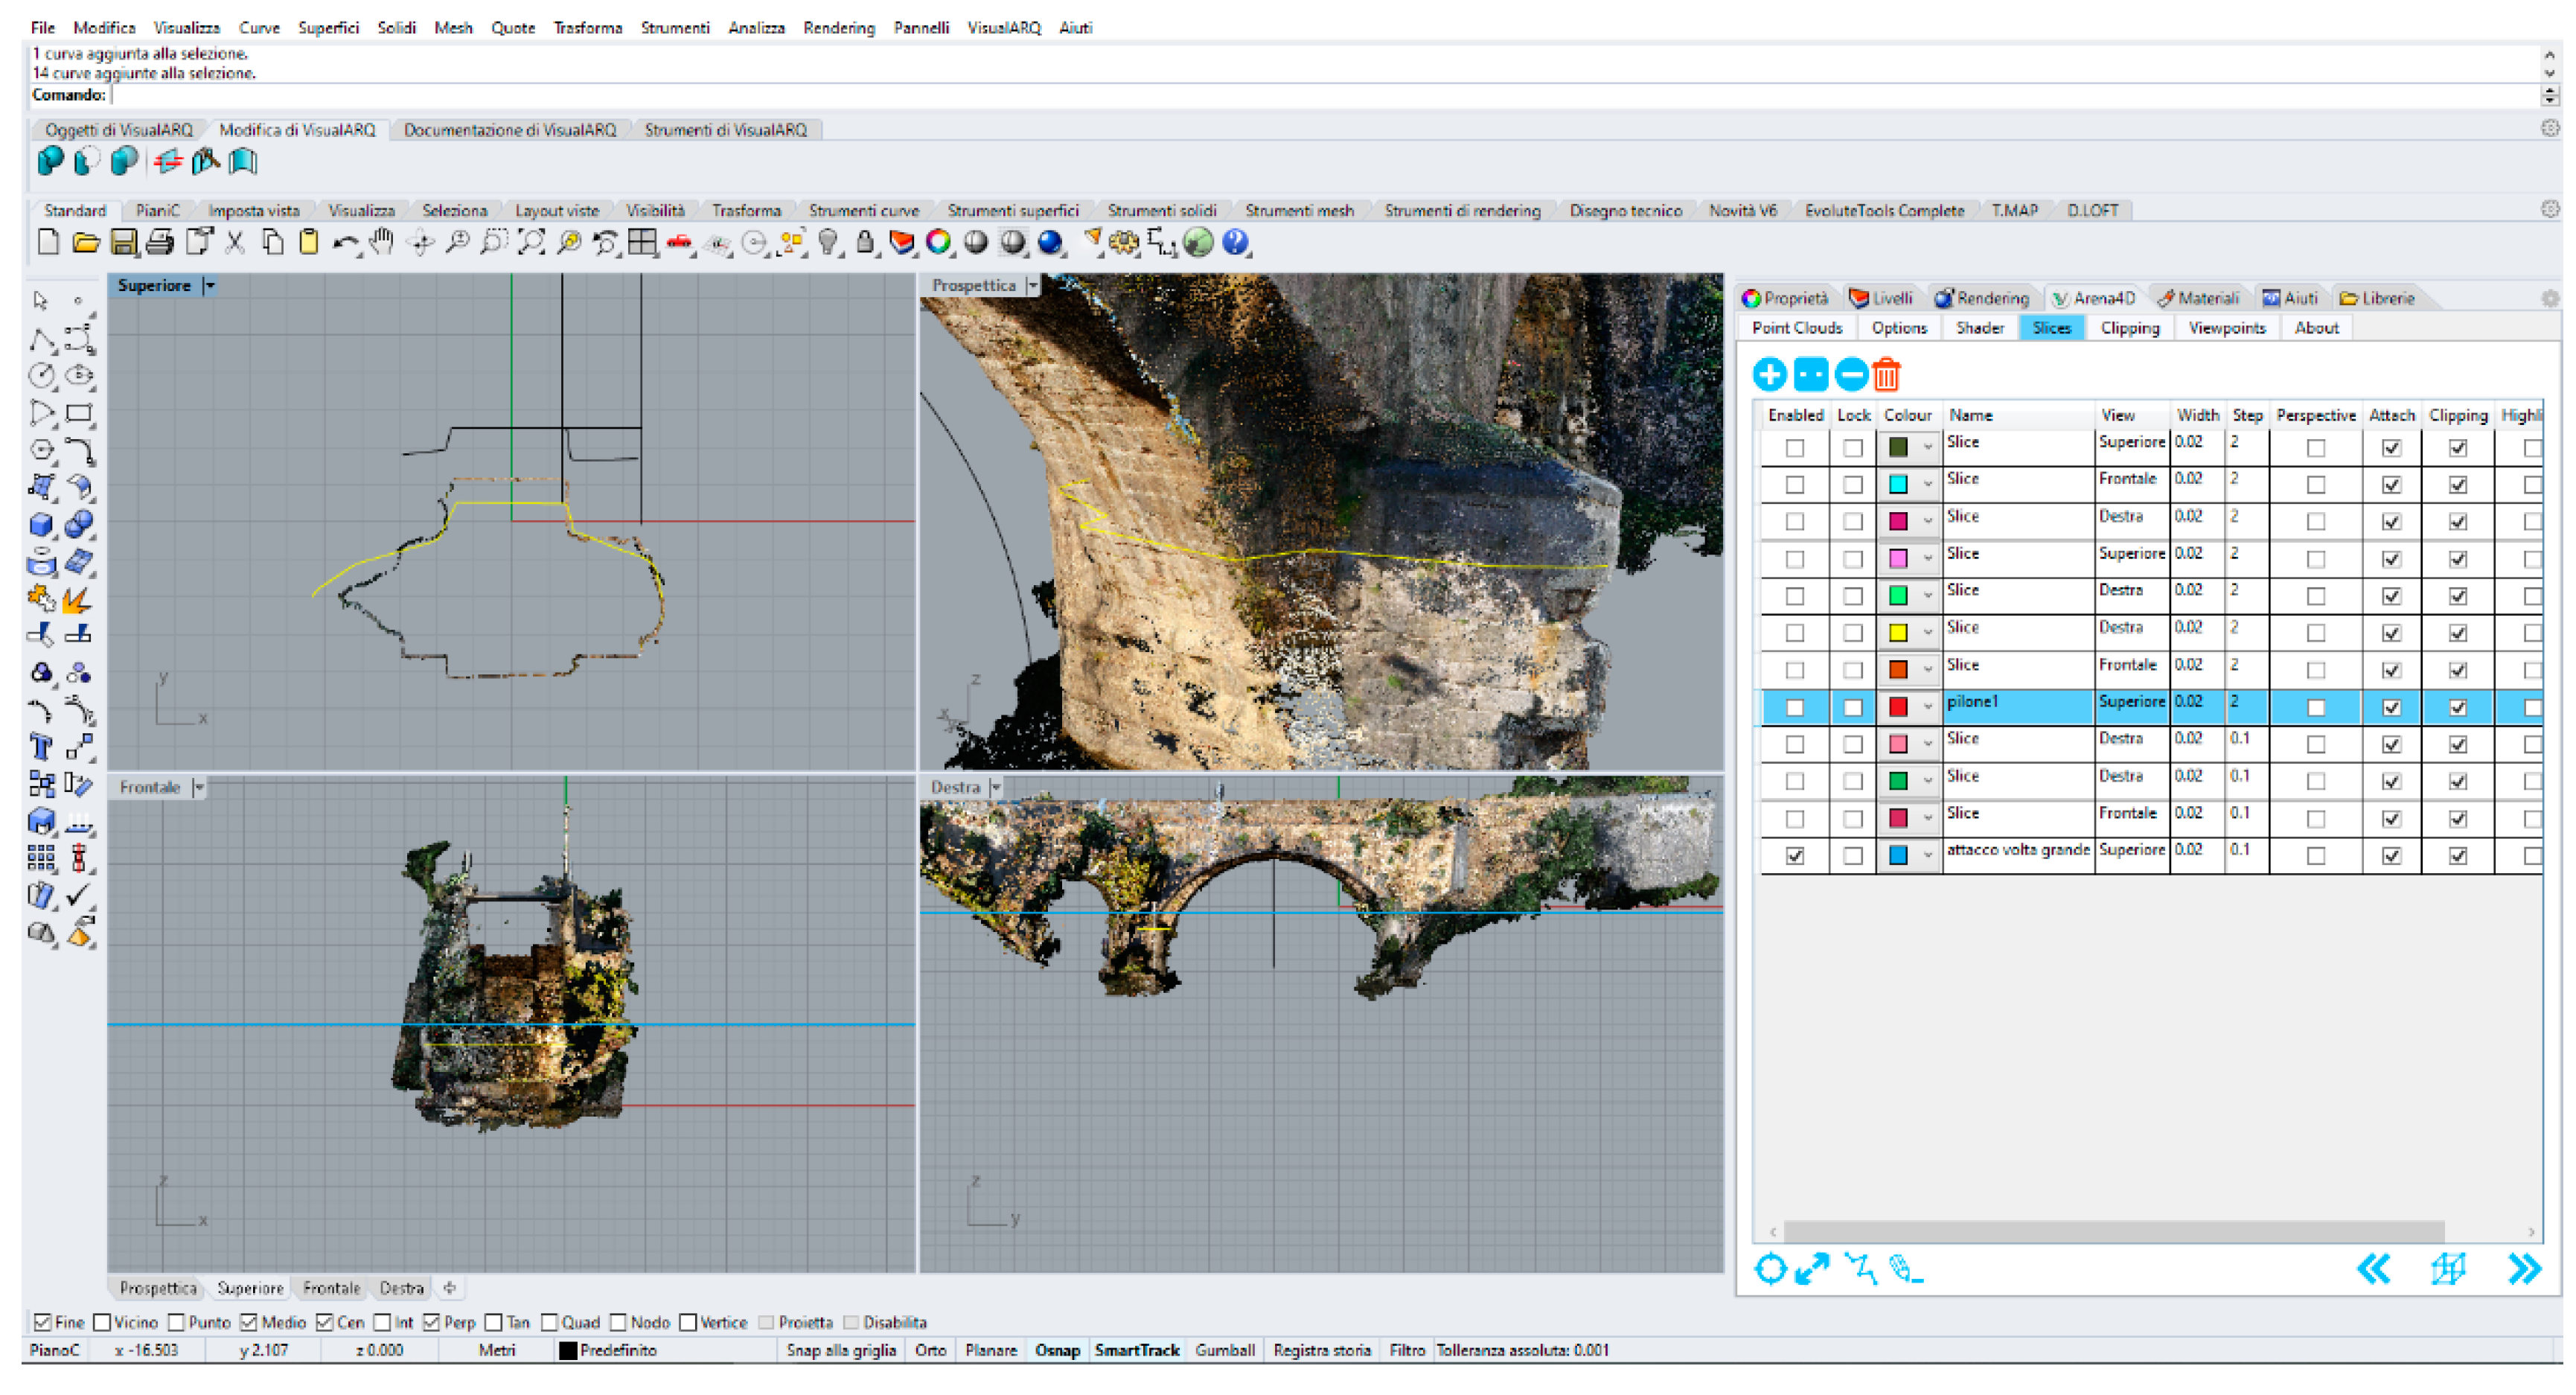
Figure 9), to be performed.
The plug-in allowed saving the sections in a specific layer. As a result, the sections were displayed as “construction plans” (see
Figure 10).
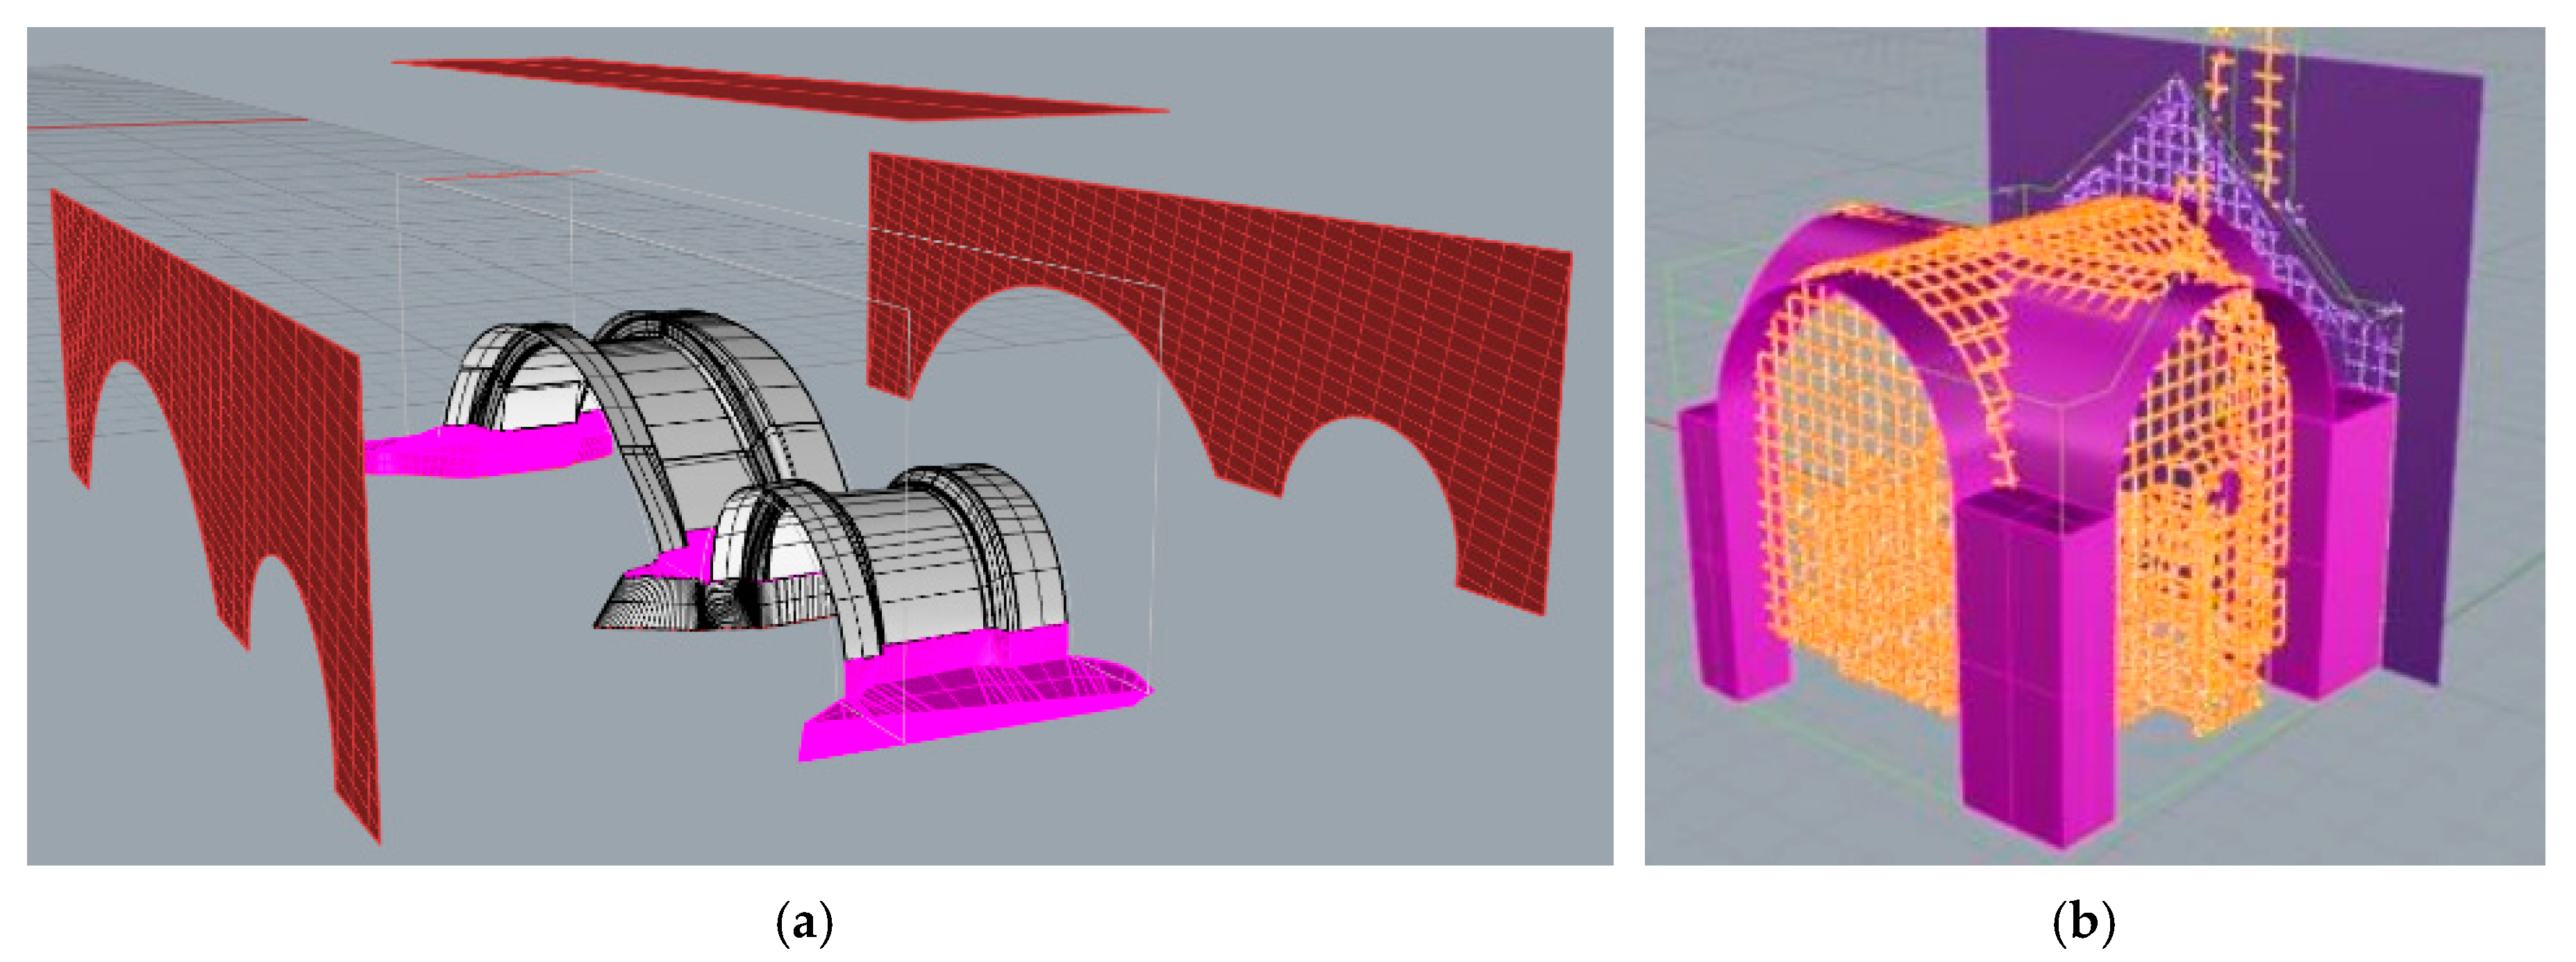
Sections that are transverse and longitudinal to the structure were used to create NURBS. Using the EvoluteTools PRO plug-in, it was possible to generate NURBS surfaces (
Figure 11a). This plug-in allowed us to shape NURBS surfaces on objects of the structure, exploiting both the sections and the point cloud through an appropriate algorithm developed within this plug-in. For example, the bridge pillar was modelled using an adaptive NURBS (
Figure 11b).
Of course, the time of the clustering task was related to the complexity of the structure. In this way, it was possible to create surfaces that represent the elements of the structure (vault, stack, retaining walls and superstructure of the bridge), as shown in
Figure 12a. Using the same procedure just described for the masonry bridge, it was possible to build a 3D model of the San Nicola in Montedoro church too (
Figure 12b).
Lastly, thanks to the development of the Grasshopper plug-in, it was possible to model similar structural elements (or parts of them) in 3D. Thus, it was possible to parameterize both from the geometric point of view and from the point of view of the type of material. For example,
Figure 13 shows the parameterization of the arch of the bridge using the tools developed in Grasshopper.
4.5. Building Information Modelling (BIM)
Many commercial BIM software products are available on the market. One of the most efficient is Autodesk Revit. The original software was developed by Charles River Software, founded in 1997, renamed Revit Technology Corporation in 2000, and acquired by Autodesk in 2002. Autodesk Revit allows users to design a building and structure and its components in 3D, annotate the model with 2D drafting elements and access building information from the building model′s database. Modelling in the BIM environment of the two case studies was carried out using Autodesk Revit software.
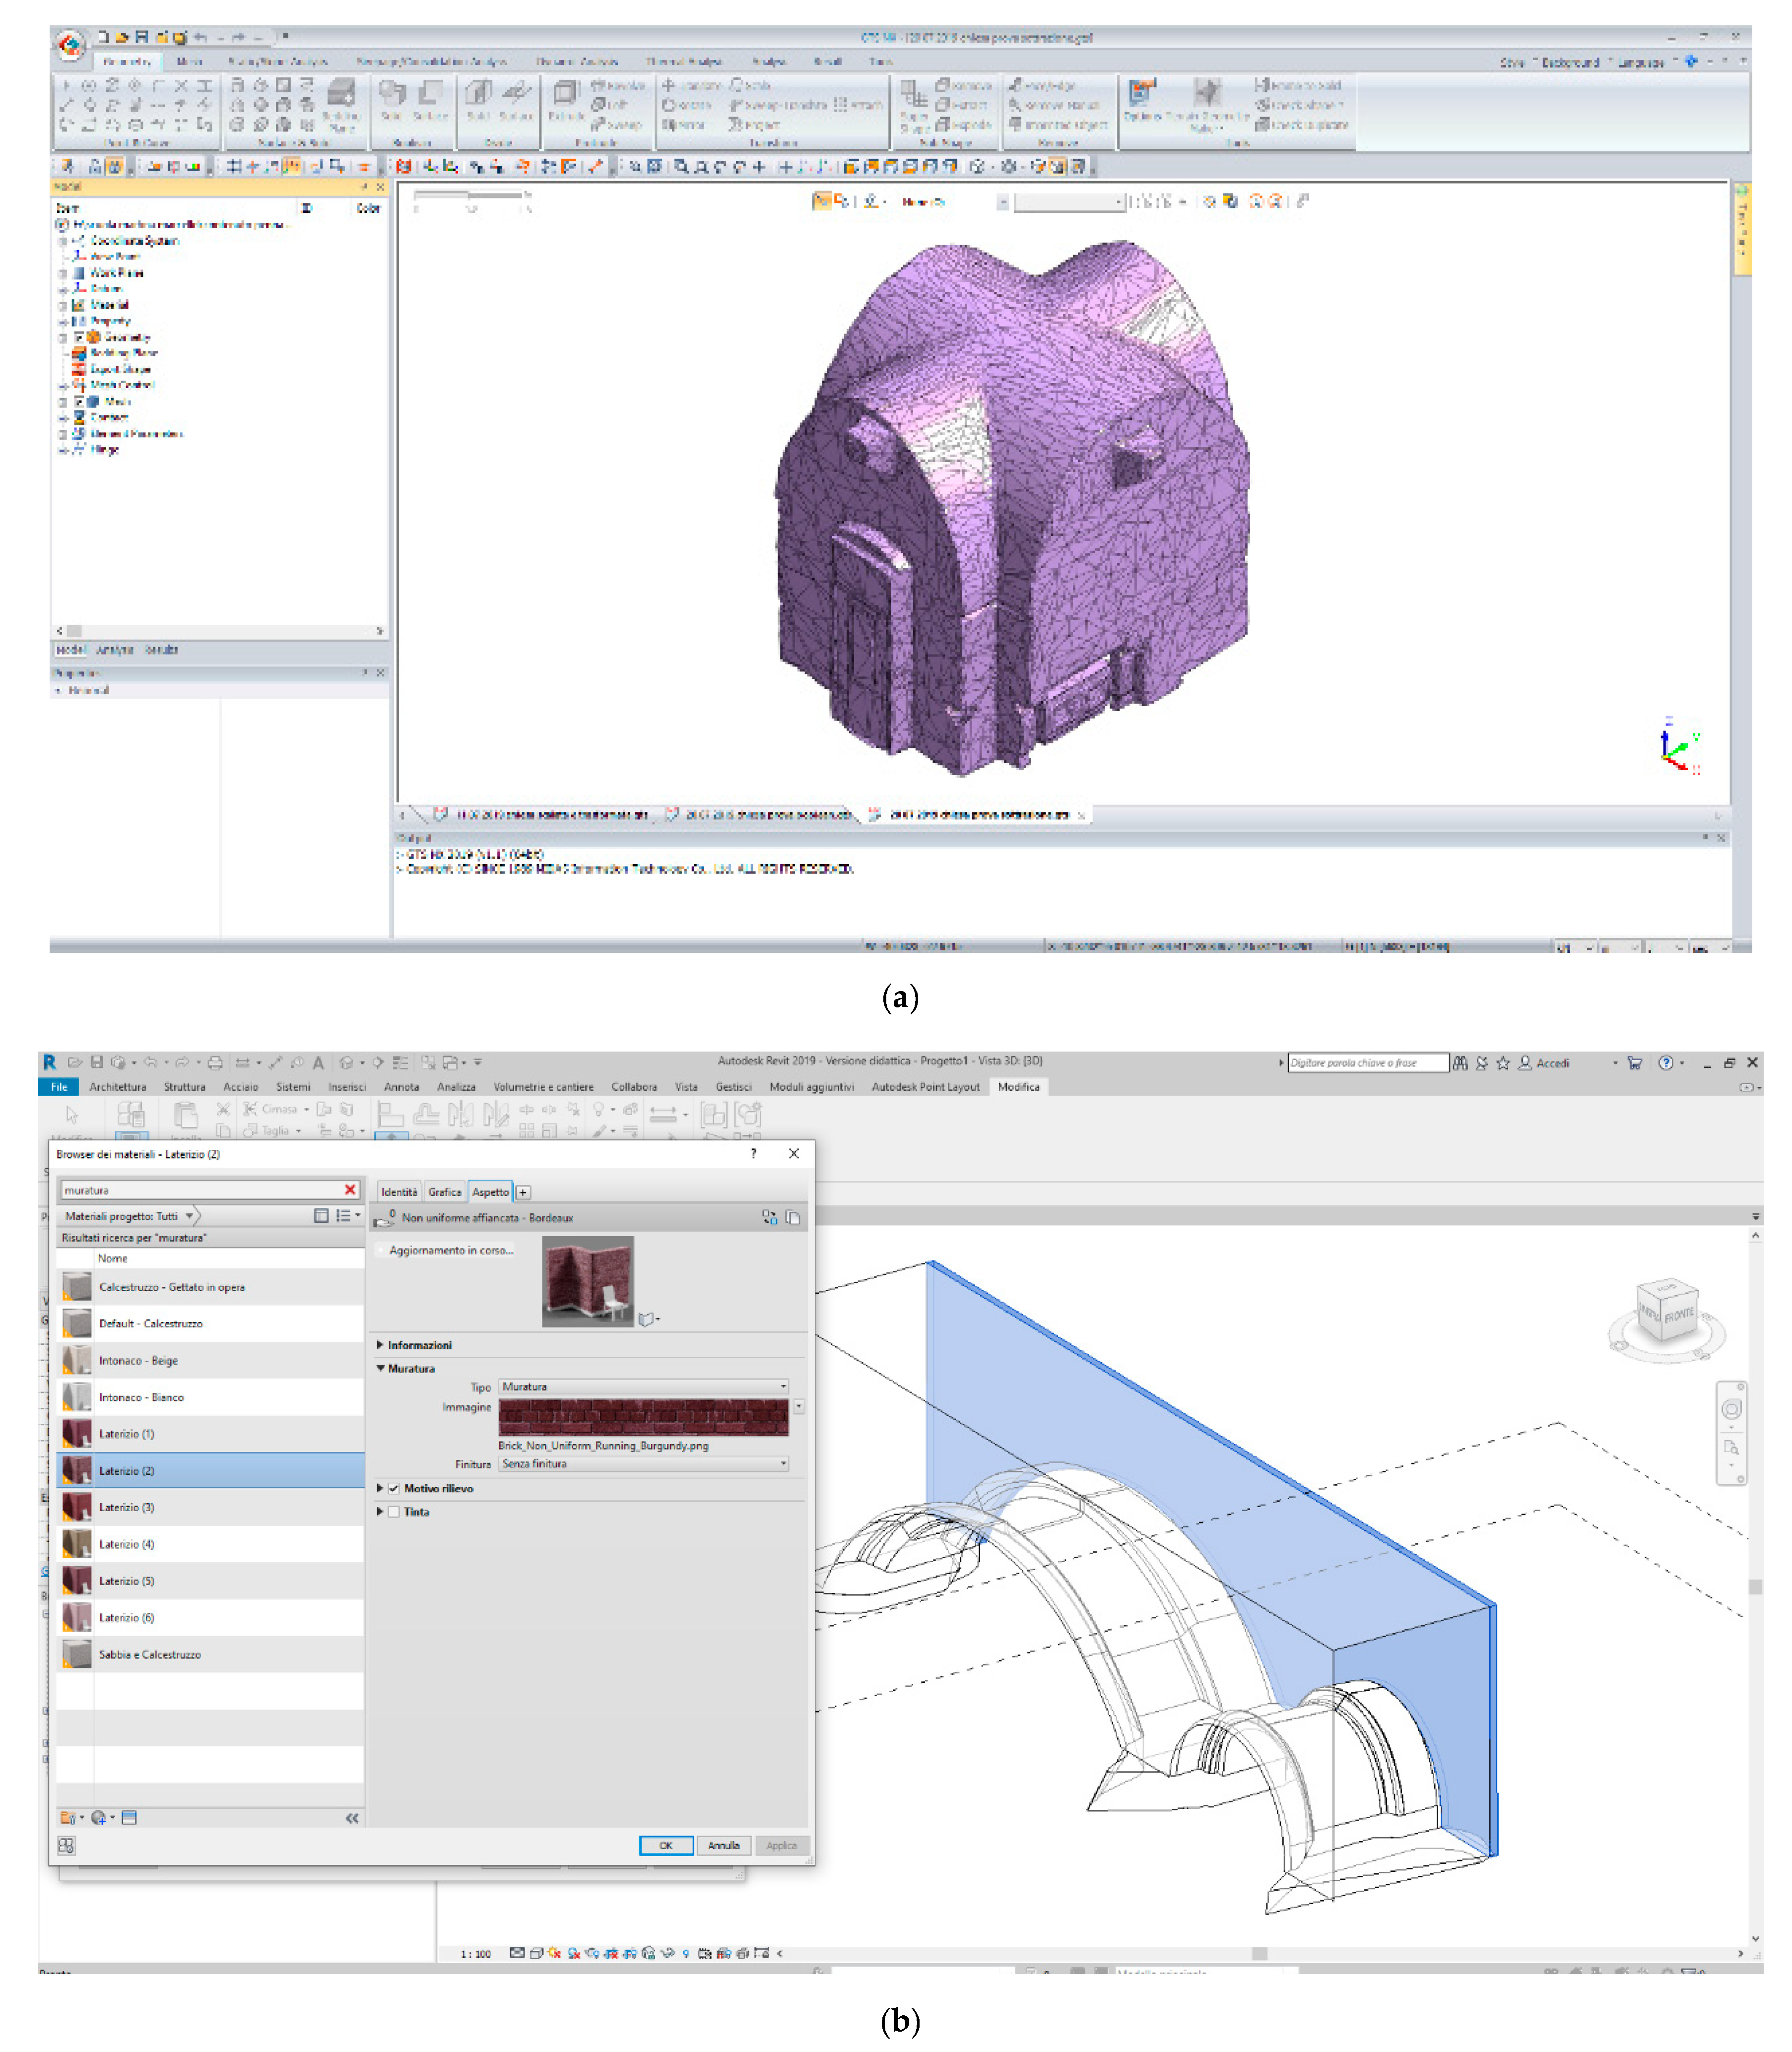
In both case studies, the resulting mesh surface obtained in Rhinoceros software in 3D ACIS Modeler (ACIS) format (*.sat) was imported into the BIM Revit software. In this way, the surface created can be quickly opened by the BIM software and can be easily manipulated with rotations and translations. The high detail of the polysurface allowed the precise determination of the levels for the creation of BIM objects. Screenshots of the modelling and management of the information in Revit software, both of the masonry bridge and of the church, are shown below (
Figure 14 a,b).
4.6. Structural Analysis
The 3D model obtained in Rhinoceros was used in structure analysis software based on the FEM method. The finite element method is the most widely used method for solving problems of engineering and mathematical models, such as structural analysis, heat transfer, fluid flow, etc.
In this paper, an FEM model was used for structural analysis. In particular, Midas GTS NX software, developed by MIDAS Information Technology Co, was used for the several structural analyses. Midas GTS NX is a comprehensive finite element analysis software package that is equipped to handle the entire range of structural design applications.
The procedure that allowed structural information to be generated, starting from the 3D model, is quite simple. In fact, once the surface is imported into the Midas GTS NX structural software, it was possible to create structural meshes. Subsequently, the conditions of external, internal, deadweight (structural elements weight) and accidental loads constraint were assigned to the structure.
As for the materials, the customized information of each of them can be assigned within Rhinoceros through the “VisualARQ” plug-in. The styles of objects with such customize can be exported, in IFC (Industry Foundation Classes) format, in Revit software. These objects, recognized in Revit according to their style and custom information (material properties, costs per unit and custom metric information associated with any object in the model), are further enriched through the Revit libraries with the appropriate material characteristics useful for volumic, thermal, computational-maintenance elaborations. In order to use the advanced structural constitutive relation it is necessary to use FEM calculation software.
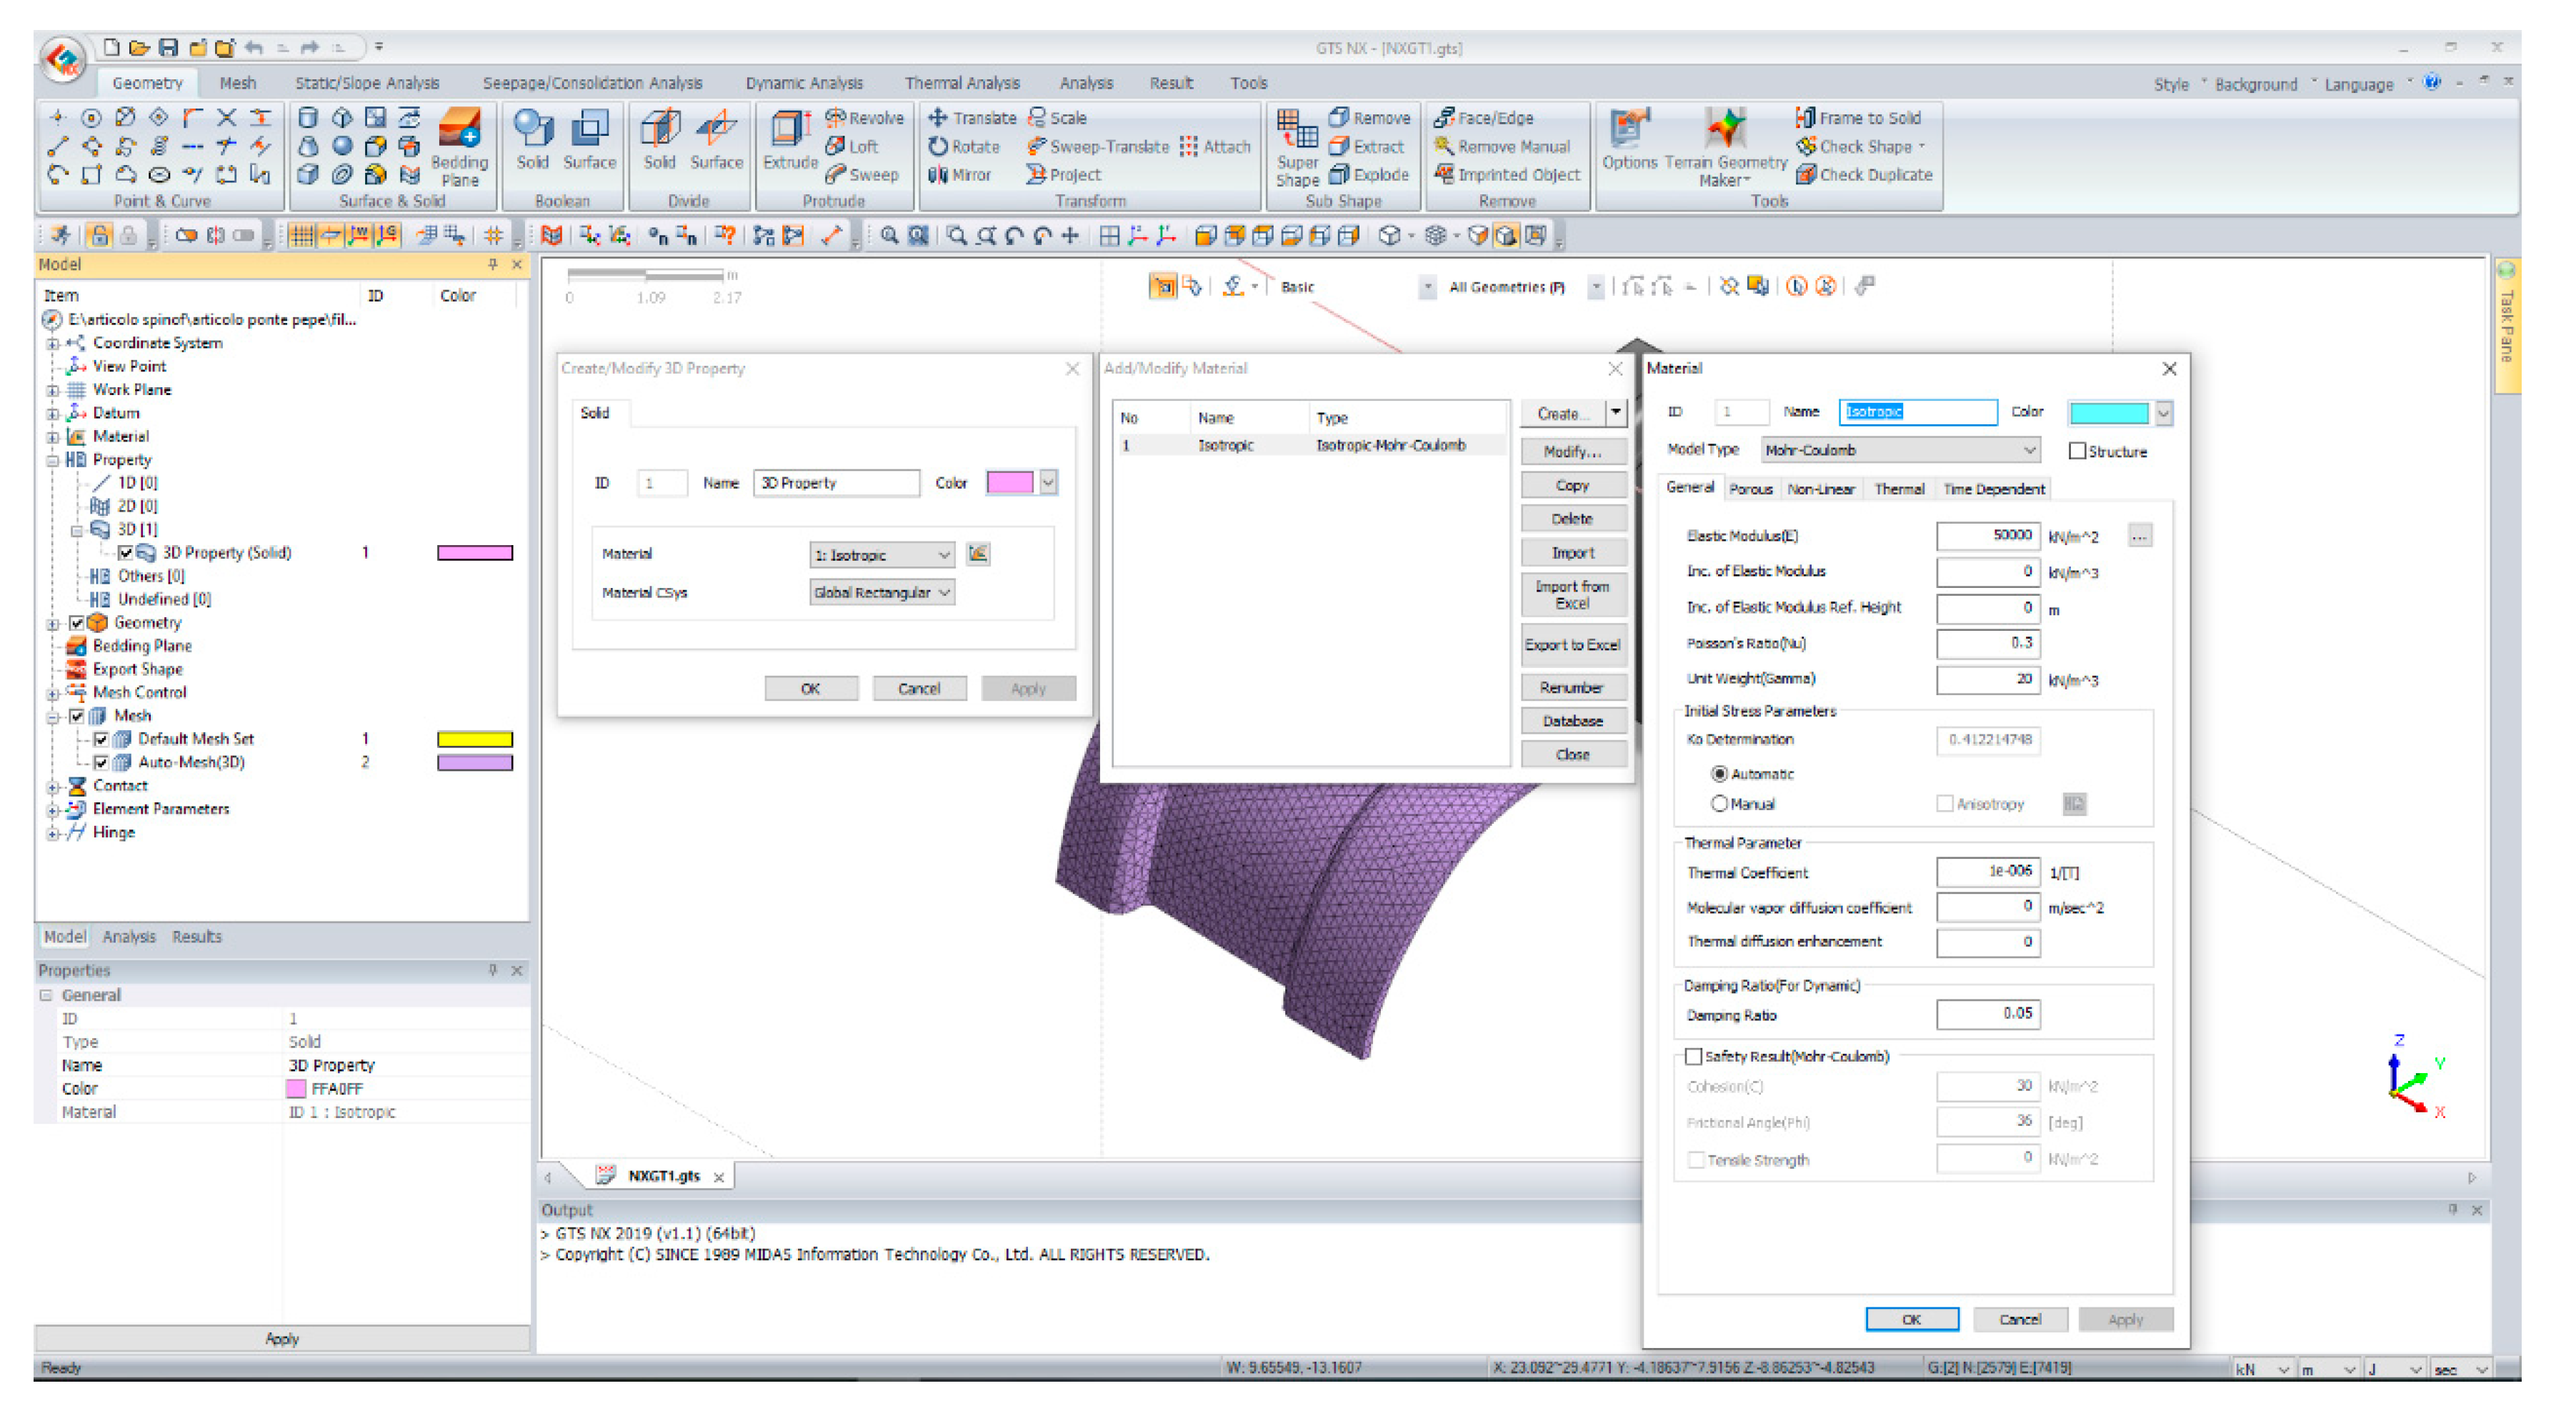
The object created in Rhinoceros was imported into Midas GTS NX through: “step” and “parasolid” format. The imported object is congruent and all its structural parts are correctly connected. The object, however, represents a single solid of a single material. Through specific Boolean operations, such as “divide solid”, it is possible to divide and auto-connect the different surfaces. Therefore, each of the structural parts generated will be given the appropriate structural material. The materials are characterized by the appropriate constitutive relations (Mohr–Coulomb, Drucker–Prager, Von Mises). The elastic modulus, friction angle, Poisson coefficient etc. were indicated in the software. Once the correct materials were assigned, through the congruence of the structural elements, linear and non-linear seismic analisys can be performed.
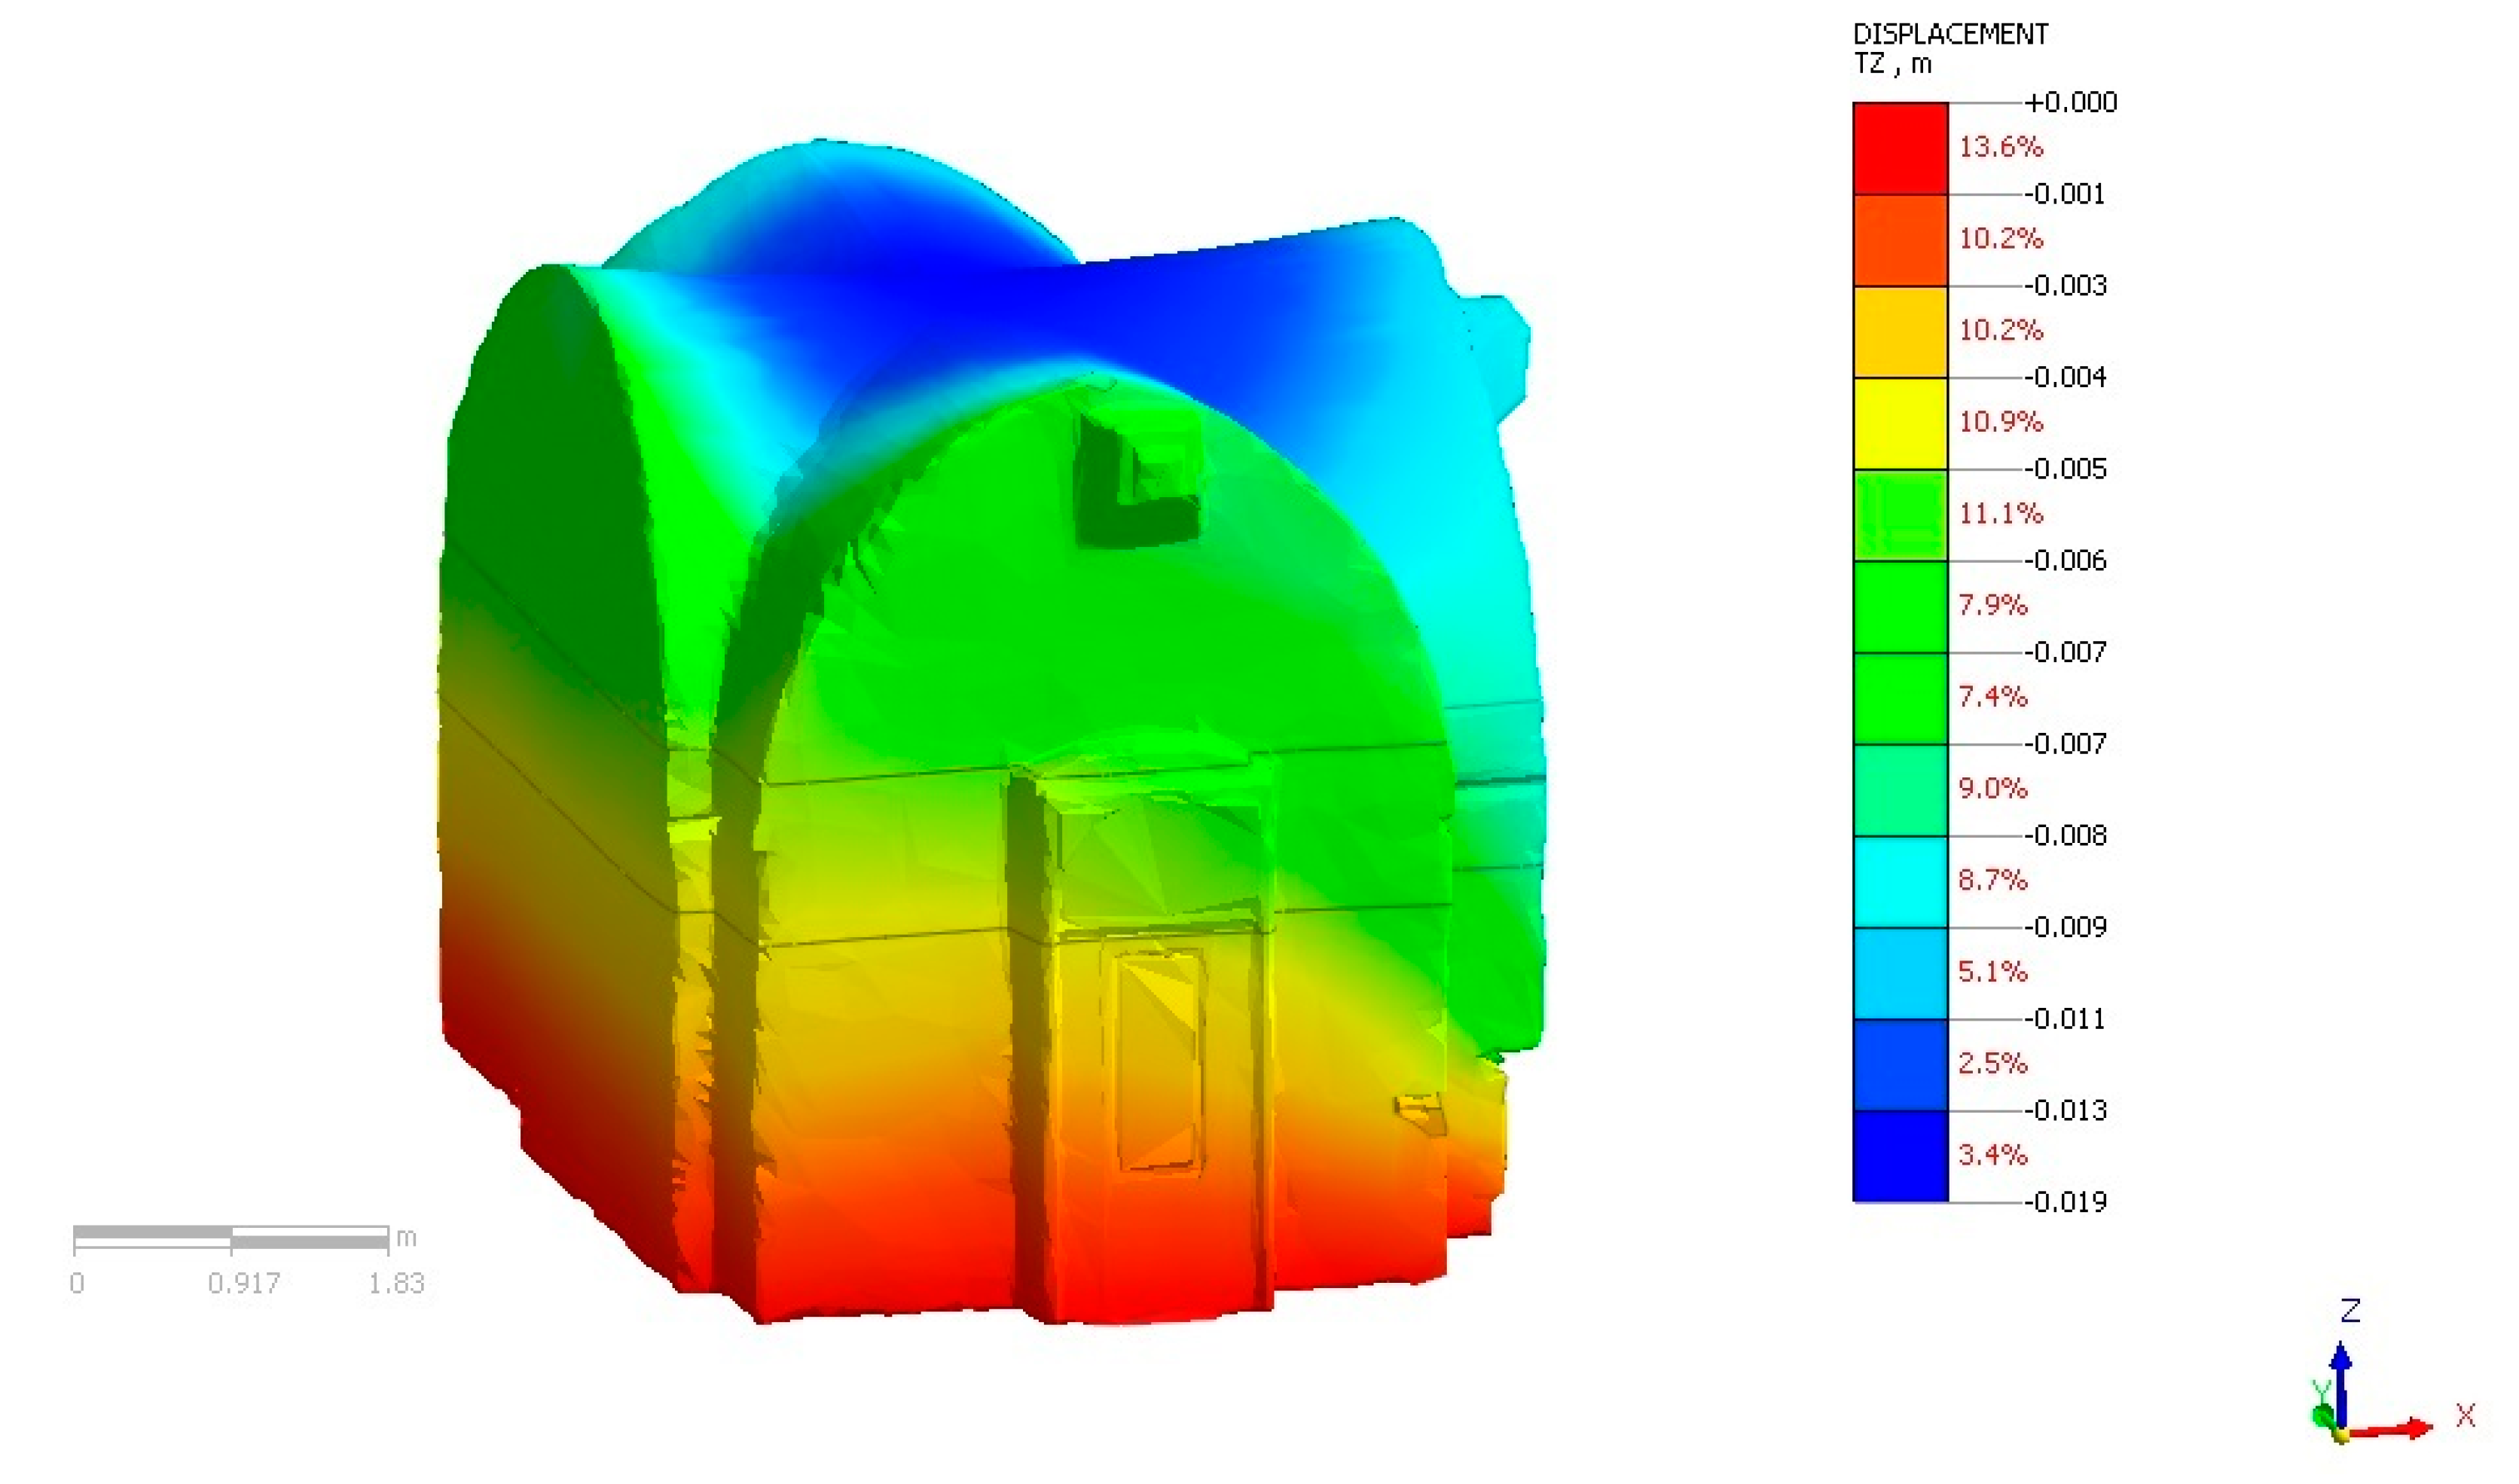
For example,
Figure 15 shows a view of the results in terms of deformation of the San Nicola in Montedoro church.
Of course, the same approach, but using a different method related to the load of the structure and the constraints, was used for the masonry bridge. Specifically, the Mohr–Coulomb constitutive relation was used to assign the materials to the masonry bridge. This constitutive relation allows for linear and non-linear seismic analysis. This task was carried out within the structural software (see
Figure 16).
As a result, it was possible to analyse the deformation state of the masonry bridge. However, it is necessary to clarify that the analysis performed on the structures represents a test based on the evidence of the correctness of the structural model within the software. Therefore, in order to define a model of deformation closer to reality, it would be necessary to take into consideration further investigations of the dynamic effects, the geotechnical-geological characteristics of the soil, the hydraulic effects (in the case of the bridge), etc. However, the consideration of the latter aspects goes beyond the scope of this paper, whose goal was to identify a specific procedure that we considered more suitable to switch from a 3D point cloud representation (obtained through a geomatics survey) to a 3D model manageable in BIM and FEM environments.
5. Conclusions
This paper reports an effective procedure to obtain 3D models for HBIM and FEM environments. In addition, using the procedure described herein, it was also possible to model structures (as shown in the case study of the masonry bridge) that had thick vegetation covering part of them. However, the procedure required several manual steps and the use of multiple softwares. At present, no single software has been developed that allows this process to be tackled directly from a geomatics survey to modelling and subsequent transformation into an object useable in BIM or FEM.
In the construction of 3D models, a key role is played by geomatics surveying. In fact, the higher the quality with which a model is built (in terms of precision and structure details) the more suitable the model will be to be implemented within BIM and FEM software.
Lastly, parametric modelling with the Grasshopper tool (implemented in the Rhinoceros software) allowed us to efficiently parameterize the elements of the analysed structures. A further potential of this tool is related to the possible updating of the static condition of the structure. In other words, Grasshopper allows building suitable models for structural verification over time, i.e., in 4D. In addition, this tool allows creating surfaces capable of representing existing structures; therefore, once a model is obtained, it is possible to build structural reinforcements that can be applied to the structure.


