Big Data Analytics and Processing Platform in Czech Republic Healthcare


1
Solutia, s.r.o., 101 00 Prague, Czech Republic
2
School of Engineering, Computer and Mathematical Sciences, Auckland University of Technology, Auckland 1010, New Zealand
3
Faculty of Electronic Engineering, Computer Science Department, University Niš, 18 000 Niš, Serbia
*
Author to whom correspondence should be addressed.
Appl. Sci. 2020, 10(5), 1705; https://0-doi-org.brum.beds.ac.uk/10.3390/app10051705
Submission received: 1 February 2020
/
Revised: 19 February 2020
/
Accepted: 24 February 2020
/
Published: 2 March 2020
(This article belongs to the Special Issue Big Data Analytics in Healthcare)
Abstract
:Big data analytics (BDA) in healthcare has made a positive difference in the integration of Artificial Intelligence (AI) in advancements of analytical capabilities, while lowering the costs of medical care. The aim of this study is to improve the existing healthcare eSystem by implementing a Big Data Analytics (BDA) platform and to meet the requirements of the Czech Republic National Health Service (Tender-Id. VZ0036628, No. Z2017-035520). In addition to providing analytical capabilities on Linux platforms supporting current and near-future AI with machine-learning and data-mining algorithms, there is the need for ethical considerations mandating new ways to preserve privacy, all of which are preconditioned by the growing body of regulations and expectations. The presented BDA platform, has met all requirements (N > 100), including the healthcare industry-standard Transaction Processing Performance Council (TPC-H) decision support benchmark in compliance with the European Union (EU) and the Czech Republic legislations. Currently, the presented Proof of Concept (PoC) that has been upgraded to a production environment has unified isolated parts of Czech Republic healthcare over the past seven months. The reported PoC BDA platform, artefacts, and concepts are transferrable to healthcare systems in other countries interested in developing or upgrading their own national healthcare infrastructure in a cost-effective, secure, scalable and high-performance manner.
1. Introduction
Big data has influenced the ways we collect, manage, analyse, visualise, and utilise data. For healthcare, on adopting an eSystem with implemented big data analytics (BDA), there is an expectation that modern, robust, high-performance and cost-effective BDA technologies can preserve patient privacy, while enhancing data-driven support for medical staff, as well as the broader patient population. Currently, the Czech Republic is in the process of adopting and incrementally upgrading their healthcare eSystem, leveraging BDA to enhance the quality of care with integrated national and regional support.
The scope of this paper is to report on the prerequisite factors, and tests influencing the implementation of the BDA platform with the performance required to support the national strategy for BDA adoption in the Czech Republic healthcare system. The reported healthcare solution had to pass more than 100 complex requirements (N = 119, including 13 bonus features), pre-requisites, and system conditions that were tested on the proposed platform, in compliance with European Union and Czech Republic regulations as well as the Transaction Processing Performance Council (TPC-H) benchmarks [1]. In the authors’ view, which is aligned with global trends and EU initiatives [2,3,4,5,6]: (1) the growing amount of data in healthcare, data-streaming IoT devices, and mobile apps have made the adoption of BDA technologies inevitable for modern society; (2) combining BDA, data mining, and AI with healthcare applications is a crucial step in advancing towards the next generation of healthcare eSystems [7,8]; and (3) the BDA platform implementation in one of the EU member states will shape decisions regarding replicability and knowledge transfer for other EU members who are in the process of transforming their healthcare systems [2]. Big data technologies have been adopted in many industries such as transport, banking, automotive, insurance, media, education, and healthcare [9,10,11,12,13]. Common to the exponential trend of Internet network traffic, the volume of data produced every day is also increasing exponentially in modern healthcare [14]. When the volume of data grows beyond a certain limit, traditional systems and methodologies can no longer cope with data processing demands or transform data into a format for the task required. Traditionally, small data portions as parts of online transaction processing (OLTP) systems are collected in a controlled manner, known as short atomic transactions [15]. In contrast, for big data clustered environments, there are stream and batch data processing demands, all requiring more flexibility for various data distribution patterns and matching eSystems scalability [16].
Typically, for big-data eSystems, stream-processing is concerned with (near) real-time analytics and data prediction, while batch data processing deals with implementing complex business logic with advanced and specialised algorithms.
Small data systems typically scale vertically by adding more resources to the same machine; this can be costly and eventually reach maximum possible upgrades. Contrastingly, big data systems are cluster-based and therefore depend mostly on horizontally scalable architecture, which in the long run provides increased performance efficiency at a lower cost by employing commodity hardware.
1.1. Big Data Technology Perspective
The idea of applying big data clusters to process and analyse healthcare data is not new [17,18,19,20]. For example, in 2009, early experiments conducted on a 100-node cluster with a set of benchmarks, revealed various trade-offs in performance for selected parallel systems to store and process data intended for healthcare use [21].
Recently, there has been a growing interest and need for eSystem platforms and cloud-based technologies, emphasising new and innovative big data tools employing various data mining, machine learning [22], and other AI-based techniques that could enable knowledge discovery, personalised patient-cantered modelling, identification of groups sharing similar characteristics, predictive analytics, improved drug safety, and enhanced diagnostic capabilities.
1.2. Challenges and Opportunities
The integration and governance of big data technologies in healthcare has local and global implications in terms of challenges and opportunities [6,8,12,23]. Challenges in healthcare include “issues of data structure, security, data standardisation, storage and transfers, and managerial skills such as data governance” [24].
For advancements in healthcare services, implementing BDA platforms combined with data analytics [25], have the potential to:
- improve the quality of personalised care and medical services;
- reduce cost of treatment;
- use predictive analytics for e.g., patients’ daily (loss of) income and disease progression;
- use real-time visualisation and analytics for immediate care and cases of readmission;
- to integrate small-data analytics and knowledge discovery that may also be integrated with big data [28];
- use healthcare data for identification of trends, strategic planning, governance, improved decision-making, and cost reduction [24].
To enable advancements towards the next generation of BDA platform that can help and improve healthcare outcomes, this study addresses the following questions:
- Is it possible to design and build a BDA platform for the Czech Republic healthcare service, in line with EU legislation, TPC-H [1] benchmarks, and other statutory requirements?
- If so, what BDA platform would provide optimal cost and performance features, while allowing installation of open-source software with various machine learning algorithms, development environments, and commercial visualisation and analytical tools?
- To what extend would such a BDA-based eSystem be future-proof for maintaining reliability, robustness, cost-effectiveness, and performance?
1.3. Industry Benchmarks
Industry benchmarks have an important role in advancing design and engineering solutions in database systems. For example, the Transaction Processing Performance Council (TPC) [1], has an important role in encouraging the adoption of industry benchmarks in computing, which are today widely used by many leading vendors to demonstrate their products’ performance. Similarly, large buyers often use TPC benchmark results [37,38] as a measurable point of comparison between new computing systems and technologies to ensure a high level of performance in their computing environments [39].
1.4. Big Data Analytics
Analytical technologies for big data [40] are showing promising results in their attempts to manage ever-expanding data in healthcare. For example, a 2014 Massachusetts Institute of Technology (MIT) study on big data in intensive care units [20] reported findings that data analysis could positively predict critical information, such as duration of hospitalisation, number of patients requiring surgical intervention, and which patients could be at risk of sepsis or iatrogenic diseases. For such patients, data analytics could save lives or prevent other complications that patients might encounter.
Technologies utilising BDA are also being successfully employed outside of hospitals [41]. The medical community and government bodies now recognise the importance of monitoring the incidence of influenza illness using massive data analysis technologies [42]. Seasonal influenza epidemics are a significant problem for public health systems, annually leading to 250,000–500,000 deaths worldwide [43,44,45]. Furthermore, new types viruses against which population lacks immunity can lead to a pandemic with millions of deaths [43]. Early detection of disease activity leads to a faster response and may reduce the impact of both seasonal and pandemic influenza in terms of saving lives or reducing respiratory illnesses on a world-wide scale [43]. One method of early detection is to monitor Internet search behaviour in relation to health queries such as employed by Google [22,45]. In addition, it was discovered that some queries are strongly correlated with the percentage of doctor visits when the patient presents symptoms of influenza. This correlation made it possible for Google to produce an algorithm that estimates influenza activity in different regions of the United States with a one-day delay. Among other algorithms, this approach allows Google to use queries to detect epidemics from influenza-like searches in areas where population has regular access to the Internet.
In light of the recent Coronavirus outbreak and lessons learned from SARS and Ebola [35,36,46,47], BDA eSystems could provide ad-hoc analytics, data exchange, and near-real time geo-mapping functionality for pandemic/epidemic tracking and outbreak spread and risks data visualisation. For pandemic outbreaks, ad-hoc analytics can be considered as human-centric and an active approach to pattern discovery. For example, the chance discovery approach [28] can be combined with available data analytics, machine learning, and data mining approaches. Such human-centric and active approach of reducing sample size and emphasising a relative minority portion can be applied to improve selective screening efficiency of incoming travellers from infected regions [28,46].
1.5. SQL vs. NoSQL Approaches
Structured query language (SQL) has been developed for relational databases, while in more recent times, not-only SQL (NoSQL) has been developed for non-relational and distributed databases. Data can be stored and processed in either a row-oriented or column-oriented format. The row-oriented principle based on Codd’s relational model is well-established in most database applications [48,49,50,51]. However, such well-established relational database management systems (RDBMS) [50,52] are not efficient for analytical applications that mostly perform create, read, update, and delete operations. Over the last few years, NoSQL [38] databases have been tested and studied, and their performance evaluated in different studies [53,54], where some have focused their assessments on the advantages of the use of NoSQL technologies [55]. For the architects of BDA platforms, known differences between Structured Query Language (SQL) and NoSQL database management systems make designing a challenging task, with a number of decisions to address the purpose and related set of requirements. Newer than SQL, NoSQL databases support the notion of elastic scaling, allowing for new nodes to be added to improve availability, scalability, and fault tolerance [56].
Many of the related works and reviews on big data techniques [57] and technologies used in healthcare rely mostly on silo principles for data integration, data processing, and data visualisation. An application that operates on the columns in the dataset allows overcoming of performance problems with the “NoSQL” or “Not Only SQL” databases [43,45]. These databases can be recognised on premises or in the cloud. Cloud computing [49,58] also offers this database service. NoSQL databases provide elastic and horizontal scaling features, allowing new nodes to be added. New nodes are typically designed on the basis of low-cost (commodity) hardware.
In relation to the main objective of this work, the creation of a real-life platform for big data integration, master data management, ad-hoc analysis, data storing, data processing, and visualisation is based on the NoSQL database for data storing and data processing on Vertica clusters.
2. Materials and Methods
The dataset used for this cross-sectional study includes an anonymised real-life data sample provided by the Institute of Health Information and Statistics (IHIS) of the Czech Republic. To comply with the two-phase IHIS acceptance testing, the requirement analysis was combined with the design science approach [53] involving the production of a scalable platform, architecture, software, and hardware infrastructure. In context of the tender bid and system procurement rigor, the set of IHIS requirements consists of tender evaluation criteria based on a weighted scoring system, including the total cost of ownership, mandatory requirements (e.g., TPC-H), and 13 bonus features.
The produced solution, based on the cyclic experimental design approach, has met all the requirements, while also achieving the highest performance ranking.
Incremental performance and functionality improvements from the Phase I and Phase I+II evaluations involved:
- Phase I-compliant big data eSystem requirements and design decisions influencing architecture design;
- Decomposition of acceptance testing requirements;
- Hardware infrastructure optimisation to a set of the requirements (N = 119) for weighted scoring, including TPC-H decision support and minimal system performance; and
- Performance-driven eSystem optimisation from available test datasets.
2.1. IHIS Requirements
The IHIS requirements can be grouped by the following aspects:
- Scalability: the eSystem must allow performance enhancement via additional and accessible computing technology, including commodity hardware products.
- Modularity, Openness, and Interoperability: the system components must be integrated via specified interfaces according to exact requirement specifications. It is also essential that a wide variety of vendors can readily utilise system components.
- Exchangeability: the eSystem solution must support installation of open-source operating systems and contain tools for non-profit and educational purposes. The eSystem must comply with standard Data Warehouse (DWH) systems. Some components must be interchangeable with Massive High Data Analytics (MHDA) system components.
- Extensibility: all tools and components of the eSystem must provide space for future upgrades, including functionality and capability advancements.
- Quality Assurance: a tool for validating data and metadata integrity is required to ensure that processed data remains accurate throughout the analysis procedure.
- Security: the eSystem must be operable on local servers, without reliance on cloud or outsourced backup systems. It is essential that the eSystem provides security for all data against external or internal threats. Therefore, authorisation, storage access and communication are of utmost concern. User access rights had to be set to the database, table, or column level to restrict data access to a limited number of advanced users. The eSystem must log all executions and read operations for future audits. The eSystem must support tools for version control and development, while meeting the requirements for metadata and data versioning, backup, and archiving.
- Simplicity: the eSystem must allow for parallel team collaboration on all processes, data flow, and database schemas. All tasks must be fully editable, allowing commit and revert changes in data and metadata. It is essential that the eSystem be simple and easy to use, as well as stable and resilient to subsystem outages.
- Performance: the eSystem must be designed for the specified minimum number of concurrent users. Batch processing of data sources and sophisticated data mining analyses are considered essential. Complete data integration processing of quarterly data increments must not exceed one hour.
The most important IHIS requirements mandate that:
- All tools, licenses, and environmental features used in the Proof of Concept (PoC) tests must match the eSystem offer submitted and documented in the public contract. To meet contractual obligations, the proposed solution cannot have: insincerely increased system performance, altered available license terms or otherwise improved or modified results vis-à-vis the delivery of the final solution. The environment configuration must satisfy the general requirements of the proposed eSystem (usage types, input data size, processing speed requirements).
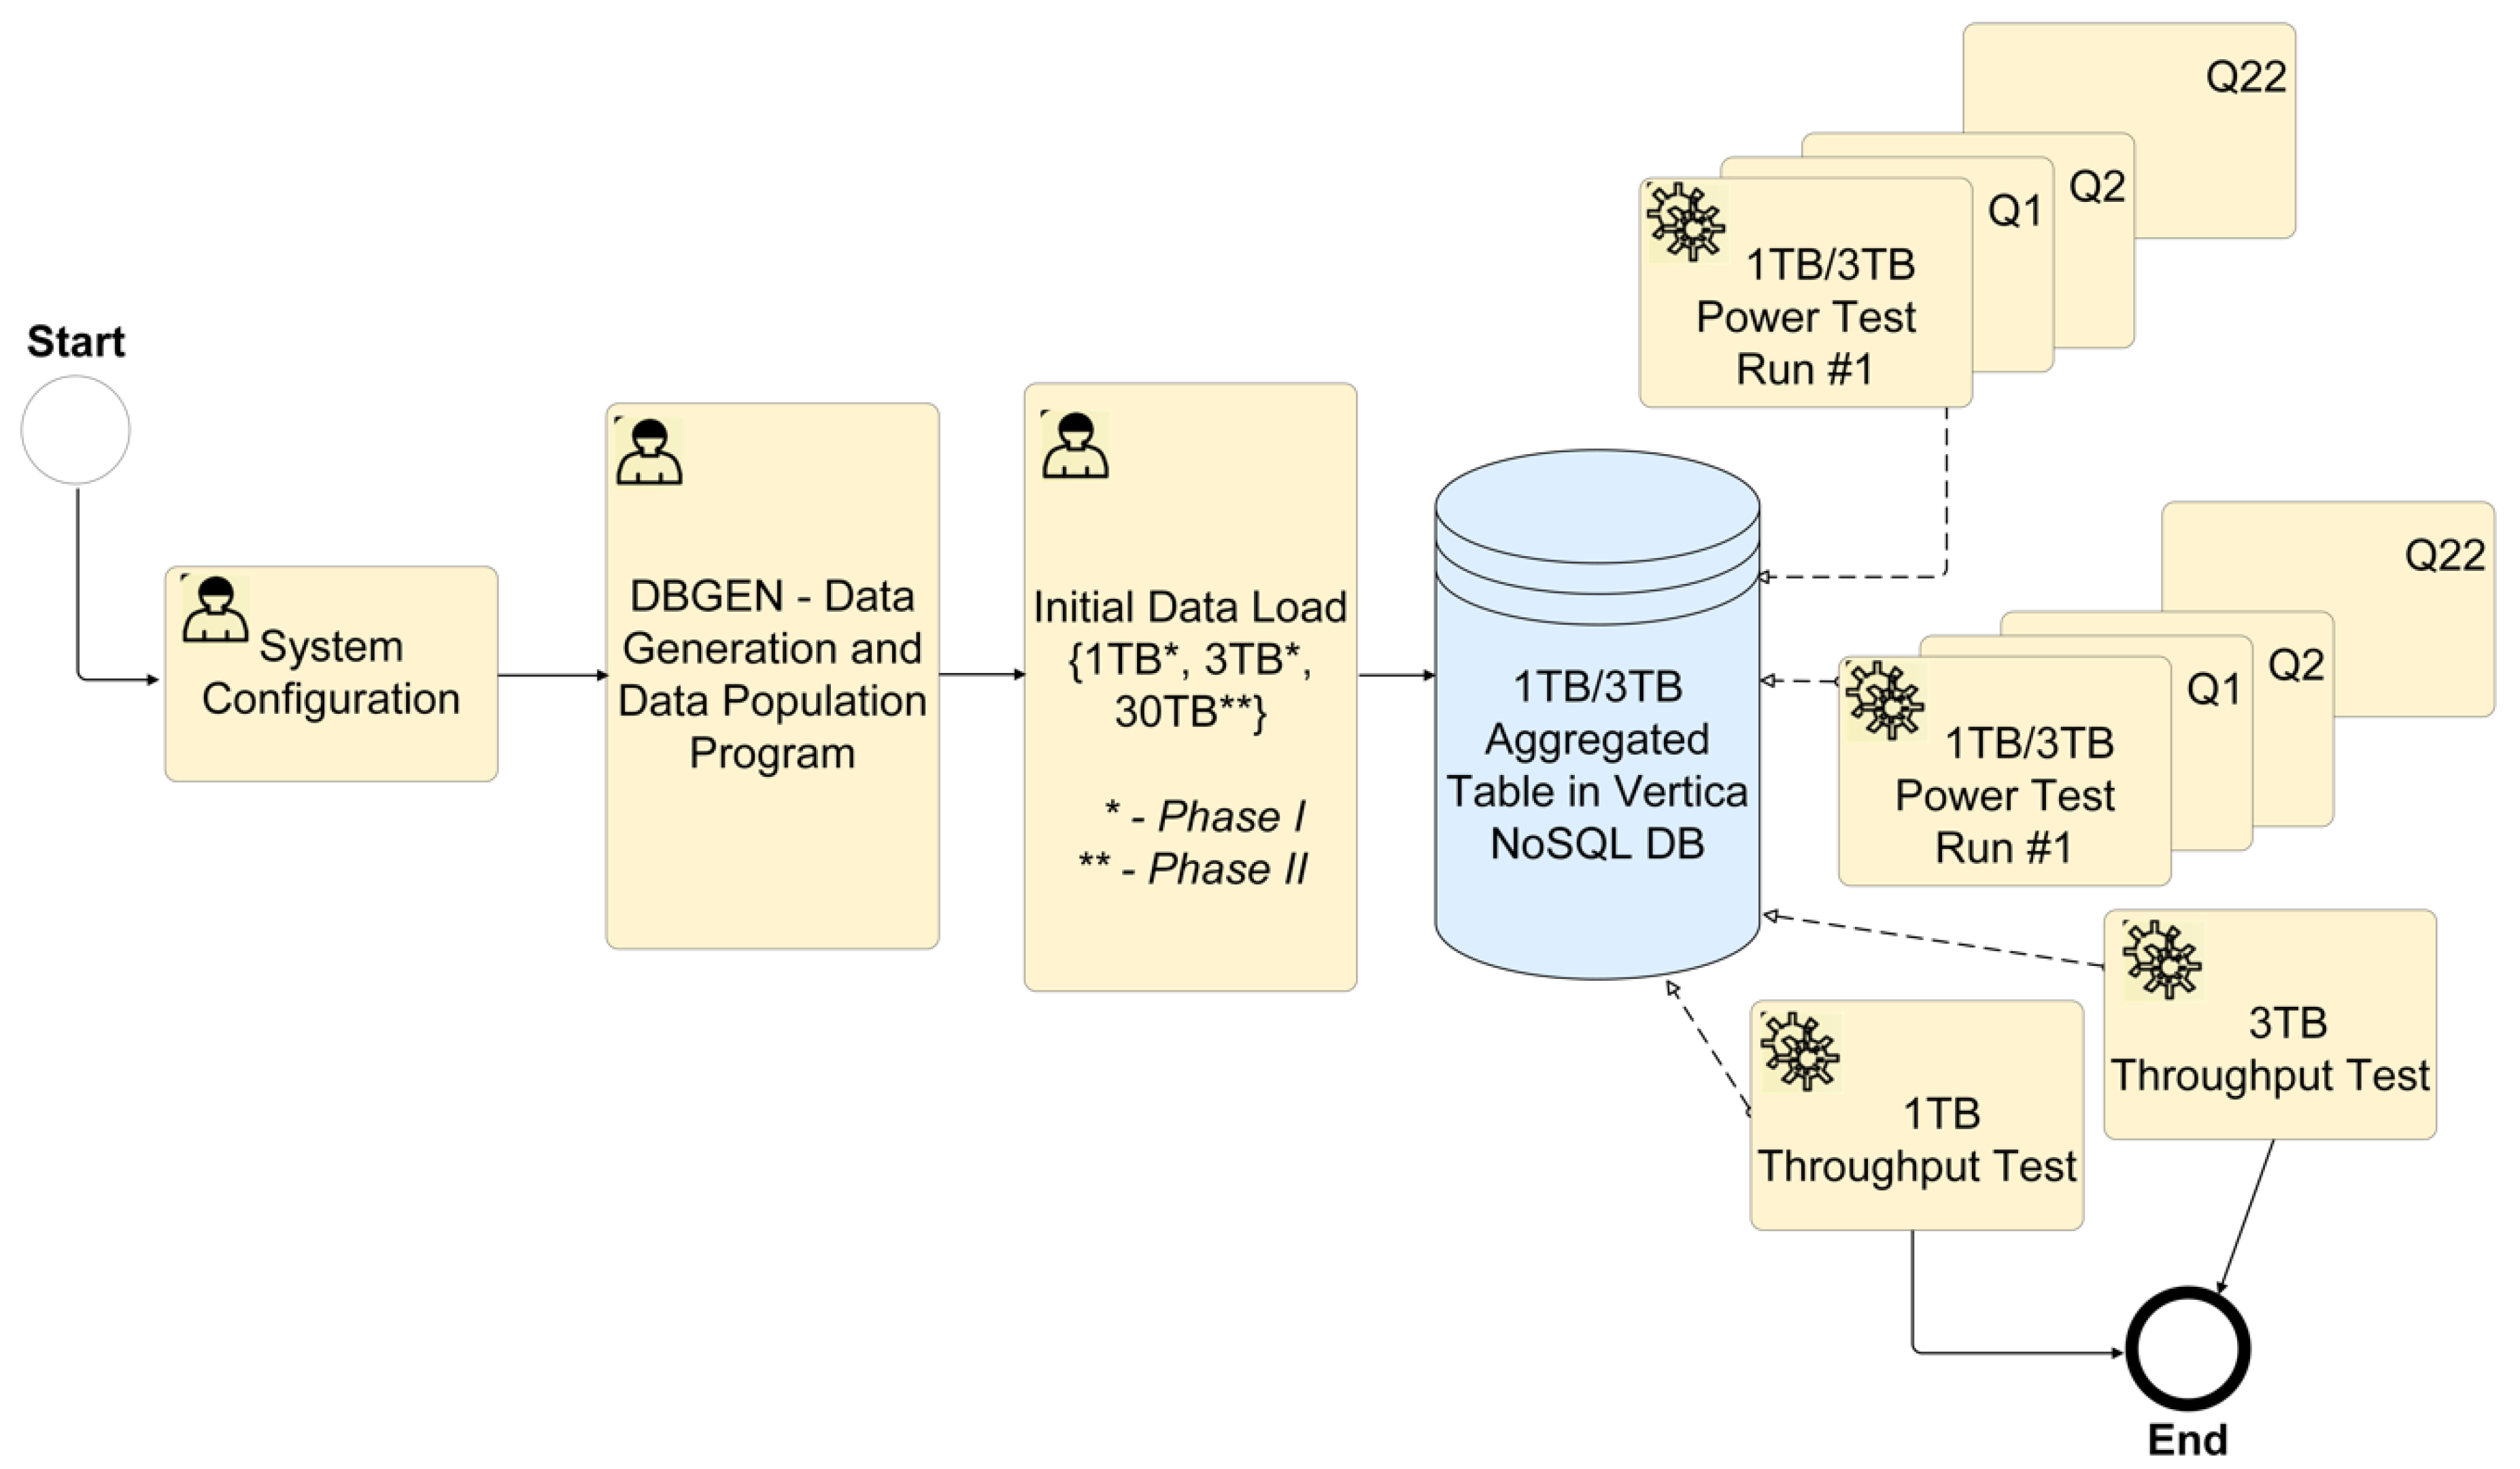
- The proposed eSystem cannot be explicitly (manually) optimised for specific queries and individual task steps within a test. The test queries are not to be based on general metadata (cache, partitioning, supplemental indexes, derived tables, and views), except in exceptional cases where optimising the loading of large amounts of data is needed. The techniques based on general metadata may be used in future for enhancing performance but are not required as a precondition for system availability. To load large amounts of data, the environment configuration can be manually adjusted to a non-standard configuration for further test steps (Figure 1).
- The configuration must not be manually changed during the test to optimise individual tasks—the eSystem is required to be universal for tasks that may overlap in time.
2.2. TPC-H Performance Requirements and Tests
Meeting TPC-H benchmarks involves testing for minimum requirements, including a set of values and parameters. Standardised test conditions specified in the TPC-H Benchmark™ are available online (http://www.tpc.org/tpch). The IHIS requires that any proposed eSystem meets performance metrics aligned with standard TPC-H workloads during developmental phase testing (Figure 1).
For data storage benchmarks, the data must be stored on independent disks, with a replication factor more significant than two. The solution must also support best practices regarding data security and data protection, including hot backup, cold backup, and recovery.
Table 1 shows predefined parameters by IHIS for their initial test databases (1 TB and 3 TB), and values for the power tests in the first run (after system cold restart) and second run (after database restart). Before starting and testing the TPC-H benchmarks, optimising of the system for specific queries (such as manual or another non-standard optimisation) is not permitted.
The TPC-H tests are to emulate future production eSystem behaviour. For all contenders (Tender Id. VZ0036628, No. Z2017-035520), supplied test data consisted of simulated medical documentation records from three fictional insurance companies: three standard quarterly packages (one quarter for each company), plus one correction (simulating a situation where one insurer supplied inadequate data). Data batches (compressed using the ZIP format) were exchanged in real time containing images and structured alphanumerical data in the comma-separated (CSV) format. Standard input data were up to 30GB per packet, amounting to a total 3 TB of data. Test data contained roughly the same number of rows of expected data, but with a reduced number of columns and with added redundant attributes to reflect the problem dimensionality and approximate amount of data anticipated. Data related to patient drug use was confirmed with The Anatomical Therapeutic Chemical Classification System [61].
For the purpose of conducting TPC-H Benchmark testing, a contender’s MHDA system had to be installed on premises utilising a private network. The on-premises multi-user MHDA system must operate in a parallelised application environment. Once the metadata are loaded, the system was required to run without intervention to prevent any configurations from being manually altered, thus compromising the TPC-H tests’ integrity.
For prototype development, testing, and reported results, we installed CentOS Linux (7.3). Our solution (as PoC) met all of the requirements for Massively Parallel Processing (MPP) as an MHDA system. The proposed BDA platform and its architecture also allowed for both remote supports according to the specified Service Level Agreement (SLA) for fault correction, and by the end of Next Business Day (NBD) requirements. After the PoC handover, the chosen, installed, and re-tested operating system on IHIS premises was Red Hat Enterprise Linux Server release 6.8 (Santiago).
For step one of the testing activities (Figure 1), we configured the system architecture with five nodes operating in the Vertica 9.0.1-1 database cluster. For step two, a DBGEN program generated 1 TB or 3 TB databases. At this point, the initial data was loaded into the system and we ran 1 TB and 3 TB power and throughput tests. These tests resulted in records of individual measurements. After testing one cluster, we deleted the data and generated another 3 TB database. We repeated these power tests for each of the five nodes, including the recording of measurement results.
To compute query processing power for a database of a given size (, we used Equation (1), in compliance with the most recent TPC Benchmark™ H standard specification (revision 2.18.0, p. 99) [1]:
where QI(i,0) is the timing interval, in seconds, of a query Qi within the single query stream of the TPC-H power test; RI(j,0) is the timing interval in seconds, of a refresh function RFj within the single query stream of the power test; and SF represents the corresponding scale factor of the database size [1].
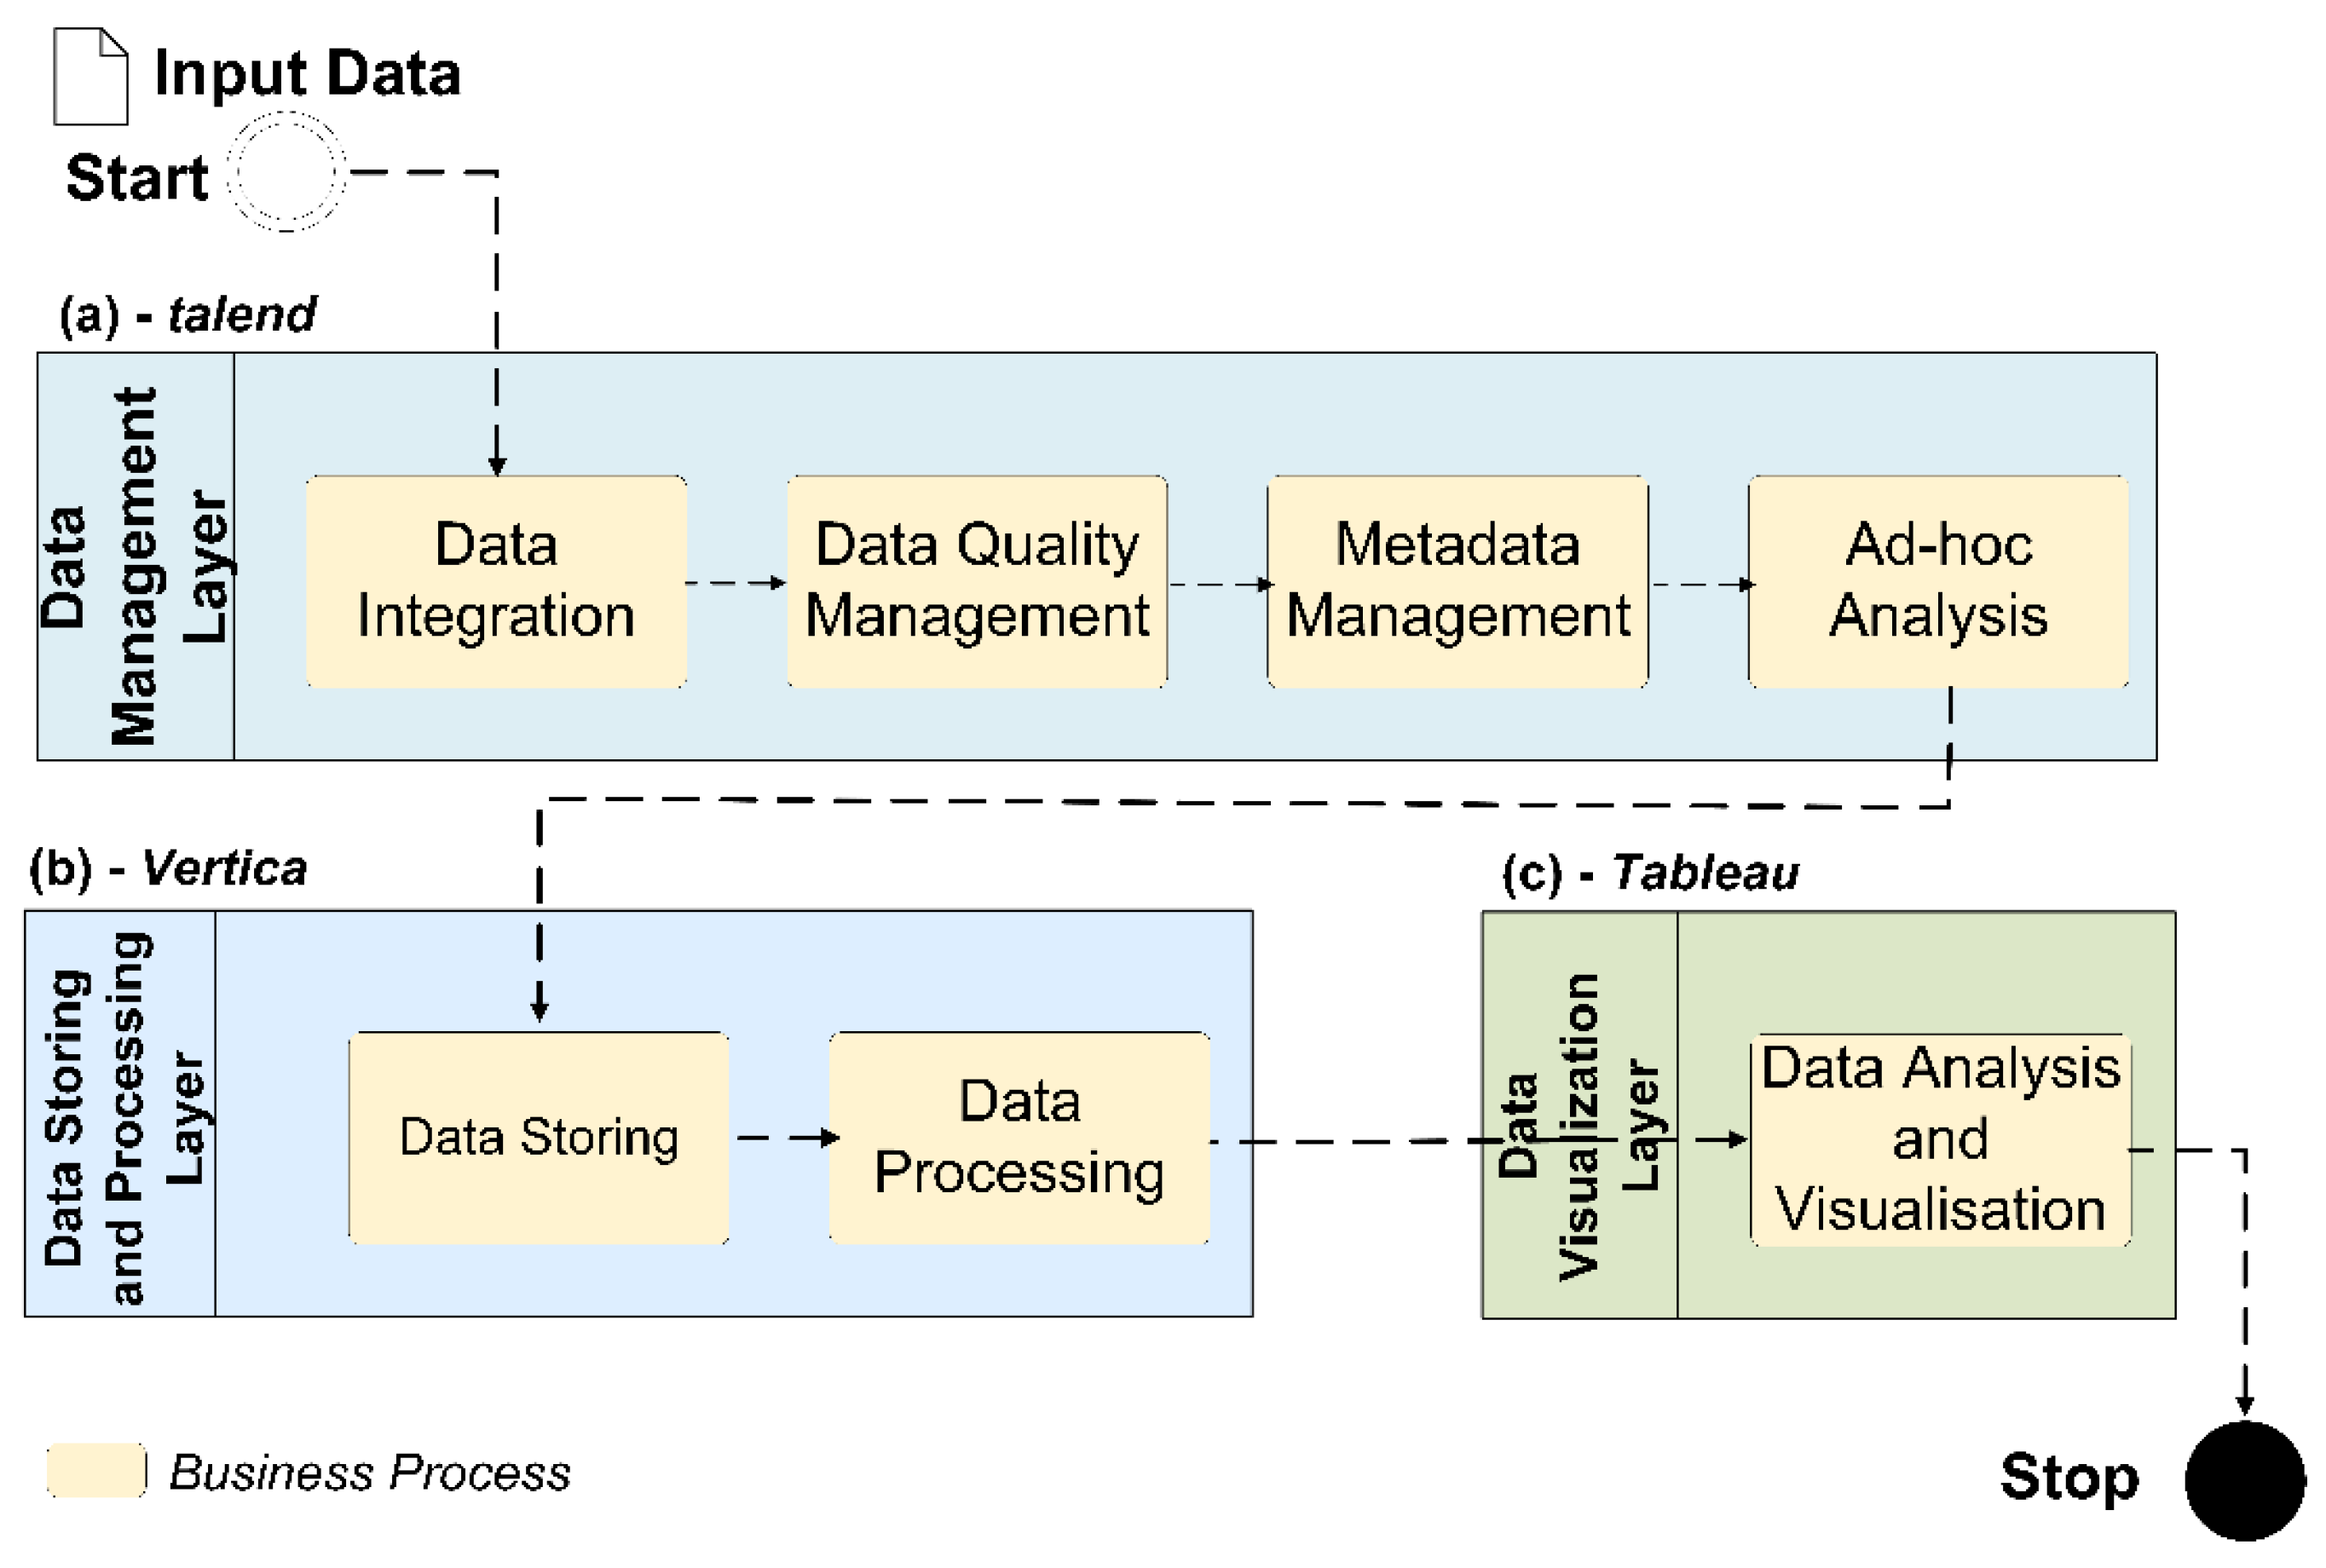
Business process organisation and data flow (Figure 2) shows integration of Talend, Vertica, and Tableau. Processing flow of the supplied test dataset starts with a Data Management Layer (through the Data Integration, Data Quality Management, and Ad-hoc Analysis subparts), linked to the Data Storing and Processing Layer. The final stage is the Data Visualisation Layer (for Data Visualisation and Analysis of the pre-processed data).
3. Results
The presented solution, as a proof of concept (PoC) was implemented and transferred to the IHIS committee, which is integrated with the Ministry of Social and Labour Security, Ministry of Defence, Ministry of Internal Affairs, Ministry of Health Insurance and Eurostat (Statistical Office of the European Union). IHIS requirements also complied with the EU-based General Data Protection Regulation (GDPR).
3.1. Big Data Analytcs (BDA) Platform and Vertica-Based Architecture
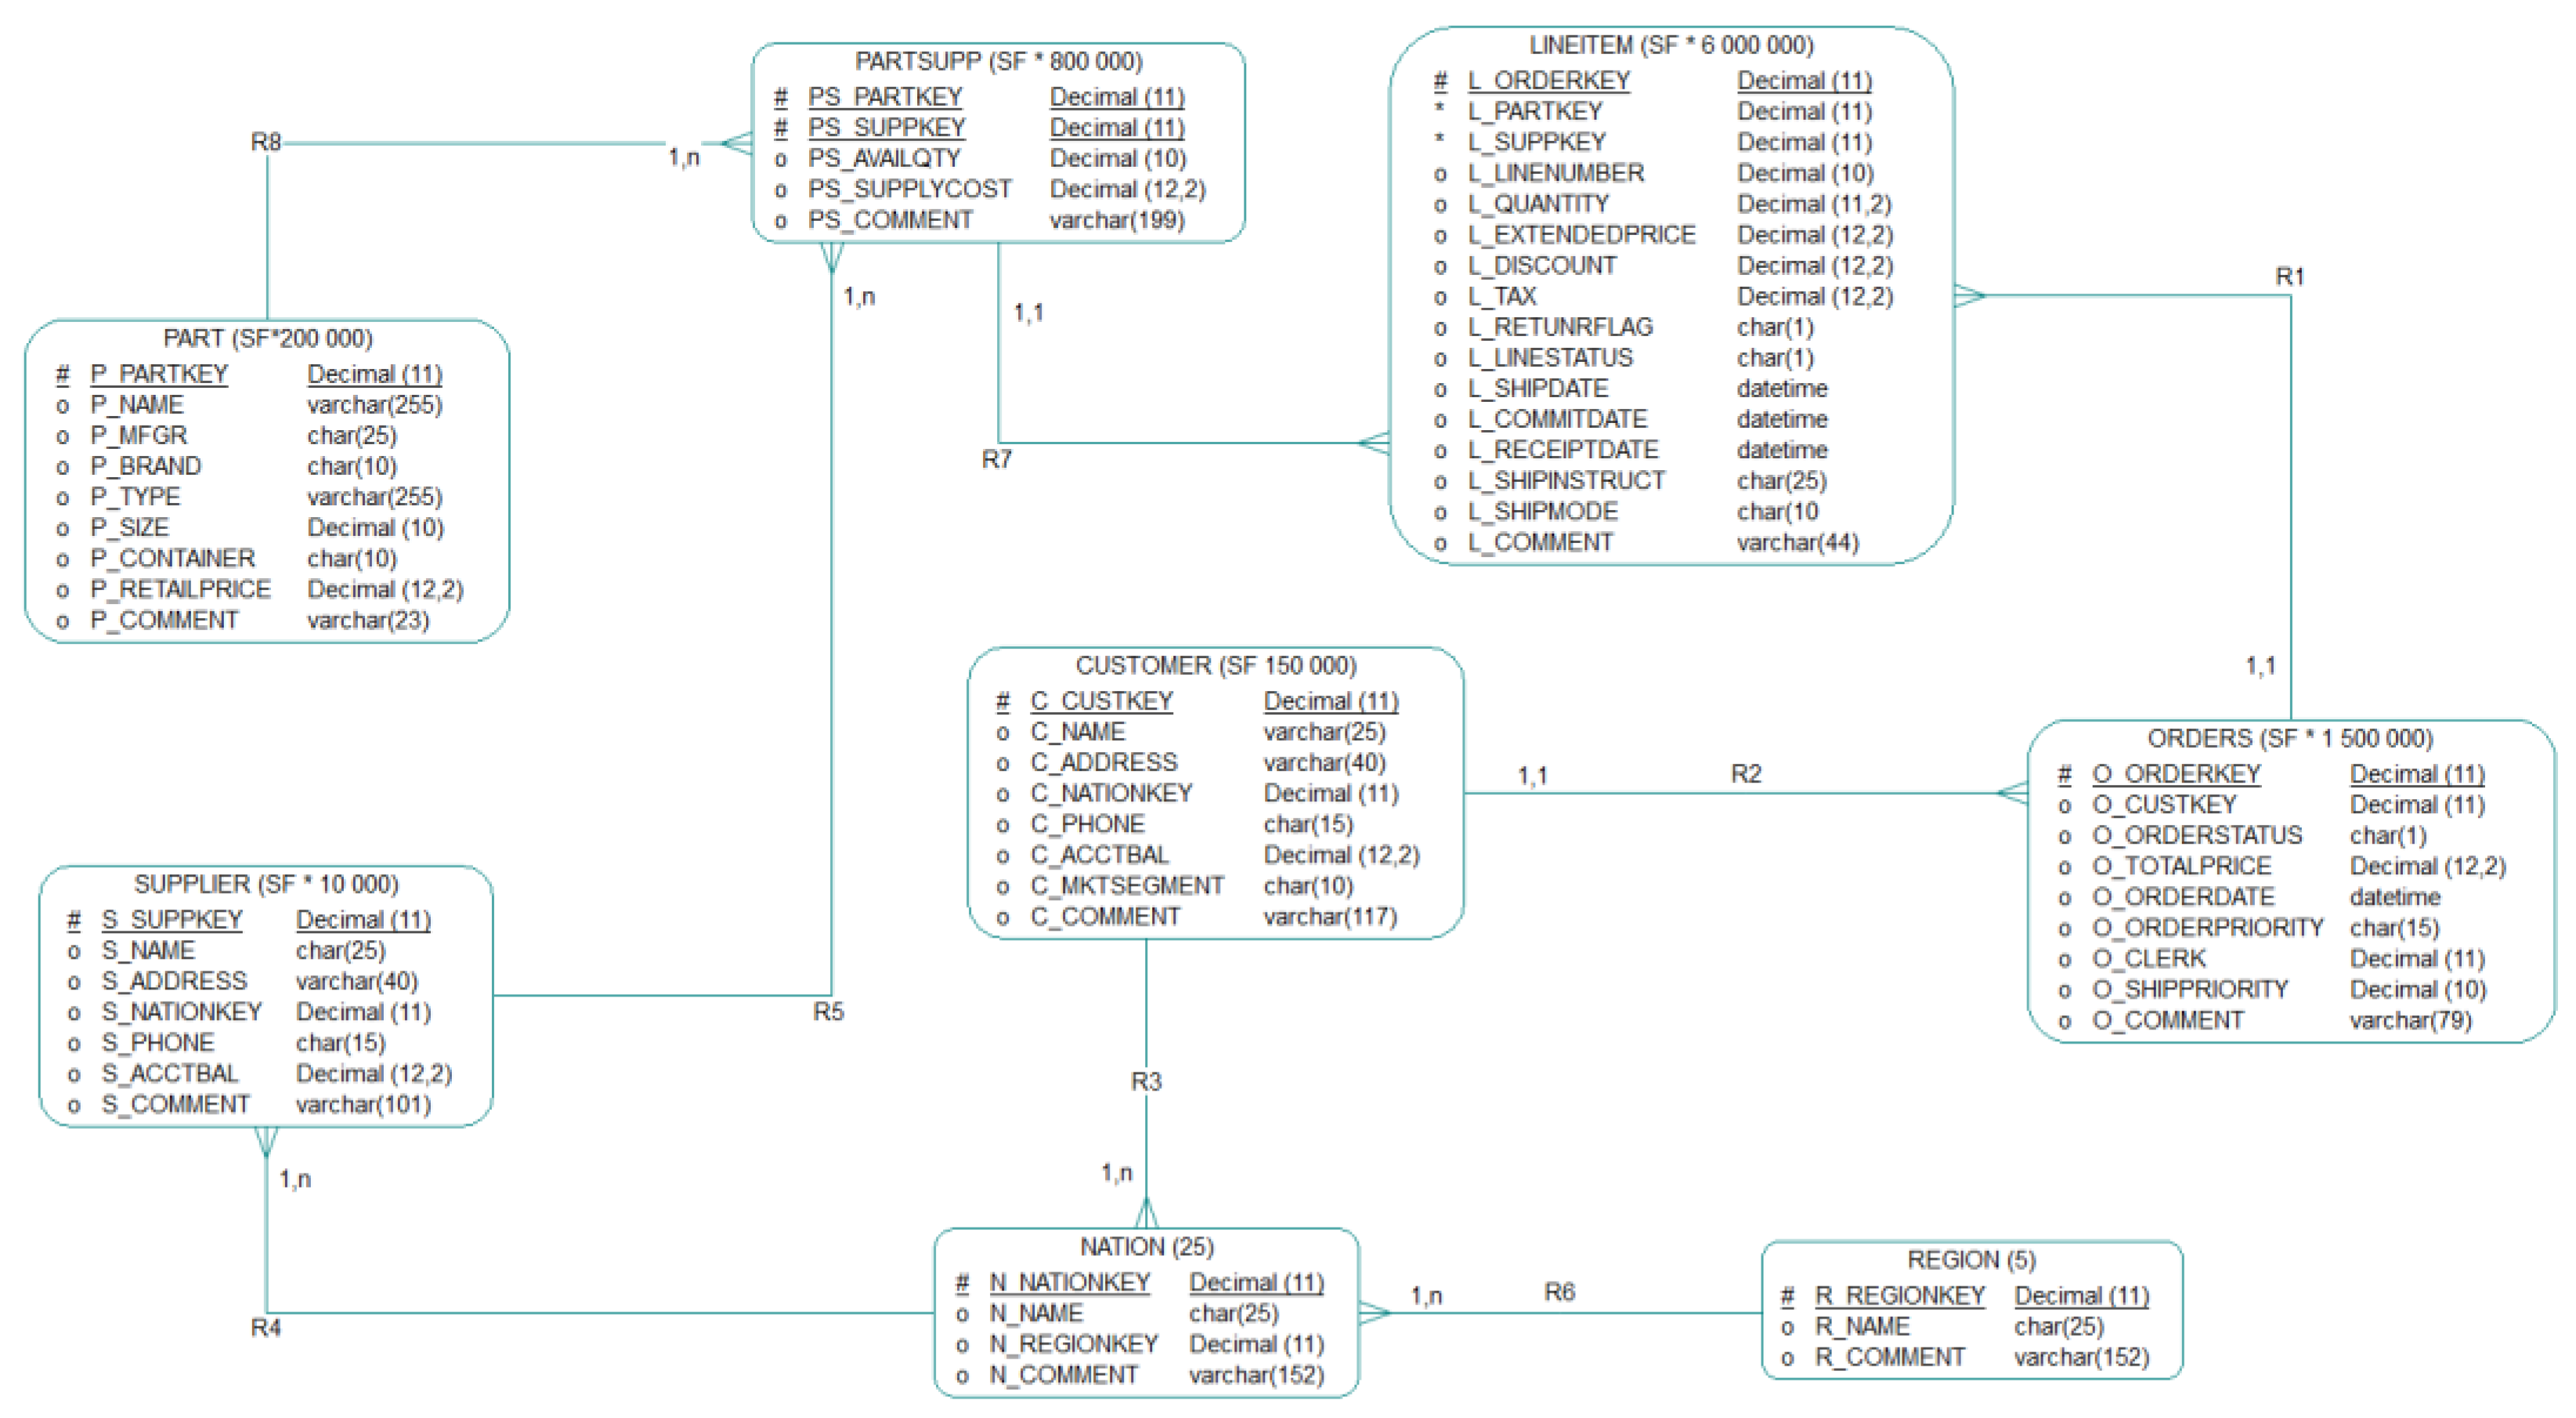
Within the presented BDA platform, we distinguished the following logical sub-components of the system: Data Integration Layer (DI), Data Storage (DS), Ad-hoc Analysis Preparation (AAP), Data Quality Management (DQM), and Meta Data Management (MDM). The entire eSystem solution based on Vertica is designed to support the processing of Massively Parallel Processing (MPP) database requirements [58,60,62]. Since the processing of big data requires high-performance computing, we used a cluster computing architecture to take advantage of the massive parallel and NoSQL database [56,63,64].
The Vertica Analytic Database enables the principle of C-Store project [52], which is widely used as a commercial relational database system for business-critical systems. The Vertica database has characteristics that are important for exceeding expected system performance, while meeting all IHIS requirements, such as: (1) massively parallel processing (MPP) system, (2) columnar storage, (3) advanced compression, (4) expanded cloud integration, (5) specialised tool for database design and administration, and (6) built-in functionalities for an analytic workload (e.g., few to ten per second) rather than for a transactional workload (e.g., few hundreds to thousands per second).
To choose Vertica for our client’s requirements, we also considered the following benefits:
- Provision for an SQL layer as well as support connection to Hadoop and fast data access to ORC, Parquet, Avro, and JSON as column-oriented data;
- High data compression ratio, including high-degree concurrency and massively parallel processing (MPP) system for processing tasks;
- Analytical database support for Kafka, Spark;
- Pricing model of enterprise solution optimised for IHIS requirements;
- Potential for huge demands of future analytical workloads;
- Cloud integration for future development; and
- Compression capabilities that can handle and deliver high-speed results for petabyte scale datasets.
3.2. Overview of Key Components
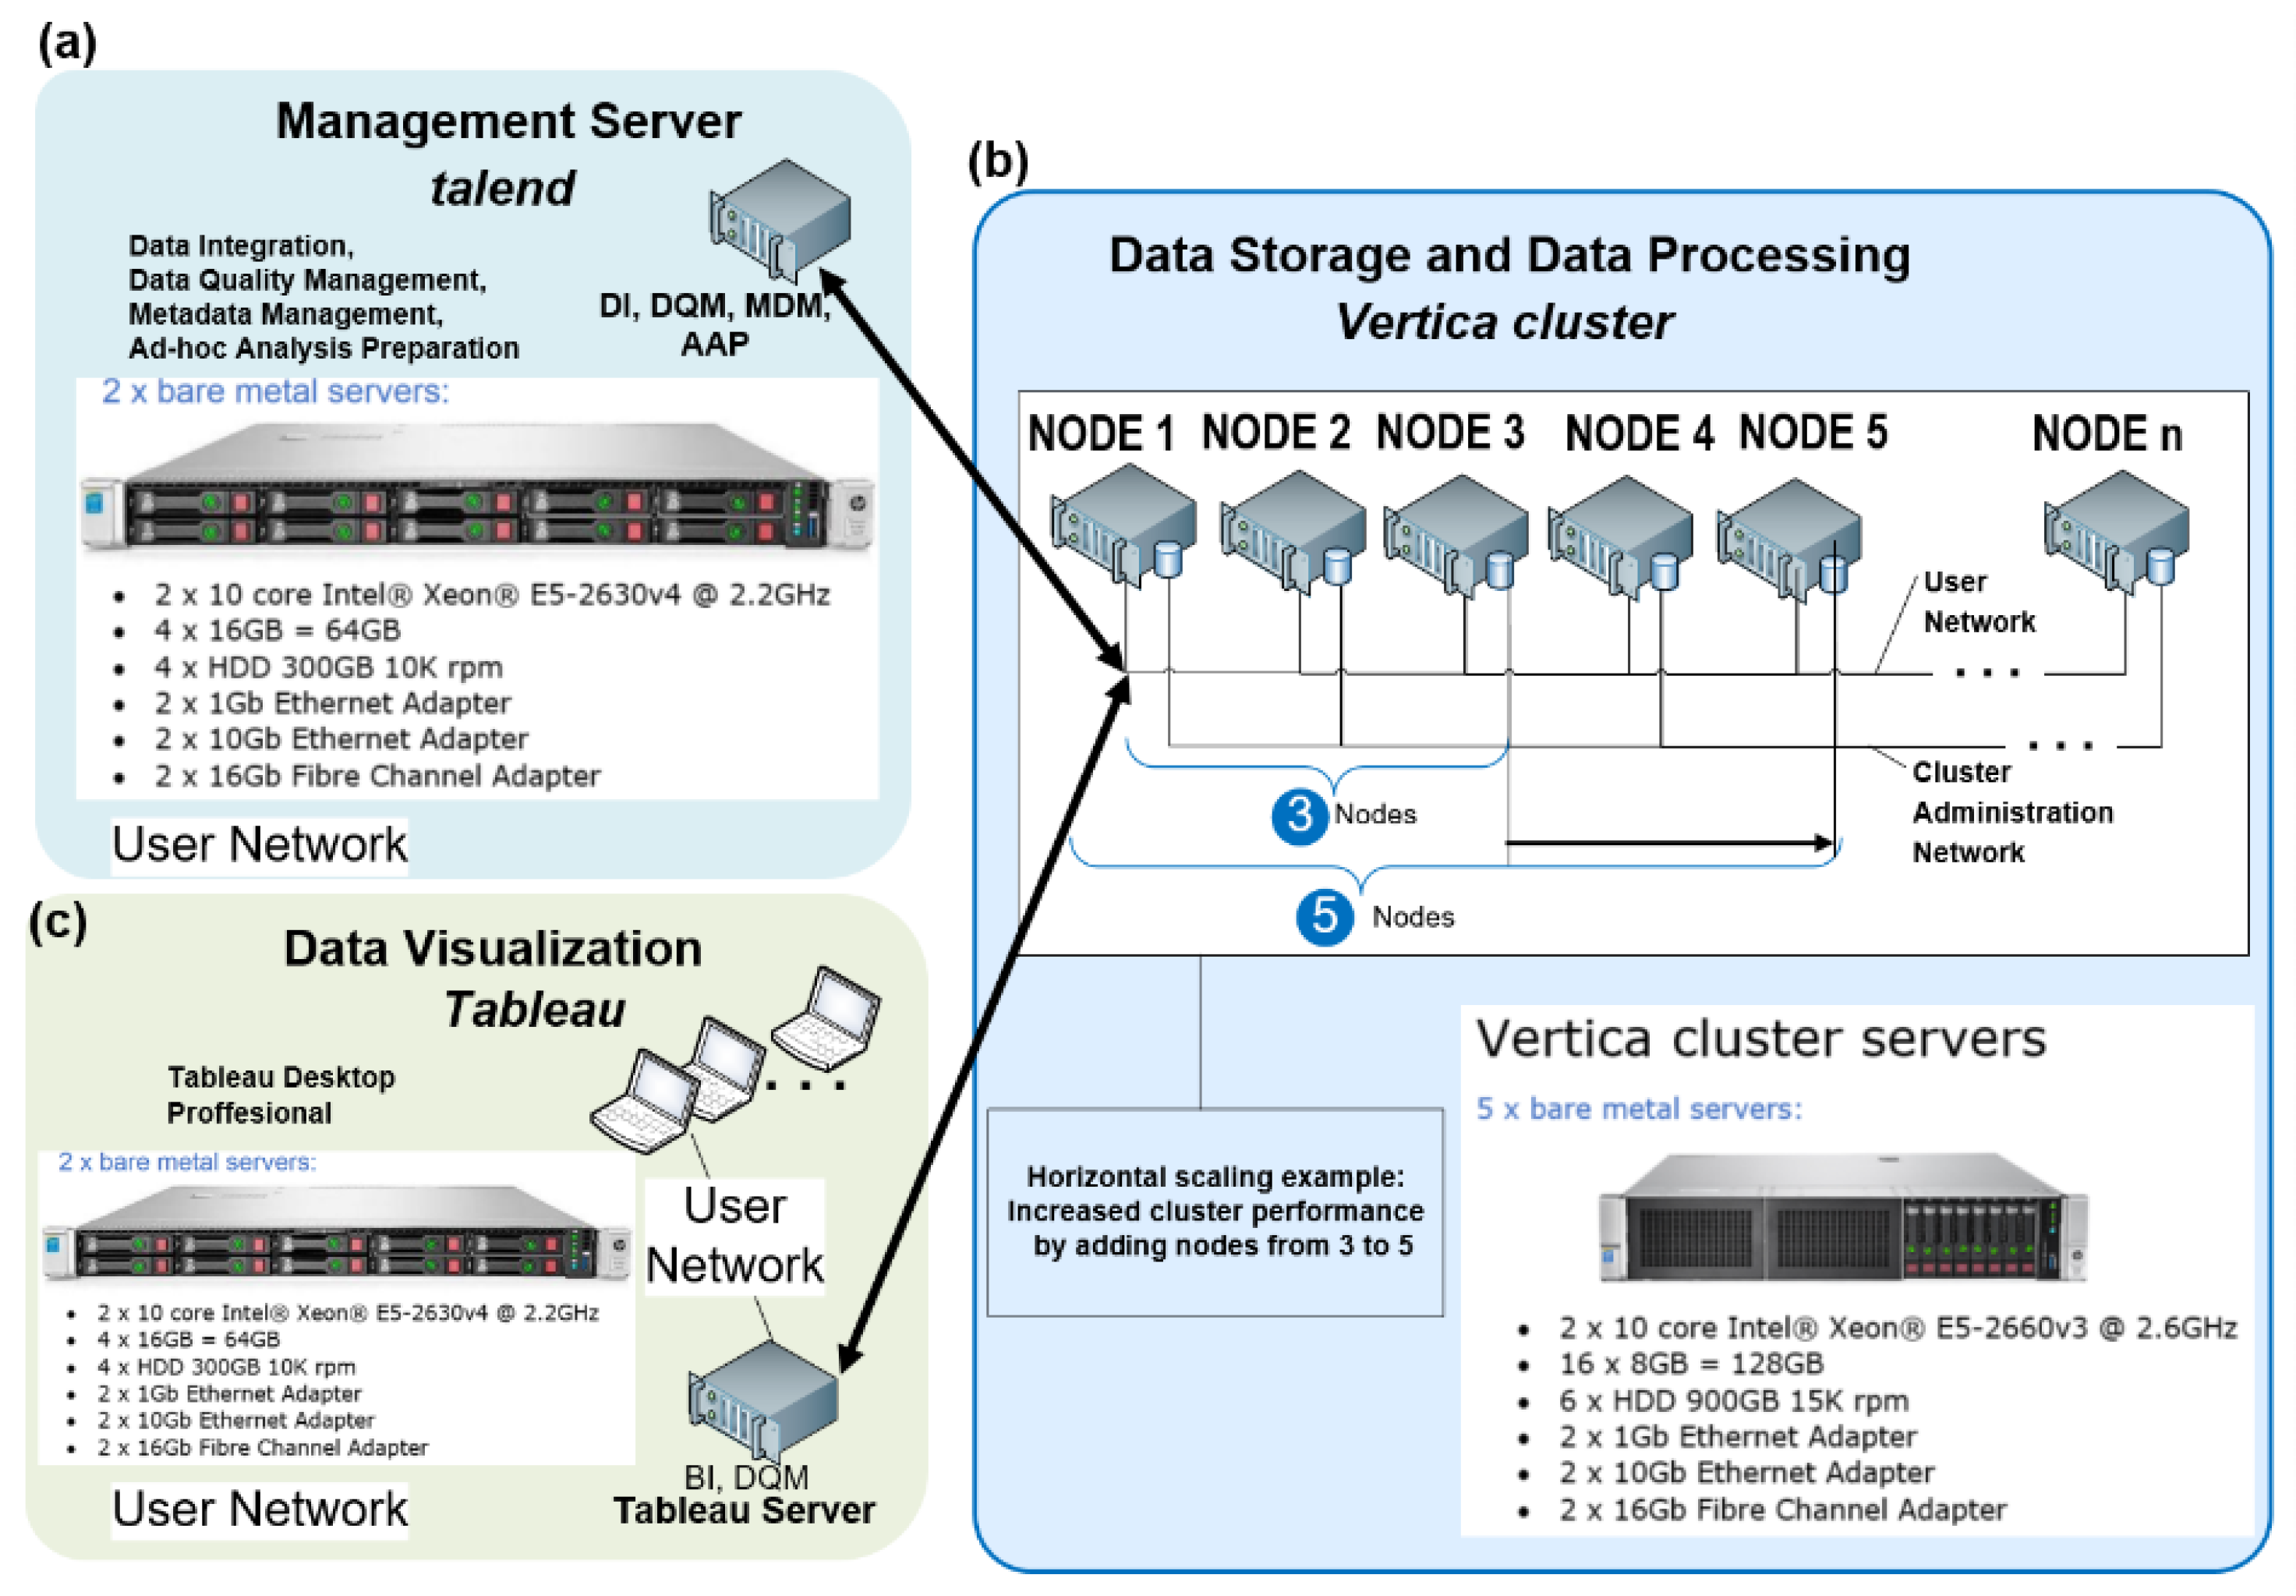
The presented BDA platform, as a distributed and large-scale system, is designed on commodity hardware with gigabit Ethernet interconnections (Figure 3). By adding nodes, the Vertica database allows system performance improvement as per IHIS requirements and general expectations for exponential growth in healthcare data [63].
The BDA platform unifies three key components: Talend (version 6.4), Vertica (version 9.0.1), and Tableau Desktop and Server (version 10.5). As a specialised data integration environment for BDA platforms, Talend provides functionality for Ad-hoc Analysis Preparation, Metadata Management, Data Quality Management, and Data Integration. The Vertica NoSQL database, built on five nodes, provides Data Storage and Data Processing. Data Visualisation is covered by the Tableau Desktop (professional edition).
3.2.1. Data Integration (DI) Layer
The data integration (DI) layer represents a system module that enables parameterised data manipulation functions, including data transformation, processing control and hierarchy, reading, writing, and parallel or sequential tasks/threads processing. We use the term “metadata” to describe the resulting statistics, classification, or data aggregation tasks. The DI provides metadata for development, test, and production environments. The DI layer also provides visualisation of its processes in the form of data-flow diagrams. Another DI-specific tool generates outputs from pre-processed data. This tool also supports rapid process development, including selection and transformation of large volumes of primary data in parallel multi-threaded execution. To deal with near-future technical and operational challenges, the DI module also contains a debugging tool for software development, testing, and maintenance.
3.2.2. Data Storage (DS)
Data storage (DS) represents a system module that contains cluster-based, horizontally scalable physical architectures built onto NoSQL Vertica databases. The DS runs on commodity hardware with distributed storage capabilities, which allows for Massively Parallel Processing (MPP) over the entire data collection. The DS keeps data in a column format in two containers, Write Optimised Store (WOS) and Read Optimised Store (ROS), for best performance. Each cluster is a collection of hosts (nodes) with Vertica software packages. Each node is configured to run a Vertica NoSQL database as a member of a specific database cluster, supporting redundancy, high availability, and horizontal scalability, ensuring efficient and continuous performance. This infrastructure allows for recovery from any potential node failure by allowing other nodes to take control. For the presented solution (Figure 3), we set a fault tolerance K-safety = 2 [62]. The DI components specify how many copies of stored data Vertica should create at any given time.
3.2.3. Data Quality Management (DQM)
The data quality management (DQM) module supports data quality control including trends and data structures. The DQM generates complex models for end-users supporting data analysis for error detection and correction as well as sophisticated visualisation and reporting required for quality control tasks. It creates, sorts, groups, and searches for validation rules entered in a structured form. Validation rules can be executed over a user-defined dataset and managed centrally.
3.2.4. Metadata Management (MDM)
The metadata management (MDM) module supports the management of user, technical, and operational metadata. The MDM centrally processes metadata from every component of the MDHA system, housed collectively in the data warehouse.
The MDM can compare different versions of metadata and display outputs, including visualisation intended for data reporting. The MDM is able to create dynamic, active charts, and tables, allowing multidimensional and interactive views. The MDM uses sandboxing for testing temporary inputs and outputs and can generate outputs in HTML, PDF, and PPT formats. The MDM component utilises Online Analytical Processing (OLAP) operations over a multidimensional data model. Additionally, it contains a glossary of terms and concept links to enable impact and lineage analysis.
3.2.5. Ad-hoc Analysis Preparation (AAP)
For ad-hoc analysis preparation (AAP) processes, we programmed two different versions into the Talend Open Studio integration tool. In the first version, the MHDA uses Extract Transform and Load (ETL) components of the integration tool. These components read data from data warehouse structures (dimensions and fact tables) into memory. Then, the filtering and aggregation components process the data into an output table. The second version uses Extract Load and Transform (ELT) components of the integration tool. Both ETL and ELT components are able to generate user-friendly, unmodified SQL Data Manipulation Language (DML) statement(s) in the background. The AAP module accelerates the processing time without having to load large amounts of metadata into the program memory.
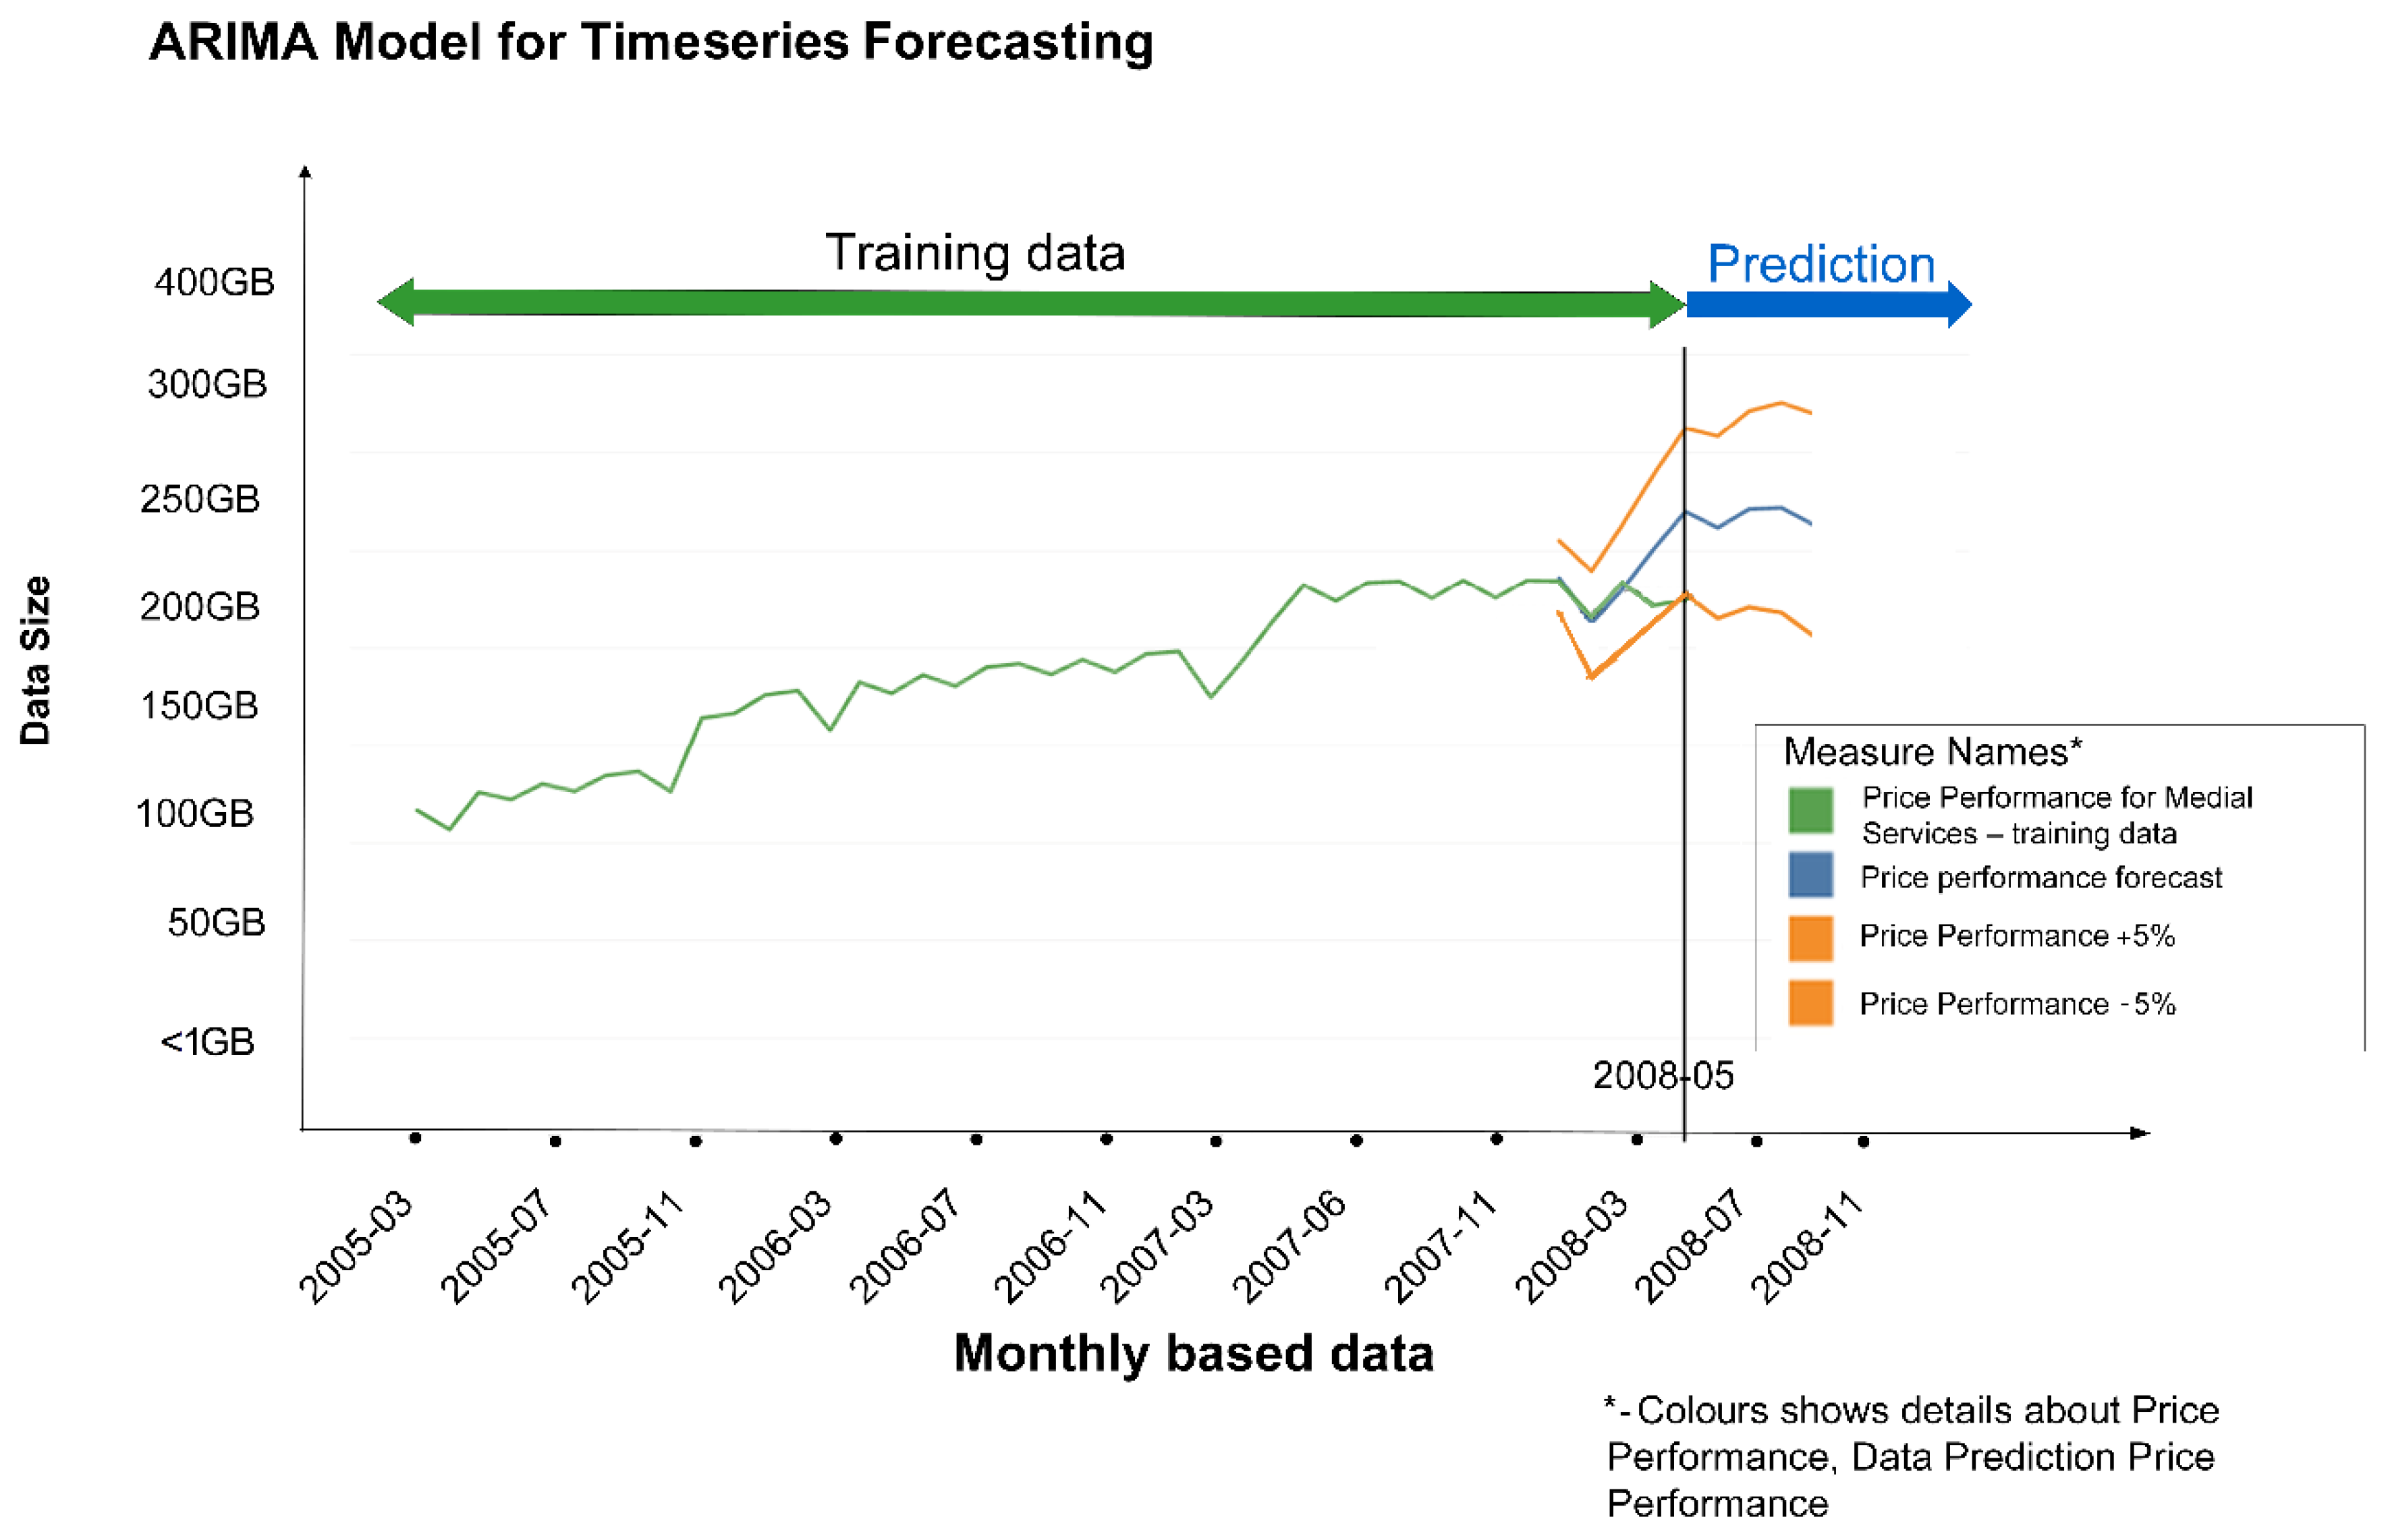
Figure 4 shows forecasting on a historical test dataset supplied by IHIS, where we tested the ARIMA [65] in-database approach to time series. This model can be created either directly in the NoSQL Vertica database, which supports predictive modelling, or in a separate statistical tool such as Tableau, which will take data from the database and return the created model (written in Predictive Model Markup Language (PMML) or another format the database supports).
Inclusion of machine learning and data analytics algorithms into the database often leads to increased processing demands on BDA platforms. Regarding data visualisation, Tableau Server (version 10.5, unlimited licenses) provides visualisation via both graphical user interface (GUI) and a web browser for standard end users. Tableau Desktop, however provides additional functionality intended for data analysts and data scientist user profiles.
3.2.6. Data Visualisation (DV)
The data visualisation (DV) module contains tools for describing data perspectives and knowledge discovery from data. The DV components represent data and metadata visually and give interpretations for possible insights. Additionally, we embedded DV components in Tableau to provide data and metadata visualisations in graphs and pictures. Tableau is a popular interactive analytical and data visualisation tool, which can help simplify raw data into easily comprehensible dashboards and worksheets. For example, Figure 5 depicts a part of the data visualisations from one of the IHIS case studies with a geographical map overlay.
3.3. TPC-H Tests Configuration
TPC-H requires data to be generated for eight tables using the specified scale factor (SF), which determines the approximate amount of data in gigabytes (Figure 6). We used the TPC-H power test, which measures the throughput/response times of a sequence of 22 queries (defined on p. 29) [1]. Vertica supports the ANSI SQL-99 standard and all queries are applied with no syntax changes. The test datasets were created by the TPC-H DBGEN program (Figure 1). In our tests, we found that the queries Q 9 and Q 21 are more complex in comparison with the commonly expected queries. For power benchmark purposes, we have shared TPCH_SF1000, consisting of row size x1000 (several billion elements).
The performance achieved using the dataset predefined by TPC-H (Figure 1) shows that the developed eSystem (as PoC) outperformed other competitors with similar product characteristics [66,67,68]. Experiments using the presented BDA platform architecture (Figure 3) and reported performance (Table 2 and Table 3, Figure 7 and Figure 8) were also tested by the government. The developed eSystem was installed within the Czech Republic borders in on-premises centralised mode using data communication channels that are physically separated from the existing Internet infrastructure.
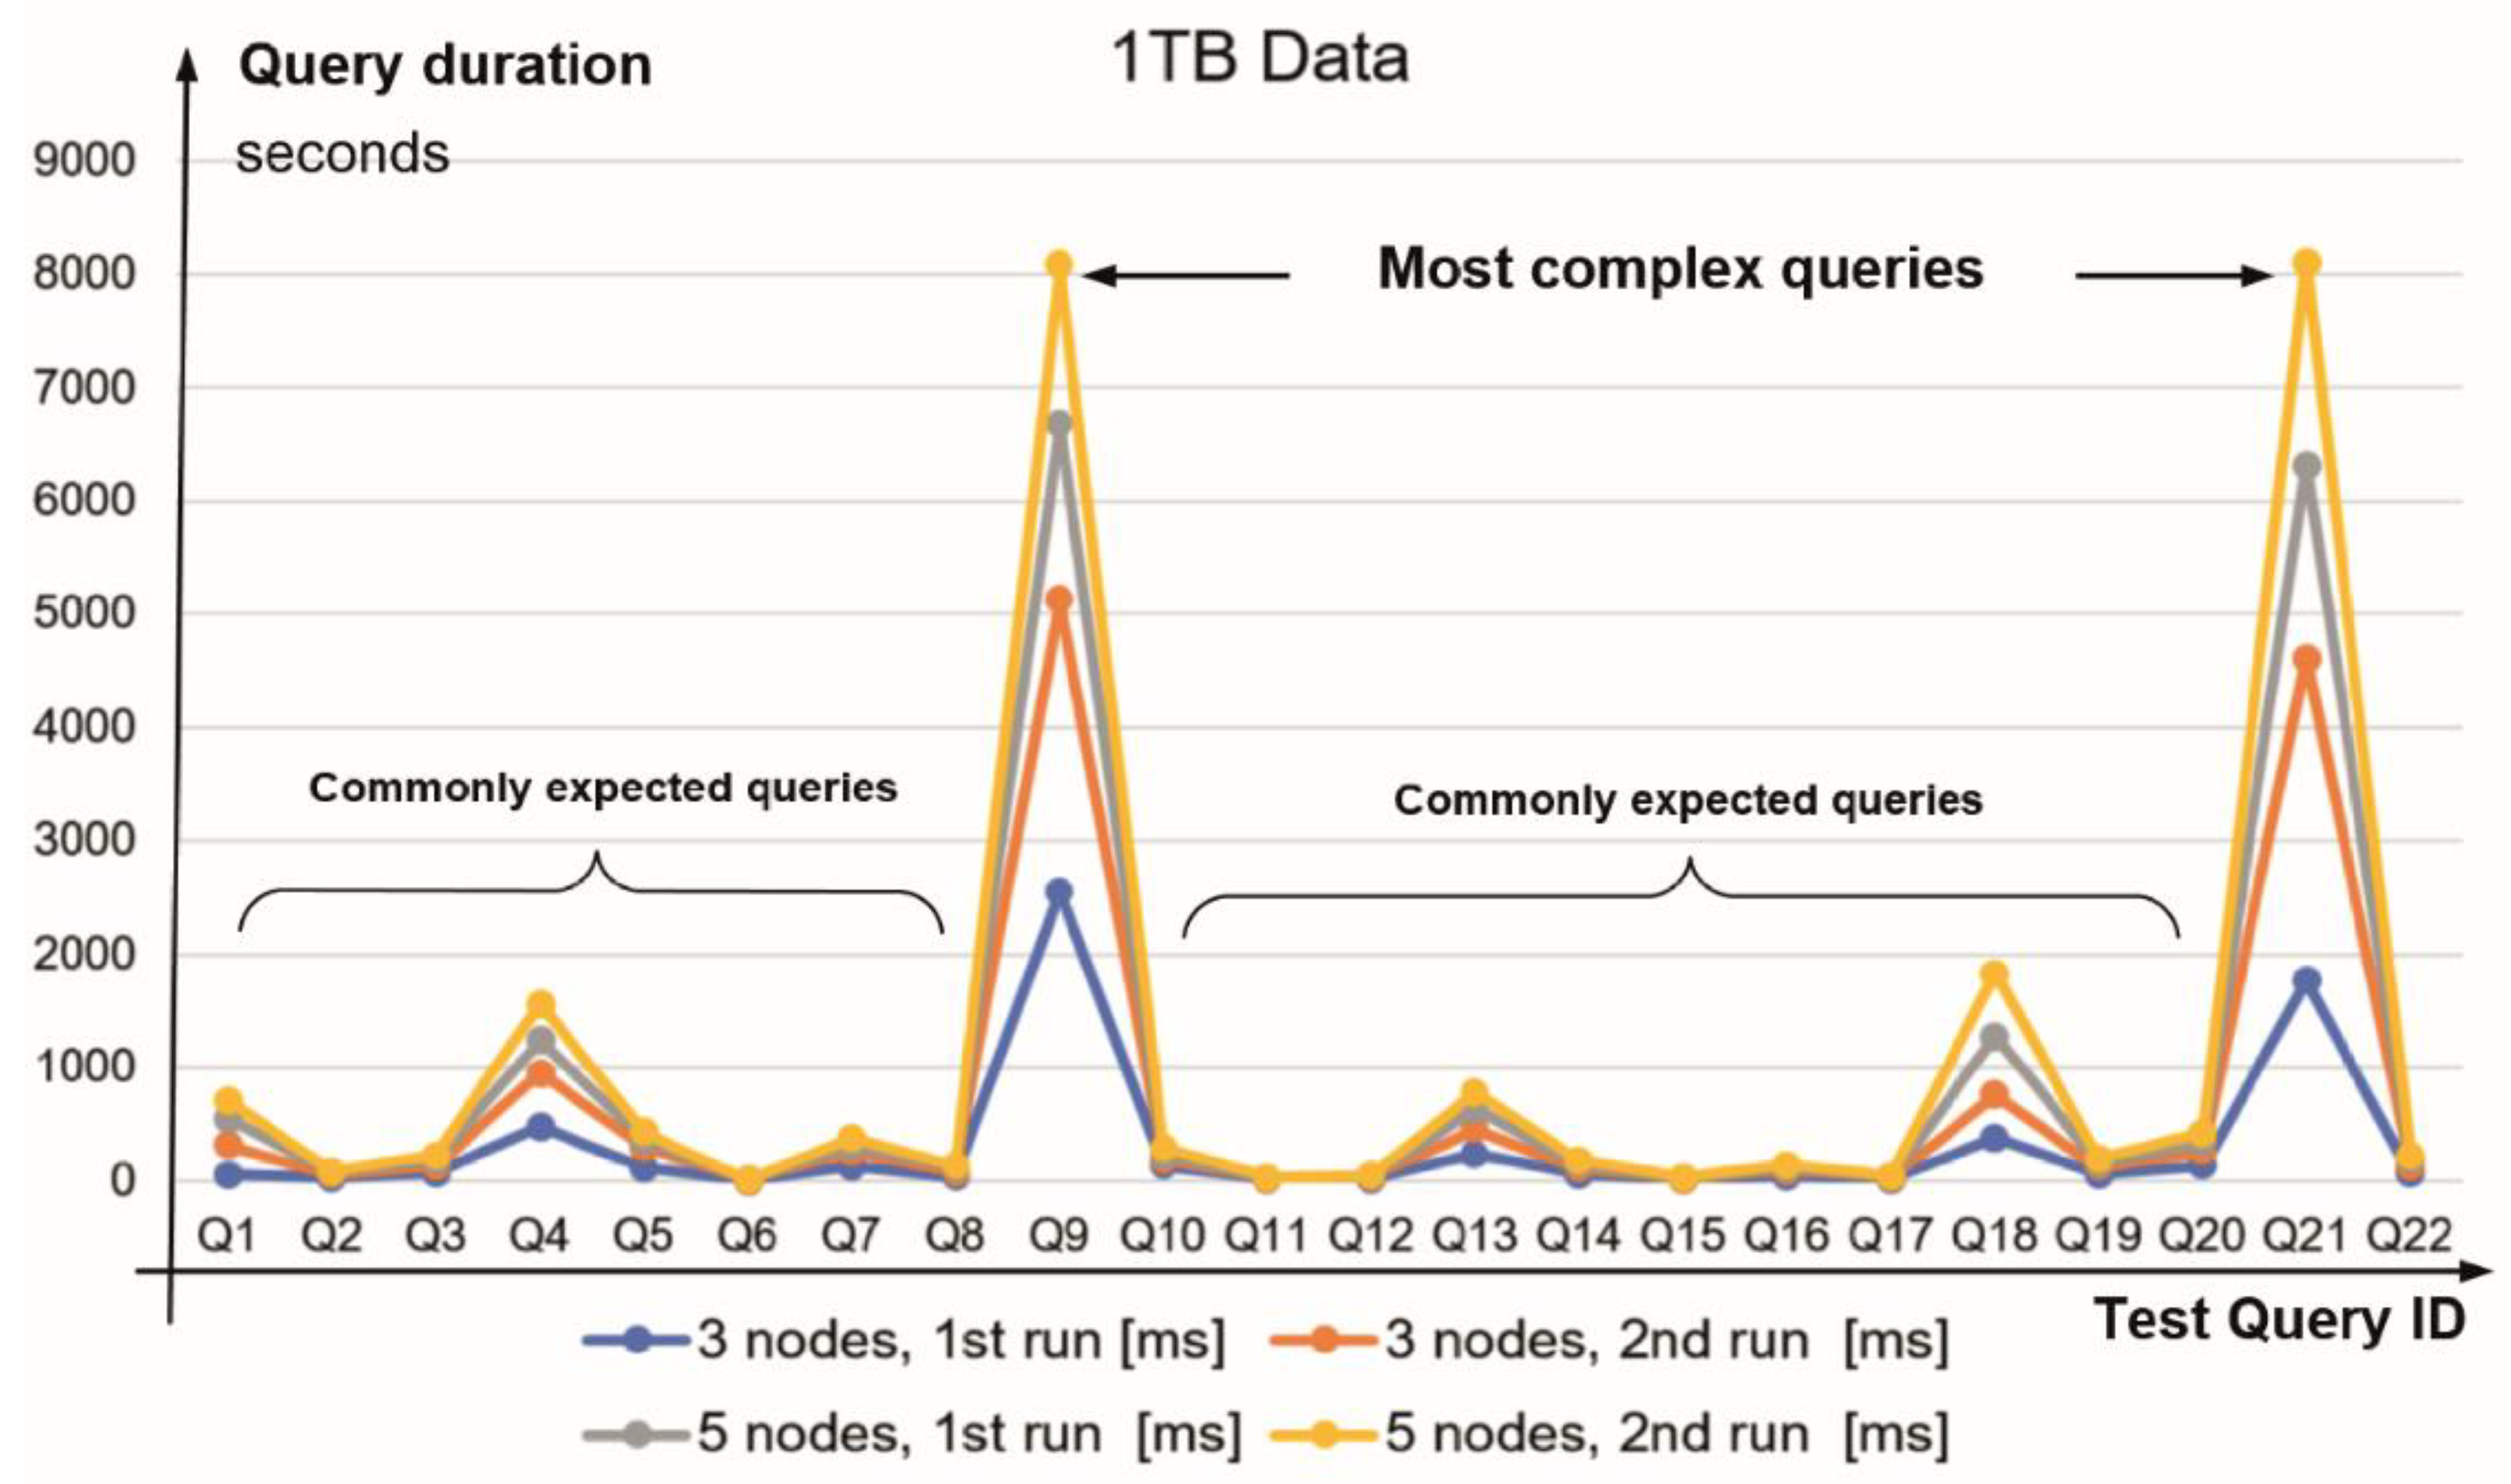
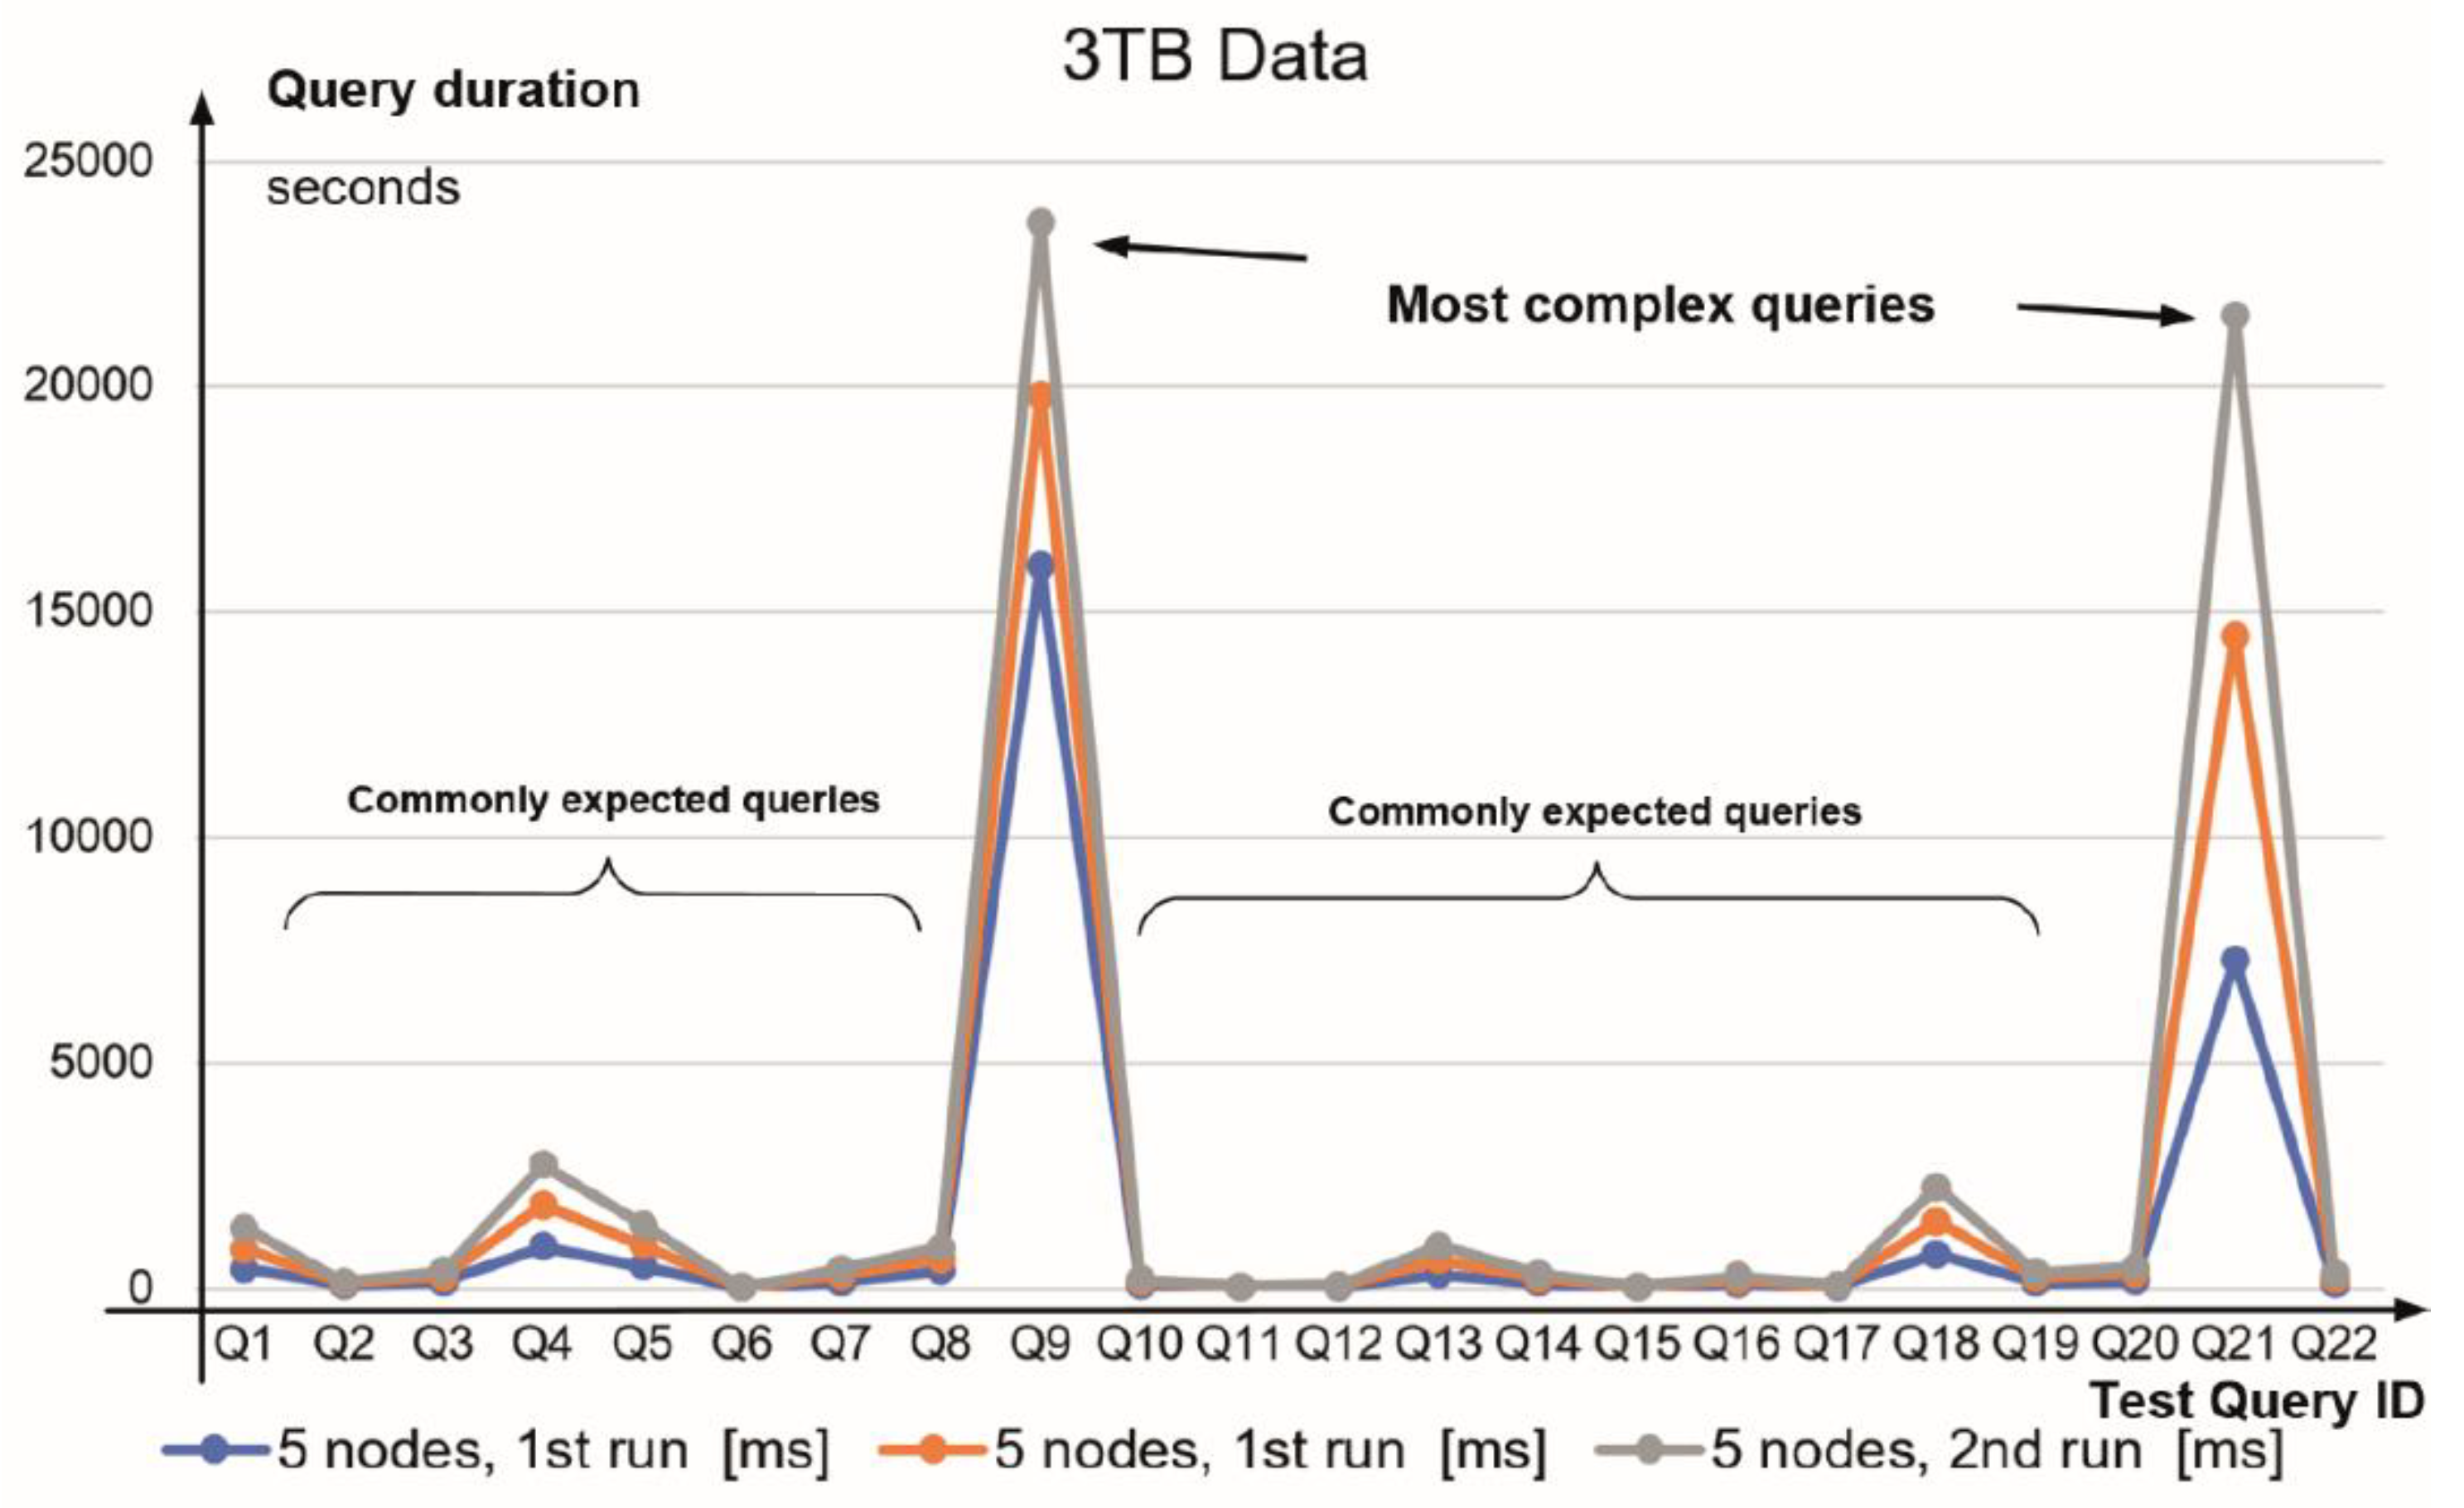
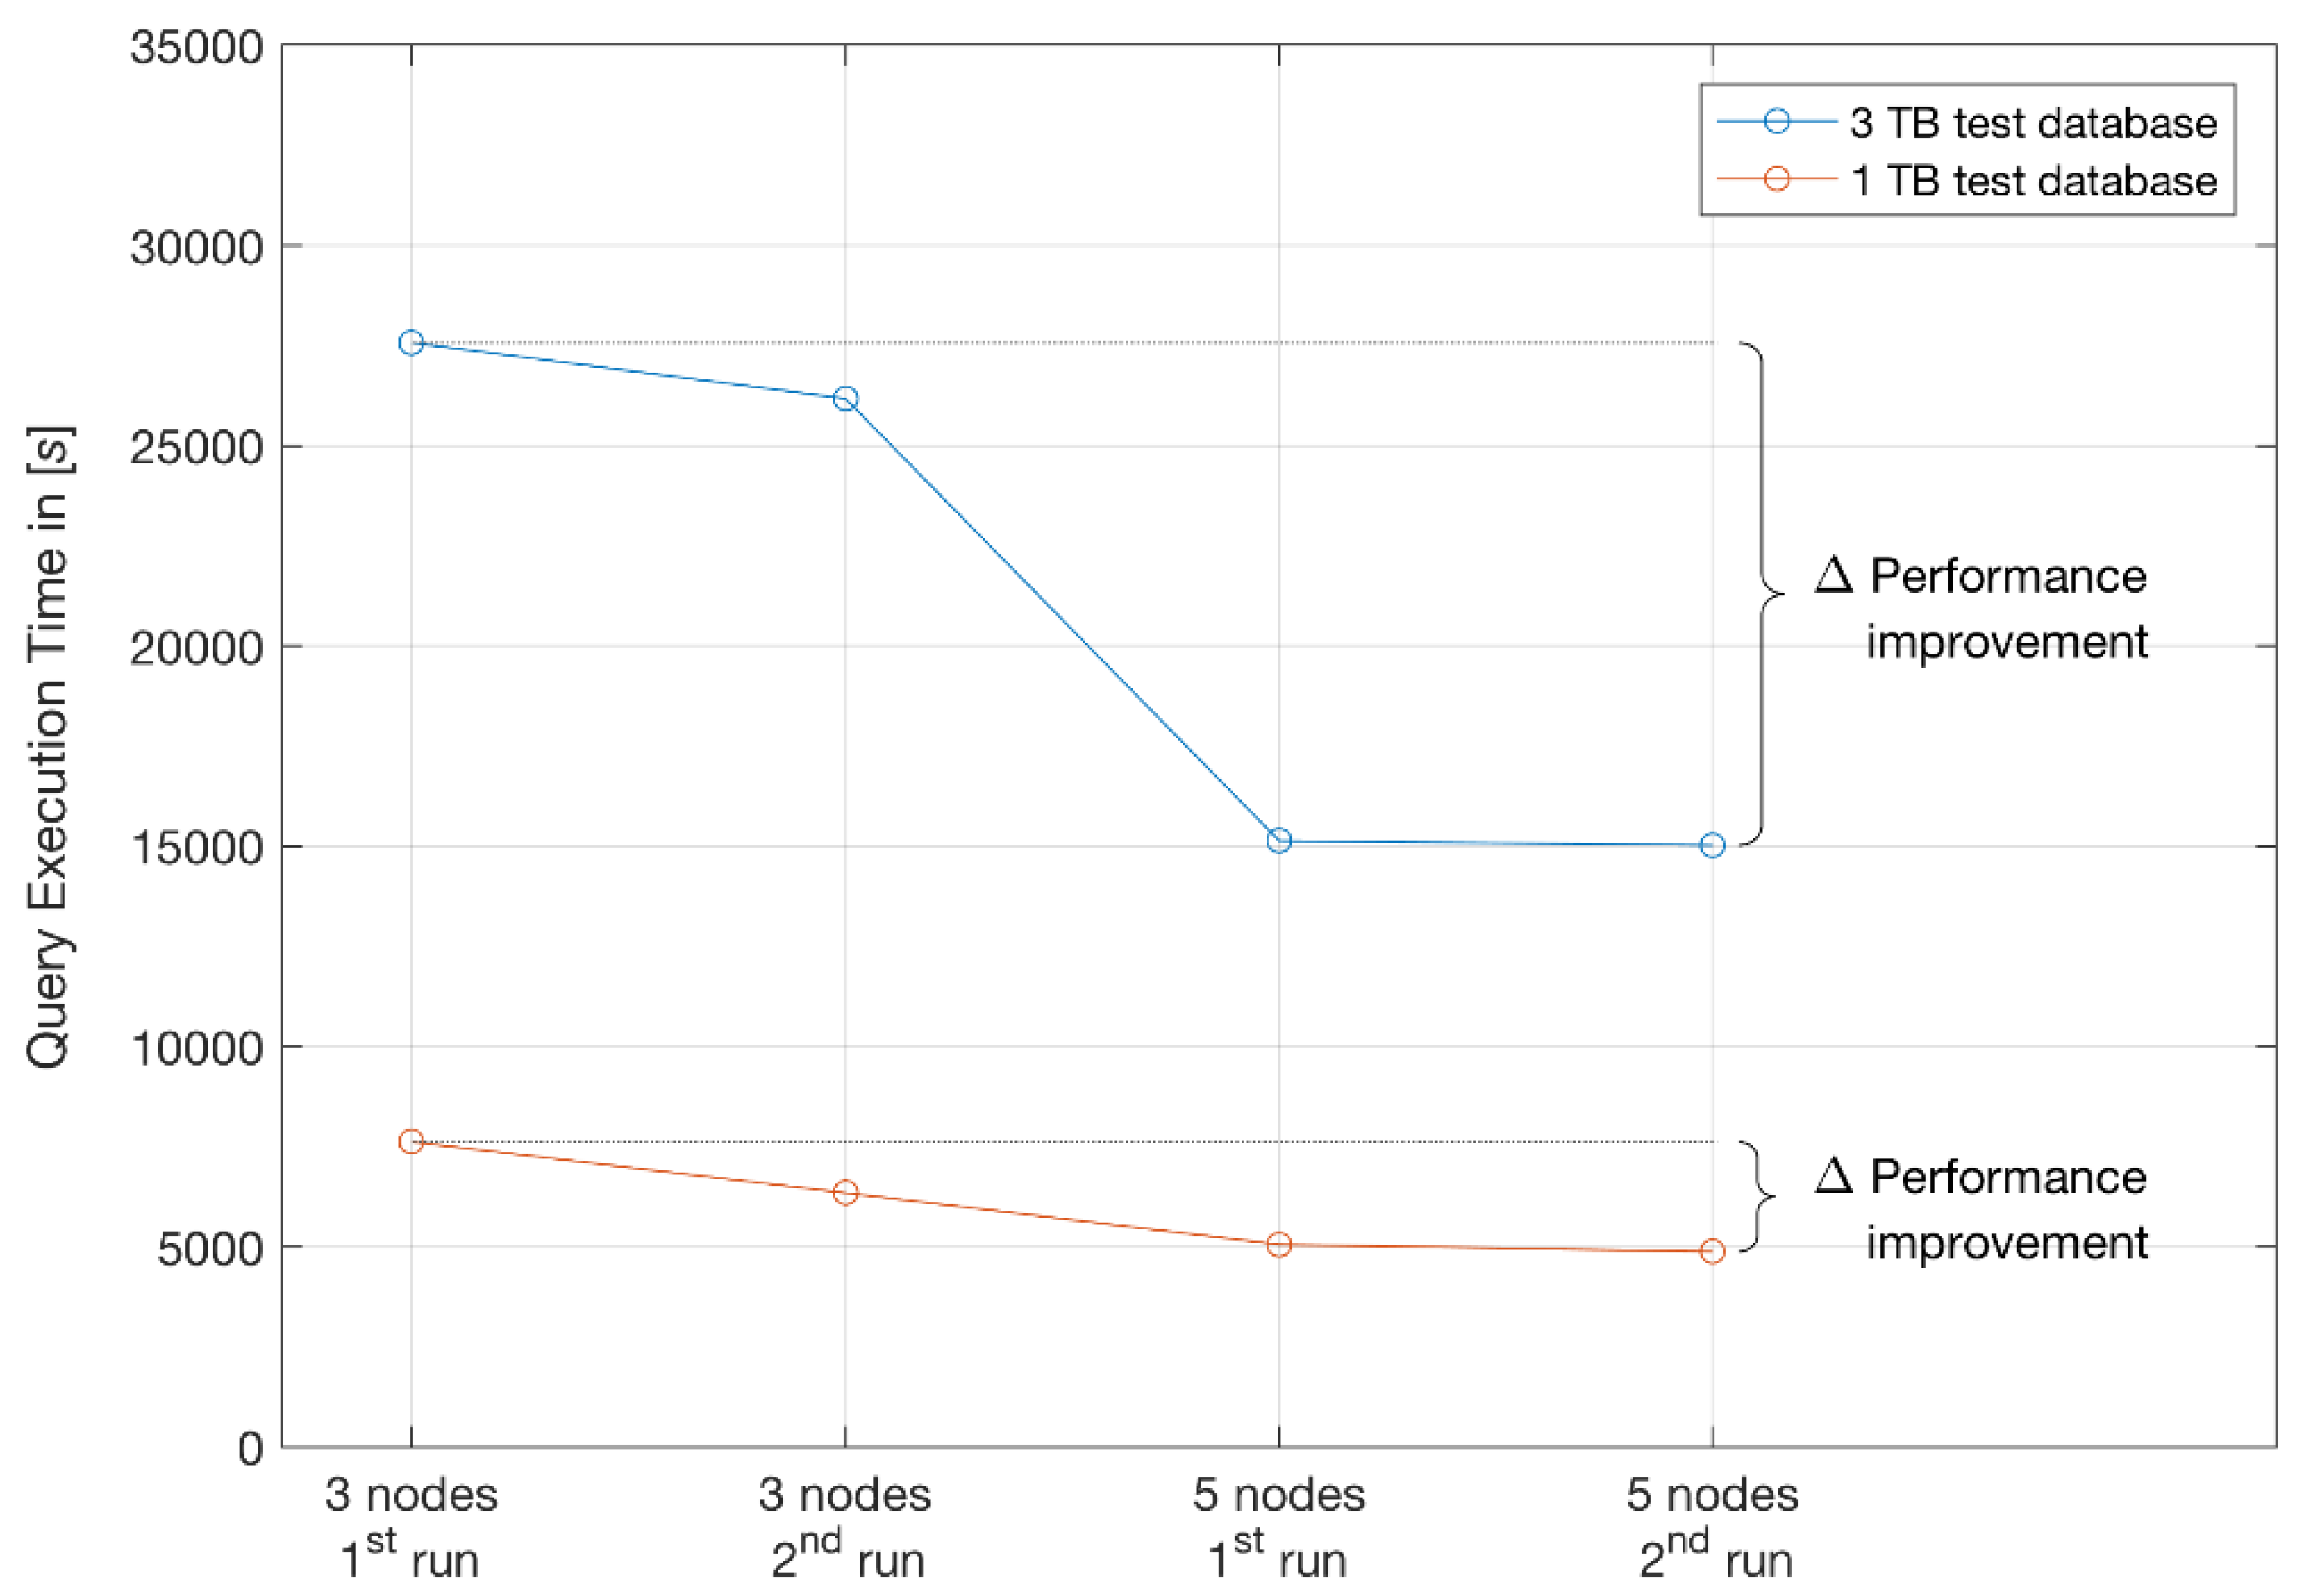
The performance of TPC-H tests running on a Vertica cluster for 1 TB and 3 TB database sizes (Table 3) are visualised in Figure 7 and Figure 8, indicating similar duration patterns for complex and commonly expected queries.
As per the client’s requirement, it was also necessary to include in our report two test runs on the same hardware configurations. The first set of TPC-H query execution times were completed after a cold system restart. The second set of test runs provide an indication on performance improvement after database restart only.
Monitoring I/O requests to accurately capture workload behaviour is important for the design, implementation, and optimisation of storage subsystems. The TPC-H trace collection on which we conducted the analysis was collected on Vertica 9.0.1 database cluster running on CentOS Linux 7.3 (installed on ext4 file system), five nodes, 2 × 10 cores CPU Intel® Xeon [email protected] GHz, 16 × 8 GB = 128 GB RAM, 6×HDD 900 GB (@15K rpm), 2 × 1 Gb Ethernet, 2 × 10 Gb Ethernet, 2 × 16 Gb Fibre Channel Adapter. Due to the ratio of performance to price set by the client, we could not recommend faster disk I/O technology.
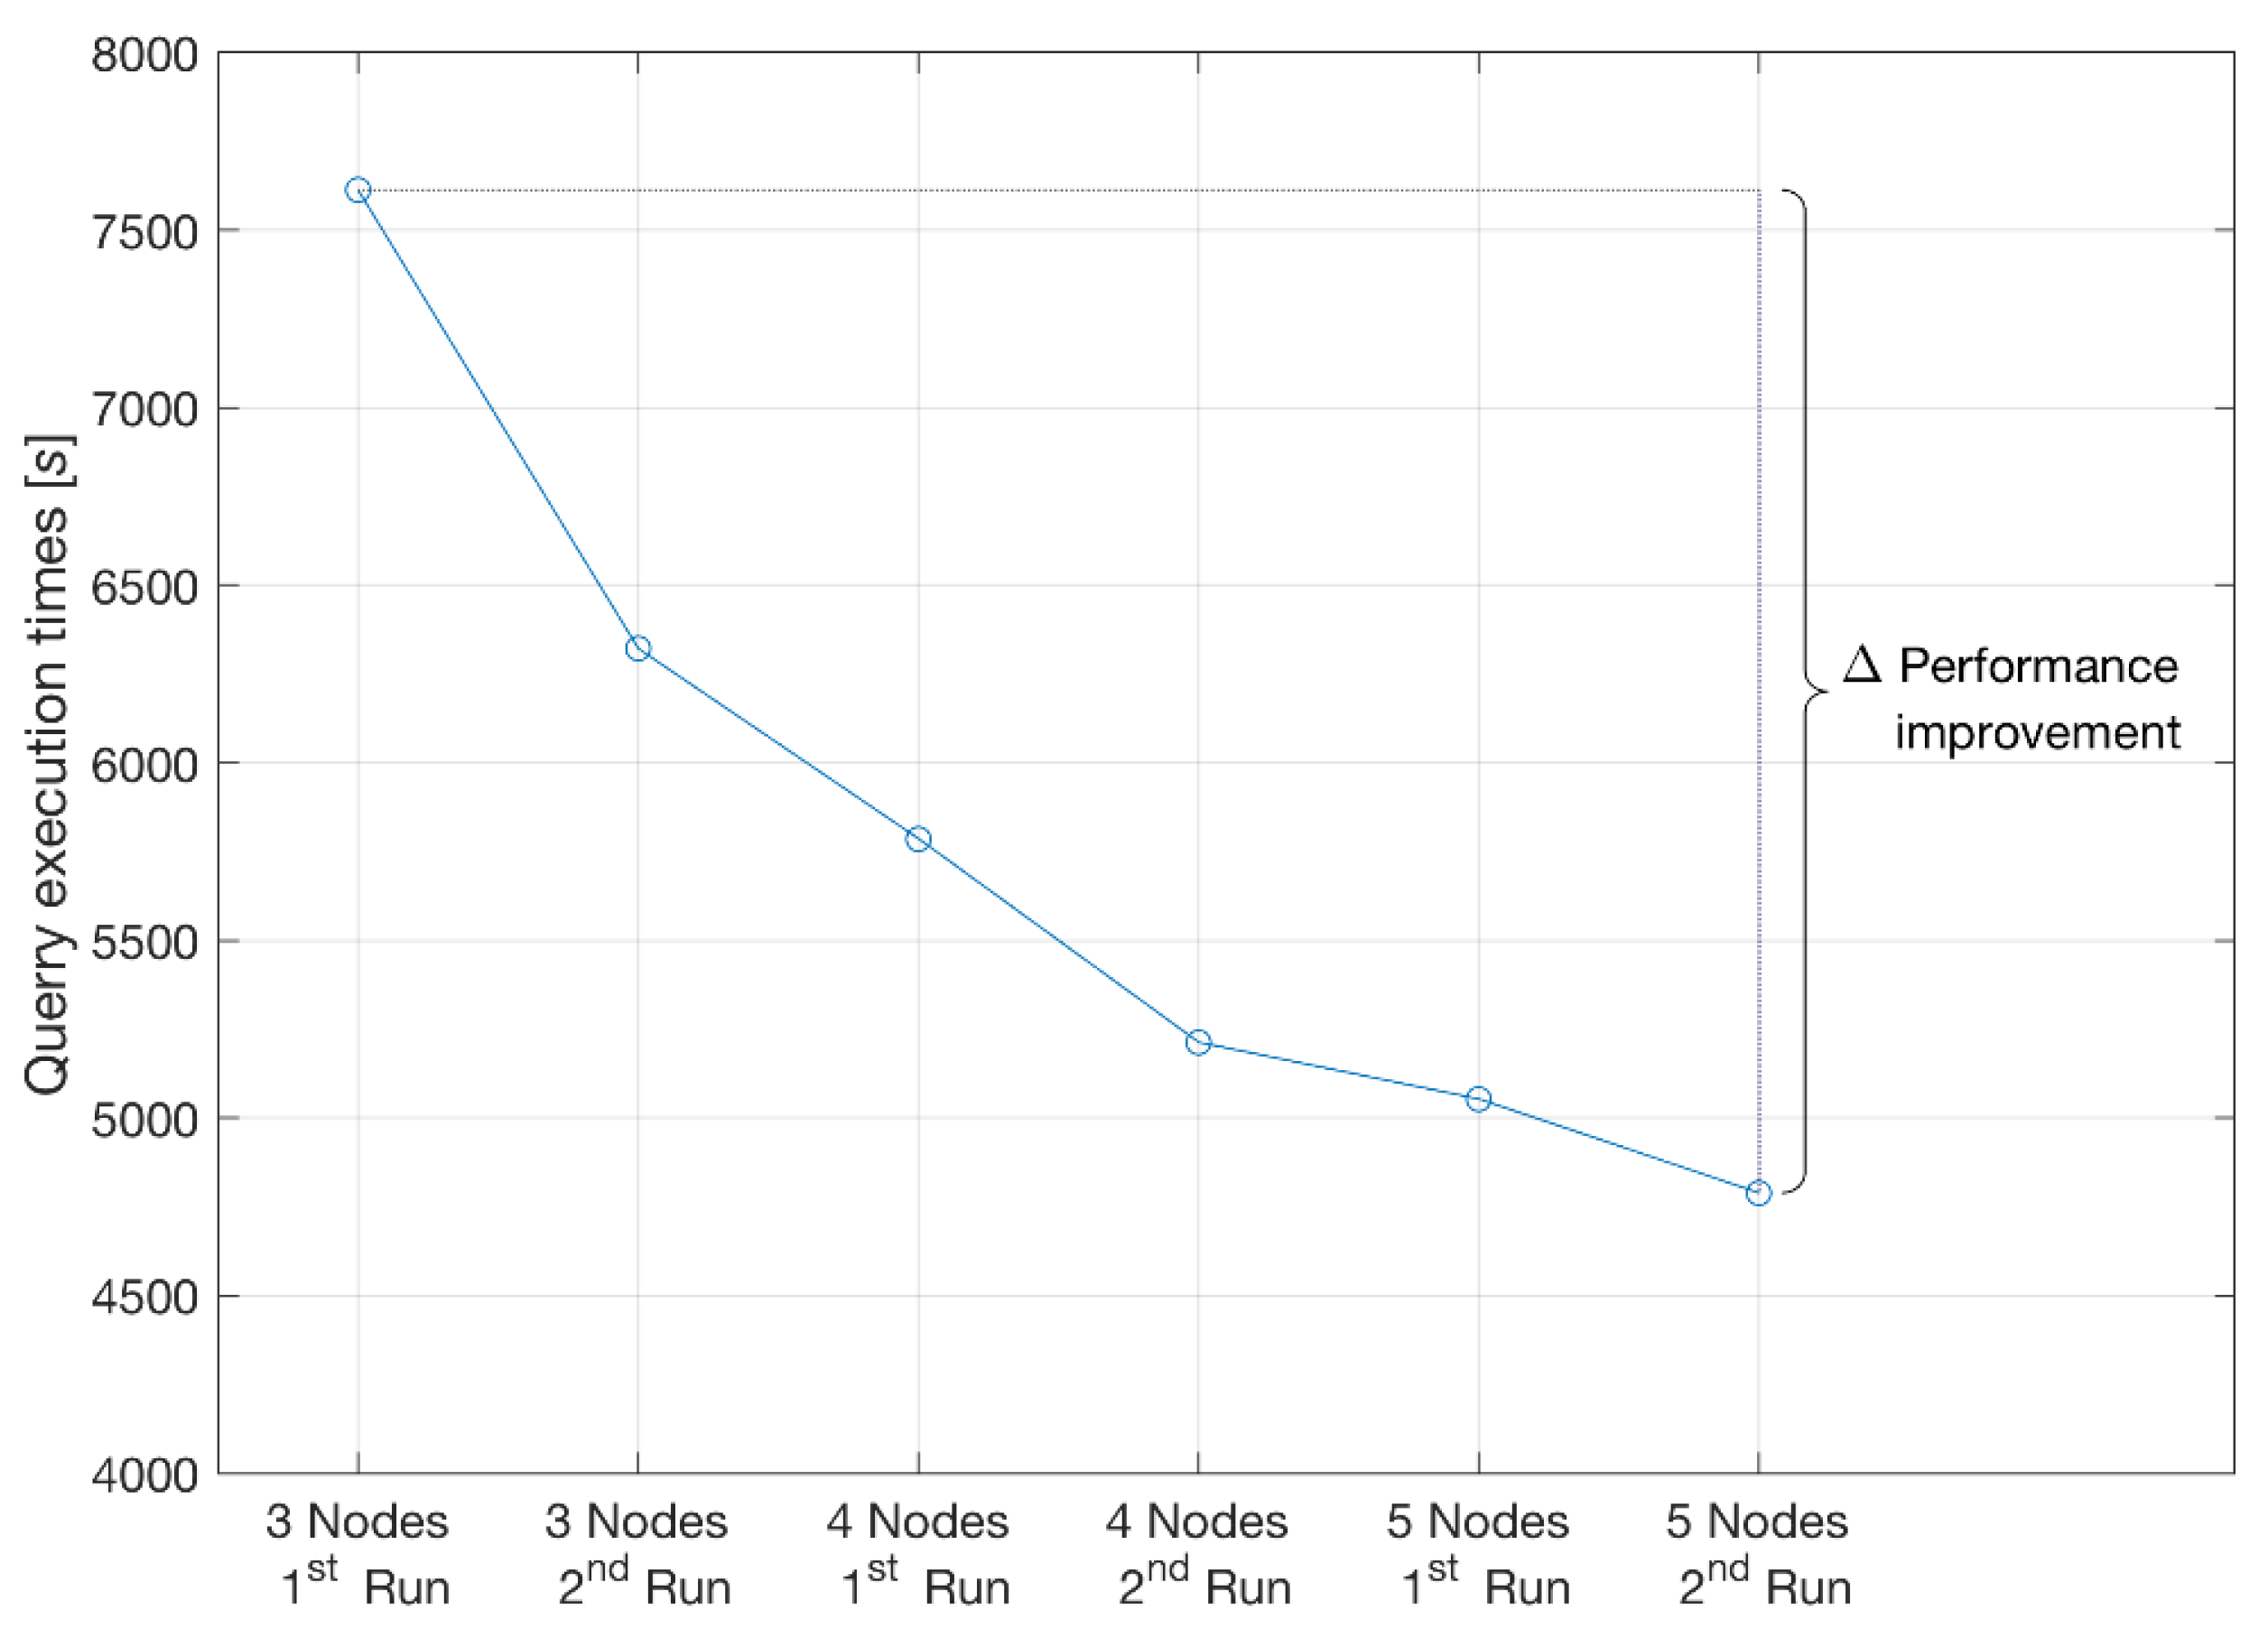
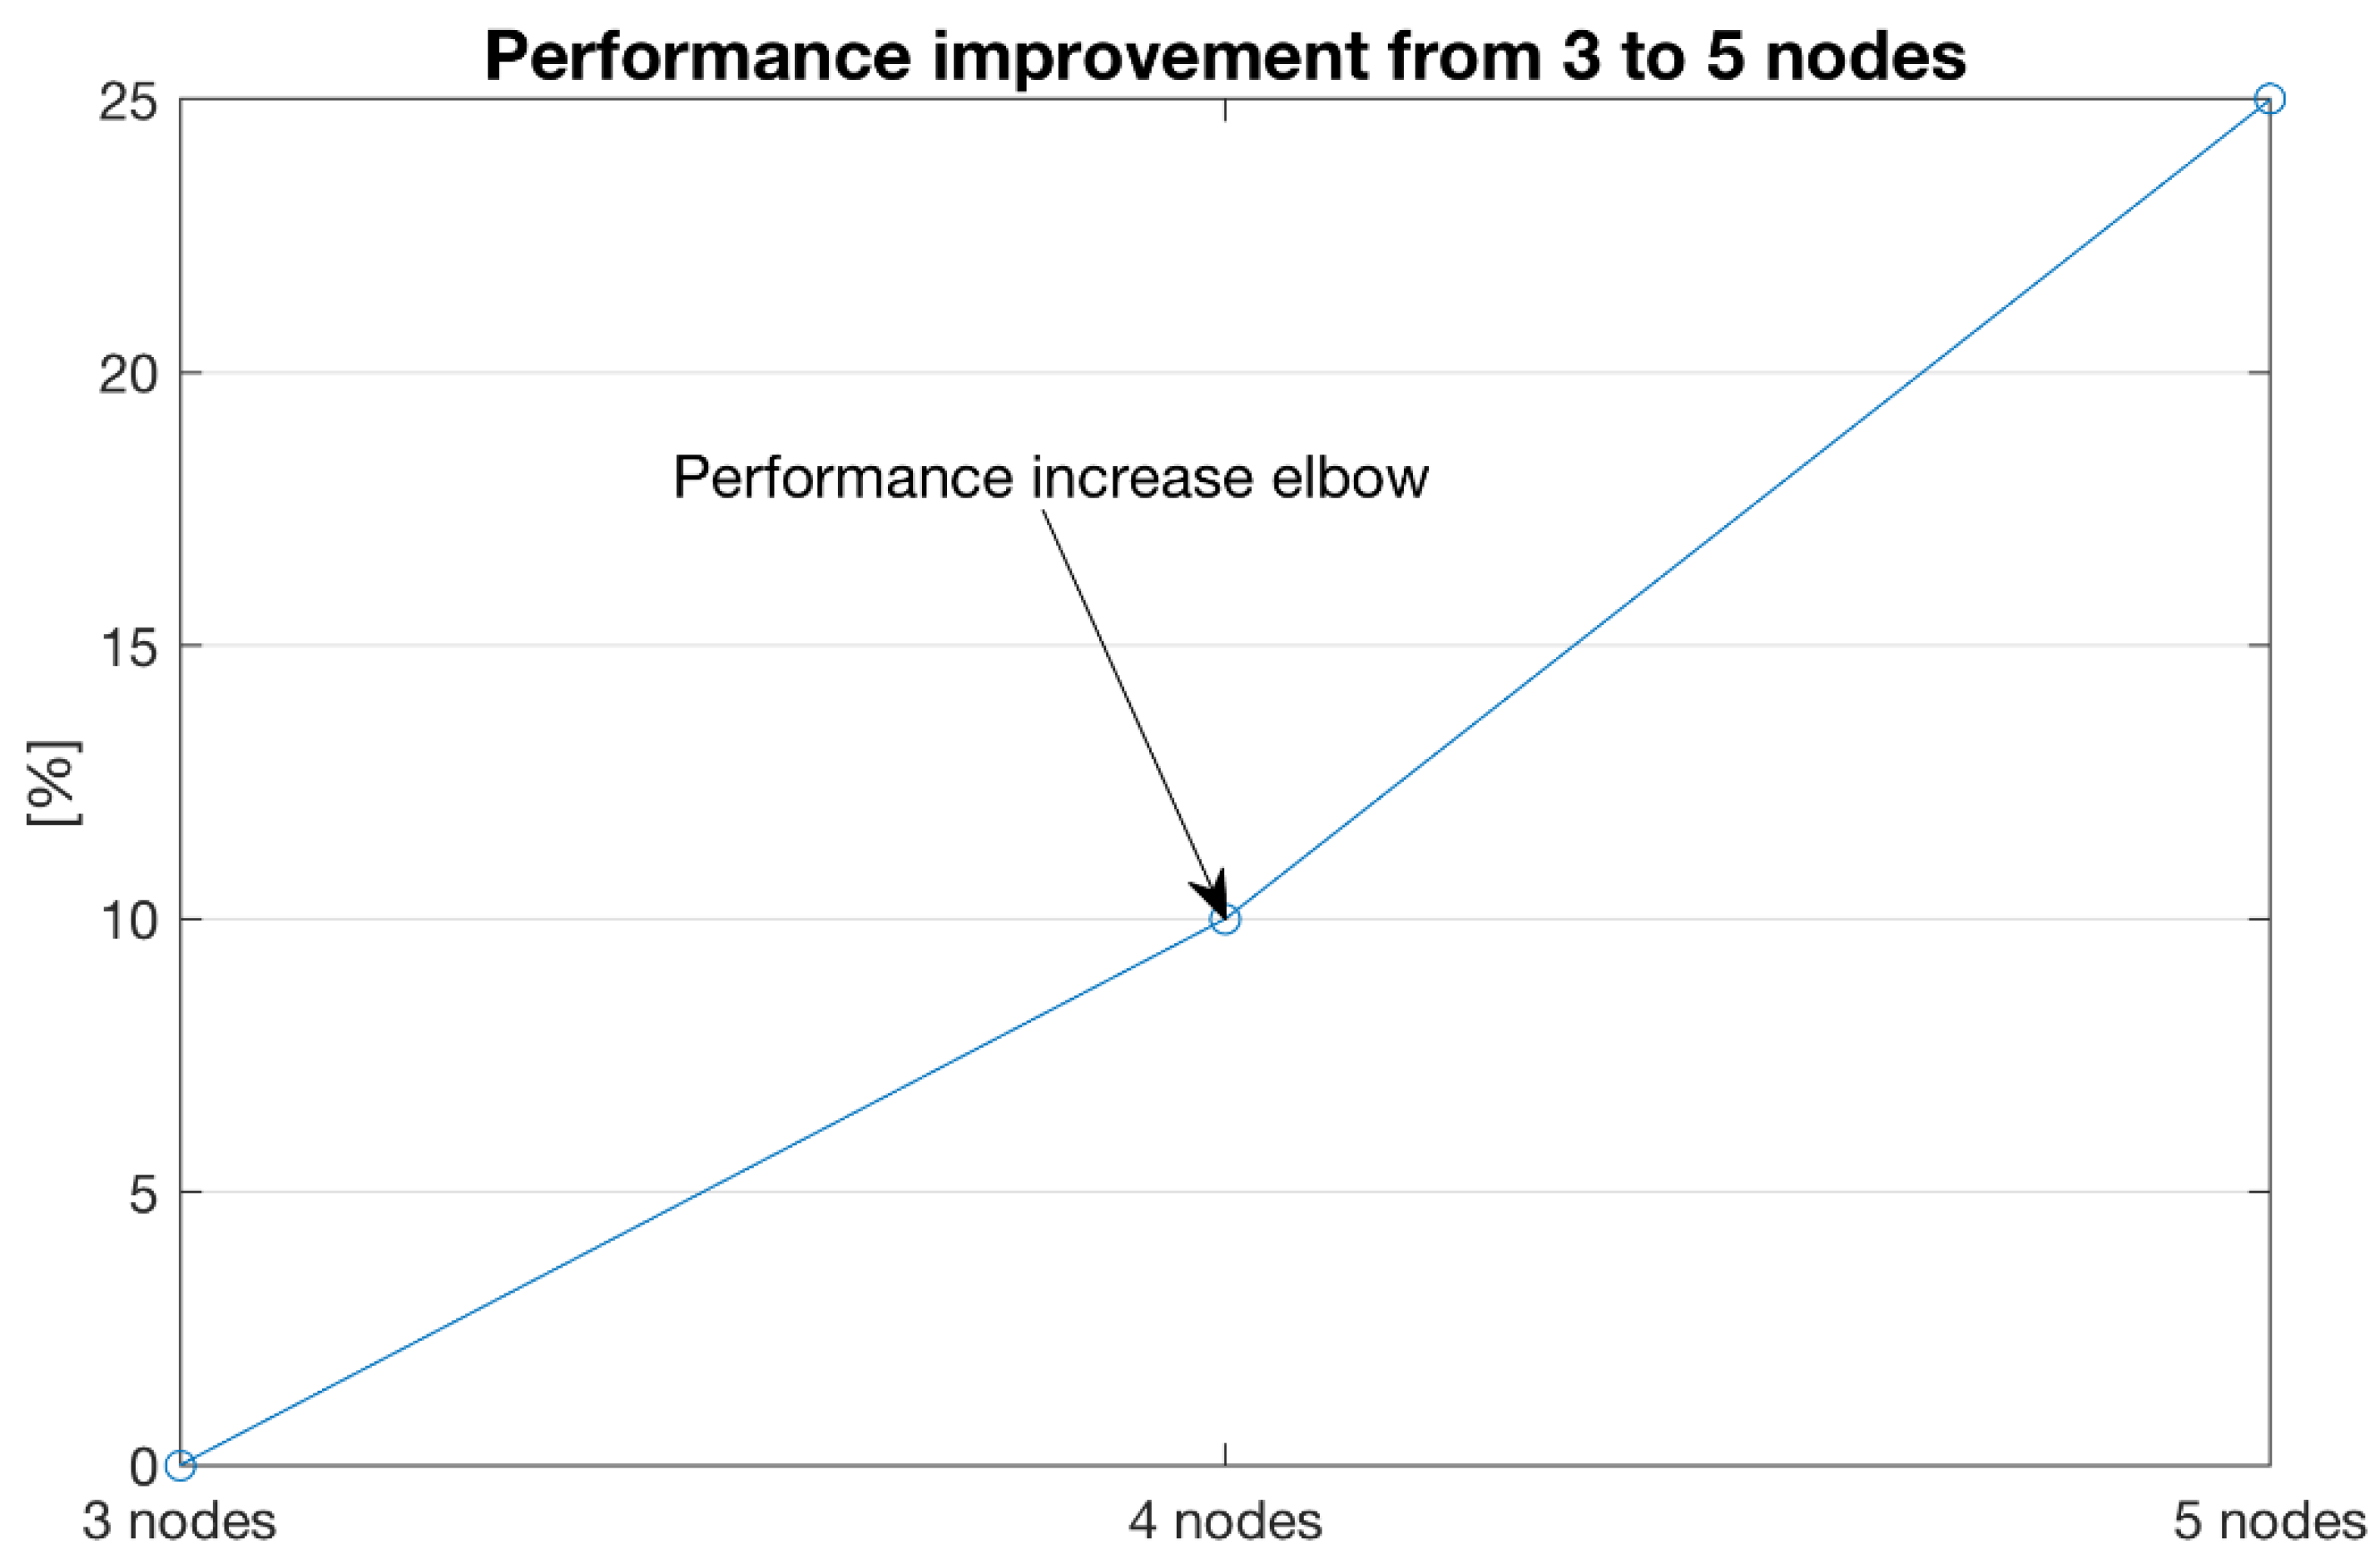
As introduced, the TPC-H can also be used as a metric to reflect on multiple aspects of a NoSQL Vertica database system’s ability to process queries. The aspects of performance improvements for different database sizes and system expansion are captured collectively in Table 4 and Figure 9, Figure 10 and Figure 11. As such, it is possible to infer anticipated needs for future system upgrades and expected performance based on evidence from measured performance improvements from three to five nodes tested on 1 TB and 3 TB databases.
In comparing performance improvement and scalability perspectives, the results show at least 25% performance increase from 3 to 5 nodes (Figure 11) on 1 TB database size utilising a low-cost commodity hardware.
Query execution times and performance improvements achieved by adding extra computer resources provide sufficient evidence of a scaled-out design to work in the future with larger datasets.
4. Discussion
The use of big data technology intended to advance a healthcare eSystem can be evaluated in terms of achieved performance, privacy, security, interoperability, compliance, costs, and future proofing such as scalability to incremental hardware integrations, analytical tools, and data increase. In the case of the Czech Republic national tender (Id. VZ0036628, No. Z2017-035520), vendor-independent solutions had to meet a large number of requirements encompassing all of the above-mentioned criteria intended to modernising the national healthcare system within the European Union. Due to contractual obligations with IHIS, as a participating party, we were unable to obtain or to disseminate competitors’ details, including their system performance benchmarks or other proposed BDA platform architecture. However, our contract permits dissemination of the results and authorship for PoC before handover to the IHIS. The presented BDA solution accepted by the Czech Republic has met all the requirements and has demonstrated system performance results well-exceeding required thresholds.
Concepts and insights transferrable to other healthcare systems are based on this case study and on the consensus of experts’ views, reported literature, and existing knowledge available in the public domain. The authors’ views and vision for big data in future healthcare eSystems are based on professional experience, findings from Vertica-based eSystem development, and big data concepts. As such, we wish to emphasise the importance of scalability for future data and performance increases, accommodation of near-future machine learning algorithms and analytical tools, security, and strategic healthcare planning. Therefore, looking beyond the primary scope of this project, we question what the implications for healthcare and other big data industry professionals are. For a start, the Vertica BDA platform runs on Amazon, Azure, Google, and VMware clouds, providing user agility and extensibility to quickly deploy, customise, and integrate a variety of software tools. Vertica enables data warehouse transition to the cloud and on-premises, providing flexibility to start small and grow along with the customer’s business requirements. In this case, our client (IHIS) set the conditions for implementation of the proposed solution according to the on-premises principle. The solution had to be physically isolated from the Internet and it was not possible to propose a cloud-based solution. Nevertheless, Vertica provides end-to-end security with support for industry-standard protocols, so we believe that the future of infrastructure will evolve as a multi-cloud and hybrid solution i.e., as a mixture of on-premises and cloud environments. Such data analytics and management approaches are not meant to be restricted to one type of environment only. For example, Vertica announced the availability of Eon Mode for Pure Storage (https://www.vertica.com/purestorage/) as the industry’s first analytical database solution with a separation of computing and storage architecture for on-premises workload distribution.
Other available big data scalable technologies and frameworks [69,70,71,72,73] include Hadoop, an open-source ecosystem (with proprietary file system HDFS); and the Java-based MapReduce framework for storing and batch processing of large amounts of data. Apache Spark is also designed to fit well within big data ecosystems. Apache Spark, for example, is known for keeping large amounts of data (RDD—Resilient Distributed Data) in memory and providing better computing performance than Hadoop (in orders of tens to one hundred). However, Apache Spark in-memory computing engine does not perform key-value storage as Hadoop on HDFS or NoSQL databases within its framework.
Apache Spark and NoSQL databases are often coupled in one ecosystem on top of a Hadoop installation. Considering Apache Spark with Hadoop ecosystems, there are overheads and delays associated with the data movement. Furthermore, such ecosystems require extra administrative efforts, particularly in cases of separate clusters and data duplication.
As a part of the presented solution, the open-source product Talend Open Studio (version 6.4) was used with the intention of data integration, extract-transfer-and-load (ETL) to various data sources (including file systems, Hadoop, NoSQL, RDBM) in batch or real-time processing fashion.
The recommended operating system for the Vertica BDA platform is Linux Centos 7.3. Vertica also has support for other Linux-based operating systems, such as (in order of authors’ preference): Red Hat Enterprise Linux (RHEL) 7.3, Oracle Enterprise Linux (OEL) 7.3, SUSE 12 SP2, Debian 8.5, and Ubuntu 14.04 LTS. For our eSystem implemented on IHIS premises, we additionally installed open-source software Nagios Core (version 4.1) for network infrastructure and cluster monitoring purposes.
Regarding plans for our BDA solution in 2021, we are considering proposing further improvements to national healthcare and privacy protection by stream data processing from health IoT devices and mobile apps (including wearable devices such as smart watch sensors). Currently, we are conducting tests in a development environment expanded by another platform’s components (Eclipse Mosquitto open source broker for carrying out stream data from IoT devices by using MQTT protocol). Acquired test data from IoT devices are transferred as stream data via MQTT Mosquitto broker (https://mosquitto.org), transformed using Apache Spark (https://spark.apache.org) and stored for future data operation purposes in Hadoop. From that layer, data are further processed in a Vertica NoSQL cluster. For IoT platform management purposes, we are using Node.js (https://nodejs.org/) to build fast and scalable network applications and the Angular platform (https://angular.io) for building mobile and desktop applications.
5. Conclusions
The growing volume of medical records and data generated from near-future IoT and mobile devices mandates the adoption of big data analytics (BDA) in healthcare and related contexts. As part of the national strategy for BDA adoption in healthcare, the Czech Republic healthcare institute (IHIS) has aligned its strategy with the European Union. With over 100 complex requirements, in line with statutory regulations, included in the national public tender, was the inclusion of a reported subset of criteria regarding performance, cost-effectiveness, robustness, and fault tolerance. Such a BDA solution, running on Linux-based open source software (e.g., Talend Open Studio, Python, R, Java, Scala environments), had to be capable of achieving competitive and above-expected threshold results regarding overall system performance evaluation, based on TPC-H industry-standard decision support benchmark.
The tender-winning BDA solution reported here represents a snapshot in time, which exceeded expected operation on healthcare-specific TPC-H benchmark tests. The BDA solution and its control was transferred to IHIS, which over the past seven months has unified the isolated healthcare systems into one eSystem. In addition to demonstrated tests and real-life performance, the current eSystem has great potential to improve national healthcare in the Czech Republic, as well as to accommodate evolving expectations and future data needs. The produced eSystem based on Vertica analytic database management software is future-proofed in terms of stream and high-volume processing, scalability (based on consumer/commodity hardware) and fault tolerance (e.g., shutting down cluster nodes would not cause data loss). Horizontal scalability tests using commodity hardware demonstrate a performance improvement of over 25% by increasing the number of cluster nodes from three to five, providing sufficient evidence of a scaled-out design based on cost-effective commodity hardware.
Currently, the produced BDA healthcare eSystem is physically isolated from the Internet infrastructure by being installed in an on-premises mode within the national geographical boundaries and therefore is considered highly secure, supporting industry standards regarding data security and protocols. The BDA healthcare eSystem supports a variety of open-source software, including various Linux distributions with a growing number of machine-learning libraries and integration of commercial tools such as Tableau. In light of the recent Coronavirus outbreak, the presented eSystem provides regional data geo-mapping visualisation of the Czech Republic within 10 s updates and can exchange data with other healthcare eSystems. In addition to data integration, the geo-mapping functionality provides near real-time pandemic/epidemic tracking, outbreak spread monitoring, and risks data visualisation.
The next steps in the future development of the presented healthcare BDA platform includes: (1) BDA platform extensions supporting medical IoT and mobile apps data streaming so that the existing solution remains ‘the blueprint’ architecture; (2) support for data-driven decisions during high-traffic events; (3) ongoing horizontal scaling and an increase from 100 TB to 1 PB (Petabyte) processing capability; (4) new approaches to data cleaning, storing, and retrieval with minimal latency; (5) integration with other national registers (e.g., to manage and facilitate drug distribution logistics); and (6) strategic planning using healthcare data.
Author Contributions
M.Š. is the principal researcher. He proposed and formulated idea, design, performed the test experiments and wrote the first draft; B.B. completed this document based on further writing, restructuring and incremental editing of the manuscript as well as conceived the study; L.S. performed final approval of the manuscript. All authors have read and agreed to the published version of the manuscript.
Funding
This research received no external funding.
Conflicts of Interest
The authors declare no conflict of interest.
Appendix A
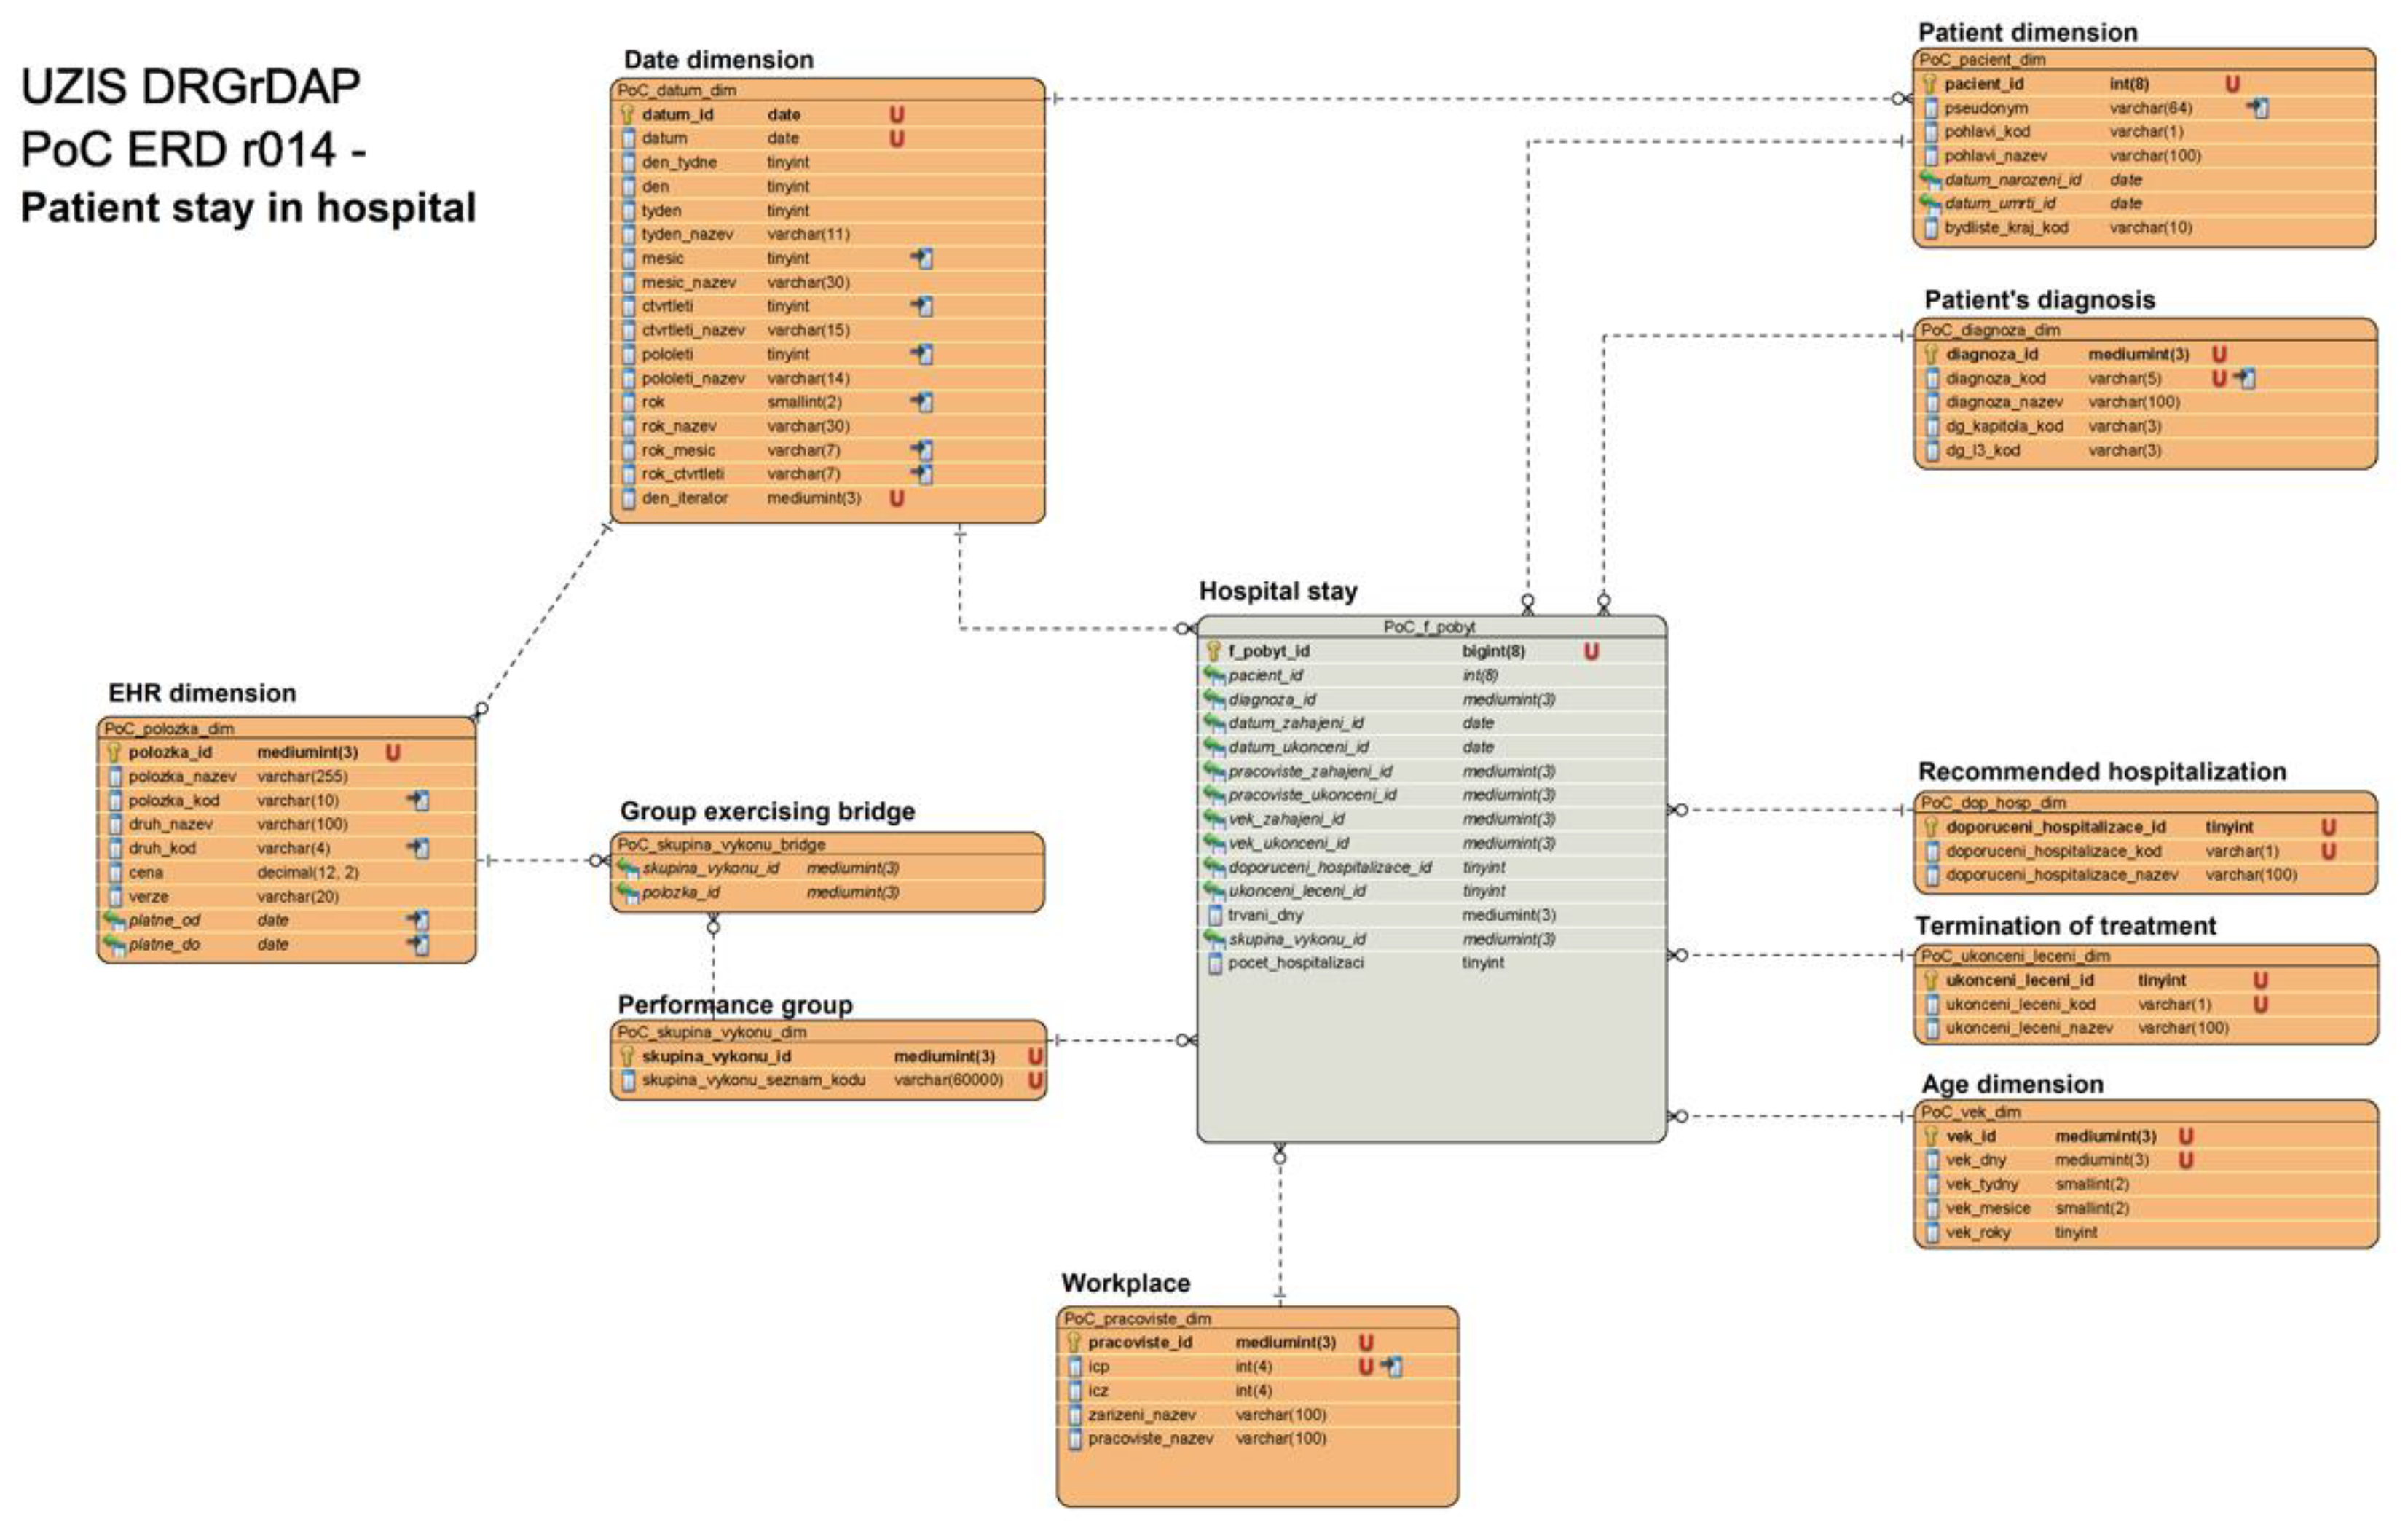
The Appendix section refers to supplementary data and ERDs (Figure A1 and Figure A2). TPC-H benchmarks for the PoC testing phase performed on data provided by IHIS.
The input data structure represents IHIS data for initial load for both patients’ and electronic healthcare records (EHR) data warehouses:
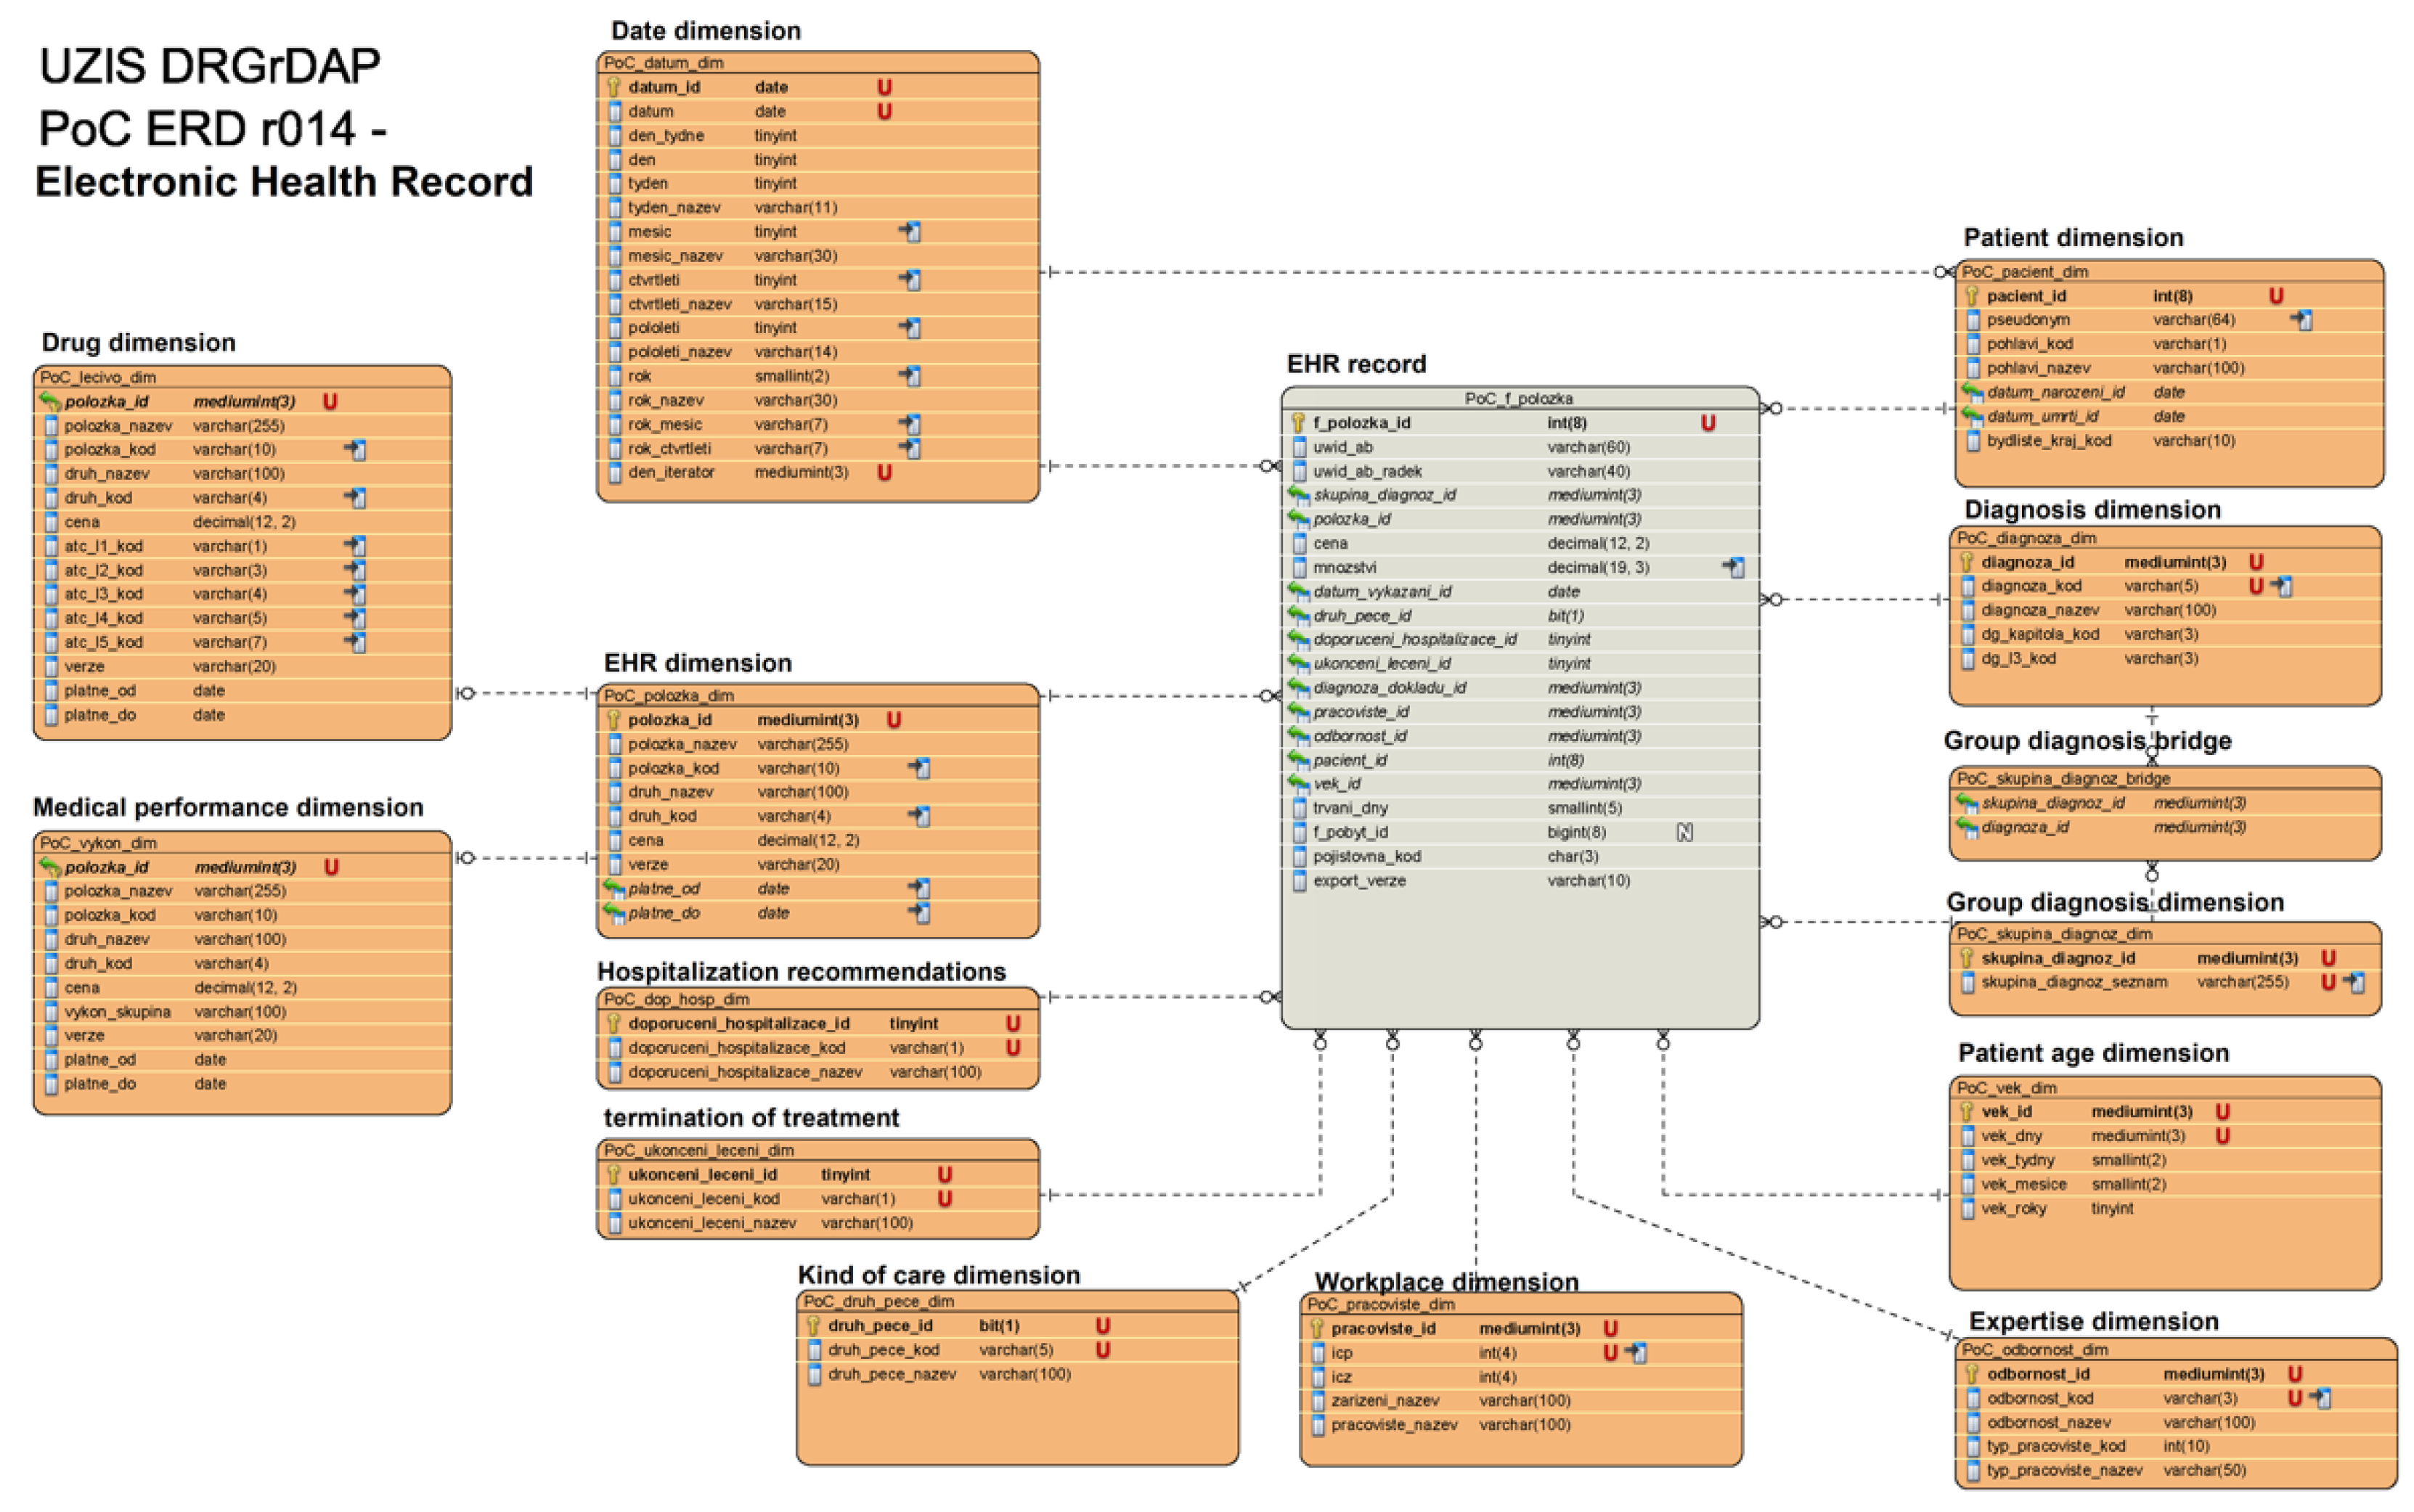
- Data warehouse contains ‘Hospital stay’ table with 10 linked tables (Figure A1) as: ‘Patient dimension’, ‘Patient’s diagnosis’, ‘Recommended hospitalization’, ‘Termination of treatment’, ‘Age dimension’, ‘Workplace’, ‘Performance group’, ‘Group exercising bridge’, ‘EHR dimension’, and ‘Date dimension’.
- Multiple compressed warehouse image archives are also included in a CSV semi-column delimited format.
- File sizes for import into the NoSQL database ranged from 100 GB up to 10 TB.
The Insurance company dataset contains records of three insurance companies:
- Three standard quarterly datasets, which have been processed on quarter time base per each insurance company, as well as one corrective (simulates a situation where one insurance company supplied bad data).
- Standard input data size is less than 1 TB per packet of data.
- Each data package is in a ZIP format with metadata included in the package name as insurance company and package serial number.
Each compressed package contains the following files:
- The Anatomical Therapeutic Chemical Classification System (ATC).
- Code lists and performance group, which are separated in the files to assign attributes of dynamically loaded dimensions.
Figure A1.
ER model of data warehouse related to hospitalisation duration (part I). The provided figure is intended for online viewing in high resolution.
Figure A1.
ER model of data warehouse related to hospitalisation duration (part I). The provided figure is intended for online viewing in high resolution.

Figure A2.
ER model of data warehouse for patient’s health record (part II). The provided figure is intended for online viewing in high resolution.
Figure A2.
ER model of data warehouse for patient’s health record (part II). The provided figure is intended for online viewing in high resolution.

References
- Transaction Processing Performance Council. TPC BenchmarkTM Standard Specification Revision 2.18.0.; Transaction Processing Performance Council (TPC): San Francisco, CA, USA, 2018. [Google Scholar]
- BigMedilytics. Big Data Project. Available online: https://www.bigmedilytics.eu/big-data-project/ (accessed on 29 December 2019).
- European Commission. Big Data: Digital Single Market Policy. Available online: https://ec.europa.eu/digital-single-market/en/policies/big-data (accessed on 28 December 2019).
- Srivastava, S. Top 10 Countries & Regions Leading the Big Data Adoption in 2019. Available online: https://www.analyticsinsight.net/top-10-countries-regions-leading-the-big-data-adoption-in-2019/ (accessed on 31 January 2020).
- The Big Data Value Association (BDVA). Data Protection Policy. Available online: http://www.bdva.eu/?q=data-protection-policy (accessed on 28 December 2019).
- Carnicero, R.; Rojas, D.; Elicegui, I.; Carnicero, J. Proposal of a learning health system to transform the national health system of Spain. Processes 2019, 7, 613. [Google Scholar] [CrossRef] [Green Version]
- Bhuiyan, M.A.R.; Ullah, M.R.; Das, A.K. iHealthcare: Predictive model analysis concerning big data applications for interactive healthcare systems. Appl. Sci. 2019, 9, 3365. [Google Scholar] [CrossRef] [Green Version]
- Saiful, I.M.; Mahmudul, H.M.; Xiaoyi, W.; Germack, D.H. A systematic review on healthcare analytics: Application and theoretical perspective of data mining. Healthcare 2018, 6, 54. [Google Scholar]
- Lyko, K.; Nitzschke, M.; Ngomo, A.-C.N. Big data acquisition. In New Horizons for a Data-Driven Economy; Cavanillas, J.M., Curry, E., Wahlster, W., Eds.; Springer: Cham, Switzerland, 2016; pp. 39–61. [Google Scholar] [CrossRef] [Green Version]
- Sarnovsky, M.; Bednar, P.; Smatana, M. Big data processing and analytics platform architecture for process industry factories. Big Data Cogn. Comput. 2018, 2, 3. [Google Scholar] [CrossRef] [Green Version]
- Husamaldin, L.; Saeed, N. Big data analytics correlation taxonomy. Information 2019, 11, 17. [Google Scholar] [CrossRef] [Green Version]
- Ajah, I.A.; Nweke, H.F. Big data and business analytics: Trends, platforms, success factors and applications. Big Data Cogn. Comput. 2019, 3, 32. [Google Scholar] [CrossRef] [Green Version]
- Hu, F.; Liu, W.; Tsai, S.-B.; Gao, J.; Bin, N.; Chen, Q. An empirical study on visualizing the intellectual structure and hotspots of big data research from a sustainable perspective. Sustainability 2018, 10, 667. [Google Scholar] [CrossRef] [Green Version]
- Ergüzen, A.; Ünver, M. Developing a file system structure to solve healthy big data storage and archiving problems using a distributed file system. Appl. Sci. 2018, 8, 913. [Google Scholar] [CrossRef] [Green Version]
- Lima, D.M.; Rodrigues-Jr, J.F.; Traina, J.A.M.; Pires, F.A.; Gutierrez, M.A. Transforming two decades of ePR data to OMOP CDM for clinical research. Stud. Health Technol. Inform. 2019, 264, 233–237. [Google Scholar]
- ur Rehman, M.H.; Jayaraman, P.P.; Malik, S.U.R.; Khan, A.U.R.; Gaber, M.M. RedEdge: A novel architecture for big data processing in mobile edge computing environments. Sens. Actuator Netw. 2017, 6, 17. [Google Scholar] [CrossRef] [Green Version]
- Sumbaly, R.; Kreps, J.; Shah, S. The big data ecosystem at LinkedIn. In Proceedings of the 2013 ACM SIGMOD International Conference on Management of Data, New York, NY, USA, 22–27 June 2013; pp. 1125–1134. [Google Scholar]
- Cohen, P.; Hahn, R.; Hall, J.; Levitt, S.; Metcalfe, R. Using Big Data to Estimate Consumer Surplus: The Case of Uber; 22627; National Bureau of Economic Research: Cambridge, MA, USA, 2016. [Google Scholar]
- Amatriain, X. Big & personal: Data and models behind Netflix recommendations. In Proceedings of the 2nd International Workshop on Big Data, Streams and Heterogeneous Source Mining: Algorithms, Systems, Programming Models and Applications, Chicago, IL, USA, 11 August 2013; pp. 1–6. [Google Scholar]
- Davoudi, S.; Dooling, J.A.; Glondys, B.; Jones, T.D.; Kadlec, L.; Overgaard, S.M.; Ruben, K.; Wendicke, A. Data quality management model (2015 update)—Retired. J. AHIMA 2015, 86, 62–65. [Google Scholar]
- Pavlo, A.; Paulson, E.; Rasin, A.; Abadi, D.J.; DeWitt, D.J.; Madden, S.; Stonebraker, M. A comparison of approaches to large-scale data analysis. In Proceedings of the 2009 ACM SIGMOD International Conference on Management of Data, Providence, RI, USA, 29 June–2 July 2009; pp. 165–178. [Google Scholar]
- Beam, A.L.; Kohane, I.S. Big data and machine learning in health care. JAMA 2018, 319, 1317–1318. [Google Scholar] [CrossRef]
- Juddoo, S.; George, C.; Duquenoy, P.; Windridge, D. Data governance in the health industry: Investigating data quality dimensions within a big data context. Appl. Syst. Innov. 2018, 1, 43. [Google Scholar] [CrossRef] [Green Version]
- Kruse, C.S.; Goswamy, R.; Raval, Y.; Marawi, S. Challenges and opportunities of big data in health care: A systematic review. Med. Inform. 2016, 4, e38. [Google Scholar] [CrossRef]
- Bouzillé, G.; Morival, C.; Westerlynck, R.; Lemordant, P.; Chazard, E.; Lecorre, P.; Busnel, Y.; Cuggia, M. An automated detection system of drug-drug interactions from electronic patient records using big data analytics. In MEDINFO 2019: Health and Wellbeing e-Networks for All; Ohno-Machado, L., Séroussi, B., Eds.; IOS Press Ebooks: Amsteerdam, Netherland, 2019; Volume 264, pp. 45–49. [Google Scholar]
- Narayanan, A.; Greco, M. Patient experience of australian general practices. Big Data 2016, 4, 31–46. [Google Scholar] [CrossRef]
- Narayanan, A.; Greco, M.; Powell, H.; Coleman, L. The reliability of big “Patient Satisfaction” data. Big Data 2013, 1, 141–151. [Google Scholar] [CrossRef]
- Ohsawa, Y. Modeling the process of chance discovery. In Chance Discovery; Ohsawa, Y., McBurney, P., Eds.; Springer: Heidelberg, Germany, 2003; pp. 2–15. [Google Scholar] [CrossRef]
- Bačić, B. Predicting golf ball trajectories from swing plane: An artificial neural networks approach. Expert Syst. Appl. 2016, 65, 423–438. [Google Scholar] [CrossRef]
- Bačić, B. Towards the next generation of exergames: Flexible and personalised assessment-based identification of tennis swings. In Proceedings of the IEEE World Congress on Computational Intelligence (IEEE WCCI) & International Joint Conference on Neural Networks (IJCNN), Rio de Janeiro, Brazil, 8–13 July 2018; pp. 1–8. [Google Scholar]
- Chan, K.Y.; Bačić, B. Pseudo-3D binary silhouette for augmented golf coaching. In Proceedings of the XXXVI International Symposium on Biomechanics in Sports—ISBS 2018, Auckland, New Zealand, 10–14 September 2018; pp. 790–793. [Google Scholar]
- Bačić, B.; Meng, Q.; Chan, K.Y. Privacy preservation for eSports: A case study towards augmented video golf coaching system. In Proceedings of the 10th International Conference on Developments in e-Systems Engineering (DeSE), Paris, France, 14–16 June 2017; pp. 169–174. [Google Scholar]
- Bačić, B.; Iwamoto, S.; Parry, D. Open source software and interdisciplinary data management: Post-surgery rehabilitation case study. In Proceedings of the Health Informatics New Zealand (HINZ), Auckland, New Zealand, 10–12 November 2014; p. 48. [Google Scholar]
- Bačić, B.; Hume, P.A. Computational intelligence for qualitative coaching diagnostics: Automated assessment of tennis swings to improve performance and safety. Big Data 2018, 6, 291–304. [Google Scholar] [CrossRef] [Green Version]
- Piot, P. What Ebola Teaches us about Controlling Coronavirus. Available online: https://time.com/5778998/ebola-coronavirus-lessons/ (accessed on 15 February 2020).
- Yong, E. The New Coronavirus is a Truly Modern Epidemic: New Diseases Are Mirrors that Reflect How a Society Works—And Where It Fails. Available online: https://www.theatlantic.com/science/archive/2020/02/coronavirus-very-2020-epidemic/605941/ (accessed on 16 February 2020).
- Klein, J.; Gorton, I.; Ernst, N.; Donohoe, P.; Pham, K.; Matser, C. Performance evaluation of NoSQL databases: A case study. In Proceedings of the 1st Workshop on Performance Analysis of Big Data Systems, Austin, TX, USA, 1 February 2015; pp. 5–10. [Google Scholar]
- Moniruzzaman, A.; Hossain, S.A. NoSQL database: New era of databases for big data analytics-classification, characteristics and comparison. Int. J. Database Theor. Appl. 2013, 6. [Google Scholar]
- Senthilkumar, S.A.; Bharatendara, K.R.; Amruta, A.M.; Angappa, G.; Chandrakumarmangalam, S. Big data in healthcare management: A review of literature. Am. J. Theor. Appl. Bus. 2018, 4, 57–69. [Google Scholar]
- Manyika, J.; Chui, M.; Brown, B.; Bughin, J.; Dobbs, R.; Roxburgh, C.; Byers, A.H. Big Data: The Next Frontier for Innovation, Competition, and Productivity; McKinsey Global Institute: New York, NY, USA, 2011; p. 156. [Google Scholar]
- Shafqat, S.; Kishwer, S.; Rasool, R.U.; Qadir, J.; Amjad, T.; Ahmad, H.F. Big data analytics enhanced healthcare systems: A review. J. Supercomput. 2018, 1–46. [Google Scholar] [CrossRef]
- Lo, E.; Cheng, N.; Lin, W.W.; Hon, W.-K.; Choi, B. MyBenchmark: Generating databases for query workloads. VLDB J. Int. J. Large Data Bases 2014, 23, 895–913. [Google Scholar] [CrossRef]
- Olson, D.R.; Konty, K.J.; Paladini, M.; Viboud, C.; Simonsen, L. Reassessing Google flu trends data for detection of seasonal and pandemic influenza: A comparative epidemiological study at three geographic scales. PLoS Comput. Biol. 2013, 9, e1003256. [Google Scholar] [CrossRef]
- Raghupathi, W.; Raghupathi, V. Big data analytics in healthcare: Promise and potential. Health Inf. Sci. Syst. 2014, 2, 3. [Google Scholar] [CrossRef]
- Ginsberg, J.; Mohebbi, M.H.; Patel, R.S.; Brammer, L.; Smolinski, M.S.; Brilliant, L. Detecting influenza epidemics using search engine query data. Nature 2009, 457, 1012. [Google Scholar] [CrossRef]
- Jacobson, S.H. Responding to the Coronavirus Threat Using Lessons Learned from Ebola: Assessing Risks and Transmission of Coronavirus. Available online: https://www.washingtontimes.com/news/2020/jan/30/responding-to-the-coronavirus-threat-using-lessons/ (accessed on 15 February 2020).
- Honigsbaum, M. How Our Modern World Creates Outbreaks Like Coronavirus. Available online: https://time.com/5779578/modern-world-epidemics-coronavirus/ (accessed on 16 February 2020).
- Kankanhalli, A.; Hahn, J.; Tan, S.; Gao, G. Big data and analytics in healthcare: Introduction to the special section. Inf. Syst. Front. 2016, 18, 233–235. [Google Scholar] [CrossRef] [Green Version]
- Codd, E.F. A relational model of data for large shared data banks. Commun. ACM 1970, 13, 377–387. [Google Scholar] [CrossRef]
- Jatana, N.; Puri, S.; Ahuja, M.; Kathuria, I.; Gosain, D. A survey and comparison of relational and non-relational database. IJERT 2012, 1, 1–5. [Google Scholar]
- Mehmet, Z.E.; Lane, M. Evaluation of NoSQL databases for EHR systems. In Proceedings of the 25th Australasian Conference on Information Systems, Auckland, New Zealand, 8–10 December 2014. [Google Scholar]
- Stonebraker, M.; Abadi, D.J.; Batkin, A.; Chen, X.; Cherniack, M.; Ferreira, M.; Lau, E.; Lin, A.; Madden, S.; O’Neil, E. C-store: A column-oriented DBMS. In Proceedings of the 31st International Conference on Very Large Data Bases, Trondheim, Norway, 30 Novemeber–2 Septermber 2005; pp. 553–564. [Google Scholar]
- Chen, H.; Chiang, R.H.; Storey, V.C. Business intelligence and analytics: From big data to big impact. J. MIS Q. 2012, 36, 1165–1188. [Google Scholar] [CrossRef]
- Badawi, O.; Brennan, T.; Celi, L.A.; Feng, M.; Ghassemi, M.; Ippolito, A.; Johnson, A.; Mark, R.G.; Mayaud, L.; Moody, G. Making big data useful for health care: A summary of the inaugural MIT critical data conference. JMIR Med. Inform. 2014, 2, e22. [Google Scholar] [CrossRef]
- Murdoch, T.B.; Detsky, A.S.-J. The inevitable application of big data to health care. JAMA 2013, 309, 1351–1352. [Google Scholar] [CrossRef]
- Niyizamwiyitira, C.; Lundberg, L. Performance evaluation of SQL and NoSQL database management systems in a cluster. IJDMS 2017, 9, 1–24. [Google Scholar] [CrossRef]
- Hong, L.; Luo, M.; Wang, R.; Lu, P.; Lu, W.; Lu, L. Big data in health care: Applications and challenges. DIM 2018, 2, 175–197. [Google Scholar] [CrossRef] [Green Version]
- Parker, Z.; Poe, S.; Vrbsky, S.V. Comparing NoSQL MongoDB to an SQL DB. In Communications of the ACM; ACM: New York, NY, USA, 2013; p. 5. [Google Scholar]
- Labhansh, A.; Parth, N.; Sandeep, T.; Vasundhra, G. Business intelligence tools for big data. JBAR 2016, 3, 505–509. [Google Scholar]
- Bear, C.; Lamb, A.; Tran, N. The Vertica database: SQL RDBMS for managing big data. In Proceedings of the 2012 Workshop on Management of Big Data Systems; ACM: New York, NY, USA, 2012; pp. 37–38. [Google Scholar]
- McLernon, D.J.; Bond, C.M.; Hannaford, P.C.; Watson, M.C.; Lee, A.J.; Hazell, L.; Avery, A.; Collaboration, Y.C. Adverse drug reaction reporting in the UK. Drug Saf. 2010, 33, 775–788. [Google Scholar] [CrossRef]
- Lamb, A.; Fuller, M.; Varadarajan, R.; Tran, N.; Vandiver, B.; Doshi, L.; Bear, C. The Vertica analytic database: C-store 7 years later. Proc. VLDB Endow. 2012, 5, 1790–1801. [Google Scholar] [CrossRef]
- Chang, B.R.; Tsai, H.-F.; Lee, Y.-D. Integrated high-performance platform for fast query response in big data with Hive, Impala, and SparkSQL: A performance evaluation. Appl. Sci. 2018, 8, 1514. [Google Scholar] [CrossRef] [Green Version]
- Amato, F.; Marrone, S.; Moscato, V.; Piantadosi, G.; Picariello, A.; Sansone, C. HOLMeS: EHealth in the big data and deep learning era. Information 2019, 10, 34. [Google Scholar] [CrossRef] [Green Version]
- Liu, X.; Nielsen, P.S. A hybrid ICT-solution for smart meter data analytics. Energy 2016, 115, 1710–1722. [Google Scholar] [CrossRef] [Green Version]
- Stonebraker, M. SQL databases v. NoSQL databases. Commun. ACM 2010, 53, 10–11. [Google Scholar] [CrossRef]
- Tauro, C.J.; Aravindh, S.; Shreeharsha, A. Comparative study of the new generation, agile, scalable, high performance NoSQL databases. Int. J. Comput. Appl. 2012, 48, 1–4. [Google Scholar]
- Hellerstein, J.M.; Stonebraker, M.; Hamilton, J. Architecture of a database system. Foundat. Trends Databases 2007, 1, 141–259. [Google Scholar] [CrossRef]
- Basu, A.; Toy, T. Real-Time Healthcare Analytics on Apache Hadoop* Using Spark* and Shark*; Intel® Distribution for Apache Hadoop* Software: New York, NY, USA, 2014. [Google Scholar]
- Harerimana, G.; Jang, B.; Kim, J.W.; Park, H.K. Health big data analytics: A technology survey. IEEE Access 2018, 6, 65661–65678. [Google Scholar] [CrossRef]
- Aboudi, N.E.; Benhlima, L. Big data management for healthcare systems: Architecture, requirements, and implementation. Adv. Bioinform. 2018. [Google Scholar] [CrossRef] [PubMed]
- Palanisamy, V.; Thirunavukarasu, R. Implications of big data analytics in developing healthcare frameworks–A review. J. King Saud. Univ. Sci. 2019, 31, 415–425. [Google Scholar] [CrossRef]
- Shoro, A.G.; Soomro, T.R. Big data analysis: Apache Spark perspective. Glob. J. Comput. Sci. Technol. 2015, 15. [Google Scholar]
Figure 1.
Testing activity diagram for the data warehouse eSystem configuration.

Figure 2.
Business process organisation and tests data flow.

Figure 3.
Resulting Big Data Analytics (BDA) platform: Architecture and infrastructure diagram showing the key components.
Figure 3.
Resulting Big Data Analytics (BDA) platform: Architecture and infrastructure diagram showing the key components.

Figure 4.
Example of predictive model for time series forecasting based on supplied test data from IHIS. The example demonstrates part of a data processing and visualisation layer (Figure 2) shown as a screenshot produced in Tableau Desktop (version 10.5).
Figure 4.
Example of predictive model for time series forecasting based on supplied test data from IHIS. The example demonstrates part of a data processing and visualisation layer (Figure 2) shown as a screenshot produced in Tableau Desktop (version 10.5).

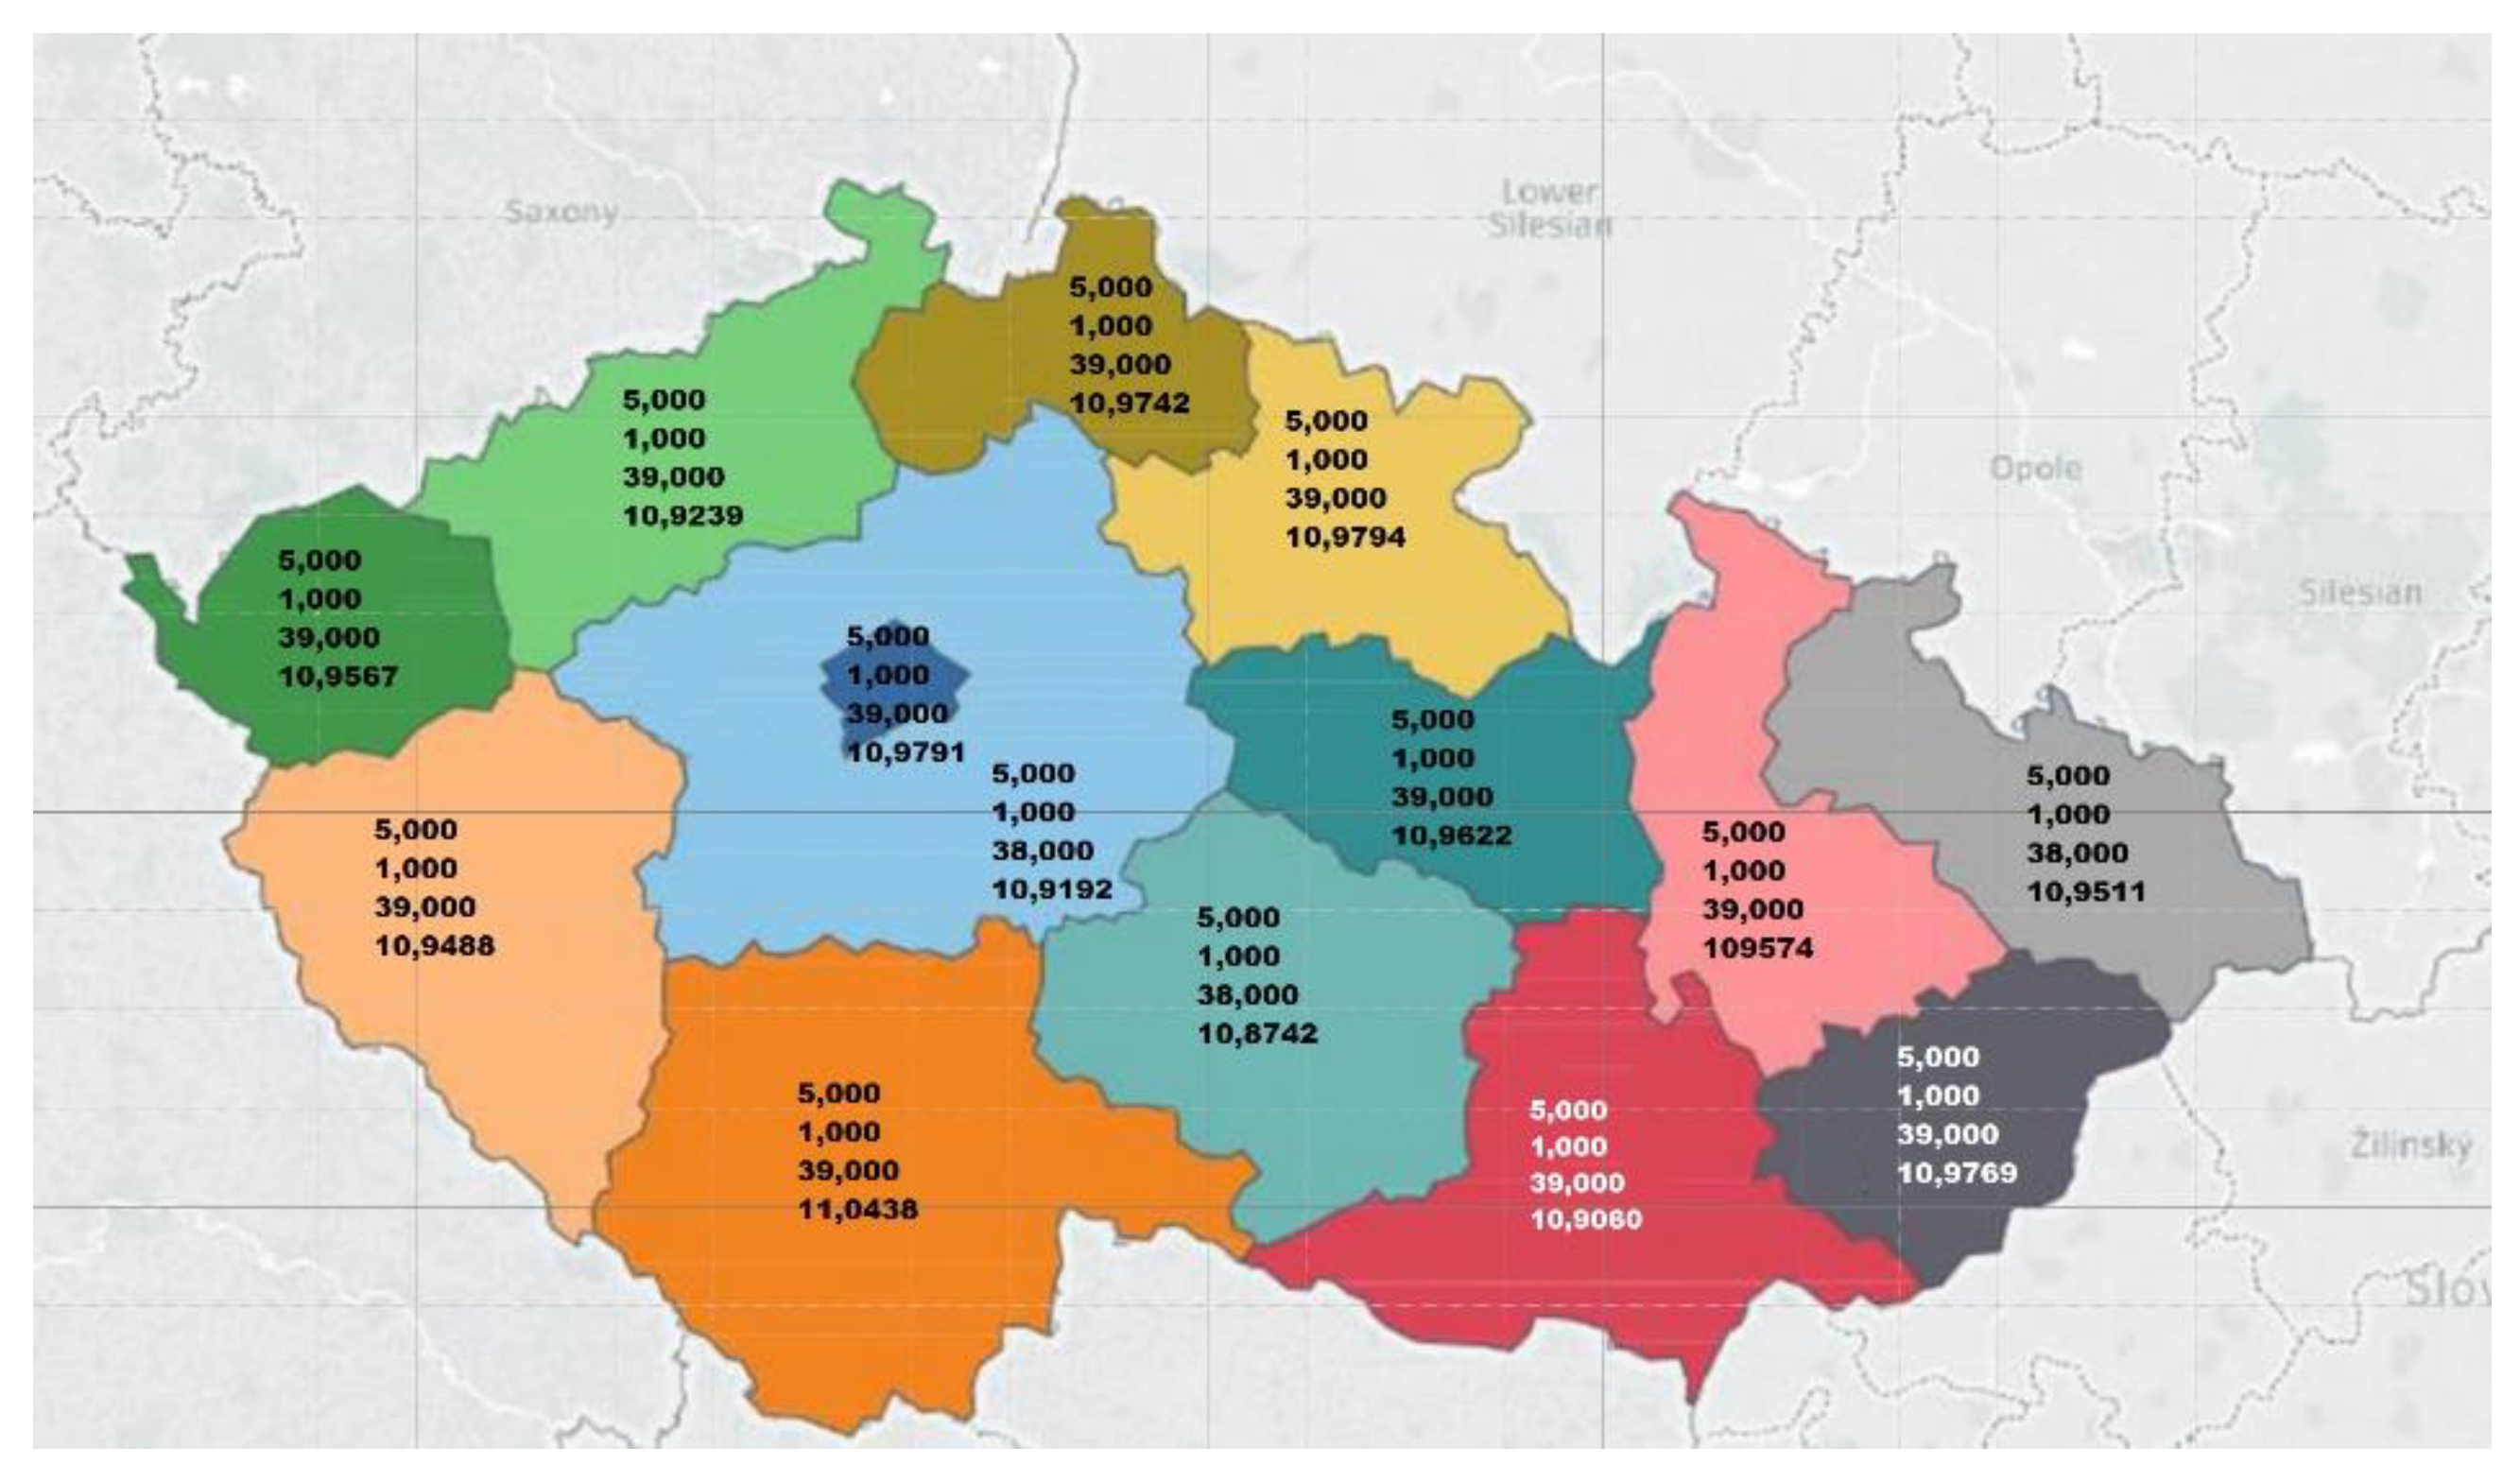
Figure 5.
Example of under-10 s real-life diagnosis as regional data visualisation in the Czech Republic using Tableau Desktop (version 10.5). In addition to data integration, geo-mapping functionality provides near real-time pandemic/epidemic mapping, tracking, outbreak spread, and risk data visualisation.

Figure 6.
The components of TPC-H consisting of eight tables (adapted from p. 13). [1].
Figure 6.
The components of TPC-H consisting of eight tables (adapted from p. 13). [1].

Figure 7.
TPC-H query duration on 1 TB test database (from Q1 to Q22).

Figure 8.
TPC-H query duration on 3 TB test database (queries Q1 to Q22).

Figure 9.
Performance improvement visualisation for TPC-H query execution time. Comparisons of first and second runs on three and five nodes in the Vertica cluster for 1 TB and 3 TB test database sizes.
Figure 9.
Performance improvement visualisation for TPC-H query execution time. Comparisons of first and second runs on three and five nodes in the Vertica cluster for 1 TB and 3 TB test database sizes.

Figure 10.
The total sum of the 22 TPC-H test query execution times on three to five nodes in the Vertica cluster for the 1 TB test database. Performance improvements are noticeable after the second run due to database restart only and after horizontal scaling with additional nodes.
Figure 10.
The total sum of the 22 TPC-H test query execution times on three to five nodes in the Vertica cluster for the 1 TB test database. Performance improvements are noticeable after the second run due to database restart only and after horizontal scaling with additional nodes.

Figure 11.
Performance improvement comparing three to five nodes in the Vertica cluster for 1 TB database size.
Figure 11.
Performance improvement comparing three to five nodes in the Vertica cluster for 1 TB database size.


Table 1.
TPC-H parameters for database (sizes 1 TB and 3 TB) and limiting values for power tests in the first and second runs, provided by IHIS.
Table 1.
TPC-H parameters for database (sizes 1 TB and 3 TB) and limiting values for power tests in the first and second runs, provided by IHIS.
| Parameter | Limit [Hours] | Achieved Results [Hours] |
|---|---|---|
| Initial import TPC-H 1 TB | 24 | 2.94 * |
| Initial import TPC-H 3 TB | 96 | 5.99 * |
| Power test TPC-H 1 TB—1st run | 1.5 | 1.4 ** |
| Power test TPC-H 1 TB—2nd run | 1.5 | 1.36 ** |
| Power test TPC-H 3 TB—1st run | 5 | 4.2 ** |
| Power test TPC-H 3 TB—2nd run | 5 | 4.17 ** |
Table 2.
Measured results compliant with TPC-H benchmarks for initial import of 1 TB and 3 TB test databases.
Table 2.
Measured results compliant with TPC-H benchmarks for initial import of 1 TB and 3 TB test databases.
| Data Size | 1 TB Data | 3 TB Data | ||||
|---|---|---|---|---|---|---|
| Table Name | No. of Rows | Duration in [s] | Duration in Hours | No. of Rows | Duration in [s] | Duration in Hours |
| Customer | 150,000,000 | 1185.00 | 0.33 | 450,000,000 | 4,100.00 | 1.14 |
| Nation | 25 | 0.10 | 0.00 | 25 | 0.20 | 0.00 |
| Orders | 1,500,000,000 | 2533.00 | 0.70 | 4,500,000,000 | 5423.00 | 1.51 |
| Part | 200,000,000 | 272.00 | 0.08 | 600,000,000 | 865.00 | 0.24 |
| Part supp. | 800,000,000 | 1342.00 | 0.37 | 2,400,000,000 | 4240.00 | 1.18 |
| Region | 5 | 0.07 | 0.00 | 5 | 0.07 | 0.00 |
| Supplier | 10,000,000 | 105.00 | 0.03 | 30,000,000 | 266.00 | 0.07 |
| Line item | 5,999,989,709 | 10,594.00 | 2.94 | 18,000,048,306 | 21,548.00 | 5.99 |
| Total load duration | 2.94 * [h] (16,031.17 [s]) | 5.99 ** [h] (36,442.27 [s]) | ||||
*—Measured results for 1TB dataset generated by DBGEN and imported into NoSQL Vertica DB; **—Measured results for 3 TB dataset generated by DBGEN and imported into NoSQL Vertica DB.
Table 3.
TPC-H benchmark queries for 1 TB and 3 TB test database sizes.
| Data Size | 1 TB Data | 3 TB Data | ||||||
|---|---|---|---|---|---|---|---|---|
| Query No. | 3 Nodes | 3 Nodes | 5 Nodes | 5 Nodes | 3 Nodes | 3 Nodes | 5 Nodes | 5 Nodes |
| 1st Run | 2nd Run | 1st Run | 2nd Run | 1st Run | 2nd Run | 1st Run | 2nd Run | |
| Q1 | 267 | 51 | 232 | 161 | 427 | 383 | 441 | 457 |
| Q2 | 23 | 22 | 19 | 15 | 52 | 42 | 36 | 40 |
| Q3 | 64 | 65 | 55 | 40 | 128 | 109 | 121 | 125 |
| Q4 | 470 | 480 | 287 | 320 | 918 | 897 | 914 | 900 |
| Q5 | 177 | 114 | 71 | 70 | 484 | 462 | 465 | 454 |
| Q6 | 0.6 | 0.7 | 0.8 | 0.5 | 1.2 | 1 | 1.4 | 1 |
| Q7 | 119 | 129 | 65 | 65 | 144 | 129 | 140 | 140 |
| Q8 | 37 | 34 | 40 | 22 | 375 | 361 | 270 | 263 |
| Q9 | 2576 | 2551 | 1555 | 1397 | 16,015 | 15,173 | 3791 | 3824 |
| Q10 | 52 | 130 | 44 | 72 | 65 | 58 | 64 | 64 |
| Q11 | 6 | 7 | 5 | 3.8 | 13 | 10 | 10 | 11 |
| Q12 | 13 | 13 | 8 | 11 | 24 | 20 | 23 | 23 |
| Q13 | 221 | 237 | 180 | 136 | 296 | 251 | 325 | 301 |
| Q14 | 49 | 55 | 41 | 36 | 111 | 102 | 105 | 105 |
| Q15 | 7 | 7 | 4 | 4 | 9 | 7 | 9 | 10 |
| Q16 | 42 | 42 | 29 | 30 | 87 | 78 | 86 | 88 |
| Q17 | 11 | 12 | 8 | 6 | 23 | 19 | 23 | 22 |
| Q18 | 376 | 380 | 517 | 554 | 741 | 721 | 743 | 746 |
| Q19 | 58 | 58 | 41 | 41 | 112 | 104 | 111 | 110 |
| Q20 | 129 | 131 | 87 | 73 | 156 | 137 | 150 | 147 |
| Q21 | 2850 | 1763 | 1703 | 1787 | 7278 | 7021 | 7196 | 7085 |
| Q22 | 67 | 60 | 62 | 35 | 107 | 88 | 110 | 106 |
| ∑ of the query execution times in seconds | 7614.6 | 6341.7 | 5053.8 | 4879.3 | 27,566.2 | 26,173 | 15,134.4 | 15,022 |
| ∑ of the query execution times in hours | 2.12 | 1.76 | 1.4 | 1.36 | 7.66 | 7.3 | 4.2 | 4.17 |
Note (Q#—Query name): Q1—Pricing Summary Report, Q2—Minimum Cost Supplier, Q3—Shipping Priority, Q4—Order Priority Checking, Q5—Local Supplier Volume, Q6—Forecasting Revenue Change, Q7—Volume Shipping, Q8—National Market Share, Q9—Product Type Profit Measure, Q10—Returned Item Reporting, Q11—Important Stock Identification, Q12—Shipping Modes and Order Priority, Q13—Customer Distribution, Q14—Promotion Effect, Q15—Top Supplier, Q16—Parts/Supplier Relationship, Q17—Small-Quantity-Order Revenue, Q18—Large Volume Customer, Q19—Discounted Revenue, Q20—Potential Part Promotion, Q21—Suppliers Who Kept Orders Waiting, Q22—Global Sales Opportunity.
Table 4.
Summary of TPC-H queries on three and five nodes configurations in the first and second runs on 1 TB and 3 TB test databases.
Table 4.
Summary of TPC-H queries on three and five nodes configurations in the first and second runs on 1 TB and 3 TB test databases.
| 3 Nodes | 3 Nodes | 5 Nodes | 5 Nodes | |
|---|---|---|---|---|
| 1st Run | 2nd Run | 1st Run | 2nd Run | |
| Results in [s] for 1 TB [s] | 7614.6 | 6341.7 | 5053.8 | 4879.3 |
| Results in [s] for 3 TB [s] | 33,099.26 | 27,566.2 | 15,134.4 | 15,022.0 |
© 2020 by the authors. Licensee MDPI, Basel, Switzerland. This article is an open access article distributed under the terms and conditions of the Creative Commons Attribution (CC BY) license (http://creativecommons.org/licenses/by/4.0/).
Share and Cite
MDPI and ACS Style
Štufi, M.; Bačić, B.; Stoimenov, L. Big Data Analytics and Processing Platform in Czech Republic Healthcare. Appl. Sci. 2020, 10, 1705. https://0-doi-org.brum.beds.ac.uk/10.3390/app10051705
AMA Style
Štufi M, Bačić B, Stoimenov L. Big Data Analytics and Processing Platform in Czech Republic Healthcare. Applied Sciences. 2020; 10(5):1705. https://0-doi-org.brum.beds.ac.uk/10.3390/app10051705
Chicago/Turabian StyleŠtufi, Martin, Boris Bačić, and Leonid Stoimenov. 2020. "Big Data Analytics and Processing Platform in Czech Republic Healthcare" Applied Sciences 10, no. 5: 1705. https://0-doi-org.brum.beds.ac.uk/10.3390/app10051705
Note that from the first issue of 2016, this journal uses article numbers instead of page numbers. See further details here.