Review

Detecting Lithium (Li) Mineralizations from Space: Current Research and Future Perspectives

by
Joana Cardoso-Fernandes
1,2,*,
Ana C. Teodoro
1,2,
Alexandre Lima
1,2,
Mônica Perrotta
3 and
Encarnación Roda-Robles
4
1
Department of Geosciences, Environment and Land Planning, Faculty of Sciences, University of Porto, Rua Campo Alegre, 4169-007 Porto, Portugal
2
Institute of Earth Sciences (ICT), Pole of University of Porto, 4169-007 Porto, Portugal
3
Geology and Mineral Resources Board of Directors, Geological Survey of Brazil (CPRM), Rua Costa, 01304-010 São Paulo, Brazil
4
Departament of Mineralogía y Petrología, University of País Vasco (UPV/EHU), Barrio Sarriena, 48940 Leioa, Bilbao, Spain
*
Author to whom correspondence should be addressed.
Submission received: 4 February 2020 / Revised: 28 February 2020 / Accepted: 2 March 2020 / Published: 5 March 2020
(This article belongs to the Section Earth Sciences)

Abstract

:
Optical and thermal remote sensing data have been an important tool in geological exploration for certain deposit types. However, the present economic and technological advances demand the adaptation of the remote sensing data and image processing techniques to the exploration of other raw materials like lithium (Li). A bibliometric analysis, using a systematic review approach, was made to understand the recent interest in the application of remote sensing methods in Li exploration. A review of the application studies and developments in this field was also made. Throughout the paper, the addressed topics include: (i) achievements made in Li exploration using remote sensing methods; (ii) the main weaknesses of the approaches; (iii) how to overcome these difficulties; and (iv) the expected research perspectives. We expect that the number of studies concerning this topic will increase in the near future and that remote sensing will become an integrated and fundamental tool in Li exploration.

1. Introduction

Optical and thermal remote sensing data, namely satellite-acquired images, have been an important tool in geological exploration allowing to target exploration areas for more than four decades. The major contribution that remote sensing offers to mineral exploration was reviewed in several works dedicated to this topic [1,2,3,4,5]: it provides information in a fairly quick, inexpensive, and non-intrusive way, which favors mining and exploration companies especially in inaccessible remote areas. However, Rajesh [3], in an overview of the use of remote sensing and Geographic Information Systems (GIS) in mineral exploration, points out the difficulty of directly pinpointing mineralizations using only remote sensing data, highlighting the importance of the integration with other types of geological data.
Sabins [6], in one of the first reviews about the types of data and image processing methods for mineral exploration, describes two main approaches to target mineral deposits: (i) structural and lithological mapping; and (ii) hydrothermal alteration mapping. Later, Rajesh [3] proposed three approaches: (i) lithological mapping; (ii) structural mapping; and (iii) alteration mapping. These approaches have been applied since the 1970s to identify very distinct types of mineral deposits. The more common applications include porphyry copper [7,8,9,10,11,12,13,14,15,16,17] and gold [18,19,20,21,22,23,24,25,26,27,28] deposits. Other applications may include: iron ore deposits [19,29,30,31,32], volcanogenic massive sulfide ore (VMS) deposits [33,34,35], several skarn-hosted deposits [36,37,38,39], chromite deposits [40,41,42,43], uranium deposits [39,44], rare earth elements (REE) exploration [36,45], brine and evaporite deposits [46,47], porphyry molybdenum deposits [48,49], zinc-lead (Zn-Pb) deposits [50], diamond [51] and bauxite exploration [52].
Regarding the types of data used, multispectral products, namely Landsat and Advanced Spaceborne Thermal Emission and Reflection Radiometer (ASTER) sensor imagery, played an important part in geological remote sensing [4,5,53]. Abrams and Yamaguchi [54] reviewed ASTER’s contributions to mineral exploration and lithological mapping. The success of the ASTER sensor in geological exploration was mainly due to a higher spectral resolution in the short-wave infrared (SWIR) and thermal infrared (TIR), specially designed for geological applications, which improved its lithological and mineral mapping capabilities, particularly in the identification of alteration minerals [4,53,54,55]. The importance of TIR (including ASTER’s TIR subsystem) in the discrimination of minerals and rocks was revised by Ninomiya and Fu [55]. These authors highlight several studies in which the TIR region was fundamental for mineral discrimination, namely where silicate minerals occur, and reviewed the spectral indices proposed for lithological mapping using ASTER-TIR data. Nonetheless, the advent of hyperspectral remote sensing allowed the direct identification and quantification of specific minerals which represented a key contribution to mineral exploration [3,53]. Cudahy [4] in a review on mineral mapping projects for exploration led by Commonwealth Scientific and Industrial Research Organization (CSIRO) in Australia, pointed out that hyperspectral remote sensing can be less popular among exploration companies because of limited spatial coverage, the relatively high-cost of quality datasets, and the inherent complexity of hyperspectral data.
Despite the successful application of different types of remote sensing data to distinct mineral deposits, the current growing economic and technological advances, which rely on other mineral commodities, highlights the need to use and adapt remote sensing data and image processing techniques on new deposit types. Nowadays, green technologies, like electric vehicles, represent an important sector of the economy [56] and lithium (Li) has become a critical metal to the green-power industry [57,58]. However, Li exploration with the resource of remote sensing data and techniques represents an emergent field, with several difficulties and unknown possibilities. Taking this into account, this review aims at (i) providing information about what can be accomplished in Li exploration using remote sensing methods; (ii) identifying the main difficulties associated with this kind of deposits; and (iii) providing insights on how to overcome these difficulties as well as future research perspectives. This paper presents the first summary of the developments made in the field of remote sensing applied to Li exploration and we consider it to be timely and appropriate due to the high global demand of this metal to the production of Li-ion batteries [58]. Additionally, this review can help to promote new applications and to solve new exploration problems.

2. Li Exploration Using Remote Sensing

This section aims at summarizing past and current applications of remote sensing data and image processing techniques to Li exploration at first, and then highlights the main weaknesses associated with each methodology already proposed.

2.1. Advancements in Satellite-Based Remote Sensing

Despite the latest interest in this topic, the first application of remote sensing to Li mineralizations started in 1982. Lefevre [59] conducted a multitemporal study (from 1975 to 1976) using Landsat Multispectral Scanner System (MSS) images to detect geobotanical anomalies caused by dispersal halos of metals, such as lithium, tungsten, and arsenic, associated with the Collete granite and the Beauvoir domes. To extract the spectral signature of the circular anomaly, band ratios 7/5 and 7/6 (band 5: 0.6 to 0.7µm; band 6: 0.7 to 0.8 µm; band 7: 0.8 to 1.1 µm) were applied to the images. Comparing the spectral anomalies of the vegetation with the soil geochemical maps, the author concluded that there was a clear correspondence between spectral and geochemical anomalies. However, such spectral anomalies could be related to the presence of the other metals in the vegetation’s leaves and not necessarily due to the presence of Li.
Over a decade ago, Perrotta et al. [60] used ASTER images for a trial mapping of Li-bearing pegmatites in the Vale do Jequitinhonha region, Brazil. The authors used visible, near-infrared (VNIR), and SWIR data to evaluate the spectral signatures of gem- and Li pegmatites, and related alteration minerals. For that, the target spectra were determined through the estimation of the pixel purity index (PPI) either directly in the atmospherically-corrected images or after applying a minimum noise fraction (MNF) transformation of the data. PPI was estimated since the mean spectra of each sample group, where the pixel samples were identified in ASTER images, failed as reference spectra. The obtained reference spectra were used to classify the ASTER image using the spectral angle mapper (SAM) and the mixture-tuned matched filtering (MTMF), having the last supervised method outperform the first since SAM was also sensible to roads, agricultural fields, or areas around the main drainage lines.
Mendes et al. [61] applied a similar methodology in the identification of Li minerals’ spectral signatures in view of future identification of unknown ore deposits in the Vale do Jequitinhonha region, Brazil. To achieve that goal, reference spectra of Li-bearing minerals, as well as associated alteration minerals and soils, were collected in the laboratory. However, only the open-pit mines delimited in image data were used as training areas after the spectra obtained in the laboratory failed to serve as a reference for the classification process. Similar to before, an MNF transformation was applied to the ASTER VNIR and SWIR bands in order to segregate the noise. Statistical analysis was applied to the MNF to determine the reference pixels with the highest PPI, from which tree reference signatures were selected. Afterward, two supervised classification methods were employed, SAM and MTMF, only where the location of metasediment outcrops, while the other lithologies where masked. Although both methods were able to correctly identify the spectral features of pegmatite intrusions, the SAM classifier also mapped other features, like roads or agricultural fields, while MTMF only identified a small number of pixels to have similar spectral behavior to the reference spectra. The solution proposed by Mendes et al. [61] was to produce a final target potential map through the Boolean intersection of the results obtained from the application of MTMF and SAM techniques.
Another remote sensing approach to Li pegmatite exploration was made recently in the Fregeneda-Almendra (Salamanca, Spain–Vila Nova de Foz Côa, Portugal) pegmatite field. Cardoso-Fernandes et al. [62], in a preliminary stage, presented the potential of the Sentinel-2 Multispectral Instrument (MSI) in Li mapping. The study attempted to identify Li pegmatites mainly based on the recognition of the associated alteration halos. To achieve that goal, several methods applied to other deposit types were adapted to the Sentinel-2 images, including RGB (red, green, blue) combinations, band ratios and principal component analysis (PCA). These methodologies allowed to predict the occurrence of iron oxides and clay minerals, and to discriminate between non-altered and hydrothermally-altered zones. The authors also tried to directly identify Li pegmatites based on their spectral behavior. Using the reference spectra of spodumene (a Li-bearing mineral), the band ratio 3/8 was proposed to discriminate the presence of Li-bearing minerals. Another approach was to use a supervised image classification to map Li-bearing pegmatites. The classification was performed on the resultant bands from the application of PCA, using the land cover signature classification (LCS) and the maximum likelihood (ML) algorithms simultaneously. The reference spectral curves used to classify the image were the ones collected in training sites identified in the Sentinel-2 images. The training areas included open-pit mines exploiting Li minerals. Although the algorithm employed allowed to correctly identify the Li pegmatites in exploitation, it also generated some false positives and misclassified some metasedimentary areas. The authors [62] also highlighted the need and importance of the acquisition of mineral spectra to improve the classification output. Considering the results given in this work, Cardoso-Fernandes et al. [63] presented two new different approaches: (i) identification of hydrothermal alteration minerals associated with the Li-bearing pegmatites; and (ii) direct identification of Li minerals. These methods were applied in different types of multispectral cloud-free products, namely, Landsat-5 Thematic Mapper (TM), Landsat-8 Operational Land Imager (OLI) and Thermal Infrared Sensor (TIRS), ASTER, and Sentinel-2 MSI. The alteration mapping results differ from one image processing method to another [63]: while RGB combinations highlighted hydrothermally-altered areas near the Li-bearing pegmatites, the common band ratios applied were unsuccessful in the identification of iron oxides and clay minerals in the open-pit mines where they were described [64]. Additionally, Selective PCA, i.e., PCA applied in a subset of bands chosen based on characteristic absorption or reflectance features of the target minerals, only identified the occurrence of iron minerals in some of the open pits. The ASTER sensor was the one that showed better performance since hydroxyl-bearing minerals like clays were solely identified in the ASTER image [63], reflecting the higher mapping capabilities of ASTER due to its better spectral resolution. On the other hand, some spectral confusion with areas affected by wildfires and with agricultural fields hindered the results. In what concerns the approach to directly identify Li minerals, Cardoso-Fernandes et al. [63] proposed new algorithms capable of identifying the Li pegmatites with better exposition (i.e., outcropping area) (see Appendix A). In the case of RGB combinations (ASTER 5-1-14 and 2-1-13; Landsat-8 7-3-11 and 2-1-11; Landsat-5 7-2-6 and 2-1-6), it was possible to discriminate the Li-bearing pegmatites from the host rocks (metapelites) [63]. However, this discrimination could not be achieved using Sentinel-2 images due to the lack of TIR bands and the importance of this region of the electromagnetic spectrum in silicate minerals [55,65] like the Li-bearing silicates (spodumene and petalite) that occur in the Fregeneda-Almendra area. The proposed band ratios (ASTER 7/6 and 1/3, Landsat-8 3/5, Landsat-5 2/4, Sentinel-2 3/8) and selective PCA based on subsets of two and four bands were also able to highlight the Li pegmatites, isolating the related spectral inputs, although the authors recommend the use of the two-band subset for PCA since it reduces unnecessary noise [63]. Despite the success in Li pegmatite discrimination, all methods manifested spectral confusion with urbanized areas and agricultural fields. These spectral confusions are consistent with the ones reported by other authors in different regions of the world [60,61], pointing to the need to spectrally separate the classes.
In follow-up work, Santos et al. [66] applied the algorithms proposed by Cardoso-Fernandes et al. [63] to evaluate their performance in drawing potential exploration areas in other Li pegmatites occurrences, namely in the pegmatite fields of Araçuaí and São João Del Rei in Brazil. The methods (RGB combinations, band ratios, and selective PCA) and the algorithms employed (see Appendix A) showed variable performances in the two pegmatite fields. Additionally, Li pegmatite identification was more accurate in the São João Del Rei region than in Araçuaí, having the vegetation coverage in the second area negatively influenced the results according to the authors [66]. It is worth mentioning the ability of RGB combinations to discriminate Li pegmatites from both host rocks and associated tailings and mine dumps, with the exception of the Landsat-5 images [66]. Additionally, in the São João Del Rei area, the most successful band ratios were the ones proposed based on the reference spectrum of lepidolite (a Li-bearing mica): Landsat-5 3/7, Landsat-8 4/7 and Sentinel-2 4/7 [63]. Regarding the ratios proposed for spodumene, only ASTER 1/3 was able to highlight Li mineralized areas. In the Araçuaí area, the spodumene based ratios were the most accurate in Li pegmatite identification. In what concerns selective PCA, the two-band subset produced better results in the São João Del Rei pegmatite field while the four-band subset worked better in Araçuaí [66]. Overall, selective PCA presented the most accurate results while band rationing was the least efficient method in Li pegmatite identification [66]. On the other hand, no limitations were found in the use of Sentinel-2 images, unlike that reported in other works [63]. This may suggest that the ability to discriminate Li pegmatites using Sentinel-2 images might rely on the composition of the host rocks. Nevertheless, the results obtained were very significant, contributing to the state of the art of this field, since not only did it confirm the methodology proposed by Cardoso-Fernandes et al. [63] but also showed its ability to detect other pegmatite occurrences with Li potential besides the known target areas. Currently, field validation is in progress to check if Li mineralization is in fact present in the potential areas identified.
Moreover, in the Alto Ligonha province (Mozambique), Gemusse et al. [67] used ASTER and Landsat-8 images to map hydrothermal alteration minerals associated with Li-bearing pegmatites, since several pegmatites in the region present a thick kaolinitic weathering crust. The two satellite products were used to produce land cover classification maps with the SAM supervised algorithm. Although the ASTER image classification obtained a higher overall accuracy, both products allowed to identify the spectral signatures of hydrothermal clay alteration (kaolin occurrences) associated with pegmatites [67]. This identification was also supported by published spectral libraries. Additionally, field samples of Li minerals, such as lepidolite and spodumene, were collected and analyzed using an ASD HandHeld2 spectroradiometer [67]. However, the spectroradiometer only covers the VNIR region of the spectra, so it was not possible to discriminate the two Li minerals in these wavelengths. Nonetheless, the classification results, using the target signatures collected in the satellite products, were able to identify two potential areas for future pegmatite exploration [67]. The authors also concluded that ASTER and Landsat-8 provide complementary information on mineral composition. Still in the Alto Ligonha region, different satellite products (namely ASTER, Landsat-8, and Sentinel-2) and different remote sensing algorithms were compared to target Li pegmatites [68]. The algorithms include three supervised classification methods—minimum distance, SAM, and ML—and one unsupervised algorithm: k-means clustering. The land cover classifications maps were compared as well as the performance accuracy of each classifier. Contrary to expected, the minimum distance attained the best accuracy while ML showed the worst performance [68] but no explanation to the fact is given. Perhaps these results reflect the quality of the training data. Despite the disparity between the results obtained with the different classifiers, Gemusse et al. [68] stated that the classification maps show clay minerals, such as kaolinite and montmorillonite, resultant from pegmatite alteration. These maps were validated through field investigations, geological maps and previous works and reports [68]. The authors also noted that the satellite product that achieves the best accuracy for the SAM and minimum distance algorithm was the Sentinel-2. More work is necessary, since the results may indicate a positive contribution from the increased spatial resolution of the sensor.
In a work focused on the application of image classification in Li pegmatite exploration, Cardoso-Fernandes et al. [69] compared the performance between two machine learning algorithms (MLAs), support vector machine (SVM) and random forest (RF), in the Fregeneda-Almendra area, using Sentinel-2A images. For details on model selection and parametrization, the original publication should be consulted [69]. This work represents the first application of MLAs in Li pegmatite mapping. Both algorithms (SVM and RF) correctly mapped the occurrence of Li pegmatites in the open-pit mines [69]. Although SVM achieved a higher overall accuracy (98.54%), the RF model (built using class balancing strategies; overall accuracy of 97.70%) was able to correctly classify a larger number of mapped Li-bearing pegmatites [69]. Additionally, some of the areas classified by SVM and RF as Li pegmatites correspond with the regions of interest delimited in previous studies [63] or to barren mapped pegmatites. Despite the potential shown by this type of approach, these techniques still produced several false positives resultant from the spectral similarity of Li pegmatites with other lithologies, namely metasedimentary rocks [69]. This may indicate that more high spatial resolution images are needed. Moreover, other difficulties were encountered (see Section 2.2), mainly associated with the high number of classes defined in the image, having the authors [69] concluded that both SVM and RF were overfitting at a class level, despite this kind of algorithms being less prone to overfit than other machine learning techniques [70,71,72,73]. This illustrates that this kind of approach can be optimized.
All the developments mentioned so far concerned the application of remote sensing the hard-rock Li deposits. However, new applications in other Li deposits are emerging. One example is the “Space enabled exploration and monitoring of Cornwall Lithium resources” research project dedicated to Li brine exploration [74]. The project aims at targeting underground geothermal Li brines through the integration of several multispectral and SAR products to produce geological, active faulting, and vegetation maps [74]. The geological mapping will be achieved in two stages: (i) the first consists on geological mapping using Landsat-8 and Sentinel-2 images with subsequent integration of geophysical data; and (ii) the second will focus on mineral alteration mapping using multispectral (ASTER and Worldview-3) and airborne hyperspectral data (HyMAp) [74]. On its turn, SAR data, namely Sentinel-1 scenes, will be used to map in detail fault systems that may structurally control Li brines. Another approach will consist of the detection of vegetation with possible Li anomalies [74].
Another deposit type that may have big potential for remote sensing applications are metasediment-hosted Li deposits like the Valdeflores (Cáceres, Spain) case where the mineralization occurs in Li-bearing micas [75,76]. This deposit would have been formed by a pervasive metasomatism that resulted in a target area of approximately 250 × 500 m [75] which means that the spatial resolution of the sensors would no longer be a problem as in pegmatite deposits. Additionally, the metasomatic formation of white mica in other mineral deposits is usually accompanied by wavelength changes of the 2200 nm absorption feature that can be used to target mineralizations using hyperspectral sensors [4]. A similar approach could be applied to detect Li micas in metasedimentary rocks.

2.1.1. Brief Overview

To understand the recent interest in the application of remote sensing methods in Li exploration and to provide an overall picture of the state of the research, we searched the number of publications in the Scopus bibliographic database using specific keywords (“Remot * sens *” AND “Lithium” AND “Mineral *”; “Satellite” AND “Lithium” AND “Mineral *”; “Remot * sens *” AND “Lithium”).
After search refinement, title and abstract screening and eligibility check, a total of nine publications from the initial 261 were included in the analysis (representing 3.4% of the total). Despite this number being considered low for bibliographic analysis [77], it highlights the existent gap in the literature in Li exploration using remote sensing data/techniques. All documents were analyzed by type, country, and citations. The co-occurrence of keywords was also analyzed considering their frequency. The VOSviewer software was employed for network visualization of the data through clustered density maps. Table 1 presents a summary of information on the nine publications included in the analysis.
The average publication year is 2014, with eight documents (88.9%) published after 2016, which reflects the recent interest in this field. Almost all documents were published in English (7; 77.8%), with the exception of one document published in Chinese (11.1%) and another one in French (11.1%) (Figure 1a). When analyzing the type of document, five publications (55.6%) correspond to conference papers while the remaining four documents (44.4%) correspond to journal articles (Figure 1b). The publications received a total of 12 citations, with an average of 1.3 citations per document since there are four documents (44.4%) with at least one citation (Table 1).
The co-occurrence of author and index keywords was also analyzed (Figure 2), being “remote sensing”, “lithium”, and “granite” the most frequent keywords occurring eight, seven, and four times, respectively.
Regarding the geographic distribution of the publications, most of the studies were conducted by researchers with European affiliations (Figure 3a): Portugal ranked first with six publications (66.7% of the total), followed by Spain with two studies (22.2% of the total), and by France and the United Kingdom with one document each (representing 11.1% of the total). On the other hand, as can be seen in Figure 3, the study area considered in each work not always corresponds to the affiliation country of the authors. Despite most studies areas being located in Europe, other applications were made in the American, African, and Asian continents (Figure 3b).

2.2. Main Challenges

The difficulties encountered in the previously mentioned applications are mainly related to the inherent characteristics of Li deposits, especially in the case of Li pegmatites which are characterized by low areas of exposition due to their dimensions (pegmatites are relatively narrow bodies).
Mendes et al. [61] reported difficulties in the direct application of the spectral signatures of Li-bearing minerals obtained in the laboratory to identify similar targets in the ASTER images. The authors [61] attributed this challenge to: (i) the low spatial resolution of the images when compared to the target area; (ii) spectral noise resultant from mixture of the materials presented in a pixel; and (iii) the low spectral resolution of the ASTER sensor when compared to the laboratory spectroradiometer.
Cardoso-Fernandes et al. [63] highlighted that the main problem associated with the identification by the hydrothermal alteration approach is that the applied RGB combinations, band ratios, and the subsets used for selective PCA correspond to algorithms proposed for the identification of other deposit types with distinct alteration styles and mineral assemblages. Thus, in order to optimize alteration mapping associated with Li pegmatites is fundamental to characterize the associated alteration minerals and possible alteration halos in the host rocks. The knowledge on the alteration halos would allow directing the image processing methods to specific minerals and it could help to discriminate between barren and Li-mineralized pegmatites. Furthermore, the possible recognition of the associated alteration halos from satellite sensors would also allow increasing the target exposition area, allowing to overcome the pegmatite thickness problem.
Based on the works conducted in the Fregeneda-Almendra area, Cardoso-Fernandes et al. [78] made a preliminary attempt to identify the main constraints in Li pegmatite exploration using satellite remote sensing as being: (i) the vegetation coverage that masks the target spectral signatures; (ii) the small pegmatite size when compared to pixel size (the exposition problem); (iii) the small number of bands and/or the lack of thermal bands in some satellite sensors (the spectral resolution problem); and (iv) the spectral resemblance between the Li pegmatites and urbanized areas or agricultural fields. These challenges are in line with the difficulties identified in other pegmatite locations [60,61,66].
In what concerns the vegetation coverage, Cudahy [4] stated, for other applications, that even when green vegetation is sparse, dry vegetation can negatively influence the spectral signature of each image pixel. At least in the Fregeneda-Almendra region, dry vegetation is more abundant than green vegetation. However, no attempts to minimize its influence were made (only green vegetation was masked). On the other hand, Cudahy [4] adverted that unmixing the spectral signatures of both green and dry vegetation is preferred than masking them. For that, Rodger and Cudahy [79] developed an unmixing method for hyperspectral sensors in which a vegetation corrected continuum depth is obtained. Despite multispectral products such as ASTER not being the most adequate to measure the spectral features of dry vegetation, it is still possible to obtain an approximate dry vegetation index [4].
Nonetheless, the compromise between spatial and spectral resolution is, in our opinion, the principal challenge in Li pegmatite exploration. This is best exemplified in the work that attempted to classify Sentinel-2 images using MLAs [69]. Although Sentinel-2 represents the free multispectral product with better spatial resolution and, therefore, the one with the best capability to overcome the pegmatite exposition problem, several misclassification errors resulted from the absence of bands in the TIR region. These misclassifications include the spectral mixing between Li pegmatites and the metasedimentary host rocks [69]. Additionally, the relatively high number of classes, identified in the image for the classification process, contributed to a higher data complexity that may have hindered the obtained results. The reduction of the number of classes, through masking of classes with no interest in Li exploration, will certainly help to optimize the algorithm performance, as recognized by the authors [69].
Another critical challenge to Li exploration based on satellite data is that in spite of the many diagnostic spectral features of Li minerals, to the best of our knowledge, it was not possible to identify so far, a unique spectral feature solely caused by the presence of Li in the structure of minerals.
Taking all this into account, it is our opinion that there are yet several developments to be made in the field of remote sensing applied to Li-mineralizations, and new algorithms and methodologies to be developed in space and Earth sciences. More insights on other remote sensing data products are given in Chapter 3.

3. Future Perspectives

A discussion on the available data products and image classification algorithms is made in the attempt to solve some of the problems identified (Section 2.2). The special requirements of Li exploration are taken into account. New types of approaches and applications to other Li deposits are addressed.

3.1. Data Products Used for the Research

Past applications (Section 2.1) included products such as ASTER, Landsat-5, Landsat-8, and Sentinel-2 images. For the purpose of this review, we will only consider the more recent products since our goal is to help in choosing the best product for future studies.
The ASTER is an imaging instrument onboard of Terra satellite, the flagship satellite of NASA’s Earth Observing System (EOS), launched in December 1999 [80]. It resulted from a collaboration between NASA and Japan’s Ministry of Economy Trade and Industry—METI [80]. ASTER captures medium-high spectral resolution data in 14 bands whose spatial resolution varies with wavelength: 15 m in the VNIR, 30 m in the SWIR, and 90 m in the TIR [81]. ASTER also provides a stereo viewing capability for digital elevation model creation [80,81]. The temporal resolution is 16 days. Due to sensor failure, SWIR data acquired since April of 2008 is not available [82]. Nonetheless, as mentioned before, ASTER’s specific characteristics greatly contributed to mineral exploration, especially in alteration mapping associated with gold and porphyry copper deposits [53,54]. A review of the different “on-demand” ASTER products can be found in the work of Pour and Hashim [83].
The Landsat program represents the world’s longest continuously acquired collection of space-based moderate-resolution multispectral land remote sensing data [84]. It is the result of a joint effort of the United States Geological Survey (USGS) and the National Aeronautics and Space Administration (NASA). Until now, Landsat counts with seven successful and one failed mission [84]. The last mission corresponds to Landsat-8, which was launched in 2013. Landsat-9 is planned to be launched in December 2020 [84]. Landsat-8 carries two different instruments: (i) the Operational Land Imager (OLI); and (ii) the Thermal Infrared Sensor (TIRS). Each image product contains nine spectral bands with a spatial resolution of 30 m for bands 1–7 and 9, and 15 m for band 8 (panchromatic); and two thermal bands (10 and 11) are collected at 100 m, but resampled for 30 m [85]. Each band consists of a 16-bit grayscale image. The scene size is 170 km × 185 km [85]. The temporal resolution is 16 days. Key publications in geological remote sensing (at least until the time of publication) from both the Landsat and the ASTER eras can be found in van der Meer et al. [53].
The Sentinel-2 mission includes the recent twin satellites Sentinel-2A and Sentinel-2B launched in the frame of the European Union’s Copernicus Program [86]. Since the satellites are out of phase with each other, the temporal resolution is five days at the equator [87]. Both satellites acquire information in 13 spectral bands in the VNIR-SWIR regions: four bands at 10 m spatial resolution, six bands at 20 m, and three bands at 60 m [87]. The orbital swath width is 290 km. A comparison between Landsat-8, Sentinel-2 and ASTER bands is established in Table 2 and in Figure 2.
Van der Meer et al. [53] refer to the importance of the Sentinel-2 mission to ensure data continuity, especially after the failure of ASTER’s SWIR module. However, the application of Sentinel-2 images for geological studies is scarce when compared to the previously mentioned satellite sensors, especially when it comes to geological exploration. The first articles in the literature regarding this satellite address their potential to alteration and iron/gossan mapping, while others highlight the correspondence between ASTER, Landsat 8, and Sentinel-2 VNIR and SWIR bands [90,91,92,93]. More recent studies highlight the possible contribution and suitability of Sentinel-2 images for geological mapping [94,95] and for geological fault detection [96]. Ge et al. [97] applied different MLAs, Artificial Neural Network (ANN), k-Nearest Neighbor (k-NN), RF and SVM, to Sentinel-2 images in order to perform lithological classification in an ophiolite complex in Inner Mongolia, China. Hu et al. [98] compared the use of Sentinel-2, ASTER, and Hyperion in hydrothermally-altered mineral mapping associated with porphyry copper deposits. Cardoso-Fernandes et al. [62] and Cardoso-Fernandes et al. [63] already showed some potentialities and limitations of the use of Sentinel-2 in Li pegmatite identification. Overall, some of these works show that, on the contrary of what it was thought, Sentinel-2 might not be able to replace ASTER in the acquisition of data for geological applications, due to the lack of a TIR sensor. Until now there is no free or commercial product capable of responding to the necessities of geological mapping and exploration, so other solutions need to be explored. The potential of the combined use of multi- and hyperspectral satellite data in mineral exploration was already discussed by Mielke et al. [93].
In what concerns the compromise between spatial and spectral resolution, the answer may rely on commercial satellites such as WorldView-3. Launched in 2014 by DigitalGlobe, World-View-3 is a high-resolution multispectral sensor that measures reflected radiance in eight VNIR bands (at 1.24 m spatial resolution) and eight SWIR bands (at 3.70 m resolution) although SWIR data is resampled to a 7.5 m pixel size for commercial distribution [99] (Table 2; Figure 4). WorldView-3 also has a panchromatic band with 0.31 m of spatial resolution [99]. The swath width is 13.1 km. Despite lacking a TIR sensor, WorldView-3 has good potential for mineral mapping since its bandpasses are very similar to the ASTER VNIR-SWIR ones [4,54]. Additionally, such high resolution can help to tackle the vegetation problems due to the sensors’ ability to map between trees [4].
To overcome the remaining inherent difficulties of Li exploration, other types of remote sensing platforms should be considered. Nowadays, drone-borne hyperspectral sensors are a reality. In fact, such an approach is being used to quickly identifying target areas for Li exploration within the “Lightweight Integrated Ground and Airborne Hyperspectral Topological Solution” (LIGHTS) project [101]. However, this kind of data has one big limitation due to the high associated cost of mounting the equipment in the drone, of around 200,000 USD. Nonetheless, it is our opinion this kind of approach will be highly sought after in the future, once the drone and hyperspectral camera prices go down.

3.2. Image Processing Algorithms

In the past, several authors have reviewed the different techniques and image processing algorithms that can be applied to geological remote sensing in general [102,103] or in mineral exploration [5,6]. Some even group the image processing methods into functional categorization schemes. Sabins [104] defined three categories: (i) image restoration; (ii) image enhancement; and (iii) information extraction. Later, in 2016, Asadzadeh and Souza Filho [103] proposed a new scheme in which the techniques are divided into knowledge-based and data-driven approaches.
Common image processing algorithms employed in mineral exploration are: (i) RGB combinations [105,106]; (ii) band ratios [6,105]; (iii) PCA [28,107]; (iv) MNF [21,105,106]; (v) matched filtering (MF) [24,105]; (vi) linear spectral unmixing (LSU) [11,51]; (vii) constrained energy minimization (CEM) [17,21]; (viii) least square fitting method [105]; (ix) independent component analysis [50]. and supervised algorithms such as (x) SAM [8,108], and (xi) MTNF [8,15]. Methods such as MNF, PPI, and SAM have already been applied to pegmatite detection in Southern Namibia using airborne hyperspectral data (HyMap) [109]. For the same region, Oshigami et al. [110] proposed a new classification method named continuum-removal MSAM that combined the Modified Spectral Angle Mapper (MSAM) and continuum-removal methods. Using HyMap images, the authors produced mineral index maps to target common pegmatite minerals such as lepidolite and other white micas. In the Cornwall region, United Kingdom, Ellis and Scott [111] used lepidolite as a pathfinder for topaz-bearing granites in an environmental monitoring study. For that, HyMap airborne images were used and methods like MNF, PPI, and MTMF were employed.
Recently, great attention has been given to non-parametric classifiers such as machine and deep learning algorithms. These techniques have been applied in land-use/land-cover (LULC) problems with great success, outperforming classical algorithms [112,113,114,115]. In 2014, Yu et al. [116] conducted a meta-analysis and synthesis of satellite-based land-cover mapping studies, concluding that, from all classification methods (used more than 10 times out of the 1651 analyzed studies), MLAs, namely ensemble classifiers, ANN and SVM, are the methods that achieved a performance better than the average accounted in the 1651 experiments.
Although the number of applications is smaller when compared to the LULC studies, similar results have been obtained in lithological mapping and mineral exploration [40,117,118,119,120,121]. Yu et al. [117], in 2012, developed an automated approach to lithological mapping in Northwestern India where different SVMs with the radial basis function (RBF) kernel were trained using ASTER, ASTER-derived digital elevation model (DEM), and aeromagnetic data. The tested number of input features ranged from 14 to 33, having the classification accuracy increased with the increasing number of layers. When compared with a classical classifier, SVM clearly outperformed ML, achieving a much higher accuracy [117]. Cracknell et al. [118] applied RF and self-organizing maps (SOM) to map lithology and volcanic-hosted massive sulfide (VHMS) alteration in Tasmania. The input data included airborne geophysical, soil geochemical and Landsat-7 Enhanced Thematic Mapper Plus (ETM+) spectral data. The approach provided new geological detail and allowed to identify areas of interest for geological and VHMS alteration mapping. According to the authors [118], the combination of supervised and unsupervised MLAs delivered a robust mean to analyze and map complex, challenging terrains. In 2016, Parakh et al. [119] compared the performance between RF and SVM in lithological mapping in India using Landsat-8, ASTER, and DEM data. Additionally, band-depth images from the analysis of laboratory spectra were used as input for the fuzzy inference system (FIS) to further discriminate between amphibolite and mica-schist. Overall, the performance of RF and SVM was similar although RF provided a higher accuracy for the minor class [119]. Bahrambeygi and Moeinzadeh [120] compared SVM and ANN in hyperspectral mapping of ophiolite terrains in Iran using Hyperion images, the ANN having achieved higher accuracy. Latifovic et al. [121], in 2018, assessed the performance of convolutional neural networks (CNN) in lithological mapping in Northwestern Canada. Different data layers were used to train the network including Landsat TM/ETM+ scenes, aerial photos, and high-resolution DEM data. The performance of CNN was evaluated in two sampling scenarios: the first uses samples collected over the area to be mapped, while the second scenario corresponds to an independent test area. Secondly, the performance of CNN was confronted with the one attained using the more widely used RF algorithm [121]. In the first scenario, both algorithms showed similar results with an average accuracy of around 76%. However, in the independent test sets, CNN outperformed RF by 4%.
Most of these works show that the classification accuracy is improved when additional data is added to the satellite-acquired one. This follows the line of thought of Rajesh [3] that remote sensing data by itself may not be sufficient to identify new mineral deposits. Therefore, it would be important to try to integrate satellite data with other types of data in Li exploration. This type of logic could also be applied to techniques employed, that is, several classifiers could be combined to form a better predictor (using ensemble methods like AdaBoost or bagging). Such an approach can help to overcome the weaknesses of single classifiers [122].
In the past recent years, several reviews have been published on either the use of a specific MLA or on the comparison of a set of machine and/or deep learning algorithms. Mountrakis et al. [72] presented various applications of SVM in remote sensing as well as several algorithmic advances and SVM variants developed. Belgiu and Drăguţ [70] reviewed the use of RF as a classifier in remote sensing. The authors also highlight developments made and new applications in the field of remote sensing, besides pointing out future directions. Maxwell et al. [123] reviewed MLAs from an applied perspective, focusing on SVM, decision trees (DTs), boosted DTs, RF, ANNs, and k-NN, the choice of proper algorithms, their implementation, training data requirements (class balancing problems for example), parameter tuning, computational costs, and availability of MLAs in remote sensing software packages. Li et al. [124] survey and compare the performances achieved by typical deep learning (DL) methods, such as model CNNs, stacked auto-encoders (SAEs), and deep belief networks (DBNs). The authors also presented a systematic review of developments made in pixel-wise and scene wise approaches using DL methods.
Despite the great performance achieved by MLAs in the field of computer vision and image processing [122,124], some difficulties are expected in what concerns their application to Li exploration. The first and most obvious obstacle is the in-depth knowledge about the MLAs and DL required for any geoscientist/geologist to conduct such an approach. The second is related to the nature of the classification problem since mineral exploration in general, and Li exploration in particular, inherently differ from classical applications, such as LULC problems. Finally, the amount of training associated with each algorithm and the need to parameterize the algorithms are another major obstacle. This parametrization can be more difficult in some MLAs like SVM but, overall, past studies show that the parameters tend to be case sensitive and therefore fundamental [112,123]. New developments on how to transfer learning from one case study to another are needed and they will definitely increase the importance and usage of MLAs and DL in mineral exploration. On the other hand, there are still a great number of potentialities to explore in Li exploration that are constantly increasing with the new models and algorithms being proposed. These include adaptations of the original algorithms (e.g., oblique RF classification [125] or transductive SVM [126]) and the use of non-traditional optimization algorithms, such as genetic algorithms and particle swarm optimization, with MLAs [127]. The application of MLAs in sub-pixel classification (e.g., [128]) could also help to decrease the impact of mixed pixels in medium spatial resolution images.

4. Summary and Conclusions

Despite the early attempt to target Li mineralizations with the launch of the Landsat missions, there is an unequivocal exponential growth on the publication numbers in the last decades. Nonetheless, since it still is an emergent field, the studies are limited to a small number of research groups, mainly based in Europe. However, considering the market demand for this raw material, we expect that many other studies will flourish in the near future all around the globe.
In general, past application studies relied on four distinct approaches: (i) geobotanical mapping; (ii) lithological mapping; (iii) mineral alteration mapping; and (iv) Li minerals/Li pegmatite discrimination. Different types of satellite products with distinct characteristics were employed as well as diverse image processing algorithms ranging from simple logical or mathematical operations (band ratios) to more evolved and complex algorithms like MLAs.
Overall, the objectives and the research questions addressed in this review were successfully accomplished/answered:
1. What can be accomplished in Li exploration using remote sensing methods? The reviewed publications show that it is possible to identify the spectral features of pegmatite intrusions and to discriminate the Li-bearing pegmatites from the host rocks (despite the misclassification errors in the lithological mapping approach). Depending on the type of host rock, this discrimination may not be possible without using TIR data. The proposed approach to directly identify Li minerals/Li pegmatites was confirmed in other areas of the globe. To some extent, the alteration mapping approach works to target Li pegmatites, although it is more promising in highly weathered areas such as in the Alto Ligonha region (Mozambique).
2. What are the main difficulties? Both the alteration mapping and Li pegmatite mapping results differ regarding the area or the image processing method applied, which points to the lack of an automated proceeding to target Li-mineralizations. Other noted difficulties are related to the spectral confusion with urbanized areas and agricultural fields or spectral noise resultant from mixing at the pixel level. From our knowledge, these problems are inherently caused by low spectral and spatial resolution, respectively. The vegetation coverage is another difficulty since it masks the Li minerals/Li pegmatites spectral signatures. In specific areas of the world, there may be problems in the hydrothermal alteration approach since the Li pegmatites may present distinct alteration styles and mineral assemblages not detected by the common techniques.
3. How to overcome these difficulties? Currently, there is no existing or expected satellite product capable of responding to all the necessities of Li exploration. Despite lacking thermal bands, WorldView-3 is probably the closest product available capable of dealing with the spatial and spectral resolution compromise. Additionally, WorldView-3 high spatial resolution can help to tackle the vegetation difficulties. Another solution to dampen the effects of vegetation is the spectral unmixing of both green and dry vegetation. To optimize the alteration mapping approach, a detailed geological characterization of the associated alteration minerals and possible alteration halos in the host rocks can lead to the development of specific, more efficient algorithms. Other types of remote sensing data, namely drone-borne hyperspectral sensors, may constitute a more efficient Li exploration tool in the future. For now, such an approach is not feasible due to the high associated costs.
4. What are the future research perspectives? We believe that there are several developments to be made in the field of remote sensing applied to Li mineralizations in the future. The constant increase and development of MLAs, in specific, offers unlimited possibilities to be explored. Less common techniques, such as the adaptation of the original MLAs or the combination of several classifiers into one single predictor, can help to achieve a better performance in Li exploration. The integration of remote sensing data with geological information (mineral prospectivity) will increase the ability to target new deposits. The development and improvement of the geobotanical approach may enable Li exploration using remote sensing in highly vegetated areas, which for now is unthinkable. The generalization of the mentioned approaches to other Li deposit types (e.g., brines) will also contribute to establishing remote sensing as a fundamental tool in Li exploration.

Author Contributions

All the authors designed and schematized the manuscript; J.C.-F. wrote the original draft; A.C.T., A.L., M.P., and E.R.-R. revised and edited the paper. All authors have read and agreed to the published version of the manuscript.

Funding

The authors would like to thank the financial support provided by FCT—Fundação para a Ciência e a Tecnologia with the ERA-MIN/0001/2017—LIGHTS project, FEDER through operation POCI-01-0145-FEDER-007690 funded by the Programa Operacional Competitividade e Internacionalização—COMPETE2020 and by National Funds through FCT within the ICT, R and D Unit (reference UIDB/04683/2020). The University of the Basque Country (UPV/EHU) contributed economically with grant GIU18/084. Joana Cardoso-Fernandes is financially supported within the compass of a Ph.D. Thesis, ref. SFRH/BD/136108/2018, by national funds from MCTES through FCT, and co-financed by the European Social Fund (ESF) through POCH—Programa Operacional Capital Humano.

Conflicts of Interest

The authors declare no conflict of interest.

Appendix A. Spectral Indices

Appendix A.1. RGB Combinations

In 2019, Cardoso-Fernandes et al. [63] proposed different RGB combinations to target Li-bearing pegmatites using atmospherically corrected, surface reflectance ASTER, Landsat-5, Landsat-8, and Sentinel-2 products (Table A1).
Table A1. Proposed RGB combinations for Li pegmatite detection [63].
SensorRGB Combination
ASTER5-1-14
2-1-13
Landsat-5 TM7-2-6
2-1-6
Landsat-8 OLI/TIRS7-3-11
2-1-11
Sentinel-2 MSI3-2-12

Appendix A.2. Band Ratios

Band ratios were also proposed to identify Li pegmatites [62,63]. These ratios were based on spectral absorption features of Li minerals, such as spodumene and lepidolite (Table A2).
Table A2. Band ratios proposed to identify Li pegmatites [62,63].
SensorBand Ratio
ASTER7/6
1/3
Landsat-5 TM2/4
3/7
Landsat-8 OLI/TIRS3/5
4/7
Sentinel-2 MSI3/8
4/12

Appendix A.3. PCA

Cardoso-Fernandes et al. [63] also selected two- and four-band subsets for the application of selective PCA to isolate target spectral signatures of Li pegmatites (Table A3). Input data were the ASTER, Landsat-5, Landsat-8, and Sentinel-2 raw bands.
Table A3. Band subsets for selective PCA in Li pegmatite identification.
SensorBand Subset
ASTER1, 3
1, 3, 11, 14
Landsat-5 TM2, 4
1, 2, 4, 6
Landsat-8 OLI/TIRS3, 5
2, 3, 5, 11
Sentinel-2 MSI3, 8
2, 3, 8, 11

References

  1. El-Baz, F. Remote sensing and mapping of Earth resources. Terra Nova 1990, 2, 446–454. [Google Scholar] [CrossRef]
  2. Meer, V.D. Bakker validated surface mineralogy from high-spectral resolution remote sensing: A review and a novel approach applied to gold exploration using AVIRIS data. Terra Nova 1998, 10, 112–119. [Google Scholar] [CrossRef]
  3. Rajesh, H.M. Application of remote sensing and GIS in mineral resource mapping—An overview. J. Mineral. Petrol. Sci. 2004, 99, 83–103. [Google Scholar] [CrossRef] [Green Version]
  4. Cudahy, T. Mineral mapping for exploration: An Australian journey of evolving spectral sensing technologies and industry collaboration. Geosciences 2016, 6, 52. [Google Scholar] [CrossRef] [Green Version]
  5. Rajan Girija, R.; Mayappan, S. Mapping of mineral resources and lithological units: A review of remote sensing techniques. Int. J. Image Data Fusion 2019, 10, 79–106. [Google Scholar] [CrossRef]
  6. Sabins, F.F. Remote sensing for mineral exploration. Ore Geol. Rev. 1999, 14, 157–183. [Google Scholar] [CrossRef]
  7. Abbaszadeh, M.; Hezarkhani, A. Enhancement of hydrothermal alteration zones using the spectral feature fitting method in Rabor area, Kerman, Iran. Arab. J. Geosci. 2011, 6, 1957–1964. [Google Scholar] [CrossRef]
  8. Bishop, C.A.; Liu, J.G.; Mason, P.J. Hyperspectral remote sensing for mineral exploration in Pulang, Yunnan Province, China. Int. J. Remote Sens. 2011, 32, 2409–2426. [Google Scholar] [CrossRef]
  9. Di Tommaso, I.; Rubinstein, N. Hydrothermal alteration mapping using ASTER data in the Infiernillo porphyry deposit, Argentina. Ore Geol. Rev. 2007, 32, 275–290. [Google Scholar] [CrossRef]
  10. Farahbakhsh, E.; Shirmard, H.; Bahroudi, A.; Eslamkish, T. Fusing ASTER and QuickBird-2 Satellite Data for detailed investigation of porphyry copper deposits using PCA.; Case study of Naysian Deposit, Iran. J. Indian Soc. of Remote Sens. 2016, 44, 525–537. [Google Scholar] [CrossRef]
  11. Hosseinjani, M.; Tangestani, M.H. Mapping alteration minerals using sub-pixel unmixing of ASTER data in the Sarduiyeh area, SE Kerman, Iran. Int. J. Digit. Earth 2011, 4, 487–504. [Google Scholar] [CrossRef]
  12. Hosseinjani Zadeh, M.; Honarmand, M. A remote sensing-based discrimination of high- and low-potential mineralization for porphyry copper deposits; a case study from Dehaj–Sarduiyeh copper belt, SE Iran. Eur. J. Remote Sens. 2017, 50, 332–342. [Google Scholar] [CrossRef]
  13. Hosseinjani Zadeh, M.; Tangestani, M.H.; Roldan, F.V.; Yusta, I. Sub-pixel mineral mapping of a porphyry copper belt using EO-1 Hyperion data. Adv. Space Res. 2014, 53, 440–451. [Google Scholar] [CrossRef]
  14. Pour, A.B.; Hashim, M. Identification of hydrothermal alteration minerals for exploring of porphyry copper deposit using ASTER data, SE Iran. J. Asian Earth Sci. 2011, 42, 1309–1323. [Google Scholar] [CrossRef]
  15. Pour, A.B.; Hashim, M. Hydrothermal alteration mapping from Landsat-8 data, Sar Cheshmeh copper mining district, south-eastern Islamic Republic of Iran. J. Taibah Univ. Sci. 2015, 9, 155–166. [Google Scholar] [CrossRef]
  16. Safari, M.; Maghsoudi, A.; Pour, A.B. Application of Landsat-8 and ASTER satellite remote sensing data for porphyry copper exploration: A case study from Shahr-e-Babak, Kerman, south of Iran. Geocarto Int. 2017, 33, 1186–1201. [Google Scholar] [CrossRef]
  17. Zhang, N.; Zhou, K. Identification of hydrothermal alteration zones of the Baogutu porphyry copper deposits in northwest China using ASTER data. J. Appl. Remote Sens. 2017, 11. [Google Scholar] [CrossRef]
  18. Amer, R.; Kusky, T.; El Mezayen, A. Remote sensing detection of gold related alteration zones in Um Rus area, Central Eastern Desert of Egypt. Adv. Space Res. 2012, 49, 121–134. [Google Scholar] [CrossRef]
  19. Ciampalini, A.; Garfagnoli, F.; Antonielli, B.; Moretti, S.; Righini, G. Remote sensing techniques using Landsat ETM+ applied to the detection of iron ore deposits in Western Africa. Arab. J. Geosci. 2012, 6, 4529–4546. [Google Scholar] [CrossRef]
  20. El-Magd, I.A.; Mohy, H.; Basta, F. Application of remote sensing for gold exploration in the Fawakhir area, Central Eastern Desert of Egypt. Arab. J. Geosci. 2014, 8, 3523–3536. [Google Scholar] [CrossRef]
  21. Gabr, S.; Ghulam, A.; Kusky, T. Detecting areas of high-potential gold mineralization using ASTER data. Ore Geol. Rev. 2010, 38, 59–69. [Google Scholar] [CrossRef]
  22. Gabr, S.S.; Hassan, S.M.; Sadek, M.F. Prospecting for new gold-bearing alteration zones at El-Hoteib area, South Eastern Desert, Egypt, using remote sensing data analysis. Ore Geol. Rev. 2015, 71, 1–13. [Google Scholar] [CrossRef]
  23. Hassan, S.M.; Ramadan, T.M. Mapping of the late Neoproterozoic Basement rocks and detection of the gold-bearing alteration zones at Abu Marawat-Semna area, Eastern Desert, Egypt using remote sensing data. Arab. J. Geosci. 2014, 8, 4641–4656. [Google Scholar] [CrossRef]
  24. Liu, L.; Zhou, J.; Han, L.; Xu, X. Mineral mapping and ore prospecting using Landsat TM and Hyperion data, Wushitala, Xinjiang, northwestern China. Ore Geol. Rev. 2017, 81, 280–295. [Google Scholar] [CrossRef]
  25. Moradi, M.; Basiri, S.; Kananian, A.; Kabiri, K. Fuzzy logic modeling for hydrothermal gold mineralization mapping using geochemical, geological, ASTER imageries and other geo-data, a case study in Central Alborz, Iran. Earth Sci. Inform. 2014, 8, 197–205. [Google Scholar] [CrossRef]
  26. Zhang, X.; Pazner, M.; Duke, N. Lithologic and mineral information extraction for gold exploration using ASTER data in the south Chocolate Mountains (California). ISPRS J. Photogramm. Remote Sens. 2007, 62, 271–282. [Google Scholar] [CrossRef]
  27. Zoheir, B.A. Controls on lode gold mineralization, Romite deposit, South Eastern Desert, Egypt. Geosci. Front. 2012, 3, 571–585. [Google Scholar] [CrossRef] [Green Version]
  28. Crósta, A.P.; Souza Filho, C.R.; Azevedo, F.; Brodie, C. Targeting key alteration minerals in epithermal deposits in Patagonia, Argentina, using ASTER imagery and principal component analysis. Int. J. Remote Sens. 2003, 24, 4233–4240. [Google Scholar] [CrossRef]
  29. Bersi, M.; Saibi, H.; Chabou, M.C. Aerogravity and remote sensing observations of an iron deposit in Gara Djebilet, southwestern Algeria. J. Afr. Earth Sci. 2016, 116, 134–150. [Google Scholar] [CrossRef]
  30. Ducart, D.F.; Silva, A.M.; Toledo, C.L.B.; Assis, L.M.D. Mapping iron oxides with Landsat-8/OLI and EO-1/Hyperion imagery from the Serra Norte iron deposits in the Carajás Mineral Province, Brazil. Braz. J. Geol. 2016, 46, 331–349. [Google Scholar] [CrossRef]
  31. Duuring, P.; Hagemann, S.G.; Novikova, Y.; Cudahy, T.; Laukamp, C. Targeting iron ore in banded iron formations using aster data: Weld range greenstone belt, yilgarn craton, western australia. Econ. Geol. 2012, 107, 585–597. [Google Scholar] [CrossRef]
  32. Rajendran, S.; Thirunavukkarasu, A.; Balamurugan, G.; Shankar, K. Discrimination of iron ore deposits of granulite terrain of Southern Peninsular India using ASTER data. J. Asian Earth Sci. 2011, 41, 99–106. [Google Scholar] [CrossRef]
  33. Berger, B.R.; King, T.V.V.; Morath, L.C.; Philli, J.D. Utility of high-altitude infrared spectral data in mineral exploration: Application to Northern Patagonia Mountains, Arizona. Econ. Geol. 2003, 98, 1003–1018. [Google Scholar] [CrossRef]
  34. Van Der Meer, F.; Vazquez-Torres, M.; Van Dijk, P.M. Spectral characterization of ophiolite lithologies in the Troodos Ophiolite complex of Cyprus and its potential in prospecting for massive sulphide deposits. Int. J. Remote Sens. 2010, 18, 1245–1257. [Google Scholar] [CrossRef]
  35. Wang, G.; Du, W.; Carranza, E.J.M. Remote sensing and GIS prospectivity mapping for magmatic-hydrothermal base- and precious-metal deposits in the Honghai district, China. J. Afr. Earth Sci. 2017, 128, 97–115. [Google Scholar] [CrossRef]
  36. Rowan, L.C.; Mars, J.C. Lithologic mapping in the Mountain Pass, California area using Advanced Spaceborne Thermal Emission and Reflection Radiometer (ASTER) data. Remote Sens. Environ. 2003, 84, 350–366. [Google Scholar] [CrossRef]
  37. Mazhari, N.; Malekzadeh Shafaroudi, A.; Ghaderi, M. Detecting and mapping different types of iron mineralization in Sangan mining region, NE Iran, using satellite image and airborne geophysical data. Geosci. J. 2017, 21, 137–148. [Google Scholar] [CrossRef]
  38. Xu, Y.; Chen, J.; Meng, P. Detection of alteration zones using hyperspectral remote sensing data from Dapingliang skarn copper deposit and its surrounding area, Shanshan County, Xinjiang Uygur autonomous region, China. J. Vis. Commun. Image Represent. 2019, 58, 67–78. [Google Scholar] [CrossRef]
  39. Salles, R.D.R.; Souza Filho, C.R.; Cudahy, T.; Vicente, L.E.; Monteiro, L.V.S. Hyperspectral remote sensing applied to uranium exploration: A case study at the Mary Kathleen metamorphic-hydrothermal U-REE deposit, NW, Queensland, Australia. J. Geochem. Explor. 2017, 179, 36–50. [Google Scholar] [CrossRef]
  40. Othman, A.; Gloaguen, R. Improving Lithological Mapping by SVM classification of spectral and morphological features: The Discovery of a new chromite body in the mawat ophiolite complex (Kurdistan, NE Iraq). Remote Sens. 2014, 6, 6867–6896. [Google Scholar] [CrossRef] [Green Version]
  41. Eslami, A.; Ghaderi, M.; Rajendran, S.; Pour, A.B.; Hashim, M. Integration of ASTER and landsat TM remote sensing data for chromite prospecting and lithological mapping in Neyriz ophiolite zone, south Iran. Resour. Geol. 2015, 65, 375–388. [Google Scholar] [CrossRef]
  42. Pournamdari, M.; Hashim, M. Detection of chromite bearing mineralized zones in Abdasht ophiolite complex using ASTER and ETM+ remote sensing data. Arab. J. Geosci. 2013, 7, 1973–1983. [Google Scholar] [CrossRef]
  43. Rajendran, S.; al-Khirbash, S.; Pracejus, B.; Nasir, S.; Al-Abri, A.H.; Kusky, T.M.; Ghulam, A. ASTER detection of chromite bearing mineralized zones in Semail Ophiolite Massifs of the northern Oman Mountains: Exploration strategy. Ore Geol. Rev. 2012, 44, 121–135. [Google Scholar] [CrossRef]
  44. Gemail, K.; Abd-El Rahman, N.M.; Ghiath, B.M.; Aziz, R.N. Integration of ASTER and airborne geophysical data for mineral exploration and environmental mapping: A case study, Gabal Dara, North Eastern Desert, Egypt. Environ. Earth Sci. 2016, 75. [Google Scholar] [CrossRef]
  45. Zimmermann, R.; Brandmeier, M.; Andreani, L.; Mhopjeni, K.; Gloaguen, R. Remote sensing exploration of Nb-Ta-LREE-Enriched carbonatite (Epembe/Namibia). Remote Sens. 2016, 8, 620. [Google Scholar] [CrossRef] [Green Version]
  46. Sabins, F.F.; Miller, R.M. Resource assessment—Salar Uyuni and vicinity. In Proceedings of the Tenth Thematic Conference on Geologic Remote Sensing (Ann Arbor, MI, Environmental Research Institute of Michigan), San Antonio, TX, USA, 9–12 May 1994; pp. 9–12. [Google Scholar]
  47. Öztan, N.S.; Süzen, M.L. Mapping evaporate minerals by ASTER. Int. J. Remote Sens. 2011, 32, 1651–1673. [Google Scholar] [CrossRef]
  48. Bedini, E. Mineral mapping in the Kap Simpson complex, central East Greenland, using HyMap and ASTER remote sensing data. Adv. Space Res. 2011, 47, 60–73. [Google Scholar] [CrossRef]
  49. Liu, L.; Zhou, J.; Yin, F.; Feng, M.; Zhang, B. The reconnaissance of mineral resources through aster data-based image processing, interpreting and ground inspection in the Jiafushaersu area, West Junggar, China. J. Earth Sci. 2014, 25, 397–406. [Google Scholar] [CrossRef]
  50. Beiranvand Pour, A.; Park, T.-Y.; Park, Y.; Hong, J.; Zoheir, B.; Pradhan, B.; Ayoobi, I.; Hashim, M. Application of multi-sensor satellite data for exploration of Zn–Pb Sulfide mineralization in the franklinian basin, north greenland. Remote Sens. 2018, 10, 1186. [Google Scholar] [CrossRef] [Green Version]
  51. Kruse, F.A.; Boardman, J.W. Characterization and mapping of kimberlites and related diatremes using hyperspectral remote sensing. In Proceedings of the 2000 IEEE Aerospace Conference. Proceedings (Cat. No.00TH8484), Big Sky, MT, USA, 25 March 2000; Volume 3, pp. 299–304. [Google Scholar]
  52. Mujabar, P.S.; Dajkumar, S. Mapping of bauxite mineral deposits in the northern region of Saudi Arabia by using advanced spaceborne thermal emission and reflection radiometer satellite data. Geo Spat. Inf. Sci. 2018, 22, 35–44. [Google Scholar] [CrossRef] [Green Version]
  53. Van der Meer, F.D.; van der Werff, H.M.A.; van Ruitenbeek, F.J.A.; Hecker, C.A.; Bakker, W.H.; Noomen, M.F.; van der Meijde, M.; Carranza, E.J.M.; Smeth, J.B.D.; Woldai, T. Multi- and hyperspectral geologic remote sensing: A review. Int. J. Appl. Earth Obs. Geoinf. 2012, 14, 112–128. [Google Scholar] [CrossRef]
  54. Abrams, M.; Yamaguchi, Y. Twenty years of ASTER contributions to lithologic mapping and mineral exploration. Remote Sens. 2019, 11, 1394. [Google Scholar] [CrossRef] [Green Version]
  55. Ninomiya, Y.; Fu, B. Thermal infrared multispectral remote sensing of lithology and mineralogy based on spectral properties of materials. Ore Geol. Rev. 2019, 108, 54–72. [Google Scholar] [CrossRef]
  56. Christmann, P.; Gloaguen, E.; Labbé, J.-F.; Melleton, J.; Piantone, P. Chapter 1—Global lithium resources and sustainability issues. In Lithium Process Chemistry; Chagnes, A., Światowska, J., Eds.; Elsevier: Amsterdam, The Netherlands, 2015; pp. 1–40. [Google Scholar]
  57. Grosjean, C.; Miranda, P.H.; Perrin, M.; Poggi, P. Assessment of world lithium resources and consequences of their geographic distribution on the expected development of the electric vehicle industry. Renew. Sustain. Energy Rev. 2012, 16, 1735–1744. [Google Scholar] [CrossRef]
  58. Arrobas, D.L.P.; Hund, K.L.; Mccormick, M.S.; Ningthoujam, J.; Drexhage, J.R. The Growing Role of Minerals and Metals for a Low Carbon Future; The World Bank: Washington, DC, USA, 2017. [Google Scholar]
  59. Lefevre, M.J. Teledetection d‘anomalies geobotaniques appliquee a la recherche miniere par la methode de traitement d’images, Echassieres (Allier). Bull. Société Géologique Fr. 1982, 127–130. [Google Scholar] [CrossRef]
  60. Perrotta, M.M.; Souza Filho, C.R.; Leite, C.A.S. Mapeamento espectral de intrusões pegmatíticas relacionadas a mineralizações de lítio, gemas e minerais industriais na região do vale do Jequitinhonha (MG) a partir de imagens ASTER. In Proceedings of the Anais do XII Simpósio Brasileiro de Sensoriamento Remoto, Goiânia, Brasil, 16–21 April 2005; pp. 1855–1862. [Google Scholar]
  61. Mendes, D.; Perrotta, M.M.; Costa, M.A.C.; Paes, V.J.C. Mapeamento espectral para identificação de assinaturas espectrais de minerais de lítio em imagens ASTER (NE/MG). In Proceedings of the Anais do XVIII Simpósio Brasileiro de Sensoriamento Remoto, Santos-SP, Brasil, 28–29 May 2017; pp. 5273–5280. [Google Scholar]
  62. Cardoso-Fernandes, J.; Teodoro, A.C.; Lima, A. Potential of Sentinel-2 data in the detection of lithium (Li)-bearing pegmatites: A study case. In Proceedings of the SPIE, SPIE Remote Sensing, Berlin, Germany, 10–13 September 2018; Michel, U., Schulz, K., Eds.; SPIE: Bellingham, WA, USA, 2018; p. 15. [Google Scholar]
  63. Cardoso-Fernandes, J.; Teodoro, A.C.; Lima, A. Remote sensing data in lithium (Li) exploration: A new approach for the detection of Li-bearing pegmatites. Int. J. Appl. Earth Obs. Geoinf. 2019, 76, 10–25. [Google Scholar] [CrossRef]
  64. De Almeida, C.M.P. Estudo Do Filão Aplitopegmatítico Da Mina Da Bajoca, Almendra: Contribuição Científico-Tecnológica. MsC Thesis, Faculdade de Ciências da Universidade do Porto, Porto, Portugal, 2003. [Google Scholar]
  65. Spatz, D.M. Remote sensing characteristics of the sediment- and volcanic-hosted precious metal systems: Imagery selection for exploration and development. Int. J. Remote Sens. 1997, 18, 1413–1438. [Google Scholar] [CrossRef]
  66. Santos, D.; Teodoro, A.; Lima, A.; Cardoso-Fernandes, J. Remote sensing techniques to detect areas with potential for lithium exploration in Minas Gerais, Brazil. In Proceedings of the SPIE, SPIE Remote Sensing, Strasbourg, France, 9–12 September 2019; Schulz, K., Michel, U., Nikolakopoulos, K.G., Eds.; SPIE: Bellingham, WA, USA, 2019. [Google Scholar]
  67. Gemusse, U.; Lima, A.; Teodoro, A. Pegmatite spectral behavior considering ASTER and Landsat 8 OLI data in Naipa and Muiane mines (Alto Ligonha, Mozambique). In Proceedings of the SPIE, SPIE Remote Sensing, Berlin, Germany, 10–13 September 2018; Michel, U., Schulz, K., Eds.; SPIE: Bellingham, WA, USA, 2018. [Google Scholar]
  68. Gemusse, U.; Lima, A.; Teodoro, A. Comparing different techniques of satellite imagery classification to mineral mapping pegmatite of Muiane and Naipa: Mozambique. In Proceedings of the SPIE, SPIE Remote Sensing, Strasbourg, France, 9–12 September 2019; Schulz, K., Michel, U., Nikolakopoulos, K.G., Eds.; SPIE: Bellingham, WA, USA, 2019. [Google Scholar]
  69. Cardoso-Fernandes, J.; Teodoro, A.C.; Lima, A.; Roda-Robles, E. Evaluating the performance of support vector machines (SVMs) and random forest (RF) in Li-pegmatite mapping: Preliminary results. In Proceedings of the SPIE, SPIE Remote Sensing, Strasbourg, France, 9–12 September 2019; Schulz, K., Michel, U., Nikolakopoulos, K.G., Eds.; SPIE: Bellingham, WA, USA, 2019. [Google Scholar]
  70. Belgiu, M.; Drăguţ, L. Random forest in remote sensing: A review of applications and future directions. ISPRS J. Photogramm. Remote Sens. 2016, 114, 24–31. [Google Scholar] [CrossRef]
  71. Breiman, L. Random forests. Mach. Learn. 2001, 45, 5–32. [Google Scholar] [CrossRef] [Green Version]
  72. Mountrakis, G.; Im, J.; Ogole, C. Support vector machines in remote sensing: A review. ISPRS J. Photogramm. Remote Sens. 2011, 66, 247–259. [Google Scholar] [CrossRef]
  73. Vapnik, V.N. The Nature of Statistical Learning Theory; Springer: New York, NY, USA, 1995. [Google Scholar]
  74. Rossi, C.; Spittle, S.; Bayaraa, M.; Pandey, A.; Henry, N. An earth observation framework for the lithium exploration. In Proceedings of the IGARSS 2018—2018 IEEE International Geoscience and Remote Sensing Symposium, Valencia, Spain, 22–27 July 2018; pp. 1616–1619. [Google Scholar]
  75. Pesquera, A.; Torres-Ruiz, J.; Gil-Crespo, P.P.; Velilla, N. Chemistry and genetic implications of tourmaline and Li-F-Cs micas from the Valdeflores area (Caceres, Spain). Am. Mineral. 1999, 84, 55–69. [Google Scholar] [CrossRef]
  76. Torres-Ruiz, J.; Pesquera, A.; Gil, P.P.; Casas, J. Tourmalinites and Sn-Li mineralization in the Valdeflores area (Cáceres, Spain). Mineral. Petrol. 1996, 56, 209–223. [Google Scholar] [CrossRef]
  77. Tavares, P.A.; Beltrão, N.; Guimarães, U.S.; Teodoro, A.; Gonçalves, P. Urban ecosystem services quantification through remote sensing approach: A systematic review. Environments 2019, 6, 51. [Google Scholar] [CrossRef] [Green Version]
  78. Cardoso-Fernandes, J.; Lima, A.; Roda-Robles, E.; Teodoro, A.C. Constraints and potentials of remote sensing data/techniques applied to lithium (Li)-pegmatites. Can. Mineral. 2019, 57, 723–725. [Google Scholar] [CrossRef]
  79. Rodger, A.; Cudahy, T. Vegetation corrected continuum depths at 2.20µm: An approach for hyperspectral sensors. Remote Sens. Environ. 2009, 113, 2243–2257. [Google Scholar] [CrossRef]
  80. Jet Propulsion Laboratory (JPL). ASTER: Advanced Spaceborne Thermal Emission and Reflection Radiometer. Available online: https://asterweb.jpl.nasa.gov/index.asp (accessed on 16 January 2020).
  81. Jet Propulsion Laboratory (JPL). ASTER: Instrument Characteristics. Available online: https://asterweb.jpl.nasa.gov/characteristics.asp (accessed on 16 January 2020).
  82. Jet Propulsion Laboratory (JPL). ASTER User Advisory. Available online: https://asterweb.jpl.nasa.gov/swir-alert.asp (accessed on 16 January 2020).
  83. Pour, A.B.; Hashim, M. The application of ASTER remote sensing data to porphyry copper and epithermal gold deposits. Ore Geol. Rev. 2012, 44, 1–9. [Google Scholar] [CrossRef] [Green Version]
  84. United States Geological Survey (USGS). Landsat Satellite Missions. Available online: https://www.usgs.gov/land-resources/nli/landsat/landsat-satellite-missions (accessed on 16 January 2020).
  85. United States Geological Survey (USGS). Landsat 8. Available online: https://www.usgs.gov/land-resources/nli/landsat/landsat-8 (accessed on 16 January 2020).
  86. European Space Agency (ESA). Observing the Earth: Copernicus. Available online: http://www.esa.int/Our_Activities/Observing_the_Earth/Copernicus/Overview4 (accessed on 7 March 2018).
  87. European Space Agency (ESA). Missions: Sentinel-2. Overview. Available online: https://sentinel.esa.int/web/sentinel/missions/sentinel-2/overview (accessed on 16 January 2020).
  88. European Space Agency (ESA). Radiometric Resolutions. Available online: https://earth.esa.int/web/sentinel/user-guides/sentinel-2-msi/resolutions/radiometric (accessed on 16 January 2020).
  89. United States Geological Survey (USGS). Landsat 8 Band Designations. Available online: https://www.usgs.gov/media/images/landsat-8-band-designations (accessed on 16 January 2020).
  90. Van der Meer, F.D.; van der Werff, H.M.A.; van Ruitenbeek, F.J.A. Potential of ESA’s Sentinel-2 for geological applications. Remote Sens. Environ. 2014, 148, 124–133. [Google Scholar] [CrossRef]
  91. Van der Werff, H.; Van der Meer, F. Sentinel-2 for mapping iron absorption feature parameters. Remote Sens. 2015, 7, 12635–12653. [Google Scholar] [CrossRef] [Green Version]
  92. Van der Werff, H.; Van der Meer, F. Sentinel-2A MSI and Landsat 8 OLI provide data continuity for geological remote sensing. Remote Sens. 2016, 8, 883. [Google Scholar] [CrossRef] [Green Version]
  93. Mielke, C.; Bösche, N.; Rogass, C.; Segl, K.; Gauert, C.; Kaufmann, H. Potential applications of the Sentinel-2 multispectral sensor and the Enmap hyperspectral sensor in mineral exploration. EARSeL eProceedings 2014, 13, 93–102. [Google Scholar] [CrossRef]
  94. Fal, S.; Maanan, M.; Baidder, L.; Rhinane, H. The contribution of sentinel-2 satellite images for geological mapping in the south of tafilalet Basin (Eastern Anti-Atlas, Morocco). Int. Arch. Photogramm. Remote Sens. Spat. Inf. Sci. 2019, 75–82. [Google Scholar] [CrossRef] [Green Version]
  95. Al-Nahmi, F.; Saddiqi, O.; Hilali, A.; Rhinane, H.; Baidder, L.; El arabi, H.; Khanbari, K. Application of remote sensing in geological mapping, case study Al Maghrabah Area—Hajjah Region, Yemen. ISPRS Ann. Photogramm. Remote Sens. Spat. Inf. Sci. 2017, 63–71. [Google Scholar] [CrossRef] [Green Version]
  96. Elhag, M.; Alshamsi, D. Integration of remote sensing and geographic information systems for geological fault detection on the island of Crete, Greece. Geosci. Instrum. Methods Data Syst. 2019, 8, 45–54. [Google Scholar] [CrossRef]
  97. Ge, W.; Cheng, Q.; Tang, Y.; Jing, L.; Gao, C. Lithological classification using sentinel-2A data in the shibanjing ophiolite complex in Inner Mongolia, China. Remote Sens. 2018, 10, 638. [Google Scholar] [CrossRef] [Green Version]
  98. Hu, B.; Xu, Y.; Wan, B.; Wu, X.; Yi, G. Hydrothermally altered mineral mapping using synthetic application of Sentinel-2A MSI, ASTER and Hyperion data in the Duolong area, Tibetan Plateau, China. Ore Geol. Rev. 2018, 101, 384–397. [Google Scholar] [CrossRef]
  99. DigitalGlobe Inc. Data Sheet for WorldView 3. Available online: http://content.satimagingcorp.com.s3.amazonaws.com/media/pdf/WorldView-3-PDF-Download.pdf (accessed on 16 January 2020).
  100. USGS Landsat Program. Comparison of #Landsat 7, 8, #Sentinel 2, #ASTER & #MODIS Bands. View Band Designations for All #Landsat Sensors. Available online: https://twitter.com/usgslandsat/status/837696716417687553 (accessed on 22 December 2017).
  101. Lightweight Integrated Ground and Airborne Hyperspectral Topological Solution. Available online: http://lights.univ-lorraine.fr/ (accessed on 29 January 2020).
  102. Cloutis, E.A. Review article hyperspectral geological remote sensing: Evaluation of analytical techniques. Int. J. Remote Sens. 1996, 17, 2215–2242. [Google Scholar] [CrossRef]
  103. Asadzadeh, S.; Souza Filho, C.R. A review on spectral processing methods for geological remote sensing. Int. J. Appl. Earth Obs. Geoinf. 2016, 47, 69–90. [Google Scholar] [CrossRef]
  104. Sabins, F.F. Remote Sensing Principles and Interpretation, 3rd ed.; W. H. Freeman: New York, NY, USA, 1997; p. 494. [Google Scholar]
  105. Mia, B.; Fujimitsu, Y. Mapping hydrothermal altered mineral deposits using Landsat 7 ETM+ image in and around Kuju volcano, Kyushu, Japan. J. Earth Syst. Sci. 2012, 121, 1049–1057. [Google Scholar] [CrossRef] [Green Version]
  106. Ali, A.; Pour, A. Lithological mapping and hydrothermal alteration using Landsat 8 data: A case study in ariab mining district, red sea hills, Sudan. Int. J. Basic Appl. Sci. 2014, 3. [Google Scholar] [CrossRef]
  107. Loughlin, W.P. Component analysis for alteration mapping. Photogram. Eng. Rem. Sens. 1991, 57, 1163–1169. [Google Scholar]
  108. Rowan, L.C.; Mars, J.C.; Simpson, C.J. Lithologic mapping of the Mordor, NT, Australia ultramafic complex by using the Advanced Spaceborne Thermal Emission and Reflection Radiometer (ASTER). Remote Sens. Environ. 2005, 99, 105–126. [Google Scholar] [CrossRef]
  109. Momose, A.; Miyatake, S.; Arvelyna, Y.; Nguno, A.; Mhopjeni, K.; Sibeso, M.; Muyongo, A.; Muvangua, E. Mapping pegmatite using HyMap data in southern Namibia. In Proceedings of the 2011 IEEE International Geoscience and Remote Sensing Symposium, Vancouver, BC, Canada, 24–29 July 2011; pp. 2216–2217. [Google Scholar]
  110. Oshigami, S.; Yamaguchi, Y.; Uezato, T.; Momose, A.; Arvelyna, Y.; Kawakami, Y.; Yajima, T.; Miyatake, S.; Nguno, A. Mineralogical mapping of southern Namibia by application of continuum-removal MSAM method to the HyMap data. Int. J. Remote Sens. 2013, 34, 5282–5295. [Google Scholar] [CrossRef]
  111. Ellis, R.J.; Scott, P.W. Evaluation of hyperspectral remote sensing as a means of environmental monitoring in the St. Austell China clay (kaolin) region, Cornwall, UK. Remote Sens. Environ. 2004, 93, 118–130. [Google Scholar] [CrossRef]
  112. Noi, P.T.; Kappas, M. Comparison of random forest, k-Nearest neighbor, and support vector machine classifiers for land cover classification using Sentinel-2 imagery. Sensors 2017, 18, 18. [Google Scholar] [CrossRef] [Green Version]
  113. Tavares, P.A.; Beltrão, N.E.S.; Guimarães, U.S.; Teodoro, A.C. Integration of Sentinel-1 and Sentinel-2 for Classification and LULC Mapping in the Urban Area of Belém, Eastern Brazilian Amazon. Sensors 2019, 19, 1140. [Google Scholar] [CrossRef] [PubMed] [Green Version]
  114. Pal, M.; Mather, P.M. Support vector machines for classification in remote sensing. Int. J. Remote Sens. 2005, 26, 1007–1011. [Google Scholar] [CrossRef]
  115. Oommen, T.; Misra, D.; Twarakavi, N.K.C.; Prakash, A.; Sahoo, B.; Bandopadhyay, S. An objective analysis of support vector machine based classification for remote sensing. Math. Geosci. 2008, 40, 409–424. [Google Scholar] [CrossRef]
  116. Yu, L.; Liang, L.; Wang, J.; Zhao, Y.; Cheng, Q.; Hu, L.; Liu, S.; Yu, L.; Wang, X.; Zhu, P.; et al. Meta-discoveries from a synthesis of satellite-based land-cover mapping research. Int. J. Remote Sens. 2014, 35, 4573–4588. [Google Scholar] [CrossRef]
  117. Yu, L.; Porwal, A.; Holden, E.-J.; Dentith, M.C. Towards automatic lithological classification from remote sensing data using support vector machines. Comput. Geosci. 2012, 45, 229–239. [Google Scholar] [CrossRef]
  118. Cracknell, M.J.; Reading, A.M.; McNeill, A.W. Mapping geology and volcanic-hosted massive sulfide alteration in the Hellyer–Mt Charter region, Tasmania, using Random Forests™ and Self-Organising Maps. Aust. J. Earth Sci. 2014, 61, 287–304. [Google Scholar] [CrossRef]
  119. Parakh, K.; Thakur, S.; Chudasama, B.; Tirodkar, S.; Porwal, A.; Bhattacharya, A. Machine learning and spectral techniques for lithological classification. In Proceedings of the SPIE Asia-Pacific Remote Sensing, New Delhi, India, 4–7 April 2016. [Google Scholar]
  120. Bahrambeygi, B.; Moeinzadeh, H. Comparison of support vector machine and neutral network classification method in hyperspectral mapping of ophiolite mélanges–A case study of east of Iran. Egypt. J. Remote Sens. Space Sci. 2017, 20, 1–10. [Google Scholar] [CrossRef]
  121. Latifovic, R.; Pouliot, D.; Campbell, J. Assessment of convolution neural networks for surficial geology mapping in the South Rae Geological Region, Northwest Territories, Canada. Remote Sens. 2018, 10, 307. [Google Scholar] [CrossRef] [Green Version]
  122. Géron, A. Hands-On Machine Learning with Scikit-Learn and TensorFlow: Concepts, Tools, and Techniques to Build Intelligent Systems; O’Reilly Media Inc.: Sebastopol, CA, USA, 2017; p. 568. [Google Scholar]
  123. Maxwell, A.E.; Warner, T.A.; Fang, F. Implementation of machine-learning classification in remote sensing: An applied review. Int. J. Remote Sens. 2018, 39, 2784–2817. [Google Scholar] [CrossRef] [Green Version]
  124. Li, Y.; Zhang, H.; Xue, X.; Jiang, Y.; Shen, Q. Deep learning for remote sensing image classification: A survey. Wiley Interdiscip. Rev. Data Min. Knowl. Discov. 2018, 8, e1264. [Google Scholar] [CrossRef] [Green Version]
  125. Menze, B.H.; Kelm, B.M.; Splitthoff, D.N.; Koethe, U.; Hamprecht, F.A. On oblique random forests. In Machine Learning and Knowledge Discovery in Databases; Springer: Berlin/Heidelberg, Germany, 2011; pp. 453–469. [Google Scholar]
  126. Bruzzone, L.; Chi, M.; Marconcini, M. A novel transductive SVM for semisupervised classification of remote-sensing images. IEEE Trans. Geosci. Remote Sens. 2006, 44, 3363–3373. [Google Scholar] [CrossRef] [Green Version]
  127. Sarmah, D.K. A survey on the latest development of machine learning in genetic algorithm and particle swarm optimization. In Optimization in Machine Learning and Applications; Kulkarni, A.J., Satapathy, S.C., Eds.; Springer: Singapore, 2020; pp. 91–112. [Google Scholar]
  128. Kumar, A.; Ghosh, S.K.; Dadhwal, V.K. Full fuzzy land cover mapping using remote sensing data based on fuzzy c-means and density estimation. Can. J. Remote Sens. 2007, 33, 81–87. [Google Scholar] [CrossRef]
Figure 1. (a) Donut chart showing the distribution of the documents’ language. (b) Pie chart with the distribution of the documents’ type.
Applsci 10 01785 g001
Figure 2. Co-occurrence of author and index keywords. Each circle represents a different keyword, being the size proportional to the respective number of occurrences. The color represents the average citation associated with each keyword, while the lines represent the link strength between different keywords. The minimum number of occurrences of a keyword considered was two, with 17 keywords having met the criteria.
Applsci 10 01785 g002
Figure 3. (a) Geographic distribution of the retrieved publications taking into account the affiliation country. (b) Geographic distribution of the analyzed publications considering the study area of the work. In some cases, the study area encompasses more than one country (Portugal/Spain).
Applsci 10 01785 g003
Figure 4. Comparison between ASTER, Landsat 8, Sentinel-2, and WorldView-3 bands. Adapted from USGS Landsat Program [100]. ASTER [81]: 1 green; 2 red; 3N/3B—NIR nadir-looking/NIR backward-looking; 4–9 SWIR; 10–14 TIR. Landsat-8 [89]: 1 coastal aerosol; 2 blue; 3 green; 4 red; 5 NIR; 6 SWIR 1; 7 SWIR 2; 8 Panchromatic; 9 cirrus; 10 TIRS 1; 11 TIRS 2. Sentinel-2 [88]: 1 coastal aerosol; 2 blue; 3 green; 4 red; 5, 6, 7, and 9 vegetation red edge; 8 NIR; 10 cirrus; 11 and 12 SWIR. WorldView-3 [99]: 1 coastal; 2 blue; 3 green; 4 yellow; 5 red; 6 red edge; 7 NIR 1; 8 NIR 2; 9–16 SWIR.
Applsci 10 01785 g004
Table 1. SCOPUS search results concerning publications related to Li exploration using remote sensing data and techniques.
Authors (Year)TitleCitations
Cardoso-Fernandes et al. (2019)Constraints and potentials of remote sensing data/techniques applied to lithium (Li) pegmatites-
Cardoso-Fernandes et al. (2019)Remote sensing data in lithium (Li) exploration: A new approach for the detection of Li-bearing pegmatites6
Santos et al. (2019)Remote sensing techniques to detect areas with potential for lithium exploration in Minas Gerais, Brazil-
Cardoso-Fernandes et al. (2019)Evaluating the performance of support vector machines (SVMs) and random forest (RF) in Li pegmatite mapping: Preliminary results-
Rossi et al. (2018)An earth observation framework for the lithium exploration-
Cardoso-Fernandes et al. (2018)Potential of Sentinel-2 data in the detection of lithium (Li)-bearing pegmatites: A study case4
Gemusse et al. (2018)Pegmatite spectral behavior considering ASTER and Landsat 8 OLI data in Naipa and Muiane mines (Alto Ligonha, Mozambique)1
Dai et al. (2017)Geological mapping and ore-prospecting study using remote sensing technology in Jiajika area of Western Sichuan Province1
Lefevre (1982)Remote sensing of geobotanical anomalies in mineral exploration: a Landsat 1 processing methodology - Echassieres, Allier, France-
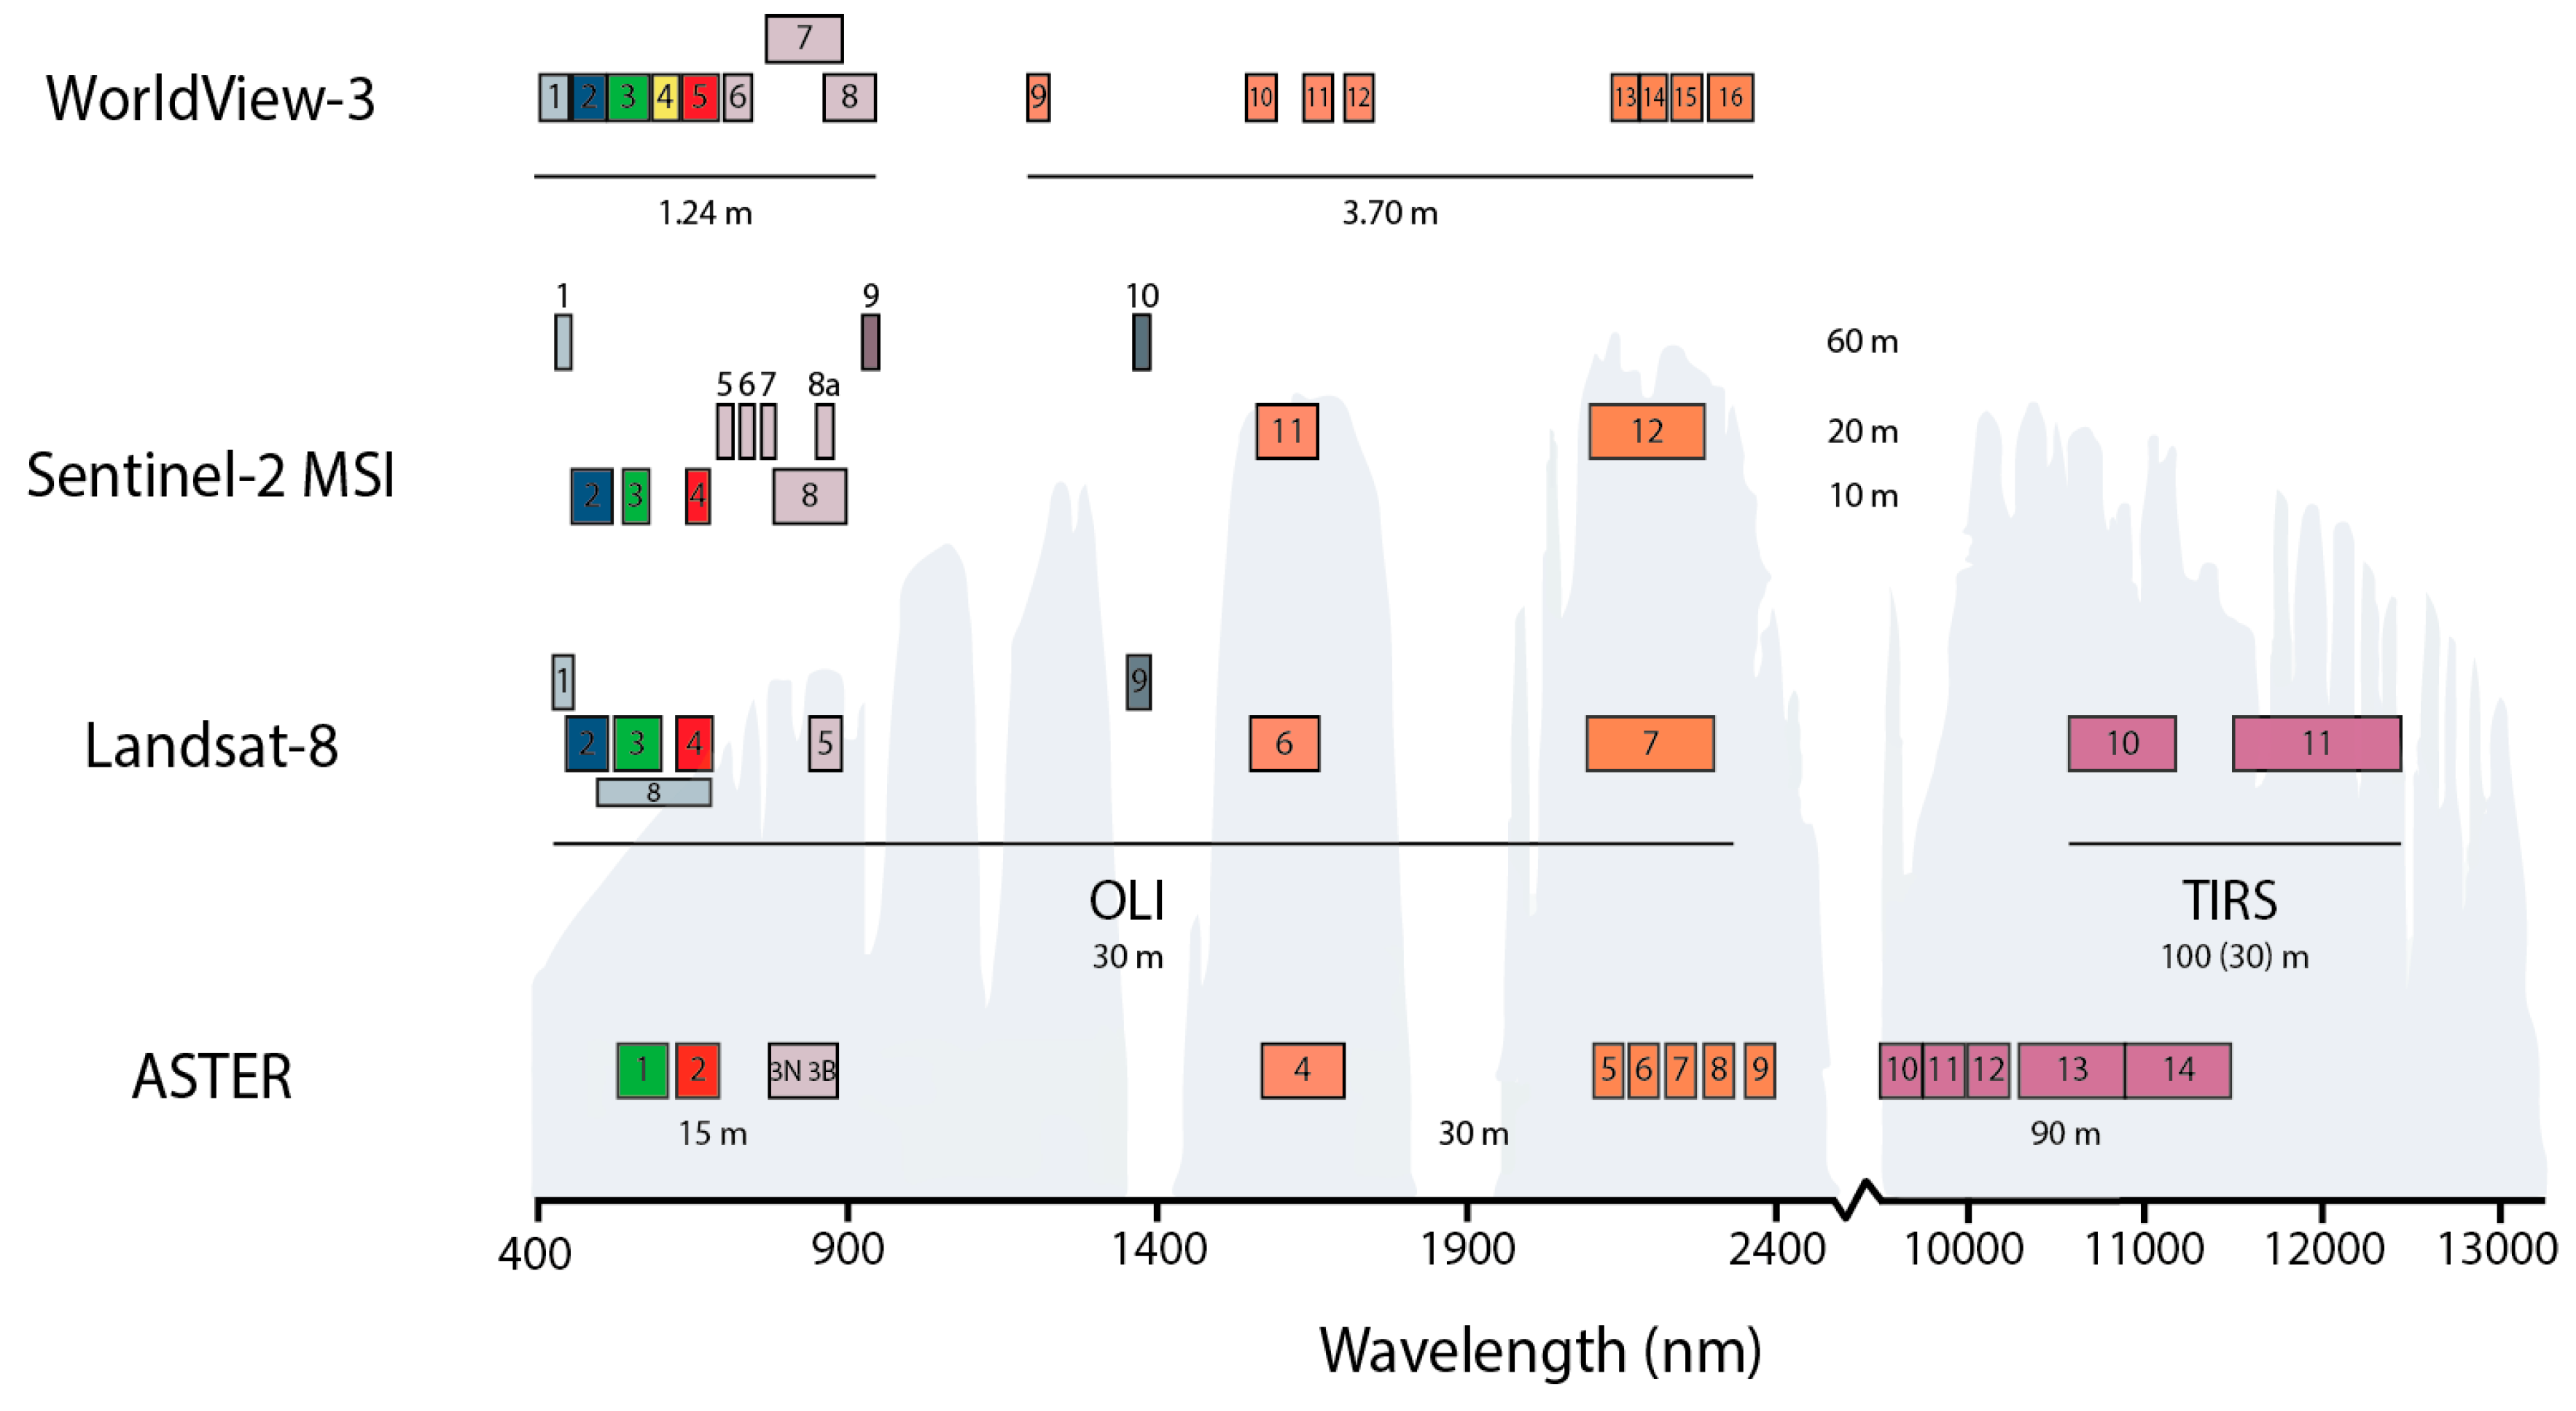
Table 2. Characteristics of sensors with potential for remote sensing of Li deposits [81,85,88,89].
Sensor NameSpectral Region (µm)Nr. of BandsSpatial Resolution (m)
VNIRSWIRTIRVNIRSWIRTIR
Landsat-8 OLI/TIRS0.43–0.881.57–2.2910.60–12.51113030100
ASTER0.52–0.861.60–2.438.13–10.9514153090
Sentinel-2 MSIA0.42–0.941.52–2.38-121020-
B0.42–0.941.52–2.37
WorldView-30.40–1.041.20–2.37-161.243.70-

