Acoustic Emission Burst Extraction for Multi-Level Leakage Detection in a Pipeline


1
School of Electrical, Electronics and Computer Engineering, University of Ulsan, Ulsan 44610, Korea
2
Department of Computer Engineering, Chonnam National University, Gwangju 61186, Korea
*
Author to whom correspondence should be addressed.
Appl. Sci. 2020, 10(6), 1933; https://0-doi-org.brum.beds.ac.uk/10.3390/app10061933
Submission received: 18 February 2020
/
Revised: 3 March 2020
/
Accepted: 8 March 2020
/
Published: 12 March 2020
(This article belongs to the Special Issue Machine Fault Diagnostics and Prognostics)
Abstract
:Acoustic emission bursts are signal waveforms that include a number of consecutive imbrication transients with variable strengths and contain crucial information on the leakage phenomenon in a pipeline system. Detection and isolation of a burst against the background signal increases the ability of a pipe’s fault diagnosis system. This paper proposes a methodology using the Enhanced Constant Fault Alarm Rate (ECFAR) to detect bursts and exploit the burst phenomenon in acoustic emission. The extracted information from the burst waveform is used to distinguish several levels of leakage in a laboratory leak-off experimental testbed. The multi-class support vector machine in the one-against-all method is established as the classifier. The results are compared with those of the wavelet threshold-based method, another algorithm utilized for impulse and burst detection, which indicates that the ECFAR method gives an ameliorative classification result with an accuracy of 93% for different levels of leakage.
1. Introduction
Municipal piping systems are widely used to supply gas or water for daily activities. Such systems have become nationally important assets in large-scale industry for conveying different types of fluids—such as oil, petroleum, and chemicals—over a long distance. Even though the pipeline system is designed and installed to industrial standards, the fault could happen due to long-lasting use, corrosion, or error in material, which generate the impending leakage [1,2]. A pipeline leak not only causes economic loss, but also poses safety and environmental risks. Since leaks are inevitable, monitoring the condition of the pipelines and life-cycle maintenance have obtained considerable attention over the past years.
Several methodologies have been proposed for leak detection in pipeline systems, including fiber optic, electromagnetic, visual inspection, and acoustic emission [3,4,5]. Recently, acoustic emission (AE) has been demonstrated to be effective for leakage detection due to advances in data acquisition and processing speeds required to handle the vast amount of signals gathered [6,7]. Furthermore, AE sensors provide enough sensitivity to instantly identify any abnormal state in pipelines. AE-based methods have been employed in numerous studies to detect leaks by modeling them as classification problems [8,9,10,11]. These data-driven approaches are reasonable because the AE signal from leakage is non-stationary and becomes difficult to find in an explicit model for leak detection. However, when the leak occurs at different positions in a pipeline, it would return dissimilar AE sensor signals due to the wave dispersion principle [12]. In addition, the wave attenuation depends on the frequency [13], and the AE signals will be distorted by their own propagation as well as the influence of ambient noise. To address this problem, de-noising and decomposition techniques were applied to search the most intrinsic components related to leakage syndromes for individual sensors, because AE signal is not complete after it is analyzed in the time–frequency domain compared with the original signal recorded from sensors. Thus, the analyzed signals differ from each other in the case of the leak’s position changing. Consequently, classifiers that mine knowledge from separate signal channels would result in misclassification.
As leakage occurs, the leaking fluids have a turbulent flow; due to impact force around the leak point, this stress induces a detectable acoustic wave inside a duct that propagates along its length [14]. When a solid wall of the pipe is stimulated by an impact, it generates a dynamic vibration, which is represented by corresponding movement equations. The exhaustion of fluid generates an AE signal that causes radial vibration. The AE sensors attached on the outside of the pipe can detect an internal pipeline signal. Some research has been performed to analyze the AE characteristics of the source signal, propagation of the wave along the pipeline, and the relationships of the AE signal with various parameters, such as flow rate, propagating distance, material, and operating conditions [15,16]. The knowledge obtained via pipe wall stimulation by AE springing from leakage is a skeleton key for fault detection and locating the leak position. However, signals from the leak are non-stationary and are unavoidably contaminated with non-leak sounds. The leak signal that emerges from an abrupt change in flow through a perforation conventionally includes transient bursts. Bursts usually come from abnormal points—such as bending segments, cracks, or leaks—or collisions inside the pipeline. The arrival time and the amplitude of bursts vary with their strength and the location of their source. Therefore, such bursts can provide information about the leak [17]. During detection of a burst event, it is also important to calculate the time difference in arrival between the sensors, which helps to localize the leak position. The value can be computed by a cross-correlation function, but it is strongly dependent on the chosen wave propagation model and background noise [18,19,20]. Therefore, burst isolation and correct analysis of this AE wave have become methods to acquire useful information. In earlier studies, wavelet analysis has also been used to recognize the transient bursts in pressure signals for water pipelines [21,22,23]. The approaches in [22,23] used the wavelet decomposition and empirical mode decomposition to enhance leakage detection by eliminating uncorrelated components of leak signals. Unfortunately, the wave attenuation and noise presence distort the AE signal, and thus these methods cannot provide a high enough performance, since most of the intrinsic components, which are decomposed relate to the remains of leak signals attenuated. To reduce the rate of error that occurs in the delayed time estimation and improve the localization accuracy of the algorithm, a critical issue existing in the AE fault detection system is to identify the leakage signal without providing false alarms. Previously, the constant fault alarm rate (CFAR) was used for object detection in the doppler radar system [24]. However, the modeling of bursts and impulses of AE signal in the role of objects which need to be detected by the CFAR, has not yet been studied.
The objective of this paper is to identify the characteristics of this dispersive AE wave by detecting the impulse and burst events related to leakage, and to isolate the burst waveform by the Enhance Constant Faults Alarm Rate (ECFAR) algorithm. Investigating the characteristics of bursts will help to distinguish the different levels of leak signal.
The remainder of this paper is outlined as follows. Section 2 introduces the data acquisition system and the recorded AE dataset, which are used to evaluate the proposed algorithm. Section 3 provides detail on pipeline burst and event detection techniques using ECFAR. Section 4 presents the evaluation result of the detection techniques, including the performance of classification of multi-level leakage. Finally, Section 5 draws conclusions and areas for future work.
2. Experimental Setup and Data Acquisition
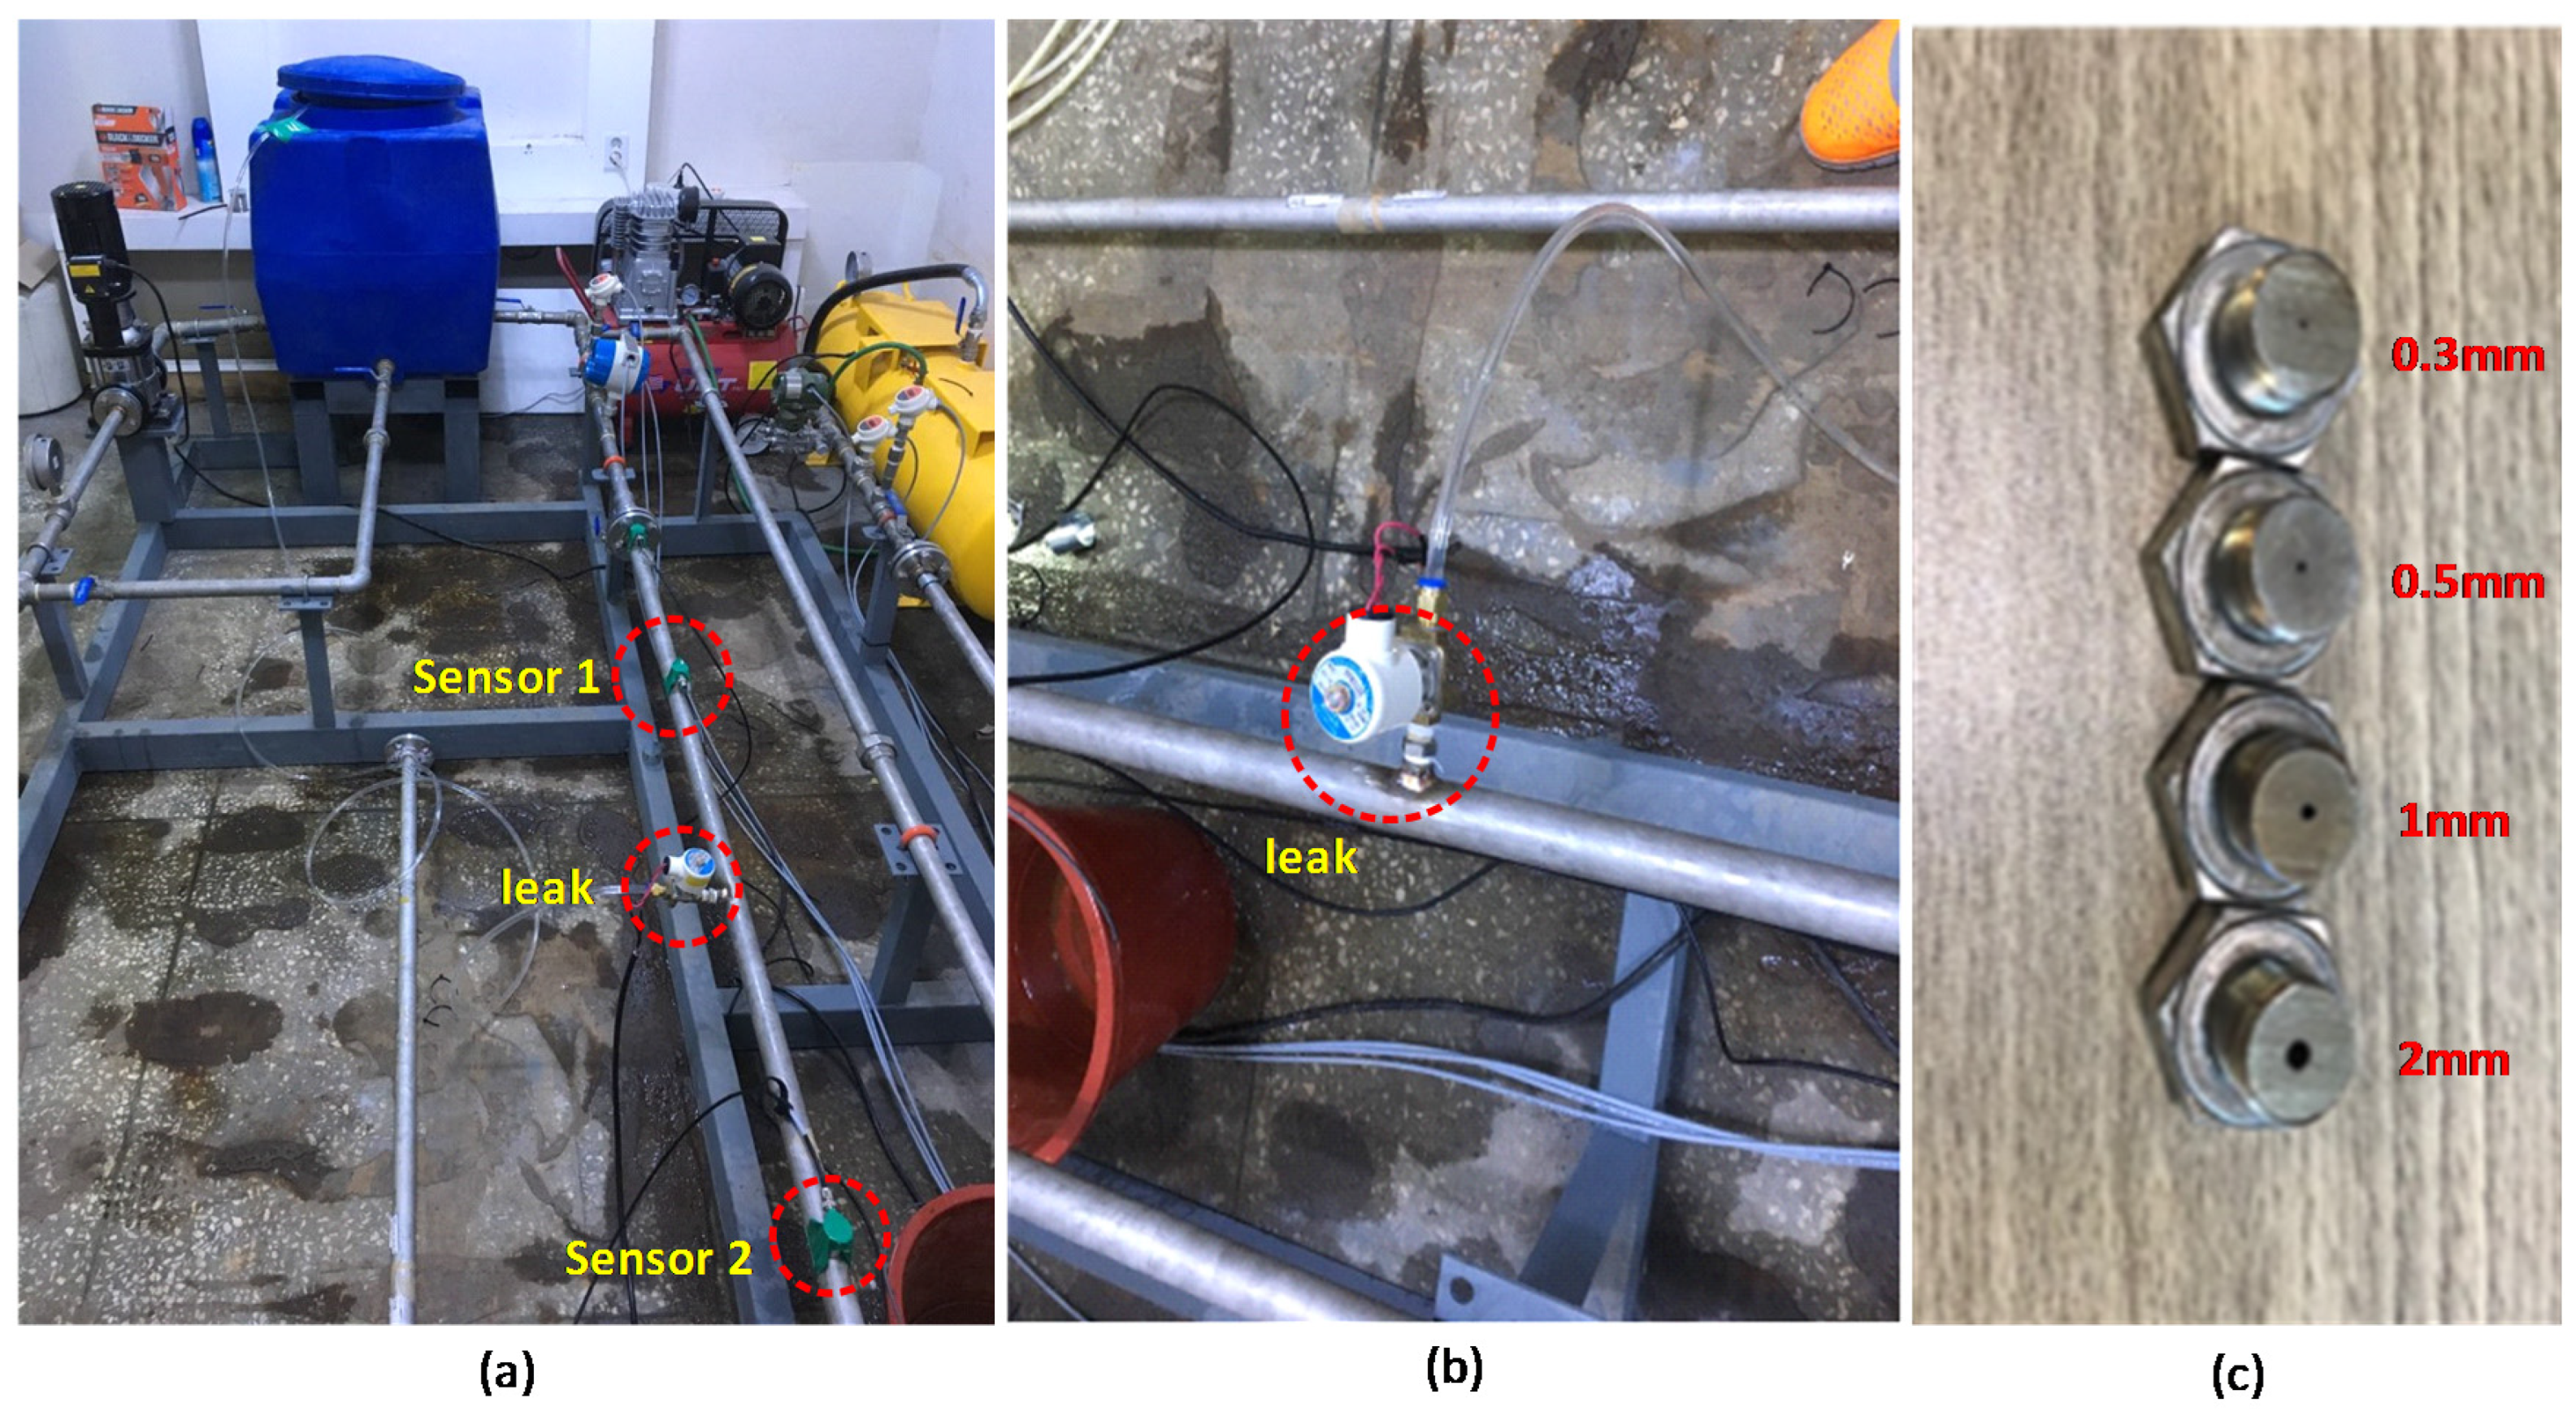
To simulate leakage in a piping system, a specific testbed was elaborately designed, as illustrated in Figure 1. Two ductile iron pipe testing sections of 2 m length, 34 mm outside diameter, and 3.38 mm wall thickness were employed. At each end of the segment, a blind flange was fitted to connect the section to the remaining part of the system. A water circulatory system was constructed to mimic the operational state of the pipeline and included a water tank and pump. The water from the tank was driven by the pump and flowed through the pipeline and test section and then returned to the tank. Two regulators and pressure meters were located on either end of the test section to adjust and record the pressure of the flow inlet and outlet, respectively. Two flow transmitters were also installed at each end of the test segment to measure the flow rate. The leakage was simulated by a drill hole. In this study, the four levels of leak were 2, 1, 0.5, and 0.3 mm, as shown in Figure 1c. The solenoid valve was used to control the leak state, as illustrated in Figure 1b.
The AE sensor system utilized in the test was composed of a data acquisition card along with a peripheral component interconnect bus (PCI-2) [25], which could interface with the piezoelectric WDI-AST wideband differential sensors [26] from MISTRAS corporation to measure the AE signal generated by the turbulent flow once the leak occurred. A detailed view of the data acquisition devices is shown in Table 1. On top of the pipe, two AE sensors were installed by adhesive types. The internal pressure at the inlet was first stabilized at 1.77 bar by adjusting the regulators at both ends of the test section. The experiments were conducted at a stable temperature of approximately 30 °C. The flow rate of water in the pipeline was maintained as a constant of 7 m3/h during the measurement process by a pump. The signal was recorded with a 1 MHz sampling rate. The captured signals were then amplified and filtered using a signal conditioning unit to provide the appropriate signal-to-noise ratio for further processing.
Vibration sensors were also used to measure leak signals in the test section. For vibration recording, accelerometer-type sensors were used. For each level of leakage, the normal and the leak state refer to the valve at the position of closed or opened, respectively. First, the pump is operated and the leak is deactivated—valve closed. The normal AE signal is recorded over time as the baseline for comparison. Later, the valve is opened, activating a leak. The acquisition device waits until the flow is stable and then begins to record the abnormal signal.
3. The Proposed Methodology of ECFAR for Burst Detection and Pipeline Fault Diagnosis
3.1. Burst Detection Use Enhance Constant Fault Alarm Rate
Most of these AE events can be observed as transients in the continuous AE signal within a time scale of milliseconds to seconds. Burst events result in an instant change in fluid, producing consecutively transient peaks that are overlapping and have different lengths. Transients in AE signals recorded from the complex systems are often difficult or even impossible to separate using the accustomed threshold approaches. Several reasons for this have been proposed, such as the fluctuation amplitude of the continuous signal in a period of a loading cycle and overlapping of impulses, which can be concurrently released from the different AE sources in the pipe wall material. These transients have different shapes, durations, strengths, and frequencies. Consequently, as the complexity of the collected signal increases, more advanced processing methods are used to separate these impulses.
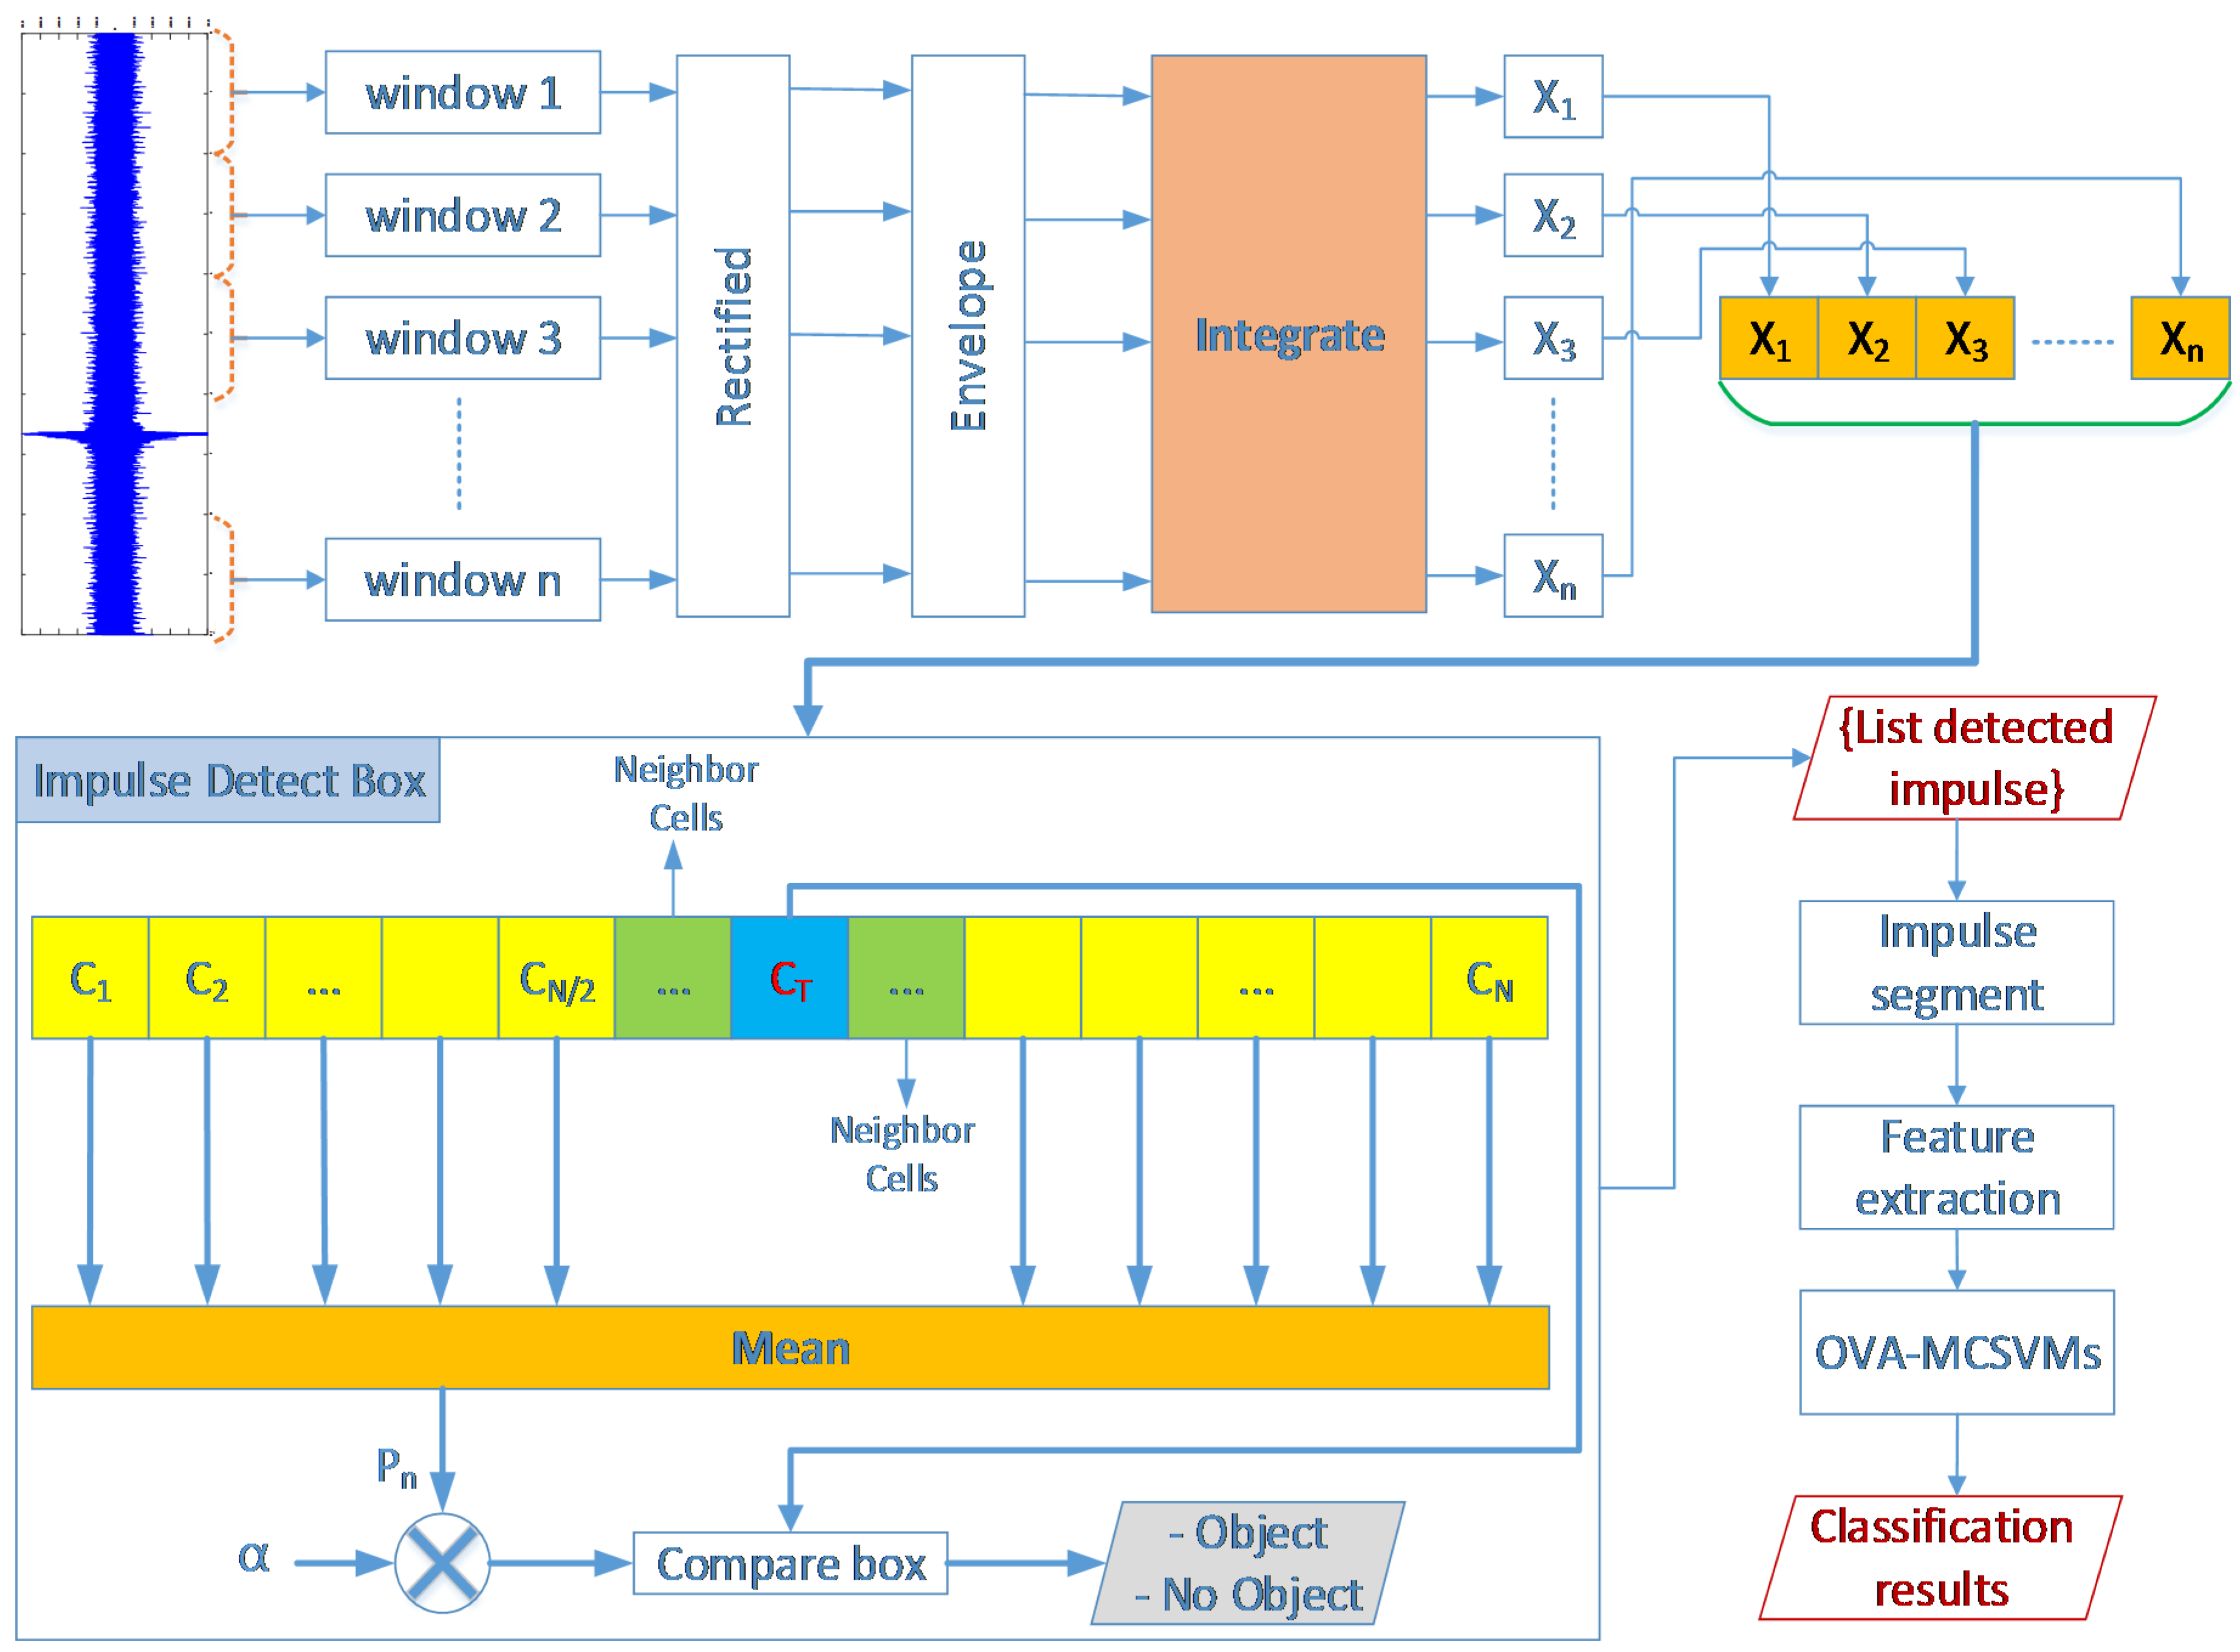
In this study, we defined the transient events—like the salient objects, which require detection—against the background signal levels. To adapt to the noise level, ECFAR algorithms were used to calculate an adaptive threshold due to the estimated noise floor. This threshold was automatically updated according to the measured acoustic emission signals. In a real measurement, the presence of noise with unknown power may cause many false alarms if the threshold value chosen is too low. Conversely, if it is set too high, fewer objects will be detected. The process utilizes a statistical analysis which assures burst and impulse detection with a constant false alarm rate. The ECFAR procedure should provide an output that is adapted to the noise floor and ensures that the number of false alarms does not depend on the noise power. The ECFAR algorithms are forced to reach a specified false alarm rate. The threshold is the value that must be exceeded to be identified as an object. The assumed noise model is a zero-mean complex-valued Gaussian random variable that is independently and identically distributed. To find an adaptive threshold for the given noise model, the noise power has to be estimated. Impulse detection is announced if the signal amplitude passes over this threshold. The threshold is established by estimating the noise level in the reference window consisting of N values. The impulse detection threshold is determined by scaling the estimated noise level with a factor to achieve a desirable probability of false alarm. The principle of the algorithm is shown in Figure 2.
In general, the threshold is an equation of both the probability of detection as the estimated noise level and the probability of false alarm. The impulse detection threshold is specified by
where is the estimated noise power, and is a scaling constant called the threshold factor. From the expression, the threshold adapts to the changing data. It can depict that, with the appropriate threshold factor , the required probability of false alarm can be kept at an invariable value. The entire signal is divided into a series of consecutive windows. The noise power estimate can be computed in each window as
where is window size, and is the sample in a window and is considered as the cells. The mean over the reference windows consisting of values presents the background noise estimation of this algorithm. Because the peaks are not located at one cell, but rather extend across a range of cells, the reference window is not placed nearby the test cell . Those cells that are directly next to are called neighbor cells. In addition, is a constant for each cell and is evaluated depending on window size as well as the given probability of a false alarm . With the above detector, we assume the data input into the detector is from a single pulse; thus, with no pulse integration, the threshold factor can be shown as
where is the required false alarm rate. If the value in the cell exceeds the threshold value , the comparator declares that an impulse is located in the cell . The is chosen to satisfy the Neyman–Pearson theorem for detection [27]
where the is the likelihood ratio, which is defined as . and stand for the absence of impulse and for its presence hypothesis, respectively, and is the probability density function.
Instead of using the raw signal from the sensor, which has a high level of noise, we proposed a pre-processing method in which the integrated signal was used as the input to the impulse detector algorithm. First, the rectification and Hilbert–Huang transform were used to convert the signal segments into the analytic form. The envelope signal was received by simply taking the modulus of the analytic signal. Then, the integrated process was employed. The integrated signal had a response similar to the power variation in the signal. Therefore, the method was sensitive to the sudden variation in the signal created by the impulse.
3.2. Leakage Detection for Pipeline with One-Versus-All Multiclass Support Vector Machine
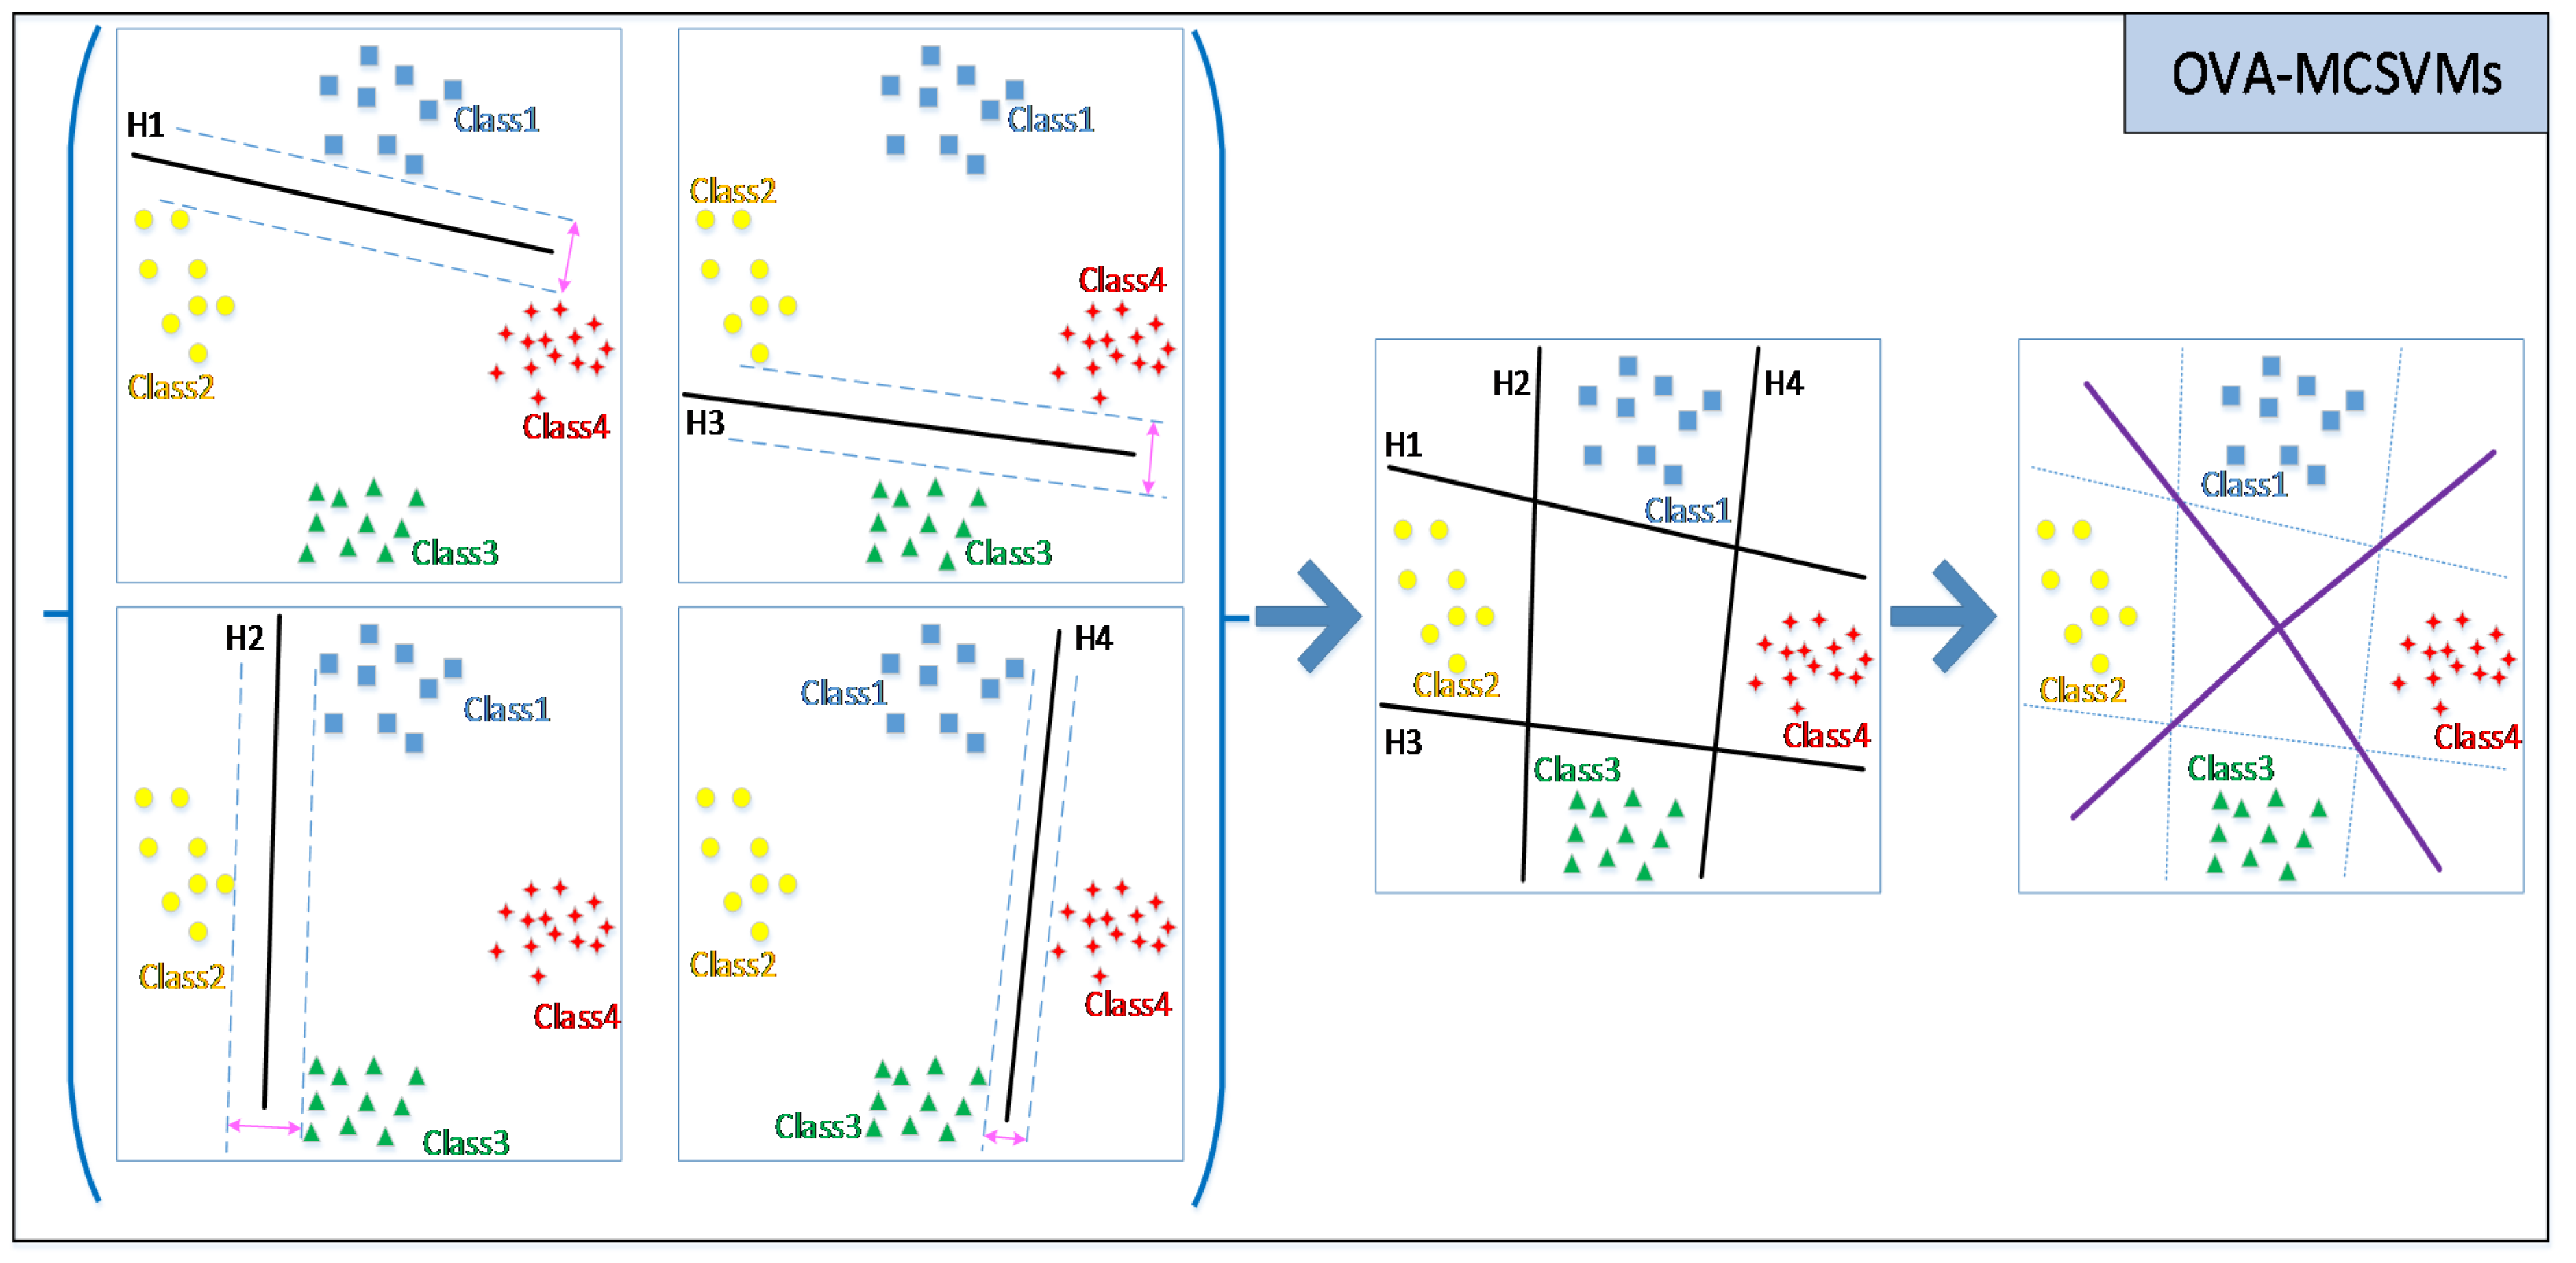
On the other hand, AE signals supply intrinsic information about mechanical characteristics of the object. To increase the reliability of the pipeline feature extraction method, traditional features were considered together with typical statistical features. For the AE burst features, the peak amplitude, duration, hit counts, and Measured Area under the Rectified Signal Envelope (MARSE) energy of the burst segment signal were calculated. In addition, statistical features such as root mean square, entropy, kurtosis, and skewness of the signal were also extracted from the time-domain. The extracted features were stored in n-dimensional matrix data structures. Afterward, to classify the features into respective classes, a one-versus-all multi-class support vector machine (OVA-MCSVMs) was utilized [28,29]. This strategy constructs -SVMs as a sequence of binary classifiers, where the -SVM classifier, (), is trained against all the other classes. In the testing stage of this approach, a classifier is considered to be a winner if it gives the decision output with maximum value. The obtained decision boundaries for an example of four classes are illustrated in Figure 3. For each classifier, the SVM finds the largest margin-width hyperplane which separates the two classes in the n-dimensional feature space. For instance, consider a given training set of sample-label pairs where is the feature vector in n-dimension space and is the label. The generalized solution is obtained by solving the optimize problem in dual form by using Lagrangian multipliers.
Here, and are two Lagrangian multipliers, is a penalty coefficient, and is the kernel function.
The SVM was trained on a number of samples representing the normal state and leaks of various sizes in the pipeline monitoring system. This classifier machine could not only enhance the capability of distinguishing between classes, but could also accurately recognize the current state of a pipeline. According to specific engineering problems, the Gaussian radial basis kernel (RBF) was selected as the kernel function, and the hyperparameter of the SVMs could be obtained by the grid search algorithm corresponding to the maximum classification accuracy.
4. Pipeline Fault Experiment Results Analysis
Figure 4 shows an example of the AE signal collected from two cases of normal and 0.3 mm leak. The signal from the 0.3 mm drill hole shows more appearance of bursts than the normal case does because of the turbulent flow from the leakage position. Considering four different leak levels—including a 2, 1, 0.5, and 0.3 mm drill hole—for the leak-off testbed system set up, each type of fault signal is applied to the burst detector to determine the burst segment signals. Then, the features are extracted from the burst segment and input to the classifier.
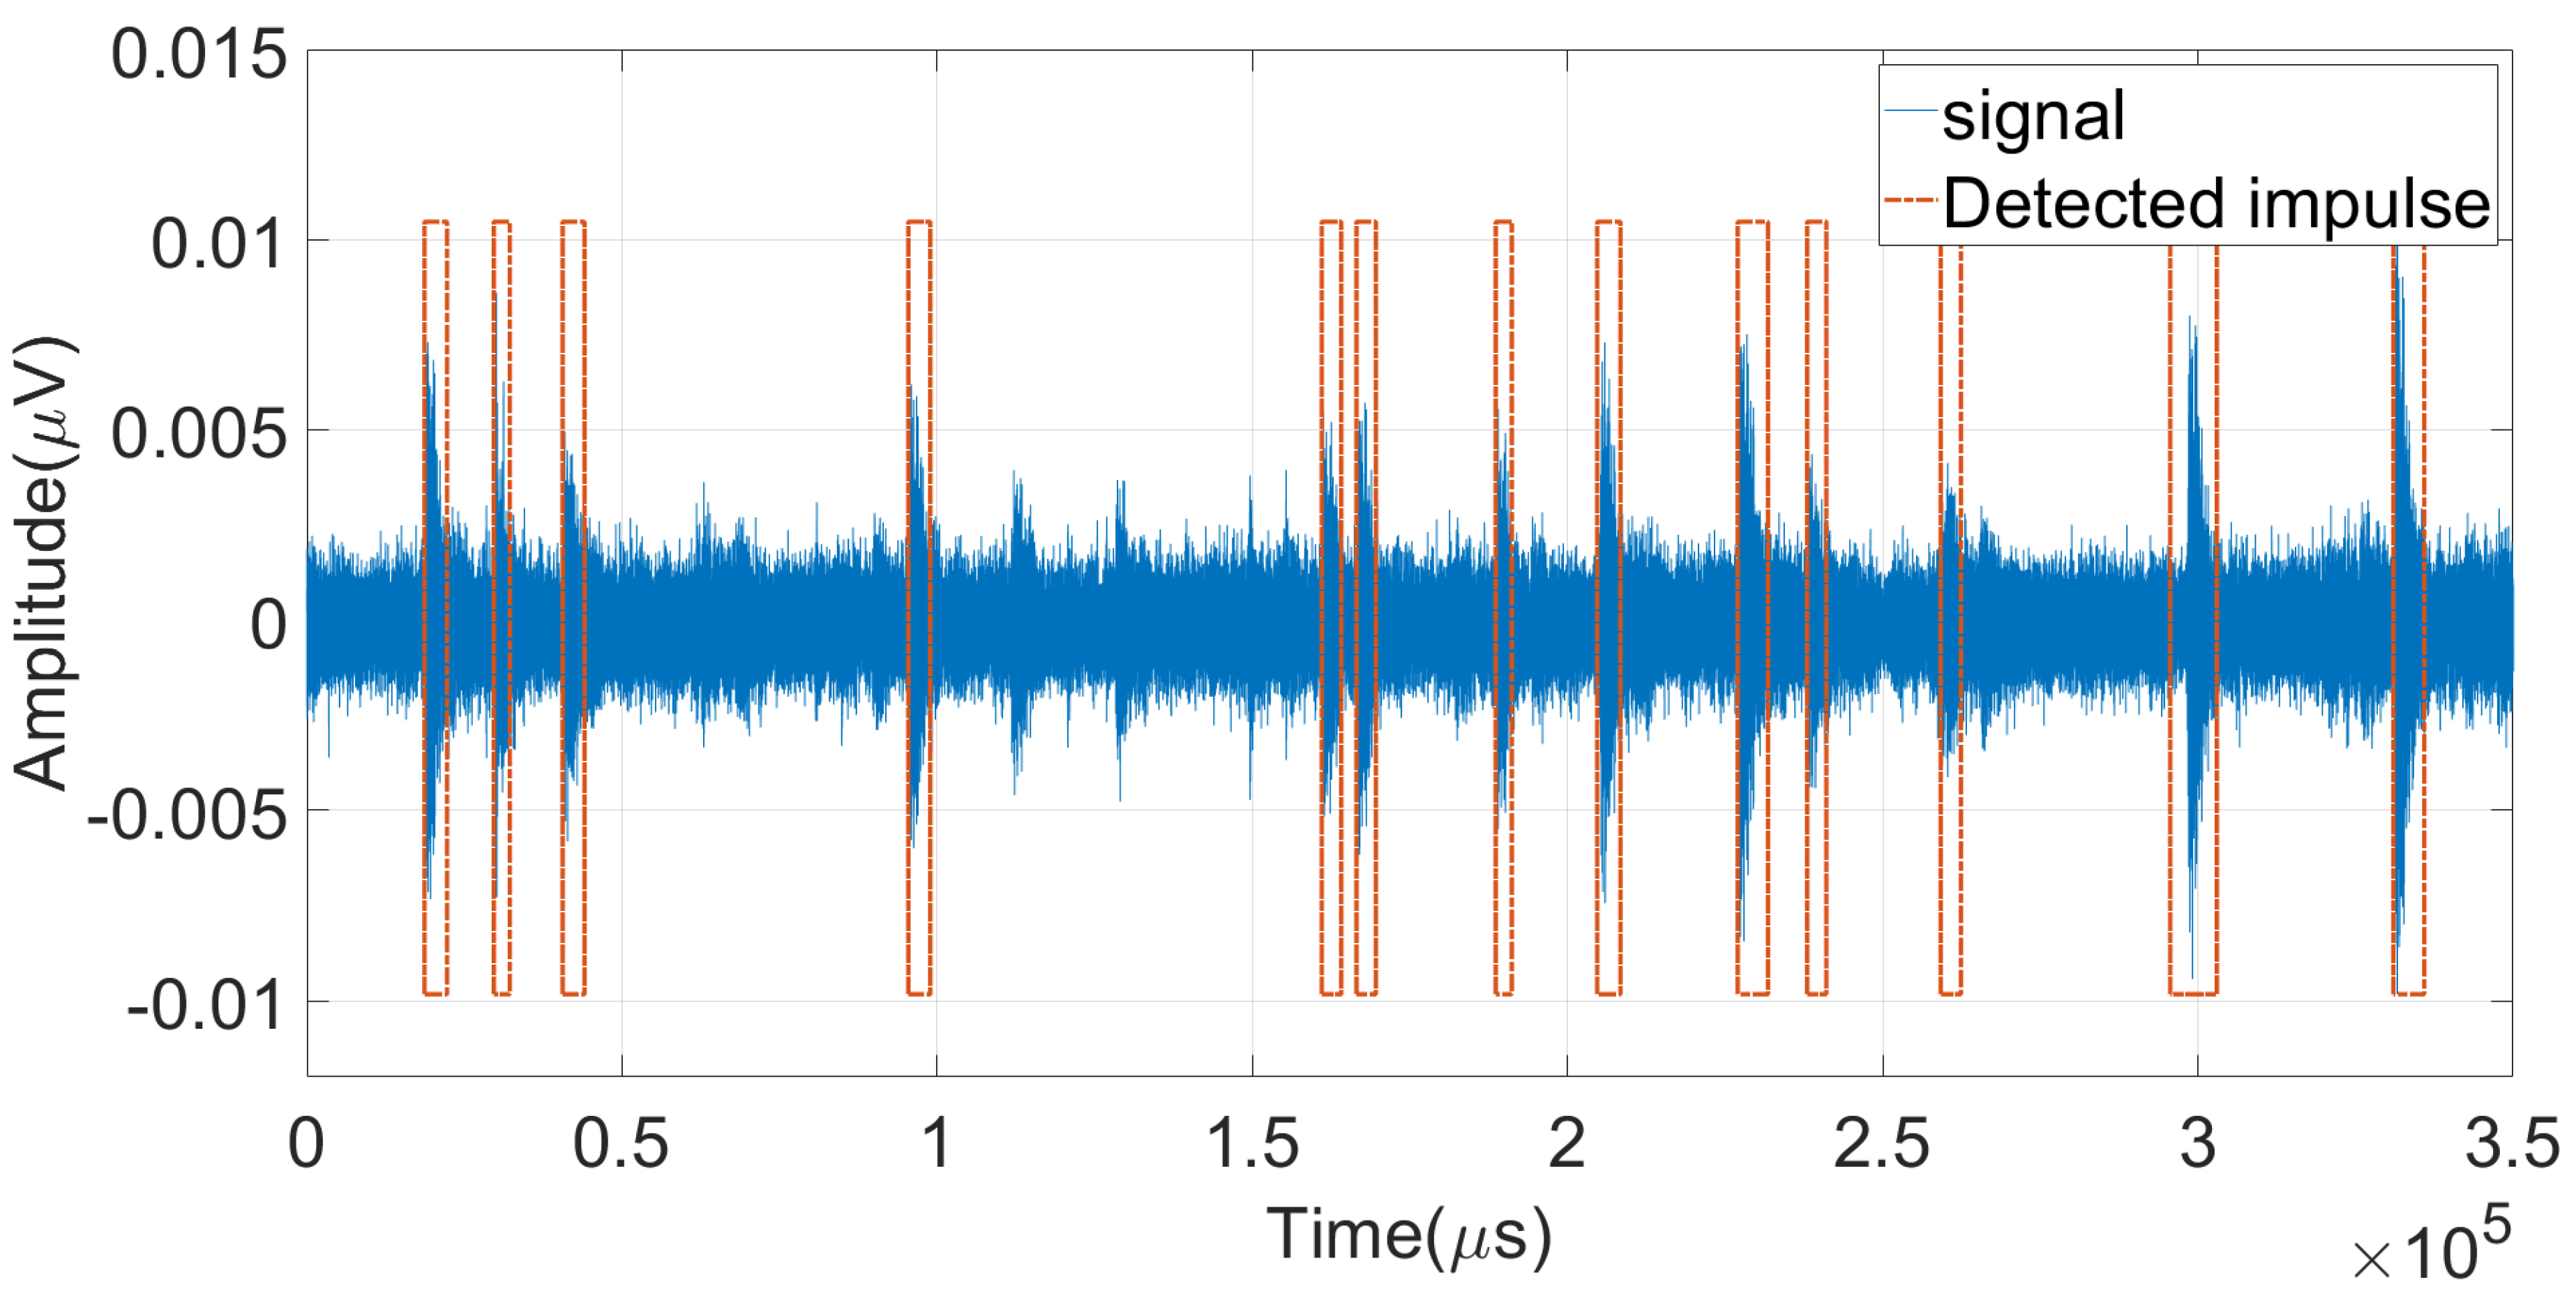
Figure 5 depicts the result of the proposed burst detection algorithm with the leakage signal segment. It is observed that the ECFAR can detect most of the bursts or impulses which occur in the signal. Since the threshold from the ECFAR detector is more adaptive to the noise, it can efficiently detect the true impulses.
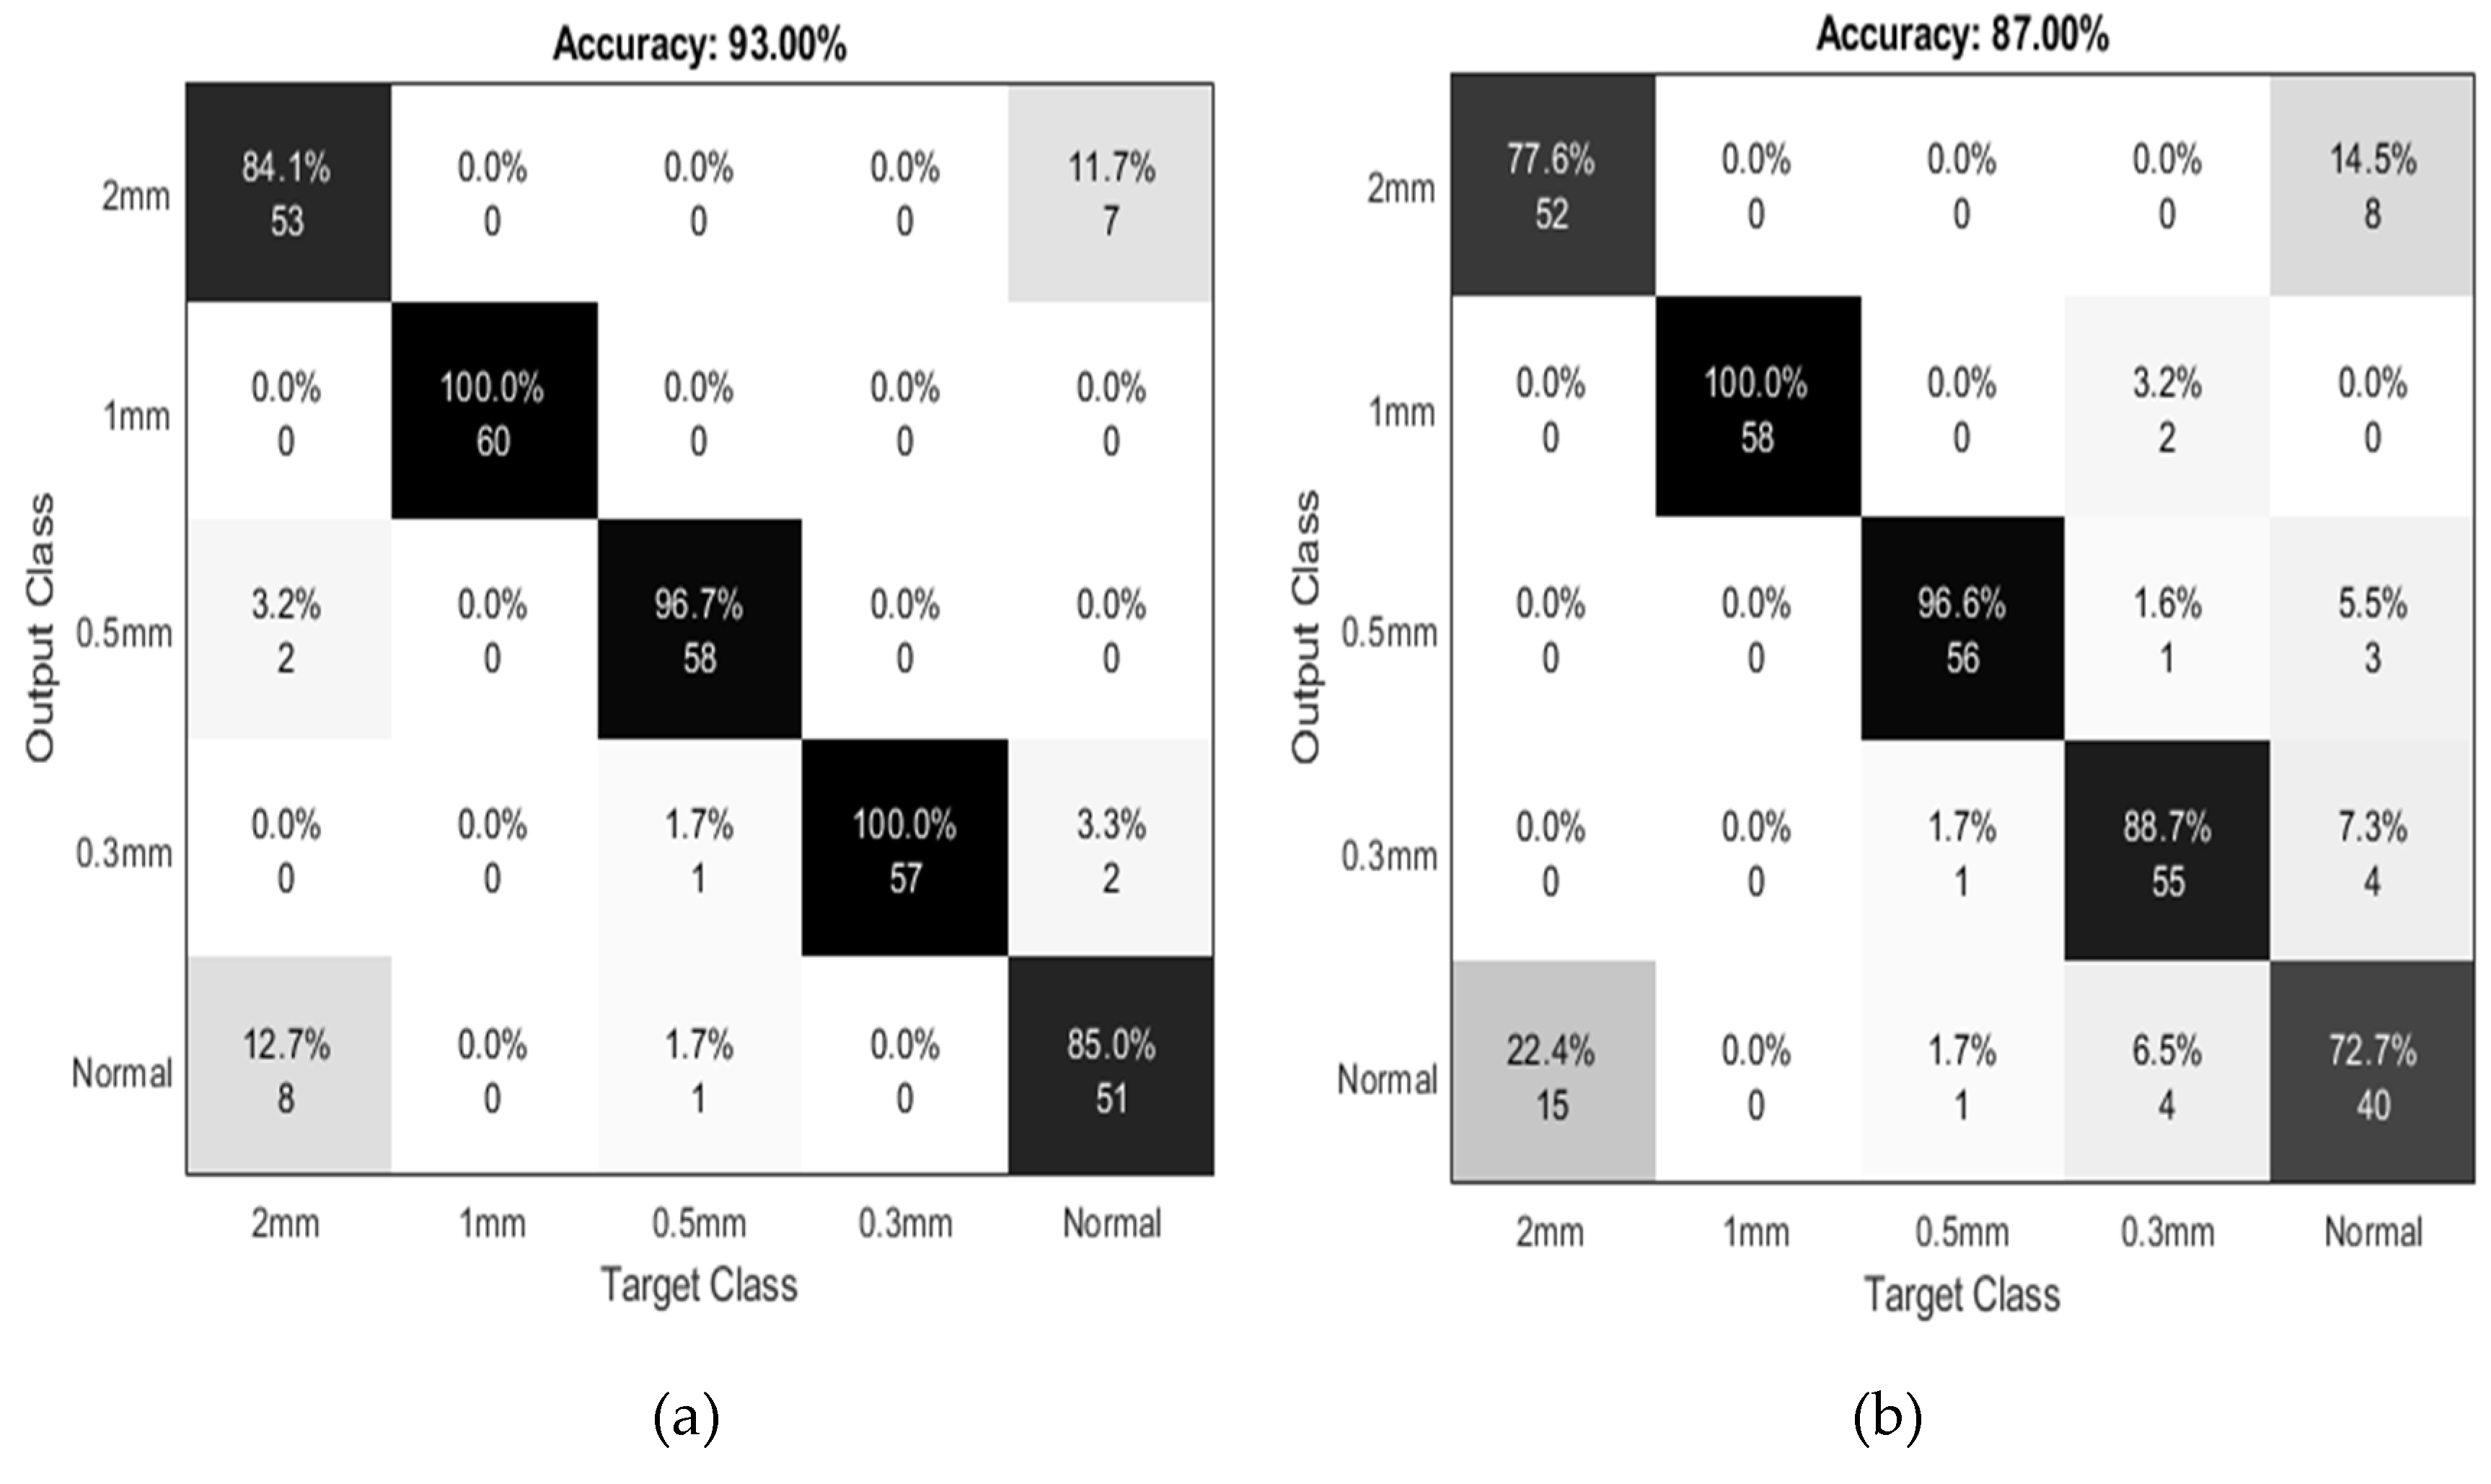
The classification result is shown in Figure 6a with the confusion matrix for evaluating the accuracy of the OVA-MCSVMs classification of the proposed method. As shown in Figure 6a, the mean accuracy of the classifying algorithm is 93%. For comparison, the research also employs the wavelet threshold for burst detection. The wavelet threshold is another algorithm utilized for impulse and burst detection, as described in [21]. After the impulse detection stage, the same process of feature extraction and classification is applied to the burst waveform. The results of the leakage signal classification, using the wavelet threshold as the method of burst detection, are shown in Figure 6b. The results show that the proposed method using ECFAR renders better results in comparison to the wavelet threshold.
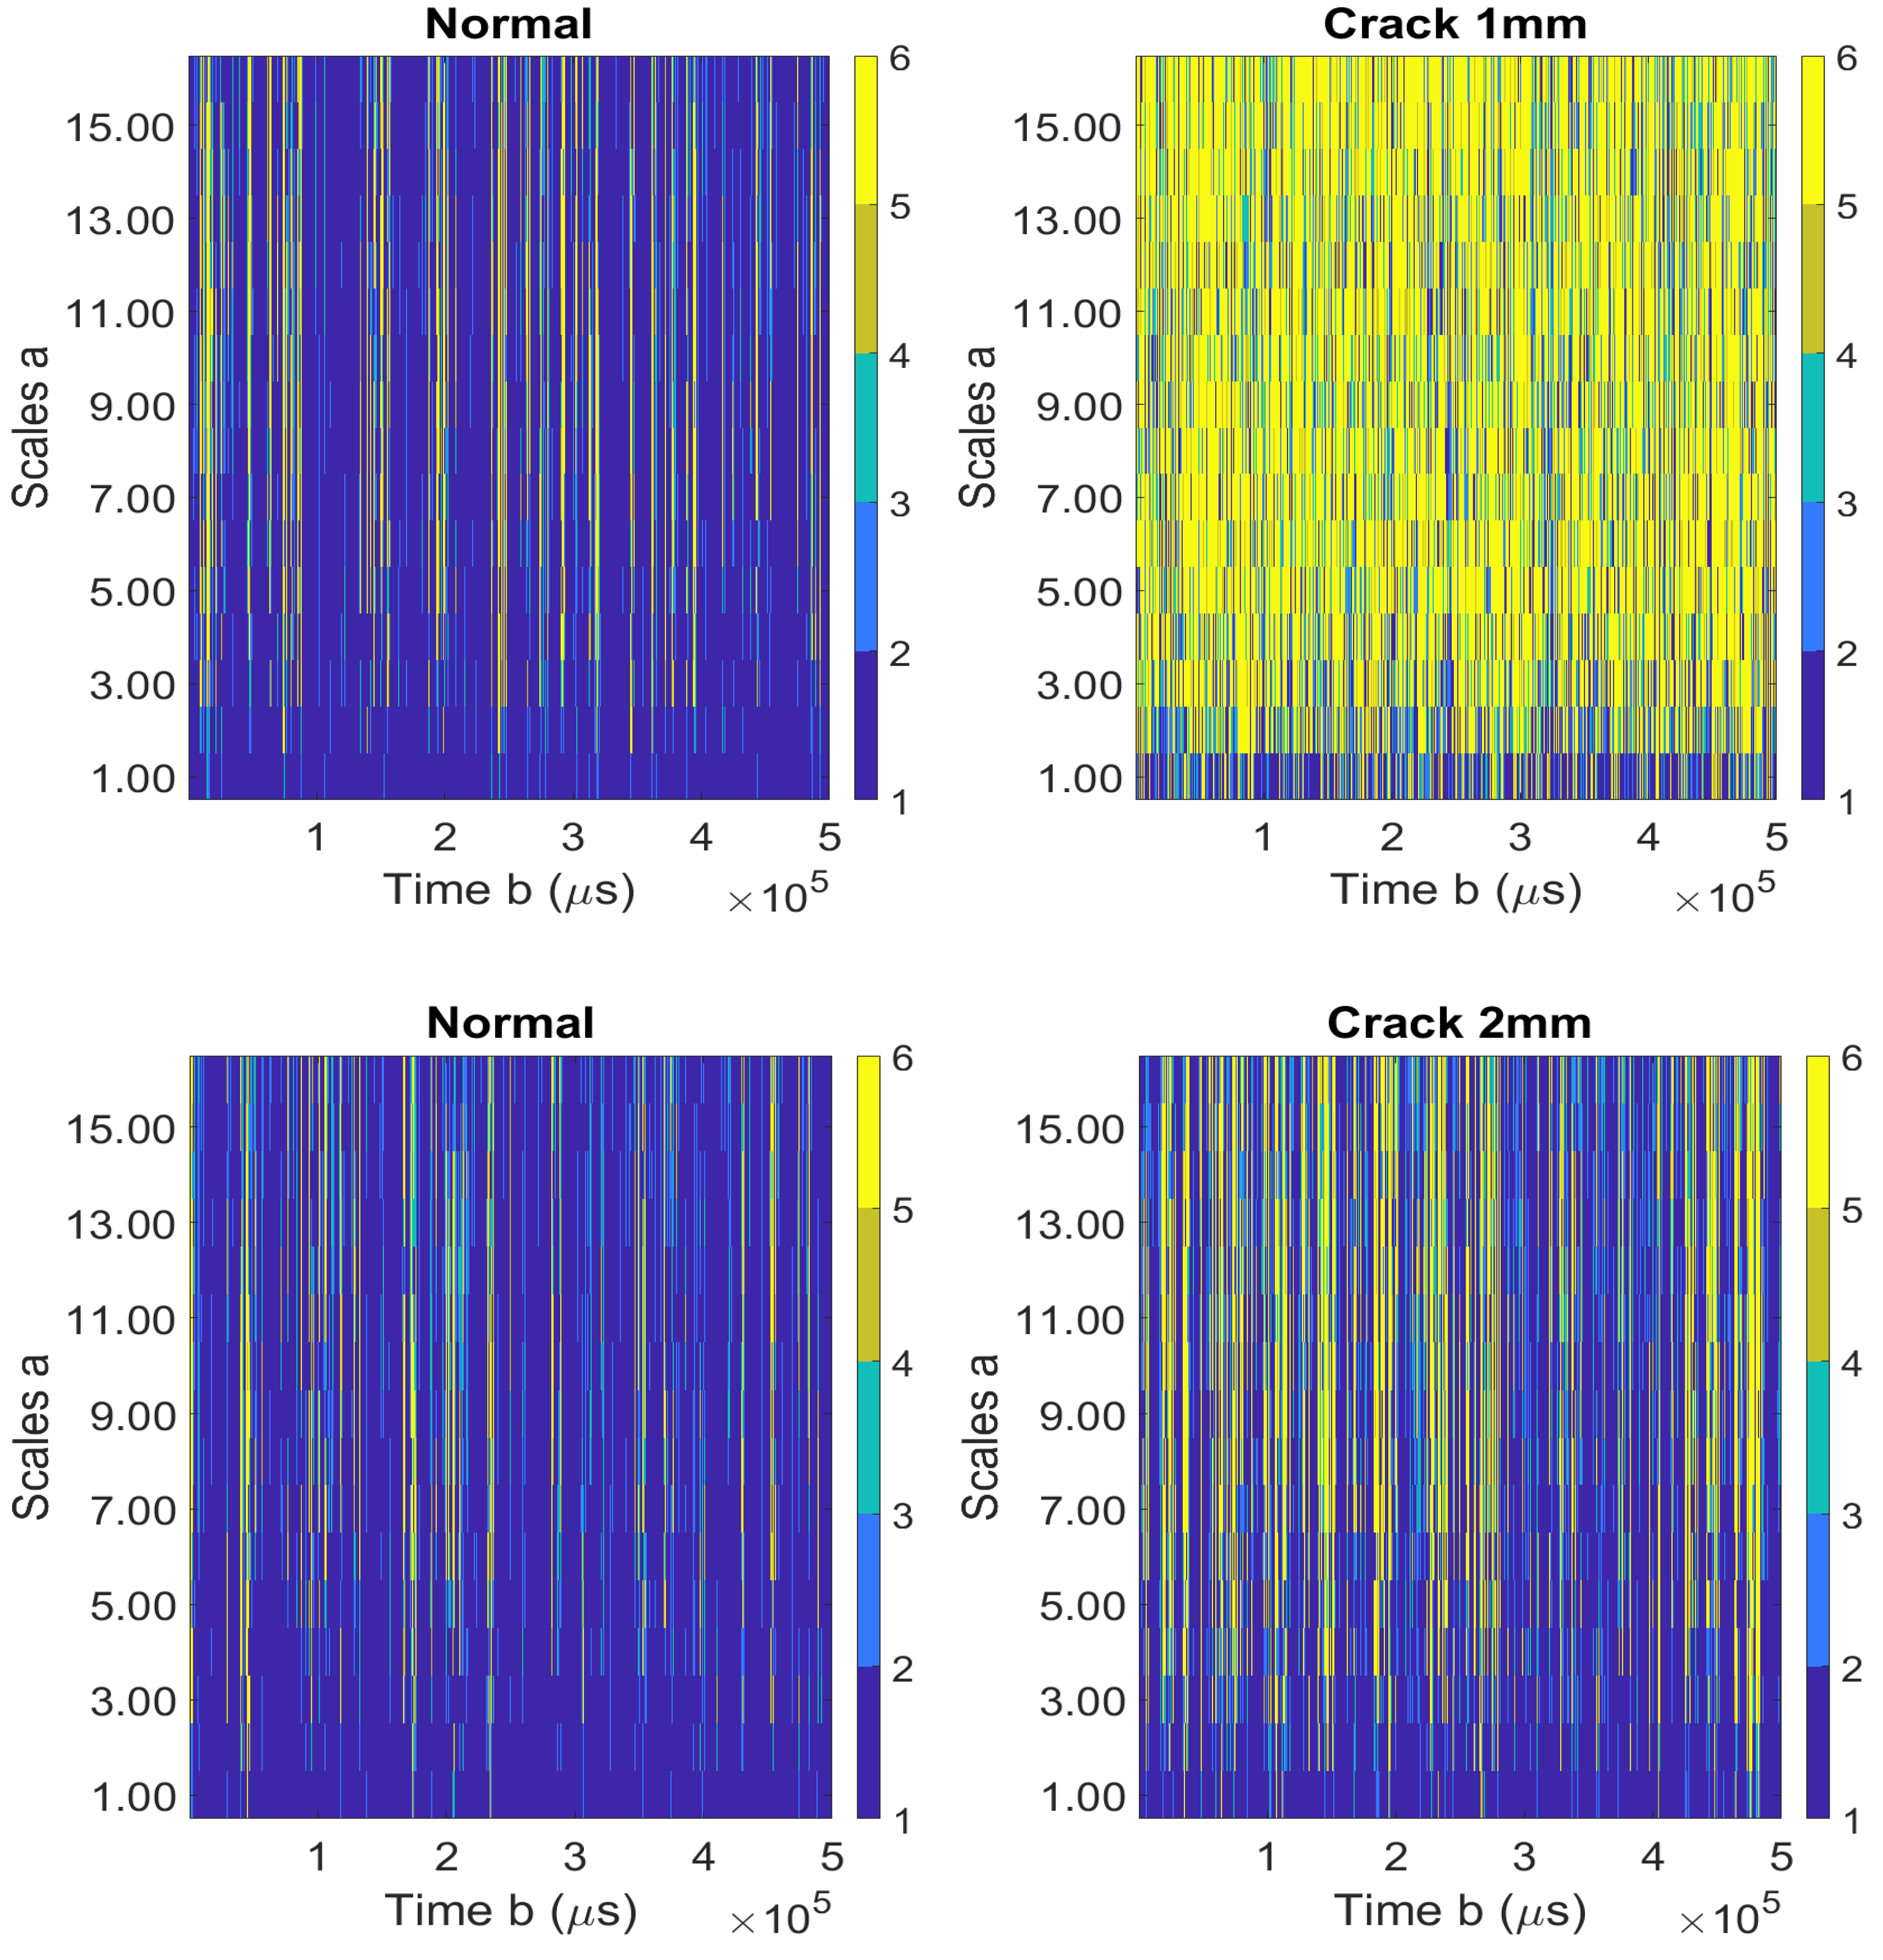
Moreover, in both methods of burst detection, most of the misclassification occurs between the 2 mm crack and normal classes, which is due to the high-flow rate of water leakage substantially reducing the pressure inside the pipe. This pressure decrease induces the decrease in AE signal amplitude, which is generated by the stress of turbulence flow at the leakage point. As a result, the leakage signal is similar to the background signal. This phenomenon can be observed in the wavelet scalograms, which are extracted from the signals of different levels of leak, as shown in Figure 7.
As in Figure 7, the number of salient peaks against the background signal from the 2 mm class is significantly decreased compared to those of the 1 mm class. However, compared with the normal signal, the density of impulses in the 2 mm class was higher.
To verify the effectiveness of the proposed method, the obtained results are compared with those of two other state-of-the-art methods, including k-nearest-neighbor (k-NN) [6] and multi-layer perceptron neural network (MLP) [11]. The results are shown in Table 2, where the comparison is made in three scenarios: (1) only extracting the statistical features from raw signal without applying burst extraction, (2) applying the burst extraction using wavelet threshold, and (3) applying burst extraction using ECFAR. The classification accuracy is defined as mean classification accuracy (MCA), which is calculated by
where is the total number of samples used to calculate the classification accuracy of the proposed method in a particular dataset, is the total number of fault types (leak levels), and is the number of datapoints in class , which is correctly classified as class .
Overall, the proposed method with OAA-SVMs classification achieves higher classification accuracy over the k-NN and MLP with the same scenario and same training and testing data.
5. Conclusions
Since bursts and impulses in an AE signal contain important information regarding leakage, this paper proposed an effective method for detecting and isolating transient bursts and impulses with the ECFAR algorithm. This method provides an elimination of peaks to boost background noise estimation, which converges to the correct value and enhances detection precision. The effectiveness of the proposed detector algorithm is indirectly evaluated through the classification of multiple leakage levels using the extracted features from the detected burst segments. The results show that the ECFAR provides better results compared with the wavelet threshold method, with a classification average of 93% accurate. However, this research has not applied the method to specify the leak position, as this will be completed in future work.
Author Contributions
All of the authors contributed equally to the conception of the idea, the design of experiments, the analysis and interpretation of results, as well as the writing of the manuscript. All authors have read and agreed to the published version of the manuscript.
Funding
This work was also supported by the Technology Infrastructure Program funded by the Ministry of SMEs and Startups (MSS, Korea). This research was supported by Basic Science Research Program through the National Research Foundation of Korea (NRF) funded by the Ministry of Education (2019R1D1A3A03103840)
Conflicts of Interest
The authors declare no conflict of interest.
References
- Murvay, P.-S.; Silea, I. A survey on gas leak detection and localization techniques. J. Loss Prev. Process. Ind. 2012, 25, 966–973. [Google Scholar] [CrossRef]
- Datta, S.; Sarkar, S. A review on different pipeline fault detection methods. J. Loss Prev. Process. Ind. 2016, 41, 97–106. [Google Scholar] [CrossRef]
- Chan, T.K.; Chin, C.S.; Zhong, X. Review of Current Technologies and Proposed Intelligent Methodologies for Water Distributed Network Leakage Detection. IEEE Access 2018, 6, 78846–78867. [Google Scholar] [CrossRef]
- Liu, Z.; Kleiner, Y. State of the art review of inspection technologies for condition assessment of water pipes. Measurement 2013, 46, 1–15. [Google Scholar] [CrossRef] [Green Version]
- Adedeji, K.B.; Hamam, Y.; Abe, B.T.; Abu-Mahfouz, A.M. Towards achieving a reliable leakage detection and localization algorithm for application in water piping networks: An overview. IEEE Access 2017, 5, 20272–20285. [Google Scholar] [CrossRef]
- Bui Quy, T.; Muhammad, S.; Kim, J.-M. A reliable acoustic EMISSION based technique for the detection of a small leak in a pipeline system. Energies 2019, 12, 1472. [Google Scholar]
- Martini, A.; Troncossi, M.; Rivola, A. Leak detection in water-filled small-diameter polyethylene pipes by means of acoustic emission measurements. Appl. Sci. 2017, 7, 2. [Google Scholar] [CrossRef] [Green Version]
- Xiao, Q.; Li, J.; Sun, J.; Feng, H.; Jin, S. Natural-gas pipeline leak location using variational mode decomposition analysis and cross-time–frequency spectrum. Measurement 2018, 124, 163–172. [Google Scholar] [CrossRef]
- Zhu, S.-B.; Li, Z.-L.; Zhang, S.-M.; Liang, L.-L.; Zhang, H.-F. Natural gas pipeline valve leakage rate estimation via factor and cluster analysis of acoustic emissions. Measurement 2018, 125, 48–55. [Google Scholar] [CrossRef]
- Xiao, R.; Hu, Q.; Li, J. Leak detection of gas pipelines using acoustic signals based on wavelet transform and Support Vector Machine. Measurement 2019, 146, 479–489. [Google Scholar] [CrossRef]
- Song, Y.; Li, S. Leak detection for galvanized steel pipes due to loosening of screw thread connections based on acoustic emission and neural networks. J. Vib. Control. 2018, 24, 4122–4129. [Google Scholar] [CrossRef]
- Hernandez Crespo, B.; Courtney, C.R.P.; Engineer, B. Calculation of Guided Wave Dispersion Characteristics Using a Three-Transducer Measurement System. Appl. Sci. 2018, 8, 1253. [Google Scholar] [CrossRef] [Green Version]
- He, P. Simulation of ultrasound pulse propagation in lossy media obeying a frequency power law. IEEE Trans. Ultrason. Ferroelectr. Freq. Control. 1998, 45, 114–125. [Google Scholar] [PubMed] [Green Version]
- Mostafapour, A.; Davoodi, S. A theoretical and experimental study on acoustic signals caused by leakage in buried gas-filled pipe. Appl. Acoust. 2015, 87, 1–8. [Google Scholar] [CrossRef]
- Thomas, M.J.; Jay, N.M.; Daniel, J.W. Acoustic emission leak detection on a metal pipeline buried in sandy soil. J. Pipeline Syst. Eng. Pract. 2013, 4, 149–155. [Google Scholar]
- Khulief, Y.A.; Khalifa, A.E.; Ben-Mansour, R.; Habib, M.A. Acoustic detection of leaks in water pipelines using measurements inside pipe. J. Pipeline Syst. Eng. Pract. 2012, 3, 47–54. [Google Scholar] [CrossRef]
- Antaki, G.A. Piping and Pipeline Engineering: Design, Construction, Maintenance, Integrity, and Repair; CRC Press: Boca Raton, FL, USA, 2003; ISBN 978-0-429-21345-8. [Google Scholar]
- Gao, Y.; Brennan, M.J.; Joseph, P.F.; Muggleton, J.M.; Hunaidi, O. A model of the correlation function of leak noise in buried plastic pipes. J. Sound Vib. 2004, 277, 133–148. [Google Scholar] [CrossRef]
- Nicola, M.; Nicola, C.-I.; Vintilă, A.; Hurezeanu, I.; Duță, M. Pipeline Leakage Detection by Means of Acoustic Emission Technique Using Cross-Correlation Function. J. Mech. Eng. Autom. 2018, 8, 59–67. [Google Scholar]
- Quy, T.B.; Kim, J.-M. Leak localization in industrial-fluid pipelines based on acoustic emission burst monitoring. Measurement 2020, 151, 107150. [Google Scholar] [CrossRef]
- Srirangarajan, S.; Allen, M.; Preis, A.; Iqbal, M.; Lim, H.B.; Whittle, A.J. Wavelet-based burst event detection and localization in water distribution systems. J. Signal Process. Syst. 2013, 72, 1–16. [Google Scholar] [CrossRef] [Green Version]
- Pan, S.; Xu, Z.; Li, D.; Lu, D. Research on Detection and Location of Fluid-Filled Pipeline Leakage Based on Acoustic Emission Technology. Sensors 2018, 18, 3628. [Google Scholar] [CrossRef] [PubMed] [Green Version]
- Guo, C.; Wen, Y.; Li, P.; Wen, J. Adaptive noise cancellation based on EMD in water-supply pipeline leak detection. Measurement 2016, 79, 188–197. [Google Scholar] [CrossRef]
- Acosta, G.G.; Villar, S.A. Accumulated CA–CFAR process in 2-D for online object detection from sidescan sonar data. IEEE J. Ocean. Eng. 2015, 40, 558–569. [Google Scholar] [CrossRef]
- Physicalacoustics-Pci 2. Available online: https://www.physicalacoustics.com/by-product/pci-2/ (accessed on 3 March 2020).
- Physicalacoustics-Sensors. Available online: https://www.physicalacoustics.com/by-product/sensors/WDI-AST-100-900-kHz-Wideband-Differential-AE-Sensor (accessed on 3 March 2020).
- Jarabo-Amores, M.-P.; de la Mata-Moya, D.; Gil-Pita, R.; Rosa-Zurera, M. Radar detection with the Neyman–Pearson criterion using supervised-learning-machines trained with the cross-entropy error. EURASIP J. Adv. Signal Process. 2013, 2013, 44. [Google Scholar] [CrossRef] [Green Version]
- Manjurul Islam, M.M.; Kim, J.-M. Reliable multiple combined fault diagnosis of bearings using heterogeneous feature models and multiclass support vector Machines. Reliab. Eng. Syst. Saf. 2019, 184, 55–66. [Google Scholar] [CrossRef]
- Kang, M.; Kim, J.; Wills, L.M.; Kim, J.-M. Time-Varying and Multiresolution Envelope Analysis and Discriminative Feature Analysis for Bearing Fault Diagnosis. IEEE Trans. Ind. Electron. 2015, 62, 7749–7761. [Google Scholar] [CrossRef]
Figure 1.
Pipeline testbed for leak simulation (a) Overall system installation (b) Solenoid valve to control the leak state (c) Four type of drill hole to simulate the leakage.
Figure 1.
Pipeline testbed for leak simulation (a) Overall system installation (b) Solenoid valve to control the leak state (c) Four type of drill hole to simulate the leakage.

Figure 2.
The proposed method of the Enhanced Constant Fault Alarm Rate (ECFAR) algorithm for burst detection.
Figure 2.
The proposed method of the Enhanced Constant Fault Alarm Rate (ECFAR) algorithm for burst detection.

Figure 3.
An example of four-class classification scenario and true decision boundaries using the one-versus-all multi-class support vector machine (OVA-MCSVMs).
Figure 3.
An example of four-class classification scenario and true decision boundaries using the one-versus-all multi-class support vector machine (OVA-MCSVMs).

Figure 4.
Examples of collected acoustic emission signals for normal case and 0.3 mm leak.

Figure 5.
Performance of ECFAR burst detection algorithm when applied to the leak signal.

Figure 6.
Confusion matrices of classification result for (a) the proposed method for impulse detection with ECFAR and (b) wavelet threshold-based impulse detection.
Figure 6.
Confusion matrices of classification result for (a) the proposed method for impulse detection with ECFAR and (b) wavelet threshold-based impulse detection.

Figure 7.
Wavelet scalogram extracted from normal (left) and leakage (right) cases of 2 mm hole and 1 mm hole.
Figure 7.
Wavelet scalogram extracted from normal (left) and leakage (right) cases of 2 mm hole and 1 mm hole.


Table 1.
Details of the data acquisition devices.
| Devices | Detail Characteristics | |
|---|---|---|
| WDI-AST |
|  |
| PCI 2 |
|  |
Table 2.
Average classification accuracy of the k-NN, MLP and the proposed method.
| Scenario (1) | Scenario (2) | Scenario (3) | |
|---|---|---|---|
| k-NN | 70.81% | 85.65% | 86.76% |
| MLP | 69.70% | 78.98% | 83.40% |
| OAA-SVMs | 73.64% | 87.00% | 93.00% |
© 2020 by the authors. Licensee MDPI, Basel, Switzerland. This article is an open access article distributed under the terms and conditions of the Creative Commons Attribution (CC BY) license (http://creativecommons.org/licenses/by/4.0/).
Share and Cite
MDPI and ACS Style
Duong, B.P.; Kim, J.; Jeong, I.; Kim, C.H.; Kim, J.-M. Acoustic Emission Burst Extraction for Multi-Level Leakage Detection in a Pipeline. Appl. Sci. 2020, 10, 1933. https://0-doi-org.brum.beds.ac.uk/10.3390/app10061933
AMA Style
Duong BP, Kim J, Jeong I, Kim CH, Kim J-M. Acoustic Emission Burst Extraction for Multi-Level Leakage Detection in a Pipeline. Applied Sciences. 2020; 10(6):1933. https://0-doi-org.brum.beds.ac.uk/10.3390/app10061933
Chicago/Turabian StyleDuong, Bach Phi, JaeYoung Kim, Inkyu Jeong, Cheol Hong Kim, and Jong-Myon Kim. 2020. "Acoustic Emission Burst Extraction for Multi-Level Leakage Detection in a Pipeline" Applied Sciences 10, no. 6: 1933. https://0-doi-org.brum.beds.ac.uk/10.3390/app10061933
Note that from the first issue of 2016, this journal uses article numbers instead of page numbers. See further details here.