Antioxidant Activity and Polyphenolic Content of North Macedonian Wines


1
Department of Food Quality & Chemistry of Natural Products, Mediterranean Agronomic Institute of Chania (M.A.I.Ch.)/Centre International de Hautes Etudes Agronomiques Méditerranéennes, P.O. Box 85, Chania 73100, Greece
2
Department of Chemistry, School of Physical Science, National and Kapodistrian University of Athens, Panepistimiopolis, Athens 15771, Greece
*
Author to whom correspondence should be addressed.
Appl. Sci. 2020, 10(6), 2010; https://0-doi-org.brum.beds.ac.uk/10.3390/app10062010
Submission received: 22 February 2020
/
Accepted: 9 March 2020
/
Published: 16 March 2020
(This article belongs to the Special Issue Antioxidants in Natural Products)
Abstract
:The purpose of this study was to evaluate comparatively the polyphenolic content and the antioxidant activity of selected regional red and white wine varieties, produced in the Republic of North Macedonia. The polyphenolic content was evaluated by measuring the total polyphenol, total flavonoid, total tannin and total anthocyanin contents and the antioxidant activity by applying the DPPH (2,2-diphenyl-1-picrylhydrazyl), FRAP (ferric-reducing antioxidant power) and CUPRAC (cupric ion-reducing antioxidant capacity) assays. Statistical analysis of the results showed that all white wines examined (Smederevka, Temjanika and Zhilavka) belong to the same group, two red wines (Vranec and Kratoshija) belong to another group while the Stanushina red variety shows distinct differences from the other red wines examined.
Keywords:
red wines; white wines; polyphenolic content; TPC; TFC; TTC; TAC; antioxidant activity; DPPH; FRAP; CUPRAC
1. Introduction
Many plants and plant products are natural sources of antioxidants, and wine existing on Earth for more than 6000 years is one of them [1]. Polyphenols are the main antioxidant constituents in grapes and wine and many efforts have been made in order to elucidate their structure and their antioxidant mechanisms. Additionally, a plethora of studies have proven the beneficial effects of the antioxidants in wine, for the prevention of coronary disease and atherosclerosis and a phenomenon known as the French Paradox [2].
Polyphenols are directly related to the antioxidant activity of wines, apart from their role in the taste, aroma, mouth feel, astringency and colour. The composition of wine regarding phenolic compounds is very diverse, since it depends on the species [3] and cultivar [4] and is also influenced by different environmental factors during grape maturation, their extraction from the grapes during vinification as well as vinification techniques applied, and chemical modification of the phenols due to maturation and contact with the wood barrels [5]. Attention must be given to the specific adjustments in vinification procedures required for different grape varieties, in order to exploit the maximum of the polyphenolic potential of the grapes.
Interest in the evaluation of the polyphenolic content and antioxidant activity of wines indigenous to the Balkan region has arisen due to limited knowledge of the potential of some local varieties. Since many international wines have spread on a global scale, most of the domestic grape varieties have been replaced with international grape varieties, their cultivation has been markedly reduced, and consequently the production of the wines of those varieties has decreased as well. As a result, some of these varieties have been neglected and their phenolic profile and antioxidant activity has not been clearly established. Additionally, no adequate vinification techniques have been developed to exploit their potential, in order to produce wines with higher quality.
Therefore, the aim of this study was to reveal the polyphenolic profile and antioxidant activity of local Balkan varieties, cultivated in the Republic of North Macedonia, providing data that could be later used as a basis for future research focused on implementing more adequate techniques for vinification, specifically adapted for the selected varieties. In this context, the polyphenolic content of selected varieties was examined by the total polyphenol content (TPC), total flavonoid content (TFC), total tannin content (TTC) and total anthocyanin content (TAC) methods and the antioxidant activity with the DPPH (2,2-diphenyl-1-picrylhydrazyl), FRAP (ferric-reducing antioxidant power) and CUPRAC (cupric ion-reducing antioxidant capacity) assays.
2. Materials and Methods
2.1. Reagents and Chemicals
2,2-Diphenyl-1-picrylhydrazyl (DPPH) and 2, 4, 6-tripyridyl-s-triazine (TPTZ) were purchased from Sigma (USA). Folin-Ciocalteu reagent, sodium hydroxide, hydrochloric acid (37% w/w), 2,9-dimethyl-1,10-phenanthroline (neocuproine) and glacial acetic acid were purchased from Merck (Germany). Sodium nitrite, copper (II) chloride dihydrate, trolox, gallic acid, catechine, iron (III) chloride hexahydrate, aluminum chloride, sodium acetate and all other chemicals and solvents were purchased from Sigma Aldrich (Germany). All reagents and chemicals were of analytical grade.
2.2. Samples
Sixteen bottles of red wine from three varieties: Kratoshija, Stanushina and Vranec, and 18 bottles of white wine from three varieties: Smederevka, Temjanika and Zhilavka, were purchased from different vintages (2015–2017) and different producers from the Republic of North Macedonia. The wines were transferred into 50 mL conical centrifuge tubes and stored at 8 °C. Samples were taken out of the refrigerator prior to analysis and diluted according to the protocols.
2.3. Spectrophotometric Analyses
All spectrophotometric analyses were performed using Jasco V-530 Spectrophotometer with 10 mm cuvette. Each sample was analysed in triplicate.
2.3.1. Determination of Total Polyphenol Content (TPC)
The total polyphenol content was measured according to a modified Folin–Ciocalteu method [6]. Red wines were diluted with dH2O in a ratio of 1:10 (v/v) while white wines were not diluted. The measurement was performed by mixing 780 μL of dH2O with 50.0 μL of Folin–Ciocalteu reagent and 20.0 μL of the appropriately diluted sample. After exactly 1 min, 150 μL of 20% (w/v) Na2CO3 was added. The mixture was stored for 1 h in the dark at room temperature and the absorbance was read at 750 nm. Gallic acid was used to obtain a calibration curve with standard solutions within the range of 0.050–0.70 mg/mL. The results were expressed as mg/L gallic acid equivalent (mg GAE/L).
2.3.2. Determination of Total Flavonoid Content (TFC)
Total flavonoid content was determined by using the aluminium chloride assay [7,8,9]. Red wines were diluted with dH2O in a ratio of 1:10 (v/v) while white wines were not diluted. 4.00 mL of dH2O and 1.00 mL of the appropriately diluted sample together with 0.300 mL of 5% (w/v) NaNO2 were transferred into a 10.0 mL volumetric flask. 5 min after mixing the three solutions, 0.300 mL of 10% (w/v) AlCl3 was added, followed by the addition of 2.00 mL of 1.00 M NaOH. The contents of the volumetric flask were immediately diluted with dH2O to a total volume of 10.0 mL and thoroughly mixed. Absorbance of the mixture was measured at 510 nm. The calibration curve was constructed by preparing standard solutions of catechine within the range of 20.0–125 mg/L and the results were expressed as mg/L catechine equivalent (mg CE/L).
2.3.3. Determination of Total Tannin Content (TTC)
The tannin content in wines was determined by using the leucoanthocyanin (LA) method and the vanillin assay (VA) [10].
The LA modified assay [11] was performed by examining the visible spectrum of the reaction at 470, 520 and 570 nm, following the original procedure proposed by Ribéreau-Gayon and Stonestreet [12]. All wines were diluted with dH2O in a ratio of 1:50 (v/v). For each sample, a test tube and a blank tube were prepared. In each tube, 2.00 mL of diluted sample was mixed with 1.00 mL of dH2O and 3.00 mL of 37% (w/w) HCl. The test tube was heated at 100 °C in an oil bath on a thermostated hot plate for 30 min and after cooling to room temperature, 0.500 mL of EtOH was added. The same procedure was followed for the blank tube but without heating. The absorbance of the content of both tubes was measured at 470, 520 and 570 nm and the difference in absorbance (ΔAbs = Abstest − Absblank) was calculated at 470 nm (ΔAbs470), 520 nm (ΔAbs520) and 570 nm (ΔAbs570). In order to compare the values derived from the measurements at the three wavelengths, the values obtained for ΔAbs470 and ΔAbs570 were converted to the corresponding values of ΔAbs520 as follows [12]:
The total tannin (g TT/L) content was calculated according to Ribéreau-Gayon [13] as follows:
where 15.7 is related to the molar extinction coefficient of a standard oligomeric procyanidin solution.
For the vanillin assay (VA) [14], two reagents were prepared: reagent A (1% w/v vanillin in MeOH) and reagent B (8% v/v H2SO4 in MeOH) and all samples were diluted to 1:10 (v/v) with dH2O.
We transferred 1.00 mL of the appropriately diluted sample into a tube and mixed with 2.50 mL of reagent A and 2.50 mL of reagent B. The tubes were incubated at 30 °C in a water bath for 20 min and the absorption was measured at 500 nm. A blank solution for red wines was prepared for each sample separately in order to avoid interferences from anthocyanins. In the blank solution, the vanillin reagent was replaced by MeOH. The absorption of each blank was subtracted from the absorption of the corresponding sample. Catechine (30.0–140 mg/L) was used as a standard compound for constructing the calibration line and results were expressed as mg/L catechine equivalent (mg CE/L).
2.3.4. Determination of Total Anthocyanin Content (TAC)
Total anthocyanin content (TAC) was determined after dilution of the sample with ethanolic hydrochloric acid solution which was prepared by mixing EtOH, dH2O and HCl in a 69/30/1 (v/v/v) ratio The samples were diluted at a factor of 1:10 (v/v) by mixing 0.10 mL of sample with 0.90 mL of ethanolic hydrochloric acid and the absorbance was immediately measured at 540 nm. Results were expressed as mg/L malvidine-3-glucoside equivalents by using the following equation [9,15]:
where ΔAbs540 is the absorbance at 540 nm, d is the dilution factor (10) and 16.7 is a factor to express the results as mg/L malvidine-3-glucoside equivalents.
2.3.5. Evaluation of the Antioxidant Activity by Ferric-Reducing Antioxidant Power (FRAP) Assay
The original FRAP assay [16] was used slightly modified [17]. Red wines were diluted 1:10 (v/v) with dH2O while white wines were used without dilution. For the FRAP reagent, three solutions were prepared: solution A contained 0.30 M acetate buffer prepared by dissolving 1.90 g/L of sodium acetate in dH2O and adjusted to pH 3.6 with 16.0 mL/L glacial acetic acid, solution B was prepared by dissolving 0.0100 M TPTZ (2, 4, 6-tripyridyl-s-triazine) in 0.040 M HCl and solution C contained 0.0200 M FeCl3.6H2O in dH2O. Prior to the determination, 25.0 mL of solution A, 2.50 mL of solution B and 2.50 mL of solution C were mixed and the final FRAP reagent was incubated at 37 °C in a water bath for 4 min before use. After incubation, 0.150 mL of the diluted sample was left to react with 2.85 mL of the FRAP reagent for 30 min in the dark and the absorbance was measured at 593 nm. A blank sample was also prepared by using water instead of wine. Standard solutions of Trolox (0.025–0.500 mmol/L) were used for the calibration and the results were expressed as mmol/L trolox equivalent (mmol TE/L).
2.3.6. Evaluation of the Antioxidant Activity by Cupric-Reducing Antioxidant Capacity (CUPRAC) Assay
For the CUPRAC assay [18], red wines were diluted 1:10 (v/v) with dH2O while white wines were used without dilution. Three solutions were prepared: solution A was prepared by dissolving copper (II) chloride in dH2O in order to prepare a solution containing 0.010 M Cu(II), solution B contained ammonium acetate buffer pH 7.0 which was prepared by dissolving 19.27 g of ammonium acetate in 250.0 mL of dH2O and solution C contained 0.0075 M neocuproine (2,9-dimethyl-1,10-phenanthroline) in EtOH.
Prior to the determination, 1.0 mL of solution A, 1.0 mL of solution B and 1.0 mL of solution C are mixed with 0.5 mL of the appropriately diluted sample together with 0.6 mL of dH2O in a tube. The reaction mixture was left for 1 h in the dark and then the absorption was measured at 450 nm. A blank sample was also prepared by using water instead of wine. Standard solutions of Trolox (0.100–0.800 mmol/L) were used for the calibration and the results were expressed as mmol/L trolox equivalent (mmol TE/L).
2.3.7. Evaluation of the Antioxidant Activity by DPPH (2,2-Diphenyl-1-Picrylhydrazyl) Assay
The original DPPH assay [19] slightly modified for a final volume of 1 mL was used [20]. Red wines were diluted 1:10 (v/v) with dH2O while white wines were used without dilution. The DPPH solution (100 μM) was prepared by dissolving 3.60 mg of DPPH in 100 mL of EtOH. 25.0 μL of the sample was mixed with 975 μL of DPPH solution and left for 30 min in the dark before measuring the absorbance at 515 nm. A blank sample was also prepared by using EtOH instead of wine. Standard solutions of trolox (0.20–1.4 mmol/L) were used for the calibration and the %radical scavenging activity (%RSA) was calculated by:
and expressed as mmol/L trolox equivalent (mmol TE/L).
2.4. Statistical Analyses
Statistical analysis of the analytical data was performed using the SPSS Statistics Software, Version 20, IBM, Armonk, NY, USA.
3. Results and Discussion
3.1. Total Polyphenols, Total Flavonoids, Total Tannins and Total Anthocyanins
The total phenolic content for wines by the Folin–Ciocalteu assay is shown in Table 1. The results reveal that the TPC of red wines varied among the three red varieties examined. Vranec contained the highest amounts of phenolic compounds, followed by Kratoshija wines and Stanushina wines which is in accordance to the literature [21,22,23]. This could be justified by the very limited production of Kratoshija and Stanushina grapes and wines and insufficient knowledge about the vinification procedures adequate for these varieties and almost inexistent standardisation and control, which causes different practices among the producers.
The results of total phenolic content for the three white varieties examined (Table 1), show similar concentrations of phenolic compounds in all three varieties, which are comparable with the results from the literature, although some authors report slightly higher results for some white varieties [24,25].
The results for total flavonoid content of wines by the aluminium chloride assay (Table 1) show similar variations with the results of the TPC assay (Table 1). Vranec contained higher amounts of flavonoids compared to Kratoshija and Stanushina, which are in accordance with the literature [8,26]. Results for white wines demonstrate high similarities between the varieties examined which is in accordance with the literature [21].
Results for total tannin content by the LA method and the VA for the red varieties examined are shown in Table 2. Results by both assays show that Vranec varieties contain notably higher concentrations of tannins than Kratoshija and Stanushina and are consistent with results reported in literature [27,28]]. No results were obtained by both assays for the white varieties due to very low concentration of tannins.
Results for total anthocyanin content of the red varieties examined (Table 2) show that Vranec and Kratoshija wines are in agreement with the results of other authors [29,30,31]. The anthocyanin content of the Stanushina red variety is comparable to the values expected for rose wines [32], thus raising the question of whether this variety has the ability to produce red wines or only rose wine. Furthermore, research that would focus on the application of different vinification techniques with adjustments made specifically for this variety would be able to resolve this debate.
3.2. Antioxidant Activity
The antioxidant activity of all wine varieties was evaluated by measuring the radical scavenging activity assay (DPPH) and the reduction potential of antioxidants (FRAP and CUPRAC assays).
Red varieties exhibit high variations of antioxidant activity measured by the FRAP assay, displaying a range of 4.45–10.27 mmol TT/L (Table 1). The highest values were observed for wines from the Vranec variety, while the lowest results were recorded for wines of the Stanushina variety. Stanushina and Kratoshija wines show much higher variability in the antioxidant activity with lower values than Vranec wines. Compared to red wines, white wines are known to exhibit very low antioxidant activity which was found to lie within the range 0.95–1.07 mmol TE/L.
The results obtained from the CUPRAC assay demonstrated a similar trend in the antioxidant activity of the analysed varieties. The reducing power of the antioxidants of red wines was found within the range 7.24–15.8 mmol TE/L. As shown in Table 1, the antioxidant activity measured with the CUPRAC assay decreased in the order: Vranec > Kratoshija > Stanushina. Similar to the results from the FRAP assay, Vranec shows consistency in the results for the selected samples, whereas Kratoshija and Stanushina both expanded their variability through a larger range of values. White wines showed much lower antioxidant activity in a limited range of 1.35–1.60 mmol TE/L, compared to red wines.
The radical scavenging activity of red wines measured by the DPPH assay were found to be within the range of 4.11–11.73 mmol TE/L (Table 1). Vranec wines show higher radical scavenging activity than Kratoshija and Stanushina. These results are consistent with the literature [17,20]. Similarly to the previous assays, white wines demonstrated low radical scavenging activities (0.51–1.30 mmol TE/L). Compared to the results from literature, the DPPH values obtained for the three varieties of white wine are consistent with the results reported by Stratil et al. [20], who found that white wines from the Czech Republic demonstrate radical scavenging activity of 0.61–1.78 mmol TE/L.
3.3. Statistical Evaluation of Results
Pearson’s coefficients (Table 3) show a very strong relationship between TPC and results with DPPH (r = 0.987, n = 34), FRAP (r = 0.970, n = 34) and CUPRAC (r = 0.957, n = 34) assays, indicating that the antioxidant activity of all varieties is related to the presence of phenolic compounds. Results for TFC also show a strong correlation with DPPH, (r = 0.990, n = 34), FRAP (r = 0.979, n = 34) and CUPRAC (r = 0.972, n = 34) assays. Apart from the relative amount of the flavonoids, attention has to be given to other factors affecting the antioxidant activity of flavonoids, primarily to the structure of the flavonoids, number of OH groups, saturation degree of carbon-carbon bonds and substitution of the OH groups with methyl and glycoside moieties [33].
Results for TTC (LA and VA assays) show good correlation with the DPPH, FRAP and CUPRAC assays (Table 3), but this relationship is weaker compared to the relationships of TPC and TFC with the antioxidant assays. The degree of polymerisation of the tannins may play a key role in their ability to behave as antioxidants, knowing that the higher degree of polymerisation is associated with the higher antioxidant activity of tannins [33]. On the other hand, the correlation coefficient between TAC, and DPPH, FRAP and CUPRAC, recorded lower values (r = 0.730, n = 16), (r = 0.754, n = 16) and (r = 0.698, n = 16), respectively. However these results are justified, taking into account that anthocyanins are less effective as antioxidants since the O-glucose substitution on the C3 position of the C ring diminishes their antioxidant potency [33].
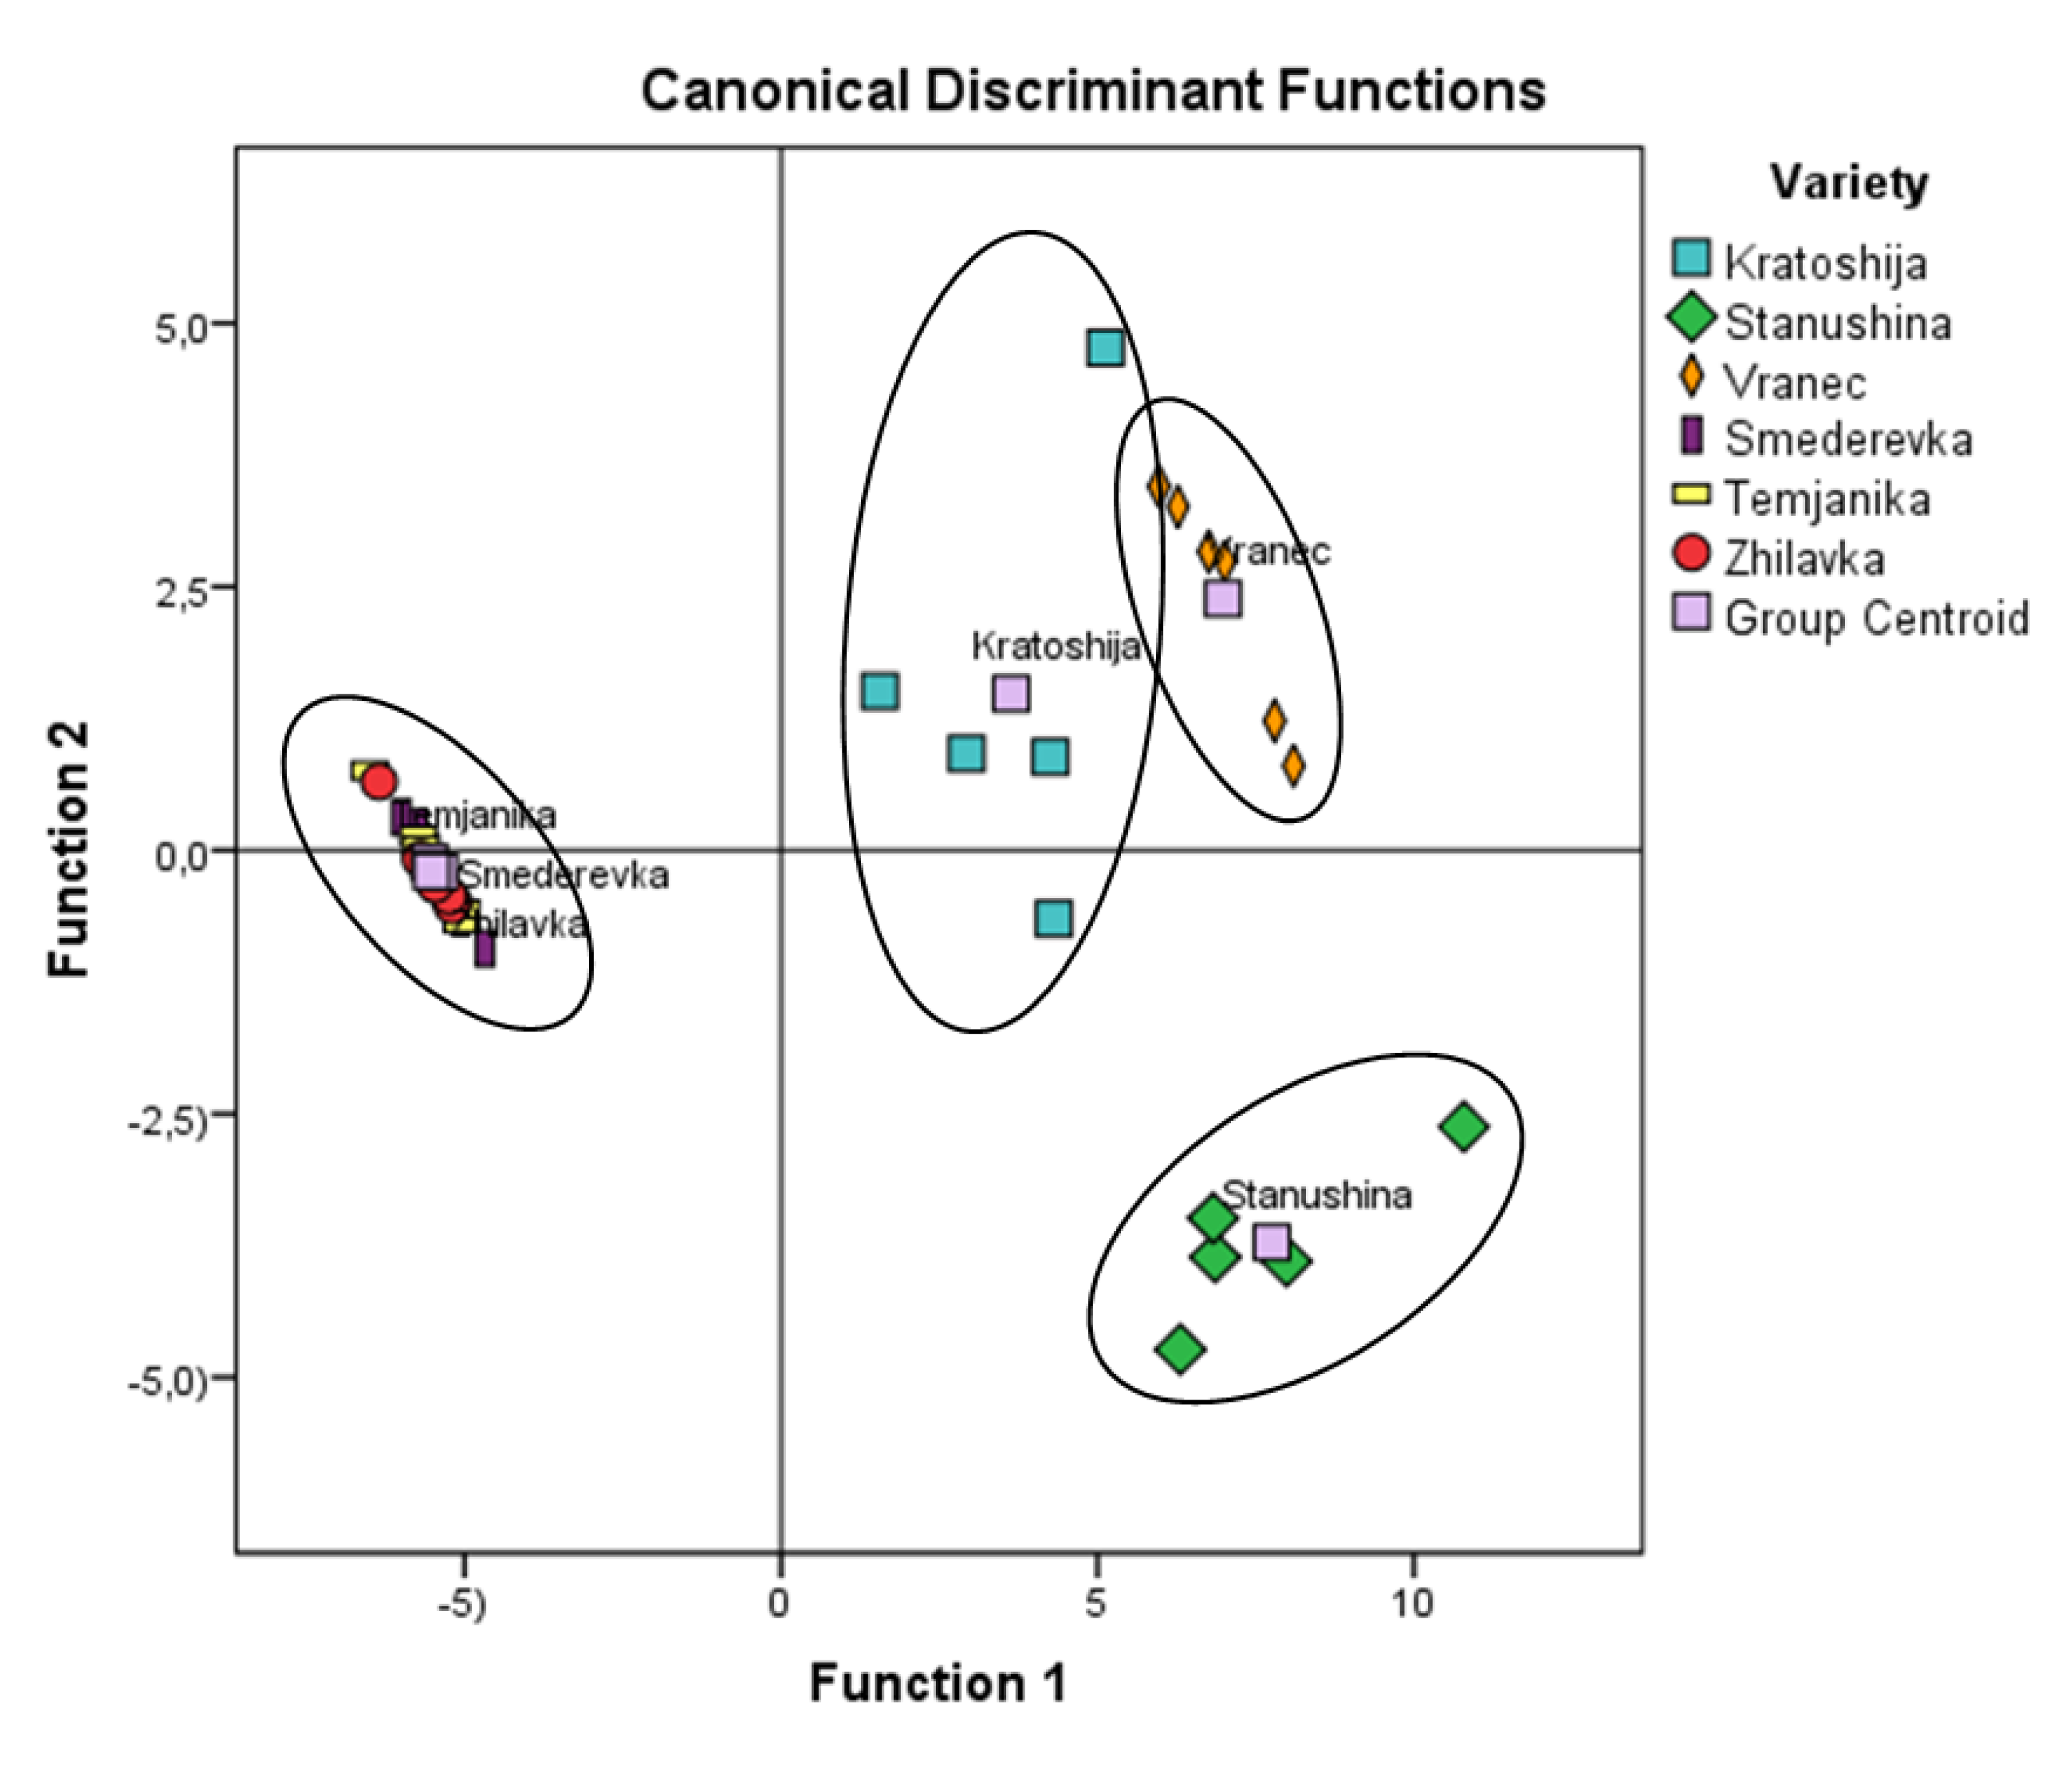
Canonical discriminant analysis (CDA) was applied for the results of TPC, DPPH and CUPRAC assays in order to establish any similarities or differences between the 6 wine varieties studied. Results (Figure 1) show that white wines are clearly classified in one group without any differences between them. Results for red wines show that Vranec and Kratoshija are clearly separated from Stanushina.
4. Conclusions
The polyphenolic contents and the antioxidant activity of wines from the Republic of North Macedonia were determined using various assays, establishing correlations between the contents of the separate polyphenolic classes and the antioxidant activity exhibited by the selected wine varieties. The antioxidant activity did not correlate to a large extent with the total anthocyanin content, due to the very weak antioxidant potency of phenolic glycosides.
The red wines demonstrated high variability in the results, particularly for the samples from the Kratoshija and Stanushina varieties, whereas the samples from the Vranec variety illustrated consistency within a much smaller range of higher values obtained for their antioxidant activity and polyphenolic contents. The three varieties were well differentiated from each other, although Kratoshija showed some similarities with Vranec. Vranec is the most exploited variety in the whole Balkan region and is the most studied variety; thus a good standardisation of these wines was already achieved. However, the cultivation of the grapes from the varieties Kratoshija and Stanushina has long been abandoned and the production of wines from these two varieties is rarely practised, most often by smaller and newly emerged wineries which have not yet established a vinification protocol applicable to these varieties in order to optimize the extraction of the polyphenols in a manner that will increase the antioxidant activity and obtain a good organoleptic profile of the wine. Furthermore, the anthocyanin content of Stanushina reached much lower concentrations, comparable to the concentrations found in rose wines. Thus, further research needs to be conducted to determine if this variety has the potential to produce red and/or rose wines, and to define ranges of anthocyanin content upon which a distinction between red Stanushina and rose Stanushina can be made.
As expected, white wines exhibited much lower antioxidant activity than red wines, due to the lower content of polyphenols in white grapes and the vinification procedures applied for white wines only, limiting the extraction of polyphenolic compounds from the grapes in the wine. The three varieties demonstrated similarities between each other to a great extent but, based on the parameters examined, no visible distinction between the varieties was made. However, the correlation between the polyphenolic content and the antioxidant activity that was demonstrated proved that the polyphenols are the main antioxidant constituents of wines.
Author Contributions
Conceptualization: K.M.; design of experiments and results: K.M., S.G. and S.L.; statistical analyses: K.M., S.G. and A.C.C.; interpretation of results: S.L. and A.C.C. All authors equally contributed to writing and editing the manuscript. All authors approved submission of the final manuscript. All authors have read and agreed to the published version of the manuscript.
Funding
This research received no external funding.
Acknowledgments
The authors wish to thank George Baourakis, Director of Mediterranean Agronomic Institute of Chania (M.A.I.Ch.)/Centre International de Hautes Etudes Agronomiques Méditerranéennes for giving permission to use all necessary facilities of the Department of Food Quality and Chemistry of Natural Products.
Conflicts of Interest
The authors declare no conflict of interest.
References
- Bateman, L. Olefin Oxidation. Q. Rev. Chem. Soc. 1954, 8, 147–168. [Google Scholar] [CrossRef]
- Renaud, S.; de Lorgeril, M. Wine, alcohol, platelets and the French paradox for coronary Herat disease. Lancet 1992, 339, 1523–1526. [Google Scholar] [CrossRef]
- Singleton, V.L.; Esau, P. Phenolic Substances in Grapes and Wine and Their Significance. Adv. Food Res. 1969, 1, 1–261. [Google Scholar]
- Etievant, P.; Schlich, P.; Bertrand, A.; Symonds, P.; Bouvier, J.C. Varietal and Geographical Classification of French Red Wines in Terms of Pigments and Flavonoid Compounds. J. Sci. Food Agric. 1988, 42, 39–54. [Google Scholar] [CrossRef]
- Soleas, G.J.; Diamandis, E.P.; Goldberg, D.M. Wine as a Biological Fluid: History, Production and Role in Disease Prevention. J. Clin. Lab. Anal. 1997, 11, 287–313. [Google Scholar] [CrossRef]
- Arnous, A.; Makris, D.P.; Kefalas, P. Correlation of pigment and flavanol contentwith antioxidant properties in selected aged regional wines from Greece. J. Food Compos. Anal. 2002, 15, 655–665. [Google Scholar] [CrossRef]
- Zhishen, J.; Mengchneg, T.; Jianming, W. The determination of flavonoids contents in mulberry and their scavenging effects on superoxide radicals. Food Chem. 1999, 64, 555–559. [Google Scholar] [CrossRef]
- Mitić, M.N.; Kostić, D.A.; Pavlović, A.N.; Micic, A.; Stojanović, B.T.; Paunovic, D.; Dimitrijević, D.S. Antioxidant activity and polyphenol profile of Vranac red wines from Balkan Region. Hem. Ind. 2016, 70, 265–275. [Google Scholar] [CrossRef] [Green Version]
- Ivanova, V.; Dörnyei, Á.; Márk, L.; Vojnoski, B.; Stafilov, T.; Stefova, M.; Kilár, F. Polyphenolic content of Vranec wines produced by different vinification conditions. Food Chem. 2011, 124, 316–325. [Google Scholar] [CrossRef]
- Burns, R.E. Methods for estimation of tannin in grain sorghum. Agron. J. 1971, 63, 511–519. [Google Scholar] [CrossRef]
- Glories, Y. CR Activités de Recherches Institut d’Oenologie 1986–1988. J-STAGE 1988, 81. [Google Scholar]
- Ribéreau-Gayon, P.; Stonestreet, E. Le dosage des tanins du vin rouge et la determination de leur structure. Chim. Anal. 1966, 48, 188–192. [Google Scholar]
- Ribéreau-Gayon, P.; Dubordieu, D.; Donèche, B.; Lonvaud, A. Handbook of Enology: The Microbiology of Wine and Vinifications, 2nd ed.; John Wiley & Sons: Chichester, UK, 2006. [Google Scholar]
- Sun, B.; Ricardo da Silva, J.; Spranger, I. Critical factors of the vanillin assay for catechins and proanthocyanidins. J. Agric. Food Chem. 1998, 46, 4267–4274. [Google Scholar] [CrossRef]
- Di Stefano, R.; Cravero, M.C.; Gentilini, N. Metodi per lo studio dei polifenoli dei vini. L’ Enotec. 1989, 25, 83–89. [Google Scholar]
- Benzie, I.F.; Strain, J.J. The Ferric Reducing Ability of Plasma (FRAP) as Measurement of ‘‘Antioxidant Power’’: The FRAP Assay. Anal. Biochem. 1996, 239, 70–76. [Google Scholar] [CrossRef] [PubMed] [Green Version]
- Büyüktuncel, E.; Colak, C. Comparison of Total Phenolic Content and Total Antioxidant Activity in Local Red Wines Determined by Spectrophotometric Methods. Food Nutr. Sci. 2014, 5, 1660–1667. [Google Scholar] [CrossRef] [Green Version]
- Apak, R.; Güçlü, K.; Őzyürek, M.; Karademir, S.E. A novel total antioxidant capacity index for dietary polyphenols, vitamins C and E, using their cupric ion reducing capability in the presence of neocuproine: CUPRAC method. J. Agric. Food Chem. 2004, 52, 7970−7981. [Google Scholar] [CrossRef]
- Blois, M.S. Antioxidant determinations by the use of a stable free radical. Nature 1958, 181, 1199−1200. [Google Scholar] [CrossRef]
- Stratil, P.; Kubáň, V.; Fojtová, J. Comparison of the Phenolic Content and Total Antioxidant Activity in Wines as Determined by Spectrophotometric Methods. Czech J. Food Sci. 2008, 26, 242–253. [Google Scholar] [CrossRef] [Green Version]
- Ma, T.; Sun, X.; Gao, G.; Wang, X.; Liu, X.Y.; Du, G.; Zhan, J. Phenolic Characterisation and Antioxidant Capacity of Young Wines made from Different Grape Varieties Grown in Helanshan Donglu Wine Zone (China). South Afr. J. Enol. Vitic. 2014, 35, 321–331. [Google Scholar] [CrossRef]
- Di Majo, D.; La Guardia, M.; Giammanco, S.; La Neve, L.; Giammanco, M. The antioxidant capacity of red wine in relationship with its polyphenolic constituents. Food Chem. 2008, 111, 45–49. [Google Scholar] [CrossRef]
- Ivanova, V.; Stefova, M.T.; Vojnoski, B. Assay of the phenolic profile of Merlot wines from Macedonia: Effect of maceration time, storage, SO2 and temperature of storage. Maced. J. Chem. Chem. Eng. 2009, 28, 141–149. [Google Scholar] [CrossRef]
- Ivanova, V.; Vojnoski, B.; Stefova, M. Effect of the Winemaking Practices and Aging on Phenolic Content of Smederevka and Chardonnay Wines. Food Bioprocess Technol. 2011, 4, 1512–1518. [Google Scholar] [CrossRef]
- Marković, M.; Martinović, B.A.; Talić, S. Antioxidant activity and total phenol content of white wine Žilavka. Bull. Chem. Technol. Bosnia Herzeg. 2015, 44, 1–4. [Google Scholar]
- Mitić, M.N.; Kostić, D.A.; Pavlović, A.N. The phenolic composition and the antioxidant capacity of Serbian red wines. Adv. Technol. 2014, 3, 16–22. [Google Scholar]
- Hosu, A.; Cristea, V.; Cimpoiu, C. Analysis of total phenolic, flavonoids, anthocyanins and tannins content in Romanian red wines: Prediction of antioxidant activities and classification of wines using artificial neural networks. Food Chem. 2014, 150, 113–118. [Google Scholar] [CrossRef] [PubMed]
- Cáceres-Mella, A.; Peña-Neira, Á.; Narváez-Bastias, J.; Jara-Campos, C.; López-Solís, R.O.; Canals, J.M. Comparison of analytical methods for measuring proanthocyanidins in wines and their relationship with perceived astringency. Int. J. Food Sci. Technol. 2013, 48, 2588–2594. [Google Scholar] [CrossRef]
- Raičević, D.; Božinović, Z.; Petkov, M.; Ivanova-Petropulos, V.; Kodžulović, V.; Mugoša, M.; Šućur, S.; Maraš, V. Polyphenolic content and sensory profile of Montenegrin Vranac wines produced with different oenological products and maceration. Maced. J. Chem. Chem. Eng. 2017, 36, 229–238. [Google Scholar] [CrossRef] [Green Version]
- Ivanova, V.; Stefova, M.T.; Chinnici, F. Determination of the polyphenol contents in Macedonian grapes and wines by standardized spectrophotometric methods. J. Serb. Chem. Soc. 2010, 75, 45–59. [Google Scholar] [CrossRef]
- Baiano, A.; Terracone, C.; Gambacorta, G.; Notte, E.L. Phenolic content and antioxidant activity of Primitivo wine: Comparison among winemaking technologies. J. Food Sci. 2009, 74, C258–C267. [Google Scholar] [CrossRef]
- He, F.; Liang, N.N.; Mu, L.; Pan, Q.H.; Wang, J.; Reeves, M.J.; Duan, C.Q. Anthocyanins and their variation in red wines I. Monomeric anthocyanins and their color expression. Molecules 2012, 17, 1571–1601. [Google Scholar] [CrossRef] [PubMed] [Green Version]
- Heim, K.E.; Tagliaferro, A.R.; Bobilya, D.J. Flavonoid Antioxidants: Chemistry, Metabolism and Structure-activity Relationships. J. Nutr. Biochem. 2002, 13, 572–584. [Google Scholar] [CrossRef]
Figure 1.
Canonical discriminant score plot for the wine varieties examined based on results of TPC, DPPH and CUPRAC.
Figure 1.
Canonical discriminant score plot for the wine varieties examined based on results of TPC, DPPH and CUPRAC.


Table 1.
Total phenolic content (TPC), total flavonoid content (TFC) and antioxidant activity by FRAP (ferric-reducing antioxidant power), CUPRAC (cupric ion-reducing antioxidant capacity) and DPPH (2,2-diphenyl-1-picrylhydrazyl) assays of red and white varieties (the lowest and the highest values within each variety are shown in bold) *.
| Wine Variety | Sample No | TPC (mg GAE/L, ±s, n = 3) | TFC (mg CE/L, ±s, n = 3) | FRAP | CUPRAC | DPPH |
|---|---|---|---|---|---|---|
| (mmol TE/L, ±s, n = 3) | ||||||
| Red Varieties | ||||||
| Kratoshija | K1 | 2134 ± 66 | 1405 ± 60 | 8.43 ± 0.15 | 12.02 ± 0.04 | 10.60 ± 0.15 |
| K2 | 2342 ± 50 | 1496 ±12 | 8.66 ± 0.07 | 11.68 ± 0.10 | 11.69 ± 0.24 | |
| K3 | 1184 ± 129 | 701 ± 26 | 5.91 ± 0.03 | 8.55 ± 0.19 | 5.21 ± 0.08 | |
| K4 | 2228 ± 26 | 1701 ± 29 | 9.95 ± 0.03 | 14.54 ± 0.07 | 9.72 ± 0.27 | |
| K5 | 710 ± 36 | 587 ± 4 | 5.60 ± 0.56 | 8.21 ± 0.10 | 3.49 ± 0.30 | |
| Stanushina | S1 | 2000 ± 10 | 1646 ± 61 | 8.57 ±0.08 | 11.83 ± 0.16 | 11.69 ± 0.55 |
| S2 | 676 ± 14 | 600 ± 8 | 5.40 ± 0.08 | 8.23 ± 0.92 | 4.51 ± 0.03 | |
| S3 | 561 ± 6 | 547 ± 10 | 4.45 ± 0.11 | 7.24 ± 0.30 | 4.19 ± 0.17 | |
| S4 | 627 ± 70 | 632 ± 3 | 4.78 ± 0.04 | 8.27 ± 0.15 | 4.11 ± 0.27 | |
| S5 | 1678 ± 35 | 1313 ± 5 | 8.87 ± 0.03 | 13.42 ± 0.03 | 9.53 ± 0.44 | |
| Vranec | V1 | 2339 ± 42 | 1732 ± 7 | 10.21 ± 0.02 | 14.90 ± 0.03 | 11.05 ± 0.10 |
| V2 | 2193 ± 77 | 1426 ± 23 | 9.90 ± 0.01 | 14.70 ± 0.02 | 10.30 ± 0.19 | |
| V3 | 2387 ± 26 | 1620 ± 15 | 10.18 ± 0.05 | 14.91 ± 0.04 | 11.15 ± 0.09 | |
| V4 | 2054 ± 22 | 1234 ± 31 | 9.82 ± 0.03 | 14.18 ± 0.06 | 10.11 ± 0.08 | |
| V5 | 2508 ± 78 | 1707 ± 10 | 10.27 ± 0.03 | 15.08 ± 0.04 | 11.73 ± 0.17 | |
| V6 | 1973 ± 33 | 1349 ± 30 | 9.31 ± 0.02 | 13.99 ± 0.04 | 9.84 ± 0.19 | |
| White Varieties | ||||||
| Smederevka | Sm1 | 264.55 ± 7.39 | 134.39 ± 1.09 | 1.03 ± 0.01 | 1.49 ± 0.01 | 0.80 ± 0.02 |
| Sm2 | 274.32 ± 7.04 | 144.01 ± 1.21 | 1.04 ± 0.01 | 1.47 ± 0.01 | 0.73 ± 0.01 | |
| Sm3 | 305.59 ± 6.09 | 180.84 ± 1.77 | 1.04 ± 0.01 | 1.53 ± 0.01 | 0.81 ± 0.01 | |
| Sm 4 | 374.03 ± 11.33 | 224.59 ± 4.03 | 1.06 ± 0.01 | 1.57 ± 0.01 | 1.14 ± 0.01 | |
| Sm5 | 169.48 ± 4.16 | 67.11 ± 0.87 | 0.97 ± 0.01 | 1.36 ± 0.01 | 0.51 ± 0.01 | |
| Sm6 | 213.58 ± 6.14 | 51.40 ± 0.81 | 1.00 ± 0.01 | 1.35 ± 0.01 | 0.59 ± 0.01 | |
| Temjanika | T1 | 243.04 ± 6.55 | 88.54 ± 1.31 | 0.95 ± 0.01 | 1.37 ± 0.01 | 0.70 ± 0.01 |
| T2 | 277.52 ± 5.98 | 170.37 ± 1.18 | 1.04 ± 0.01 | 1.49 ± 0.01 | 1.00 ± 0.01 | |
| T3 | 434.27 ± 7.04 | 296.05 ± 5.92 | 1.07 ± 0.01 | 1.60 ± 0.01 | 1.30 ± 0.01 | |
| T4 | 249.94 ± 3.85 | 58.45 ± 0.27 | 0.99 ± 0.01 | 1.38 ± 0.01 | 0.54 ± 0.02 | |
| T5 | 210.58 ± 2.11 | 49.00 ± 0.97 | 1.01 ± 0.01 | 1.39 ± 0.01 | 0.59 ± 0.02 | |
| T6 | 294.38 ± 9.07 | 126.31 ± 0.30 | 1.01 ± 0.01 | 1.46 ± 0.01 | 0.81 ± 0.01 | |
| Zhilavka | Z1 | 273.44 ± 4.93 | 128.69 ± 2.43 | 1.03 ± 0.01 | 1.49 ± 0.01 | 0.91 ± 0.02 |
| Z2 | 354.53 ± 0.72 | 191.37 ± 0.13 | 1.07 ± 0.01 | 1.53 ± 0.01 | 1.18 ± 0.01 | |
| Z3 | 367.92 ± 3.03 | 97.30 ± 1.74 | 1.07 ± 0.01 | 1.50 ± 0.02 | 0.98 ± 0.01 | |
| Z4 | 247.65 ± 0.57 | 78.03 ± 0.99 | 1.01 ± 0.01 | 1.40 ± 0.01 | 0.78 ± 0.01 | |
| Z5 | 241.46 ± 2.34 | 61.23 ± 1.04 | 1.04 ± 0.01 | 1.40 ± 0.01 | 0.71 ± 0.01 | |
| Z6 | 325.34 ± 3.35 | 190.93 ± 0.54 | 1.04 ± 0.01 | 1.50 ± 0.01 | 1.12 ± 0.01 | |
* All results are presented as mean value of three measurements (n = 3) together with the standard deviation (±s).
Table 2.
Total tannin content (TTC) by the leucoanthocyanin (LA) method and the vanillin assay (VA) and total anthocyanin content (TAC) of the three red varieties examined (the lowest and the highest values within each variety are shown in bold) *.
Table 2.
Total tannin content (TTC) by the leucoanthocyanin (LA) method and the vanillin assay (VA) and total anthocyanin content (TAC) of the three red varieties examined (the lowest and the highest values within each variety are shown in bold) *.
| Wine Variety | Sample No | TTC (g TT/L) LA | TTC (g CE/L) VA | TAC (mg/L) |
|---|---|---|---|---|
| (±s, n = 3) | ||||
| Kratoshija | K1 | 2.52 ± 0.18 | 1.20 ± 0.05 | 225.72 ± 4.82 |
| K2 | 2.22 ± 0.58 | 1.56 ± 0.01 | 291.63 ± 1.32 | |
| K3 | 2.03 ± 0.22 | 0.19 ± 0.01 | 96.06 ± 0.46 | |
| K4 | 2.94 ± 0.02 | 1.70 ± 0.01 | 216.47 ± 1.47 | |
| K5 | 0.72 ± 0.02 | 0.27 ± 0.04 | 60.50 ± 1.26 | |
| Stanushina | S1 | 2.60 ± 0.05 | 0.92 ± 0.11 | 82.51 ± 0.60 |
| S2 | 0.73 ± 0.02 | 0.12 ± 0.02 | 33.48 ± 0.56 | |
| S3 | 0.51 ± 0.05 | 0.17 ± 0.01 | 35.62 ± 0.72 | |
| S4 | 0.33 ± 0.03 | 0.32 ± 0.04 | 24.52 ± 2.52 | |
| S5 | 2.03 ± 0.04 | 1.52 ± 0.01 | 21.24 ± 0.28 | |
| Vranec | V1 | 3.86 ± 0.06 | 1.78 ± 0.04 | 272.58 ± 16.01 |
| V2 | 2.91 ± 0.03 | 1.07 ± 0.03 | 225.27 ± 3.44 | |
| V3 | 3.90 ± 0.03 | 2.20 ± 0.01 | 216.95 ± 7.19 | |
| V4 | 2.32 ± 0.09 | 1.45 ± 0.01 | 273.06 ± 1.80 | |
| V5 | 2.86 ± 0.05 | 1.92 ± 0.01 | 196.43 ± 5.17 | |
| V6 | 2.23 ± 0.03 | 1.37 ± 0.03 | 121.15 ± 3.12 | |
* All results are presented as mean value of three measurements (n = 3) together with the standard deviation (±s).
Table 3.
Pearson’s correlation analysis between results of TPC, TFC, TAC, LA, VA, DPPH, FRAP and CUPRAC assays for all wine varieties.
Table 3.
Pearson’s correlation analysis between results of TPC, TFC, TAC, LA, VA, DPPH, FRAP and CUPRAC assays for all wine varieties.
| DPPH | FRAP | CUPRAC | |
|---|---|---|---|
| (mmol TE/L) | |||
| TPC (mg GAE/L) * | 0.987 * | 0.970 * | 0.957 * |
| TFC (mg CE/L) * | 0.990 * | 0.979 * | 0.972 * |
| TAC (mg TA/L) ** | 0.730** | 0.754 ** | 0.698 ** |
| LA (g TT/L) ** | 0.859 ** | 0.906 ** | 0.877 ** |
| VA (g CE/L) ** | 0.880 ** | 0.927 ** | 0.925 ** |
* Analysis applied to all wines (red and white; n = 34); ** Analysis applied to red wines only (n = 16).
© 2020 by the authors. Licensee MDPI, Basel, Switzerland. This article is an open access article distributed under the terms and conditions of the Creative Commons Attribution (CC BY) license (http://creativecommons.org/licenses/by/4.0/).
Share and Cite
MDPI and ACS Style
Mitrevska, K.; Grigorakis, S.; Loupassaki, S.; Calokerinos, A.C. Antioxidant Activity and Polyphenolic Content of North Macedonian Wines. Appl. Sci. 2020, 10, 2010. https://0-doi-org.brum.beds.ac.uk/10.3390/app10062010
AMA Style
Mitrevska K, Grigorakis S, Loupassaki S, Calokerinos AC. Antioxidant Activity and Polyphenolic Content of North Macedonian Wines. Applied Sciences. 2020; 10(6):2010. https://0-doi-org.brum.beds.ac.uk/10.3390/app10062010
Chicago/Turabian StyleMitrevska, Katerina, Spyros Grigorakis, Sofia Loupassaki, and Antony C. Calokerinos. 2020. "Antioxidant Activity and Polyphenolic Content of North Macedonian Wines" Applied Sciences 10, no. 6: 2010. https://0-doi-org.brum.beds.ac.uk/10.3390/app10062010
Note that from the first issue of 2016, this journal uses article numbers instead of page numbers. See further details here.