Article

Thermal Analysis of Photoelectron Emission (PE) and X-ray Photoelectron Spectroscopy (XPS) Data for Iron Surfaces Scratched in Air, Water, and Liquid Organics

1
Department of Materials Science, Ibaraki University, Hitachi, Ibaraki 316-8511, Japan
2
Ashikaga Institute of Technology, Ashikaga 326-8558, Japan
3
Institute of Mesotechnology, 2-2-1-201 Nakahara, Kashiwa 277-0085, Japan
*
Author to whom correspondence should be addressed.
Submission received: 4 February 2020 / Revised: 7 March 2020 / Accepted: 16 March 2020 / Published: 20 March 2020

Abstract

:

Featured Application

This work describes the results of Arrhenius plot analysis of photoelectron emission (PE) and X-ray photoelectron spectroscopy (XPS) data for scratched iron surfaces. The data were obtained as a function of three variables of temperature, photon energy, and scratching environments. This study is considered to contribute to better understanding of electron transfer occurring across the real metal surfaces in the fields such as tribology, adhesion, catalysis, corrosion, and so on.

Abstract

Little is known about the temperature dependence of electron transfer occurring at real metal surfaces. For iron surfaces scratched in seven environments, we report Arrhenius activation energies obtained from the data of photoelectron emission (PE) and X-ray photoelectron spectroscopy (XPS). The environments were air, benzene, cyclohexane, water, methanol, ethanol, and acetone. PE was measured using a modified Geiger counter during repeated temperature scans in the 25–339 °C range under 210-nm-wavelength light irradiation and during light wavelength scans in the range 300 to 200 nm at 25, 200, and 339 °C. The standard XPS measurement of Fe 2p, Fe 3p, O 1s, and C 1s spectra was conducted after wavelength scan. The total number of electrons counted in the XPS measurement of the core spectra, which was called XPS intensity, strongly depended on the environments. The PE quantum yields during the temperature scan increased with temperature, and its activation energies (ΔEaUp1) strongly depended on the environment, being in the range of 0.212 to 0.035 eV. The electron photoemission probability (αA) obtained from the PE during the wavelength scan increased with temperature, and its activation energies (ΔEαA) were almost independent of the environments, being in the range of 0.113–0.074 eV. The environment dependence of the PE behavior obtained from temperature and wavelength scans was closely related to that of the XPS characteristics, in particular, the XPS intensities of O 1s and the O2− component of the O 1s spectrum, the acid–base interaction between the environment molecule and Fe–OH, and the growth of non-stoichiometric FexO. Furthermore, the origin of the αA was attributed to the escape depth of hot electrons across the overlayer.

Graphical Abstract

1. Introduction

Much attention is given to studying charge transfer and electronic excitation in the overlayers of real metallic surfaces in relation to various problems in tribology, lubrication, adhesion, corrosion, and so on [1,2]. The present study reveals the effects of temperature, photon energy, and surface overlayer on photoelectron emission (PE) from scratched iron surfaces. PE takes place when photons are absorbed by electrons, reaching the release of these photon-absorbing electrons from the surface. The theoretical basis of PE is well expressed by Spicer’s three-step model [3]. This divides the photoemission into three successive steps: (a) optical excitation, (b) transport of photo-excited electrons to the surface, and (c) release of excited electrons into a vacuum. In addition, the parameters of the emitter, such as the optical absorption coefficient, electron–electron scattering mechanisms, and height of the potential barrier at the surface [4] are also related to this theory. For real iron surfaces, however, electron emission at low temperature close to room temperature is very weak even in response to irradiation by photons with energy greater than the work function of the metal. This observation can be attributed to the effect of the surface overlayer. This film is formed by adsorbed species, such as oxides, hydroxyl groups, reaction products, and carbon materials, as a result of the interaction of the metal with the environment. Information known about the temperature dependence of the transfer of electrons photo-excited from the metal base through superficial layers is limited, owing to the difficulties related to experimental measurements of such electrons. We developed a non-vacuum-based method to examine the influence of temperature and incident light wavelengths (photon energies) on PE from real iron surfaces. In the present study, for sample surfaces scratched in the environments such as air, water, and liquid organics, the PE results obtained from the PE measurement, carried out in two ways as a function of temperature and light wavelength, were reexamined in more detail in relation to the X-ray photoelectron spectroscopy (XPS) results.
In the first case, for real iron surfaces scratched in air, water, and liquid organic environments, we outlined the results of PE previously reported, often called thermally assisted photoelectron emission (TAPE) [5], as well as the results of XPS. The experiments were carried out to examine the influence of the interaction between mechanical deformed metal surfaces and the environments on the PE behavior of the surfaces. Mechanical deformation was conducted by scratching sample surfaces with a diamond cutter in seven environments such as air, benzene, cyclohexane, water, methanol, ethanol, and acetone. Then, the intensity of PE was measured as a function of temperature under 210-nm-wavelength light irradiation using a modified Geiger counter. Temperature was swept in the 25–339 °C range in two cycles of temperature increase and subsequent reduction. The first cycle was called Up1 and Down1 scans, while the second cycle was called Up2 and Down2 scans. Here, Up and Down mean temperature increase and temperature decrease, respectively. Four PE glow curves, expressing the PE intensity as a function of temperature, were obtained for a scratched sample [6]. The PE glow curve obtained in the Up1 scan was found to be strongly affected by the environment in which scratching was performed, while those obtained in the following three scans took a similar trend and were almost independent of the environment. For the above-scratched iron samples, we obtained the activation energies from the glow curves of PE quantum yield (emitted electrons per incident photon), Y, during four temperature scans under 210-nm-wavelength light irradiation and reported their relationship with the acid–base interaction between molecules of the liquid environments and Fe–OH on the surface [5]. The Arrhenius activation energy was obtained using an Arrhenius type Equation (1), for YGC values at seven temperatures selected in the glow curves.
YGC = Y0exp(−ΔEa/kBT),
where YGC is the quantum yield, ΔEa is the activation energy, Y0 is the pre-exponential factor, kB is Boltzmann’s constant, and T is the temperature in Kelvin. The activation energies during the Up1 scan, ΔEaUp1, were in the 0.212–0.035 eV range, greatly depending on the environment; water produced much higher ΔEaUp1 than acetone. This difference was explained in terms of the acid–base interaction between the molecule of the environments, whose properties of acceptor number and proton affinity were considerably different, and the hydroxyl group of Fe–OH. The ΔEaDown1, ΔEaUp2, and ΔEaDown2 values were maintained in the 0.038–0.012 eV range. In addition, the values of the total count of electrons emitted during the Up1 and Up2 temperature scans, called NUp1 and NUp2, were obtained as one of the PE characteristics. It was shown that the values of NUp1 and NUp2 decreased with increasing ΔEaUp1 and ΔEaUp2, respectively. Furthermore, the appearance of a convex swelling peak in the PE glow curves during the Up1 scan was associated with the thermal removal of carbon materials weakly bound to the sample surface and the enhancement of the basicity of the oxygen atom of the Fe–OH group, owing to continuous irradiation of 210-nm-wavelength light during the temperature increase, producing a different mode of the acid–base interaction with the molecule of the environments.
In the second case, we outlined the experimental results of PE obtained during scanning the wavelength of irradiated light for scratched iron surfaces at fixed temperatures of 25, 200, and 339 °C. The temperatures of 200 and 339 °C were maintained after the PE measurement was conducted by increasing temperature to these final temperatures in the same way as in the Up1 scan under 210-nm-wavelength light irradiation mentioned above [7]. Firstly, we describe the principle of the analysis of the photoelectron emission during the light wavelength scan from 300 to 200 nm. The analysis of PE behavior as a function of incident photon energy and temperature was based on a theoretical equation. Fowler [8] and DuBridge [9,10] showed that the photoelectric current per unit area for unit intensity of radiation, I, from a metal surface excited by incident light at a certain temperature can be expressed by the following Equation (2), [10,11]:
I = αAT2f(x),
where α is a dimensionless proportionality factor, which is related to the probability of an electron absorbing a quantum of the incident light. A is the Richardson constant (A = 1.20 × 10⁶ A·m−2·K−2), and T is the temperature in Kelvin. Here, it is noted that, in the present study, αA is referred to as the electron photoemission probability. f (x) represents the universal function of the parameter x ≡ (hν − ϕ)/kBT, which is given by the following Equation (3):
f (x) = π2/6 + x2/2 − (ex − e−2x/22 + e−3x/32 − ⋯ ) for x ≥ 0,
where h is Planck’s constant, ν is the frequency of the incident light, ϕ is the photothreshold of the metal, kB is Boltzmann’s constant, and is the photon energy of the incident light. Using the notation YFD and Ep instead of I and , respectively, in Equation (2), and to a good approximation, replacing Equation (3) by x2/2, we can derive an approximate Equation (4), used for the photoemission.
YFD = αA(Epϕ)2/2kB2,
where YFD is the quantum yield, Ep is the incident photon energy, and ϕ is the photothreshold (photoelectric work function). Here, it should be noted that, previously, we examined the ratio of the magnitude of π2/6 (= 1.64) to that of x2/2 in Equation (3) at the present experimental condition and verified that the ratio is small, reaching a conclusion that the approximate Equation (4) can be used [7]. It is seen that the plot of the square root of YFD against Ep in Equation (4) falls on a straight line, giving the values of both (αA/2kB2)1/2 and ϕ. In fact, in the work, the values of αA were obtained by fitting the PE data of the electron emission intensity, represented by the unit of counts·min−1, as a function of Ep to Equation (4). Typical plots of the PE data against Ep are presented in Figure 1 in Reference [7]. The PE experiments and results for the wavelength scan were summarized as follows [7]: (1) the wavelength was scanned in the 300–200 nm range at 25, 200, and 339 °C; (2) using the electron emission intensity, from which PE quantum yields can be estimated, as a function of wavelength of incident light, the values of electron photoemission probability, αA, and photothreshold, ϕ, were determined. Both αA and ϕ values increased with increasing temperature. This means that the factor governing the increase of PE with temperature is αA, but not ϕ; (3) in addition, the total number of emitted electrons during the wavelength scan, NT, and the emission intensity at a wavelength of 210 nm, I210, during the wavelength scan were obtained; (4) from the Arrhenius plots of the logarithm of αA, NT, and I210 values against the reciprocal of the above three temperatures in Kelvin, the activation energies ΔEαA, ΔENT, and ΔE210 were estimated. It was found that the values of ΔEαA, ΔENT, and ΔE210 were almost independent of the environments.
The purpose of the present PE study was to more quantitatively analyze the dependence of PE characteristics for scratched iron surfaces on scratching environments, particularly the surface oxygen, temperature, and photon energy. Firstly, we describe the dependence of XPS spectra of Fe 2p, Fe 3p, O 1s, and C 1s at three temperatures of 25, 200, and 339 °C for scratched iron samples on the scratching environments. The total number of the electrons counted in the XPS measurements of these spectra, called XPS intensity, was used as one of the XPS characteristics to feature the environments. Furthermore, the XPS intensity of oxygen components obtained from the resolution of O 1s spectrum was used as another feature of the XPS characteristics. Then, the activation energies were obtained from Arrhenius plots of the XPS characteristics such as the XPS intensity and the maximum peak intensity of the Fe 2p, Fe 3p, and O 1s spectra. Secondly, the relationship of PE characteristics during Up1 and Up2 temperature scans, that is, the total count of electrons emitted during Up1 and Up2 scans, NUp1 and NUp2, and the activation energies, ΔEaUp1 and ΔEaUp2, with the environments was examined. In addition, the relationship between the PE characteristics, ΔEaUp1 and NUp1 and ΔEaUp2 and NUp2, was described. Thirdly, the dependence of PE characteristics obtained from the light wavelength scan at the above three temperatures on the environments was examined. The PE characteristics during the wavelength scan were as follows: αA, NT, ϕ, and their activation energies of ΔEαA, ΔENT, and ΔEϕ. Furthermore, the relationship of αA to XPS Fe 2p, Fe 3p, and O 1s intensities was intensively examined. After that, the relationship between the acceptor number of the liquid environment molecule and the activation energies obtained from the XPS characteristics and the PE characteristics during temperature and wavelength scans was examined. Fourthly, in order to clarify how the origin of αA can be related to the escape depth in the overlayer of hot electrons excited from the metal base, we examined the dependence of PE quantum yields, Y, at four wavelengths—λ = 200, 210, 220, and 230 nm—and their activation energy, ΔE, on the environments. Fifthly, we tried to clarify why the PE quantum yield increases with temperature during the Up1 temperature scan. The following factors were examined: (1) the determination of structure of the overlayer consisting of a mixed trilayer of FexO, Fe3O4, and FeOOH, particularly the promotion of the oxide layer structure, including O2− ions with temperature; (2) the acid–base interaction of the molecule of the environments with Fe–OH, producing an electric dipole; (3) the presence of FexO with a p-type semiconductor characteristic [12], which is considered based on the ratio of XPS intensity of the O2− component of the O 1s spectrum to the XPS intensity of Fe 2p and Fe 3p at 25, 200, and 339 °C, and which is thought to grow with temperature in the neighborhood of the interface between the base metal; (4) the presentation of the band model of the energy diagram for FexO.

2. Materials and Methods

2.1. Materials

The metal samples used were 0.1-mm-thick commercial rolled iron sheets (Nilaco, Tokyo, Japan). The purity was 99.5% and the impurities contained were Mn (3000 ppm), Si (1000 ppm), C (<800 ppm), P (<400 ppm), and S (<500 ppm). The ambient air, distilled water, and organic liquids (reagent grade) of benzene (C6H6), cyclohexane (C6H12), methanol (CH3OH), ethanol (C2H5OH), and acetone ((CH3)2CO) were used as the scratching environments. Prior to the scratching, the metal samples were cut to 20 × 30 mm2 in size, and they were ultrasonically cleaned twice in 30 mL of acetone (reagent grade) for 15 min (i.e., a total time was 30 min) to remove contaminants on their surfaces, before being dried under vacuum for 15 min and stored in a desiccator. After that, the sample to be scratched was placed in ambient air, distilled water, or an organic liquid in a glass petri dish. The entire surface of the sample was then scratched uniformly using a manually operated diamond cutter. The scratching conditions were as follows: scratch width = 0.4 mm; scratch length = 30 mm; scratch frequency = 60 scratches per minute; scratch period = 5 min. This means that the entire surface of the sample was scratched six times. Two samples scratched in ambient air gave almost the same Fe 3p spectrum assigned to the fresh metal surface. Thus, it was confirmed that the effect of the scratching was independent of the operator. The temperature and relative humidity of the ambient air were 23–26 °C and 21%–31%, respectively. Finally, the scratched surfaces were dried under vacuum conditions for 15 min.

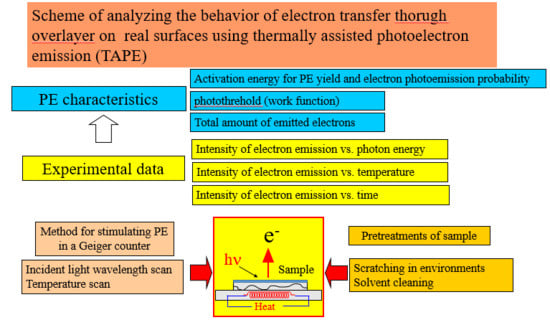
2.2. Thermally Assisted PE

The TAPE measurement apparatus was shown in detail previously [5,13]. We briefly describe the measurement apparatus and its operation procedure. The measurement chamber was a gas-flow-type Geiger counter. Q gas (Takachiho, Tokyo, Japan) consisting of a mixture of 99% He gas (purity of 99.999%) and 1% iso-C4H10 (isobutane) vapor was used as the counter gas. The electron counting system consisted of a radiation counter and a linear count rate meter (Ohyo Koken Kogyo, Tokyo). The light irradiation was performed using a system consisting of a grating monochromator and a wavelength drive unit connected to an ultraviolet (UV) source (Ritu Oyo Kougaku, Niiza, Japan). The UV source was a deuterium lamp (Hamamatsu Photonics). The heating system consisted of a temperature controller equipped with a chromel–alumel thermocouple (Rigaku, Akishima, Tokyo).
Firstly, a sample was mounted on the sample holder of the measuring chamber, and then the Q gas was continuously flowed into the chamber at atmospheric pressure at a rate of 100 sccm, where the sample surface was directly exposed to the Q gas. The sample was placed 20 mm below the grid of the cathode, and the area of the sample exposed to the incident light was 0.5 × 3 mm2 in the center of the sample. In all experiments, the direction of the light irradiation was approximately normal to the plane of the sample.
The intensity of TAPE was measured in two experimental methods: (1) during a temperature scan under light irradiation at a fixed wavelength, and (2) during a wavelength scan at a fixed temperature. The PE results from the scratched samples during the temperature scan were reported previously [5,6]. Here, we briefly describe the operation conditions used in the temperature scan. Under 210-nm-wavelength light irradiation, in the first cycle, the temperature of the sample was increased from 25 to 339 °C (Up1 scan) (time required for the scan = 950 s) and then decreased from 339 to 40 °C (Down1); subsequently, a second cycle of an increase from 40 to 339 °C (Up2) and a decrease from 339 to 25 °C (Down2) was performed. In the Up1 and Up2 scans, the sample was heated at the rate of 20 °C/min. The power of the 210-nm-wavelength light irradiation (photon energy = 5.904 eV) was 110 nW (photon flux = 1.16 × 10¹¹ photons/s). This power was used to continuously irradiate the sample area during the temperature scan
Next, the PE measurement during the wavelength scan was carried out over the wavelength range 300–200 nm at the scan rate of 0.4 nm/s (time required for the scan = 250 s) at three temperatures of 25, 200, and 339 °C. The wavelength scans at the temperatures of 200 and 339 °C were performed after the PE measurement was conducted by increasing the temperature to these final temperatures in the same manner as in the Up1 scan under 210-nm-wavelength light irradiation mentioned above. Here, it is noted that the sample scanned at 25 °C was not previously exposed to the 210-nm incident light. A newly scratched sample was used for a wavelength scan at each temperature of 25, 200, and 339 °C, and the wavelength scan was conducted twice at each temperature. The dependence of the power of the UV source on the incident light wavelength was measured. The power during the wavelength scan was in the range of 93–110 nW for the wavelength range of 200 nm (6.20 eV) to 240 nm (5.17 eV). The power then slowly decreased with increasing wavelength from 245 to 300 nm, reaching 20 nW at 300 nm. In Figure 2 in Reference [7], the plots of (electron emission intensity)1/2 against the photon energy are shown, giving an approximately straight line in the incident photon energy range of 6.1–5.17 eV. To estimate the value of αA, the average photon flux, 1.13 × 10¹¹ photons/s, was obtained using the power of incident light in the range 6.20−5.17 eV (200−240 nm) [5].

2.3. XPS(X-ray Photoelectron Spectroscopy)

The results of the standard XPS measurements were previously reported for the samples scratched in different environments [6]. In the present study, we pay much attention to the data itself obtained in the XPS measurements. The sample for the XPS measurement was prepared after the PE measurement during the wavelength scan from 300 to 200 nm at 25 °C and after cooling to 25 °C following the PE measurement during the wavelength scan from 300 to 200 nm at 200 and 339 °C. A sample was cut to 3 × 3 mm2 in size, in which the spot area exposed to the incident light was included, and then the cut sample was rapidly transported to the measuring chamber of the XPS apparatus. The sample surface was exposed to ambient room air for a short time during transporting. During this procedure, the sample surface was successively exposed to Q gas, ambient room air, and vacuum before the commencement of the XPS measurements. Therefore, we have to consider the effect of the moisture in the room air on the sample surface. It is noted that, in our measurement room, the XPS apparatus was placed closely to the TAPE apparatus. The temperature and relative humidity of the room air were 23–26 °C and 21%–31%, respectively. Therefore, judging from the low humidity of the air and the presence of the hydroxyl groups on the real surface, which was presumed to reduce the activity to moisture, the effect of moisture from the ambient room air may be considered to be little and, even if it occurs, the moisture will be removed under vacuum in the XPS measurement. Of the core-level spectra measured using a Shimadzu ESCA 750 spectrometer (Shimadzu, Kyoto, Japan) with an Mg Kα X-ray source (8 kV and 30 mA), Fe 2p, Fe 3p, O 1s, and C 1s spectra were taken in the present study. The energy range and sensitivity factors of these spectra were as follows: Fe 2p (725–700 eV, 10.5); O 1s (540–528 eV, 2.9); C 1s (300–280 eV, 1.0); Fe 3p (65–45 eV, 1.54). Here, the energy range of 66–48 eV for Fe 3p reported previously [13] was changed to 65–45 eV. It is noted that the main peak in the C 1s spectrum appeared at the binding energy of 285 eV. In the present study, the number of electrons counted in the XPS measurement of each core spectrum, called XPS intensity for the core spectrum, was used to represent the XPS characteristics of the environments, but it was not divided by the sensitivity factor of the spectrum. The XPS intensity was calculated from the difference between the maximum and minimum values—meaning background subtraction—obtained by the Shimadzu ESCAPAC 760 data system attached to a Shimadzu ESCA 750 spectrometer. The resolution of the O 1s spectrum was performed by curve-fitting using the Gaussian and Lorentzian functions, into three components. The components were assigned to the lattice oxide ion (O2), the lattice hydroxyl group (OH and OHδ), and adsorbed water (H2O), according to Reference [14]. In addition, the XPS intensity for the three O 1s components was obtained by distributing the XPS O 1s intensity to the components. An example of the curve resolution of the O 1s spectrum for acetone is shown later. The chemical structure of the overlayer for the environments was judged based on the comparison of the shape of Fe 2p spectrum with that for the spectra reported in the literatures cited below.

3. Results and Discussion

3.1. XPS

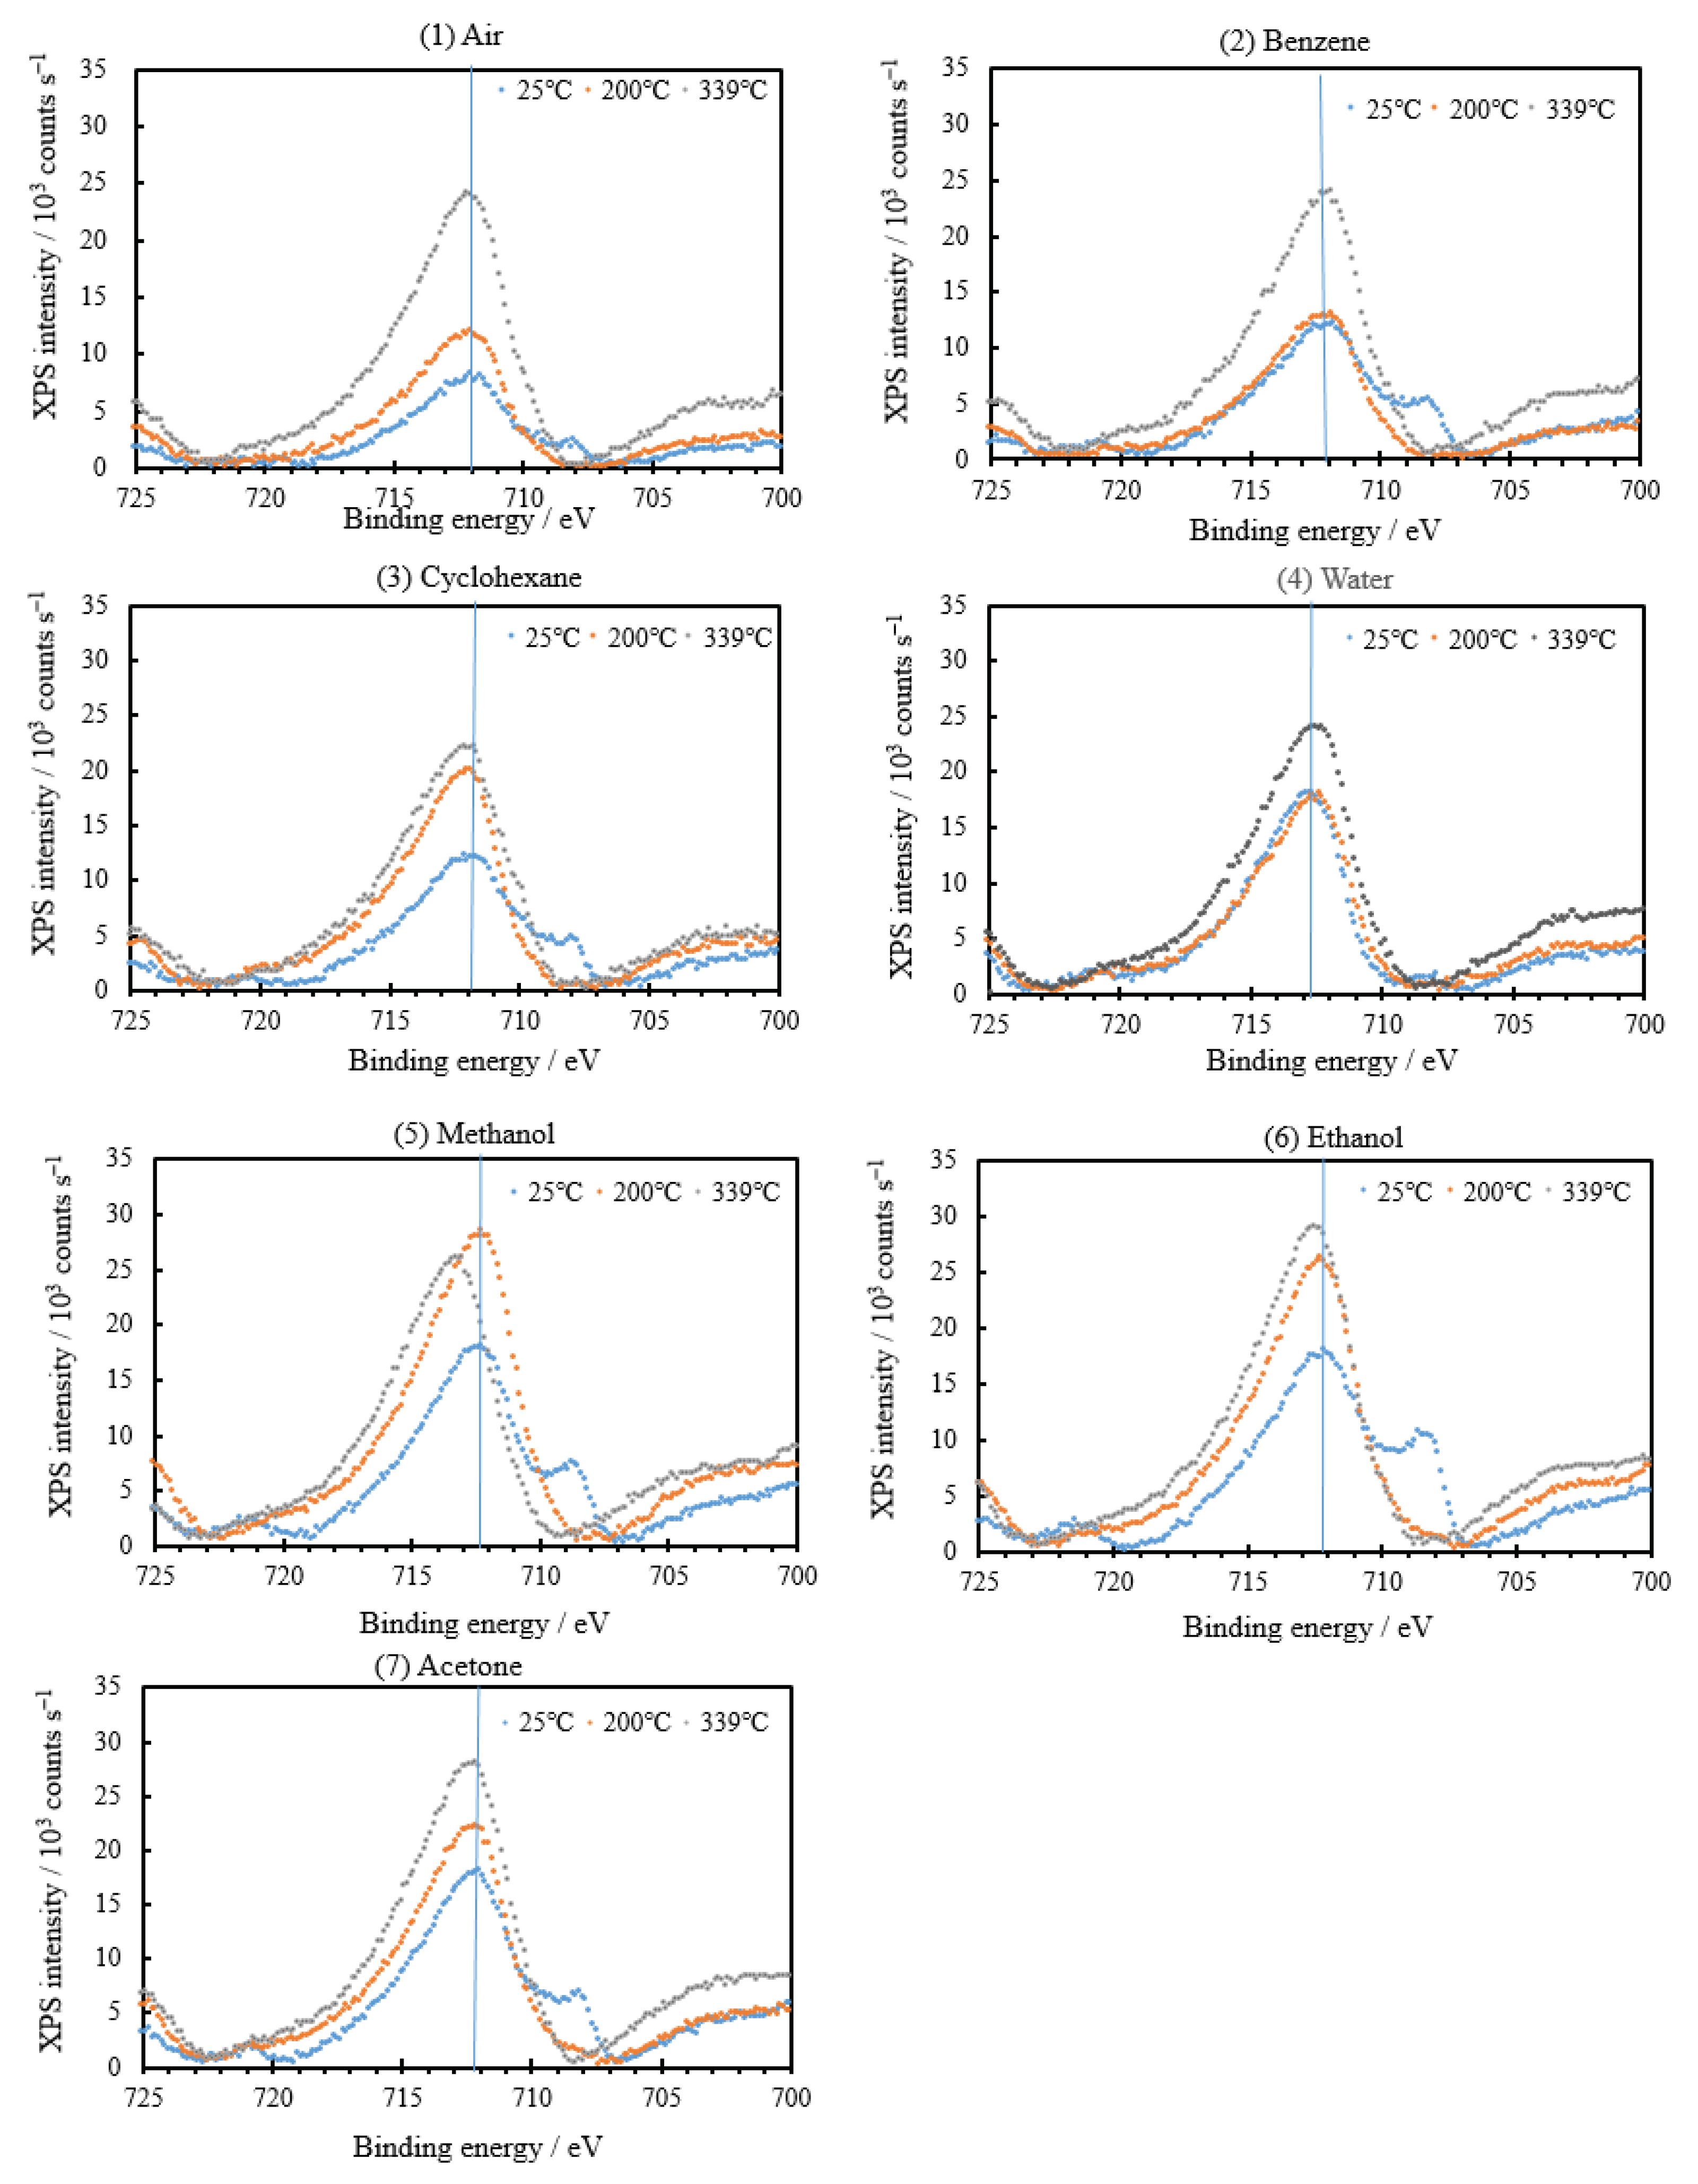
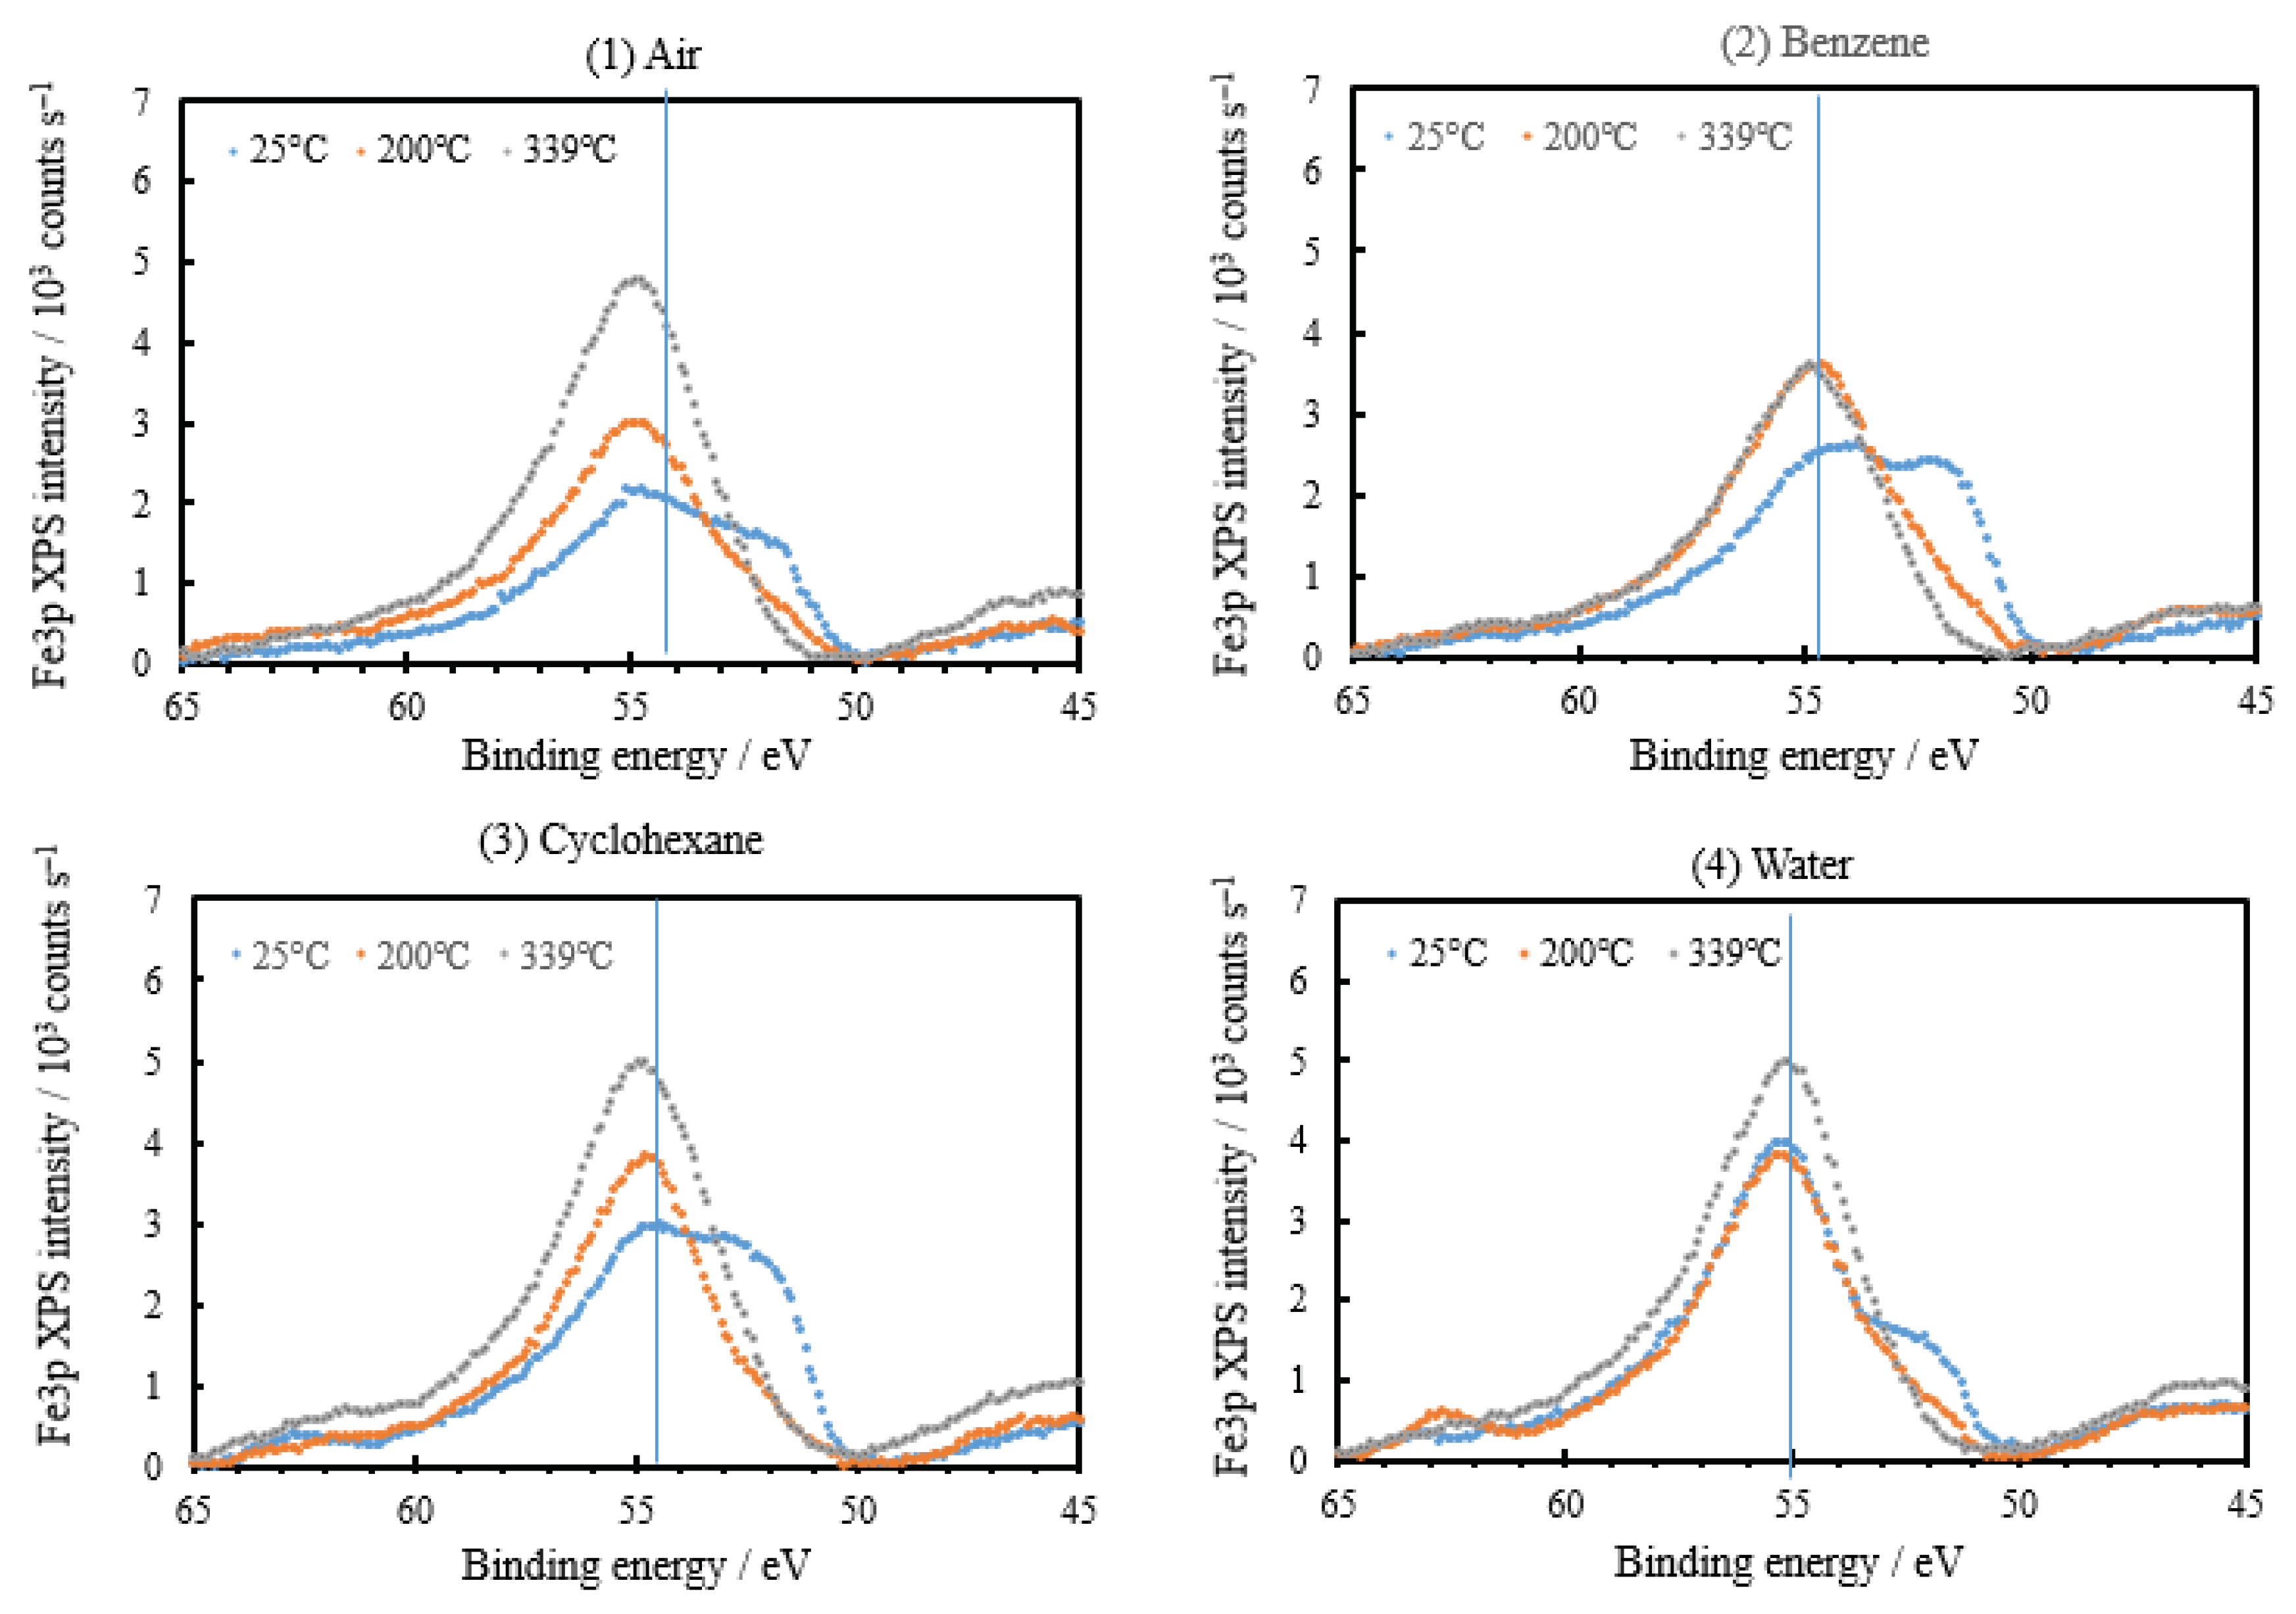
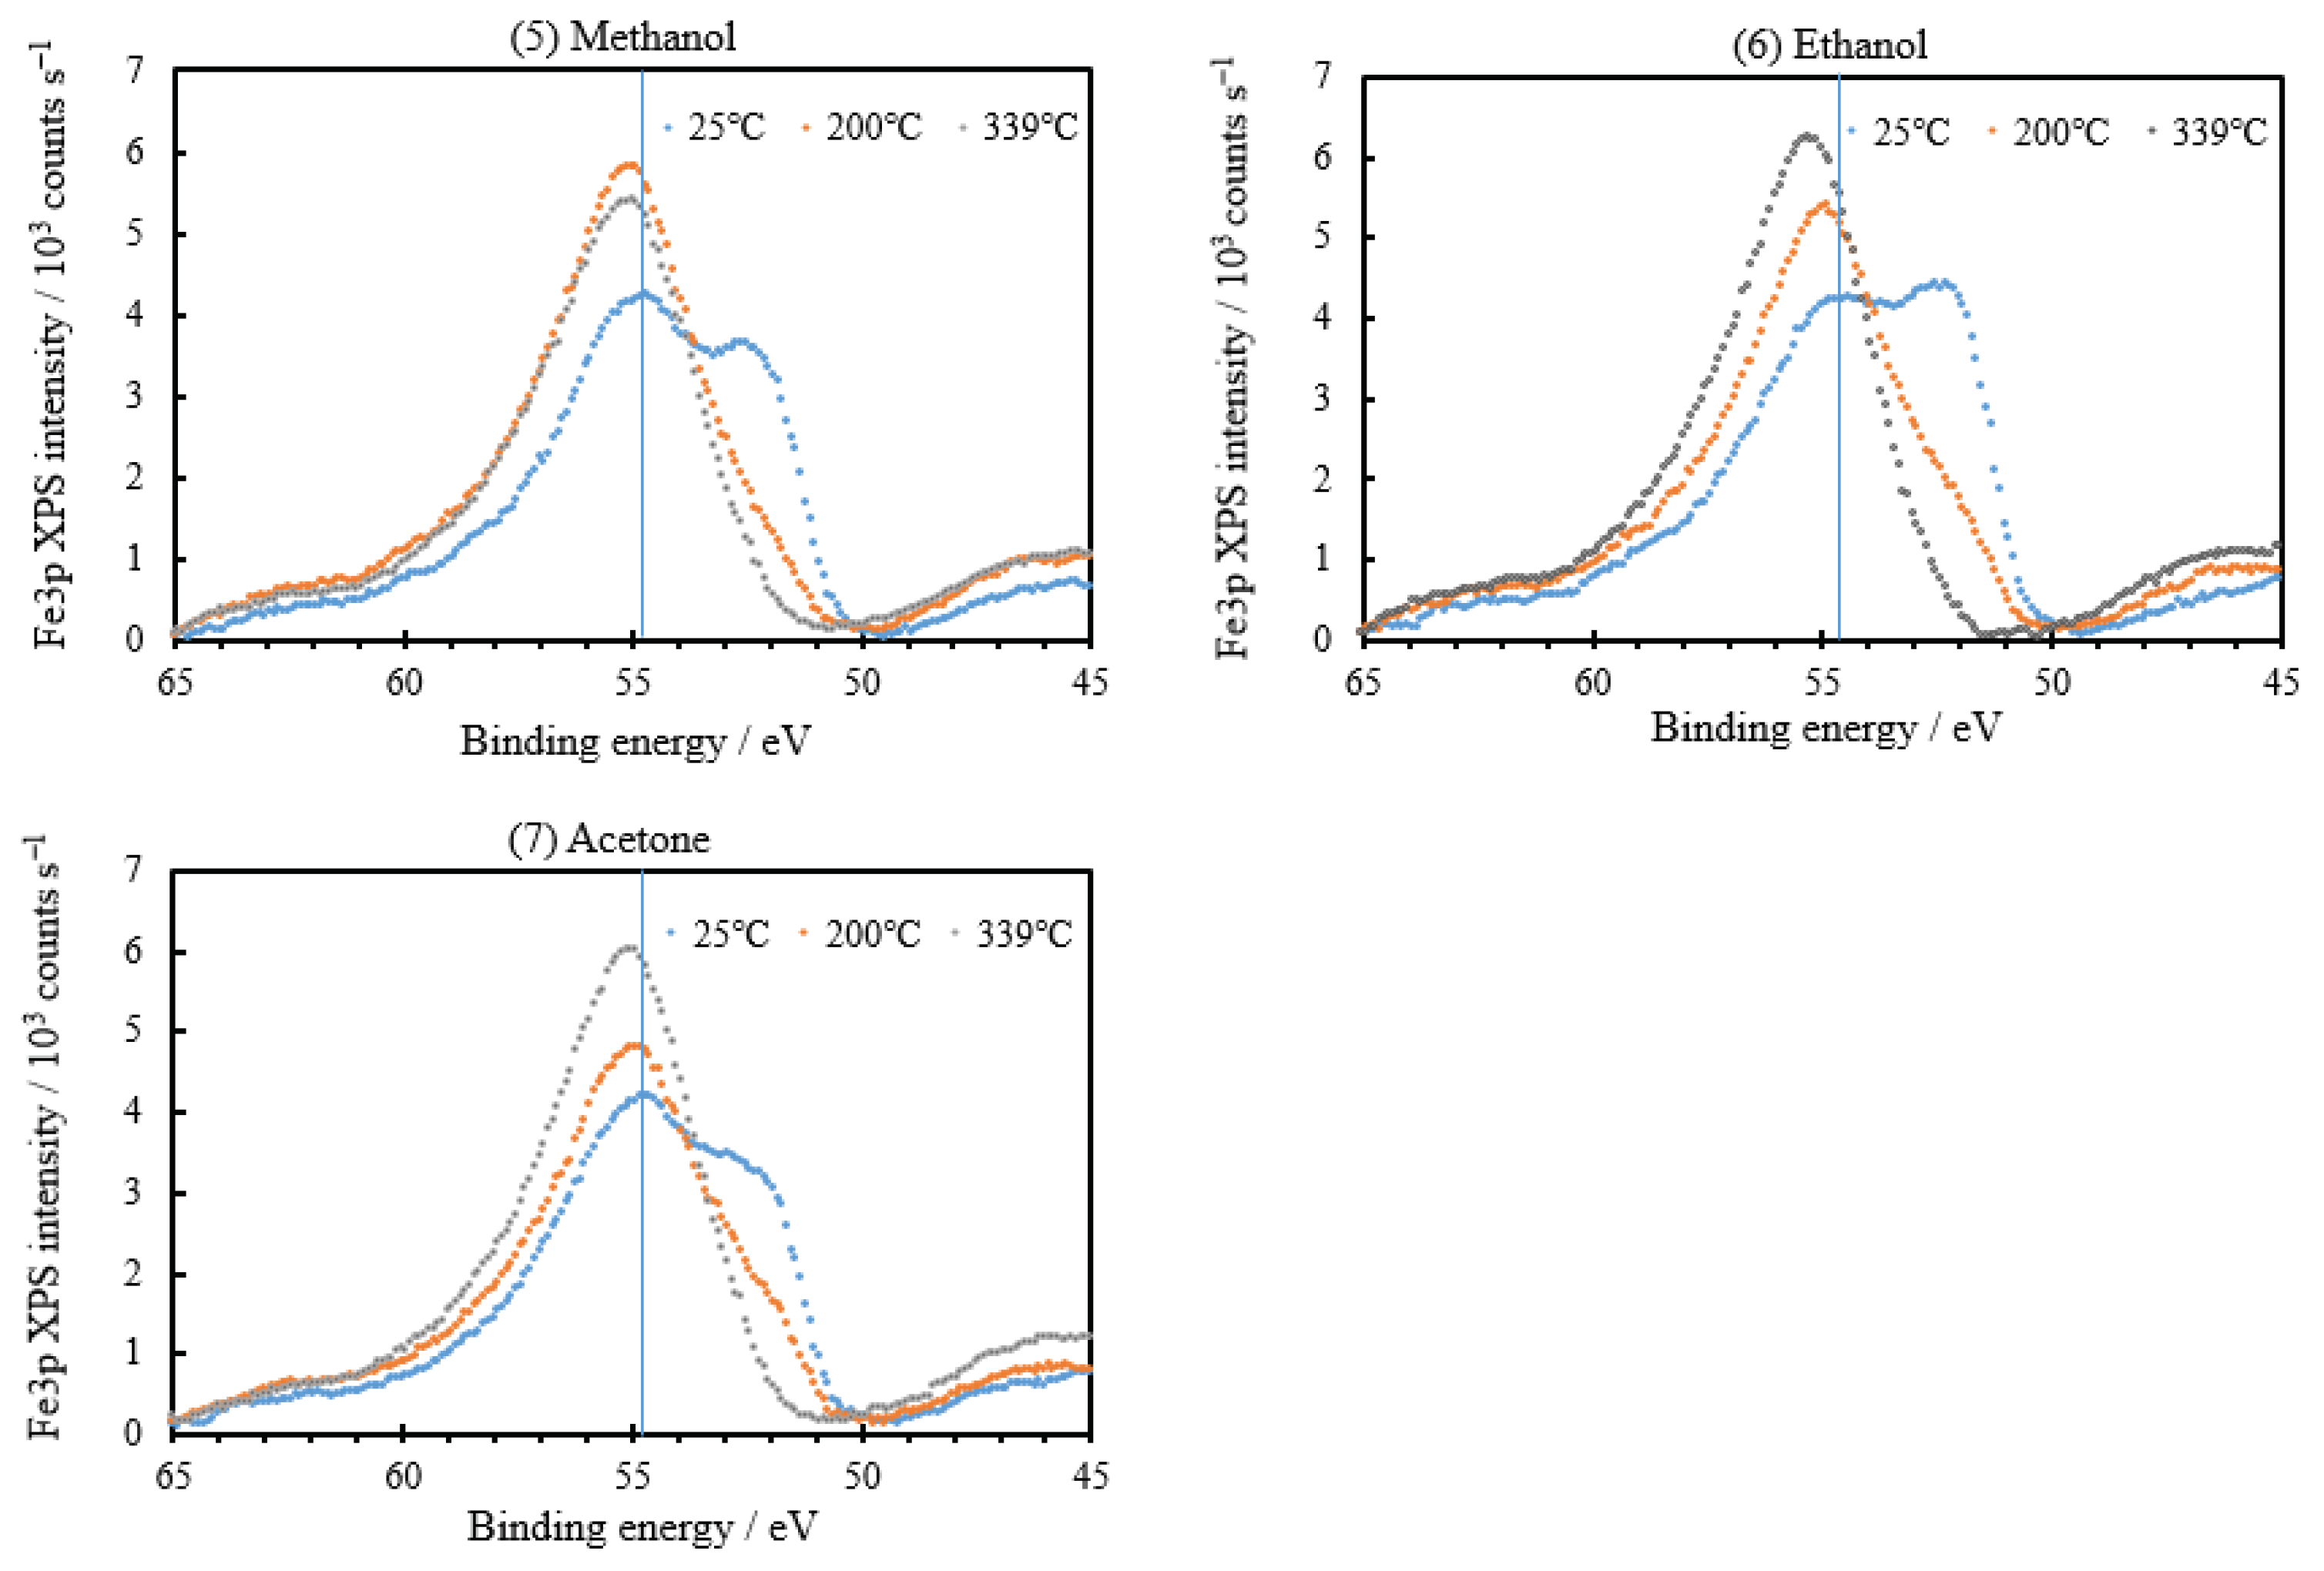
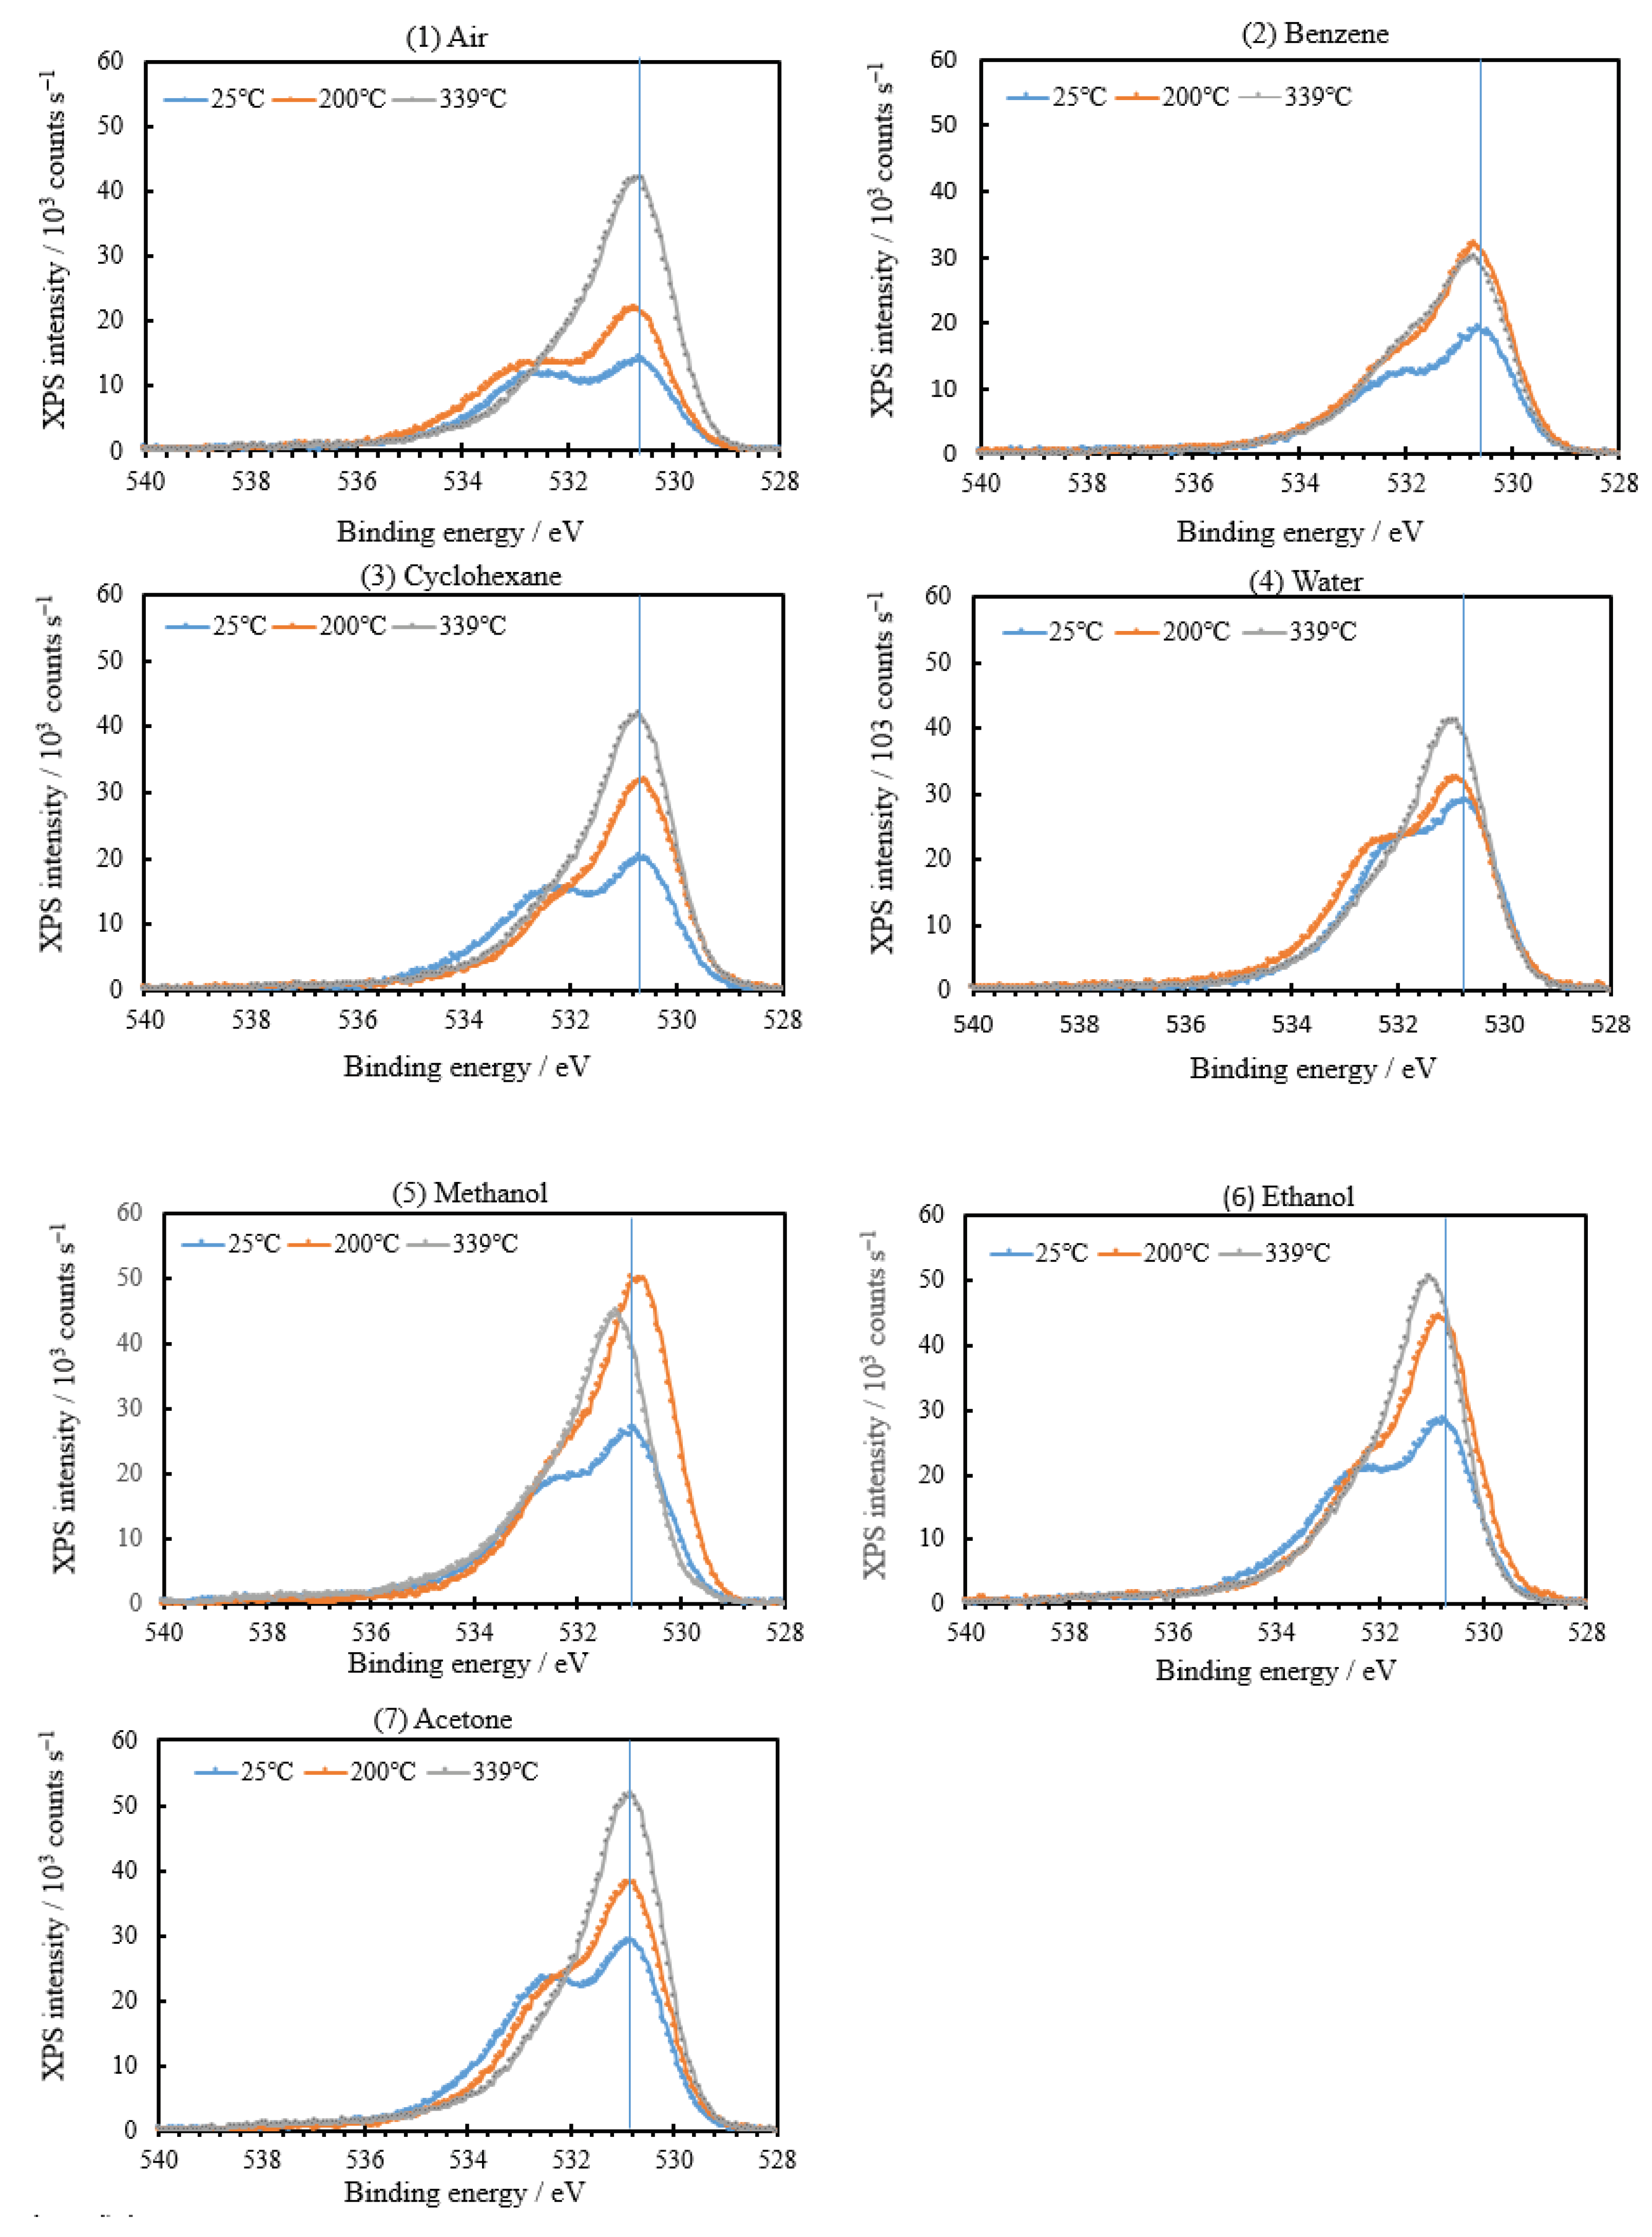
3.1.1. Dependence of XPS Spectra on Scratching Environments and Temperature

Figure 1 shows the Fe 2p spectra at 25, 200, and 339 °C for real iron surfaces scratched in different environments. The XPS measurement was carried out after the PE measurement at 25, 200, and 339 °C for real iron surfaces scratched in the environments. Although we already reported the change of Fe 2p and Fe 3p spectra with the increasing temperature for the scratched samples [6], in the present study, according to References [15,16,17,18,19,20], we reexamined in more detail the dependence of Fe 2p spectra on temperature and scratching environments. The intensities and binding energies of peaks—called Peaks I, II, and III—observed in the Fe 2p spectra are listed in Table 1. In Figure 1 and Table 1, it is seen that the Fe 2p spectrum at 25 °C for all environments had two small peaks (Peaks I and III) appearing at the binding energies of approximately 721 and 708 eV, respectively, and a main peak (Peak II) in the neighborhood of 712 eV. At 200 and 339 °C, while the small peaks almost disappeared, only the main peak with a similar shape, which increased in the intensity with temperature, was maintained at almost the same binding energy. We considered the assignment of these peaks. According to Reference [15], the binding energies of 706.75 eV (Fe 2p3/2) and 719.95 eV (Fe 2p1/2) are reported for the Fe metal, and those of 710.7 eV (Fe 2p3/2) and 724.3 eV (Fe 2p1/2) are reported for Fe2O3. Additionally, Graat and Somers [16] reported both 706.8 eV and 719.8 eV for Fe0, 709.8 eV, a satellite peak, and 722.8 eV for Fe2+, and 711.2 eV, a satellite peak, and 724.3 eV for Fe3+. According to McIntyre and Zetaruk [17], the following binding energies (eV) were assigned for Fe 2p3/2 for iron metal and iron oxides: 706.9 (Fe metal), 709.5 (FeO), 708.3 (Fe3O4), 711.0 (α-Fe2O3 and γ-Fe2O3), and 711.9 (α-FeOOH). According to the above references, the two small peaks observed in the present Fe 2p spectra can be attributed to Fe 2p3/2 and Fe 2p1/2 for Fe metal, respectively, and the main peak at 712 eV seems to originate from mainly Fe 2p3/2 peak for FeOOH. Here, the fact that the small peaks for Fe metal appeared at the binding energies of approximately 1 eV higher than those reported in References [15,16,17] suggests that the chemical shift may be caused by the effect of scratching on the metal, while the observed binding energy of 712 eV was almost identical to the value for the Fe 2p3/2 of FeOOH [17], resulting in the assignment of FeOOH. The chemical shift seems to be small for FeOOH. In Figure 1, at 200 and 339 °C, satellite peaks assigned to Fe 2p3/2 of Fe2+ and Fe3+ [16] seem to be negligible. It was reported that satellite peaks for FeO and Fe2O3 were absent for Fe3O4 [18,19]. Ogawa et al. [20] reported Fe 2p spectra of Fe−O−N films formed by sputtering iron metal at different O2 flow rates (fO2) in an Ar−N2−O2 gas mixture, and explained that the film structure with increasing O2 flow rate changes from a mixed phase of metallic Fe and Fe3O4 initially, to a mixed phase of FeO and α-Fe2O3, and finally, to α-Fe2O3. The shape of the Fe 2p spectrum at 25 °C obtained in our present experiment was very similar to that of the Fe 2p spectrum in the low-O2 flow rate stage in the range of 705−725 eV as shown in Figure 3a in Reference [20], except for the shift in binding energy. In Reference [20], at higher O2 flow rates, a mixed phase of FeO and α-Fe2O3 with a satellite peak at 718.9 eV, and α-Fe2O3 with a satellite peak at 719.2 eV were observed, respectively. Therefore, this suggests that the structure of the scratched surface at 25 °C may be composed predominantly of a mixed phase of metallic Fe and Fe3O4. Furthermore, Lin et al. [21] demonstrated a graphic representation of the oxides growth on iron surfaces as a function of oxygen exposures in Figure 5 in Reference [21], and they showed that the oxide films formed at low O2 exposure consist of predominantly FeOx and a thin film of FeOOH due to ambient background contamination on the top, while, at higher exposure, a trilayer oxide of FeO, Fe3O4, and FeOOH is formed. In our present experiment, from the increase in intensity of the O 1s peak appearing at approximately 530.8 eV in the O 1s spectrum with an increase in temperature, which is shown in Figure 3, as well as the increase in the XPS O 1s intensity, which represents the total number of electrons counted in the O 1s spectrum, with temperature, which is shown in Figure 4c, it is clear that the surface oxygen content increased with the increasing temperatures. Upon making the increase in O2 exposures in Reference [21] correspond to the increase of the surface oxygen amount with temperature in the present experiment, it is reasonable that the Fe 2p spectra at 200 and 339 °C shown in Figure 1 can be attributed to a mixed trilayer of FeO, Fe3O4, and FeOOH. We show later that XPS intensities of not only Fe 2p and Fe 3p, but also that of O 1s, increase with increasing temperature. We think that this occurred as a result of desorption of adsorbed water, the transport of oxygen species embedded in the inside to the surface, and the growth of the iron oxide species. Furthermore, we describe the contribution of the growth of non-stoichiometric oxide species, FexO, to the TAPE. Here, it is interesting to note that Fe3O4 (magnetite) contains both Fe3+ and Fe2+ at octahedral sites, and conduction can occur via the transfer of electrons from Fe2+ to Fe3+ [22]. It is thought that the transfer of electrons in Fe3O4 may be associated with the transport of electrons across the overlayer in the PE.
Figure 2 shows Fe 3p spectra at 25, 200, and 339 °C for real iron surfaces scratched in environments. In the Fe 3p spectrum at 25 °C, the shoulder peak assigned to Fe metal appeared at around 52.5 eV and was more evident than that in the Fe 2p spectra. This peak was gradually attenuated with temperature and disappeared at 339 °C. It is interesting that the Fe 3p spectra can be more strongly affected by the environment than the deeper core Fe 2p spectra shown in Figure 1.
Additionally, a main peak observed in the Fe 3p spectra, whose binding energy was almost temperature-independent, appeared at approximately 55 eV. This peak is considered to have originated from a mixed trilayer of FexO, Fe3O4, and FeOOH, and the binding energy can be assigned to both Fe 3p3/2 and Fe 3p1/2 [17]. In Table 2, the intensities and binding energies of Peaks 1 and 2 observed in the Fe 3p spectra are listed. It is confirmed that the emission intensities of Peak 1 at 339 °C and of Peak 2 at 25 °C for the environments decreased in approximately the same order of the environments as those of Peak II at 339 °C and of Peak III at 25 °C, as shown in Table 1, respectively.
The O 1s spectra are shown in Figure 3. The curve resolutions of these spectra are described later.

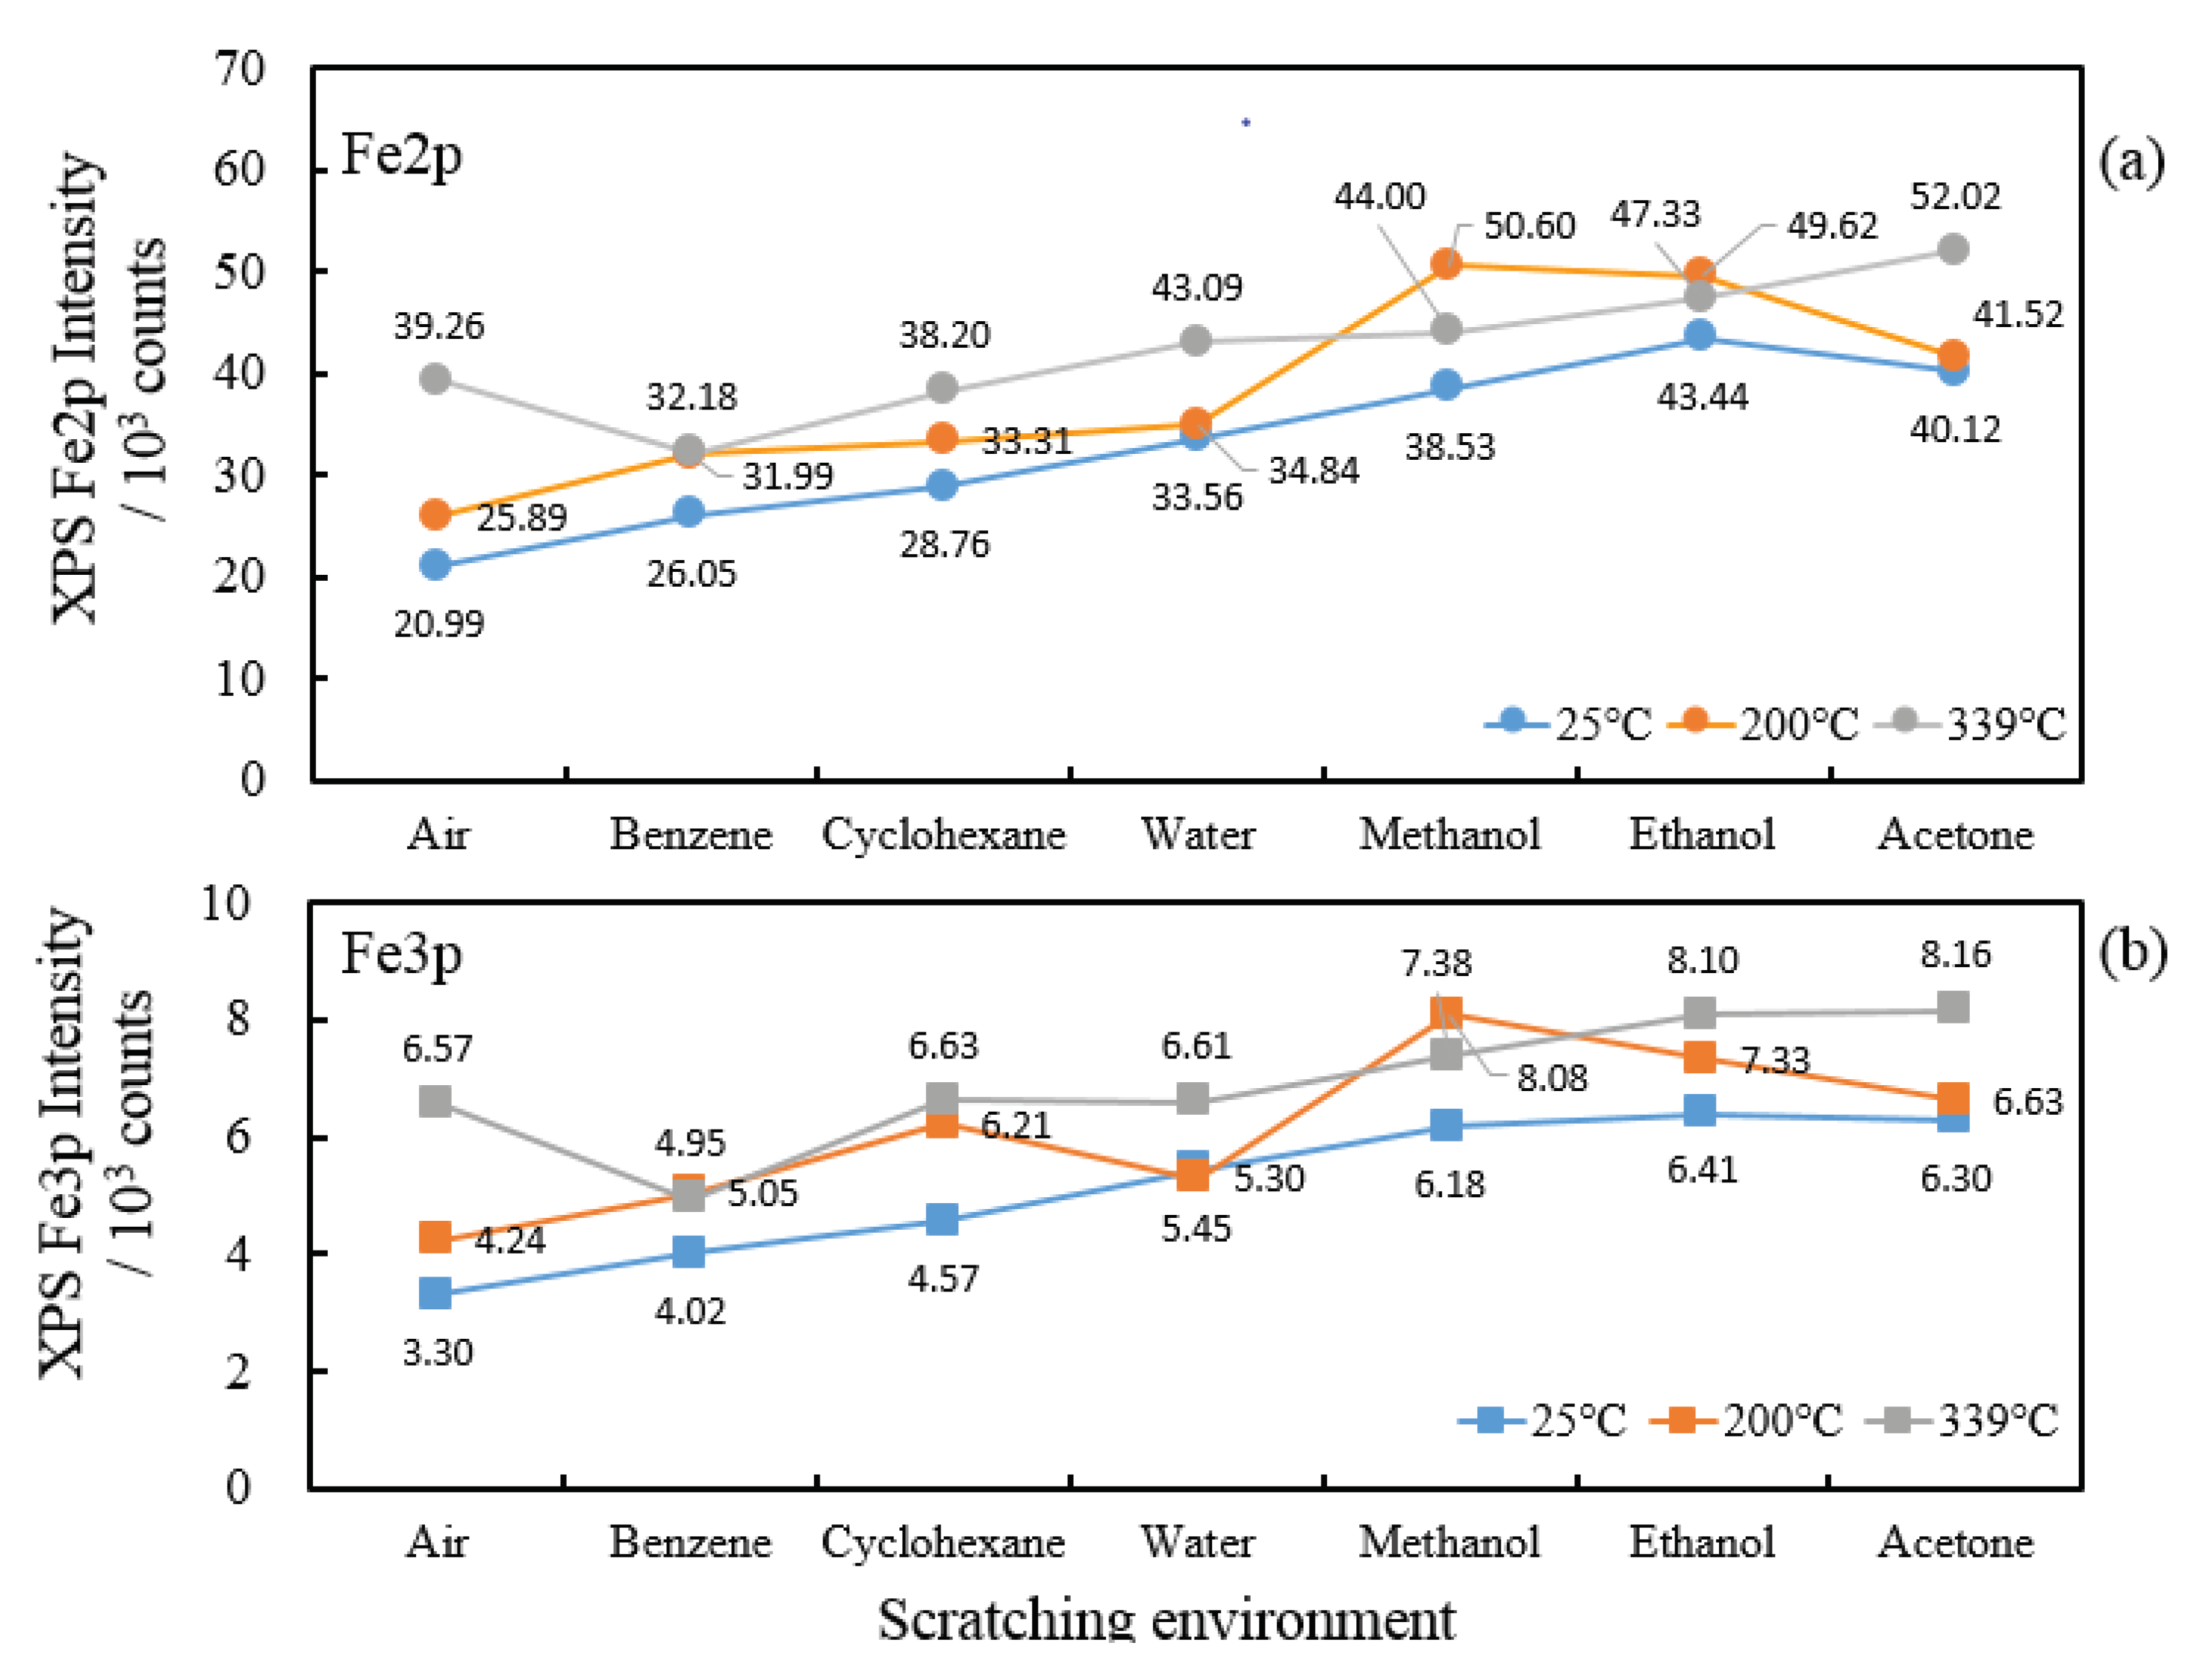
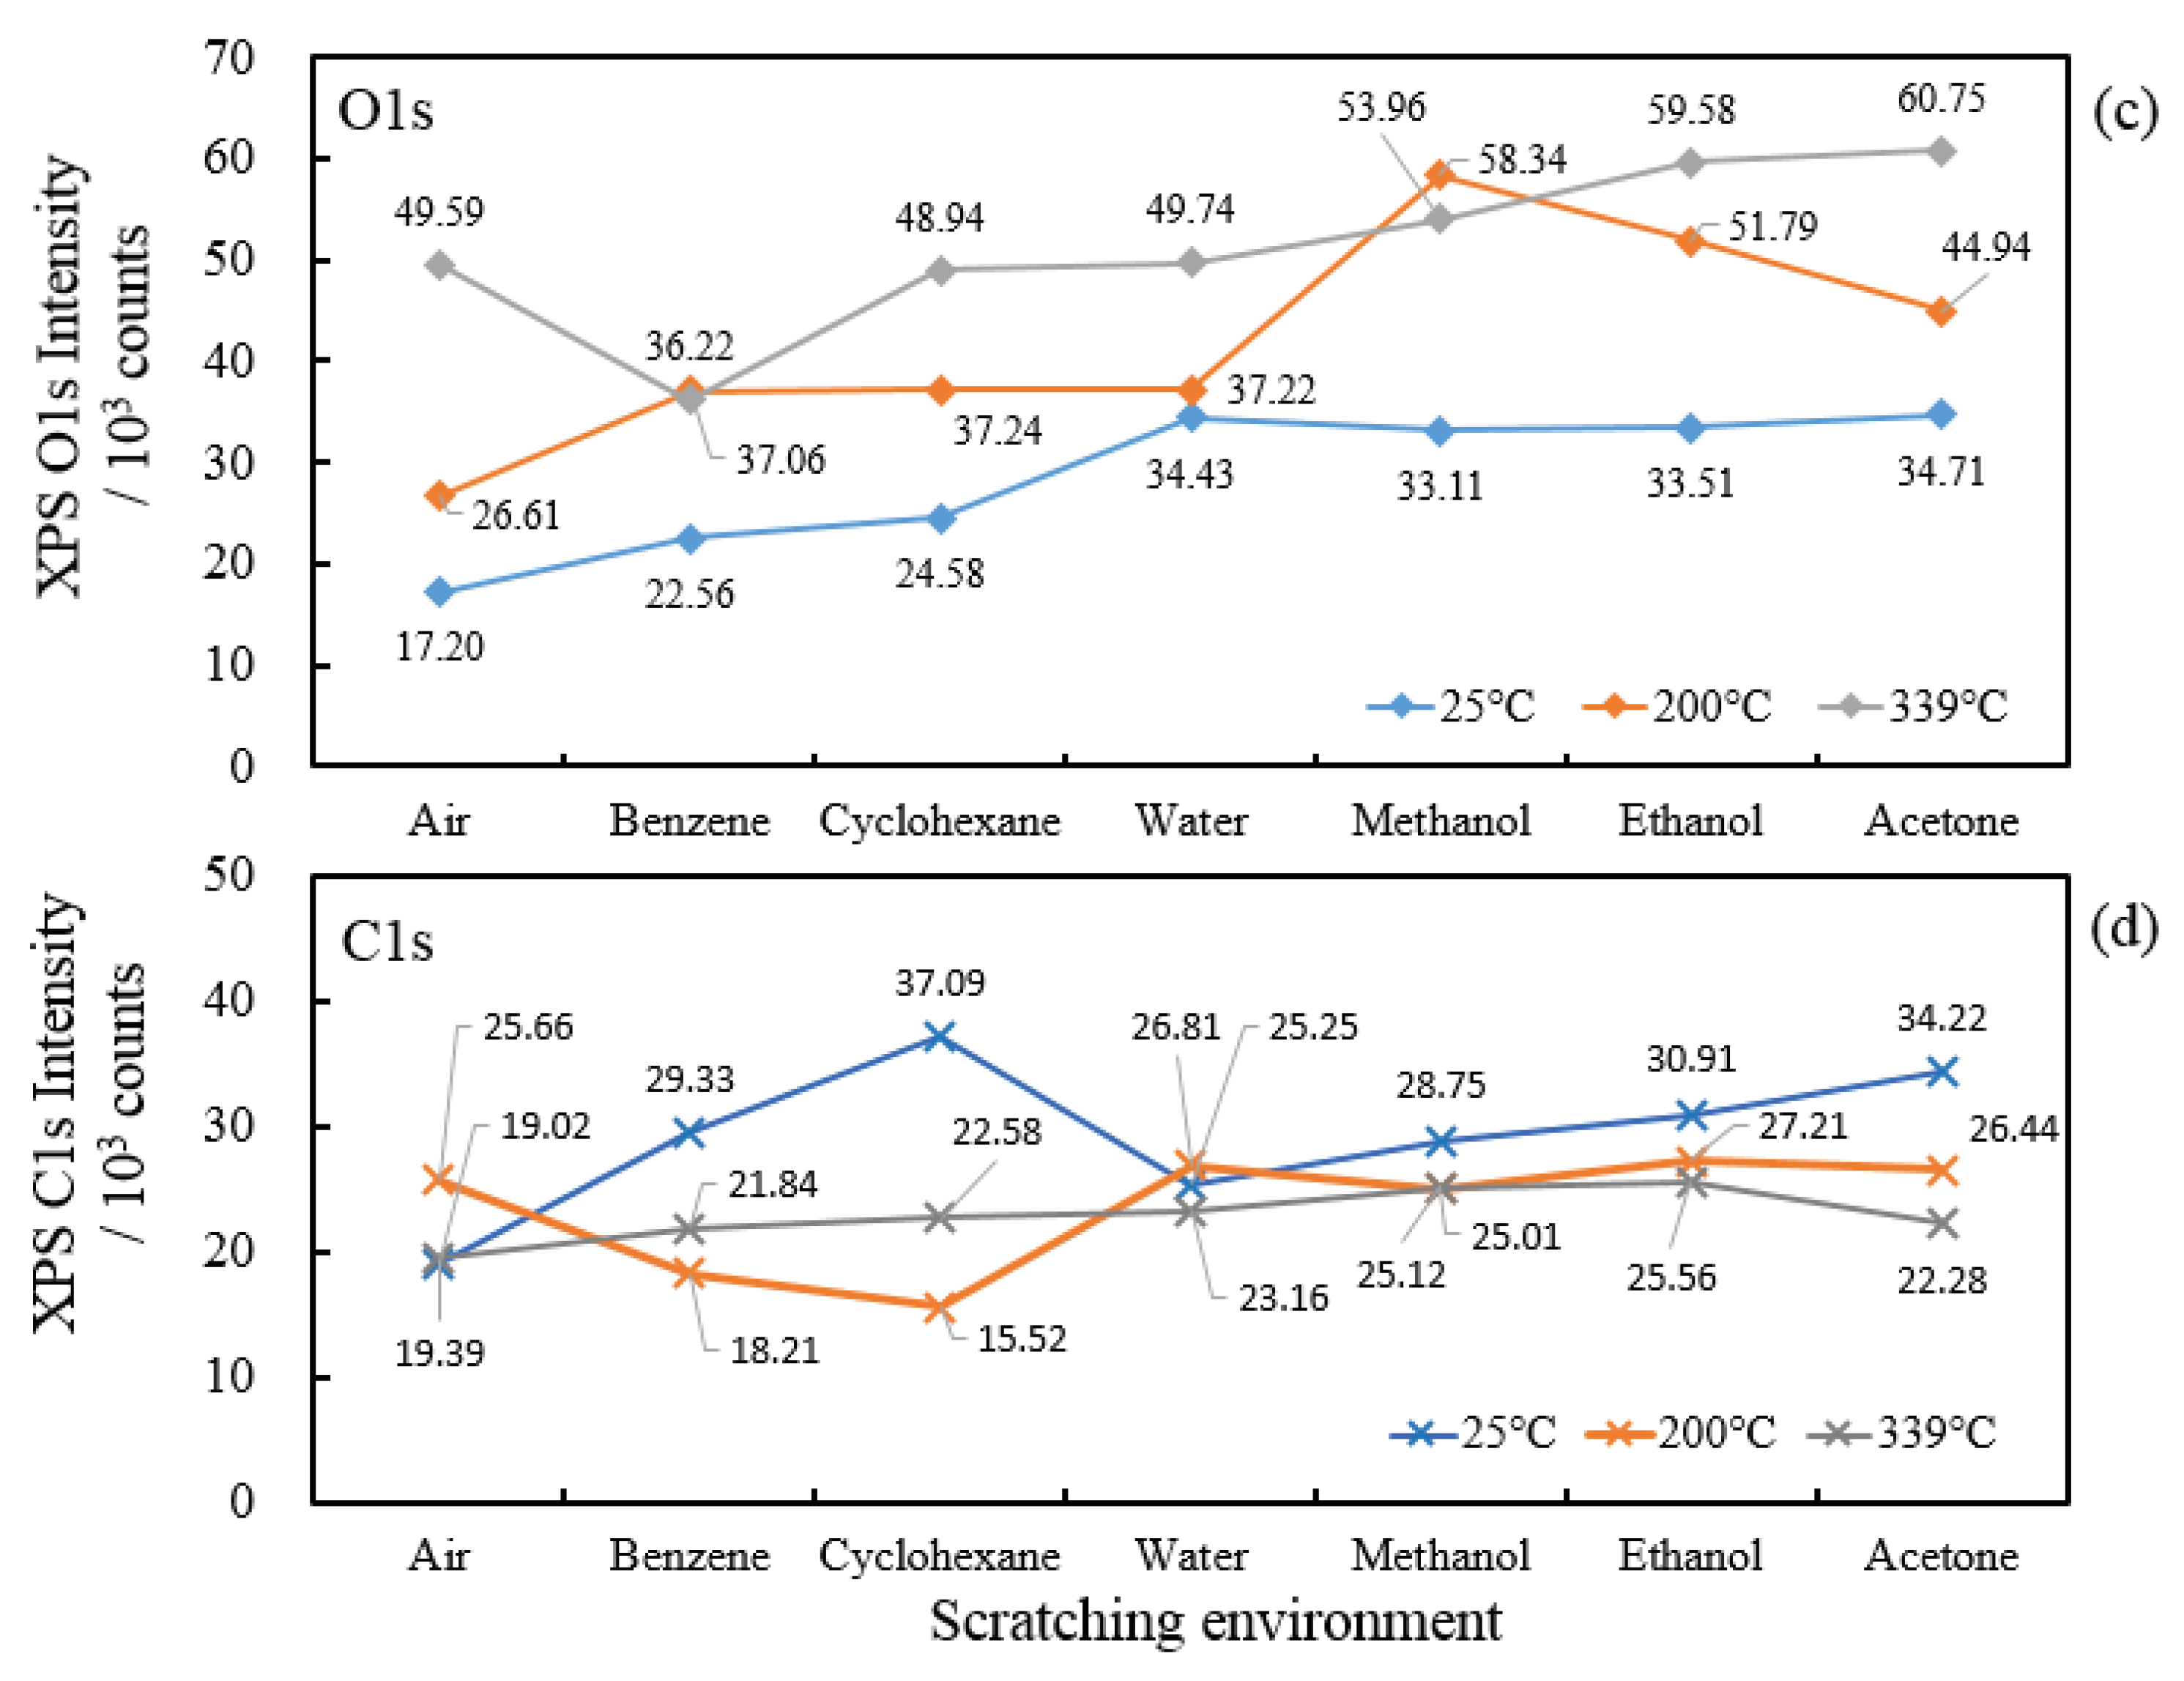
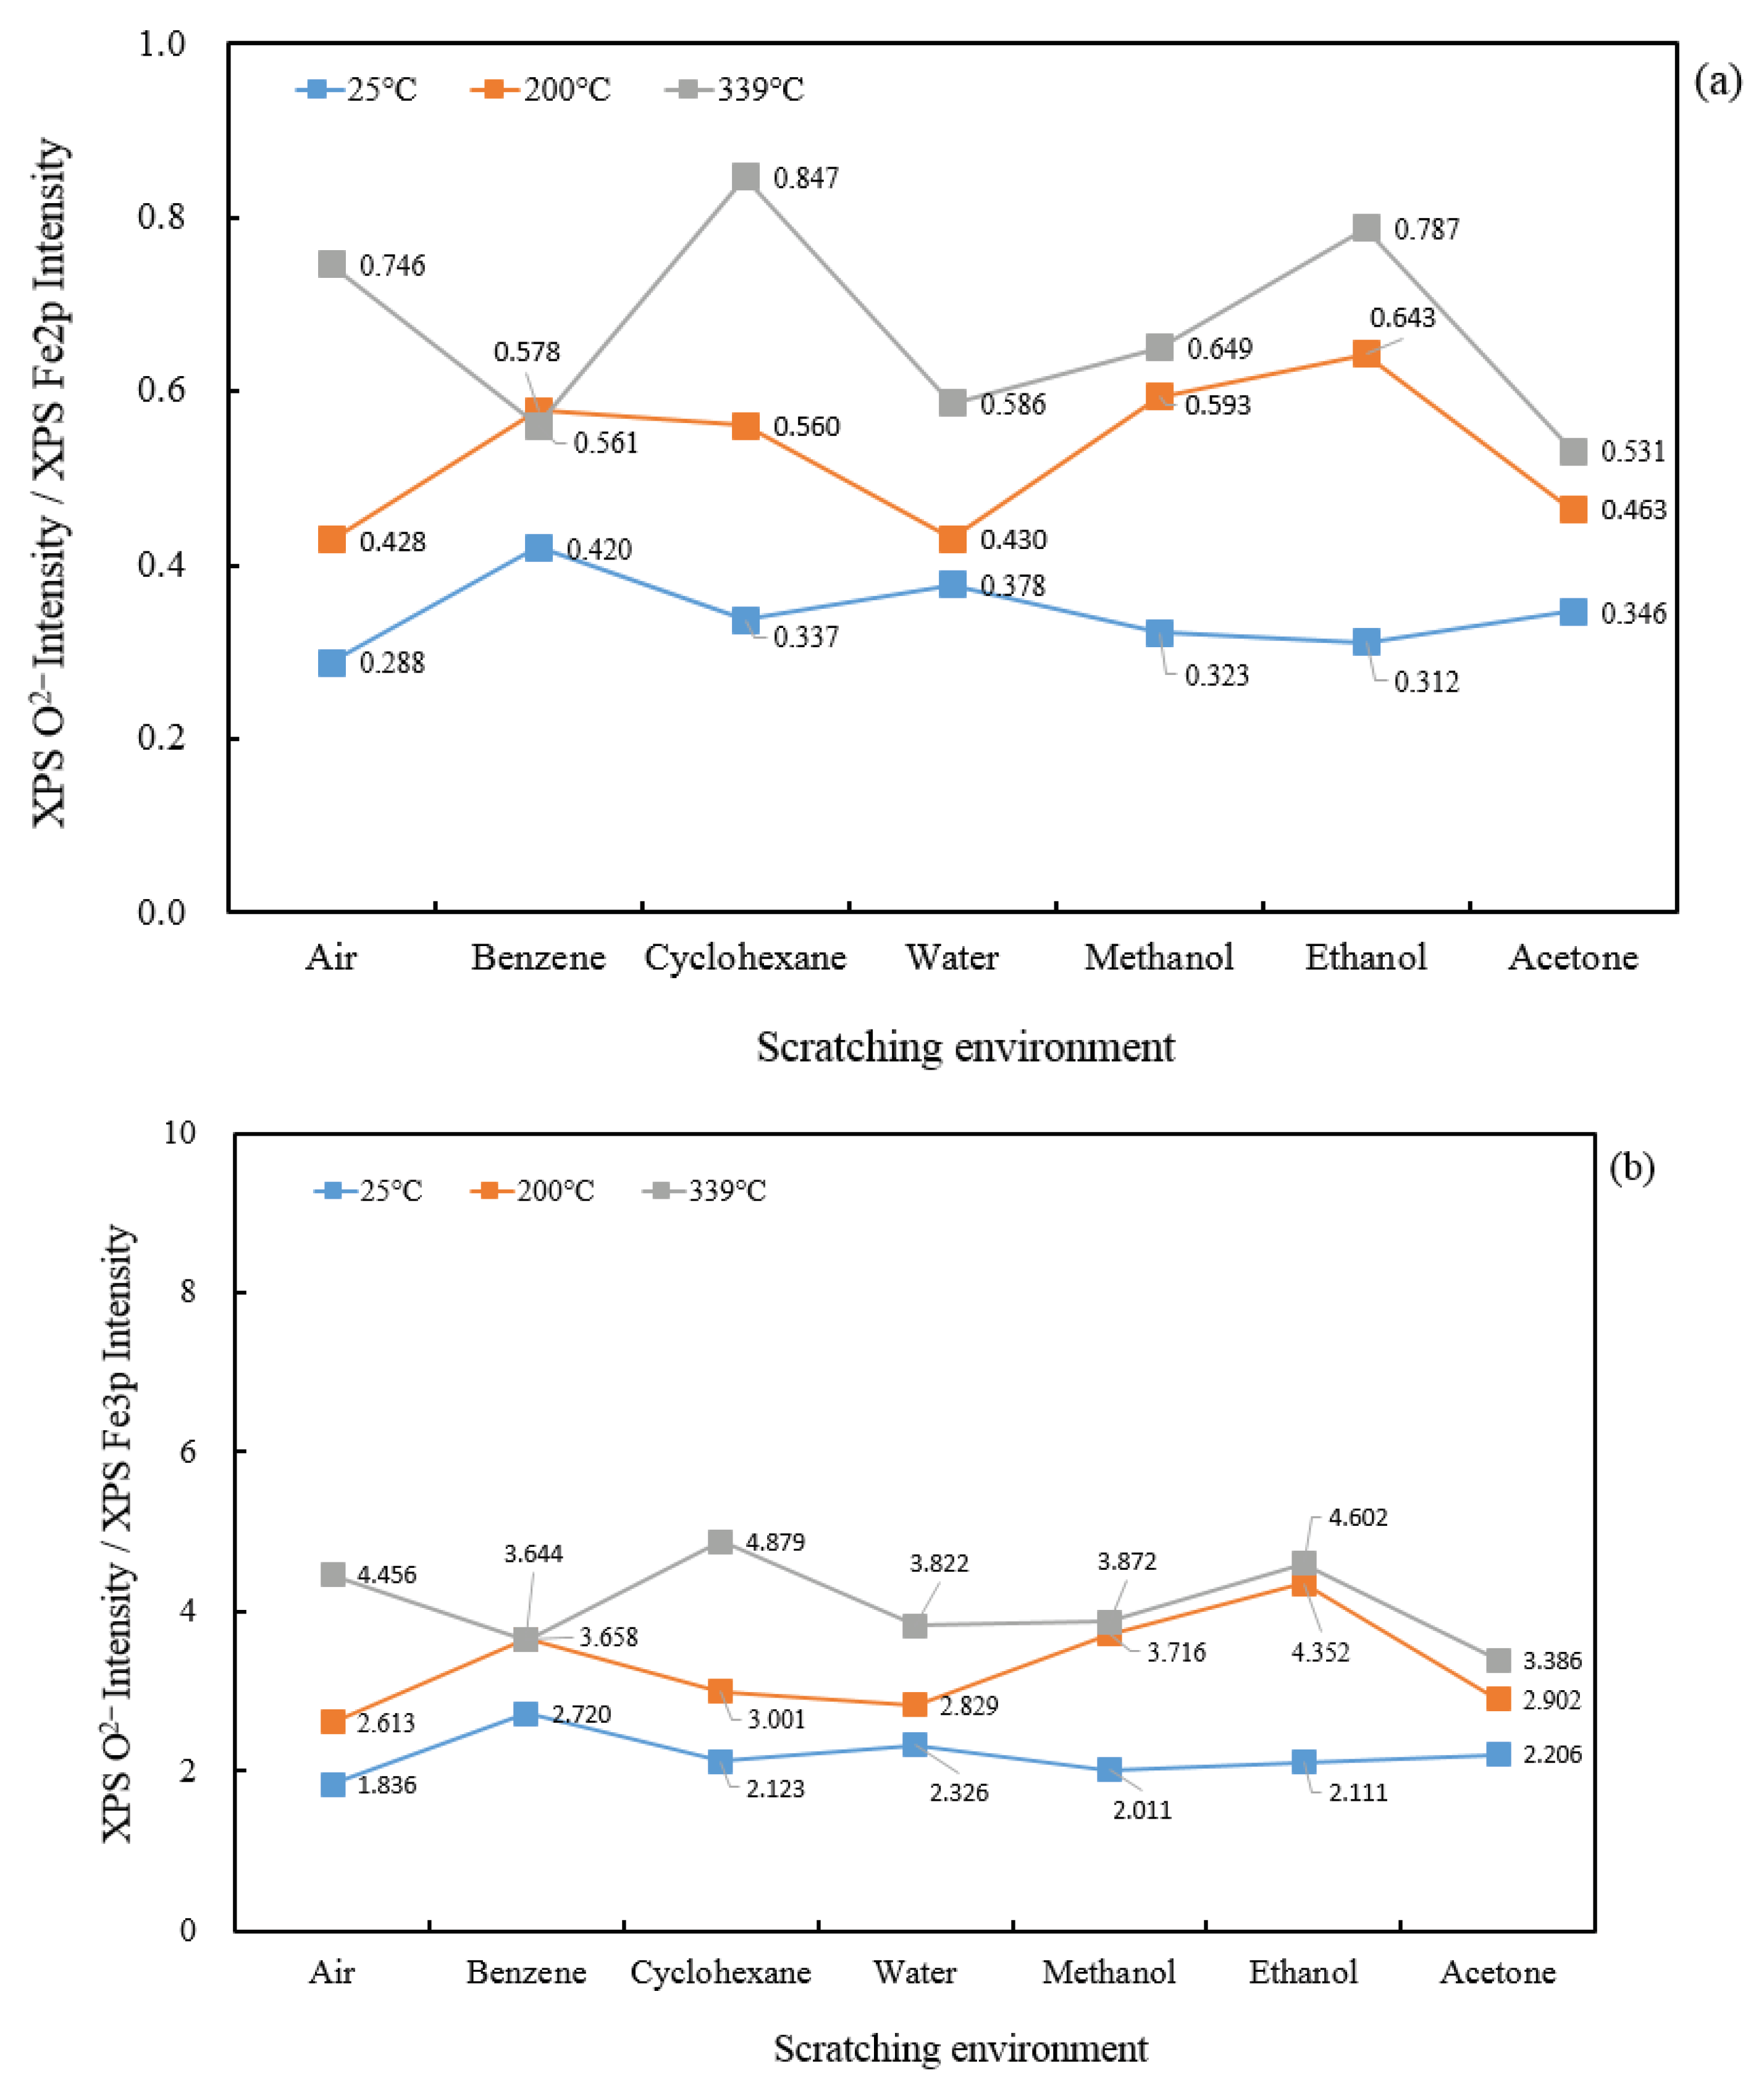
3.1.2. Plots of XPS Intensity of Core Spectra Against Scratching Environments

Figure 4a–d shows the dependence of the total number of electrons counted, called XPS intensity, in the XPS measurement of Fe 2p, Fe 3p, O 1s, and C 1s spectra at 25, 200, and 339 °C on the scratching environment. In Figure 4, the environments on the abscissa are arranged in increasing order of XPS increase in the order of air < benzene < cyclohexane < water < methanol < ethanol < acetone. This arrangement of the environments is used hereafter. It should be noted that, in Figure 4d, the XPS C 1s intensity at 339 °C is located at nearly the same level for all environments. Therefore, this confirms that the XPS intensity of each spectrum can be attributed to the environment itself, but not to the measurement condition of the XPS spectrometer, which was maintained constant for all environments. In Figure 4, the following are featured: (1) the XPS intensities of Fe 2p, Fe 3p, and O 1s at 25, 200, and 339 °C tend to increase as the environments shift to right, and they are raised with the increasing temperatures; (2) as the temperature is increased from 25 °C to 200 and 300 °C, the XPS O 1s intensity at 25 °C gradually increases (Figure 4c) to greater than the XPS intensities of Fe 2p (Figure 4a) and Fe 3p (Figure 4b); (3) the temperature dependence of the XPS C 1s intensity is almost independent of temperature, although, in the case of benzene and cyclohexane, the XPS C 1s intensity fluctuates, increasing at 25 °C, then decreasing at 200 °C, before becoming higher at 339 °C, leading to a level equal to that for the other environments. This can be attributed to the deposition of carbon materials by decomposition of these molecules, resulting from scratching and its removal by temperature increase. We think that, based on the thermal desorption spectroscopy (TDS) results for an iron surface ultrasonically cleaned only in acetone without scratching, followed by drying under vacuum, as described before, the increase in the XPS intensities of Fe 2p, Fe 3p, and O 1s with temperature may be caused as a result of the desorption of a main species, H2O, from the scratched surface [13], as well as the transport of oxygen species embedded in the metal inside by scratching to the outer surface. We describe later that the values of αA can be associated with the increase of XPS intensities of Fe 2p, and Fe 3p, and O 1s.

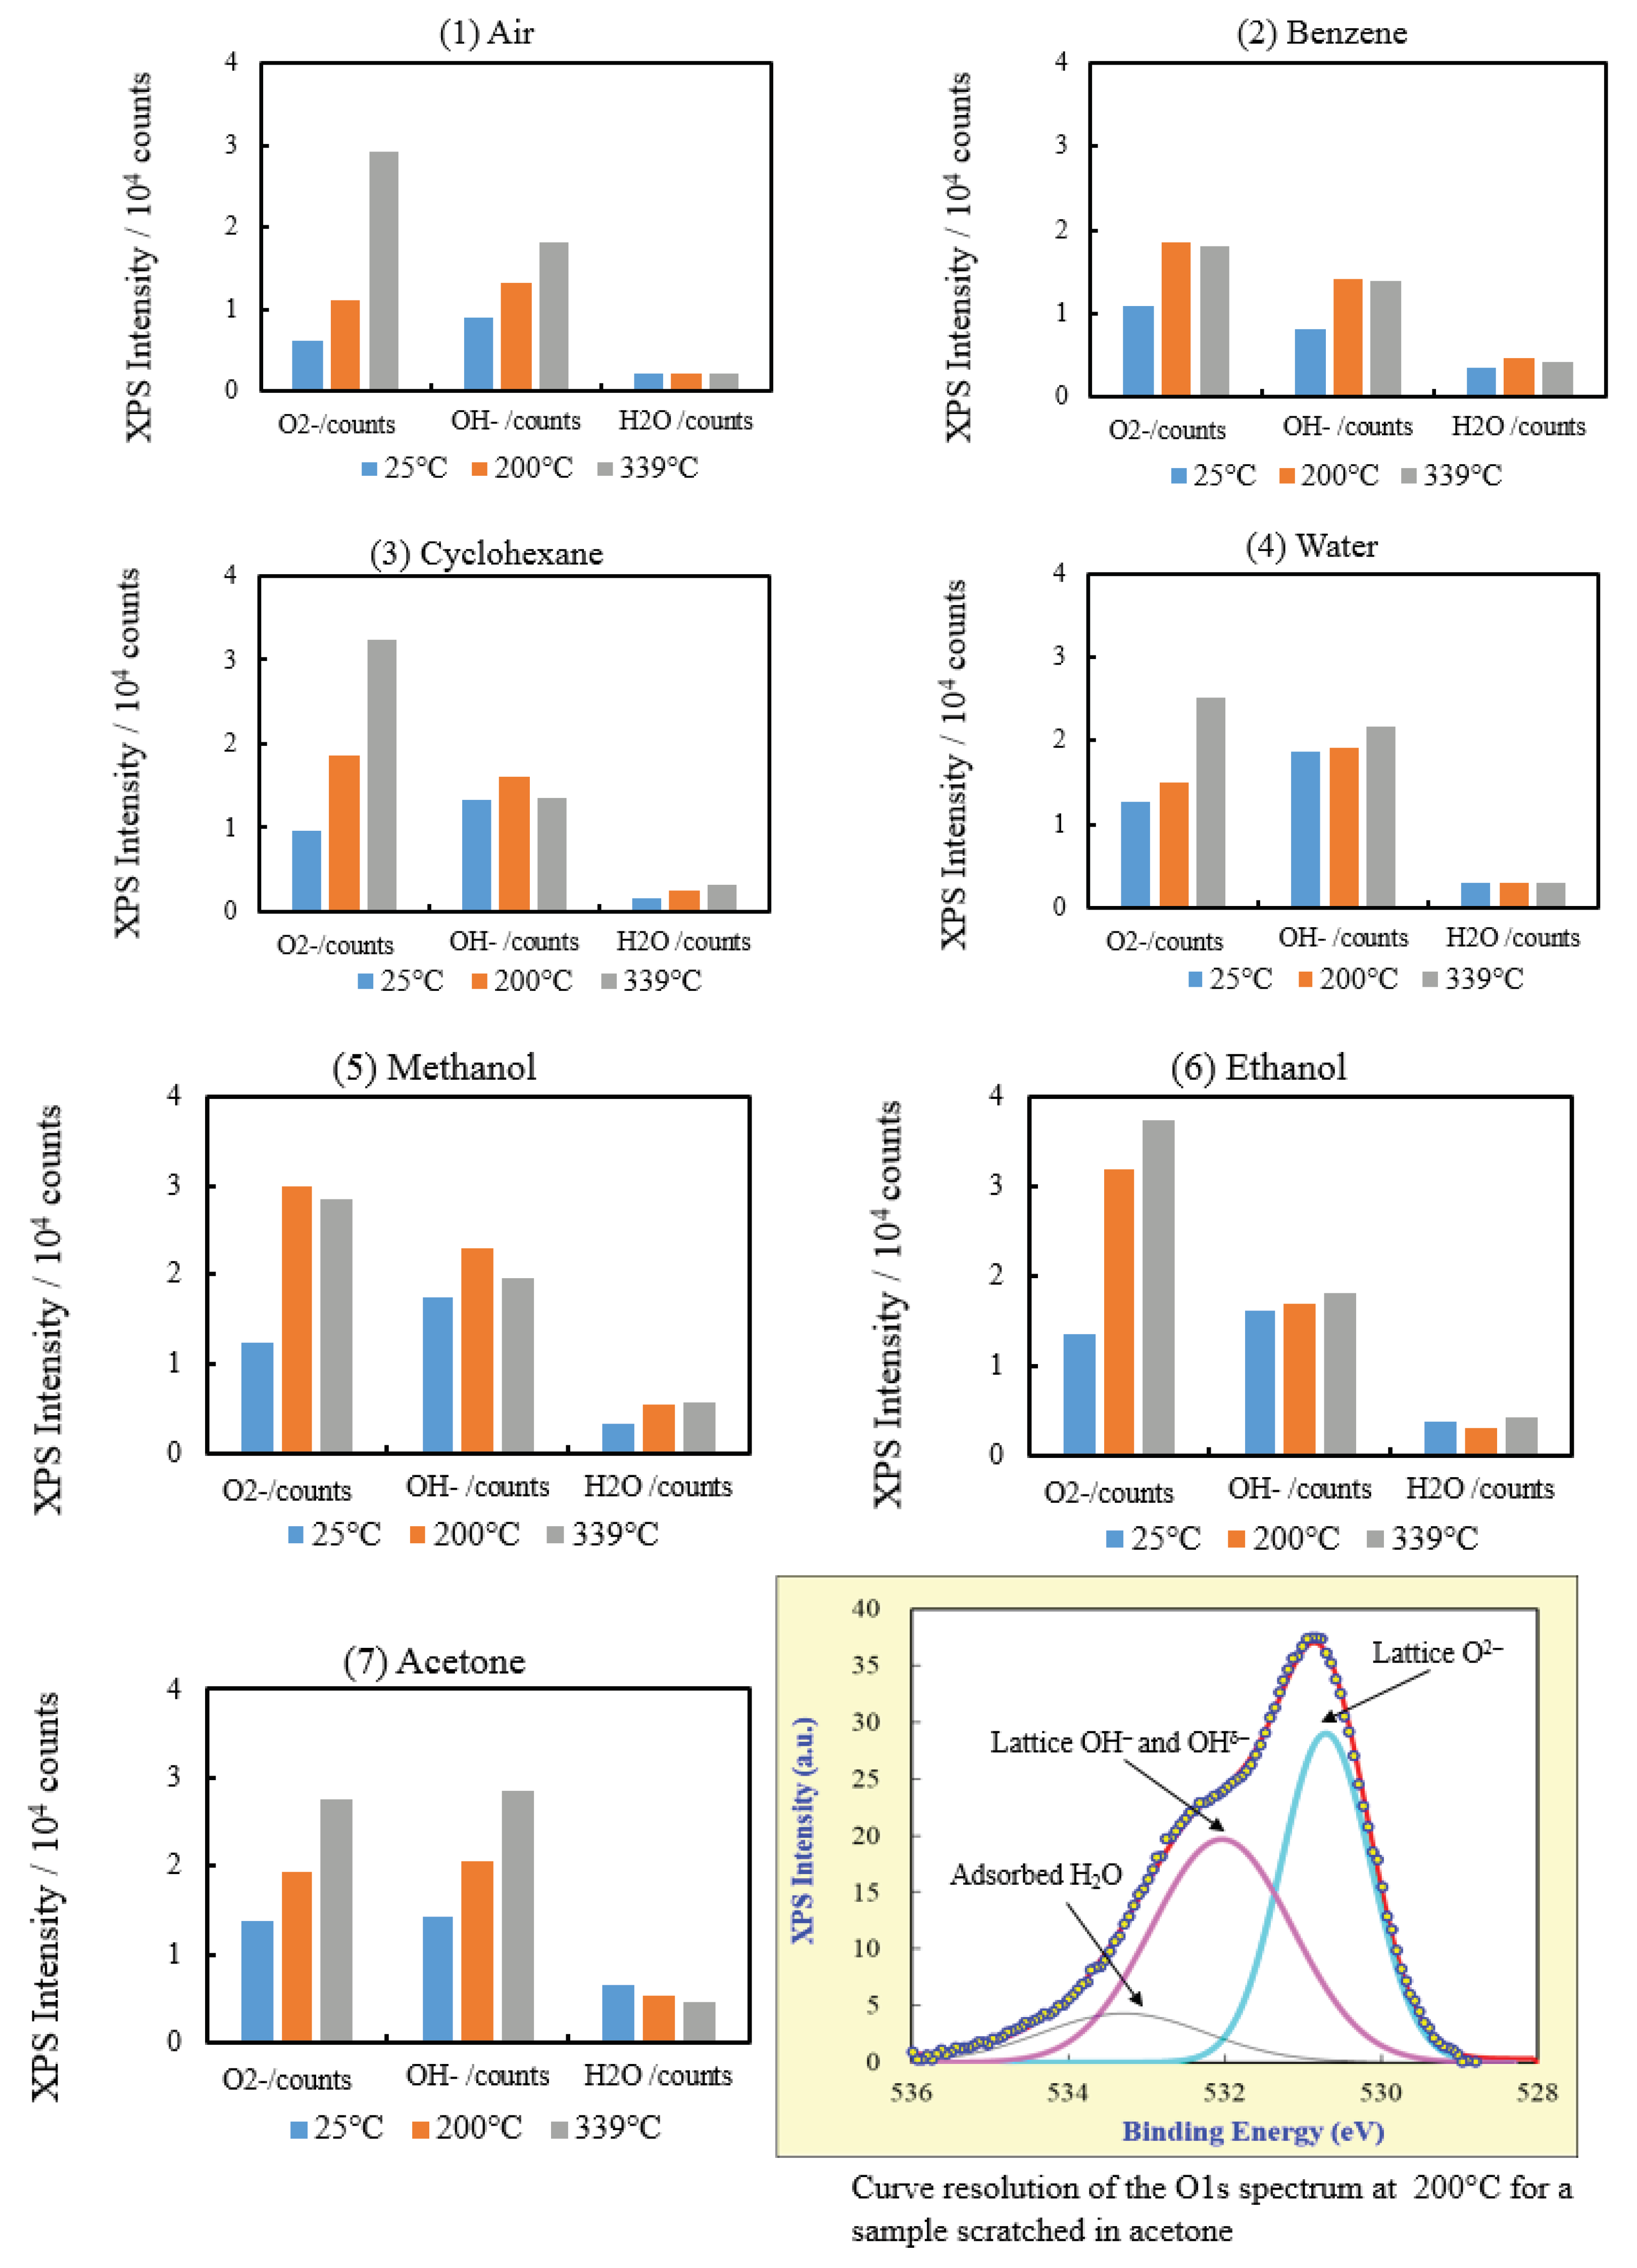
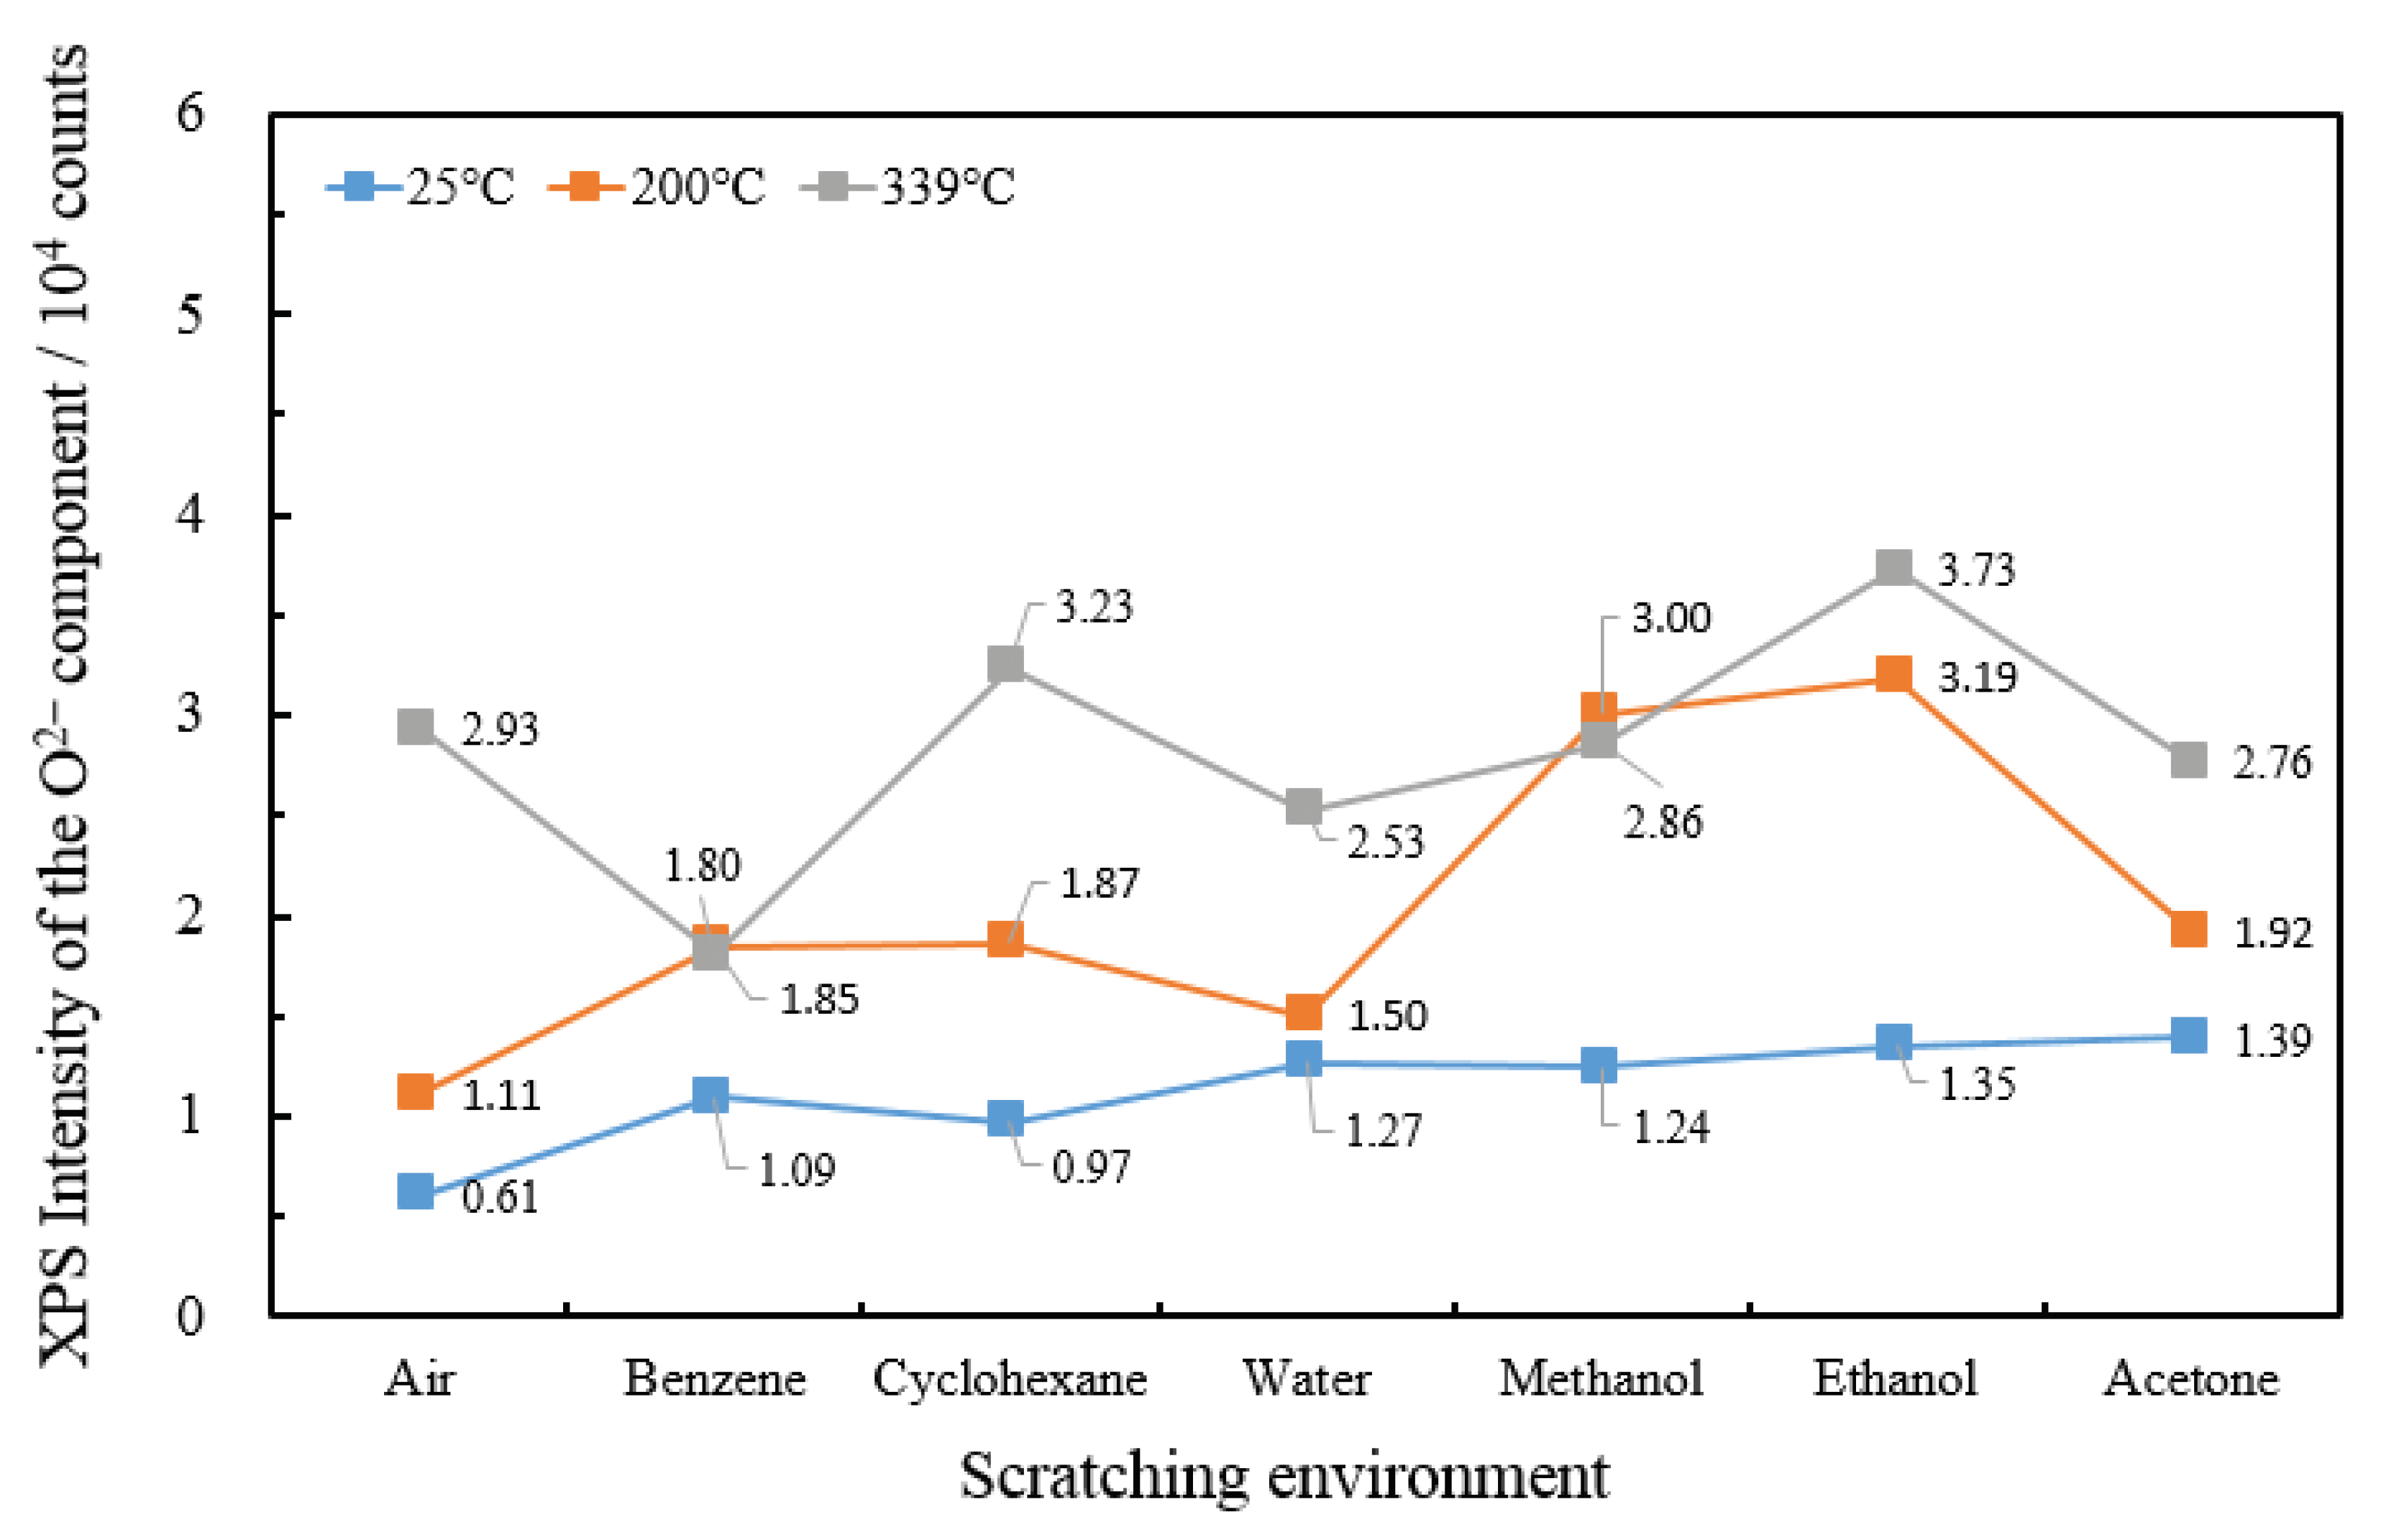
3.1.3. Curve Resolution of O 1s Spectrum and Temperature Dependence of XPS O 1s Component Intensity on Scratching Environments

In Figure 5, the temperature dependence of XPS intensity of the three components on the environments, which are lattice O2, lattice OH and OHδ, and adsorbed H2O, is shown, and an example of the curve resolution into three components for acetone is also demonstrated. These components are represented as O2, OH, and H2O, respectively. In a previous report [7], the percentages (%) for the two main oxygen components assigned to lattice O2 and lattice OH were used, but in the present case, the XPS intensity obtained in the O 1s spectrum was distributed to the three components. In Table 3, the temperature dependence of the binding energies for the three components is summarized. The binding energies were almost independent of temperature and environments. The averages of the component binding energies for all environments were 530.7 eV (lattice O2), 532.1 eV (lattice OH and OHδ), and 533.5 eV (adsorbed H2O). The following results in Figure 5 are featured: (1) in the case of air, cyclohexane, water, ethanol, and acetone, i.e., except for benzene and methanol, the XPS intensity of the O2 component increased smoothly with increasing temperature. This suggests that the increase in XPS O2 intensity can be closely associated with the increase in the PE intensity with temperature during the Up1 scan (Figure 1 in Reference [6]); (2) interestingly, in the case of benzene and acetone, the temperature dependence of the XPS intensity of O2 closely resembled that of OH. This behavior may be associated with the fact that the glow curves of PE intensity during Up1 and Up2 temperature scans for both benzene and acetone took a considerably similar trend (Figure 1 in Reference [6]).
Figure 6 shows the dependence of the XPS O2 intensity on the environments at the three temperatures. The value of intensity at 25 °C gradually increased as the environment shifted to the right, while that at 200 °C decreased for water, increased for methanol and ethanol, and then decreased for acetone. It is seen that the dependence of the XPS O2 intensity on the different environments is very similar—in particular, at 200 °C—to that of the XPS intensity of Fe 2p, Fe 3p, and O 1s demonstrated in Figure 4a–c, respectively, which exhibited a similar environment dependence. The XPS O2 intensity at 200 °C for the different environments increased in the following order: air (1.11 × 10⁴ counts) < water (1.50 × 10⁴) < benzene (1.85 × 10⁴) ≈ cyclohexane (1.87 × 10⁴) < acetone (1.92 × 10⁴) < methanol (3.00 × 10⁴) < ethanol (3.19 × 10⁴). Interestingly, this order was nearly the same as that for the increase in magnitude of the swelling of the glow curve, called MSG, as shown in Figure 14 in Reference [5], which was air < water < benzene < cyclohexane < methanol < acetone < ethanol.
The value of MSG was defined as the difference between the emission intensity at the selected seven temperatures in the observed glow curves and that on the straight line drawn between the intensities at 40 °C and 339 °C. The unit of MSG was represented by counts/s. The above findings strongly suggest that the formation of the peak appearing at around 200 °C in the PE glow curves can be associated with the growth of the component of O2, probably promoting the formation of iron oxide, including O2 ions in the overlayer. In Figure 6, it is seen that the value of XPS O2 intensity for air, cyclohexane, water, ethanol, and acetone increases with increasing temperature, while that for benzene and methanol remained at almost the same level at 200 and 339 °C.

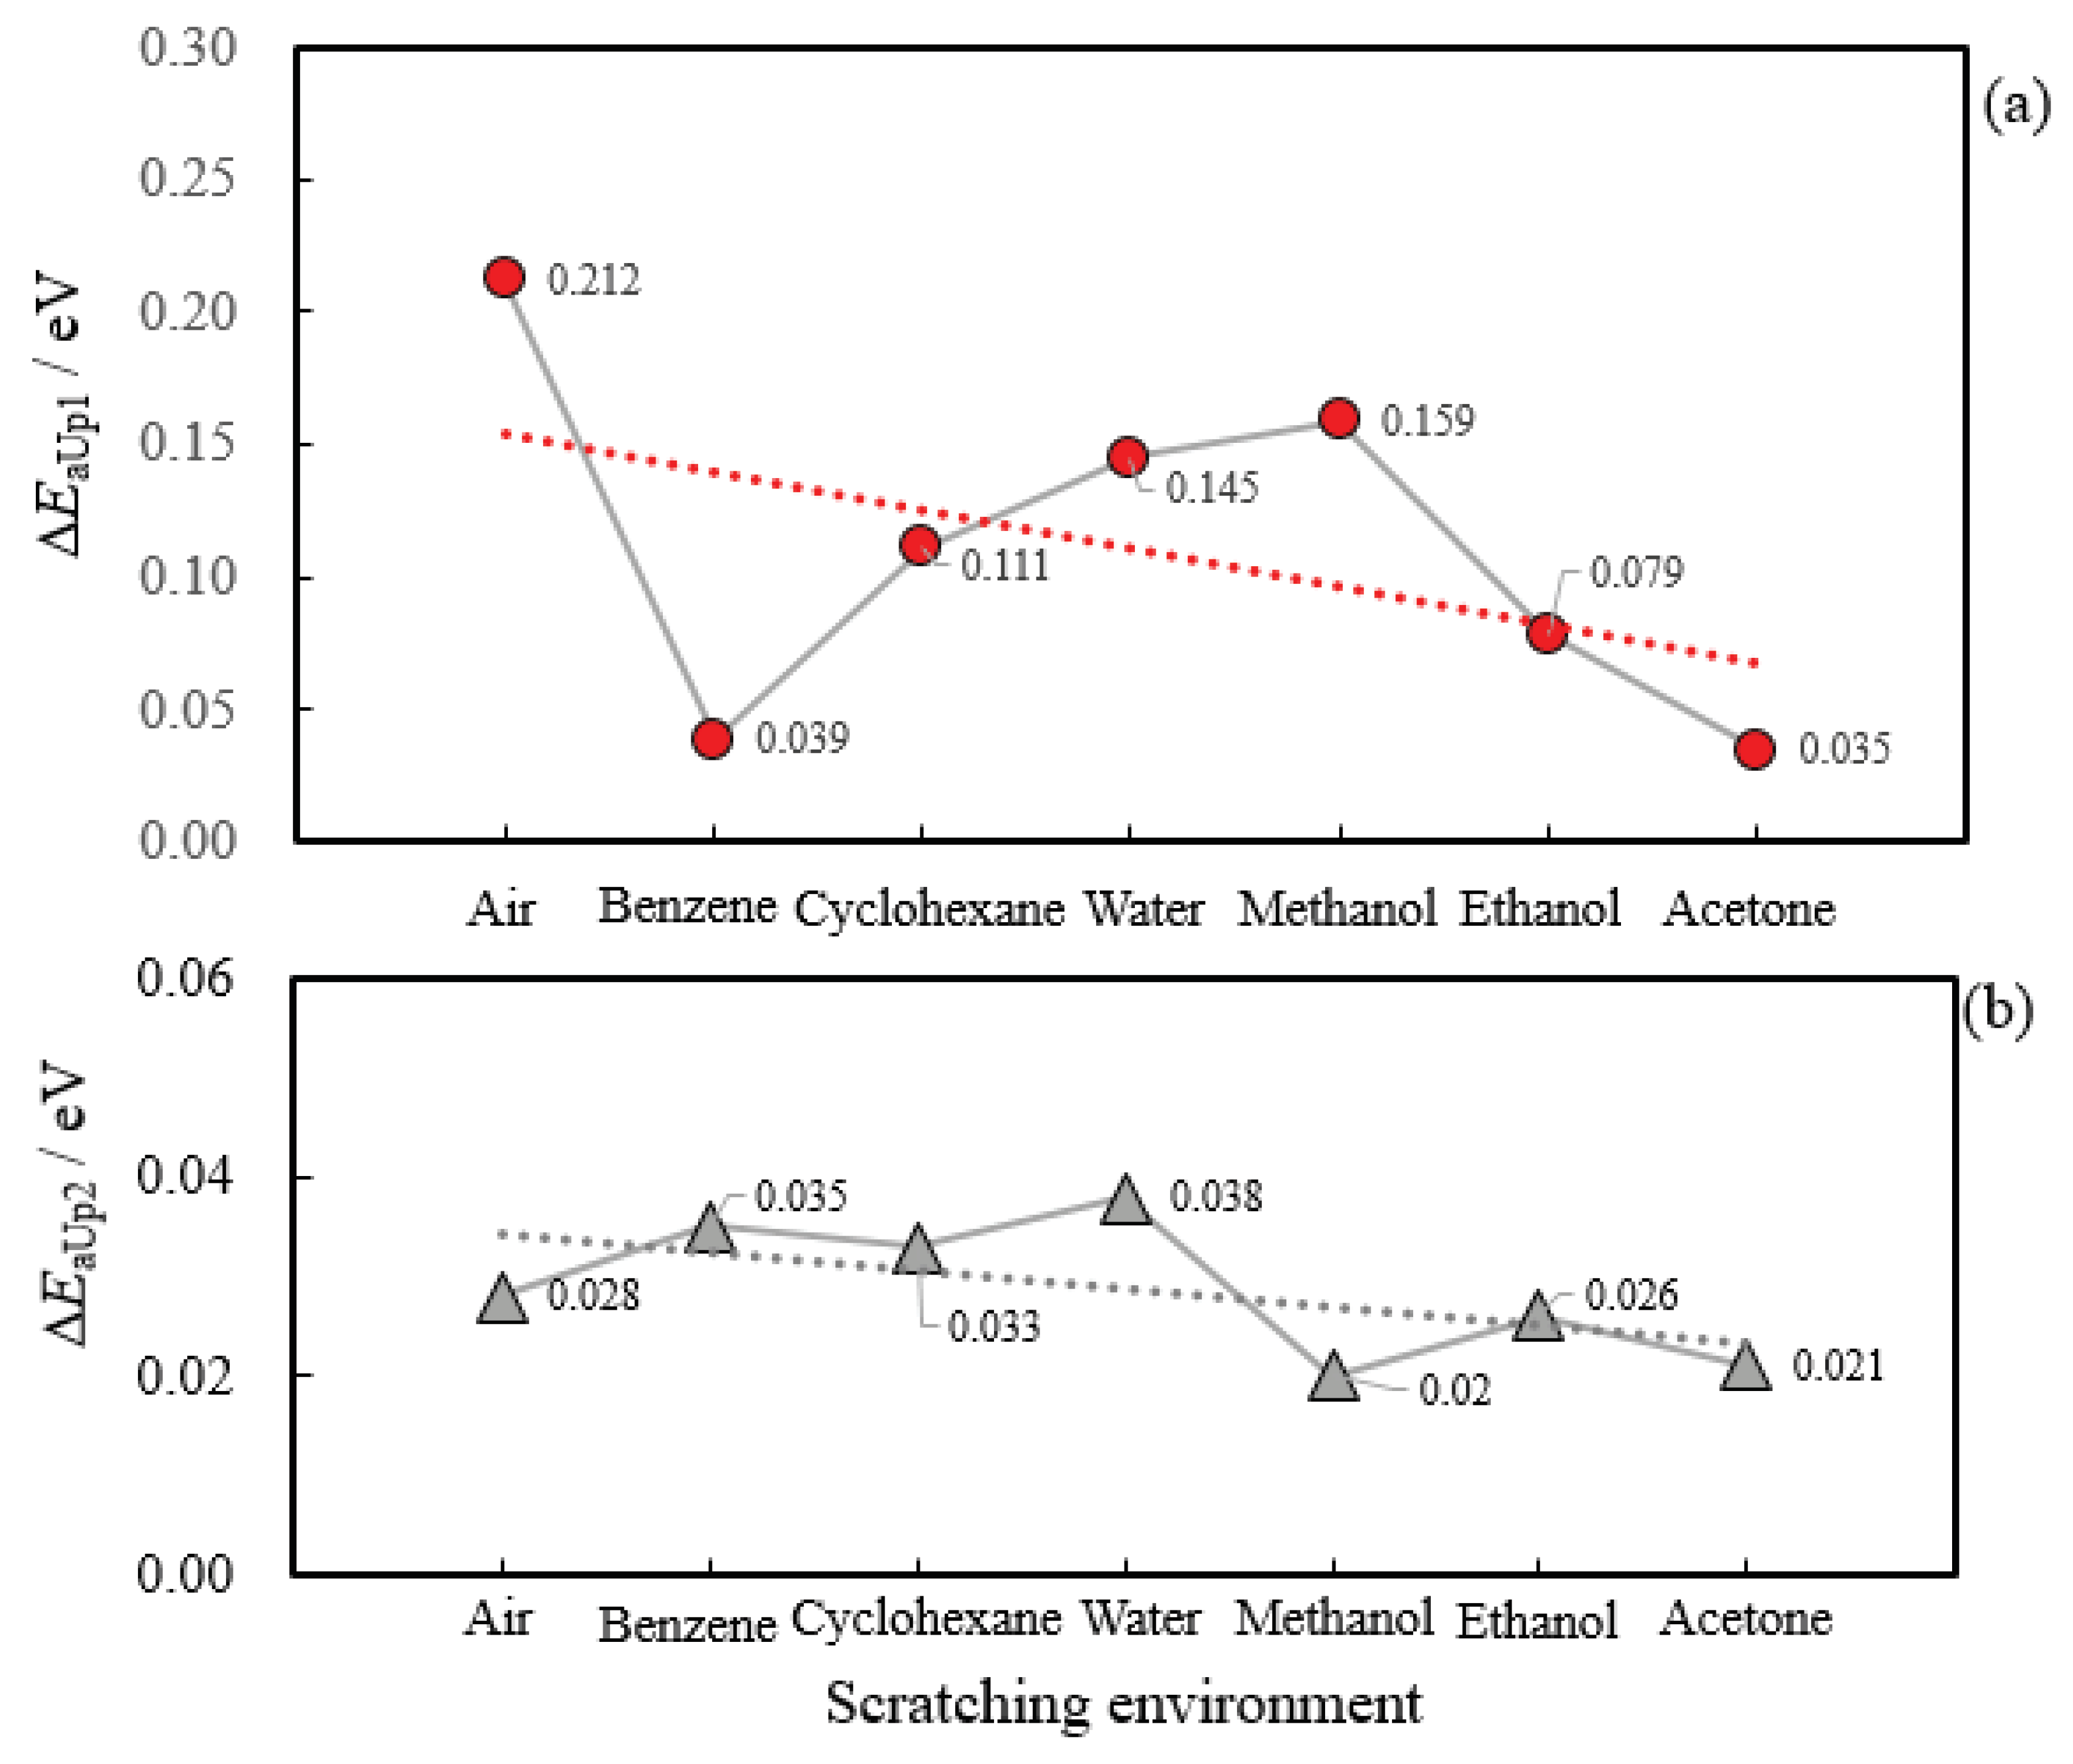
3.2. Activation Energies Obtained by Arrhenius Plots of the XPS Characetristics

We think that the PE can be greatly influenced by the structure of the iron oxide film, through which the electrons excited from metal base transfer to the outer surface. In order to quantitatively estimate the action of the film, we employed Arrhenius plots of the XPS data for the different environments. Table 4 lists the Arrhenius activation energies obtained by plotting the logarithm of the XPS data at 25, 200, and 339 °C against the reciprocal of the temperature in Kelvin, 1/T, for the samples scratched in the environments. For example, the Arrhenius equation for XPS Fe 2p intensity was represented by IFe2p = IFe2p0 exp(−ΔEFe2p)/kBT, where ΔEFe2p is the activation energy, IFe2p is the XPS Fe 2p intensity, and IFe2p0 is the pre-exponential factor. The procedure to obtain the activation energy from the PE data during the wavelength scan is illustrated in Reference [7]. The XPS data examined were as follows: (1) the XPS intensity of Fe 2p, Fe 3p, O 1s, and C 1s; (2) the XPS intensity of O2, OH, and H2O components of the O 1s spectrum; (3) the ratios of XPS O2 intensity/XPS Fe 2p intensity and of XPS O2 intensity/XPS Fe 3p intensity, which are described later; (4) the maximum peak intensity in the Fe 2p, Fe 3p, and O 1s XPS spectra. We think that the activation energy obtained here represents the energy required for the formation or growth process of the above-mentioned species to thermally occur at the surface. The activation energies listed were obtained from Arrhenius plots of approximately straight lines with R2 ≥ 0.82. Although the activation energy values were not necessarily obtained in all the experiments, the following results listed in Table 4 are featured: (1) the value of ΔEO1s was nearly twice as much as that of ΔEFe2p and ΔEFe3p, indicating that the formation of surface oxygen species required more energy than that of surface iron species; (2) the value of ΔEO1s for air was considerably higher than that for other environments. This finding can be associated with the highest value of ΔEaUp1 for air, leading to the weakest PE intensity appearing in the glow curve, and the negative value of MSG, as shown in Table 2 and Figures 13 and 14 in Reference [5]; (3) interestingly, the ΔEC1s for methanol, ethanol, and acetone had a negative value, which means that the growth process of carbon materials at the surface was exothermic, as described in Reference [7]; (4) the values of ΔEO2−/Fe2p and ΔEO2−/Fe3p relating to the formation of the non-stoichiometric oxide structure were almost independent of the environments, except for water, and the averages were 0.035 eV and 0.031 eV, respectively. If the film which has a non-stoichiometric oxide structure is generated at the surface, such a magnitude of energy may be required; (5) the average of the ΔEO2 values was 0.48 eV and was considerably higher than that of ΔEOH (0.025 eV). The values of ΔEO2 (0.072 eV) for water were much higher than that for other environments. This suggests that, in the case of water, it is difficult to produce O2 species. Furthermore, it is seen that the values of ΔEO2 and ΔEOH were almost the same for benzene and acetone; that is, the values of ΔEO2 were 0.027 eV (benzene) and 0.032 eV (acetone) and those of ΔEOH were 0.029 eV (benzene) and 0.032 eV (acetone). Regarding the values of ΔEaUp1 during the Up1 scan [5], the values for benzene and acetone were 0.039 and 0.035 eV, respectively, and these values were much lower than the values for other environments. Regarding these results, we anticipate that there may exist two types of electron transport routes, including O2 and OH, in the film. In the case of benzene and acetone, both routes may be available, resulting in the lowering of the values of ΔEaUp1, while, in other environments, the route relating to O2 may be predominantly used, so that the values of ΔEaUp1 remain high. The contribution of ΔEH2O remains unclear; (6) lastly, the value of the ΔEO1sPEAK for each environment was very similar to that of ΔEO1s.

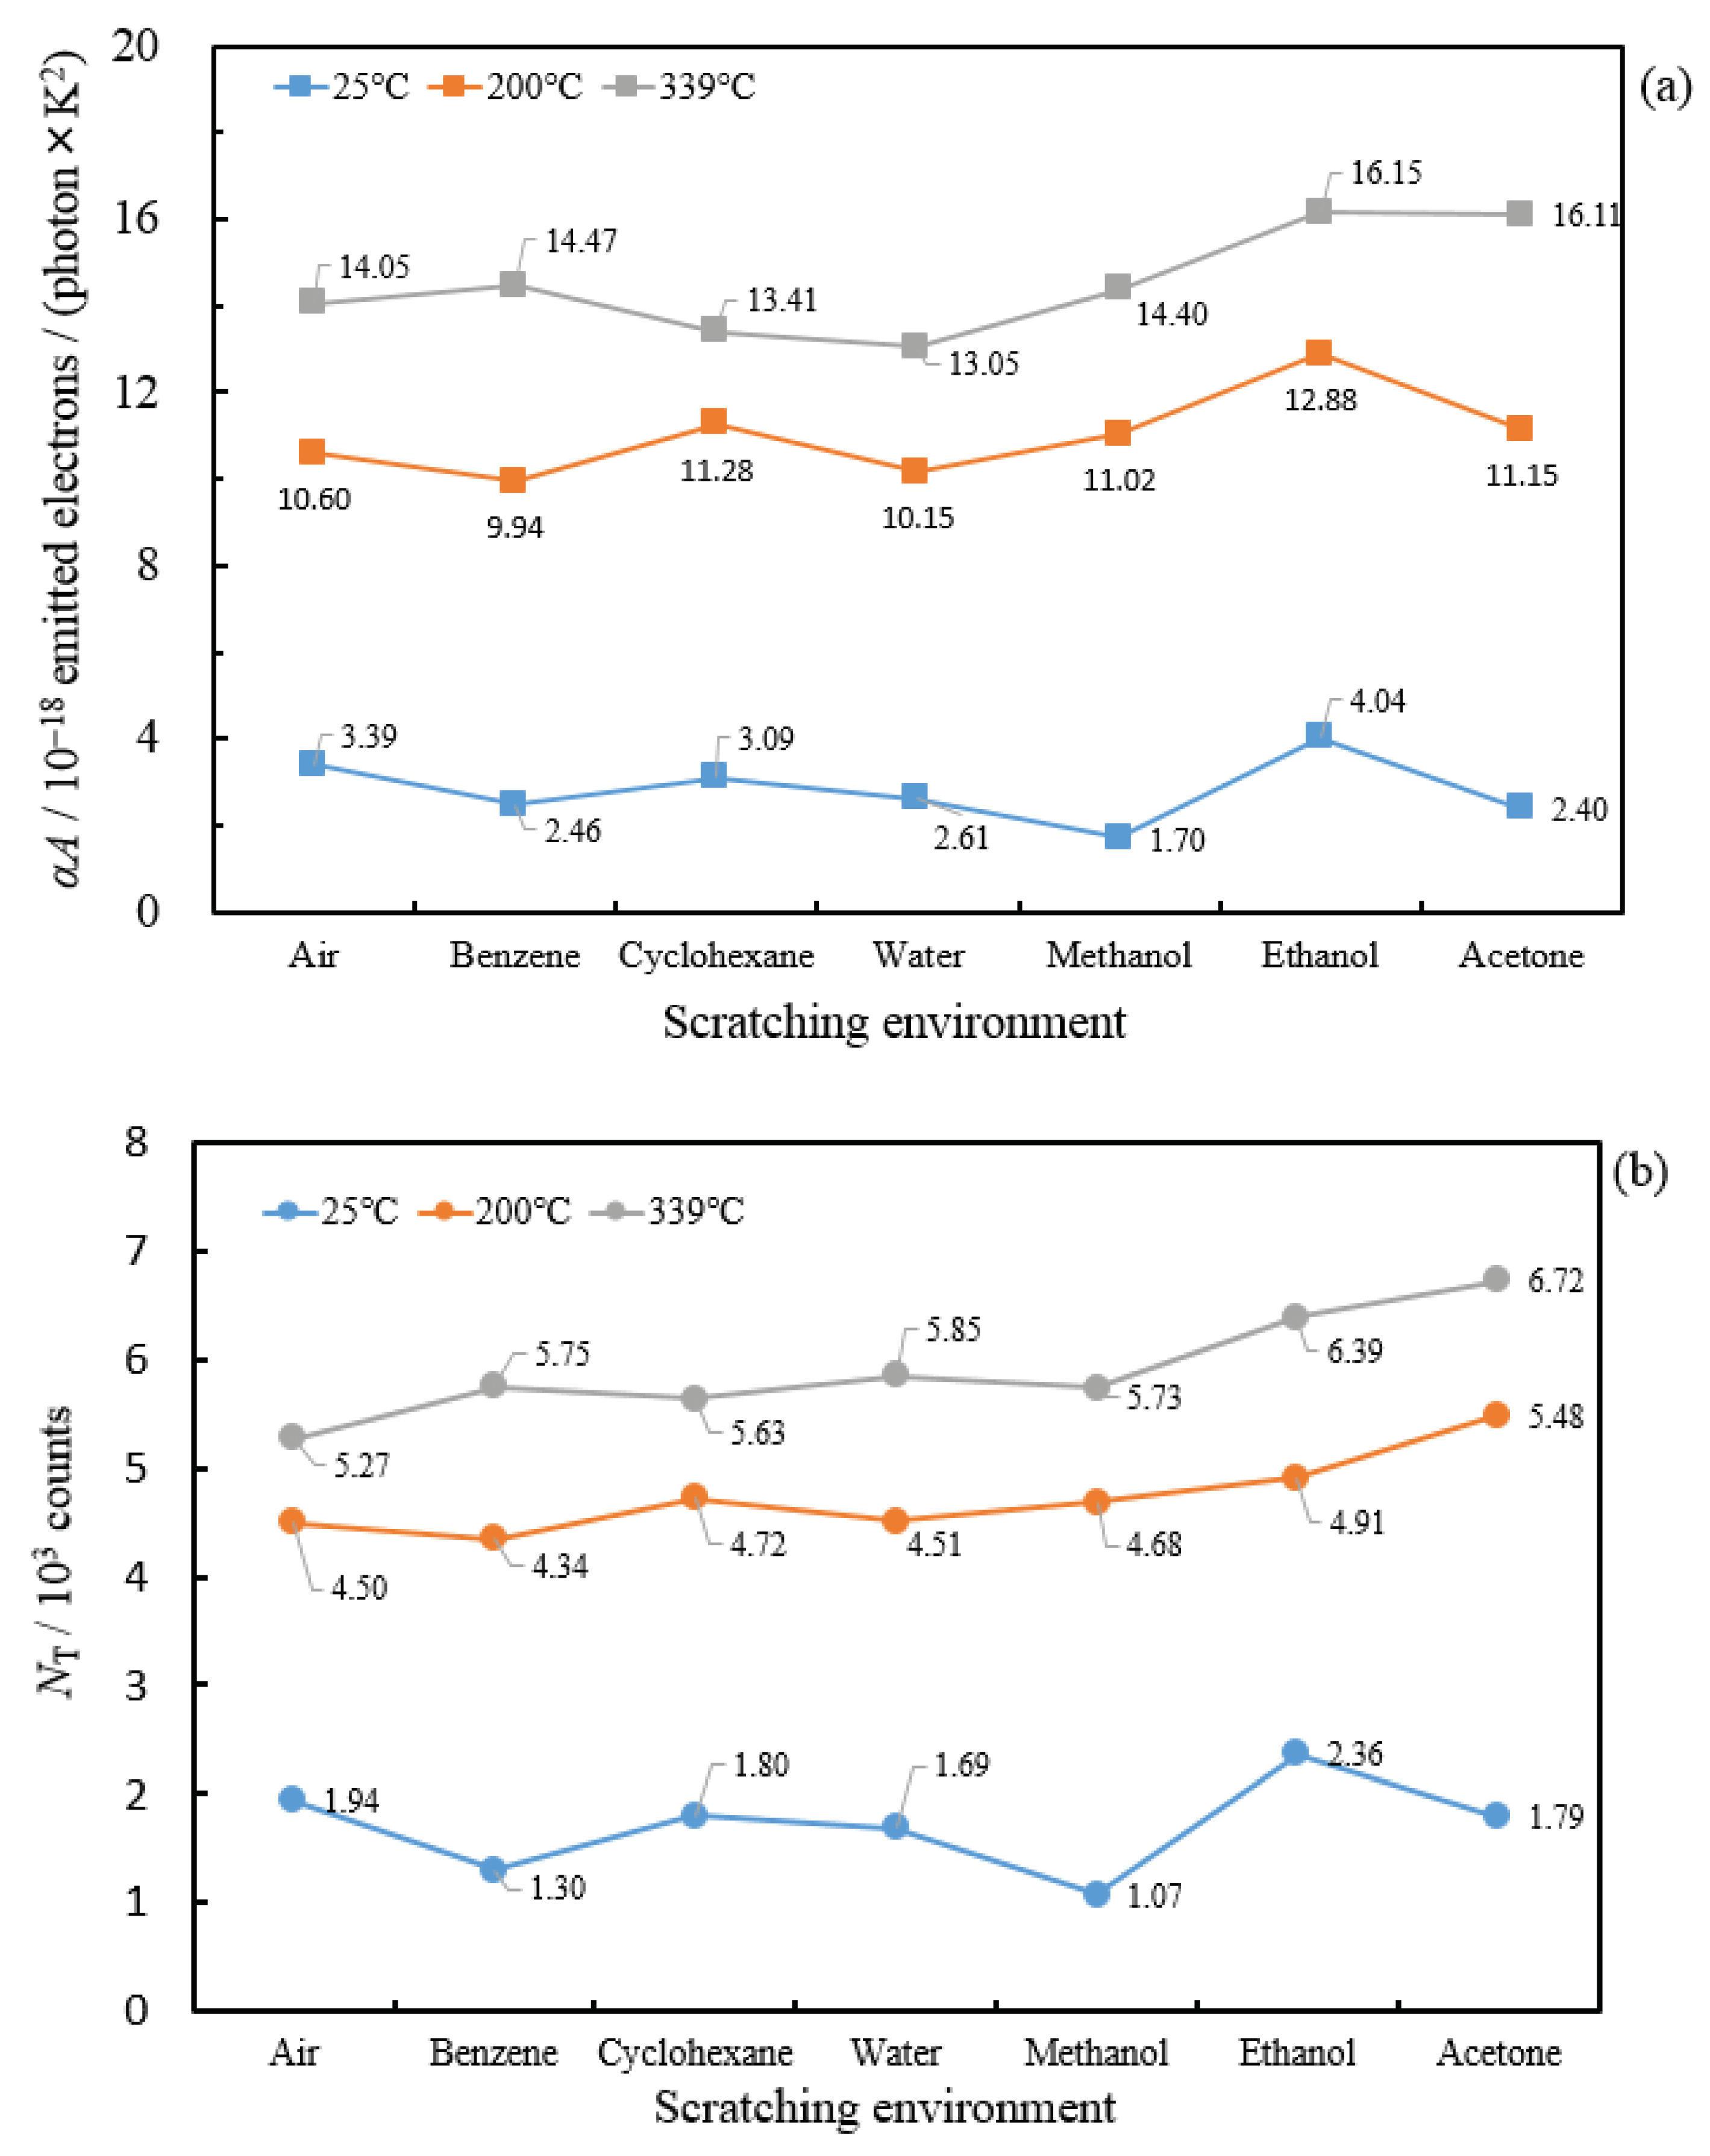
3.3. The PE Characteristics during Temperature Scan Against Scratching Environments

We indicate more explicitly the change in the PE characteristics for the temperature scan in different environments. The PE measurement in this case was conducted as described below [5].
The PE glow curves, representing the temperature dependence of PE intensity, which led to the PE quantum yield, Y, under 210-nm-wavelength light irradiation, were measured. The temperature scan was carried out over two cycles of temperature increase and subsequent decrease (Up1 and Down1 scans, and Up2 and Down2 scans) in the range 25–339 °C, and we obtained four PE glow curves. After that, the Arrhenius activation energies, ΔEa, were obtained using the PE quantum yields at seven temperatures chosen in the glow curve for each scan. The values of the total count of electrons emitted during the Up1 and Up2 scans, NUp1 and NUp2, respectively, were also obtained. Figure 7 shows the plots of NUp1 and NUp2 against the environments. It is seen that the values of NUp1 and NUp2 tended to increase as the environment shifted to the right, with a slightly higher level in the Up2 scan. The projected points at benzene in the Up1 scan and at air and methanol in the Up2 scan are in good agreement with the decreasing values of ΔEaUp1 and ΔEaUp2 in Figure 8, respectively.
Figure 8a,b shows the plots of the values of ΔEaUp1 and ΔEaUp2 against the environments, respectively. The ΔEaUp1 values widely ranged from 0.212 to 0.035 eV, while the values of ΔEaUp2 were in a much narrower range of 0.038 to 0.020 eV. We observed that the values of ΔEaUp1 showed a decreasing trend for the environments of water, methanol, ethanol, and acetone, i.e., except for benzene and cyclohexane. In addition, the values of ΔEaUp2 tended to gradually decrease as the environment shifted to the right. The sharp drop in ΔEaUp1 from air to benzene may be associated with the two routes presumed for the electron transfer process as stated above, although the mechanism remained unclear. The gradual decrease in ΔEaUp1 between the environments of water, methanol, ethanol, and acetone can be explained by the orientations of electric dipoles formed by the acid−base interaction modes between the molecules of (CH3)2CO, C2H5OH, CH3OH, and H2O, and the surface hydroxyl groups [5]. We explain the interaction modes of H2O, which has the highest acceptor number, and (CH3)2CO, which has the highest proton affinity, with Fe−OH. In the case of H2O, the H atom of H2O is attracted to the unshared electron pair of the O atom of Fe−OH, producing an electric dipole with its negatively charged end oriented outward, represented by Fe−OH⋅⋅⋅Hδ+−OHδ. In the case of (CH3)2CO, the H atom of Fe−OH is attracted to the unshared electron pair of the O atom of (CH3)2CO, producing an electric dipole with its positively charged end oriented toward the outside, represented by Fe−Oδ−Hδ+⋅⋅⋅O=C(CH3)2. Here, the symbol (⋅⋅⋅) denotes the hydrogen bond. Thus, these orientations of the electric charges contribute to the increase or reduction in ΔEaUp1, resulting in a significant influence on the PE intensity. Moreover, the decrease in ΔEaUp2 with the environments may be associated with a weak acid–base interaction between the molecule of the environments and the Fe−OH remaining on the surface even after the Down1 temperature scan. Here, we summarize the effect of the surface oxygen on the PE during the temperature scan. The air environment has the highest values of ΔEO1s and ΔEO2 (Table 4). This finding suggests that, since the surface oxygen species in the case of air at 25 °C is considerably strongly bound to the surface, the ability of the oxygen species to move with temperature is suppressed. Therefore, it can be said that the air environment acts to reduce the PE, producing the highest value of ΔEaUp1 [5]. On the other hand, from Figure 4c and Figure 7, it can be stated that the surface oxygen species for all environments plays a significant role in the increase in PE intensity.
Figure 9 shows the relationship between the electron emission intensity at 339 °C during the Up1 and Up2 scans and the XPS O 1s intensity at 339 °C for all environments (Figure 4c). Although the data are widely scattered, it is confirmed that the increase in the surface oxygen favors the enhancement of electron emission intensity in both scans. We consider that the increase in the electron emission intensity in Figure 9 can be attributed to a large contribution of the O2 component of the O 1s spectrum at this temperature and the acid–base interaction between the environment molecule and Fe−OH. Here, we emphasize, again, that there are two types of action of the surface oxygen species on the PE during the temperature scan: one has the ability to strongly reduce the PE, and the other one is able to promote the PE with the aid of the interaction with molecules of the scratching environments. It is of interest to describe here, again, the relationship between NUp1 and ΔEaUp1 and between NUp2 and ΔEaUp2, which was reported in Reference [5]. In Figure 10, the values of NUp1 and NUp2 decreased with increasing ΔEaUp1 and ΔEaUp2, respectively. Clearly, this indicates that the total counts of electrons emitted from a scratched sample in the Up1 and Up2 temperature scans are closely associated with the activation energies (ΔEaUp1 and ΔEaUp2, respectively).

3.4. The PE Characteristics during Wavelength (Photon Energy) Scan Against Scratching Environments

The PE intensity during the light wavelength scan in the range of 300−200 nm was measured at 25, 200, and 339 °C using a new sample. The wavelength scan was conducted twice at each temperature. The PE characteristics of the electron photoemission probability, αA, the total number of emitted electrons, NT, and ϕ, and their activation energies ΔEαA, ΔENT, and ΔEϕ were obtained for each scan, and the average values of these characteristics for the two scans were employed. The PE data were fixed to Fowler–DuBridge’s approximate equation for PE quantum yields (emitted electrons/photon), YFD = αA(Epϕ)2/2kB2 (Equation (4)), where αA is the electron photoemission probability, A is identical to the Richardson constant, Ep is the incident photon energy , and ϕ is the photothreshold. The mean values of the PE characteristics obtained from the two scans were given in Reference [7]. In Figure 11 and Figure 12, we plotted the average of the αA and NT values, and the ΔEαA and ΔENT values against the environments, respectively. In Figure 11a, the αA values for each environment greatly increased with increasing temperature from 25 to 200 °C, and slightly increased from 200 to 339 °C. Regarding the dependence of the αA values on the environments, the αA level at 25 °C was nearly constant, but the αA values at 200 and 339 °C tended to increase slightly as the environment was shifted to the right, with a depression at 339 °C for cyclohexane, water, and methanol. In Figure 11b, the NT values greatly increased with temperature from 25 to 200 °C and slightly increased from 200 to 339 °C. The values at 200 and 339 °C gradually increased as the environment was shifted to the right. This behavior was almost the same as the αA values.
Figure 12 shows the plots of the values of ΔEαA and ΔENT against the environments. The ΔEαA was in the range 0.113–0.074 eV, and the ΔENT was in the range 0.088–0.053 eV. It is seen that ΔEαA and ΔENT tended to slightly increase as the environment was shifted to the right. Surprisingly, it was found that, in contrast with the environment dependence of ΔEaUp1 and ΔEaUp2 during the temperature scan (Figure 8), the environment dependence of ΔEαA and ΔENT obtained from the wavelength scan had a completely opposite tendency. We propose that this difference can be explained as a result of the interaction between the environment molecule and the surface oxygen species being predominant during the temperature scan.
Here, regarding the experimental result of the temperature dependence of αA, we introduce the result by Ames and Christensen [11]. The authors obtained the values of the dimensionless probability parameter, α, as a function of temperature from room temperature to 760 °C in the photoelectric emission from nickel over a wavelength range from 225 to 253 nm. Using the α values shown in Figure 6 in Reference [11], we calculated the ratios of α values, both at 760 and 25 °C and at 340 and 25 °C; the ratio for the former was α760/α25 = 6.3 and that for the latter α340/α25 = 2.2. For comparison, we calculated the ratio of αA values at 339 and 25 °C obtained in the present experiment (Figure 11a). In the cases of acetone and air, the ratio values were αA339/αA25 = 6.7 for acetone and αA339/αA25 = 4.1 for air. This indicates that the increase in the α values from 25 to 339 °C for the present scratched iron samples was considerably greater than that for the nickel: α340/α25 = 2.2. This difference may be related to the surface cleaning of the nickel and the surface scratching of the iron samples. We consider the PE process. Firstly, the electrons can be photo-excited from the valence band of the metal, becoming hot electrons before being transported through the overlayer to the outer surface. The overlayer is considered to consist of a mixed trilayer of FexO, Fe3O4, and FeOOH, as mentioned above. Regarding the overlayer suffering electron–electron scattering during the transport, we examined whether the amount of surface elements present in the overlayer can affect the αA, causing a change in the ability of the electrons to emit. We used XPS intensities of Fe 2p, Fe 3p, and O 1s. Figure 13 shows the plots of the αA values against XPS Fe 2p, Fe 3p, and O 1s intensities at 25, 200, and 339 °C, respectively. In Figure 13a–c, it is seen that, with increasing temperature, the data points of αA values tended to shift to the higher values of XPS Fe 2p, Fe 3p, and O 1s intensities, and the level of αA values also became higher. We paid attention to the slope of the approximately straight lines plotted in Figure 13. The αA values at 200 and 339 °C tended to increase with increasing XPS Fe 2p, Fe 3p, and O 1s intensities, with a much steeper gradient at 339 °C. Therefore, it seems that the increase in the amount of iron and oxygen atoms enhances the αA.
In Table 5, we examine how the acceptor number of the environment molecules can be related to the activation energies obtained from the PE characteristics data during temperature and wavelength scans and from the XPS data. Here, it should be noted that the scratching environments are rearranged in decreasing order of the acceptor number. The results given in Table 5 are featured as follows: (1) the activation energies of ΔEO 1s, ΔEO2, and ΔEO 1sPEAK for air are remarkably higher than those for other environments, and this trend is analogous to that of ΔEaUp1. This indicates that the surface oxygen species in the case of air are more strongly bound on the surface, such that increased thermal energy is required to grow the oxide layer, which leads to an increase in the PE in the Up1 temperature scan; (2) for the environments from water to benzene, the decreasing order of the acceptor number is in good agreement with the decreasing order of ΔEaUp1. This means that the molecule of liquid environments with higher acceptor number, meaning higher Lewis acidity or electrophilicity of a solvent, produces higher ΔEaUp1. As described above, this can be attributed to the electric dipole with a negatively charged end oriented outward formed between the environment molecule and the Fe−OH; (3) interestingly, it was found that the plot of ΔEaUp1 against ΔEO2 yielded a straight line with a positive slope. Furthermore, it was confirmed that the plots of ΔEO2 against the acceptor number formed a straight line with a positive slope. Regarding ΔEO2, it seems that the growth of crystalline structure, including O2 species, can be associated with the enhancement of the PE in the Up1 temperature scan; (4) lastly, the values of ΔEaUp2, ΔEαA, ΔENT, and ΔEϕ were nearly independent of the acceptor number of the environments and of ΔEO2. It is of interest that the photothreshold had a small activation energy, although the reason remains unclear.

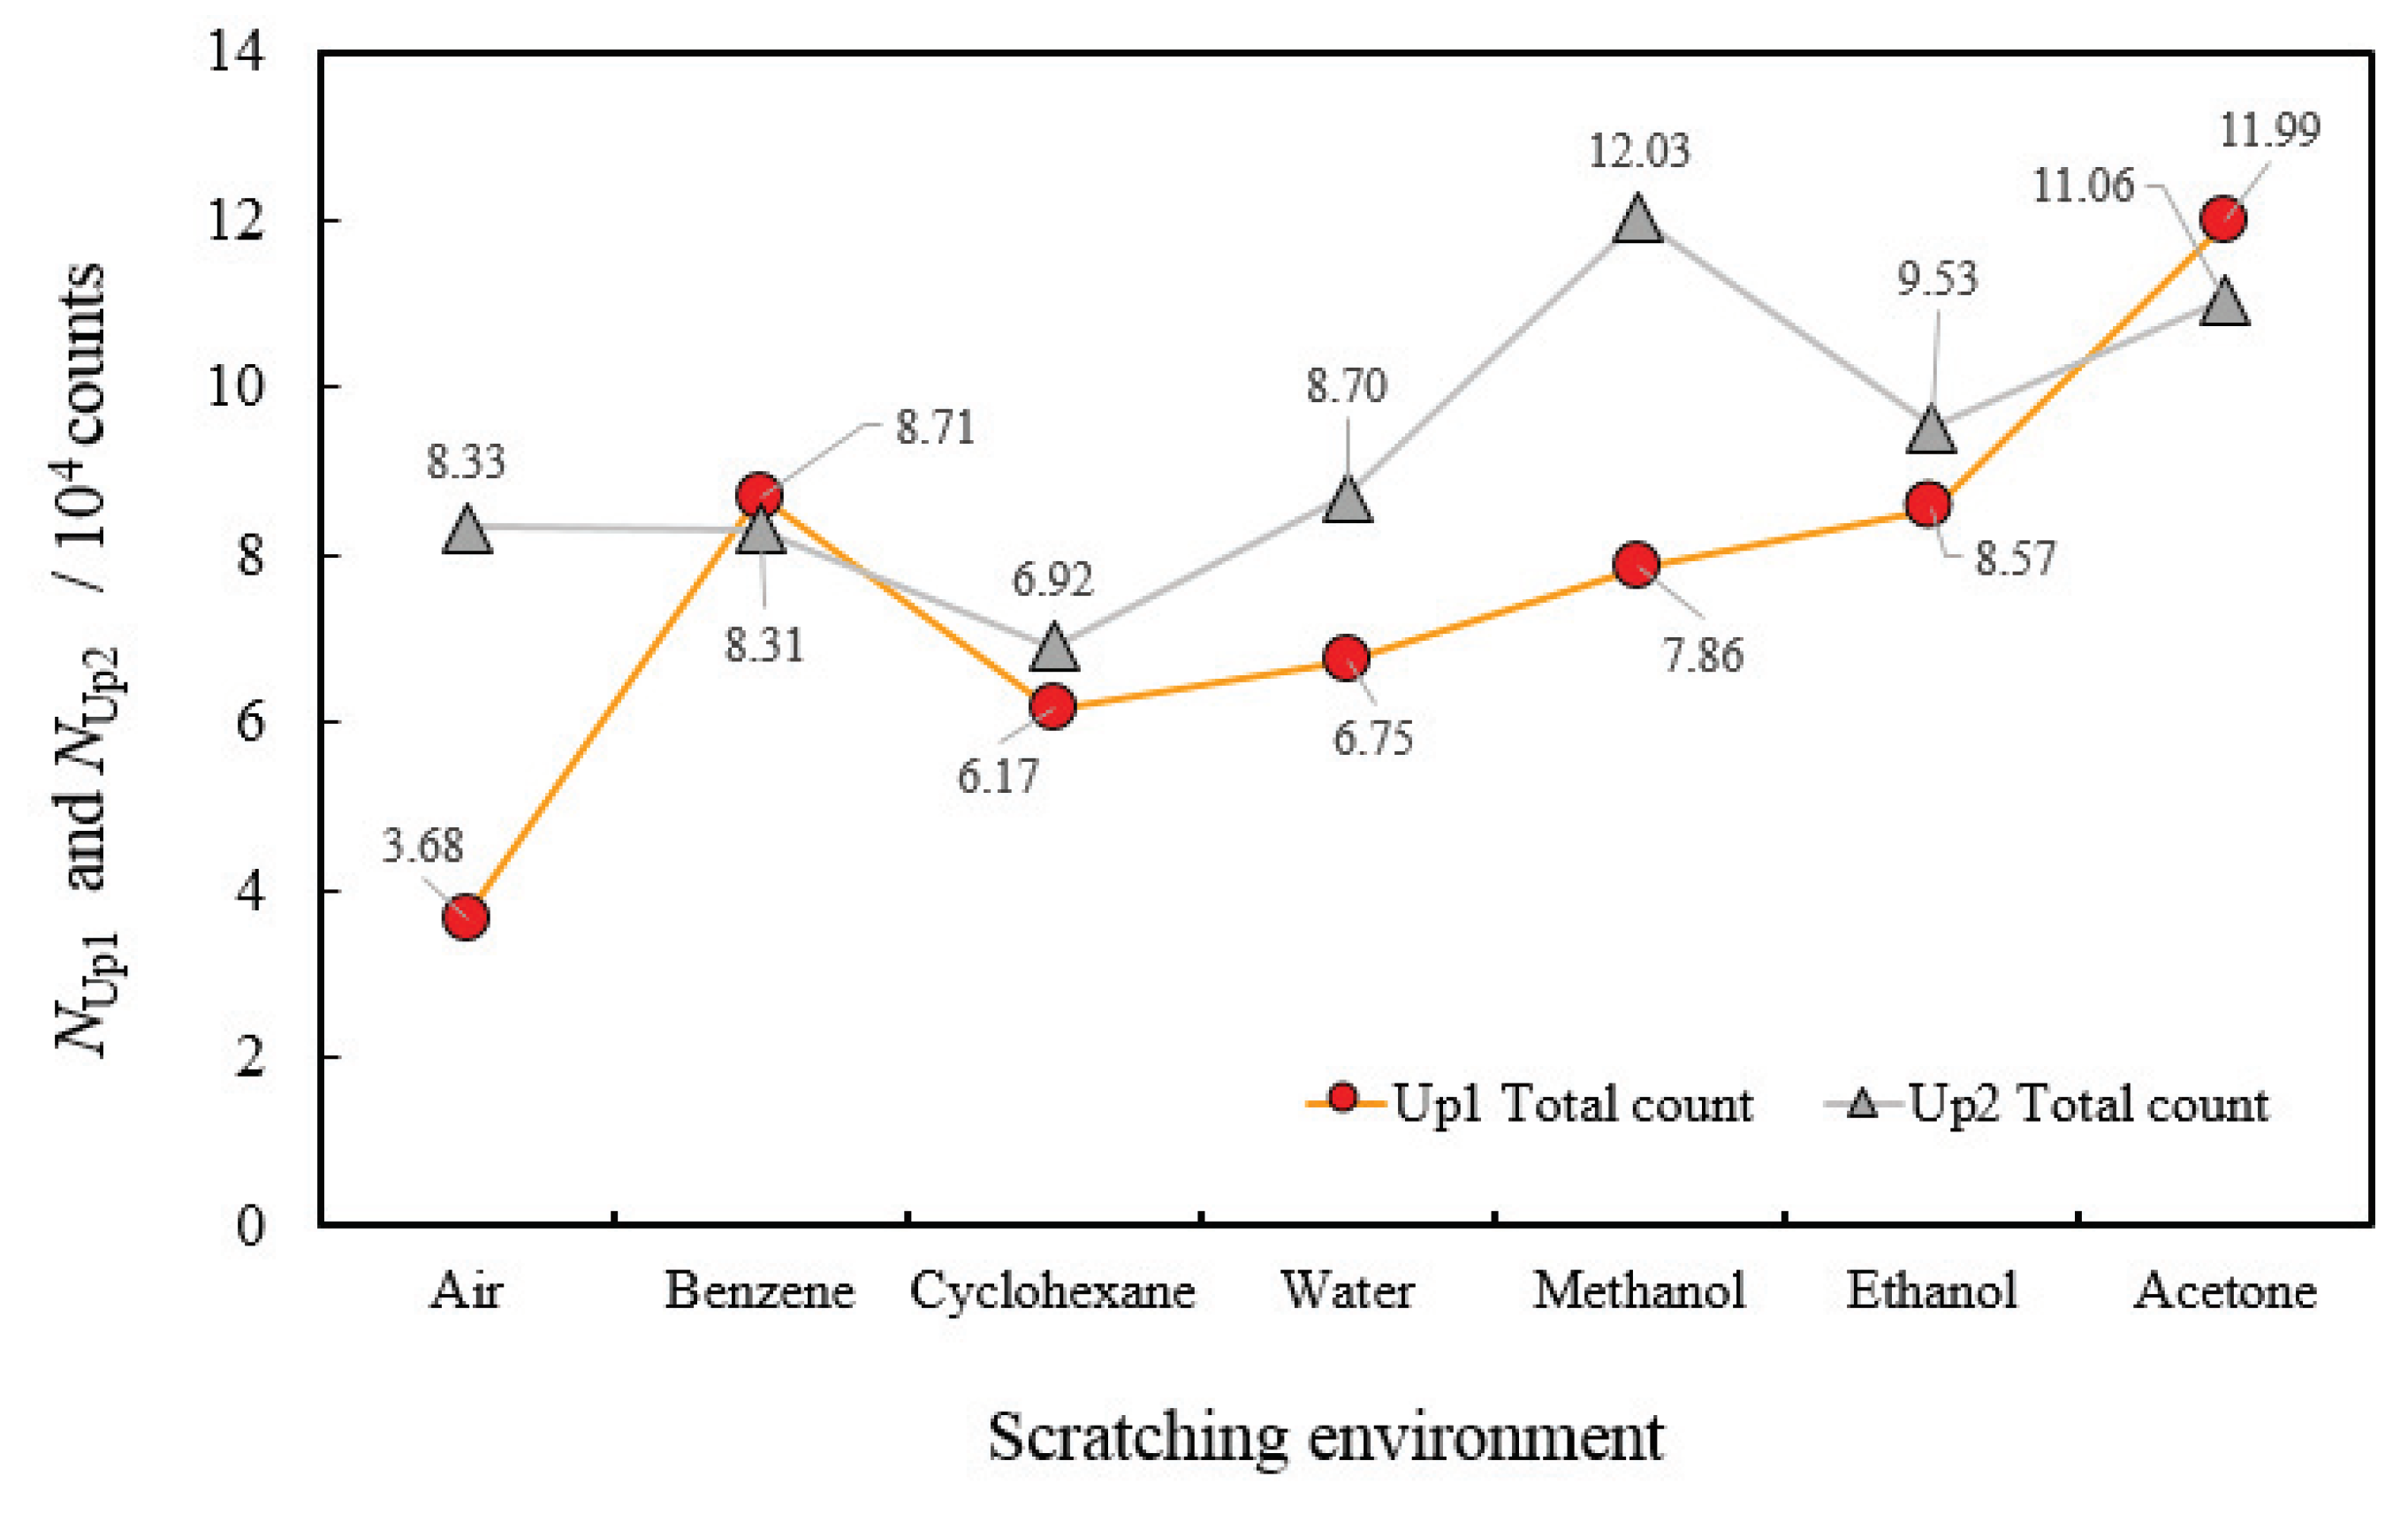
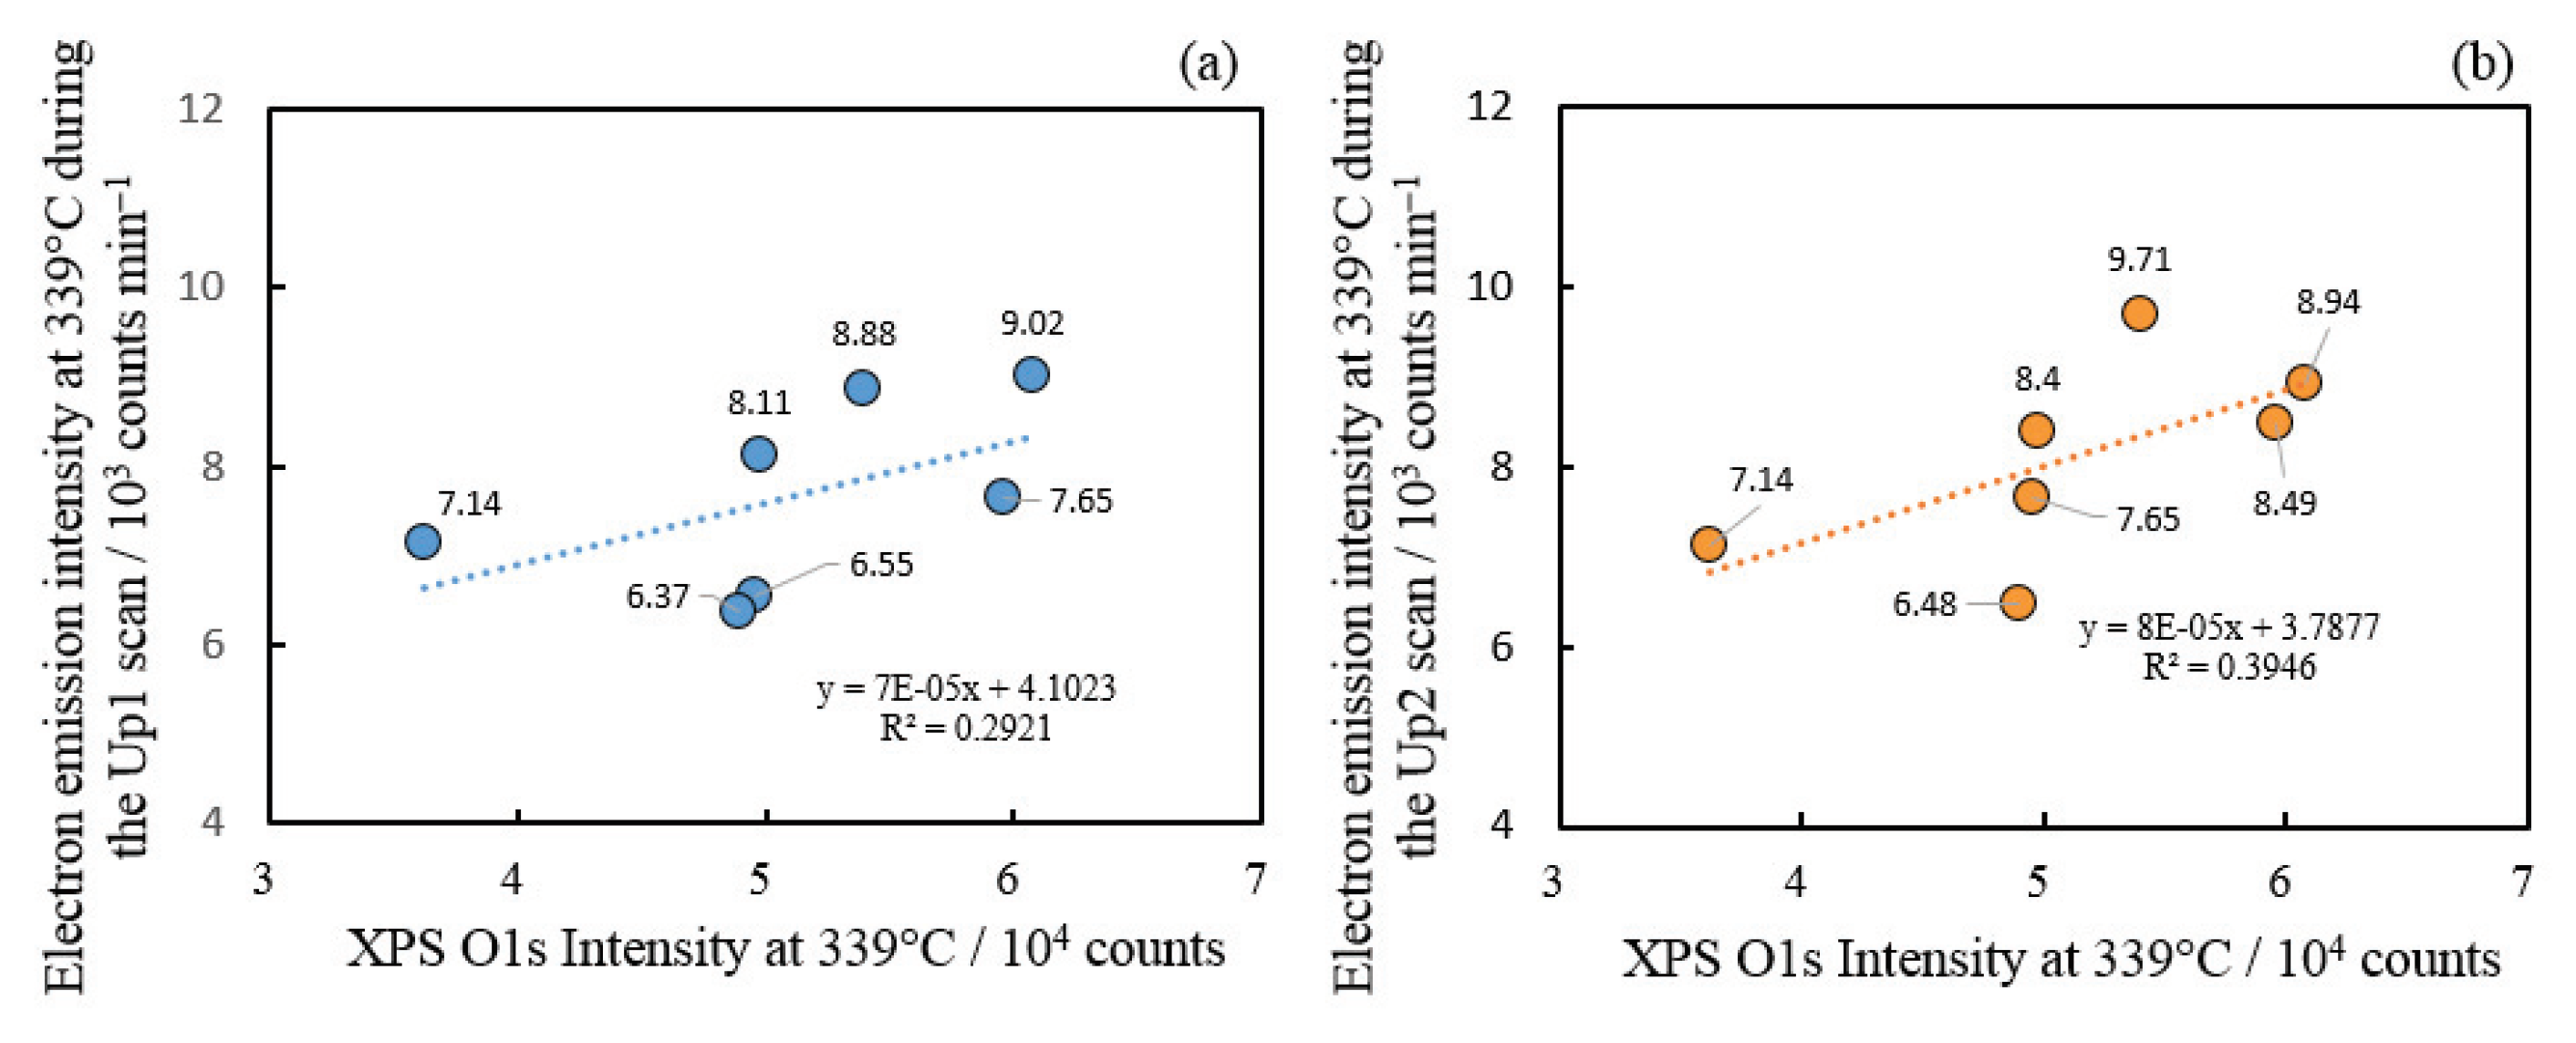
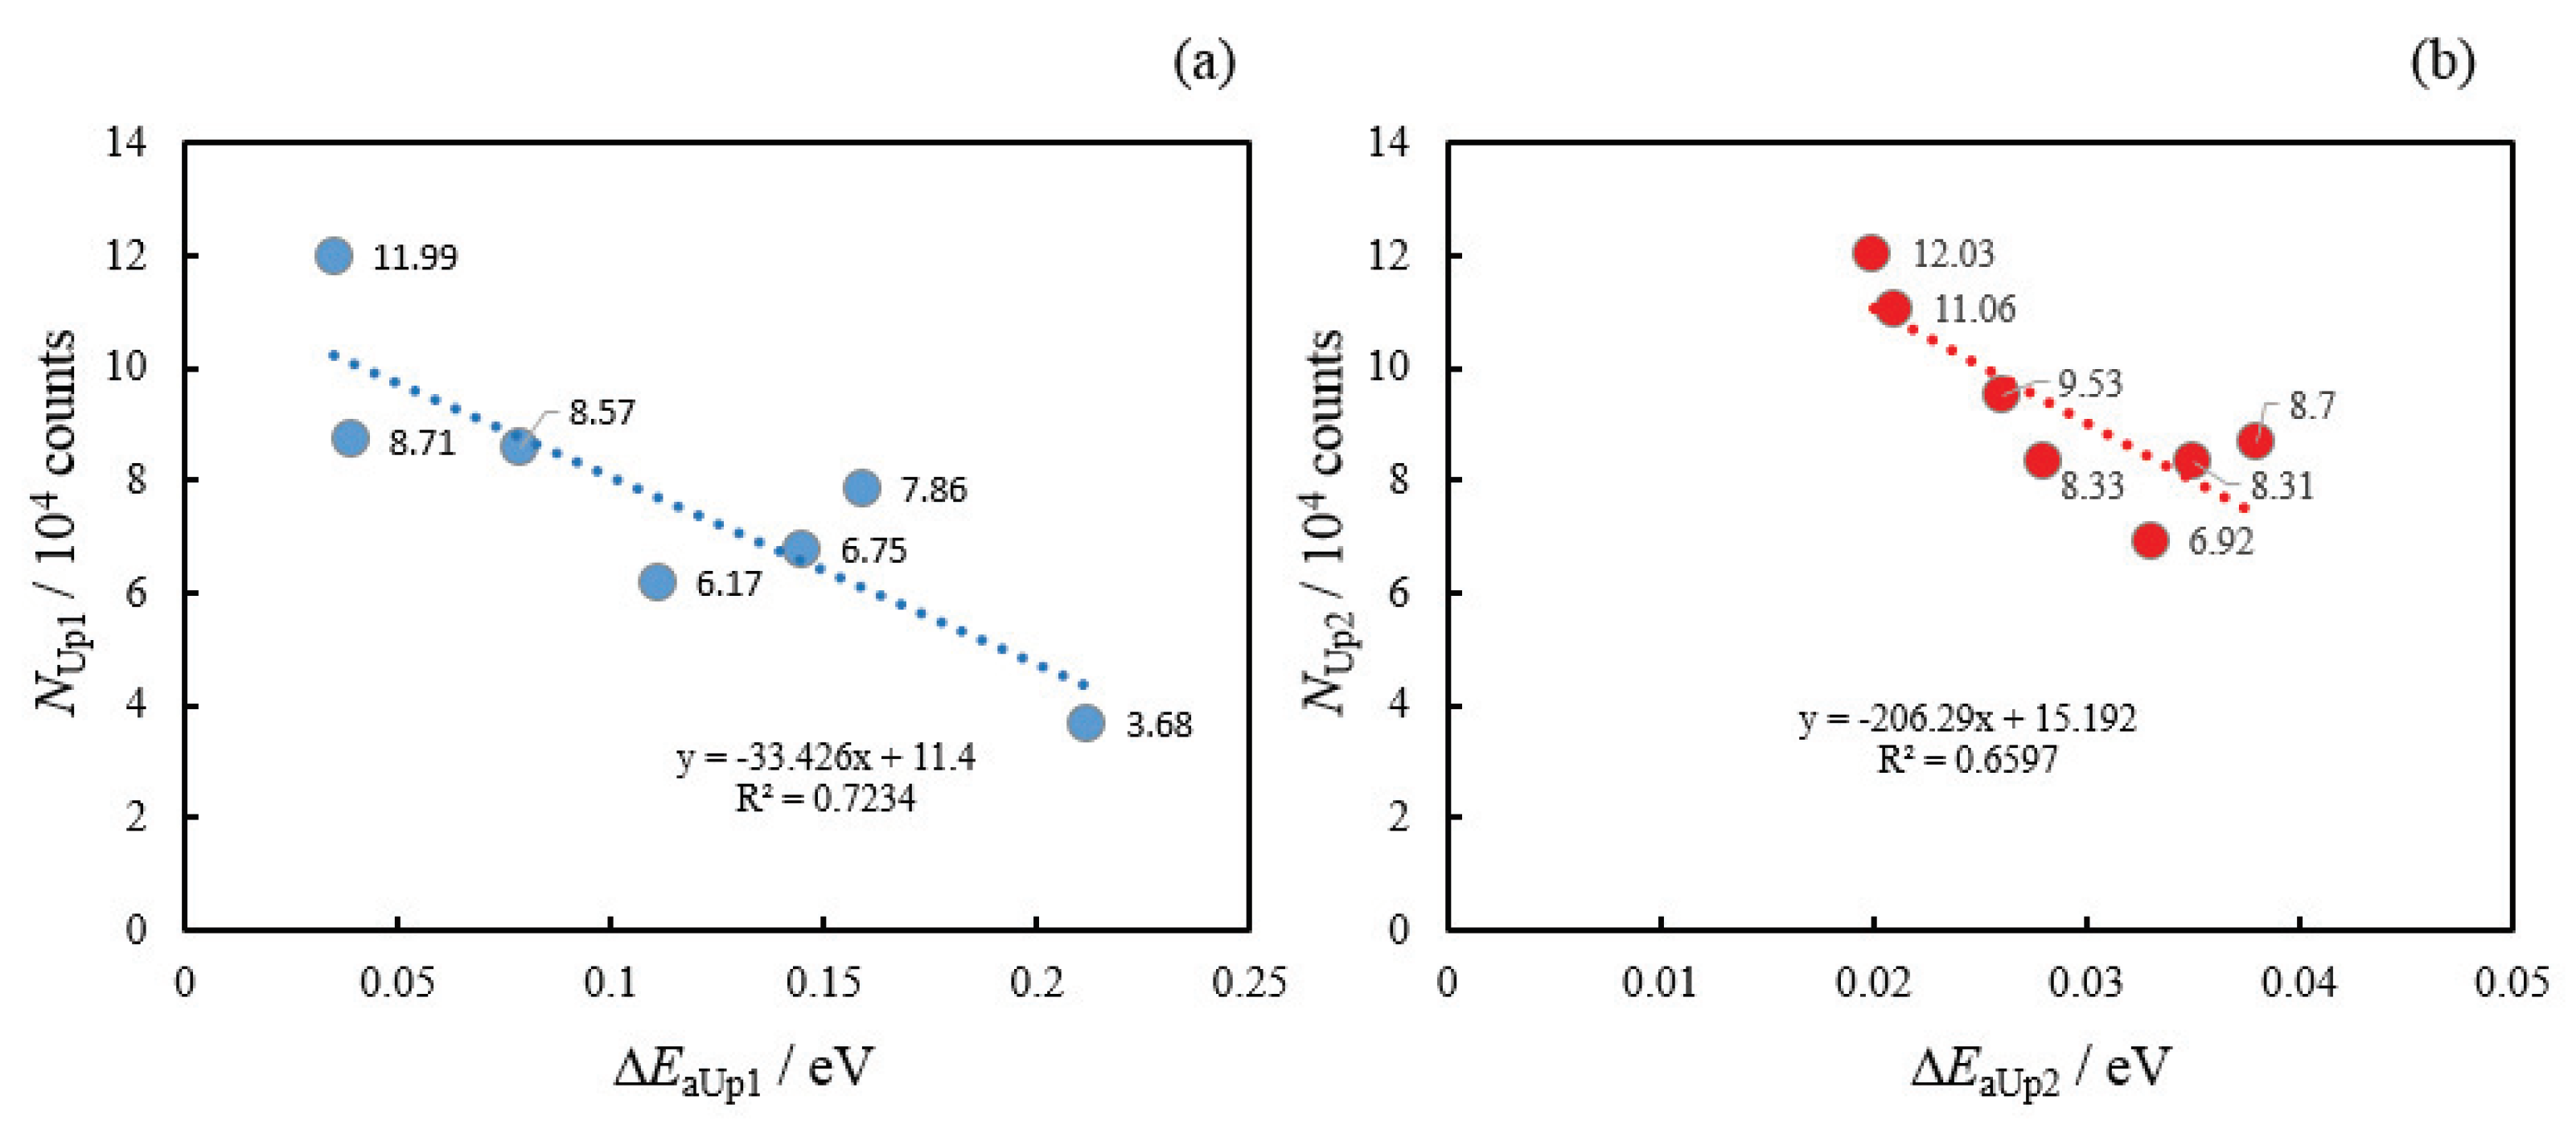
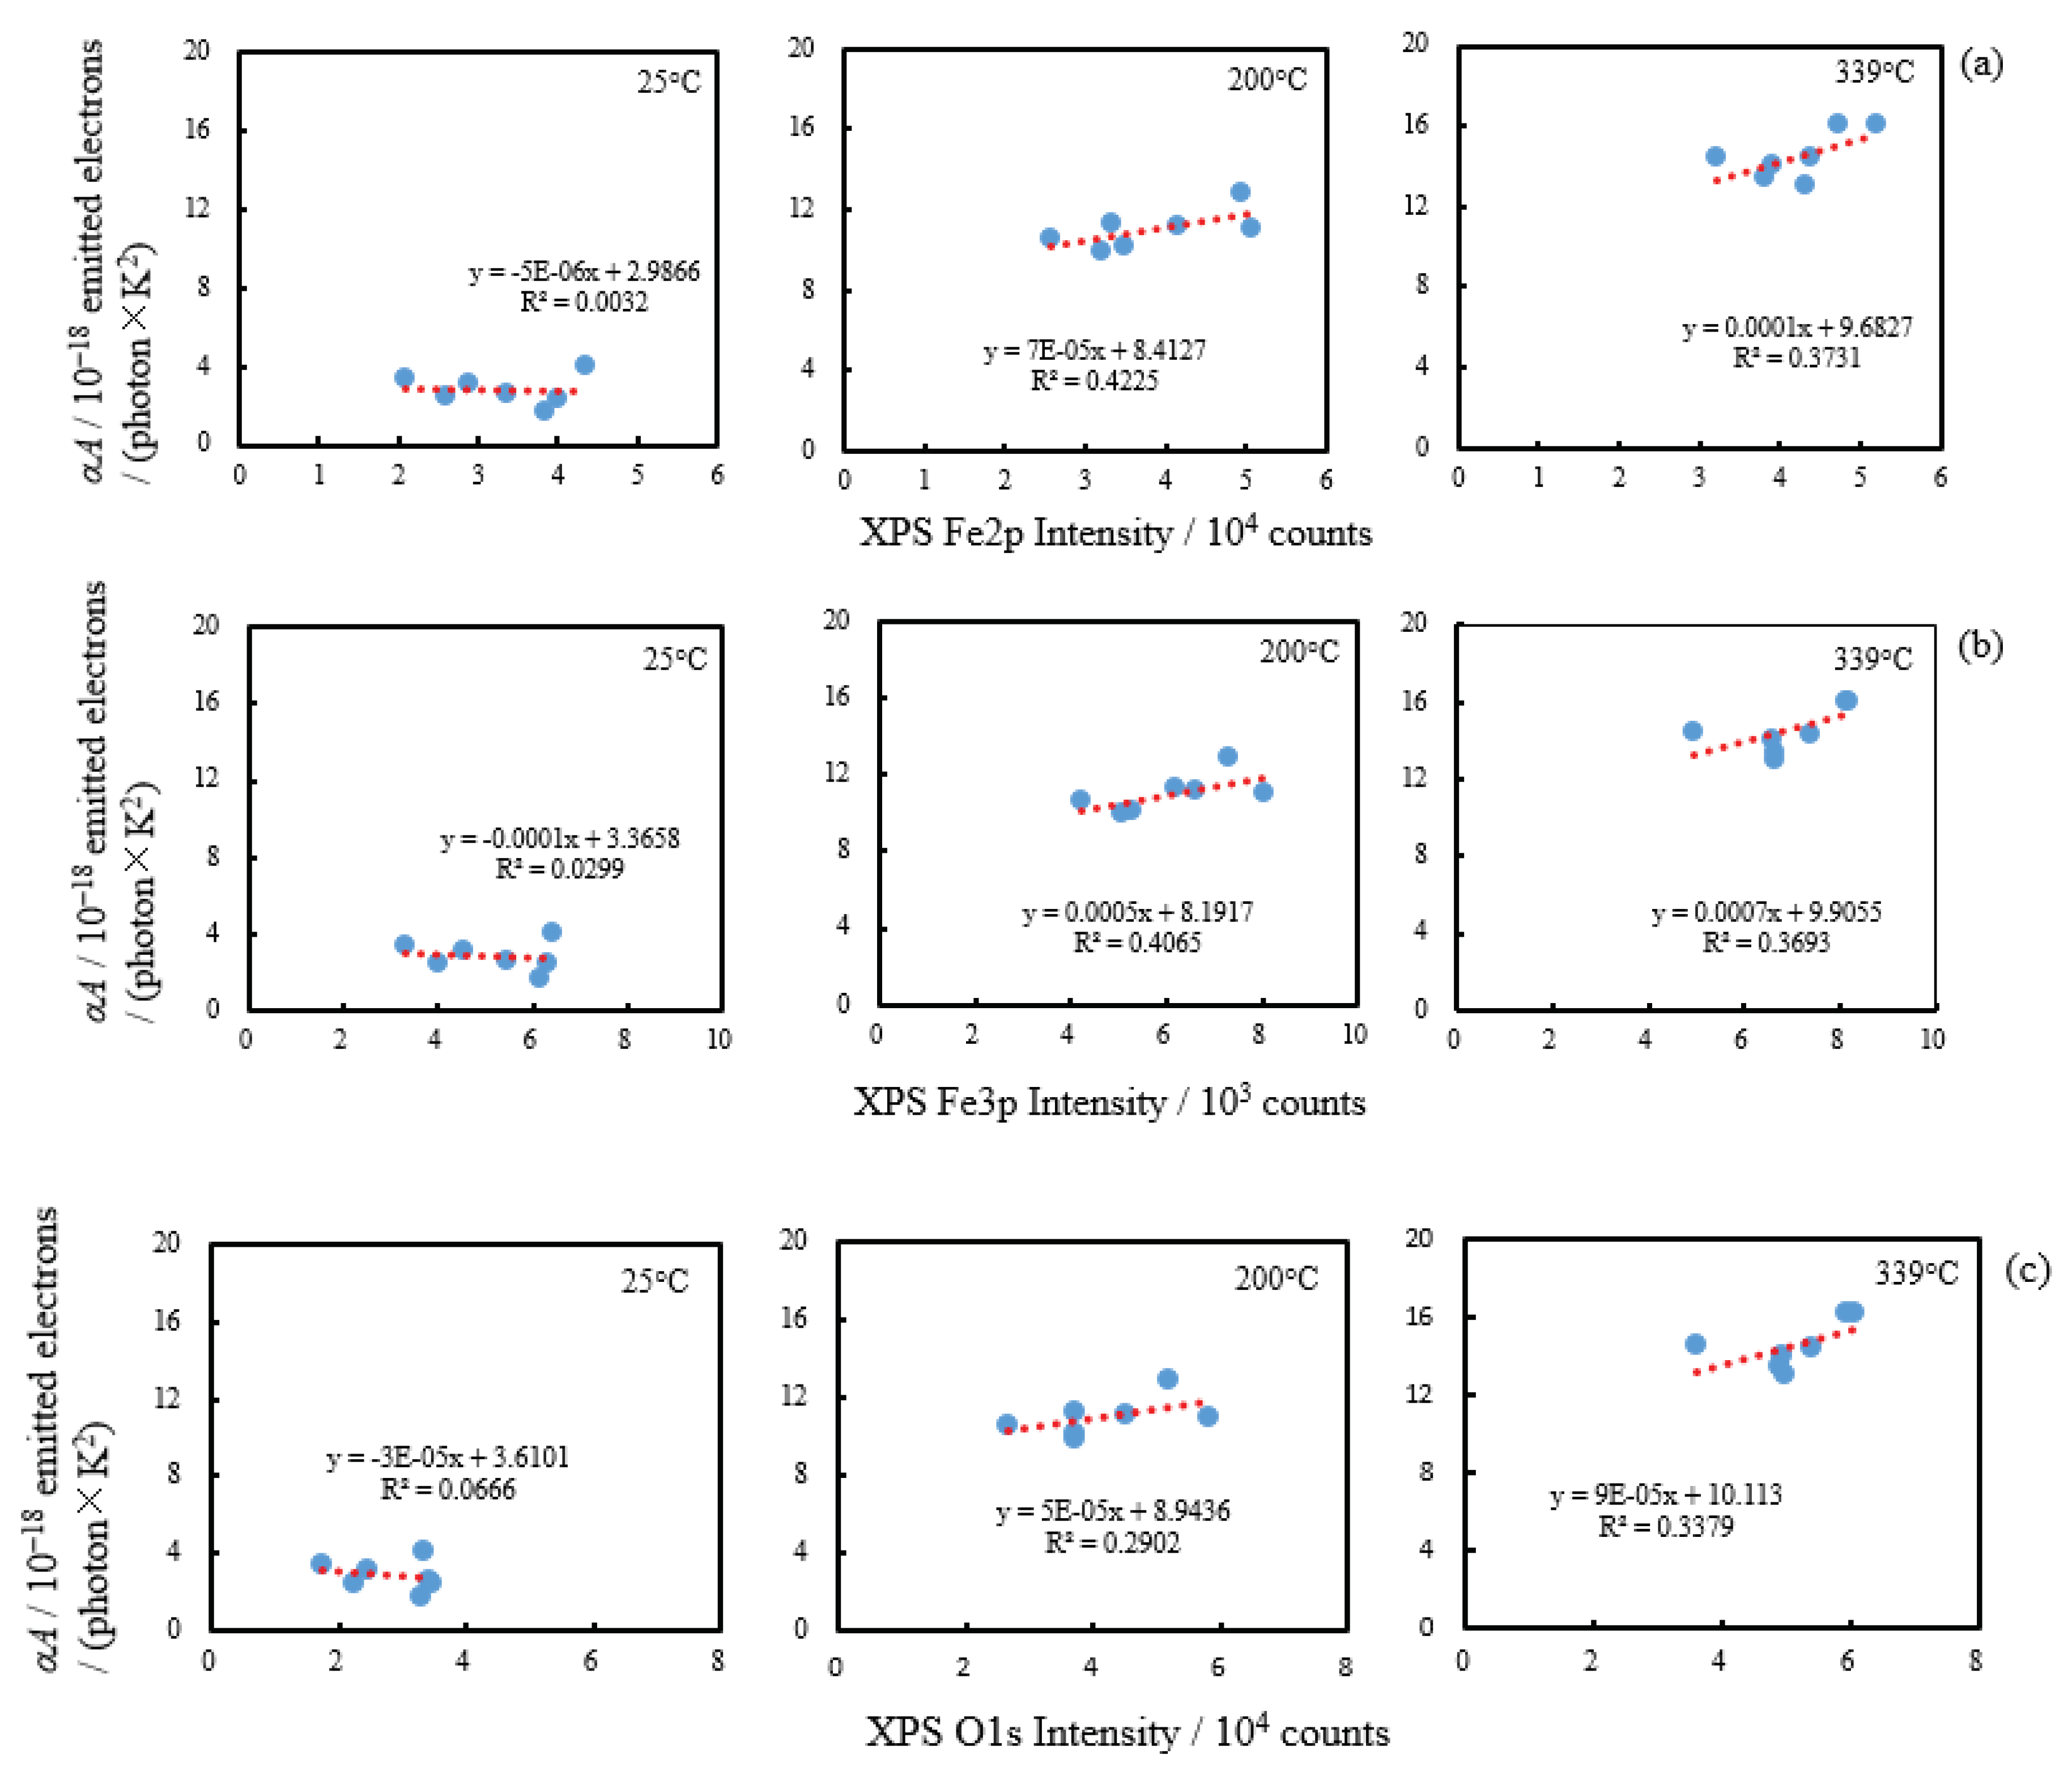
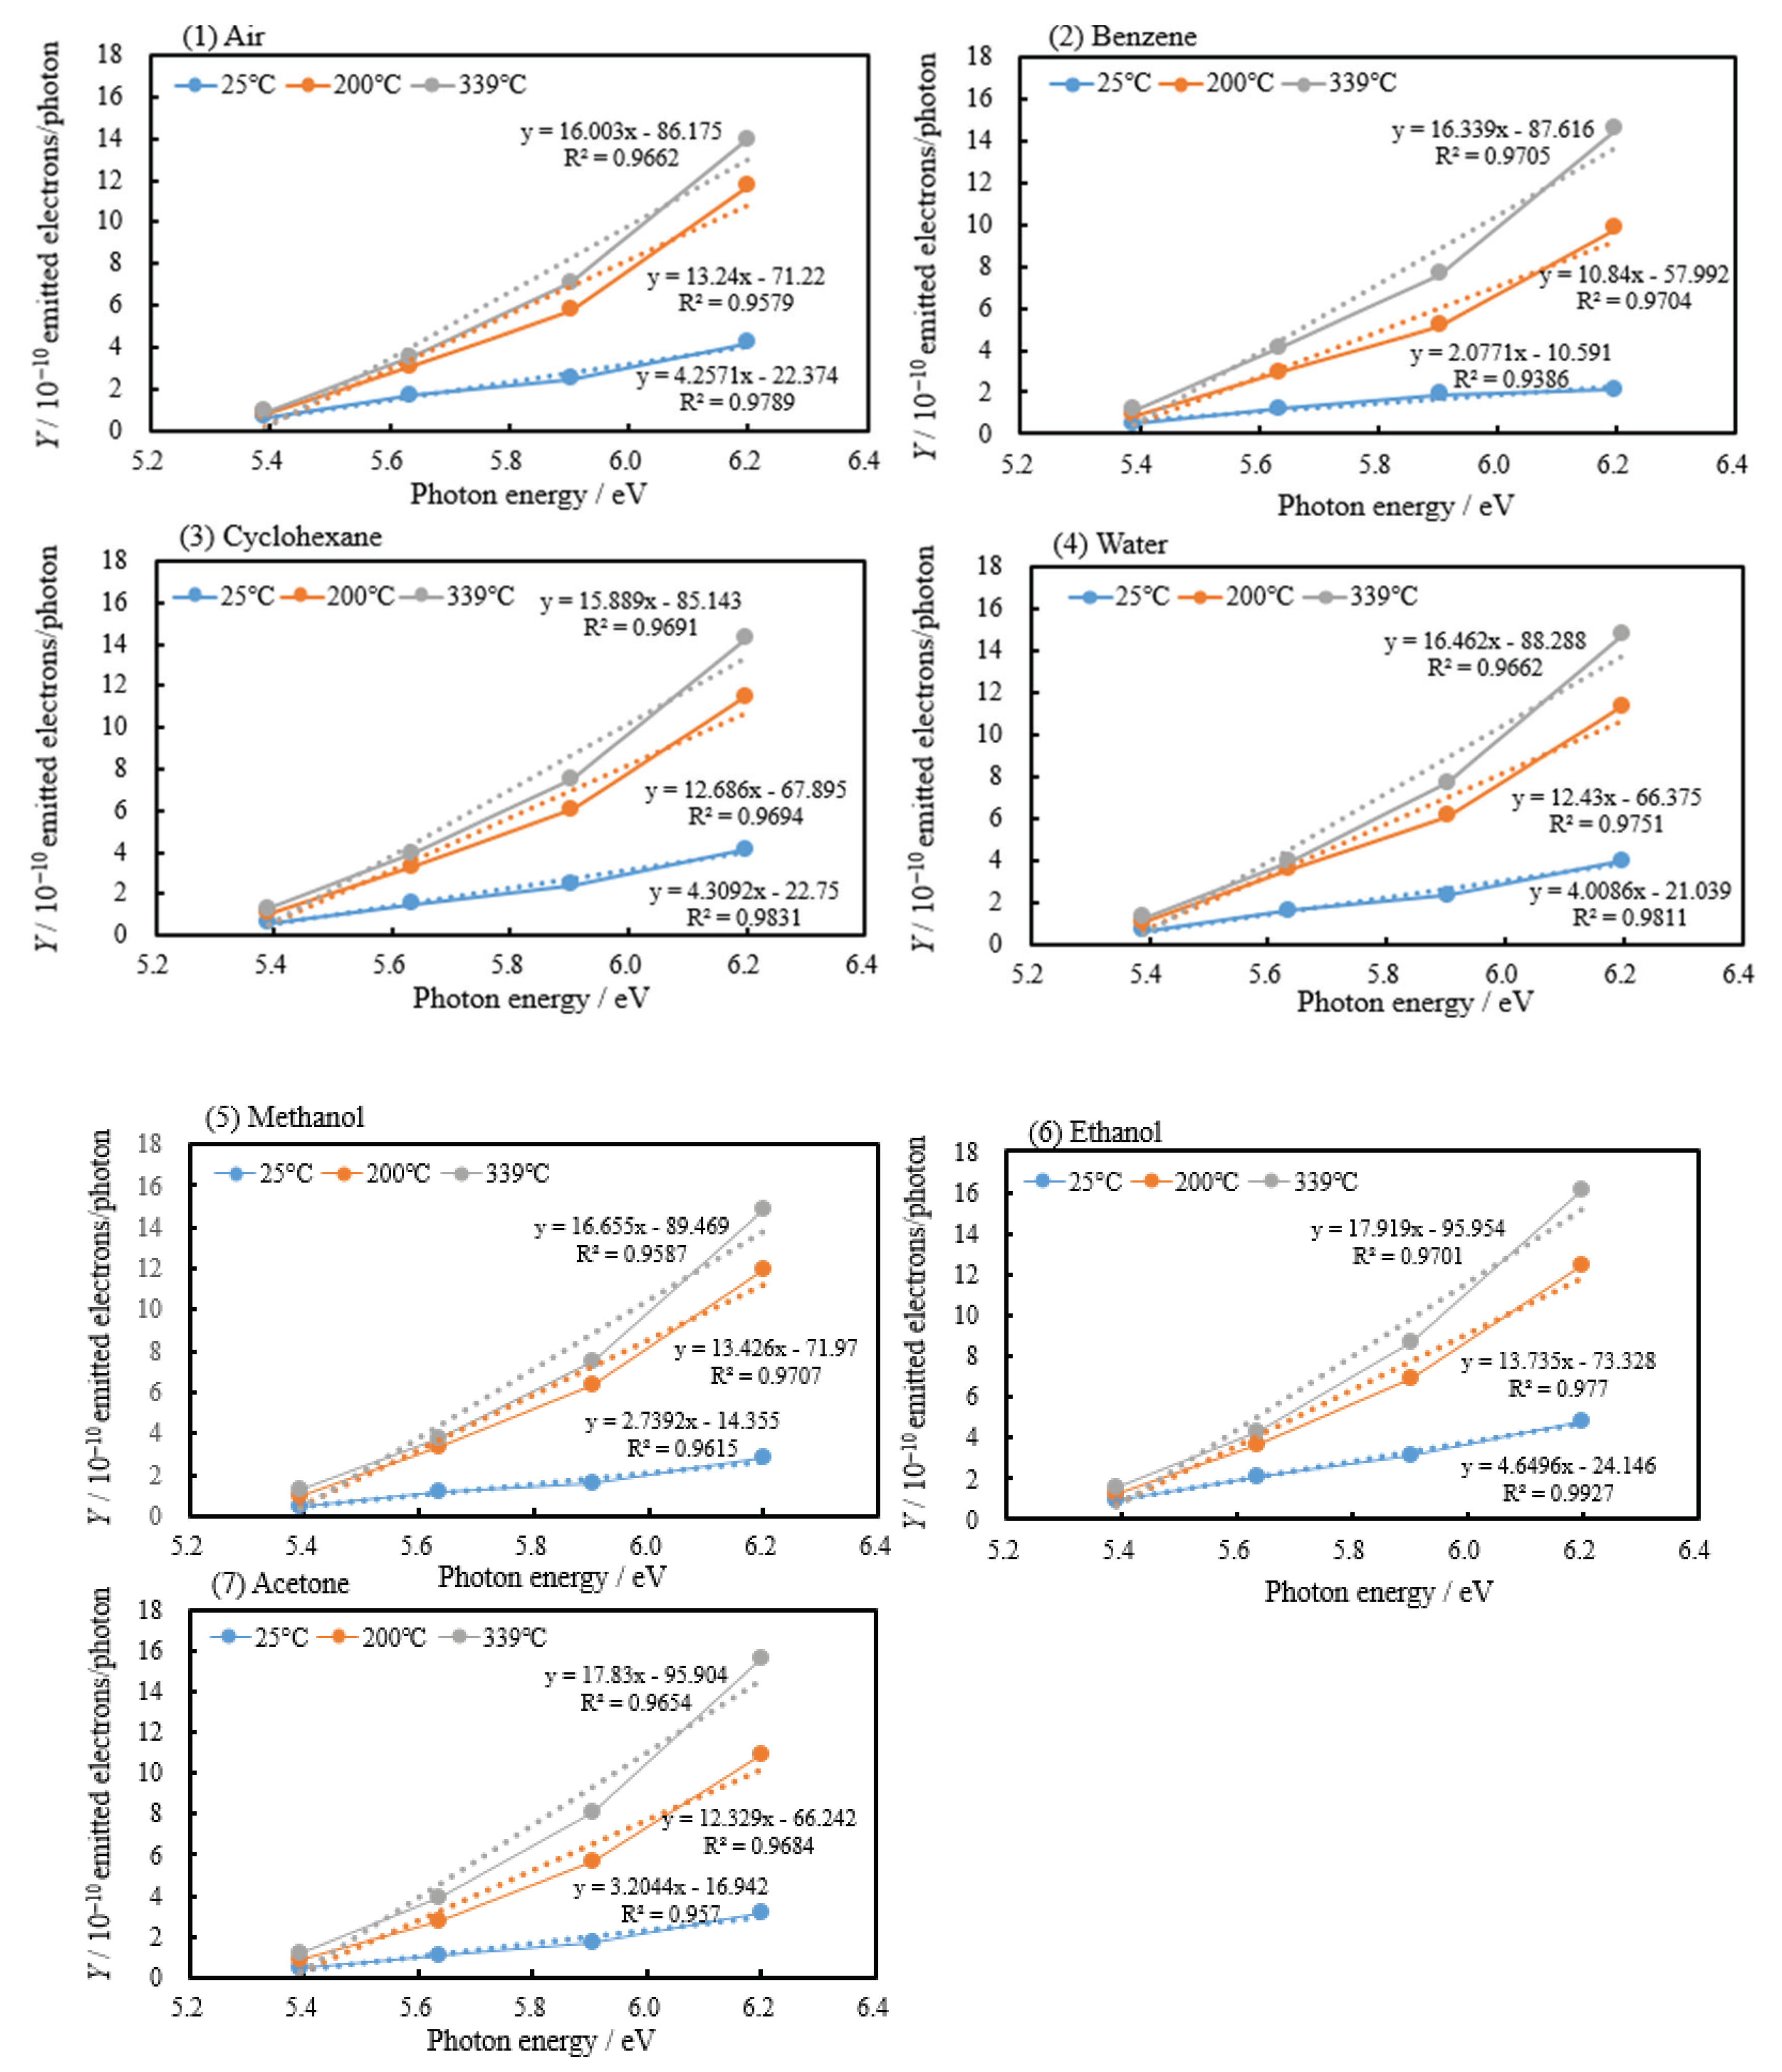
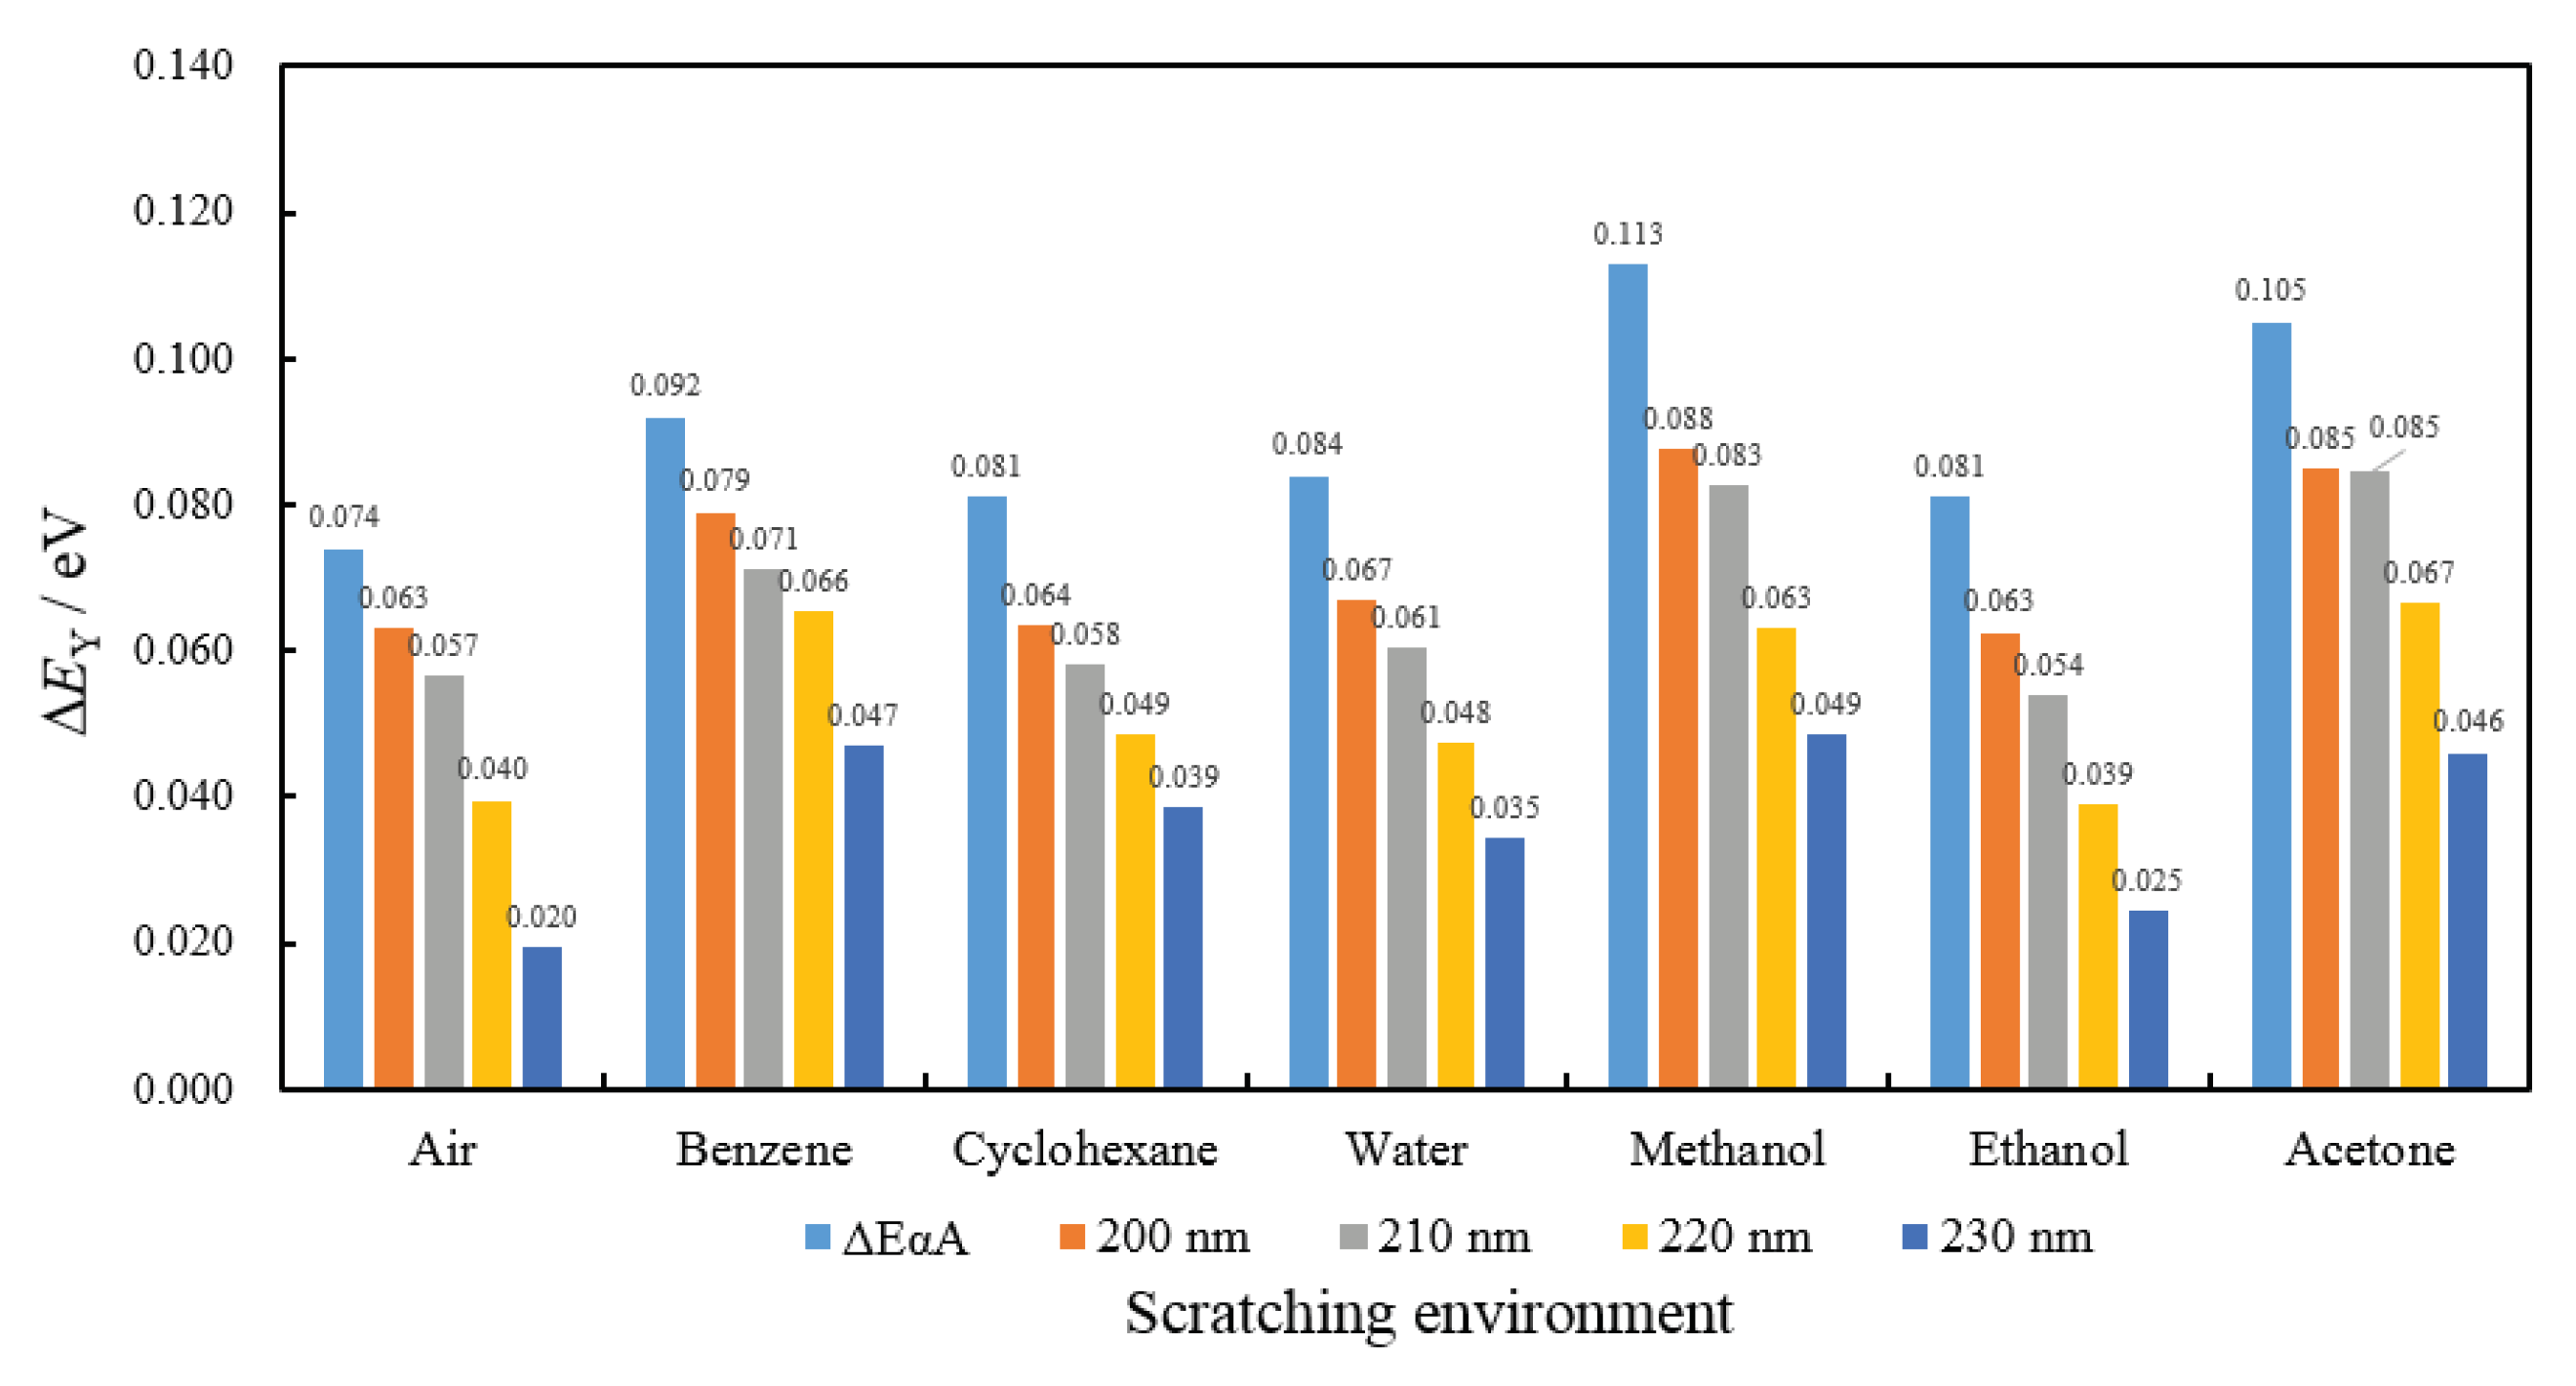
3.5. PE Quantum Yields at Different Photon Energies during Wavelength Scan for Scratching Environments

For the three-step model of photoemission, Spicer and Herrera-Gomez [4] and Spicer [23] gave the following expression for the probability of each of the steps producing a photoemitted electron:
QY = (αPE/α) × (1/(1 + la/L)) × P,
where QY is the quantum yield, the number of electrons emitted per absorbed photon, while the optical absorption coefficient for photon energy can be written as α() = αPE() + αn(), where αPE() is the absorption coefficient for excitation into states above the vacuum level, and αn() is the coefficient for transitions below the vacuum level. L() is the escape depth for the electron excited by photon energy , la is the optical absorption length 1/α(), and P() is the probability of electrons reaching the surface with sufficient energy to escape. Spicer and Herrera-Gomez [4] described that la/L is the dominant parameter determining the photoemission quantum yield and that the quantum yield is inversely proportional to the value of (1 + la/L). In addition, they pointed out that high quantum efficiency refers to electrons being able to escape without suffering electron–electron scattering. In Figure 7 in Reference [4], it is seen that the average escape depth increases with increasing for metals and semiconductors.
Regarding the dependence of the L on photon energy, Figure 14 shows the plots of the PE quantum yields, Y, for all environments against the photon energies, , at the wavelengths, λ, of 200, 210, 220, and 230 nm chosen during the 300–200-nm wavelength scan at 25, 200, and 339 °C. It is noted that the Y values used here are the mean values of the two wavelength scans. The Y values increased with increasing photon energy and changed more rapidly at increased temperatures. This finding seems to prove that the quantum yield can be related to the escape length of electrons.
The activation energies for the Y values at each wavelength, ΔE, were obtained from the Arrhenius plot of the Y values against the reciprocal temperature in Kelvin, 1/T. Figure 15 shows the values of ΔEY, where ΔEY represents ΔEY200, ΔEY210, ΔEY220, and ΔEY230 for all the environments. The ΔEY values are the mean values of the scan data of two wavelengths. For each environment, as the photon energy was increased, the values of ΔE almost linearly increased and, finally, ΔEY200 became close to ΔEαA of the environment. Therefore, it seems that ΔEαA may be the energy needed to increase the escape depth for the hot electrons. The change in ΔE values with the environments was nearly similar to that of ΔEαA. In addition, it was found that the difference between the ΔE values at 200 nm and 230 nm, (ΔEY200 − ΔEY230), considerably depended on the environments. The values of (ΔEY200 − ΔEY230) increased in the following order: 0.025 eV (cyclohexane) < 0.032 eV (benzene) = 0.032 eV (water) < 0.038 (ethanol) ≈ 0.039eV (acetone) = 0.039 eV (methanol) < 0.043 eV (air), but the mechanism remains unclear. Furthermore, regarding the dependence of the activation energy on the incident light wavelength, we previously reported that the activation energy, ΔEa, at 200, 210, 220, and 230 nm for rolled iron surfaces cleaned only in acetone decreased as follows: 0.112 eV (200 nm), 0.100 eV (210 nm), 0.073 eV (220 nm), and 0.040 eV (230 nm) [13]. In this case, the value of (ΔEY200 − ΔEY230) was 0.072 eV, which was remarkably greater than that in the present scratched iron surfaces.

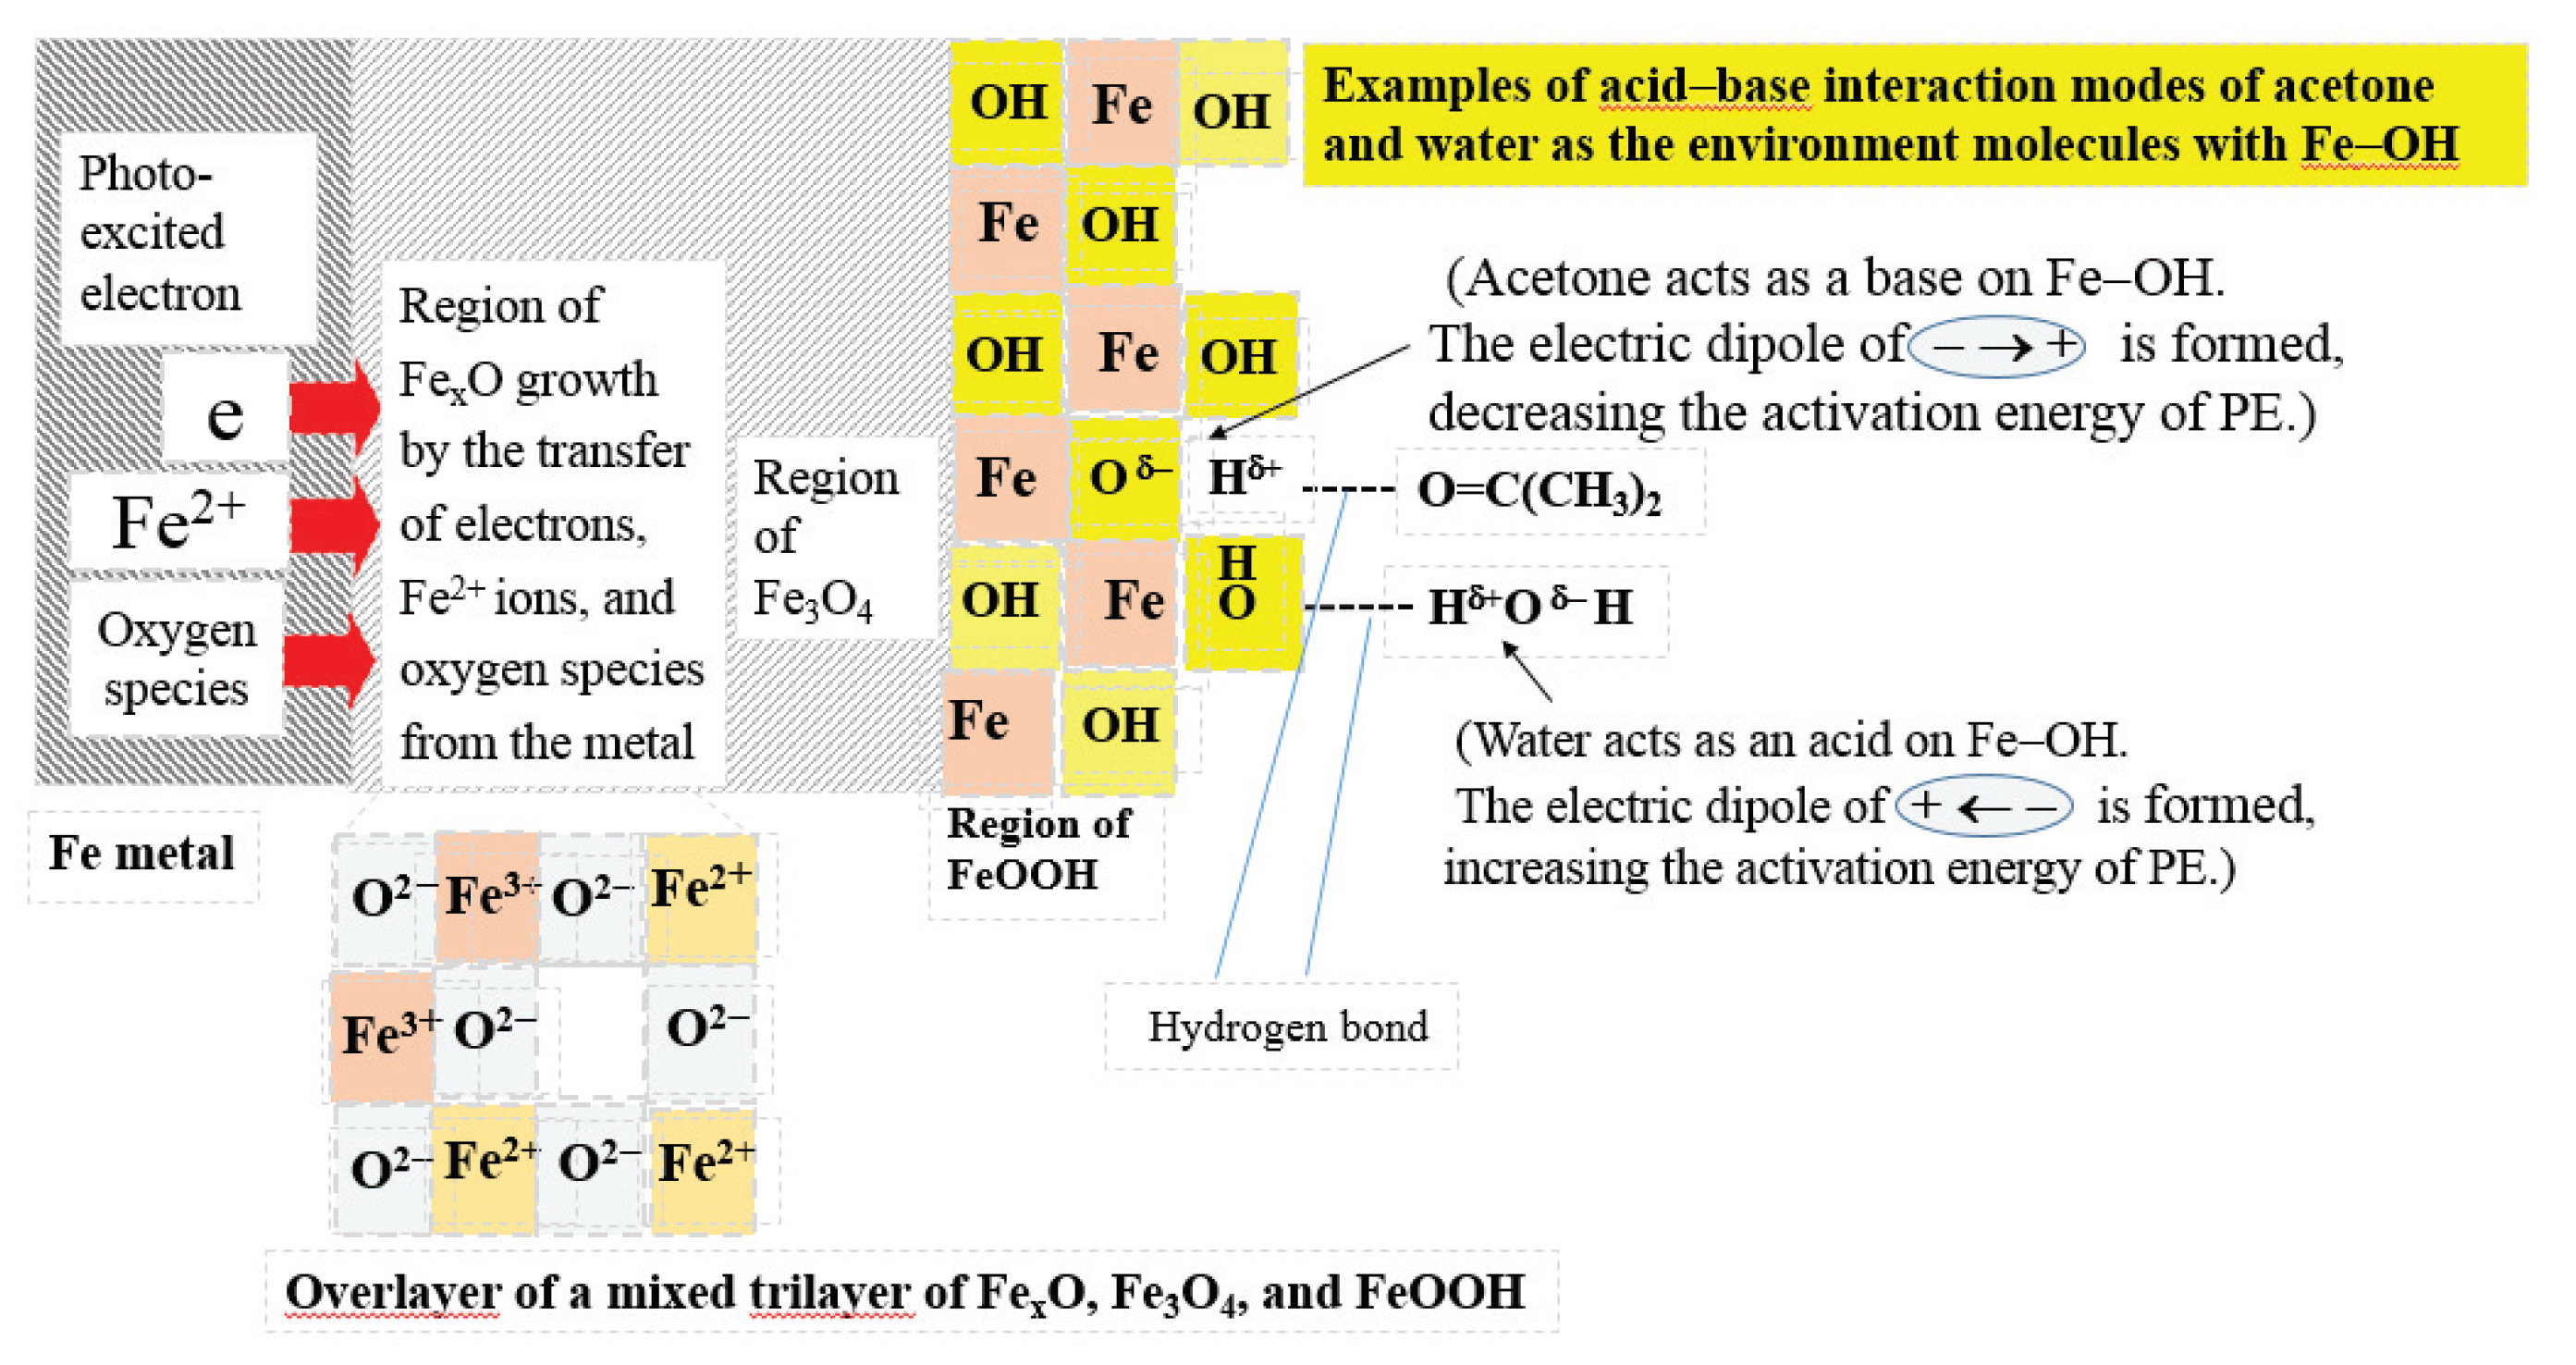
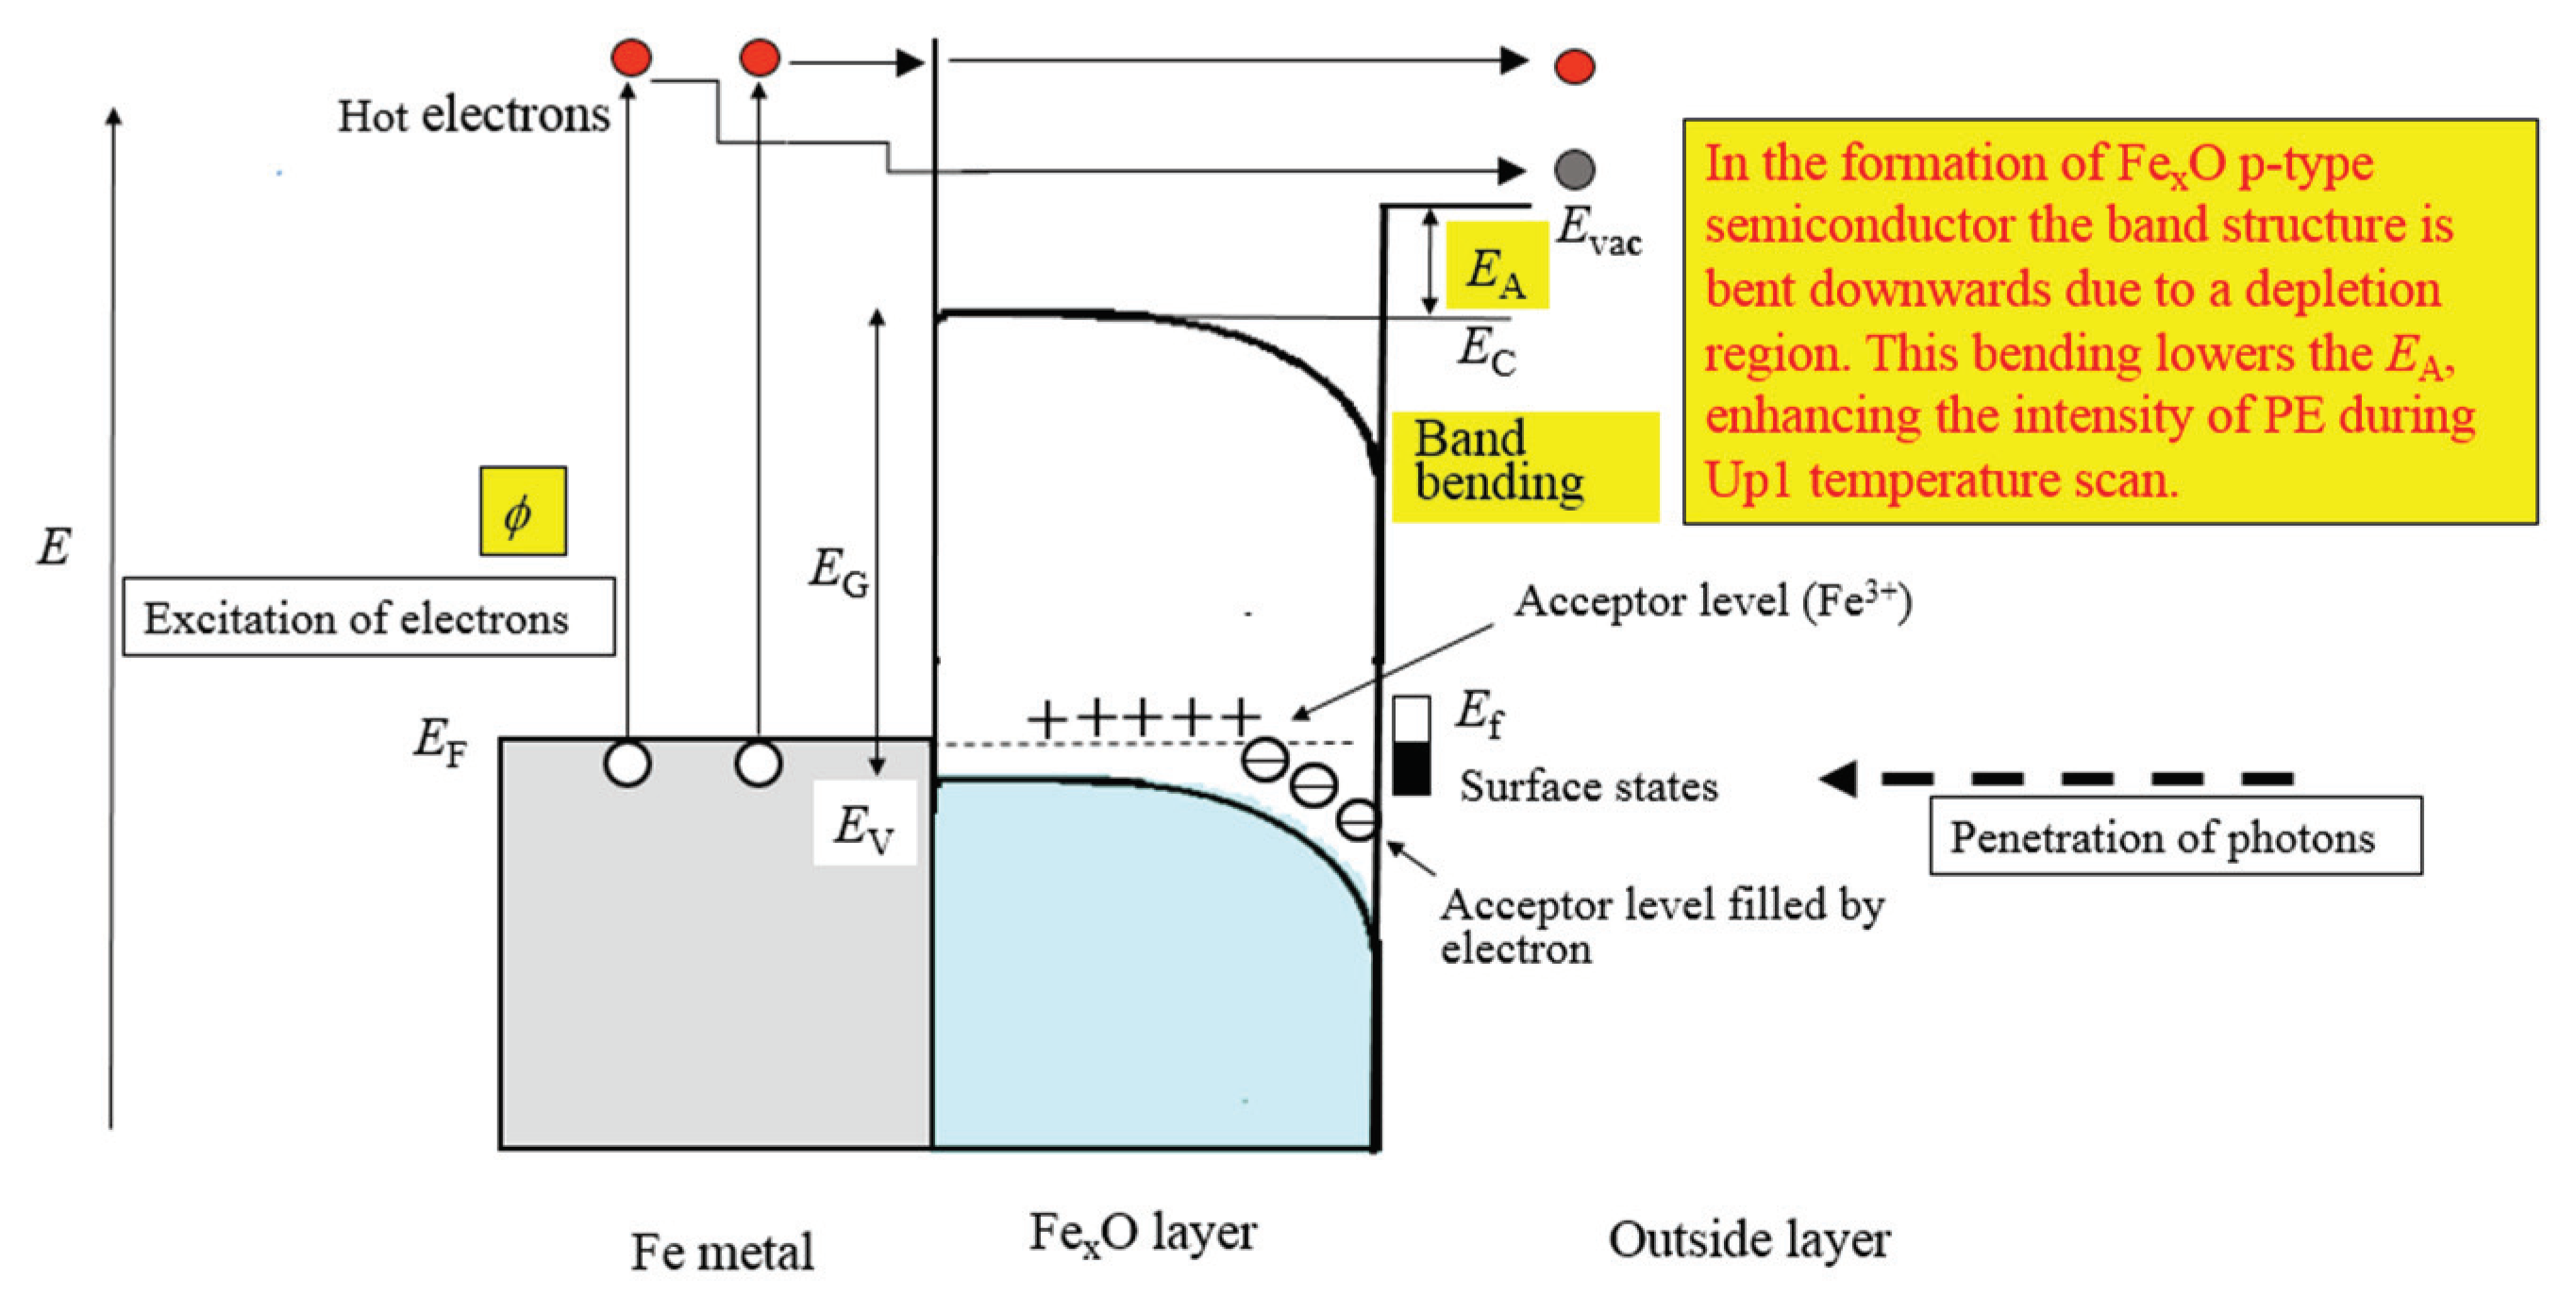
3.6. Effects of FexO Layer and Hydroxyl Groups at the Surface Overlayer on PE

We hypothesized why the baseline of the PE intensity gradually increases with increasing temperature, as observed in the glow curve during the Up1 temperature scan for air in Figure 1 in Reference [6]. We examined the chemical structure of the overlayer. From the spectra of Fe 2p (Figure 1) and Fe 3p (Figure 2), it is seen to be the film structure of the iron oxide layer that is mainly responsible for TAPE because of the weakness of the metal signal. Firstly, we pay attention to the XPS intensity of the O2 component because of its strong contribution to the PE. Figure 16a,b shows the plots of the XPS intensity ratio of O2/Fe 2p and of O2/Fe 3p at 25, 200, and 339 °C in different environments, respectively. In Figure 16a,b, it is seen that, generally, the XPS intensity ratios of O2/Fe 2p and of O2/Fe 3p are nearly constant at each temperature in the different environments, but they increase greatly with increasing temperatures. For example, we consider the XPS intensity ratio of O2/Fe 3p for acetone, which showed values of 2.206 at 25 °C, 2.902 at 200 °C, and 3.386 at 339 °C, as shown in Figure 16b. Using these XPS intensity ratios and the sensitivity factor of 2.9 (O 1s) and 1.54 (Fe 3p) in the XPS measurement, these XPS intensity ratios were converted to the atomic ratio of O/Fe, i.e., 2.206 × 1.54/2.9 = 1.171 (25 °C), 2.902 × 1.54/2.9 = 1.541 (200 °C), and 3.386 × 1.54/2.9 = 1.798 (339 °C). For the atomic ratio of Fe/O, the values of 0.85 (25 °C), 0.65 (200 °C), and 0.56 (339 °C) were obtained. In the same way, using the XPS intensity ratio of O2/Fe 2p in Figure 16a and the sensitivity factor of 2.9 (O 1s) and 10.5 (Fe 2p), the atomic ratios of Fe/O for acetone were obtained as 0.80 (25 °C), 0.60 (200 °C), and 0.52 (339 °C). Thus, the Fe/O atomic ratios obtained from the XPS data given in Figure 16a,b had almost the same values. Interestingly, the atomic ratio of Fe/O gradually decreased with increasing temperature. The atomic ratios of Fe/O at 200 and 339 °C were found to become much smaller than that (Fe/O = 0.75) of the stoichiometric oxide of Fe3O4, which is assigned as the main oxide component. This means that the scratched surface was oxygen-rich. As shown in Figure 11a,b, for all environments, the PE characteristics such as αA and NT at 200 and 339 °C tended to increase in the arrangement order of the environments, and the XPS O 1s intensity also approximately increased in the same order of the environments (Figure 4c). Therefore, since the electrical conductivity of a p-type semiconductor of non-stoichiometric oxides is known to increase upon oxidation, the scratched surface can be said to have the property of a p-type semiconductor. It is well known that, although wüstite (ferrous oxide) has an ideal (stoichiometric) formula, FeO, its actual stoichiometry is closer to FexO with 0.833 < x < 0.957, where, for every three “missing” Fe2+ ions, the crystal contains two Fe3+ ions to balance the charge [12]. Therefore, we propose that there may exist a non-stoichiometric iron oxide, FexO, which strongly acts on the TAPE with increasing temperature as a p-type semiconductor, producing the increase in the baseline PE intensity.
Figure 17 shows the actions of the two types of chemical species present at the overlayer on the intensity of PE in the Up1 temperature scan: (1) the acid–base interaction of the environment molecule on the surface hydroxyl group (Fe−OH), and (2) the growth of FexO p-type semiconductor layer as a result of the transfer of electrons, iron ions, and oxygen species from the metal to the oxide film. In the case of the former action, the acid–base interaction causes the formation of an electric dipole at the outside surface, producing an enhancement of PE for acetone, while it produces a reduction in PE for water, as shown in Figure 17. Furthermore, it is considered that light irradiation for a longer period in the PE measurement increases the electron density of the oxygen atom of the hydroxyl group, which more strongly enhances the basicity of the hydroxyl group [5,6]. In the case of the latter action, the amount of non-stoichiometric FexO with a p-type semiconductor characteristic increases with increasing temperature in the neighborhood of the interface between the base metal and the surface oxide layer. Here, x is a small number with a value less than unity.
In Figure 18, a model of the energy diagram for the FexO layer is illustrated according to an important concept of the band bending downward and the effective electron affinity used in the band model of the photocathode of the p-type semiconductor [4,24]. The Fe3+ ions constitute the positive holes in the oxide, which can move around in the oxide as a result of the transfer of electrons from Fe2+ ions to Fe3+ ions. Fe3+ ions are located at the acceptor level. Two Fe3+ ions are formed for every three missing Fe2+ ions to balance the charge. The band structure is bent downward due to the formation of a depletion region that has a negative charge, resulting in the lowering of the effective electron affinity, which enhances the transfer of electrons.

4. Conclusions

Electron emission and surface charge transfer at real metal surfaces are considered to play a significant role in various problems in tribology, corrosion, adhesion, and so on. However, little is known about the behavior of electrons in the superficial overlayers. We quantitatively revealed the action of the overlayers on photoelectron emission (PE) from scratched iron surfaces. This layer is related to the process of the transport of electrons photo-excited from the metal inside to the surface, which corresponds to the second of Spicer’s three steps model for PE. We conducted the PE measurement as a function of temperature and light wavelength (photon energy) for samples scratched in seven different environments, using a modified Geiger counter with a heating system. As the observed PE output, we obtained the PE characteristics: Arrhenius activation energies for the PE quantum yields (the number of emitted electrons per incident photon of light) were obtained from the PE during temperature scan, and the electron photoemission probability was obtained from the PE during light wavelength scan, while the shape of the glow curves, representing the temperature dependence of PE intensity, strongly depended on the environments and indicated the presence of a baseline increasing with temperature. On the other hand, X-ray photoelectron spectroscopy (XPS) measurements of Fe 2p, Fe 3p, O 1s, and C 1s core spectra for samples scratched in the environments after PE measurement at 25 °C and after cooling to 25 °C following PE measurement at 200 and 339 °C were performed. The total number of electrons counted in the XPS measurements of Fe 2p, Fe 3p, and O 1s, called XPS intensity, greatly depended on the environments and the temperatures. As XPS characteristics of the overlayers, the following results were obtained: the XPS intensities for scratched surfaces and their temperature dependence, Arrhenius activation energies of XPS intensities of O 1s and the O2 component of O 1s, and the temperature dependence of the XPS intensity ratio of O2/Fe 3p and O2/Fe 2p, leading to the anticipation of FexO with a p-type semiconductor characteristic. In addition, the strength of acceptor number of the molecules of the liquid environments relating to acid−base interaction was used. The observed PE output was closely associated with the XPS characteristics of the overlayers.
The connection of the thermal analysis of PE data for metal surfaces with that of XPS data clarified that the electron transfer at the surfaces in the PE can be strongly governed by the flow of hot electrons across the surface layers, including oxygen species. The contribution of the first process in Spicer’s three-step PE model, optical excitation, to the present PE was little. The findings related to the electron emission observed in the present study can be applied to better understand the charge transfer at various real surfaces. In future work, we will extend this study to other metals and semiconductor materials.

Author Contributions

Y.M. conceived the study and designed the experiments, and wrote the paper; T.S. contributed to the analysis of the XPS and PE data; K.N. contributed to the setup of the PE measurement apparatus and a discussion on the research. All authors have read and agreed to the published version of the manuscript.

Acknowledgments

The authors would like to thank the Ministry of Education, Culture, Sports, Science, and Technology for supporting this work through a grant in aid. They also gratefully acknowledge Keika Tsuruya, a former student of Y.M., for performing the TAPE and XPS measurements.

Conflicts of Interest

The authors declare no conflicts of interest.

References

  1. Ciniero, A.; Le Rouzic, J.; Baikie, I.; Reddyhoff, T. The origins of triboemission—Correlating wear damage with electron emission. Wear 2017, 374–375, 113–119. [Google Scholar] [CrossRef]
  2. Kraljic, M.; Mandic, Z.; Duic, L. Inhibition of steel corrosion by polyaniline coatings. Corros. Sci. 2003, 45, 181–198. [Google Scholar] [CrossRef]
  3. Spicer, W.E. Surface analysis by means of photoemission and other photon-stimulated processes. In Chemistry and Physics of Solid Surfaces; Vanselow, R., Tong, S.Y., Eds.; CRC Press: Boca Raton, FL, USA, 1977; pp. 235–254. [Google Scholar]
  4. Spicer, W.E.; Herrera-Gomez, A. Modern theory and applications of photocathodes. In Proceedings of the SPIE’s 1993 International Symposium on Optics, Imaging, and Instrumentation, San Diego, CA, USA, 11–16 July 1993; Volume 2022, pp. 18–35. [Google Scholar]
  5. Momose, Y.; Suzuki, D.; Tsuruya, K.; Sakurai, T.; Nakayama, K. Transfer of electrons on scratched iron surfaces: Photoelectron emission and X-ray photoelectron spectroscopy studies. Friction 2018, 6, 98–115. [Google Scholar] [CrossRef] [Green Version]
  6. Momose, Y.; Tsuruya, K.; Sakurai, T.; Nakayama, K. Photoelectron emission and XPS studies of real iron surfaces subjected to scratching in air, water, and organic liquids. Sur. Interface Anal. 2016, 48, 202–211. [Google Scholar] [CrossRef]
  7. Momose, Y.; Sakurai, T.; Nakayama, K. Photoelectron emission characteristics of iron surfaces scratched in different environments: Dependence on photon energy irradiation methods. Sur. Interface Anal. 2018, 50, 1319–1335. [Google Scholar] [CrossRef]
  8. Fowler, R.H. The analysis of photoelectric sensitivity curves for clean metals at various temperatures. Phys. Rev. 1931, 38, 45–56. [Google Scholar] [CrossRef]
  9. DuBridge, L.A. A further experimental test of Fowler’s theory of photoelectric emission. Phys. Rev. 1932, 39, 108–118. [Google Scholar] [CrossRef]
  10. DuBridge, L.A. New Theories of the Photoelectric Effect; Hermann and Cie: Paris, France, 1935. [Google Scholar]
  11. Ames, I.; Christensen, R.L. Anomalous photoelectric emission from nickel. IBM J. Res. Dev. 1963, 7, 34–39. [Google Scholar] [CrossRef]
  12. Conder, K. Electronic and Ionic Conductivity in Metal Oxides; Paul Scherrer Institute: Villigen, Switzerland, 2015; pp. 1–44. [Google Scholar]
  13. Momose, Y.; Suzuki, D.; Sakurai, T.; Nakayama, K. Influence of temperature and photon energy on quantum yield of photoemission from real iron surfaces. Appl. Phys. A 2014, 117, 1525–1534. [Google Scholar] [CrossRef]
  14. Grosvenor, A.P.; Kobe, B.A.; McIntyre, N.S. Studies of the oxidation of iron by water vapour using X-ray photoelectron spectroscopy and QUASES. Surf. Sci. 2004, 572, 217–227. [Google Scholar] [CrossRef]
  15. Wagner, C.D.; Rigs, W.M.; Davis, L.E.; Moulder, J.F.; Muilenberg, G.E. Handbook of X-ray Photoelectron Spectroscopy; Perkin = Elmer: Eden Prairie, MN, USA, 1979. [Google Scholar]
  16. Graat, P.C.J.; Somers, M.A.J. Simultaneous determination of composition and thickness of thin iron-oxide films from XPS Fe2p spectra. Appl. Surf. Sci. 1996, 100–101, 36–40. [Google Scholar] [CrossRef]
  17. McIntyre, N.S.; Zetaruk, D.G. X-ray photoelectron spectroscopic studies of iron oxides. Anal. Chem. 1977, 49, 1521–1529. [Google Scholar] [CrossRef]
  18. Muhler, M.; Schlögl, R.; Ertl, G. The nature of the iron oxide-based catalyst for dehydrogenation of ethylbenzene to styrene. J. Catal. 1992, 138, 413–444. [Google Scholar] [CrossRef]
  19. Yamashita, T.; Hayes, P. Analysis of XPS spectra of Fe2+ and Fe3+ ions in oxide materials. Appl. Surf. Sci. 2008, 254, 2441–2449. [Google Scholar] [CrossRef]
  20. Ogawa, Y.; Ando, D.; Sutou, Y.; Koike, J. Effects of O2 and N2 flow rate on the electrical properties of Fe-O-N thin films. Mater. Trans. 2014, 55, 1606–1610. [Google Scholar] [CrossRef] [Green Version]
  21. Lin, T.-C.; Seshadri, G.; Kelber, J.A. A consistent method for quantitative XPS peak analysis of thin oxide films on clean polycrystalline iron surfaces. Appl. Surf. Sci. 1997, 119, 83–92. [Google Scholar] [CrossRef]
  22. Merchant, P.; Collins, R.; Kershaw, R.; Dwight, K.; Wold, A. The electrical, optical and photoconducting properties of Fe2−xCrxO3 (0 ≤ x ≤ 0.47). J. Solid State Chem. 1979, 27, 307–315. [Google Scholar] [CrossRef]
  23. Spicer, W.E. Negative affinity 3-5 photocathodes: Their physics and technology. Appl. Phys. 1977, 12, 115–130. [Google Scholar] [CrossRef]
  24. Zhuravlev, A.G.; Alperovich, V.L. Relaxational kinetics of photoemission and photon-enhanced thermionic emission from p-GaAs surface with nonequilibrium Cs overlayers. Appl. Surf. Sci. 2018, 461, 10–16. [Google Scholar] [CrossRef]
Figure 1. Temperature dependence of Fe 2p spectra of real iron surfaces scratched in different environments: (1) air, (2) benzene, (3) cyclohexane, (4) water, (5) methanol, (6) ethanol, and (7) acetone.
Applsci 10 02111 g001
Figure 2. Temperature dependence of Fe 3p spectra of real iron surfaces scratched in different environments: air, (2) benzene, (3) cyclohexane, (4) water, (5) methanol, (6) ethanol, and (7) acetone.
Applsci 10 02111 g002aApplsci 10 02111 g002b
Figure 3. Temperature dependence of O 1s spectra of real iron surfaces scratched in different environments: (1) air, (2) benzene, (3) cyclohexane, (4) water, (5) methanol, (6) ethanol, and (7) acetone.
Applsci 10 02111 g003
Figure 4. Dependence of the total number of electrons counted, termed X-ray photoelectron spectroscopy (XPS) intensity, in the Fe 2p (a), Fe 3p (b), O 1s (c), and C 1s (d) spectra in the XPS measurements after the photoelectron emission (PE) measurement at 25, 200, and 339 °C for real iron surfaces on the scratching environments in the following order: (1) air, (2) benzene, (3) cyclohexane, (4) water, (5) methanol, (6) ethanol, and (7) acetone.
Applsci 10 02111 g004aApplsci 10 02111 g004b
Figure 5. Temperature dependence of XPS intensity of three components of O2, OH, and H2O of the O 1s spectrum of scratched real iron surfaces on different environments: (1) air, (2) benzene, (3) cyclohexane, (4) water, (5) methanol, (6) ethanol, and (7) acetone. A typical example of the curve resolution of the O 1s spectrum for acetone is also shown.
Applsci 10 02111 g005
Figure 6. Dependence of the number of electrons counted, XPS intensity of the O2 component in the O 1s spectra after the PE measurement at 25, 200, and 339 °C for real iron surfaces on the scratching environments: (1) air, (2) benzene, (3) cyclohexane, (4) water, (5) methanol, (6) ethanol, and (7) acetone.
Applsci 10 02111 g006
Figure 7. Plots of the total count of PE electrons emitted during the Up1 and Up2 temperature scans, NUp1 and NUp2, respectively, against the scratching environment.
Applsci 10 02111 g007
Figure 8. Plots of the activation energies of the PE quantum yields during the Up1 and Up2 temperature scans, ΔEaUp1 (a) and ΔEaUp2 (b), against the scratching environments.
Applsci 10 02111 g008
Figure 9. Plots of the electron emission intensity at 339 °C during Up1 scan (a) and Up2 scan (b) against the XPS O 1s intensity at 339 °C for all scratching environments.
Applsci 10 02111 g009
Figure 10. Plots of the total count of PE electrons emitted during the Up1 and Up2 temperature scans against the activation energy for both scans, (a) NUp1 vs. ΔEaUp1 and (b) NUp2 vs. ΔEaUp2 for all scratching environments.
Applsci 10 02111 g010
Figure 11. Dependence of the average electron photoemission probability, αA (a), and the total number of emitted electrons, NT (b), obtained from the PE measurement during the wavelength scan at 25, 200, and 339°C for real iron surfaces on the scratching environments: (1) air, (2) benzene, (3) cyclohexane, (4) water, (5) methanol, (6) ethanol, and (7) acetone.
Applsci 10 02111 g011
Figure 12. Plots of the activation energies, ΔEαA (a) and ΔENT (b), obtained from the wavelength scan against the scratching environments.
Applsci 10 02111 g012
Figure 13. Dependence of the average electron photoemission probability, αA, on (a) XPS Fe 2p intensity, (b) XPS Fe 3p intensity, and (c) XPS O 1s intensity at 25, 200, and 339 °C for all environments.
Applsci 10 02111 g013
Figure 14. PE quantum yield, Y, as a function of the photon energy at wavelengths of 200 nm (photon energy: 6.199 eV), 210 nm (5.904 eV), 220 nm (5.636 eV), and 230 nm (5.391 eV) during the 300- to 200-nm wavelength scan at 25, 200, and 339 °C for different environments: (1) air, (2) benzene, (3) cyclohexane, (4) water, (5) methanol, (6) ethanol, and (7) acetone. The Y values are the mean values of the two wavelength scan data.
Applsci 10 02111 g014
Figure 15. Activation energies of the PE quantum yield (emitted electrons/photon), ΔEY, obtained at wavelengths of 200, 210, 220, and 230 nm during the wavelength scan at 25, 200, and 339 °C, together with those of the electron photoemission probability (ΔEαA) for all environments. The values of ΔEY come from the mean values of the scan data at two wavelengths, and the values of ΔEαA are from Table 2 in Reference [7].
Applsci 10 02111 g015
Figure 16. Dependence of (a) the ratio of XPS O2 intensity to XPS Fe 2p intensity and (b) the ratio of XPS O2 intensity to XPS Fe 3p intensity obtained from the O 1s, Fe 2p, and Fe 3p XPS spectra for 25, 200, and 339 °C for real iron surfaces on the scratching environments.
Applsci 10 02111 g016
Figure 17. Growth of FexO p-type semiconductor and the acid–base interaction of the scratching environment molecule at the scratched surface as a result of the transfer of electrons, iron ions, and oxygen species from the metal during Up1 temperature scan. The electron density of the oxygen atom of Fe−OH is considered to become greater during the temperature scan.
Applsci 10 02111 g017
Figure 18. Band model of the energy diagram proposed for the FexO p-type semiconductor only, although the effect of the adjacent oxide layer of Fe3O4 is not clear. The symbols EF, Ef, Evac, EV, EC, and EA are the Fermi levels of the metal and FexO layer, the vacuum level, the top level of the valence band and the bottom level of the conduction band of the FexO layer, and the effective electron affinity, respectively. Two types of emitted electrons (hot electrons and thermalized electrons) are indicated [7].
Applsci 10 02111 g018
Table 1. The intensities and binding energies of Peaks I, II, and III observed in Fe 2p spectra at three temperatures for iron surfaces scratched in different environments.
EnvironmentsPeak IPeak II*Peak III
Temperature (°C)Peak Intensity (103 counts/s)Binding Energy (eV)Peak Intensity (103 counts/s)Binding Energy (eV)Binding Energy (eV)Peak Intensity (103 counts/s)Binding Energy (eV)
Air250.80720.98.24712.02.40708.0
2000.98720.011.99712.0
3391.82720.824.00712.0
Benzene251.53720.812.01712.05.37708.1
2001.08720.512.99711.9
3392.03720.624.00711.9
Cyclohexane251.18720.512.01711.94.90708.0
2001.85720.520.10712.0
3391.66720.122.19711.8
Water252.01721.018.08712.91.48708.0
2002.06720.618.00712.4
3392.45720.824.02712.5
Methanol252.49721.618.09712.37.46708.6
2002.77720.328.50712.3
3393.34720.525.90713.1
Ethanol252.80721.418.01712.110.77708.6
2001.67720.926.02712.4
3392.31721.329.00712.5
Acetone251.92720.617.85712.16.88708.1
2001.67720.822.18712.1
3392.62720.827.92712.4
Average720.7712.3708.1
* Peak II at 25 °C is assigned to FeOOH, and Peak II at 200 and 339 °C is assigned to Fe3O4.
Table 2. The intensities and binding energies of Peaks 1 and 2 observed in Fe 3p spectra at three temperatures for iron surfaces scratched in different environments.
EnvironmentsPeak 1Peak 2
Temperature (°C)Peak Intensity (103 counts/s)Binding Energy (eV)Peak Intensity (103 counts/s)Binding Energy (eV)
Air252.1855.11.5051.7
2003.0154.9
3394.8054.8
Benzene252.6353.92.4452.2
2003.6054.6
3393.6054.9
Cyclohexane253.0054.52.6352.3
2003.8354.8
3395.0054.8
Water254.0055.21.5552.1
2003.8355.2
3395.0055.1
Methanol254.2554.73.6352.6
2005.8255.0
3395.4055.0
Ethanol254.2554.44.4252.5
2005.4054.9
3396.2155.1
Acetone254.1954.83.3452.5
2004.8054.9
3396.0155.1
Average54.852.5
Table 3. Temperature dependence of binding energies of three components of O2-, OH and OHδ, and H2O in the O 1s spectrum for iron surfaces scratched in different environments.
EnvironmentsTemperatureBinding Energy of the Components (eV)
(°C)O2-OH and OHδH2O
Air25530.6532.3533.4
200530.7532.5533.9
339530.6531.9533.8
Benzene25530.5532.0533.2
200530.6531.8533.0
339530.6531.8533.1
Cyclohexane25530.5532.3534.2
200530.5531.7533.2
339530.7532.0533.4
Water25530.6531.9533.4
200530.7532.2533.6
339530.9531.9533.5
Methanol25530.8532.2533.5
200530.7531.9533.3
339531.1532.2533.6
Ethanol25530.7532.2533.8
200530.8532.2533.3
339530.9532.1533.3
Acetone25530.7532.3533.5
200530.7532.0533.3
339530.7531.6533.3
Average530.7532.1533.5
Table 4. Arrhenius activation energies obtained from the XPS data at 25, 200, and 339 °C for the iron surfaces scratched in the different environments a), b).
Scratching EnvironmentActivation Energies for the Fe 2p, Fe 3p, O 1s, and C 1s Intensities (unit: counts)Activation Energies for Intensity of O2-, OH-, and H2O Components in the O1s Spectra (unit: counts)Activation Energies for the Ratio of O2- Intensity/Fe 2p IntensityActivation Energies for the Ratio of O2- Intensity/Fe 3p IntensityActivation Energies for the Maximum Peak Intensity in the Fe 2p, Fe 3p, and O 1s Spectra (unit: counts·s−1)
ΔEFe 2p (eV)ΔEFe 3p (eV)ΔEO 1s (eV)ΔEC 1s (eV)ΔEO2- (eV)ΔEOH- (eV)ΔEH2O (eV)ΔEO2-/Fe 2p (eV)ΔEO2-/Fe 3p (eV)ΔEFe 2pPEAK (eV)ΔEFe 3pPEAK (eV)ΔEO 1sPEAK (eV)
Air0.0280.0310.0490.0720.0340.0440.0400.0480.0360.053
Benzene0.0110.0120.0260.0270.0290.0160.0160.0170.026
Cyclohexane0.0130.0190.0330.0570.0320.0440.0380.0320.0240.036
Water0.023
Methanol0.0270.0070.0460.0310.0360.0350.031
Ethanol0.0110.0290.0090.0520.0050.0470.0410.0240.0190.029
Acetone0.0260.0210.0320.0320.0150.0210.0210.0210.0160.027
Average0.0170.0180.0320.0120.0480.0250.0160.0350.0310.0310.0220.034
a) The values were obtained from the slope of Arrhenius plots of approximately straight lines with R2 ≥ 0.82.
b) The XPS data were as follows: (1) the XPS intensity of Fe 2p, Fe 3p, O 1s, and C 1s; (2) XPS intensity of the O2-, OH-, and H2O components of the O 1s spectrum; (3) the ratio of O2- intensity/Fe 2p intensity; (4) the ratio of O2- intensity/Fe 3p intensity; (5) the maximum peak intensity in the Fe 2p, Fe 3p, and O 1s spectra.
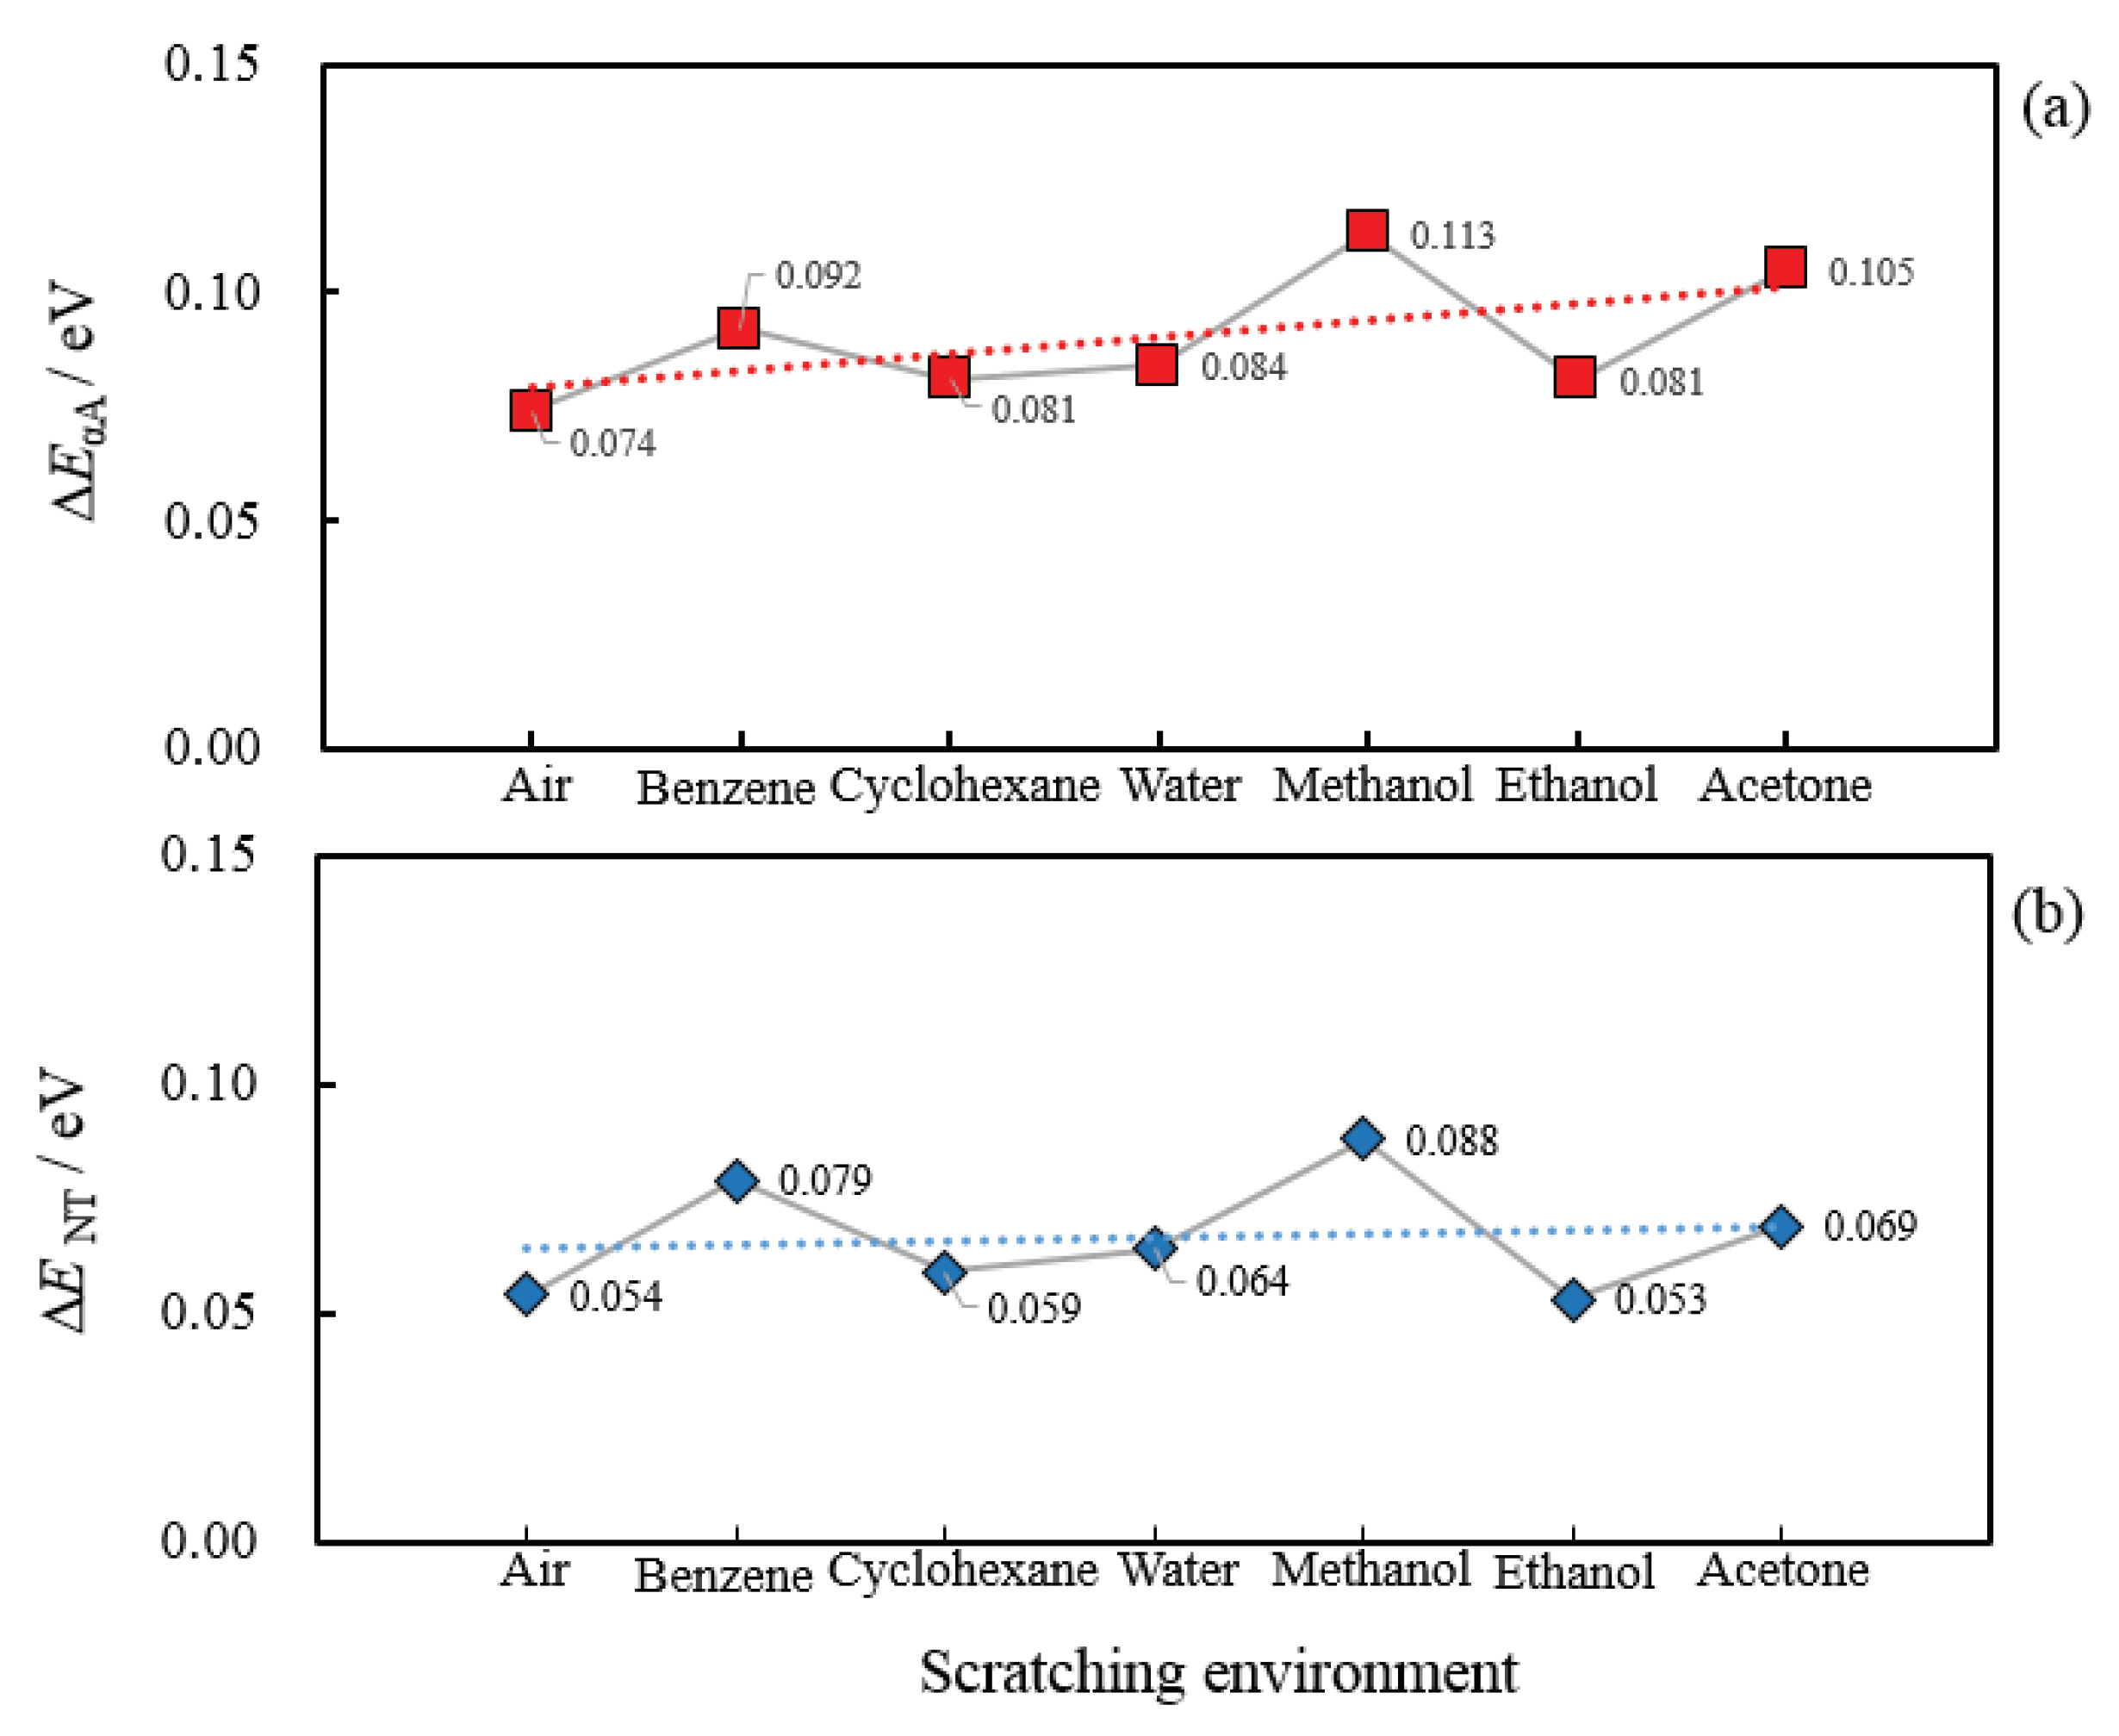
Table 5. Relationship between acceptor number of the environment molecules, Arrhenius activation energies obtained from the XPS data in the XPS measurement, those for the PE quantum yields during the temperature scans, and those for the PE characteristics of the electron photoemission probability, total count of emitted electrons, and photothresholds obtained from the PE measurement during the wavelength scan.
Scratching EnvironmentAcceptor Number a)Activation Energies for the O 1s Intensity in the XPS MeasurementActivation Energies for Intensity of O2- Component in the O 1s Spectra (unit: counts)Activation Energies for the Peak Intensity in the O 1s Spectra (unit: counts·s−1)Activation Energies for the PE Quantum Yields in the Up1 ScanActivation Energies for the PE Quantum Yields in the Up2 ScanActivation Energies for the Electron Photoemission Probability, αA, in the Wavelength ScanActivation Energies for the Total Count of Emitted Electrons, NT, in the Wavelength ScanActivation Energies for Photothresholds, ϕ
ΔEO 1s b) (eV)ΔEO2-b) (eV)ΔEO 1sPEAKb) (eV)ΔEaUp1 c) (eV)ΔEaUp2 c) (eV)ΔEaA d) (eV)ΔENT d) (eV)ΔEϕ e) (eV)
Air0.0490.0720.0530.2120.0280.0740.0540.002
Water54.80.1450.0380.0840.0640.002
Methanol41.30.0270.0460.0310.1590.0200.1130.0880.003
Ethanol37.10.0290.0520.0290.0790.0260.0810.0530.003
Acetone12.50.0260.0320.0270.0350.0210.1050.0690.002
Benzene8.20.0260.0270.0260.0390.0350.0920.0790.002
Cyclohexane0.0330.0570.0360.1110.0330.0810.0590.002
a) Gutmann, V. Ion pairing and outer sphere effect. Chimia 1977, 31, 1-7.
b) These values come from Table 4.
c) These values come from Table 2 in Friction 2018, 6(1): 98–115.
d) These values come from Table 2 in Sur. Interface Anal. 2018, 50, 1319–1336.
e) These ϕ values are in Table 1 in Sur. Interface Anal. 2018, 50, 1319–1336.

