Article

Modify Leave-One-Out Cross Validation by Moving Validation Samples around Random Normal Distributions: Move-One-Away Cross Validation

School of Mechanical Engineering, Dalian University of Technology, Dalian 116024, China
*
Author to whom correspondence should be addressed.
Submission received: 2 March 2020 / Revised: 30 March 2020 / Accepted: 31 March 2020 / Published: 3 April 2020

Abstract

:
The leave-one-out cross validation (LOO-CV), which is a model-independent evaluate method, cannot always select the best of several models when the sample size is small. We modify the LOO-CV method by moving a validation point around random normal distributions—rather than leaving it out—naming it the move-one-away cross validation (MOA-CV), which is a model-dependent method. The key point of this method is to improve the accuracy rate of model selection that is unreliable in LOO-CV without enough samples. Errors from LOO-CV and MOA-CV, i.e., LOO-CVerror and MOA-CVerror, respectively, are employed to select the best one of four typical surrogate models through four standard mathematical functions and one engineering problem. The coefficient of determination (R-square, R2) is used to be a calibration of MOA-CVerror and LOO-CVerror. Results show that: (i) in terms of selecting the best models, MOA-CV and LOO-CV become better as sample size increases; (ii) MOA-CV has a better performance in selecting best models than LOO-CV; (iii) in the engineering problem, both the MOA-CV and LOO-CV can choose the worst models, and in most cases, MOA-CV has a higher probability to select the best model than LOO-CV.

1. Introduction

Cross validation (CV) methods were proposed for model selection and performance evaluation without generating additional testing points and have been widely used in various engineering fields. Stone [1] applied the cross-validatory choice and assessment to prediction of a multinomial indicator. Stone [2] emphasized the pragmatic character of cross-validatory statistical methods and concluded some standards approaches to the assessment of choice of statistical procedures. Cudeck et al. [3] proposed a cross validation procedure and explored its properties. Picard and Cook [4] used the CV method to assess the predictive ability of regression models. Dai [5] developed a competitive ensemble pruning approach based on CV in ensemble system. Arlot et al. [6] applied the CV method and model selection in noise detection and they proposed a new change-point detection procedures for the heteroscedastic signal.
The CV methods are mainly divided into two types [7], i.e., leave-one-out CV (LOO-CV) and bootstrap, in which LOO-CV is the same as k-fold CV (K-CV) and bootstrap is similar to Monte Carlo CV (MCCV) sometimes. Xu and Liang [8] proposed a Monte Carlo CV (MCCV) method which is an asymptotically consistent method to select the dimension of calibration model in chemistry. A few years later, Xu et al. [9] developed the MCCV method, named as a corrected MCCV (CMCCV) which can assess accurately the prediction performance of the selected model. Although k-fold CV method has been widely used, k distinct samples have inherent correlations among them. Roberts et al. [10] indicated that dependence structures in data persist as dependence structures in model residuals, violating the assumption of independence. This is one of the reasons for poor performance of CV. They recommended that block CV (BCV) be used wherever dependence structures exist in a dataset. Airola et al. [11] considered that it is difficult to estimate the reliability of the classification performance of inferred predictive models with small data sets, and then they proposed a Leave-pair-out CV (LPO-CV) to assess the performance in this case. Kale et al. [12] defined a new measure of algorithm stability to analyze the reduction in variance of the gap between the CV estimate and the true error rate. For the K-CV method it is unreasonable to choose the number of subsets by empirical methods. Anguita et al. [13] developed an approach for adjusting the number of subsets in a data-dependent way, and then they can estimate misclassification probability of the chosen model reliably and rigorously. Yu and Feng [14] modified the CV method to select the penalty parameter of Lasso penalized linear regression models in high-dimensional settings. Jung and Hu [15] proposed a new K-CV approach; the key point of this method is to select a candidate ‘optimal’ model from each hold-out fold and average the K candidate ‘optimal’ models to obtain the ultimate model. Finally, it is worth noting that the computational cost of LOO-CV is very high due to multiple times of learner training. For the calculation efficiency of LOO-CV, Liu et al. [16] developed a fast CV based on the Bouligand influence function (BIF) for kernel-based algorithms.
The CV method has also been widely used in surrogate techniques for fitting multiple surrogates and choosing one, based on errors evaluated by LOO-CV method (LOO-CVerror). Song et al. [17] used the LOO-CV to pick the best surrogate and eliminate worse ones when constructs a hybrid surrogate model by combining several typical single surrogate models. Xu et al. [18] proposed an adaptive sampling strategy, named CV-Voronoi method, in which the Voronoi diagram is used to partition the design space and CV is employed to estimate the error behavior of each partition. Viana et al. [19] investigated systematically whether and how errors generated by CV helped to obtain the best predictor among multiple surrogates. They concluded that CV method can filter out inaccurate surrogates well and may identify the best surrogate if sample points which are used to build surrogate models are enough. Later Zhang and Yang [20] concluded how CV is applied to consistently choose the best method and addressed several seemingly common misconceptions on CV, such as better estimation of prediction error by CV does not mean better model selection.
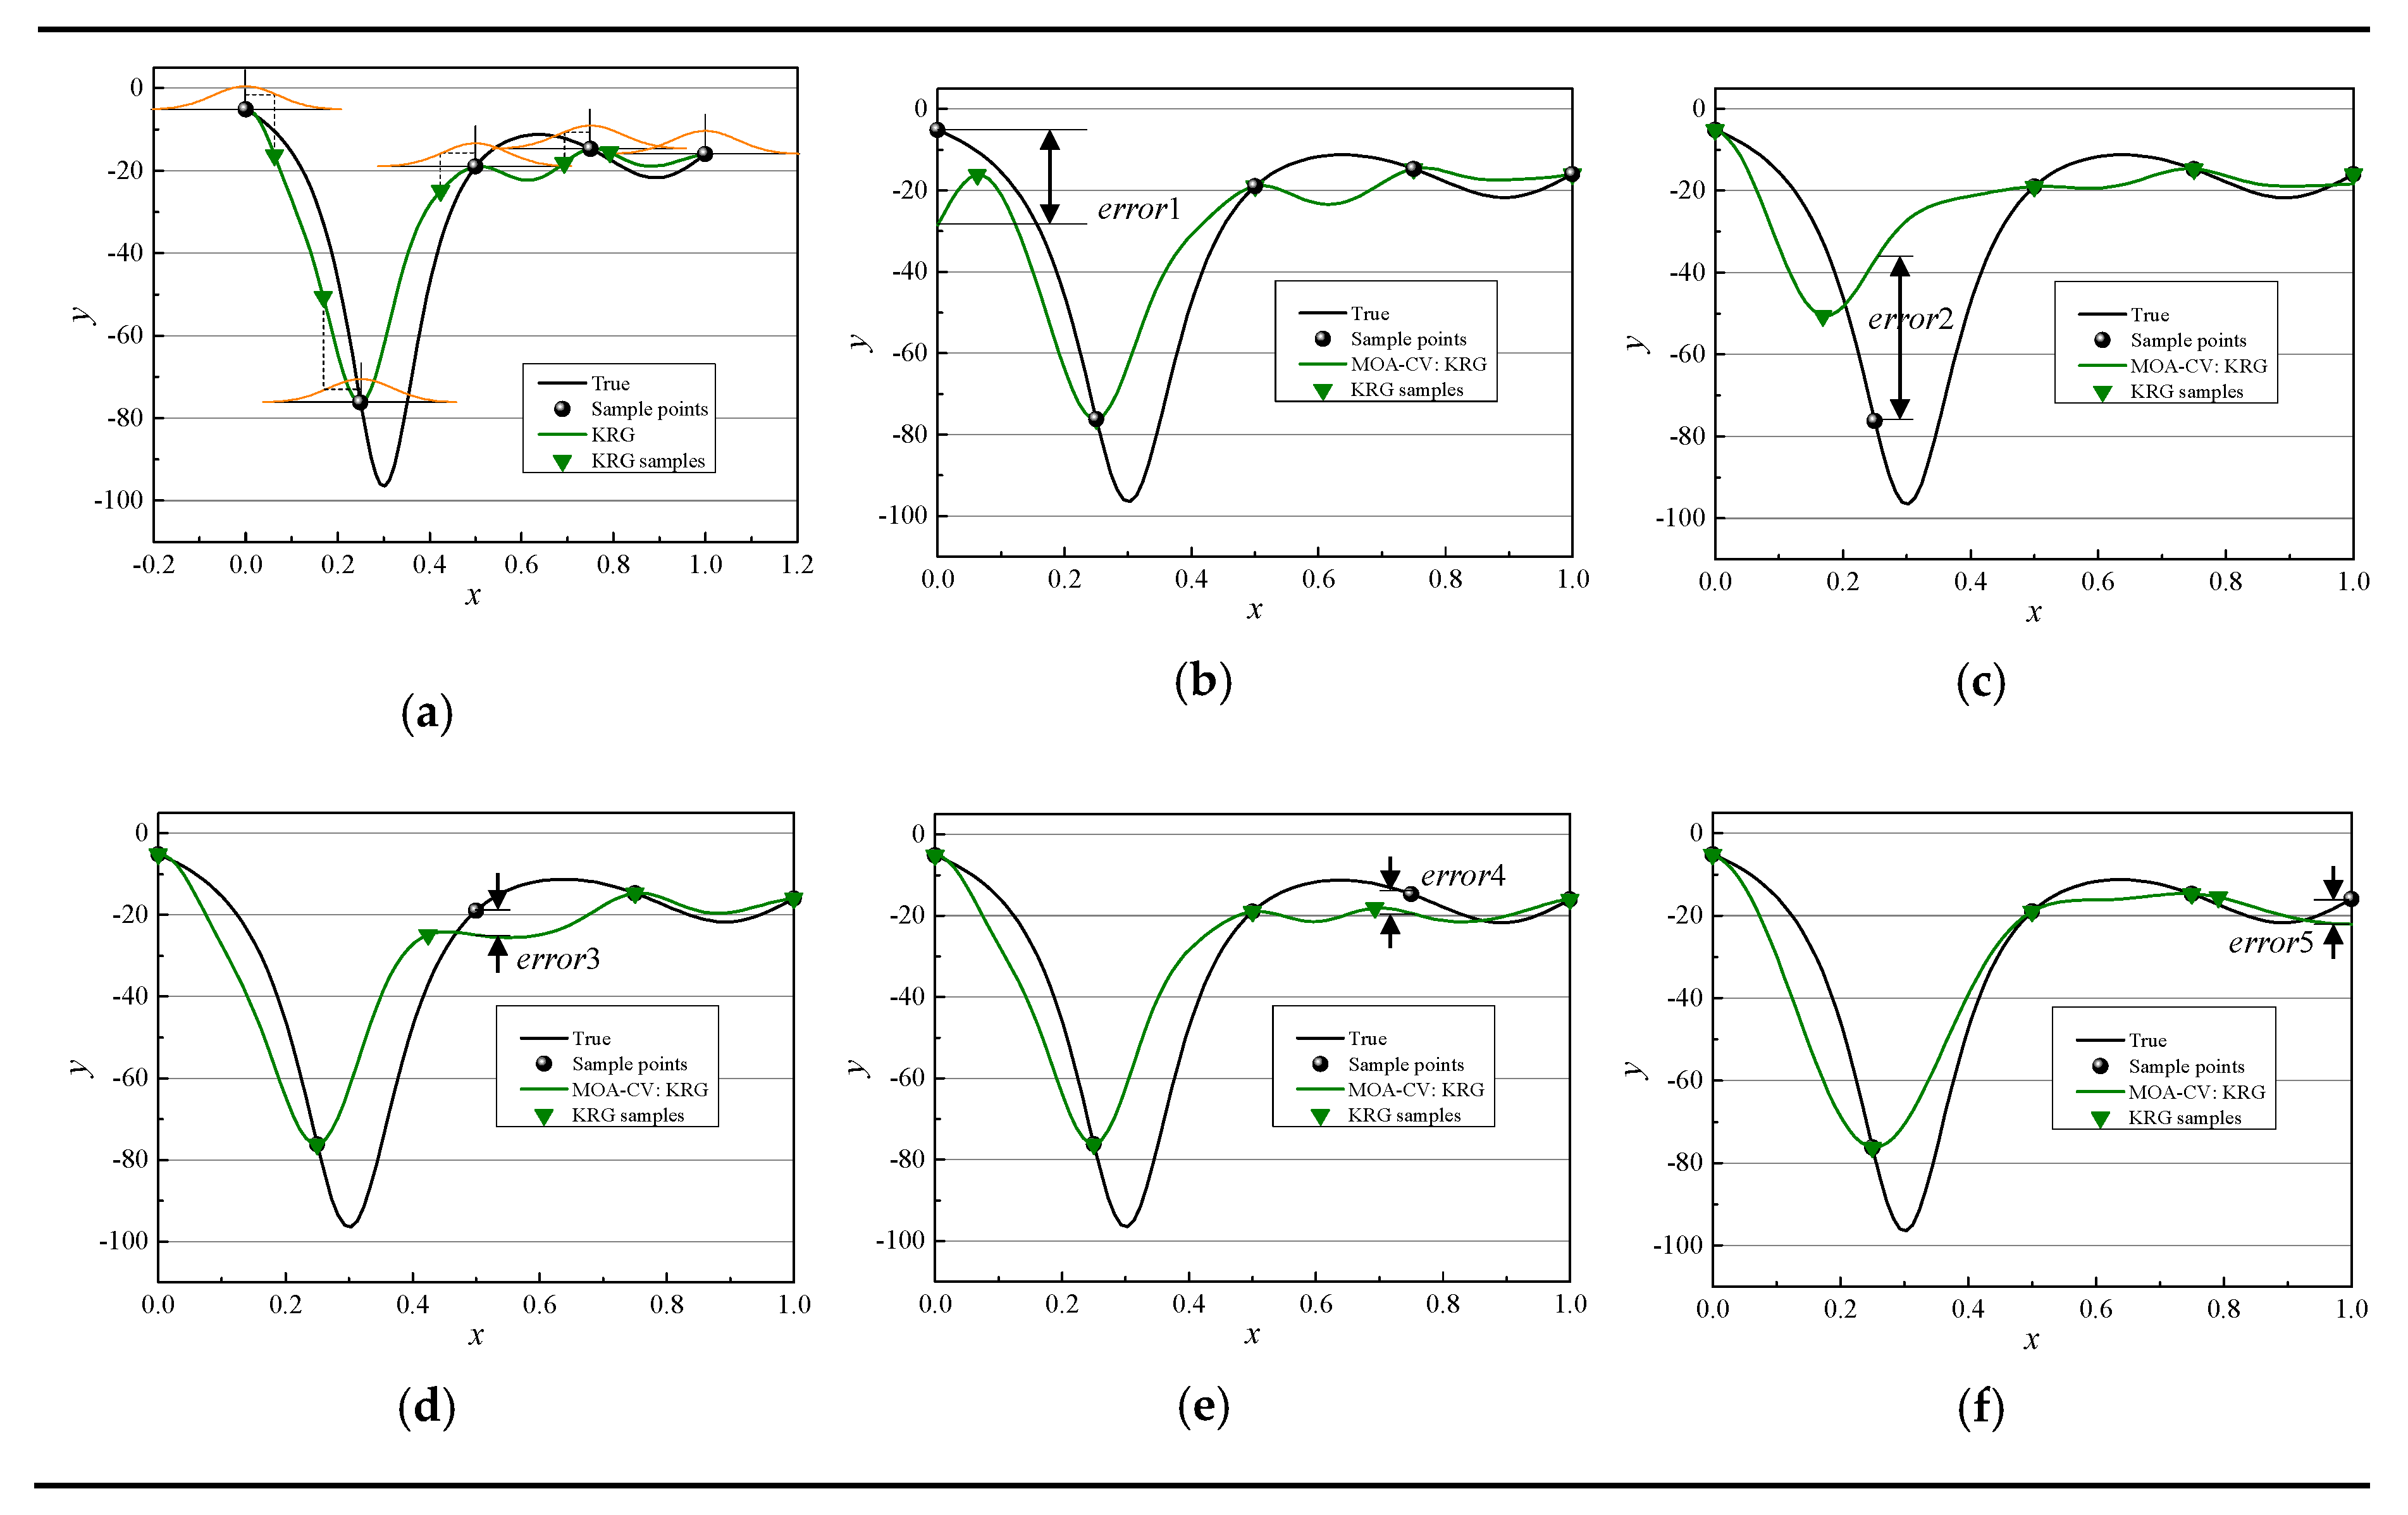
In previous work, we have proposed a hybrid surrogate model, named the extended hybrid surrogate model (E-AHF) [17]. In the process of constructing the E-AHF model, the LOO-CV was used to select the best surrogate model and filter out worse ones. The best surrogate model is considered as the benchmark model for others; worse ones are removed, finally the rest surrogate models are saved to build the final surrogate library. In the E-AHF model, the key step is to construct the library of surrogate models and determine the best surrogate. Therefore, the criterion for modeling rank, i.e., the LOO-CV, is significant to E-AHF. However, there still exists a problem: the LOO-CV method cannot always filter out inaccurate models exactly and select accurately the best one without enough sample points. In the LOO-CV method, the sample points are divided into two parts, i.e., training points and one validation point. We modified the LOO-CV by moving a validation point around random normal distributions rather than leaving it out, named move-one-away cross validation (MOA-CV).
In this paper, four surrogate techniques are used to construct models; errors generated by MOA-CV and LOO-CV methods, i.e., MOA-CVerror and LOO-CVerror, respectively, were used to select the best model from those four surrogate models through four standard mathematical functions and one engineering problems. A higher MOA-CVerror/LOO-CVerror indicates worse performance of surrogate models. However, how can we know exactly which best model is the true best model? Hence, we used the coefficient of determination (R-square, R2) which is reliable to evaluate the accuracy of a model to be a calibration of MOA-CV and LOO-CV. Additionally, extra testing points need to be generated randomly for R2. The accurate rate of selecting the best surrogate model is used to assess and compare the performance of MOA-CV and LOO-CV. To explain the MOA-CV method clearly, a 1-dimensional (1D) function was used to demonstrate the operation process first.
The remaining of this paper is organized as follows. The LOO-CV method is briefly introduced in Section 2, followed by the introduction of the MOA-CV method in Section 3. Results and discussions through four standard mathematical functions and one engineering problem are conducted in Section 4. Conclusions are presented in Section 5.

2. Introduction of LOO-CV

It has been proven that no single surrogate model always performs the best for all engineering practice [21]. In the model building process of E-AHF, we first construct several single surrogate models without any prior information about the true model and then use the LOO-CV method to select the best model and filter out worse ones. For hybrid surrogate model, instead of randomly determining library of surrogate models, a filtering process, e.g., the LOO-CV method, which is a common modeling selection approach, could be performed first to eliminate poorly-performing individual surrogates and select the best one. The basic idea of the LOO-CV method is to take one sample point from the data set containing n sample points as the validation set, and then use the remaining n − 1 sample points as the training set to build a model. Obtain the prediction error at the validation point and repeat this process n times sequentially until all n sample points have been validated once. Finally, n prediction errors are obtained, and the average value of n prediction errors is taken as the LOO-CVerror of the model constructed from n sample points. The LOO-CVerror is shown in Equation (1).
L O O C V e r r o r = 1 n j = 1 n ( y j ( x j ) y ^ j ( j ) ( x j ) ) 2
where LOO-CVerror means the error generated by LOO-CV, n is the number of training points, y j ( x j ) is the true response at x j and y ^ j ( j ) ( x j ) stands for the prediction at x j , which is calculated using the n − 1 training points except the jth training point (validation point). In general, the model with the smallest LOO-CVerror is the most accurate, and vice versa.
However, it may occur some problems when using the LOO-CV method. LOO-CV cannot always filter out inaccurate models well and select accurately the best one without enough samples in some cases. We use four common surrogate models, i.e., polynomial regression surface (PRS) [22], radial basis function with multiquadric kernel function (RBF-MQ) [23], radial basis function with thin plate spline basis function (RBF-TPS) [23] and kriging (KRG) [24], to fit the true function. Details about those four surrogate techniques see References [22,23,24]. In this work, we use MOA-CVerror and LOO-CVerror to select the most accurate of those four surrogate models. R2 is considered as the calibration criterion of MOA-CVerror and LOO-CVerror. That is, we assume that the results of R2 is reliable, then compare the results of MOA-CVerror and LOO-CVerror with R2 to get the accurate rate of MOA-CV and LOO-CV. A higher R2 means an accurate model. On the contrary, a lower MOA-CVerror or LOO-CVerror indicates a better model.
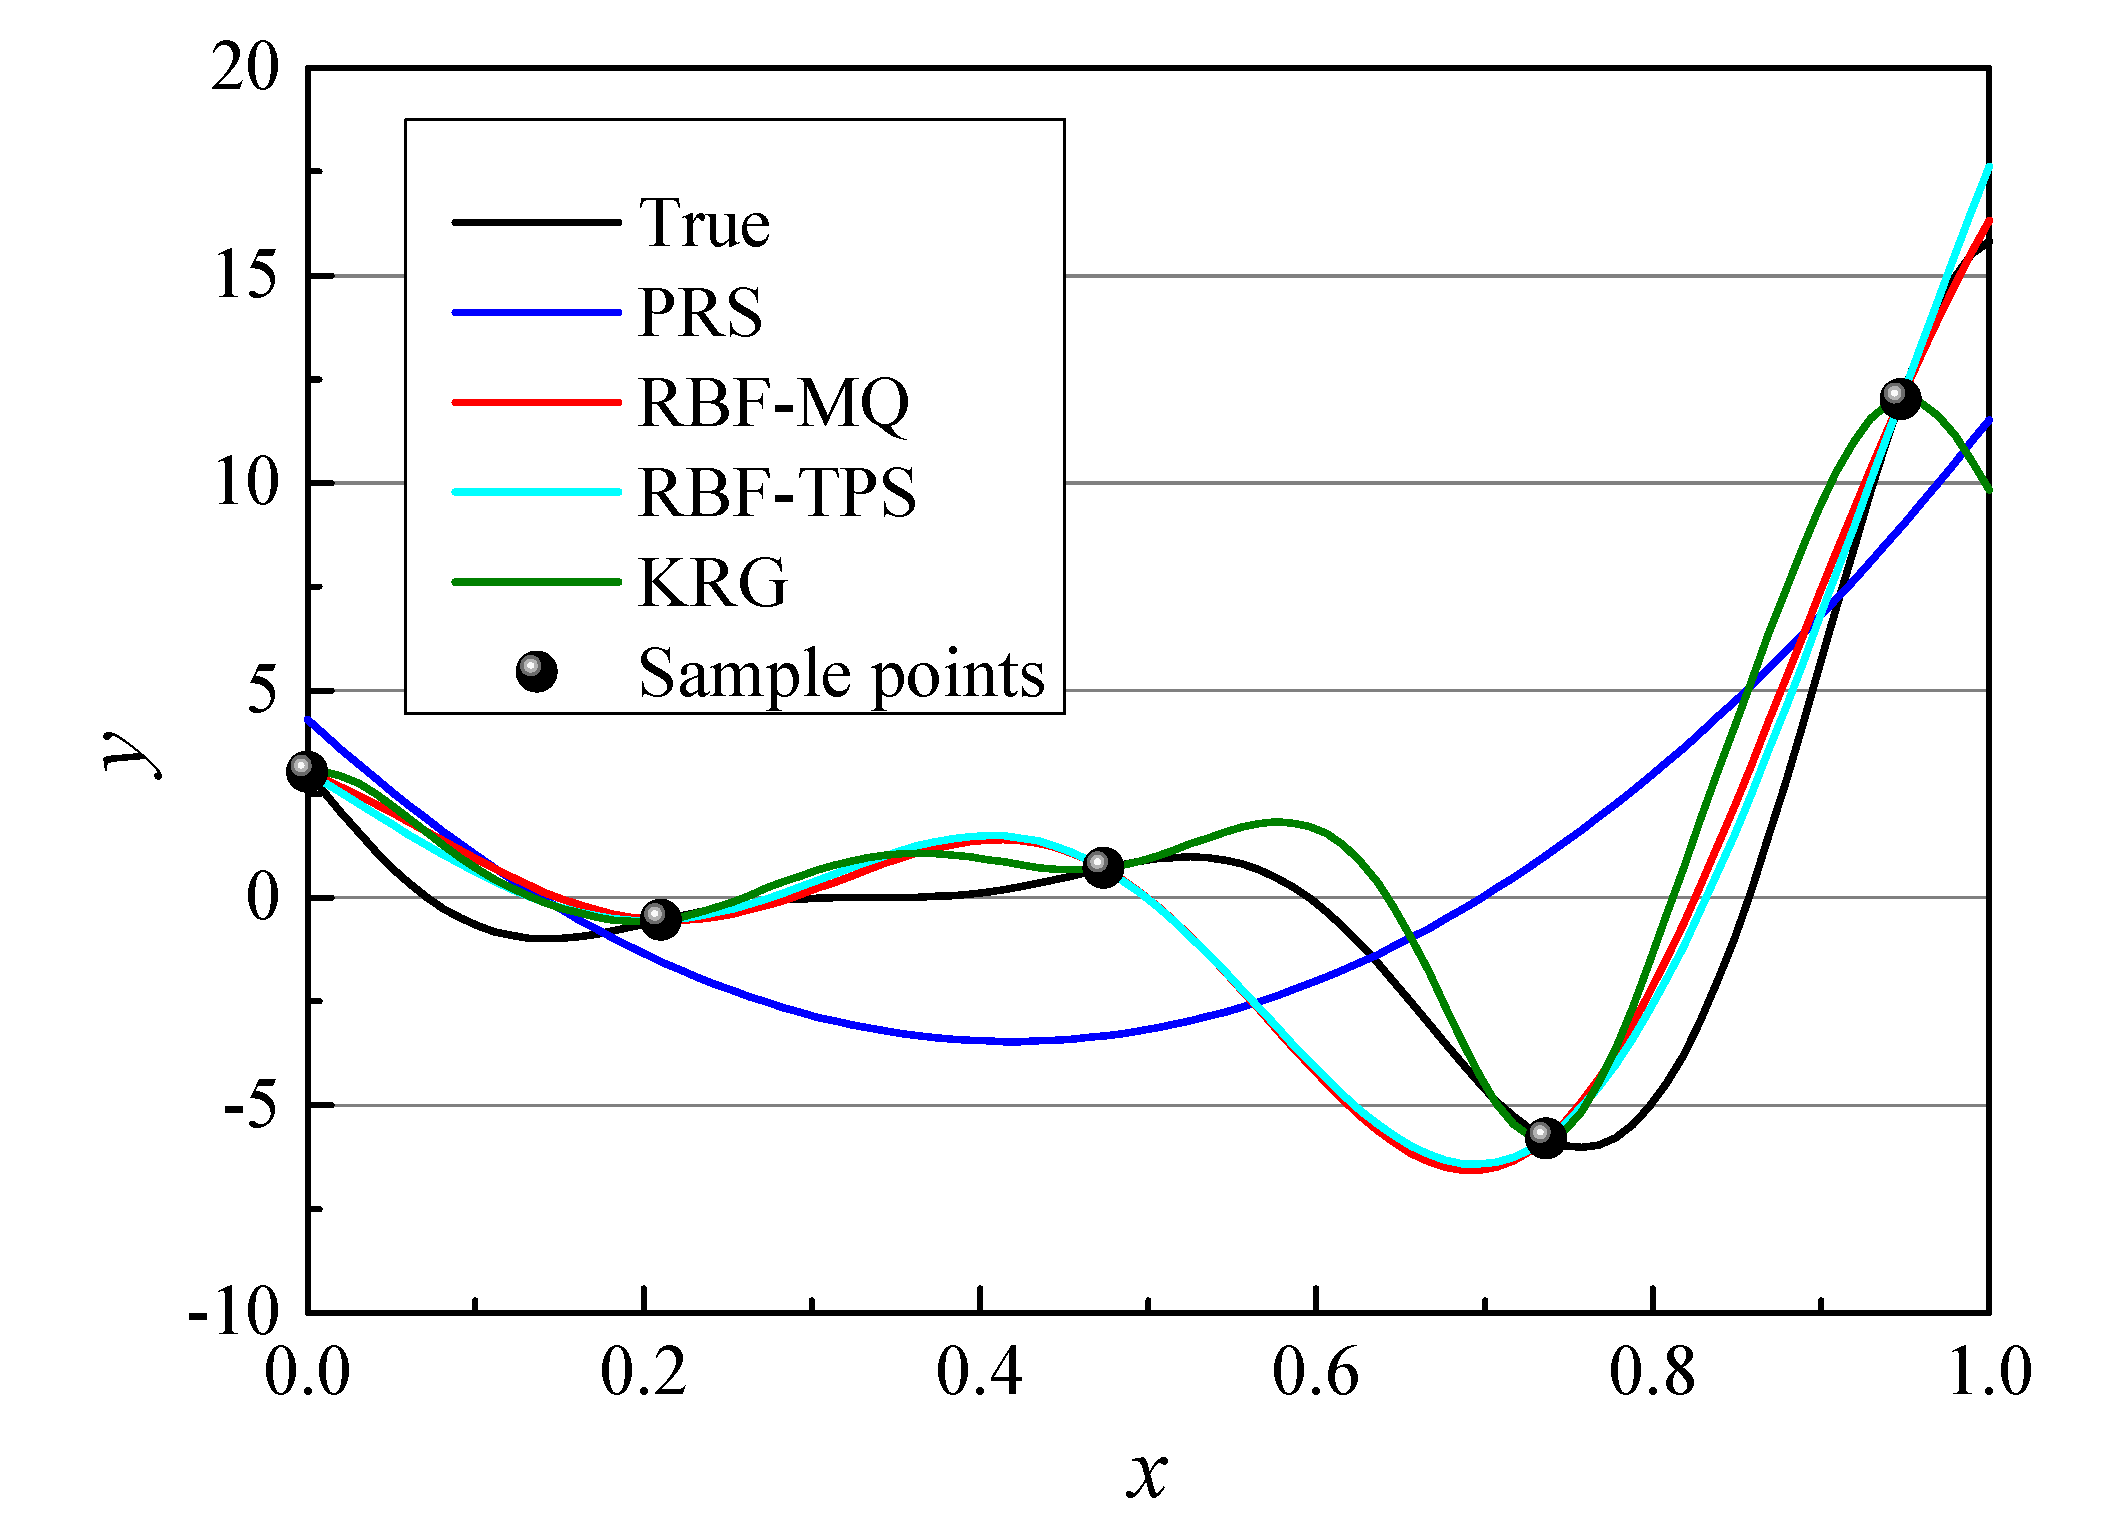
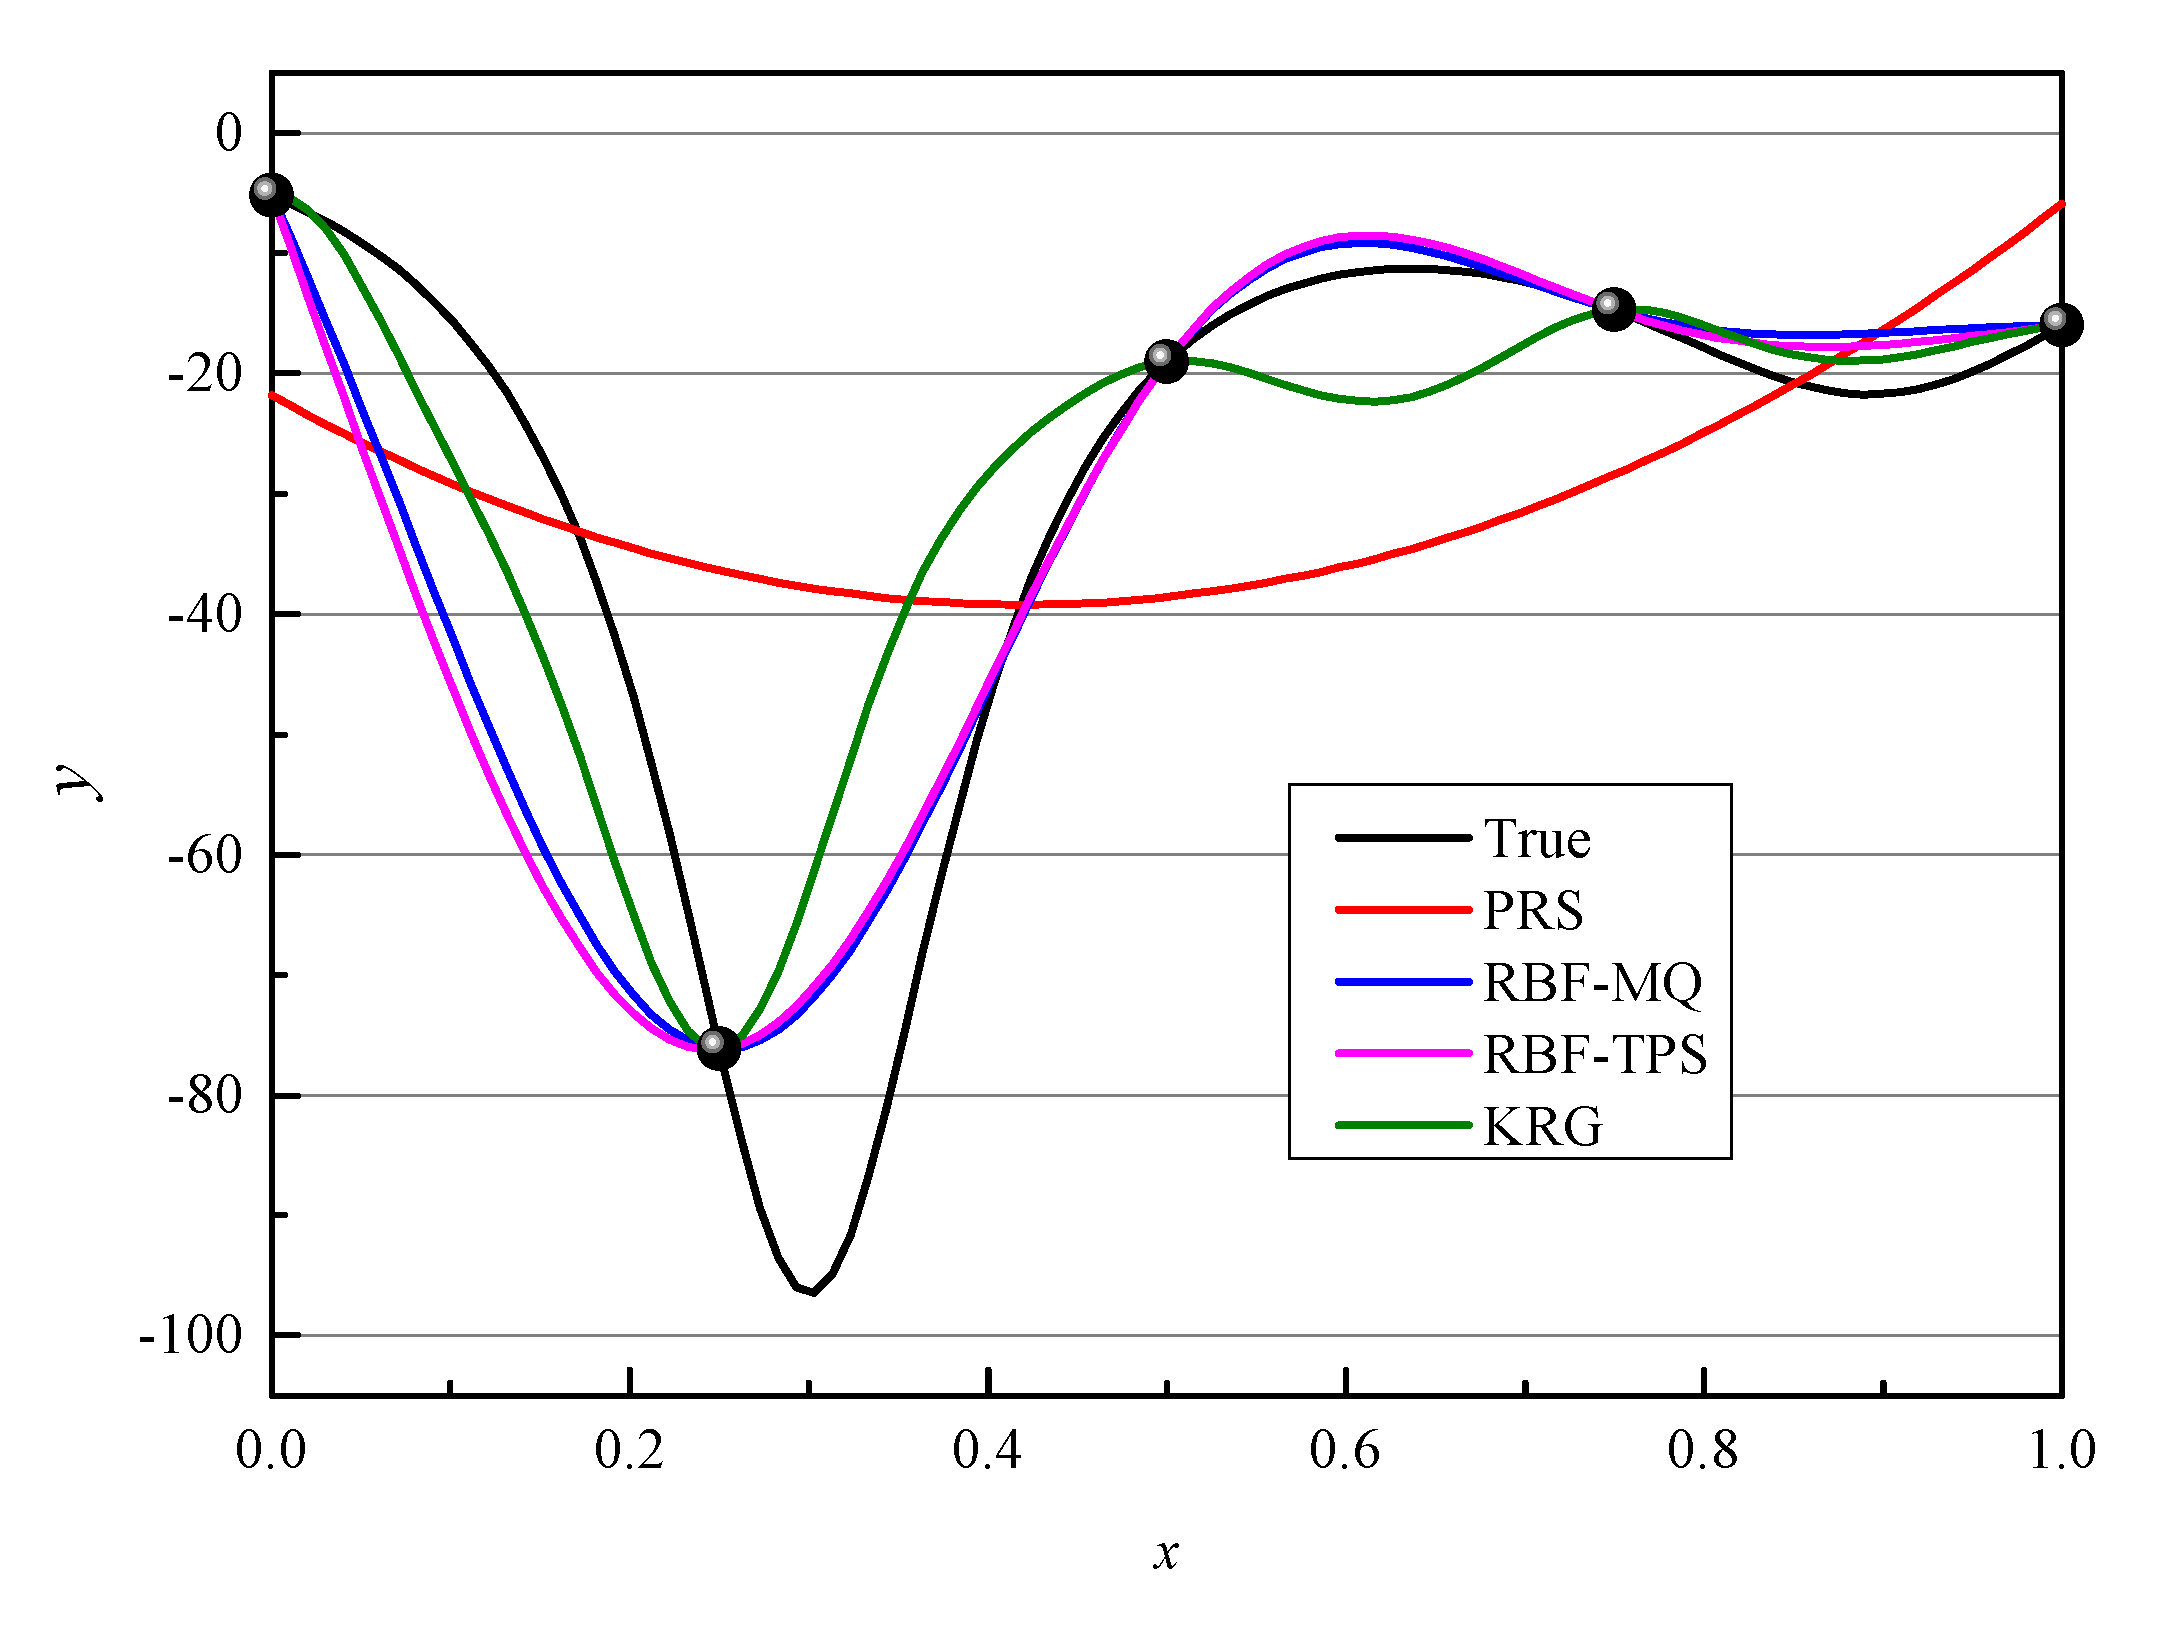
Take a 1-dimensional (1D) function as an example to explain the problem occur for LOO-CV as shown in Figure 1. Five sample points are generated (as black ball shows), and four surrogate models are built based on five sample points. The true function is shown as the black line. R2 of the four models are listed in Table 1. We can see that from R2 the most accurate model is RBF-TPS, RBF-MQ performs the second, KRG performs the third and PRS performs the worst. However, from LOO-CVerror, the best model is KRG, the second one is PRS, the third one is RBF-MQ and the last one is RBF-TPS. That is, RBF-TPS is actually the most accurate model, however, in the construction of E-AHF, the step of using LOO-CV method to filter worse surrogate models means will remove the RBF-TPS model from the library of surrogate models and remain the PRS model which is the worst one.

3. The Proposed MOA-CV Method

3.1. The MOA-CV Method

Regarding the problem above, the move-one-away cross validation (MOA-CV) method is proposed. The reason why the LOO-CV method cannot always select the best and the worst models may be that each validation point, which is eliminated calculating the LOO-CVerror, is different in importance to different surrogate techniques. That is, in some cases, a surrogate model constructed from the entire sample point has better accuracy than another one, but the results are reversed when uses the LOO-CVerror to assess the accuracy of models. Therefore, to preserve the information of validation points as much as possible, rather than eliminating the validation point as the LOO-CV method, MOA-CVerror of the proposed MOA-CV method are calculated by moving validation points around random normal distributions of samples. Pick a set of sample points ( x , y ) = { ( x 1 , y 1 ) , , ( x j , y j ) , , ( x n , y n ) } , and use the sample points to construct a surrogate model S 0 . Select the jth sample ( x v , y v ) = ( x j , y j ) as the validation points, and the remaining n − 1 points as training points, i.e., ( x t r , y t r ) = { ( x 1 , y 1 ) , , ( x j 1 , y j 1 ) , ( x j + 1 , y j + 1 ) , , ( x n , y n ) } . Move the validation point around a random normal distribution with parameter μ = x j and σ = λ d min , where d min is the minimum distance among sampling points ( x , y ) and λ is set by hand, i.e., λ = 0.02 . Then generate a virtual training point ( x j , y ^ j ) , where y ^ j means the prediction of model S 0 at x j . Then the training points can be updated as ( x t r , y t r ) = { ( x 1 , y 1 ) , , ( x j 1 , y j 1 ) , ( x j , y ^ j ) , ( x j + 1 , y j + 1 ) , , ( x n , y n ) } , and use the virtual training set ( x t r , y t r ) to build a surrogate model S 1 . The validation point is unchanged. The main form of the MOA-CVerror is as follows:
M O A C V e r r o r = 1 n j = 1 n ( y j ( x j ) y ^ j ( x j ) ) 2
where MOA-CVerror means the error generated by the MOA-CV method, j means moving the validation point ( x v , y v ) = ( x j , y j ) to be a virtual training point ( x j , y ^ j ) , and y ^ j ( x j ) denotes the prediction of S 1 at x j . Similar to the LOO-CV method, the model with the smallest MOA-CVerror is the most accurate, and vice versa.
The operation steps of the MOA-CV algorithm are briefly described in Table 2.

3.2. Demonstration of MOA-CV Method

First, a 1D mathematical function as shown in Equation (3) is taken as an example to demonstrate the operation processes of the MOA-CV method.
y = 6 1 ( x 0.3 ) 2 + 0.01 1 ( x 9 ) 2 + 0.04
Five sample points are generated randomly and a KRG surrogate model is built, as shown in Figure 2. Five corresponding virtual sample points is generated by the MOA-CV method based on the KRG surrogate model. Figure 2a shows that the each validation point is moved around a normal distribution, as the origin line shows. Figure 2b–f depicts the process of obtaining the MOA-CVerror over five iterations. Five errors for five iterations are obtained, and finally, the MOA-CVerror is calculated by averaging the five errors.
To compare the model selecting performance of MOA-CV and LOO-CV, four surrogate models are constructed based on five sample points, as shown in Figure 3. The prediction accuracy R2 is listed in Table 3. It is obvious that the four surrogate models have different prediction accuracy. From the results of R2 in Table 3 we can know that the real accuracy order of those four models is KRG, RBF-MQ, RBF-TPS and PRS. The right order of surrogates is in italic bold. Although the magnitudes of MOA-CV and LOO-CV are different, we can still compare their performance according to the accurate rate of model selection. MOA-CVerrors of the four surrogate models are highly consistent with R2 and can accurately select the best and worst surrogate model. However, LOO-CVerrors are extremely distinct from R2. The best surrogate model selected by the LOO-CV method is the PRS model, which happens to be the worst one among the four surrogate models in actual situation. The reason may be that unlike the LOO-CV method which is model-independent, the MOA-CV method is a model-dependent method that can learn information from constructed surrogate models. That is, the MOA-CVerror are largely positively correlated with the accuracy of the built surrogate model itself.

3.3. Effect of Variance of the Random Normal Distribution

In the demonstration of the MOA-CV method, the variance σ of the random normal distribution is fixed at 0.02 d min . In this section, ten different values of variance σ are set to explore the effect on the accurate rates of ranking surrogate models. The 1D function as shown in Equation (3) is still used, and the training samples are the same to those in Section 3.2. Since the key point of the MOA-CV method is to move the validation point, the virtual validation point can not be too far away form the original one. That is, σ cannot be too large. Set σ is equal to k d min , in which k is set to be 0.01, 0.02, 0.03, 0.04, 0.05, 0.06, 0.07, 0.08, 0.09 and 0.1. The ranking results of surrogate models by MOA-CV with different σ are listed in Table 4; the corrected orders are in italic bold. From Table 4, it is observed that the MOA-CV method with k = 0.02 has the highest accurate rate and as the k increases from 0.03 to 0.09, the corrected rate of ranking is likely to decreases. Overall, in this work, the variance σ is set to be 0.02 d min .

4. Results and Discussions

4.1. Test Problems

In order to test and compare the model selection performance of the MOA-CV method and the LOO-CV method, two 2-dimensional (2D) and two 10-dimensional (10D) numerical functions are used in this work [24,25] as shown in Table 5. In addition, one engineering problem is also employed in this section.

4.2. Design of Experiments

The first process of constructing models is generating sample points, also called design of experiments (DoEs) which is the computational strategy to produce sample points for computer simulations and surrogate modeling. In this section, Latin hypercube sampling (LHS) with better space-filling and projective properties are used to generate sample points. In this work, we use the built-in Matlab function lhsdesign. Three samples sizes, i.e., 5n, 8n and 10n (where n is the dimension of a function), respectively, are chosen to investigate the effect of different sample sizes on the performance of MOA-CV and LOO-CV. For each function and each sample size, ten random sets of DoEs are generated. The abovementioned surrogate models are used to build models; MOA-CVerror and LOO-CVerror are used to rank models based on the calibrated criterion R2.
Table 6 lists the percentages of choosing the best surrogate models for the four functions, with a higher value in italic bold. Almost for any function, the accurate rates of best model selection of MOA-CV and LOO-CV rise with the increase in samples sizes from 5n to 10n. MOA-CV performs much better than LOO-CV in selecting best models, especially when the sample size is larger. In terms of HD functions, when the sample size is 5n, MOA-CV and LOO-CV perform quite poor. That is, with small samples neither the MOA-CV nor the LOO-CV method can find the best model. When the sample size increases to 10n, MOA-CV is more likely than LOO-CV to find the best model. The average result over four functions also shows that it is a little easier for the MOA-CV method to discover the best model than the LOO-CV method.
Table 7 lists the accurate rate of finding the worst surrogate models for the four functions, also with a higher value in italic bold. MOA-CV has the best accurate rate when the sample size is 8n. When the sample sizes are 5n and 10n, LOO-CV performs better than MOA-CV in terms of removing worst models. Similar to selecting the best models, MOA-CV and LOO-CV also perform quite poor with 5n sample points in cases of HD functions. From the average result over four functions, it is seen that the MOA-CV method performs slightly worse than the LOO-CV method in finding worst models.
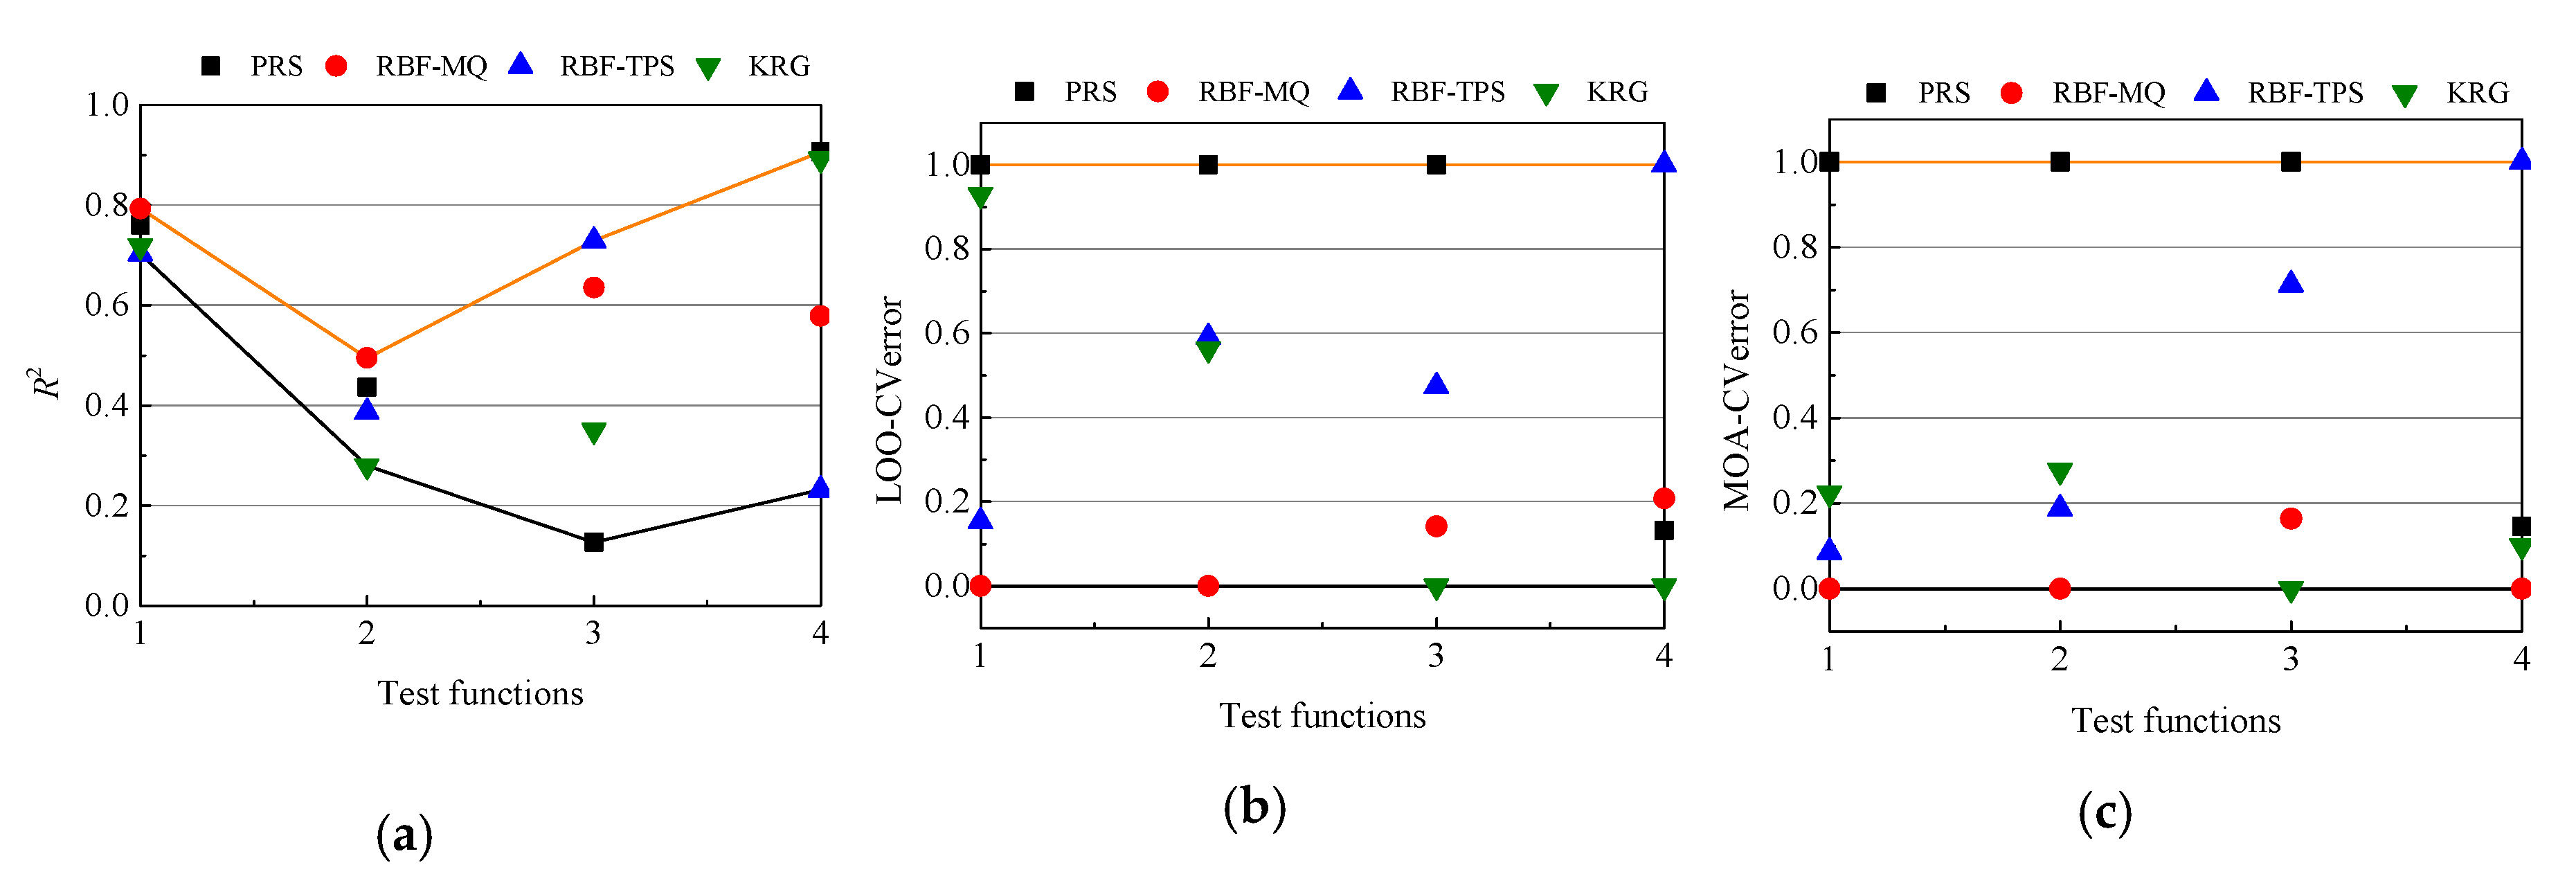
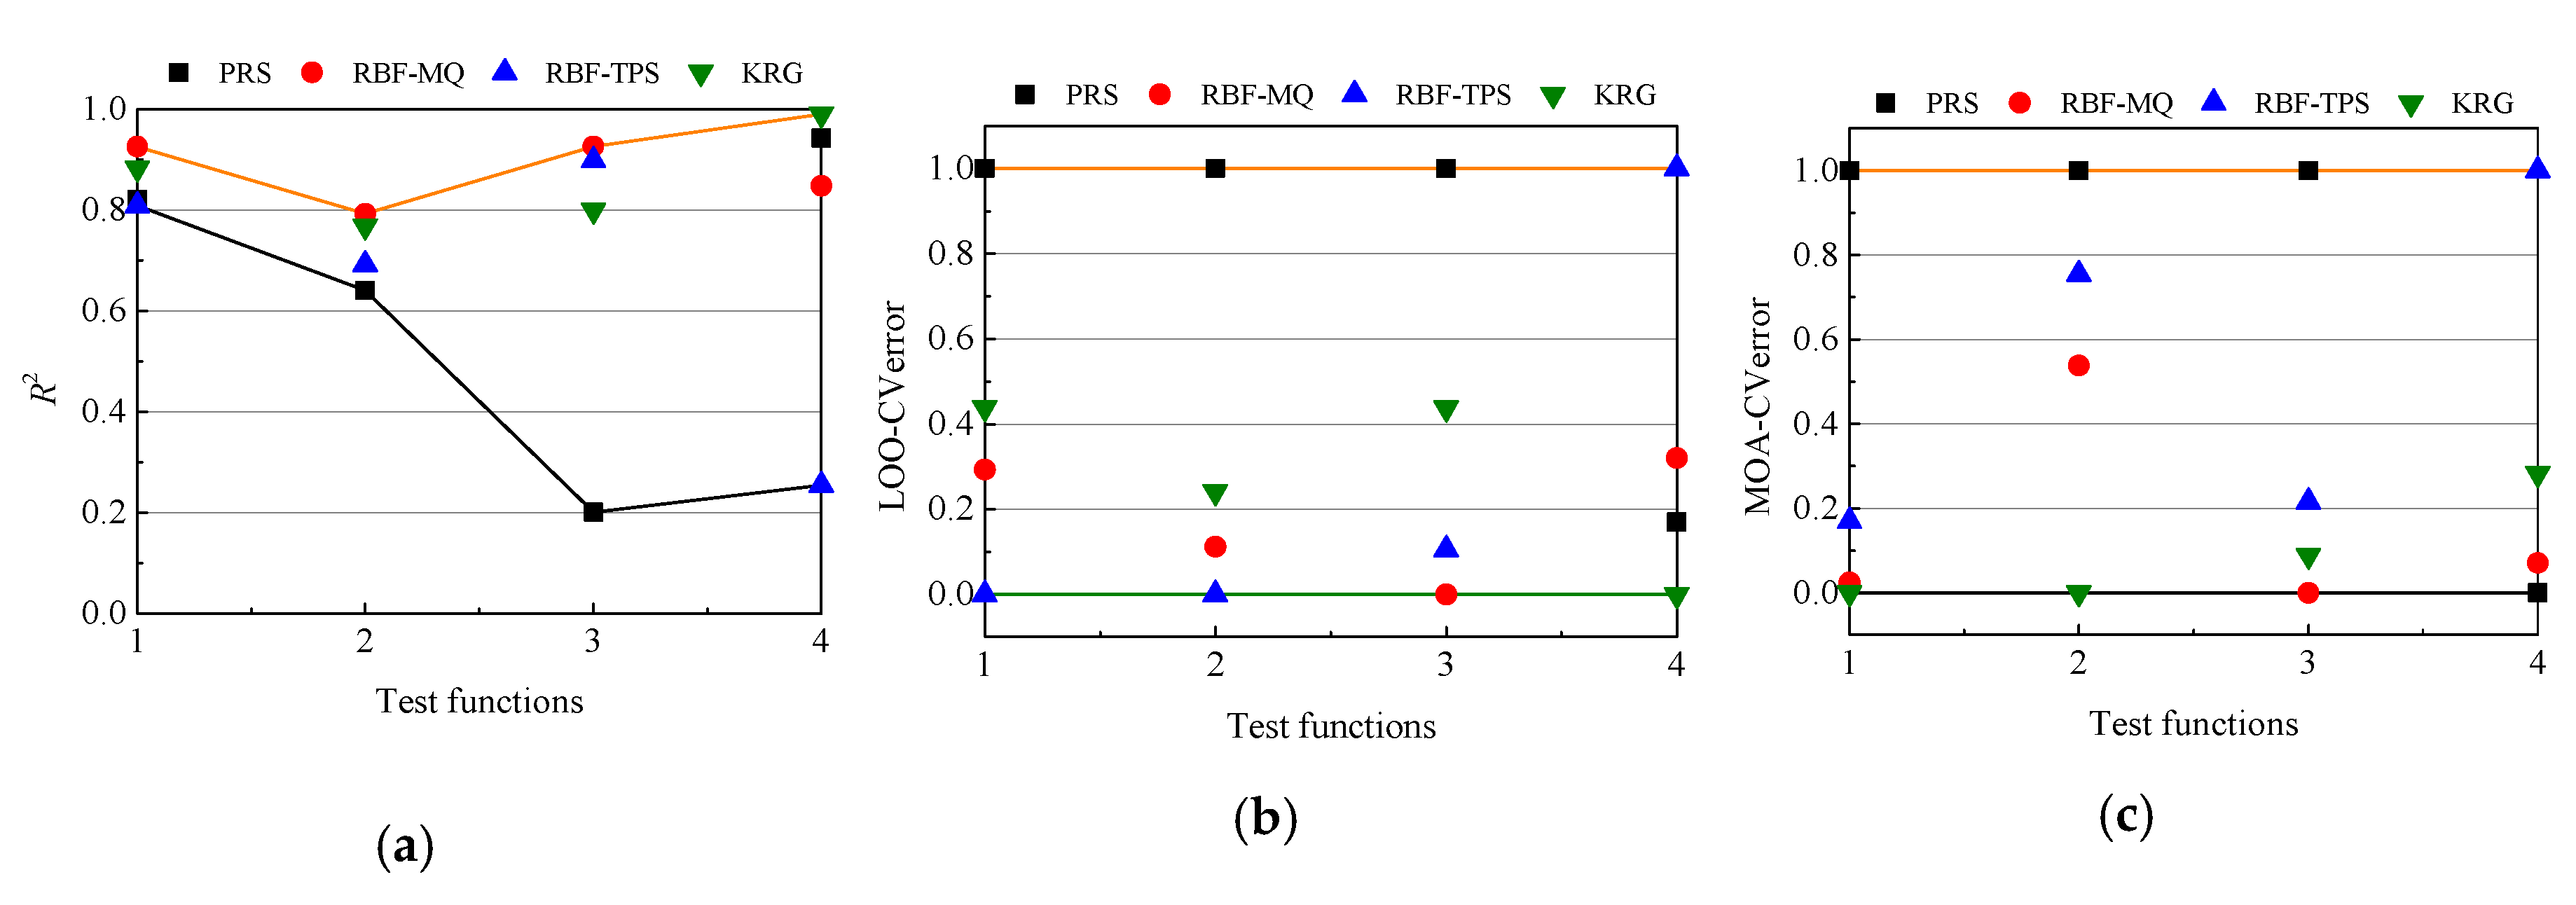
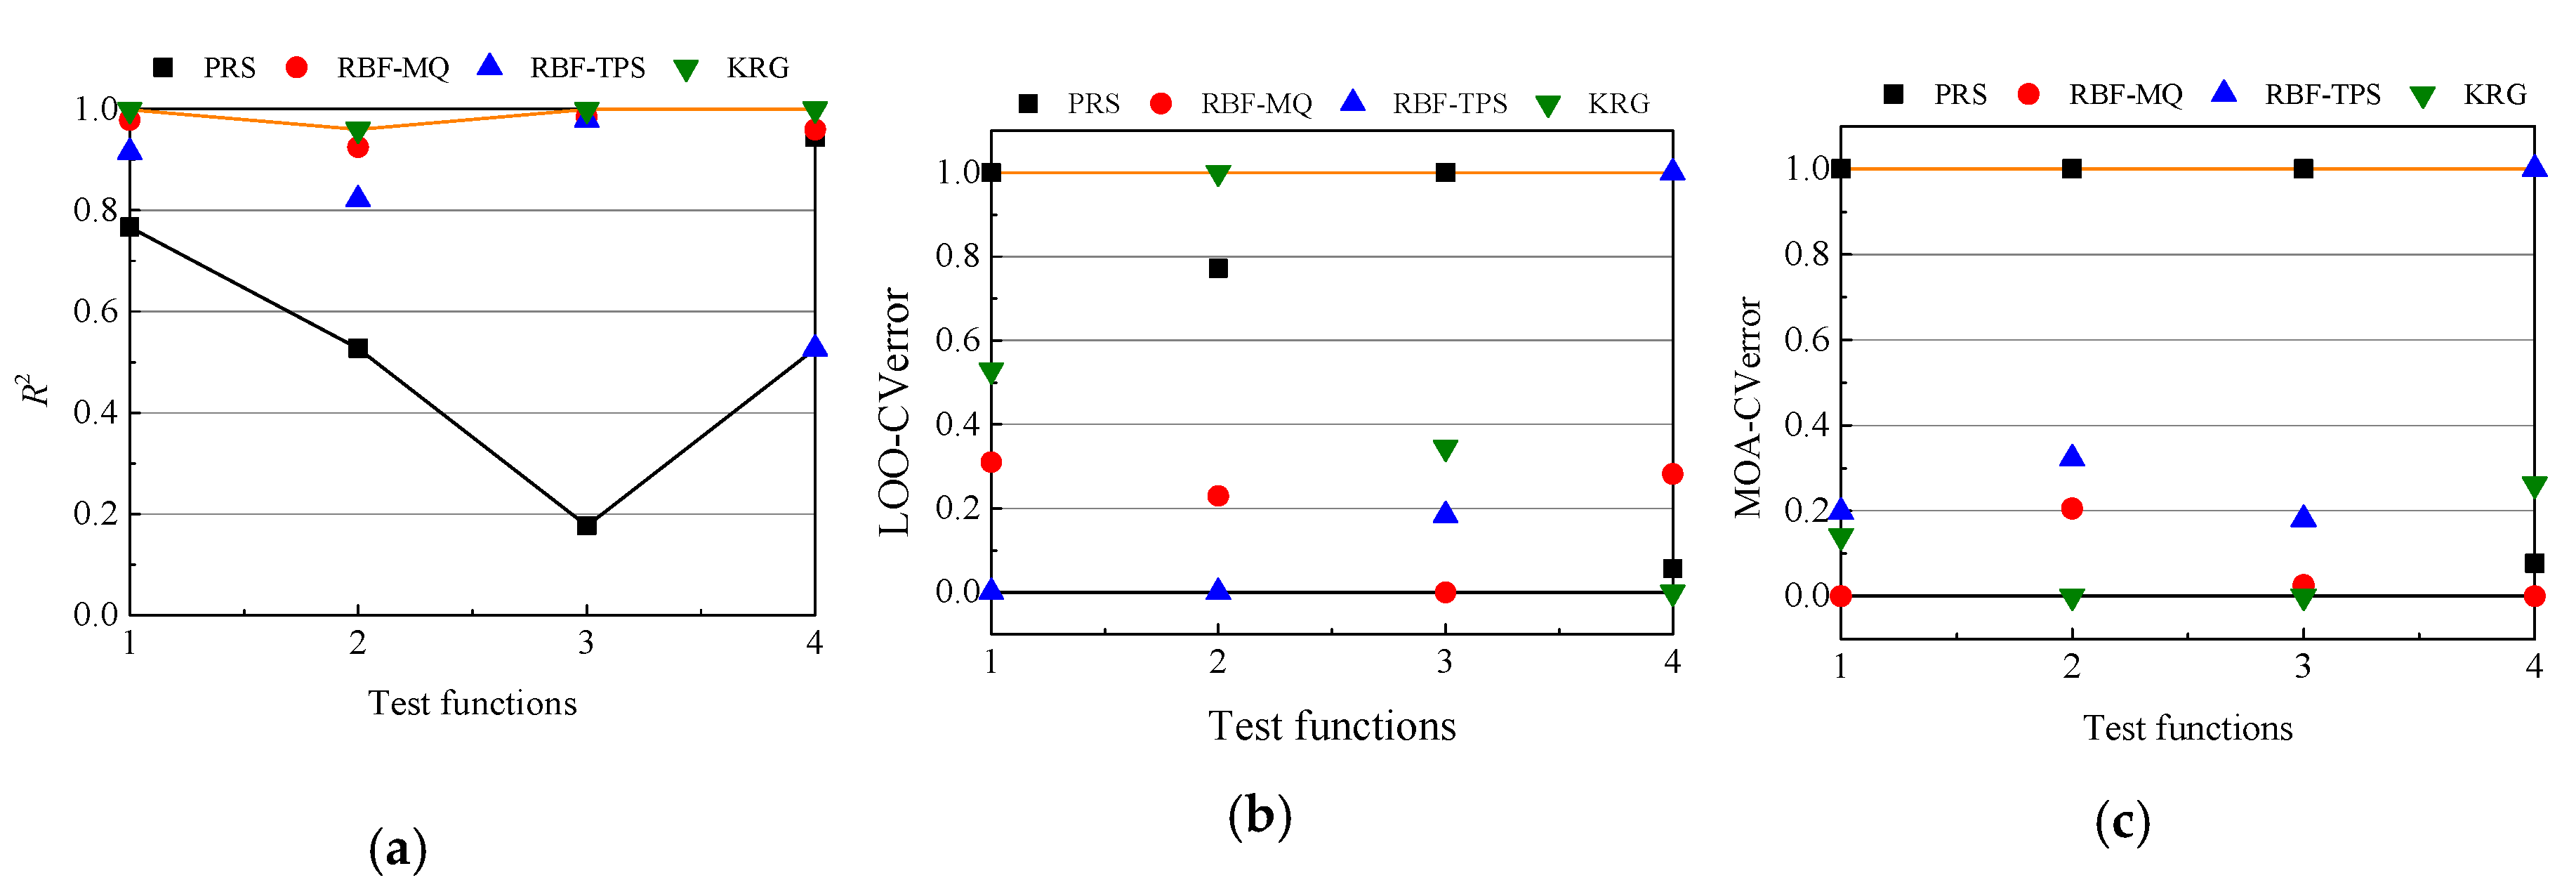
As described above, for each function and each sample size, 10 sets of DoEs are generated randomly. Here, we compare the averaged results of selecting best and worst models over these 10 sampling plans.
Figure 4, Figure 5 and Figure 6 show the model ranks by using R2, LOO-CVerror and MOA-CVerror under 5n, 8n and 10n sample points. Table 8 and Table 9 summarize the average accurate rates of selecting best and worst models for four tests functions over 10 groups of DoEs, and the higher values are in italic bold. In order to intuitively describe accurate rates of MOA-CV and LOO-CV, the MOA-CVerror and LOO-CVerror are regularized between 0 to 1. Hence, the worst model has the largest MOA-CVerror/LOO-CVerror of 1, while the best model has the smallest MOA-CVerror/LOO-CVerror of 0. It is concluded that both the MOA-CV and LOO-CV methods have a 50% probability of selecting the best model. With increase in sample sizes, the MOA-CV model may become better in selecting best and worst models.

4.3. Engineering Problems

In addition to numerical problems, one engineering problem, i.e., the prediction of the thrust (TH) on the whole rotor of a small aerial vehicle (UAV), is also employed to investigate and compare the model selection performance of MOA-CV and LOO-CV methods.
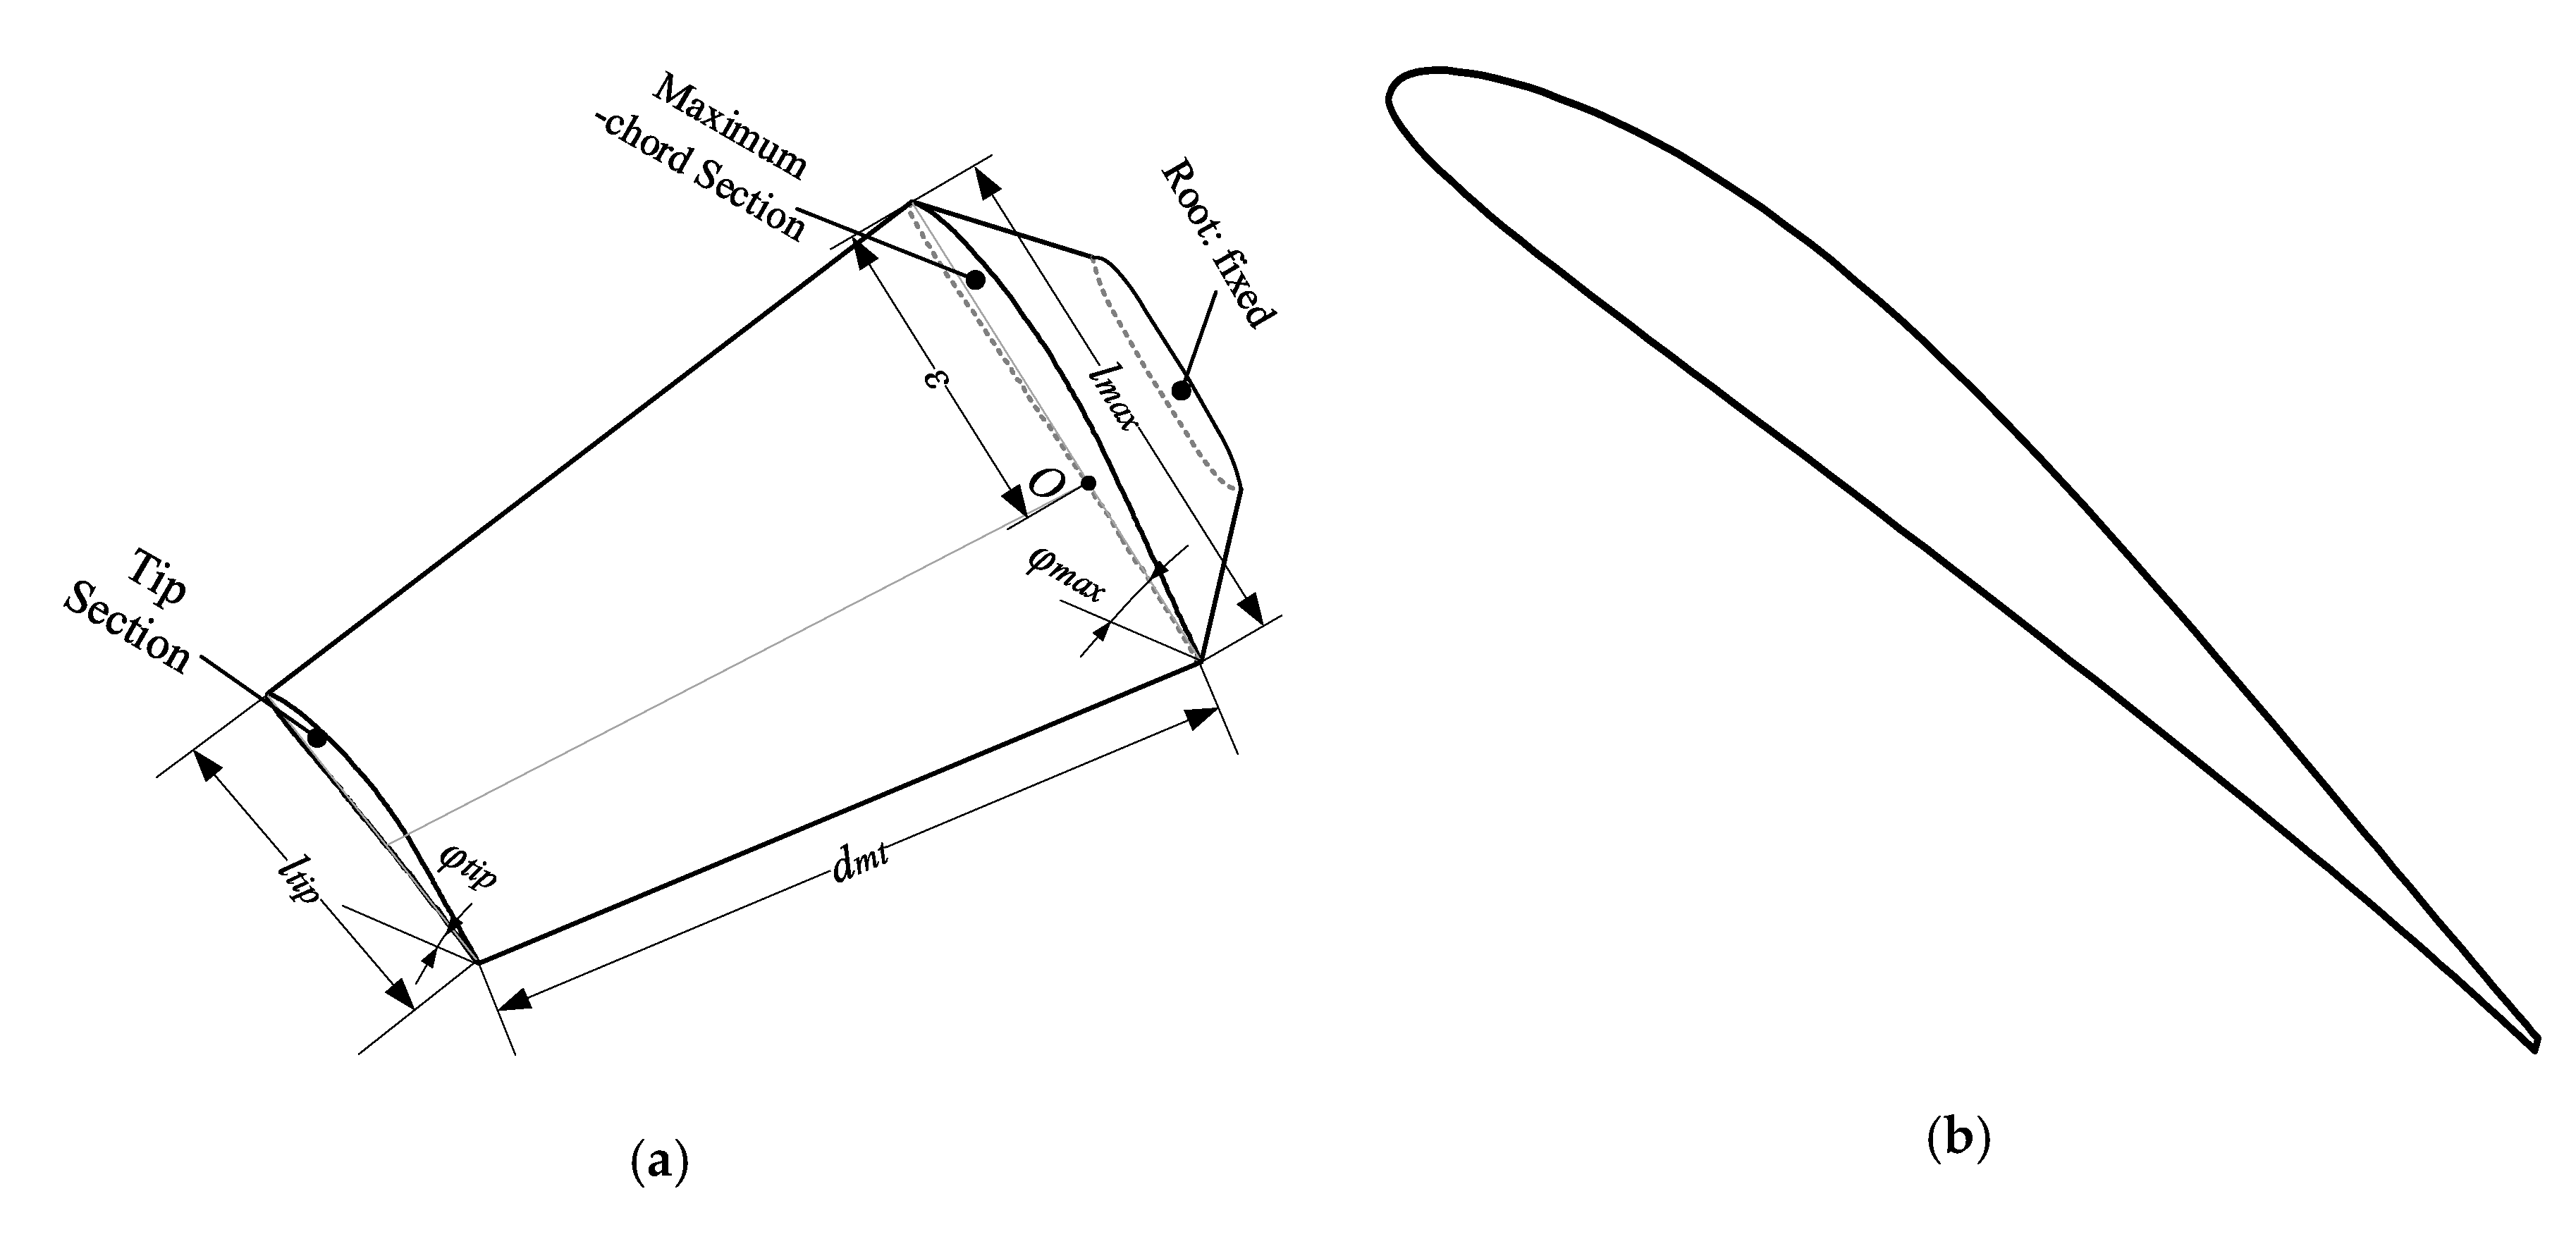
The rotor blade and airfoil of a small (UAV) are shown in Figure 7. The whole rotor consists of three blades. In this problem, we focus on the thrust (TH) on the whole rotor. The airfoil (as shown in Figure 7b) is generated by using the class shape function transformation (CST) [26] which is a parametric modeling method. The airfoil has 16 parametric modeling variables. Six structural variables are presented in Figure 7a. Hence, the rotor blade of the UAV totally has 22 variables listed in Table 10. For the 16 parametric modeling variables, please see Reference [26]. Two sections are shown in Figure 7, i.e., blade tip and maximum-chord sections. l t i p and φ t i p are chord length and mounting angle of the blade tip section, respectively. l m a x and φ m a x are chord length and mounting angle of the maximum-chord section, respectively. The position of maximum-chord section is represented by d m t . ε is the forward sweep.
We use the LHS approach built-in MATLAB to randomly generate 220 samples and get the corresponding TH. Then we choose 110, 176 and 220 (i.e., 5n, 8n and 10n, where n is the number of variables) samples to construct PRS, RBF-MQ, RBF-TPS and KRG, respectively. The MOA-CV and LOO-CV methods are employed to select the most accurate and the worst accurate models. Then other 50 samples are generated for the calibrated criterion, i.e., R2.
The results of R2, MOA-CVerror and LOO-CVerror are shown in Table 11, Table 12 and Table 13, respectively. The best model presented by each criterion are in bold; the worst model are shown in italic. From the result of R2 we can see that RBF-MQ has the best accuracy and PRS has the worst accuracy. Results of MOA-CVerror indicate RBF-MQ is the most accurate when the sample sizes are 5n and 10n, which is consistent with those of R2, while results of LOO-CVerror show KRG is the most accurate, which is different from the results of R2. However, when the sample size is 8n, MOA-CV cannot select the best model, while LOO-CV can choose the best one. Both the MOA-CVerror and the LOO-CVerror indicate that the PRS is the worst model regardless of sample size. Overall, in this case, both the MOA-CV and the LOO-CV can choose the worst models, and in most cases, MOA-CV is likely to find the best model than LOO-CV.

5. Conclusions

In order to improve the E-AHF model which has been proposed in previous work, we modified the LOO-CV method, which is used to build the surrogate library in E-AHF. By moving a validation point around random normal distributions rather than leaving it out, the move-one-away cross validation (MOA-CV) is proposed. Four surrogate techniques are used to construct models; errors generated by MOA-CV and LOO-CV methods, i.e., MOA-CVerror and LOO-CVerror, respectively, were used to select the best model from those four surrogate models through 20 standard mathematical functions and one engineering problem. We used the R2 which is reliable to evaluate the accuracy of a model to be a calibration of MOA-CV and LOO-CV. The accurate rate of selecting the best and worst surrogate was used to assess and compare the performance of MOA-CV and LOO-CV.
Results show that with the increase in sample sizes, MOA-CV and LOO-CV are more likely to select the best models. MOA-CV performs much better than LOO-CV in selecting best models, especially when the sample size is larger. For HD functions, with small samples, neither the MOA-CV nor the LOO-CV method can find the best model. Similar to selecting the best models, MOA-CV and LOO-CV also perform quite poor with smaller samples for HD functions.
From the average accurate rates over ten sets of DoEs, it is concluded that with increase in sample sizes, the MOA-CV model may become better in selecting best and worst models. In the engineering problem, both the MOA-CV and LOO-CV can choose the worst models, and in most cases, MOA-CV has a higher probability to select the best model than LOO-CV.

Author Contributions

Conceptualization, L.L. and X.S.; methodology, L.L.; writing—original draft preparation, L.L.; writing—review and editing, X.S. and W.S.; project administration, X.S. and W.S.; funding acquisition, X.S. and W.S. All authors have read and agreed to the published version of the manuscript.

Funding

This research was funded by the National Natural Science Foundation of China, Grant Number U1608256 and the National Key Research and Development Program of China, Grant Number 2018YFB1700704.

Conflicts of Interest

The authors declare no conflict of interest.

References

  1. Stone, M. Cross-validation and multinomial prediction. Biometrika 1974, 61, 509–515. [Google Scholar] [CrossRef]
  2. Stone, M. Cross-validation: A review. Stat. A J. Theor. Appl. Stat. 1978, 9, 127–139. [Google Scholar]
  3. Cudeck, R.; Browne, M.W. Cross-validation of covariance structures. Multivar. Behav. Res. 1983, 18, 147–167. [Google Scholar] [CrossRef] [PubMed]
  4. Picard, R.R.; Cook, R.D. Cross-validation of regression models. J. Am. Stat. Assoc. 1984, 79, 575–583. [Google Scholar] [CrossRef]
  5. Dai, Q. A competitive ensemble pruning approach based on cross-validation technique. Knowl.-Based Syst. 2013, 37, 394–414. [Google Scholar] [CrossRef]
  6. Airola, A.; Pahikkala, T.; Waegeman, W.; De Baets, B.; Salakoski, T. An experimental comparison of cross-validation techniques for estimating the area under the ROC curve. Comput. Stat. Data Anal. 2011, 55, 1828–1844. [Google Scholar] [CrossRef]
  7. Kohavi, R. A study of cross-validation and bootstrap for accuracy estimation and model selection. In Proceedings of the Fourteenth International Joint Conference on Artificial Intelligence, Montreal, QC, Canada, 20–25 August 1995; pp. 1137–1143. [Google Scholar]
  8. Xu, Q.S.; Liang, Y.Z. Monte Carlo cross validation. Chemometr. Intell. Lab. Syst. 2001, 56, 1–11. [Google Scholar] [CrossRef]
  9. Xu, Q.S.; Liang, Y.Z.; Du, Y.P. Monte Carlo cross-validation for selecting a model and estimating the prediction error in multivariate calibration. J. Chemometr. A J. Chemometr. Soc. 2004, 18, 112–120. [Google Scholar] [CrossRef]
  10. Roberts, D.R.; Bahn, V.; Ciuti, S.; Boyce, M.S.; Elith, J.; Guillera-Arroita, G.; Warton, D.I. Cross-validation strategies for data with temporal, spatial, hierarchical, or phylogenetic structure. Ecography 2017, 40, 913–929. [Google Scholar] [CrossRef]
  11. Arlot, S.; Celisse, A. Segmentation of the mean of heteroscedastic data via cross-validation. Stat. Comput. 2011, 21, 613–632. [Google Scholar] [CrossRef] [Green Version]
  12. Kale, S.; Kumar, R.; Vassilvitskii, S. Cross-validation and mean-square stability. In Proceedings of the Second Symposium on Innovations in Computer Science, Beijing, China, 7–9 January 2011. [Google Scholar]
  13. Anguita, D.; Ghelardoni, L.; Ghio, A.; Oneto, L.; Ridella, S. The ‘K’ in K-fold Cross Validation. In Proceedings of the European Symposium on Artificial Neural Networks, Computational Intelligence and Machine Learning, Bruges, Belgium, 25–27 April 2012. [Google Scholar]
  14. Yu, Y.; Feng, Y. Modified Cross-Validation for Penalized High-Dimensional Linear Regression Models. J. Comput. Graph. Stat. 2014, 23, 1009–1027. [Google Scholar] [CrossRef] [Green Version]
  15. Jung, Y.; Hu, J. AK-fold averaging cross-validation procedure. J. Nonparametr. Stat. 2015, 27, 167–179. [Google Scholar] [CrossRef] [PubMed] [Green Version]
  16. Liu, Y.; Liao, S.; Jiang, S.; Ding, L.; Lin, H.; Wang, W. Fast Cross-Validation for Kernel-based Algorithms. IEEE Trans. Pattern Anal. Mach. Intell. 2019, 42, 1083–1096. [Google Scholar] [CrossRef]
  17. Song, X.; Lv, L.; Li, J.; Sun, W.; Zhang, J. An advanced and robust ensemble surrogate model: Extended adaptive hybrid functions. J. Mech. Des. 2018, 140, 041402. [Google Scholar] [CrossRef] [Green Version]
  18. Xu, S.; Liu, H.; Wang, X.; Jiang, X. A robust error-pursuing sequential sampling approach for global metamodeling based on voronoi diagram and cross validation. J. Mech. Des. 2014, 136, 071009. [Google Scholar] [CrossRef]
  19. Viana, F.A.; Haftka, R.T.; Steffen, V. Multiple surrogates: How cross-validation errors can help us to obtain the best predictor. Struct. Multidiscip. Optim. 2009, 39, 439–457. [Google Scholar] [CrossRef]
  20. Zhang, Y.; Yang, Y. Cross-validation for selecting a model selection procedure. J. Econometr. 2015, 187, 95–112. [Google Scholar] [CrossRef]
  21. Goel, T.; Haftka, R.T.; Shyy, W.; Queipo, N.V. Ensemble of surrogates. Struct. Multidiscip. Optim. 2007, 33, 199–216. [Google Scholar] [CrossRef]
  22. Myers, R.H.; Montgomery, D.C. Response surface methodology: Process and product in optimization using designed experiments. Technometrics 2008, 38, 284–286. [Google Scholar]
  23. Gutmann, H.M. A radial basis function method for global optimization. J. Glob. Optim. 2000, 19, 201–227. [Google Scholar] [CrossRef]
  24. Jin, R.; Chen, W.; Simpson, T.W. Comparative studies of metamodelling techniques under multiple modelling criteria. Struct. Multidiscip. Optim. 2001, 23, 1–13. [Google Scholar] [CrossRef]
  25. Mullur, A.A.; Messac, A. Metamodeling using extended radial basis functions: A comparative approach. Eng. Comput. 2006, 21, 203. [Google Scholar] [CrossRef]
  26. Kulfan, B.M. Universal parametric geometry representation method. J. Aircr. 2008, 45, 142–158. [Google Scholar] [CrossRef]
Figure 1. Comparison of different surrogate models.
Applsci 10 02448 g001
Figure 2. Demonstration of the move-one-away cross validation (MOA-CV) method. (a) virtual training points; (b) 1st iteration; (c) 2nd iteration; (d) 3rd iteration; (e) 4th iteration; (f) 5th iteration.
Applsci 10 02448 g002
Figure 3. Comparison of four surrogate models.
Applsci 10 02448 g003
Figure 4. Model ranks by mean of (a) R2, (b) LOO-CVerror and (c) MOA-CVerror with 5n sample points.
Applsci 10 02448 g004
Figure 5. Model ranks by mean of (a) R2, (b) LOO-CVerror and (c) MOA-CVerror with 8n sample points.
Applsci 10 02448 g005
Figure 6. Model ranks by mean of (a) R2, (b) LOO-CVerror and (c) MOA-CVerror with 10n sample points.
Applsci 10 02448 g006
Figure 7. Rotor blade. (a) rotor blade and structural variables; (b) airfoil of rotor blade.
Applsci 10 02448 g007
Table 1. Rank of models by R2 and leave-one-out CV (LOO-CV).
TermPRSRBF-MQRBF-TPSKRG
R20.320.830.850.80
Rank of R24213
CVerror of LOO-CV12.313.114.010.9
Rank of CV2341
Table 2. Operation Steps of LOO-MCV Algorithm.
No.Process
Step 1Generate original sampling points ( x , y ) , and based on ( x , y ) , build a surrogate model S 0
Step 2Split ( x , y ) into two sets, i.e., training set ( x t r , y t r ) = { ( x 1 , y 1 ) , , ( x j 1 , y j 1 ) , ( x j + 1 , y j + 1 ) , , ( x n , y n ) } and validation set ( x v , y v ) = ( x j , y j )
Step 3Calculate the minimum distance d min among ( x , y )
Step 4Determine the mean and the variance of a random normal distribution at each validation point ( x v , y v ) = ( x j , y j ) , μ = y j and σ = 0.02 d min ,
Step 5Obtain a virtual training point, i.e., ( x j , y ^ j ) on the model S 0
Step 6Generate a new training set ( x t r , y t r ) and build a surrogate model S 1 based on ( x t r , y t r ) , get the prediction y ^ j ( x j ) of S 1 at x j
Step 7Calculate the MOA-CVerror
Table 3. Ranking results of surrogate models by MOA-CV and LOO-CV methods.
TermPRSRBF-MQRBF-TPSKRG
R20.180.660.530.69
Order by R24231
LOO-CVerror44.26264.356473.49144.263
Order by LOO-CV1342
MOA-CVerrorr22.9483.4384.2933.127
Order by MOA-CV4231
Table 4. Ranking results of surrogate models by MOA-CV with different σ.
OrdersPRSRBF-MQRBF-TPSKRGCorrected Rate
R2 (corrected orders)4231
k = 0.01 432150%
k = 0.02 4231100%
k = 0.03 431225%
k = 0.04 421350%
k = 0.05 413250%
k = 0.06 421350%
k = 0.07 243150%
k = 0.08 143225%
k = 0.09 234125%
k = 0.1 421350%
Table 5. Test functions.
No.D.Test FunctionsD.S.
12 y = ( x 2 5.1 x 1 2 4 π 2 + 5 x 1 π 6 ) 2 + 10 ( 1 1 8 π ) cos ( x 1 ) + 10 [−5, 0; 10, 15]
22 y = ( 4 2.1 x 1 2 + 1 3 x 1 4 ) x 1 2 + x 1 x 2 + ( 4 + 4 x 2 2 ) x 2 2 [−2, −1; 2, 1]
310 y = i 9 [ ( x i + 1 2 x i ) 2 + ( x i 1 ) 2 ] [−3, 3]D
410 y = i 10 exp x i [ c i + x i log ( j 10 x j ) ] [−5, 5]D
Notes: D. and D.S. are the dimension and design space of test functions, respectively.
Table 6. Accurate rate of selecting best models.
Size of Samples5n8n10n
FunctionsMOA-CVLOO-CVMOA-CVLOO-CVMOA-CVLOO-CV
LD functions140%10%40%10%20%20%
210%20%50%10%60%30%
HD functions30%0%50%0%80%0%
40%0%30%0%90%30%
Average for all functions12.5%7.5%42.5%5%62.5%20%
Table 7. Accurate rate of removing worst models.
Size of Samples5n8n10n
FunctionsMOA-CVLOO-CVMOA-CVLOO-CVMOA-CVLOO-CV
LD functions140%70%90%60%60%40%
240%20%60%30%40%70%
HD functions30%0%20%20%0%0%
40%0%30%30%20%20%
Average of ratefor all functions20%22.5%50%35%30%32.5%
Table 8. Accurate rate of selecting best models by mean of LOO-CVerror and MOA-CVerror.
Methods5n8n10n
LOO-CV50%50%50%
MOA-CV50%25%50%
Table 9. Accurate rate of removing worst models by mean of LOO-CVerror and MOA-CVerror.
Methods5n8n10n
LOO-CV50%75%75%
MOA-CV50%75%100%
Table 10. Variables of rotor blade.
No.VariablesTermsDesign Space
1 A U 0 t i p Parametric modeling variables
For blade tip
[−0.167, −0.059]
2 A U 1 t i p [−0.112, 0.225]
3 A U 2 t i p [−0.228, 0.140]
4 A U 3 t i p [−0.081, 0.579]
5 A L 0 t i p [0.123, 0.281]
6 A L 1 t i p [0.212, 0.527]
7 A L 2 t i p [−0.035, 0.421]
8 A L 3 t i p [0.048, 0.761]
9 A U 0 m a x Parametric modeling variables
For the maximum-chord section
[−0.167, −0.059]
10 A U 1 m a x [−0.112, 0.225]
11 A U 2 m a x [−0.228, 0.140]
12 A U 3 m a x [−0.081, 0.579]
13 A L 0 m a x [0.123, 0.281]
14 A L 1 m a x [0.212, 0.527]
15 A L 2 m a x [−0.035, 0.421]
16 A L 3 m a x [0.048, 0.761]
17 φ t i p (°)Mounting angle of blade tip[5, 20]
18 l t i p (mm)Chord length of blade tip[5, 12]
19 φ m a x (°)Mounting angle of maximum-chord section[15, 30]
20 l m a x (mm)Chord length of maximum-chord section[12, 30]
21 d m t (mm)Position of maximum-chord section[10, 15]
22 ε (mm)Forward sweep[0, 0.65]
Table 11. Results of R2 of four surrogate models.
R25n8n10n
PRS000
RBF-MQ0.8240.8260.806
RBF-TPS0.1020.0420.319
KRG0.8170.8350.798
Table 12. Results of MOA-CVerror of four surrogate models.
MOA-CVerror5n8n10n
PRS0.06620.2630.250
RBF-MQ1.86 × 10−41.48 × 10−41.55 × 10−4
RBF-TPS0.006460.04300.00139
KRG4.78 × 10−44.59 × 10−44.91 × 10−4
Table 13. Results of LOO-CVerror of four surrogate models.
LOO-CVerror5n8n10n
PRS0.04690.05700.0251
RBF-MQ3.69 × 10−43.59 × 10−44.02 × 10−4
RBF-TPS7.71 × 10−46.64 × 10−49.89 × 10−4
KRG3.47 × 10−43.50 × 10−43.75 × 10−4

