Article

The Effect of Elevated CO2 on Berry Development and Bunch Structure of Vitis vinifera L. cvs. Riesling and Cabernet Sauvignon

1
Department of General and Organic Viticulture, Hochschule Geisenheim University, Von-Lade-Strasse 1, 65366 Geisenheim, Germany
2
Department of Modeling and Systems Analysis, Hochschule Geisenheim University, Von-Lade-Strasse 1, 65366 Geisenheim, Germany
3
Department of Microbiology and Biochemistry, Hochschule Geisenheim University, Von-Lade-Strasse 1, 65366 Geisenheim, Germany
4
Department of Agronomy and Plant Breeding I, Justus Liebig University, Schubertstrasse 81, 35392 Giessen, Germany
*
Author to whom correspondence should be addressed.
Submission received: 12 March 2020 / Revised: 30 March 2020 / Accepted: 31 March 2020 / Published: 4 April 2020

Abstract

:
Carbon dioxide (CO2) as one of the main factors driving climate change is known to increase grapevine growth and yield and could, therefore, have an impact on the fruit quality of vines. This study reports the effects of elevated CO2 (eCO2) on berry development and bunch structure of two grapevine cultivars (Vitis vinifera L. cvs. Riesling and Cabernet Sauvignon) within the VineyardFACE (Free-Air Carbon Dioxide enrichment) experiment, using must analysis and non-invasive fluorescence sensor technology. Berry development was examined on five dates over three consecutive years by analyzing total soluble solids (TSS), pH, total acidity, organic acids, nutrition status, and non-invasive Multiplex measurements. Before harvest, secondary bunches were collected to examine bunch and berry parameters. Results showed that eCO2 had little impact on berry composition of Riesling and Cabernet Sauvignon during berry development, which could be related to bunch structure or single berry weight within single seasons. Elevated CO2 (eCO2) did not result in modified TSS accumulation during ripening but was directly related to the chlorophyll index SFR_R. Higher single berry weights (SBW), higher malic acid (MA), and lower tartaric acid (TAA) were examined at some stages during development of berries under eCO2 levels. Our study provides evidence that eCO2 did alter some bunch and berry parameters without a negative impact on fruit quality.

1. Introduction

As the atmospheric carbon dioxide (CO2) concentration is predicted to increase 1.5–3 ppm per year, an increase of 20% by the mid-21st century is expected [1]. Its role as one of the most relevant greenhouse gases and the close link toward an increase in global mean surface temperature lead to predictions of higher evapotranspiration and increasing risk of drought events. CO2 enrichment increases photosynthesis and, therefore, growth and yield of perennial plants. Within grapevines, this was already shown by various authors using different CO2 enrichment techniques such as open top chambers [2,3,4,5], Mini-FACE (Free-Air Carbon Dioxide enrichment) [6,7,8], or the recently reported VineyardFACE system [9,10]. In addition to open field studies on grapevines, CO2 enriched experiments in greenhouses were also conducted [11,12,13]. Even though the effect of eCO2 on grapevines was studied over the last few decades, the effect on fruit structure and grape quality is not sufficiently investigated.
In a recent VineyardFACE study, eCO2 did not alter bunch number per vine but increased yield, bunch weight, and berry number for cvs. Riesling and Cabernet Sauvignon, and it resulted in higher bunch compactness for Cabernet Sauvignon [9]. Moutinho-Pereira [3] also affirmed increased cluster weights in one of three experimental years for cv. Touriga Franca under eCO2, whereas Bindi et al. [6] reported an increased berry fresh weight for cv. Sangiovese. However, berry size was discussed to be related to berry and wine quality [14,15,16,17,18,19,20,21]. Hence, the quality of grapes grown under eCO2 might be affected.
In other perennial fruit crops like pears and sour oranges, enhanced fruit weight, volume, and diameter were detected under eCO2 [22,23,24]. Soluble solids content of pears was also increased under eCO2, but the effect depended on growth stages of the fruit [22,23]. Studies on annual crops under eCO2 concentrations showed increased fruit yield and berry size of strawberries and raspberries [25,26,27], while, in strawberries, sugar content and aroma compounds were increased, and the organic acid content was decreased [26]. This shows that eCO2 could positively affect fruit structure and fruit quality of several special crops.
Whether increasing CO2 concentration may not have negative effects on grape composition was discussed, but little [2,7,28]. Only the anthocyanin concentration of red grape varieties grown under arid climatic conditions was described to possibly increase with increasing CO2 concentration [7,28,29]. By comparing compositional variation in the context of abiotic parameters of 10 successive vintages in multiple Australian regions, a relationship between the annual CO2 increase and total anthocyanin concentration was reported [28]. In cv. Shiraz, Edwards et al. [5] showed that eCO2 treatment was advanced in phenological development and, therefore, in total soluble solids accumulation with an increasing effect over seasons. Acid and sugar concentrations of cv. Sangiovese were affected by eCO2, even though results did not show a consistent response over the ripening period [7]. Gonçalves et al. [2] detected higher pH and fructose concentration in berries of cv. Touriga Franca at the beginning of grape maturation in the first season and higher total acidity in grape juice in the second season under eCO2. So far, no continuous response in the composition of berries or must of different grape varieties grown under eCO2 concentration over a longer period is described.
Therefore, the main objective of this study was to examine the effect of eCO2 within the VineyardFACE experiment on berry development and bunch structure of two grapevine cultivars (Vitis vinifera L. cvs. Riesling and Cabernet Sauvignon) over three consecutive years by using standard must analysis and non-invasive fluorescence sensor technology on berries.

2. Materials and Methods

2.1. Field Site, Experimental Design and Plant Material

The study was conducted at the VineyardFACE experimental site (49°59′ N, 7°57′ E) of Hochschule Geisenheim University in Geisenheim, Rheingau, Germany. The VineyardFACE was established as a ring system with six rings and a total area of 0.5 hectares. Vines were trained into a vertical shoot positioning system (VSP) and canes were pruned to five nodes per square meter. Rows were north–south-orientated, while vine spacing was 0.9 m within rows and 1.8 m between rows. Two cultivars were used, Vitis vinifera L. cv. Riesling (clone 198–30 Gm) grafted on rootstock SO4 (clone 47 Gm) and L. cv. Cabernet Sauvignon (clone 170) grafted on rootstock 161–49 Couderc.
The VineyardFACE experiment was set up with two CO2 treatments, ambient (aCO2, 400 ppm) and elevated (eCO2, +20% of the aCO2 treatment), which were replicated as three rings. Each ring consisted of seven rows, which were planted alternately with Riesling and Cabernet Sauvignon. Since 2014, vines were fumigated with eCO2 from sunrise to sunset over the three years of experiment. Only the three inner rows of each ring were used for data collection with n = 15 vines per ring of Riesling and n = 16 vines of Cabernet Sauvignon. A detailed description of the VineyardFACE experiment and the CO2 distribution was presented previously [9].

2.2. Weather Conditions

The climate conditions in Geisenheim are characterized by a temperate oceanic climate with mild winters and warm summers represented by an average annual air temperature of 10.5 °C (long-term average from 1981–2010) and a mean annual rainfall of 543 mm.
Weather data were recorded from a weather station located at the VineyardFACE site. Precipitation, daily mean air temperatures, and number of heat days (>30 °C) for the growing seasons 2014, 2015, and 2016 are shown in Table 1. The driest year was 2015, showing the lowest precipitation and highest number of heat days.

2.3. Berry Development Sampling

To analyze must quality parameters, berries were collected with a starting point around veraison (mid-August) to harvest date five times per year. From each variety, 30 representative berries were collected biweekly (15 west side, 15 east side) of the three inner rows to get 3 × 30 berries per FACE ring. After sampling, berries were weighted determining average single berry weight by dividing the bulk weight by the number of berries. Berry samples were stored in the fridge at 4 °C overnight and were analyzed the morning after.

2.4. Berry Analysis

Non-invasive measurements of 19 berries per 30 berries were conducted in the lab directly after berry sampling by using a hand-held optical sensor based on chlorophyll fluorescence (Multiplex Research®, Force-A, Orsay, France) as described previously [30,31]. The spectroscopic index SFR_R (simple fluorescence ratio after red excitation) as a chlorophyll index was calculated according to Ghozlen et al. [30]. The SFR_R index was related to total soluble solids (TSS).
Juice of berry samples was obtained using a pressure-controlled sampling press at 1 bar (Longarone 85, QS System GmbH, Norderstedt, Germany). Must was collected in 50 mL tubes and centrifuged (5430R, Eppendorf AG, Hamburg, Germany) at 7830 rpm for 5 min at 20 °C. Must was analyzed for TSS (° Brix) using a handheld refractometer (HRKL32, Krüss, Hamburg, Germany). Total acidity (TA) and pH were measured with a 719 S Titrino and an additional 778 Sample Processor (Metrohm, Hamburg, Germany). The concentration of amino acids of the juice was determined according to the N-OPA procedure of Dukes and Butzke [32]. Briefly, this method involves derivation of α-amino acid groups with o-phthaldialdehyde/N-acetyl-l-cysteine (OPA/NAC) reagent. Absorbance was measured at 335 nm with an UV/VIS spectrometer (Specord 500, Analytik Jena AG, Jena, Germany). Results were calculated as mg of isoleucine equivalent/L from a standard curve.
Analyses of organic acids (tartaric acid, malic acid, citric acid, and shikimic acid) were performed using high performance liquid chromatography (HPLC) according to Schneider et al. [33] and modified by Knoll et al. [34] with the following changes: Firstly, 5 µL of sample was injected into the Agilent Technologies 1100 series liquid chromatograph equipped with a multiwave-length detector (MWD) and analyzed using an Allure® Organic Acid column (250 mm × 4.6 mm inside diameter) (Restek GmbH, Bad Homburg, Germany) with a Security GuardTM Cartridge C18 4 × 3 mm (Phenomenex, Aschaffenburg, Germany). As an eluent, distilled water was used with 0.0139% sulfuric acid and 0.5% (v/v) ethanol. The column was operated at 46 °C with an eluent flow rate at 0.6 mL/min. Eluting compounds were detected by UV absorbance at 210 nm. Organic acids are reported as single values because samples were taken as triplicates per single FACE ring.

2.5. Bunch Structure Measures

One day prior to harvest, four (2014) and six (2015, 2016) bunches per FACE ring were collected to examine bunch parameters for both cultivars. Bunches were sampled at the second position of the shoot along the cane, excluding first and last shoot position. Only healthy bunches were taken for Riesling in 2014, 2015, and 2016, and Cabernet Sauvignon in 2015 and 2016. Length, width, and bunch weight were recorded. Afterward, bunches were destemmed to record the number of berries and total berry weight (TBW). Berries of each bunch were classified according to their diameter with a stainless-steel sieve column (ISO 3310-1). The column provided the following seven groups of berry sizes: (1) <6.3 mm, (2) 6.3–8 mm, (3) 8–10 mm, (4) 10–12.5 mm, (5) 12.5–14 mm, (6) 14–16 mm, and (7) 16–18 mm. For each bunch, the berry number of each berry size was counted.

2.6. Statistical Analysis

Statistical analysis was performed with the statistical software R, version 3.6.1 [35]. Data for all continuous numerical measures from the berry and bunch analysis were tested for each variety (Riesling, Cabernet Sauvignon) using Bayesian generalized linear mixed model analyses (R-package brms, version 2.10.0) [36,37,38] accounting for the sampling structure and pseudo replications (block, ring) and their respective repeated measures in time (year or date). Fixed effect estimation included treatment (aCO2, eCO2), time (year or date), and their interaction. Focusing on the estimation of differences between treatments, time points were treated as factorial variables. For these measures, a Gamma distribution likelihood with a log-link function was assumed, accounting for deviations from a normal distribution, i.e., skewness, and the fact that all measures are restricted to positive values only, while assuming the variance to increase with the mean, which is typical for ecological data [39]. Weakly informative priors were set for the intercept and effect sizes.
Each model was set up to run four Markov chains of 8000 iterations each. With a warm-up phase of 4000 iterations, each posterior included 16,000 samples in total. Posterior predictions were used for both treatments to estimate the difference between aCO2 and eCO2 measures for each time point. Results included the probability (%) of the treatment effect being larger than zero by estimating the proportion of posterior predicted differences between eCO2 and aCO2 that was greater than zero. A significant difference, i.e., a high probability of a difference, was attested when this probability of the treatment effect was estimated to be above 90% (positive difference) or below 10% (negative difference). In addition, information was provided on the most probable point estimate by calculating the median difference and the 50% posterior highest density interval (HDI) that stands for the 50% most probable point estimates.
Count data on berry size classes were analyzed by Bayesian ordinal regression applying a mixed effects adjacent category model with category specific effects and a probit-link function [40]. Each analysis was based on the data of sampled bunches and split into yearly data sets. Again, controlling of sampling structure (block, ring, and bunch) was performed to estimate the treatment effect on the berry size distribution. By using default, uninformative priors, models were run with four chains each, with a total of 8000 iterations with 4000 warm-up iterations which were not included in the final samples. From model results, posterior predictions were calculated to estimate probabilities for sampling specific differences in categories between aCO2 and eCO2 single berry samples. In addition, the median of this difference is provided. No HDI was estimated for this discrete ordinal data.
Model quality and convergence were checked by visual comparison of the posterior distributions and the data, visual inspection of well-mixedness from trace plots of the Markov chains, and controlling a Rhat measure of below 1.01 [41]. The length of the Markov chains guaranteed adequate multivariate effective sample sizes [42] for a Monte Carlo standard error of below 5% for all models [43]. The ratio of estimated bulk and tail effective sample sizes (ESS) to the total number of samples was consistently kept above 0.1 for all model parameters.
Limiting the model complexity by only including CO2 treatment and year effects came with the consequence that other environmental factors, i.e., annual temperature cycle, precipitation, etc., might be confounded within the year effect and, thus, possible interactions could not be detected. Hence, higher residual errors are to be expected, which can cause higher uncertainties in posterior predictions. Furthermore, with only three independent repetitions per time point (three rings per CO2 treatment), uncertainty in HDI would also be affected; hence, we expect only consistent differences to be reliably detected when using the proposed 90% single-sided probability threshold.

3. Results

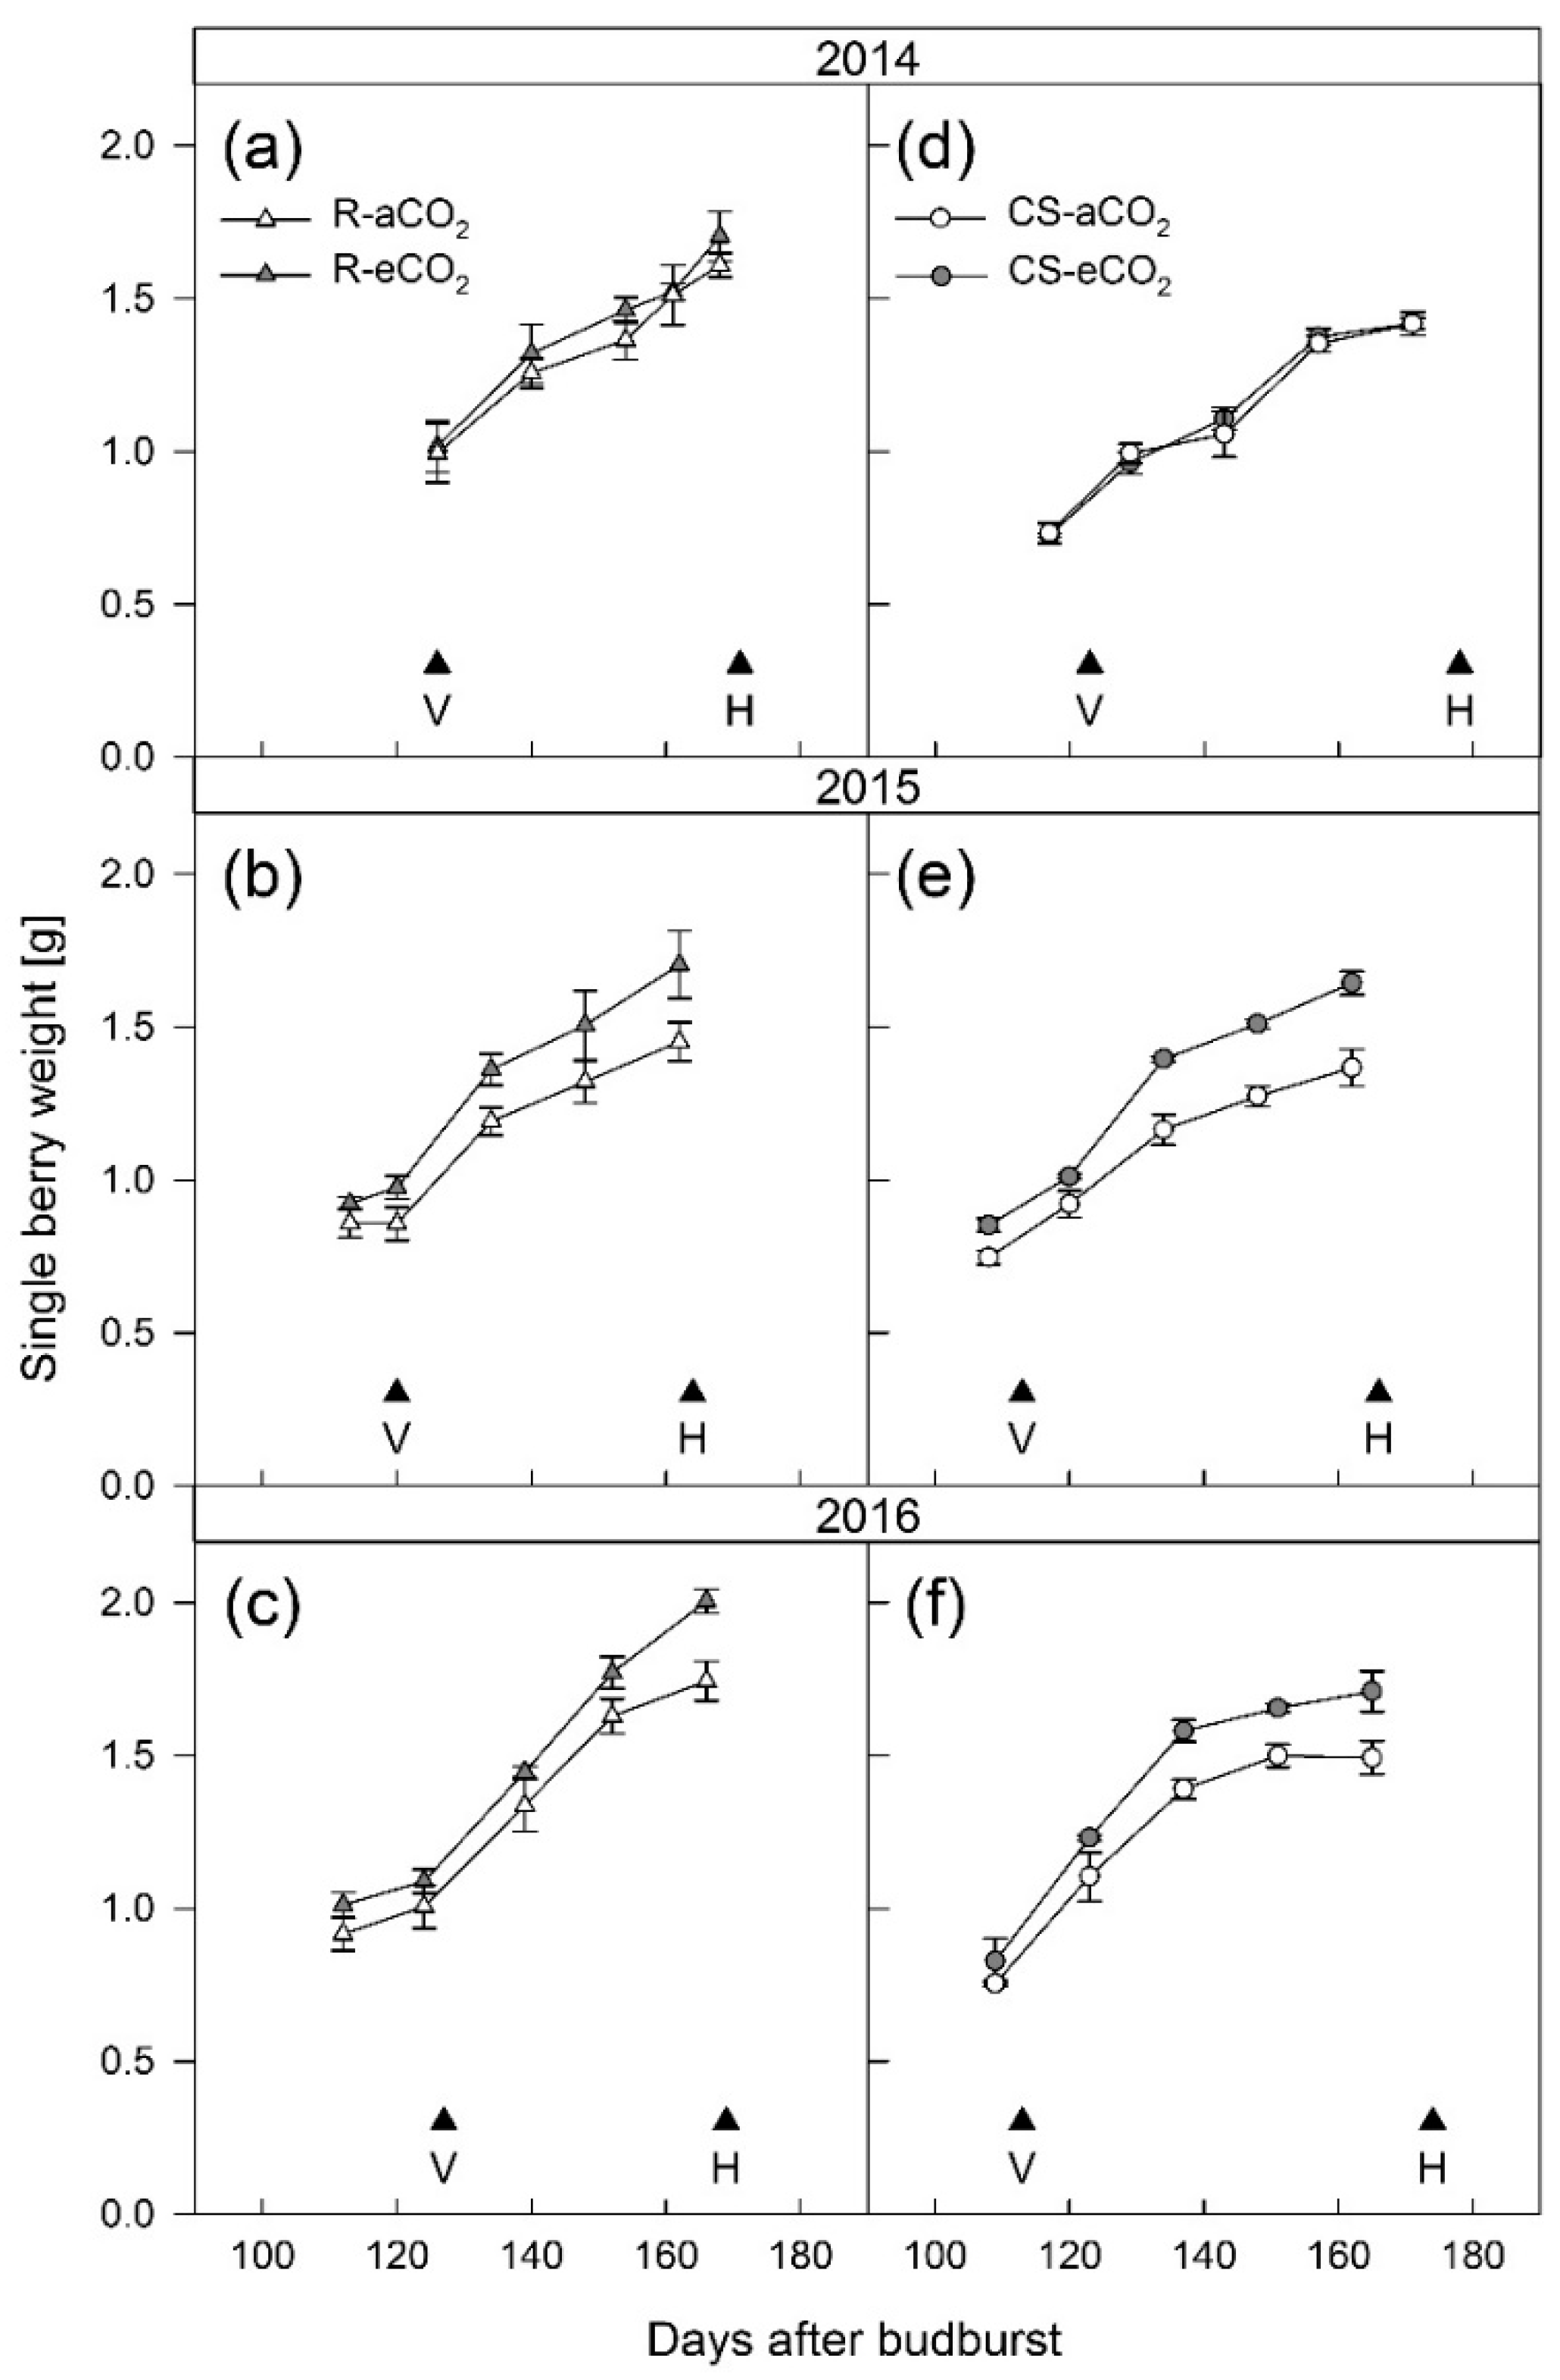
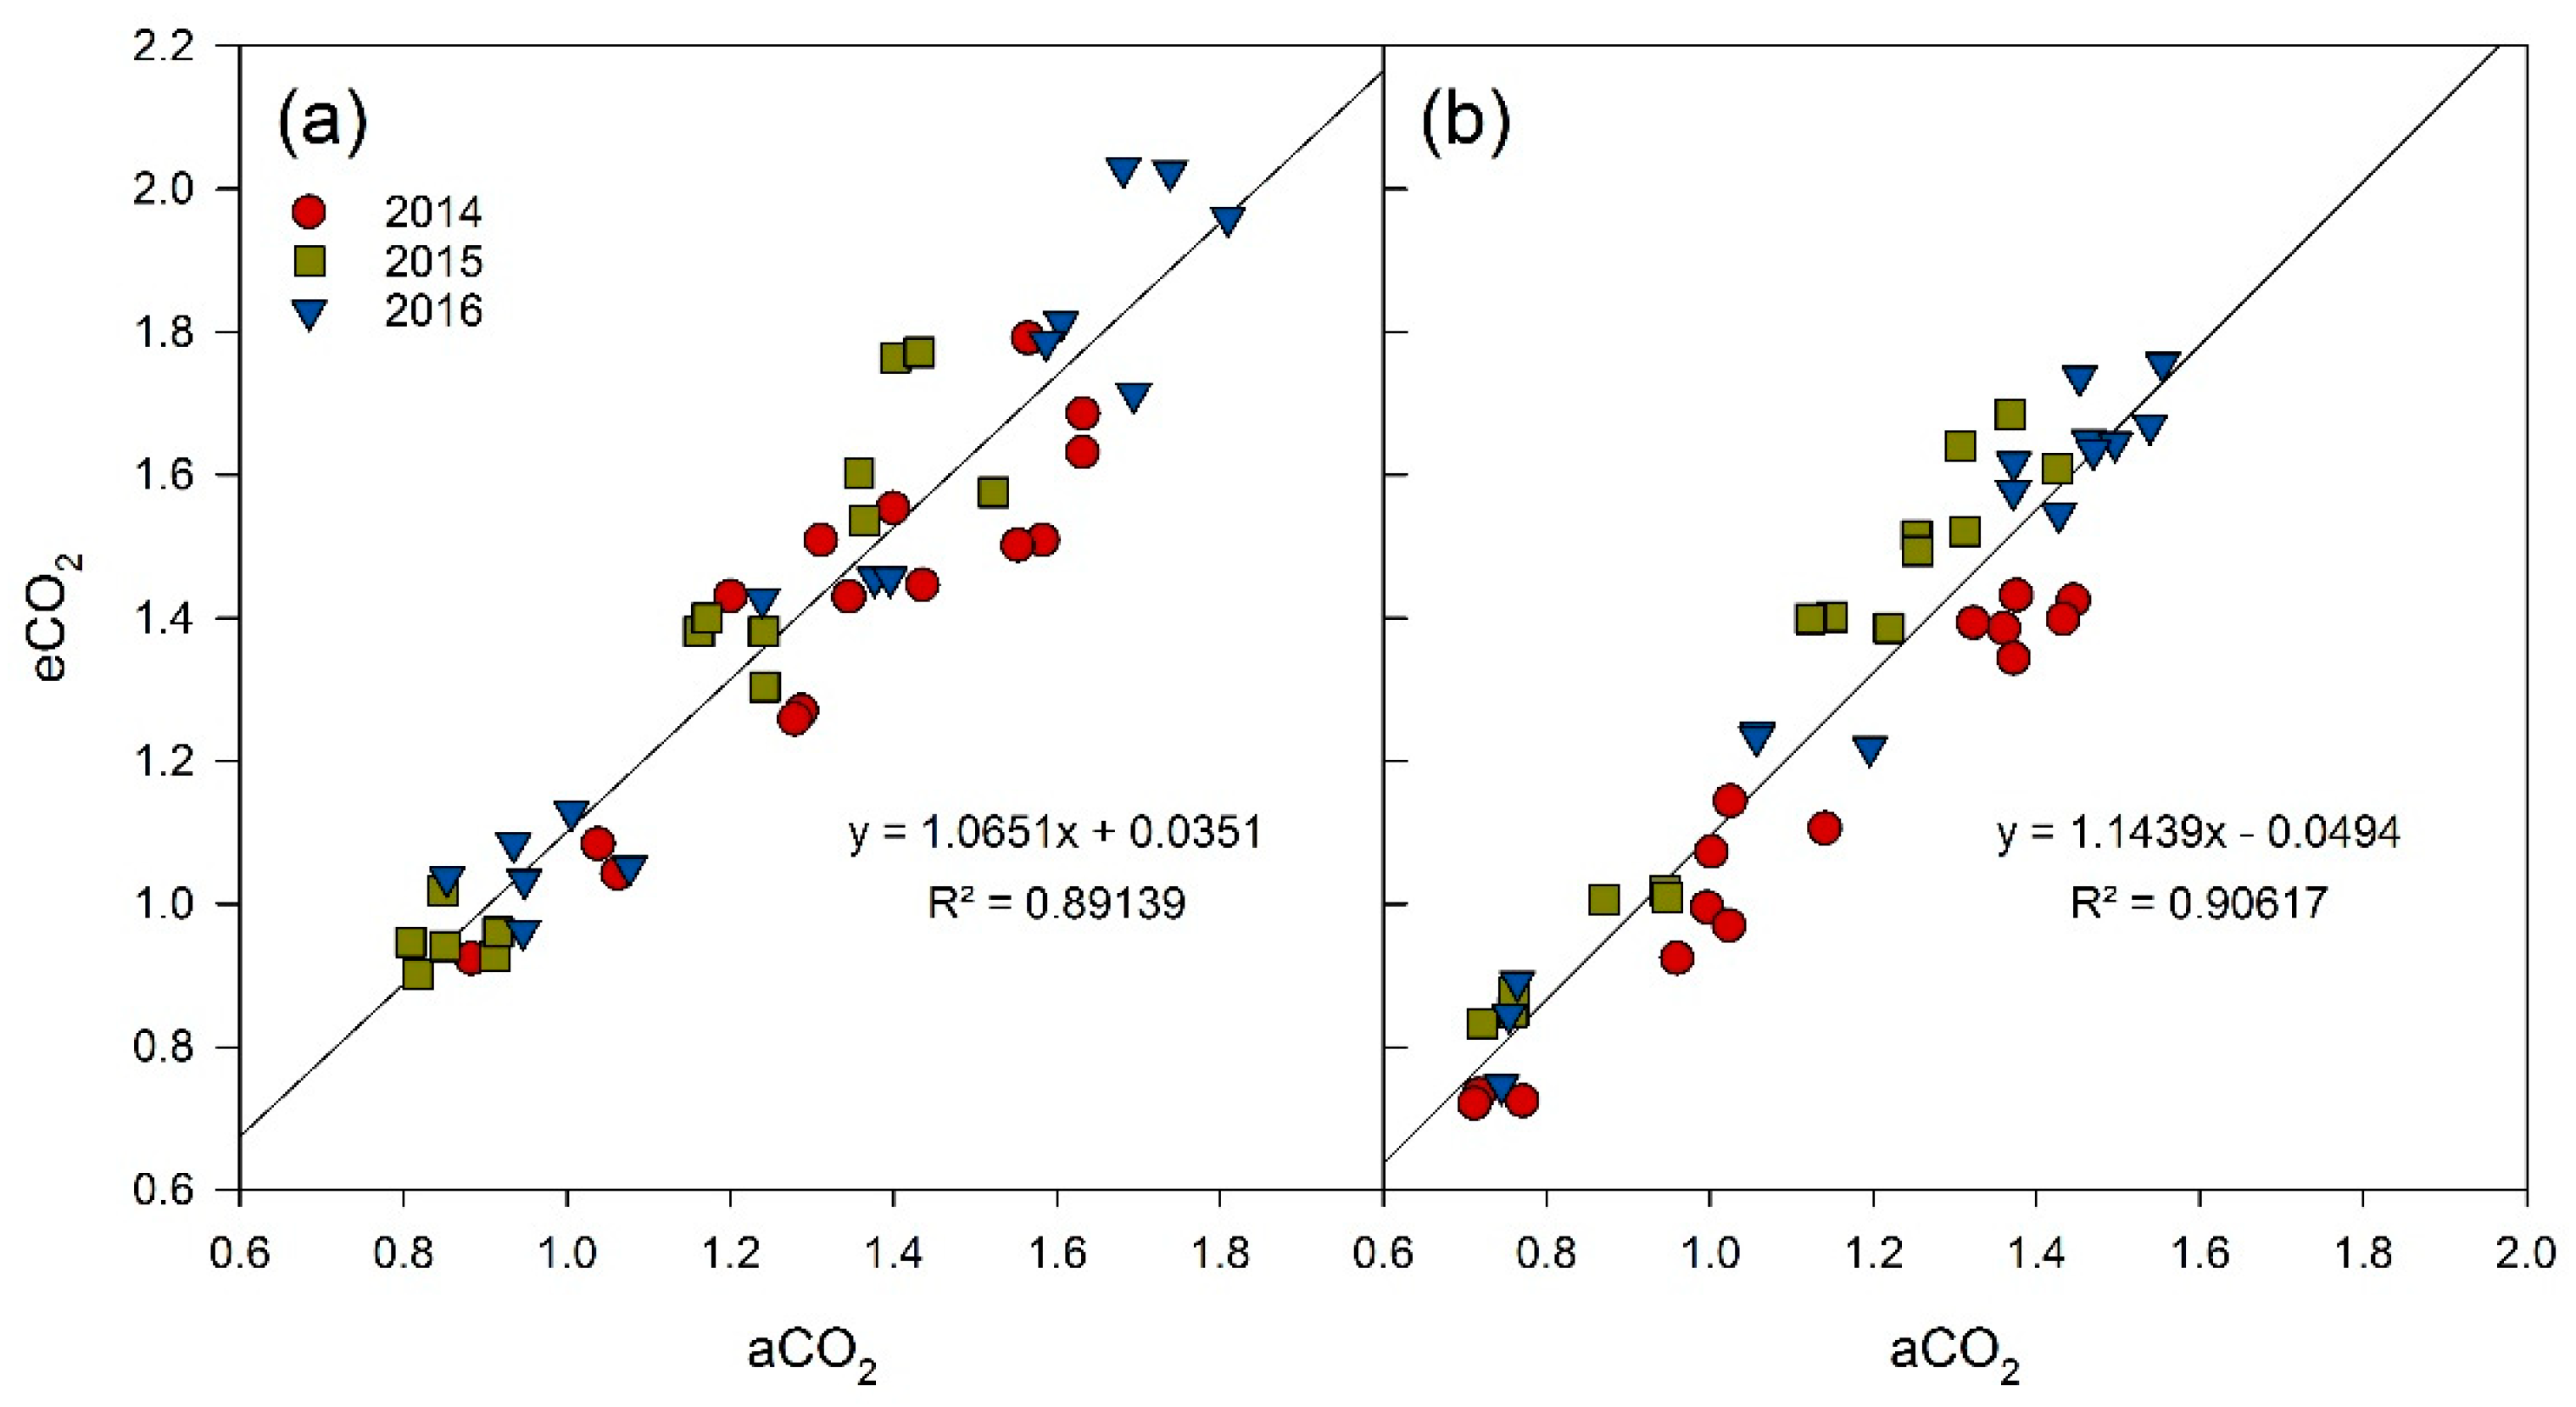
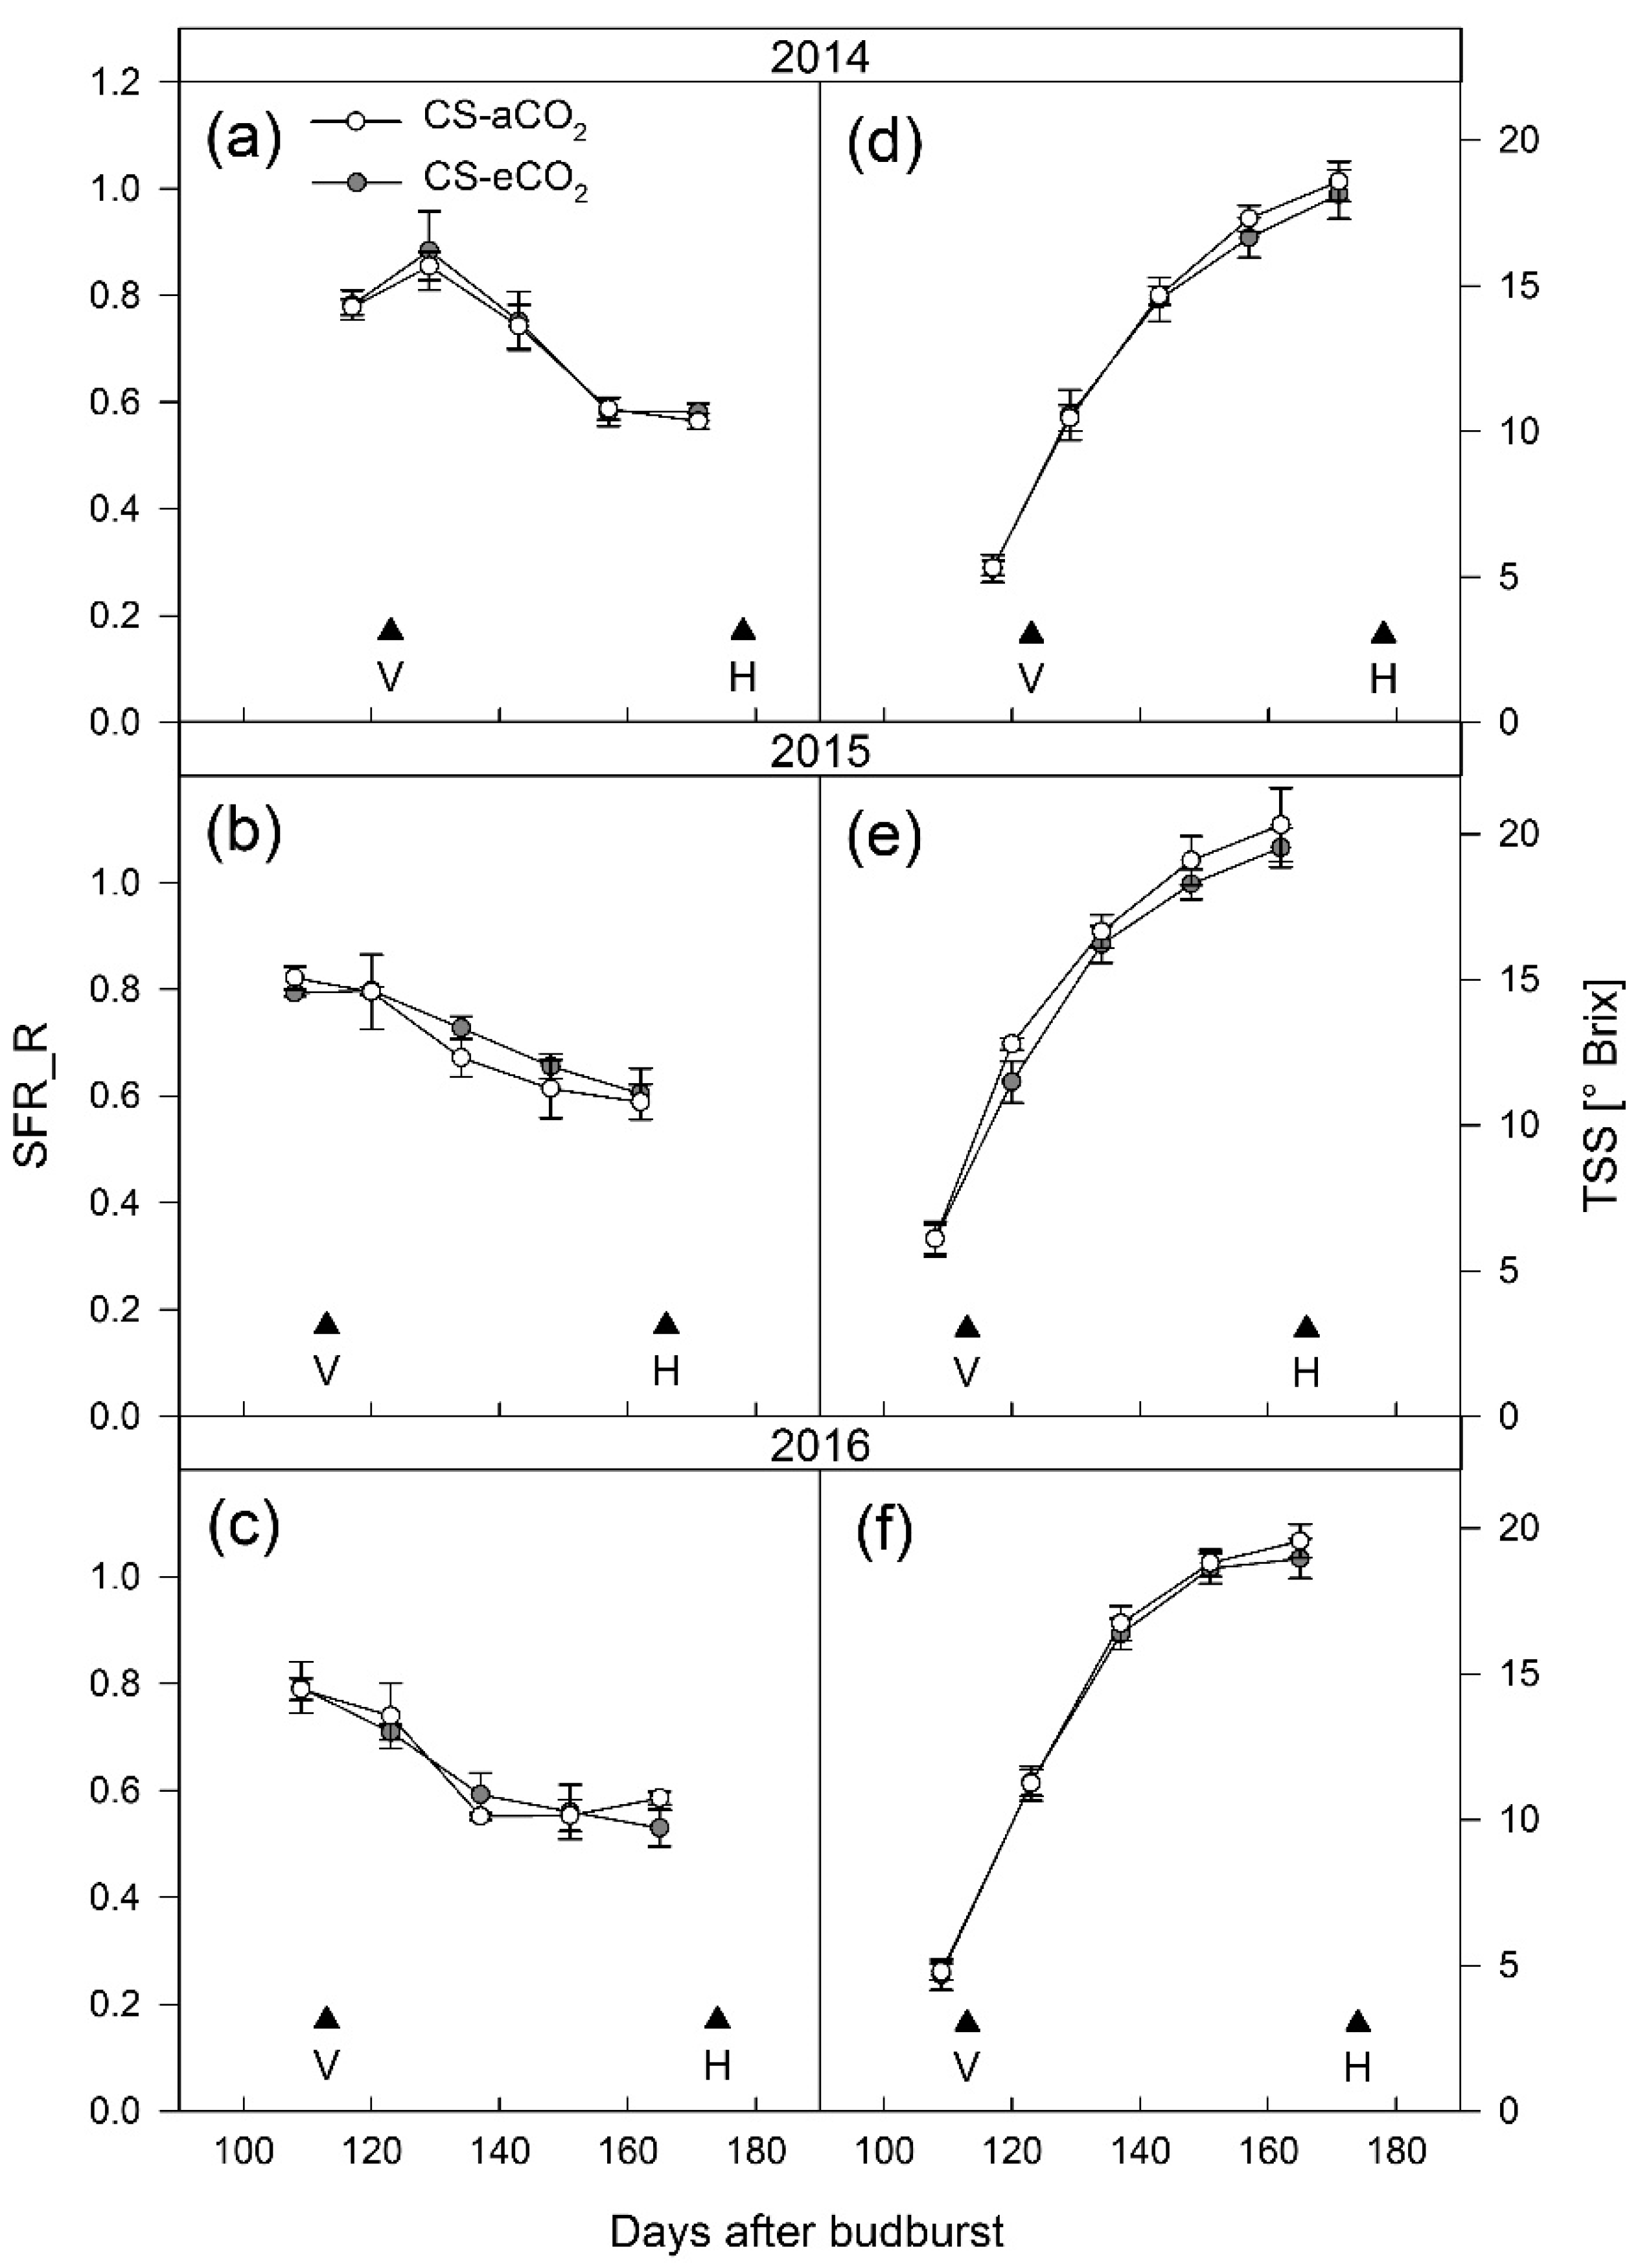
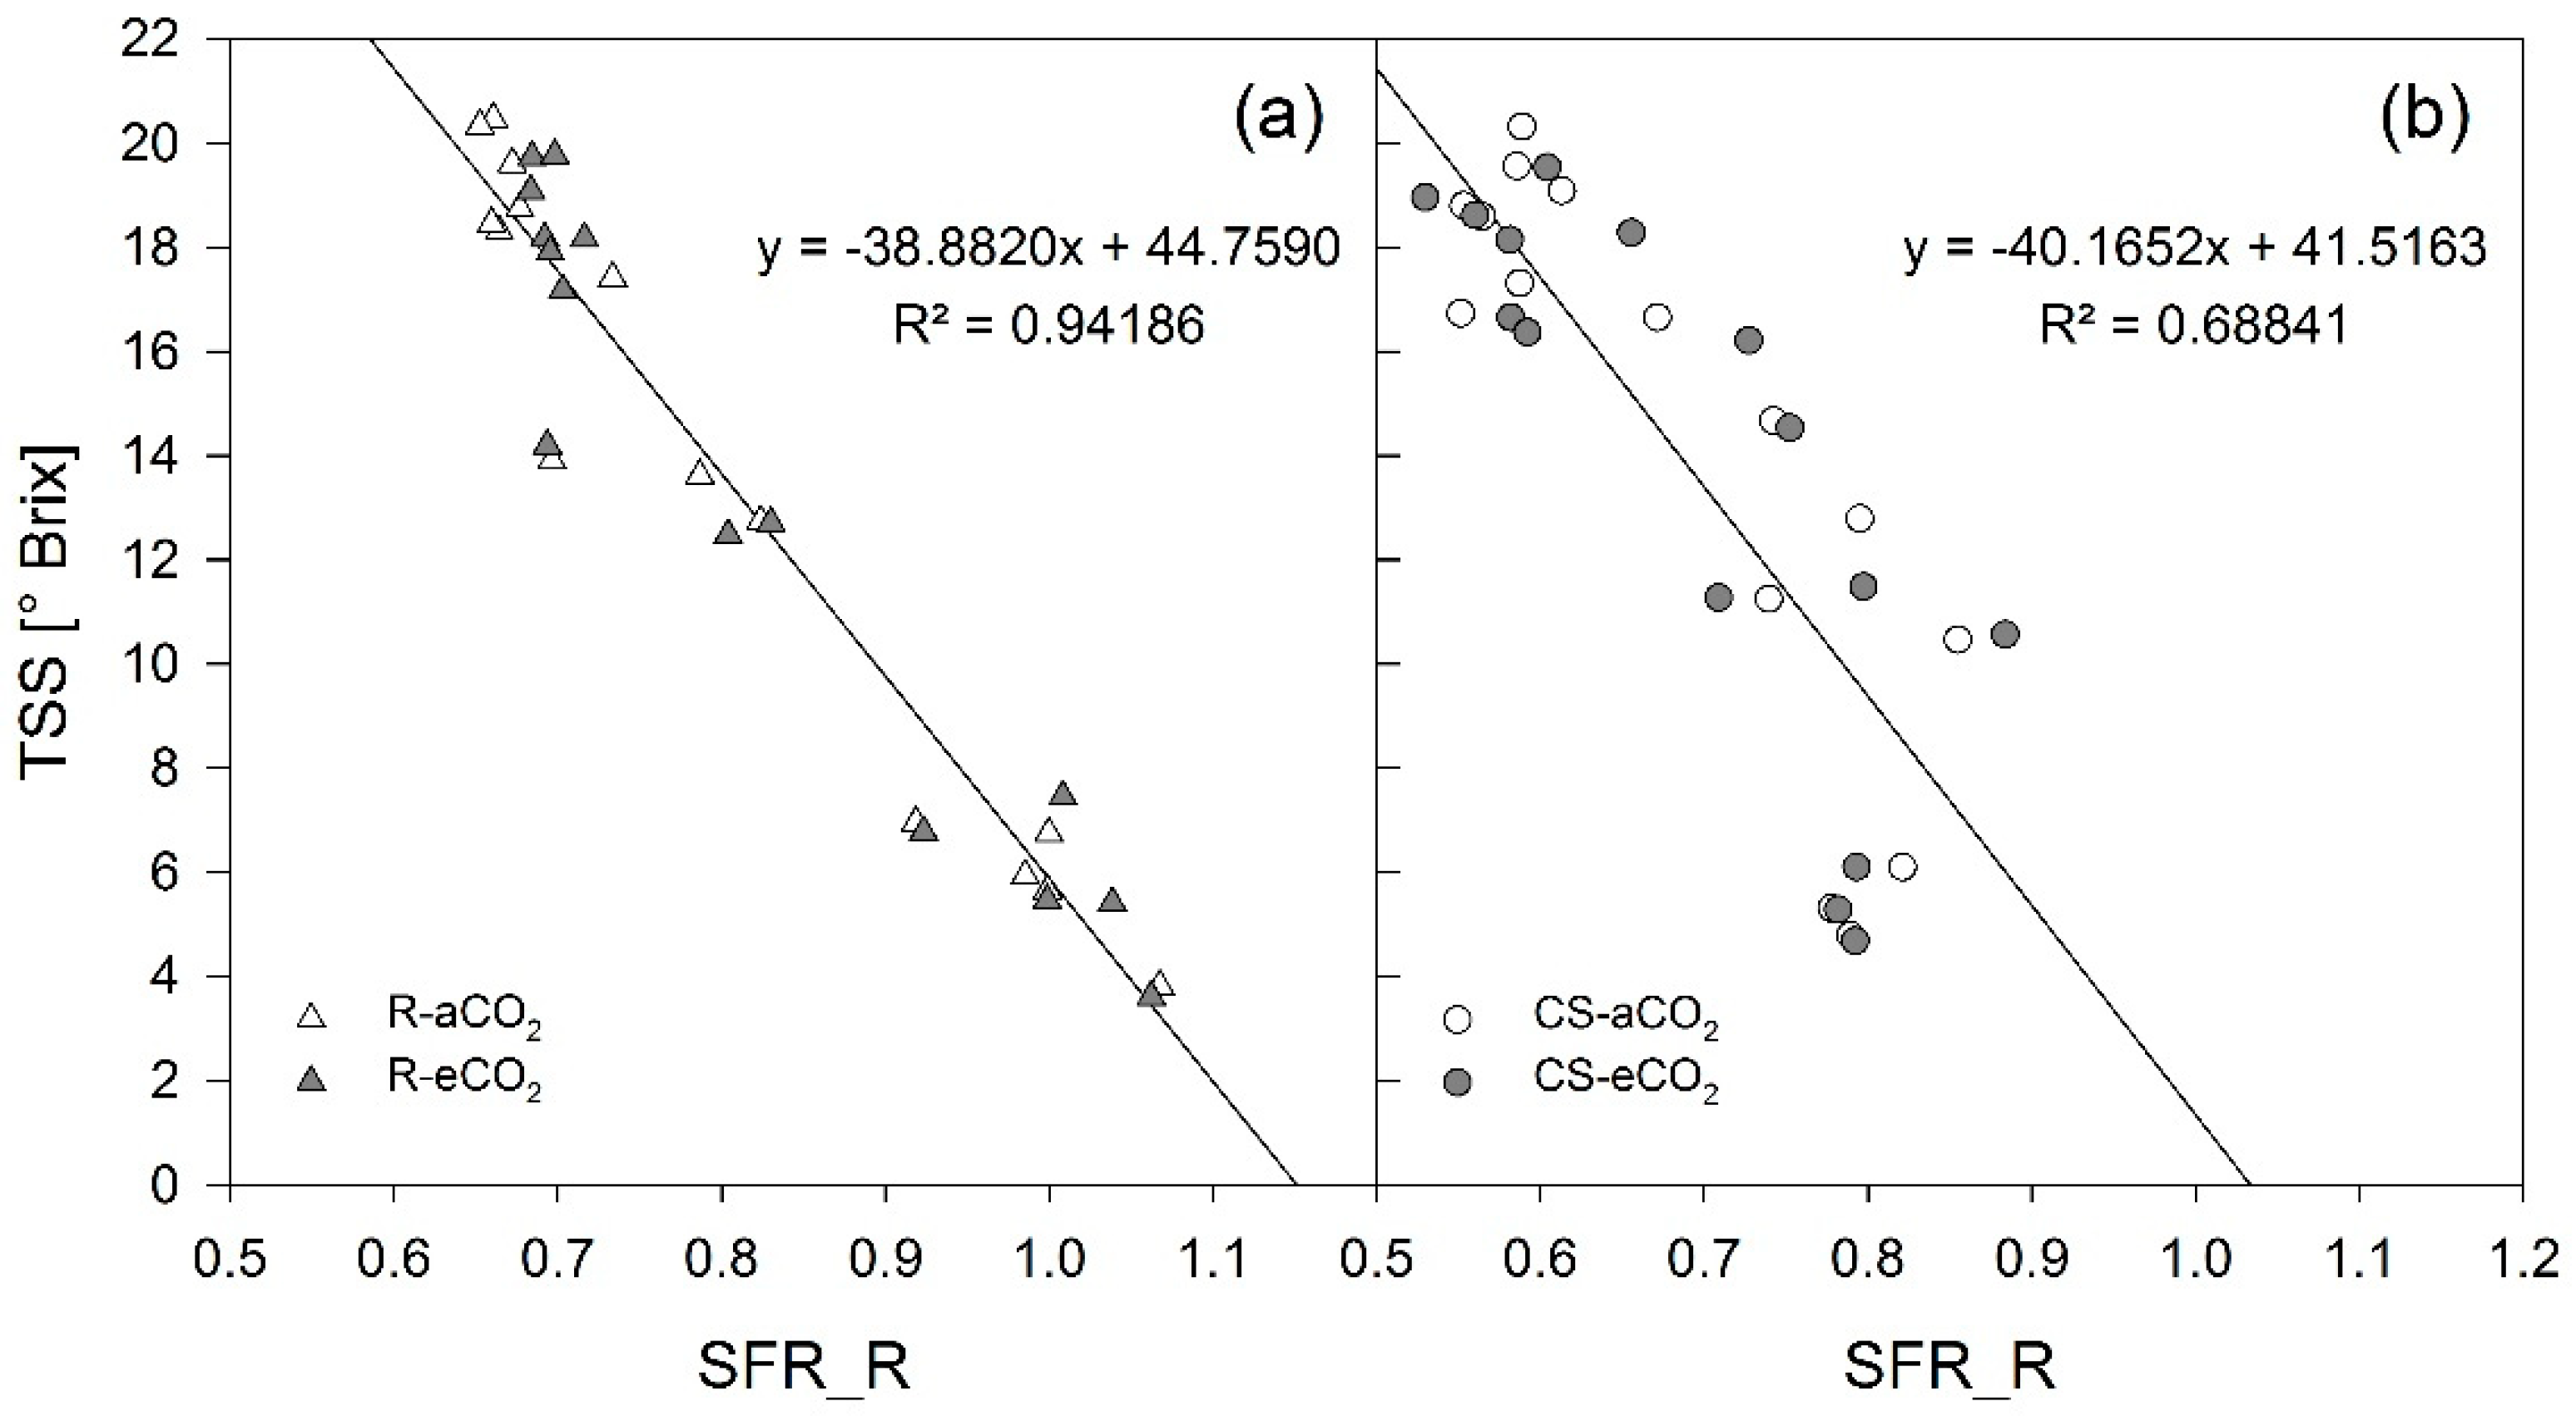
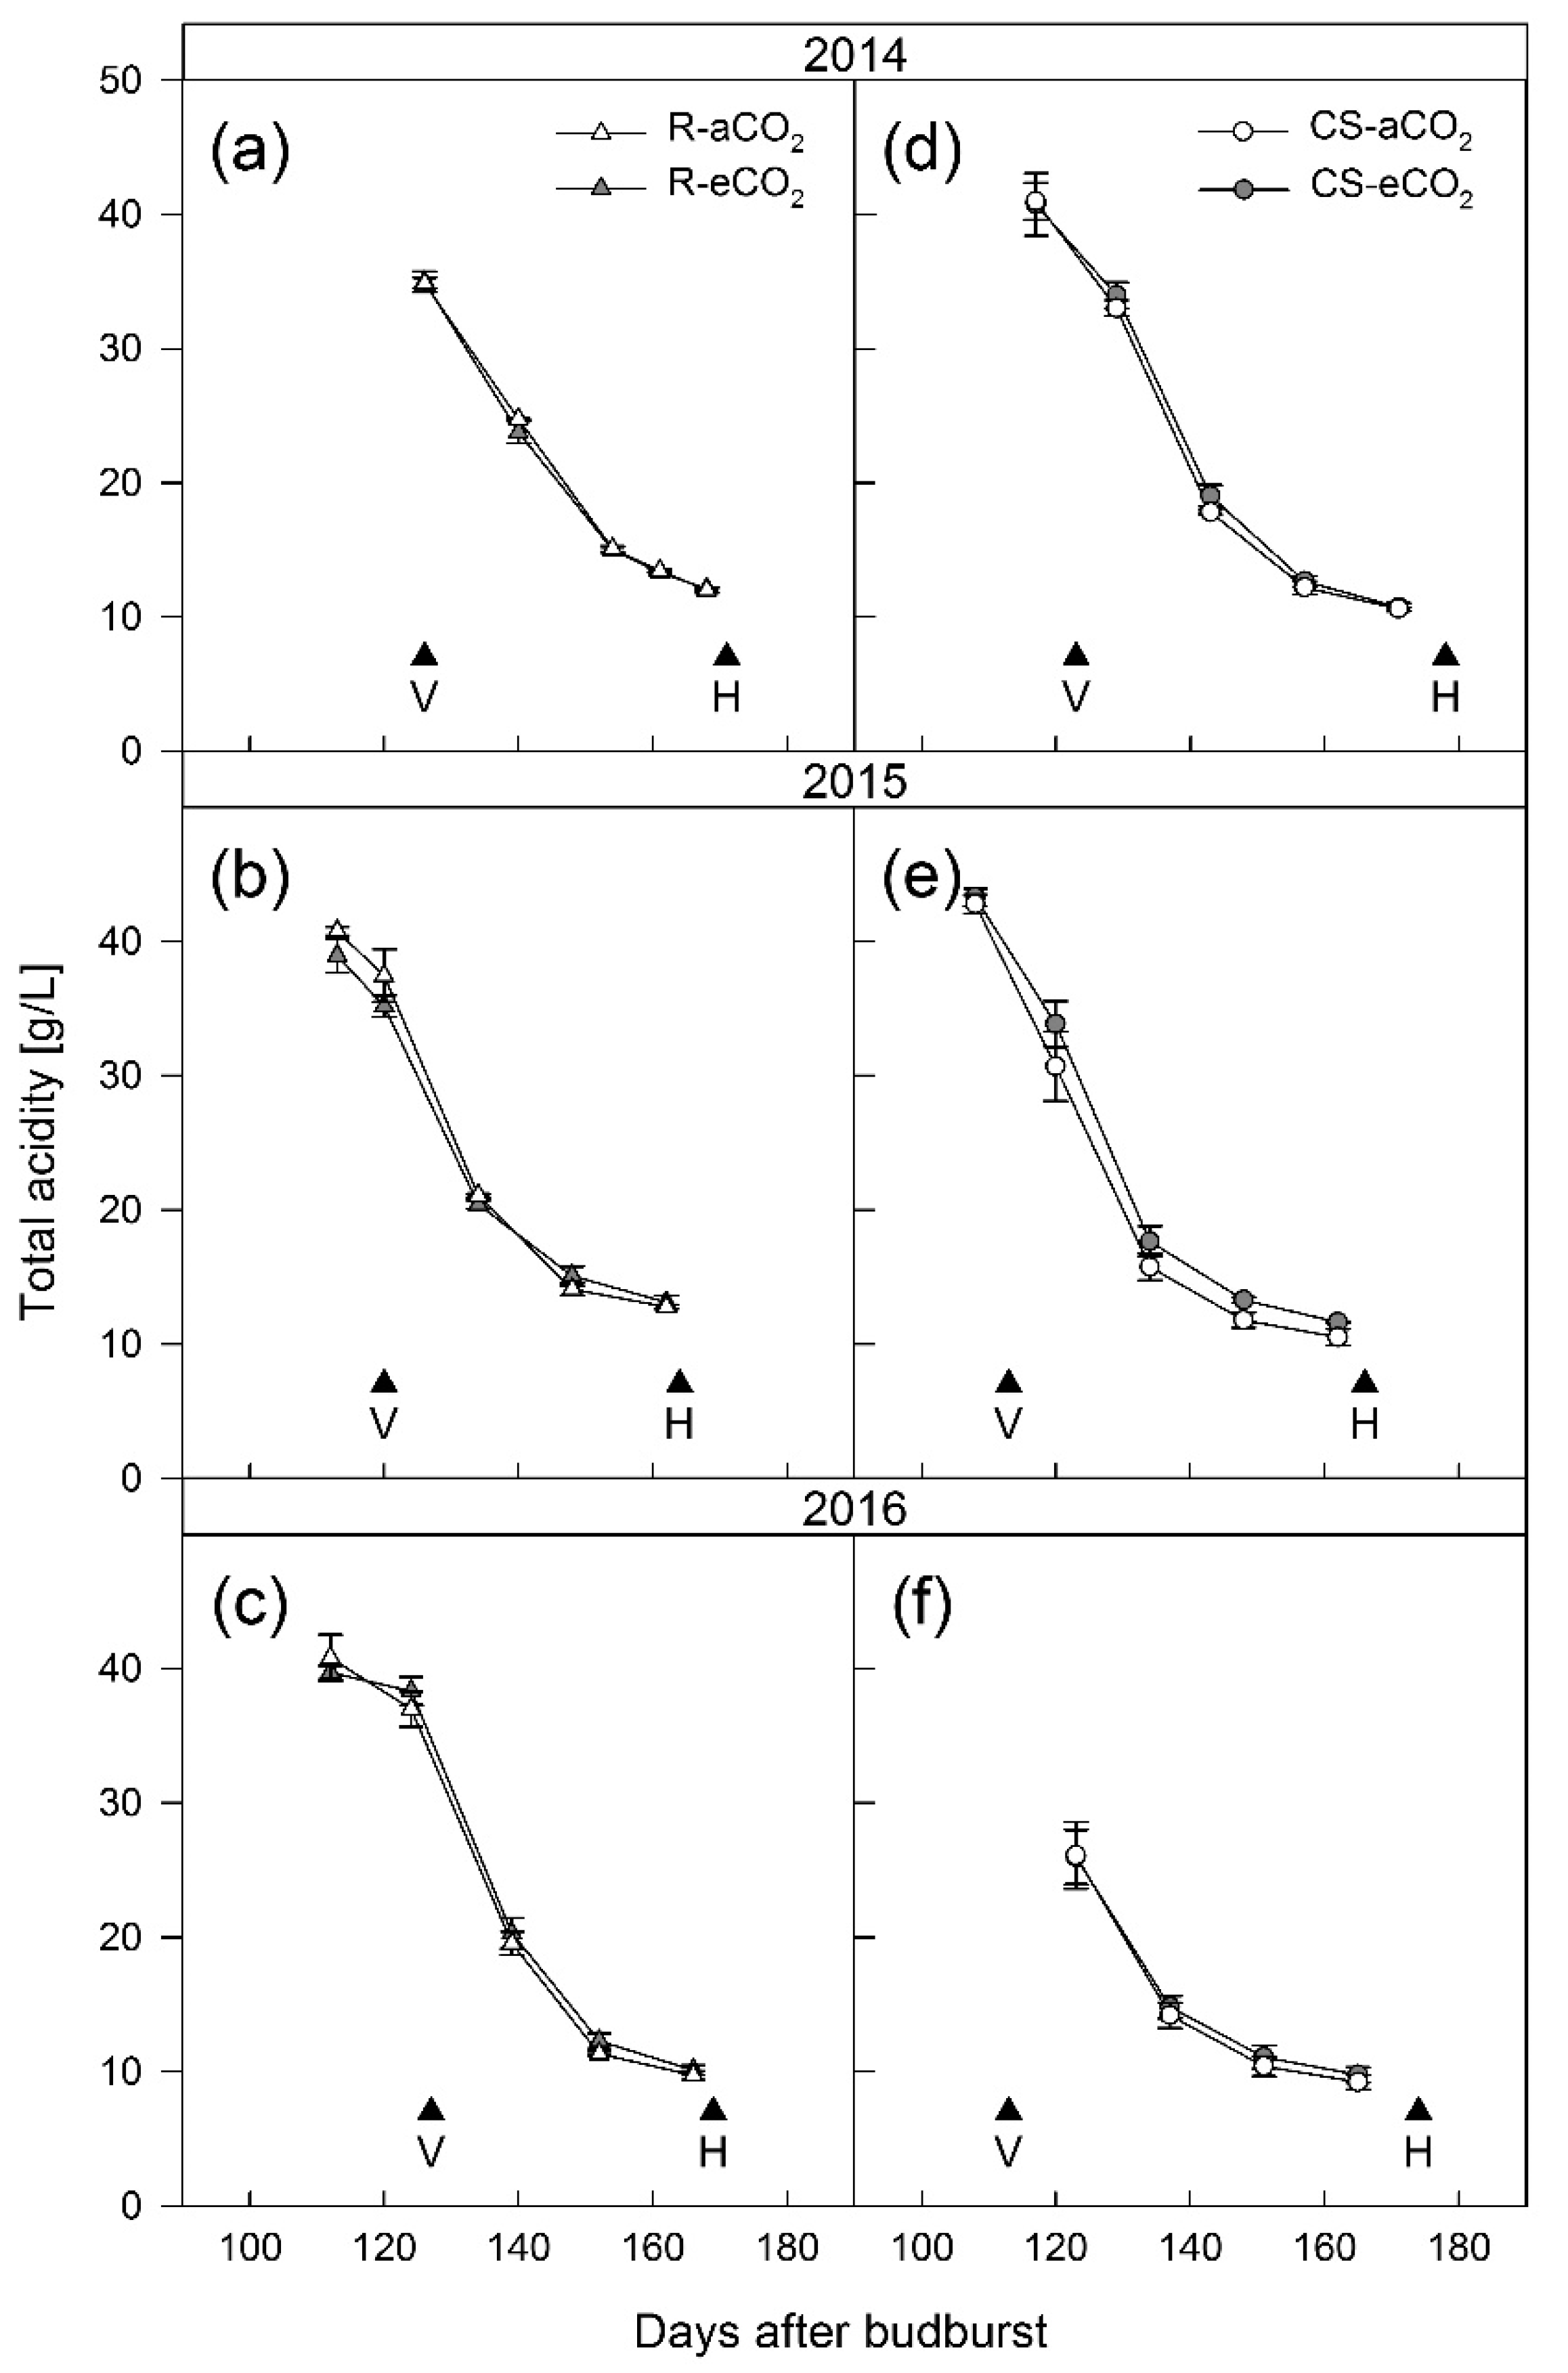
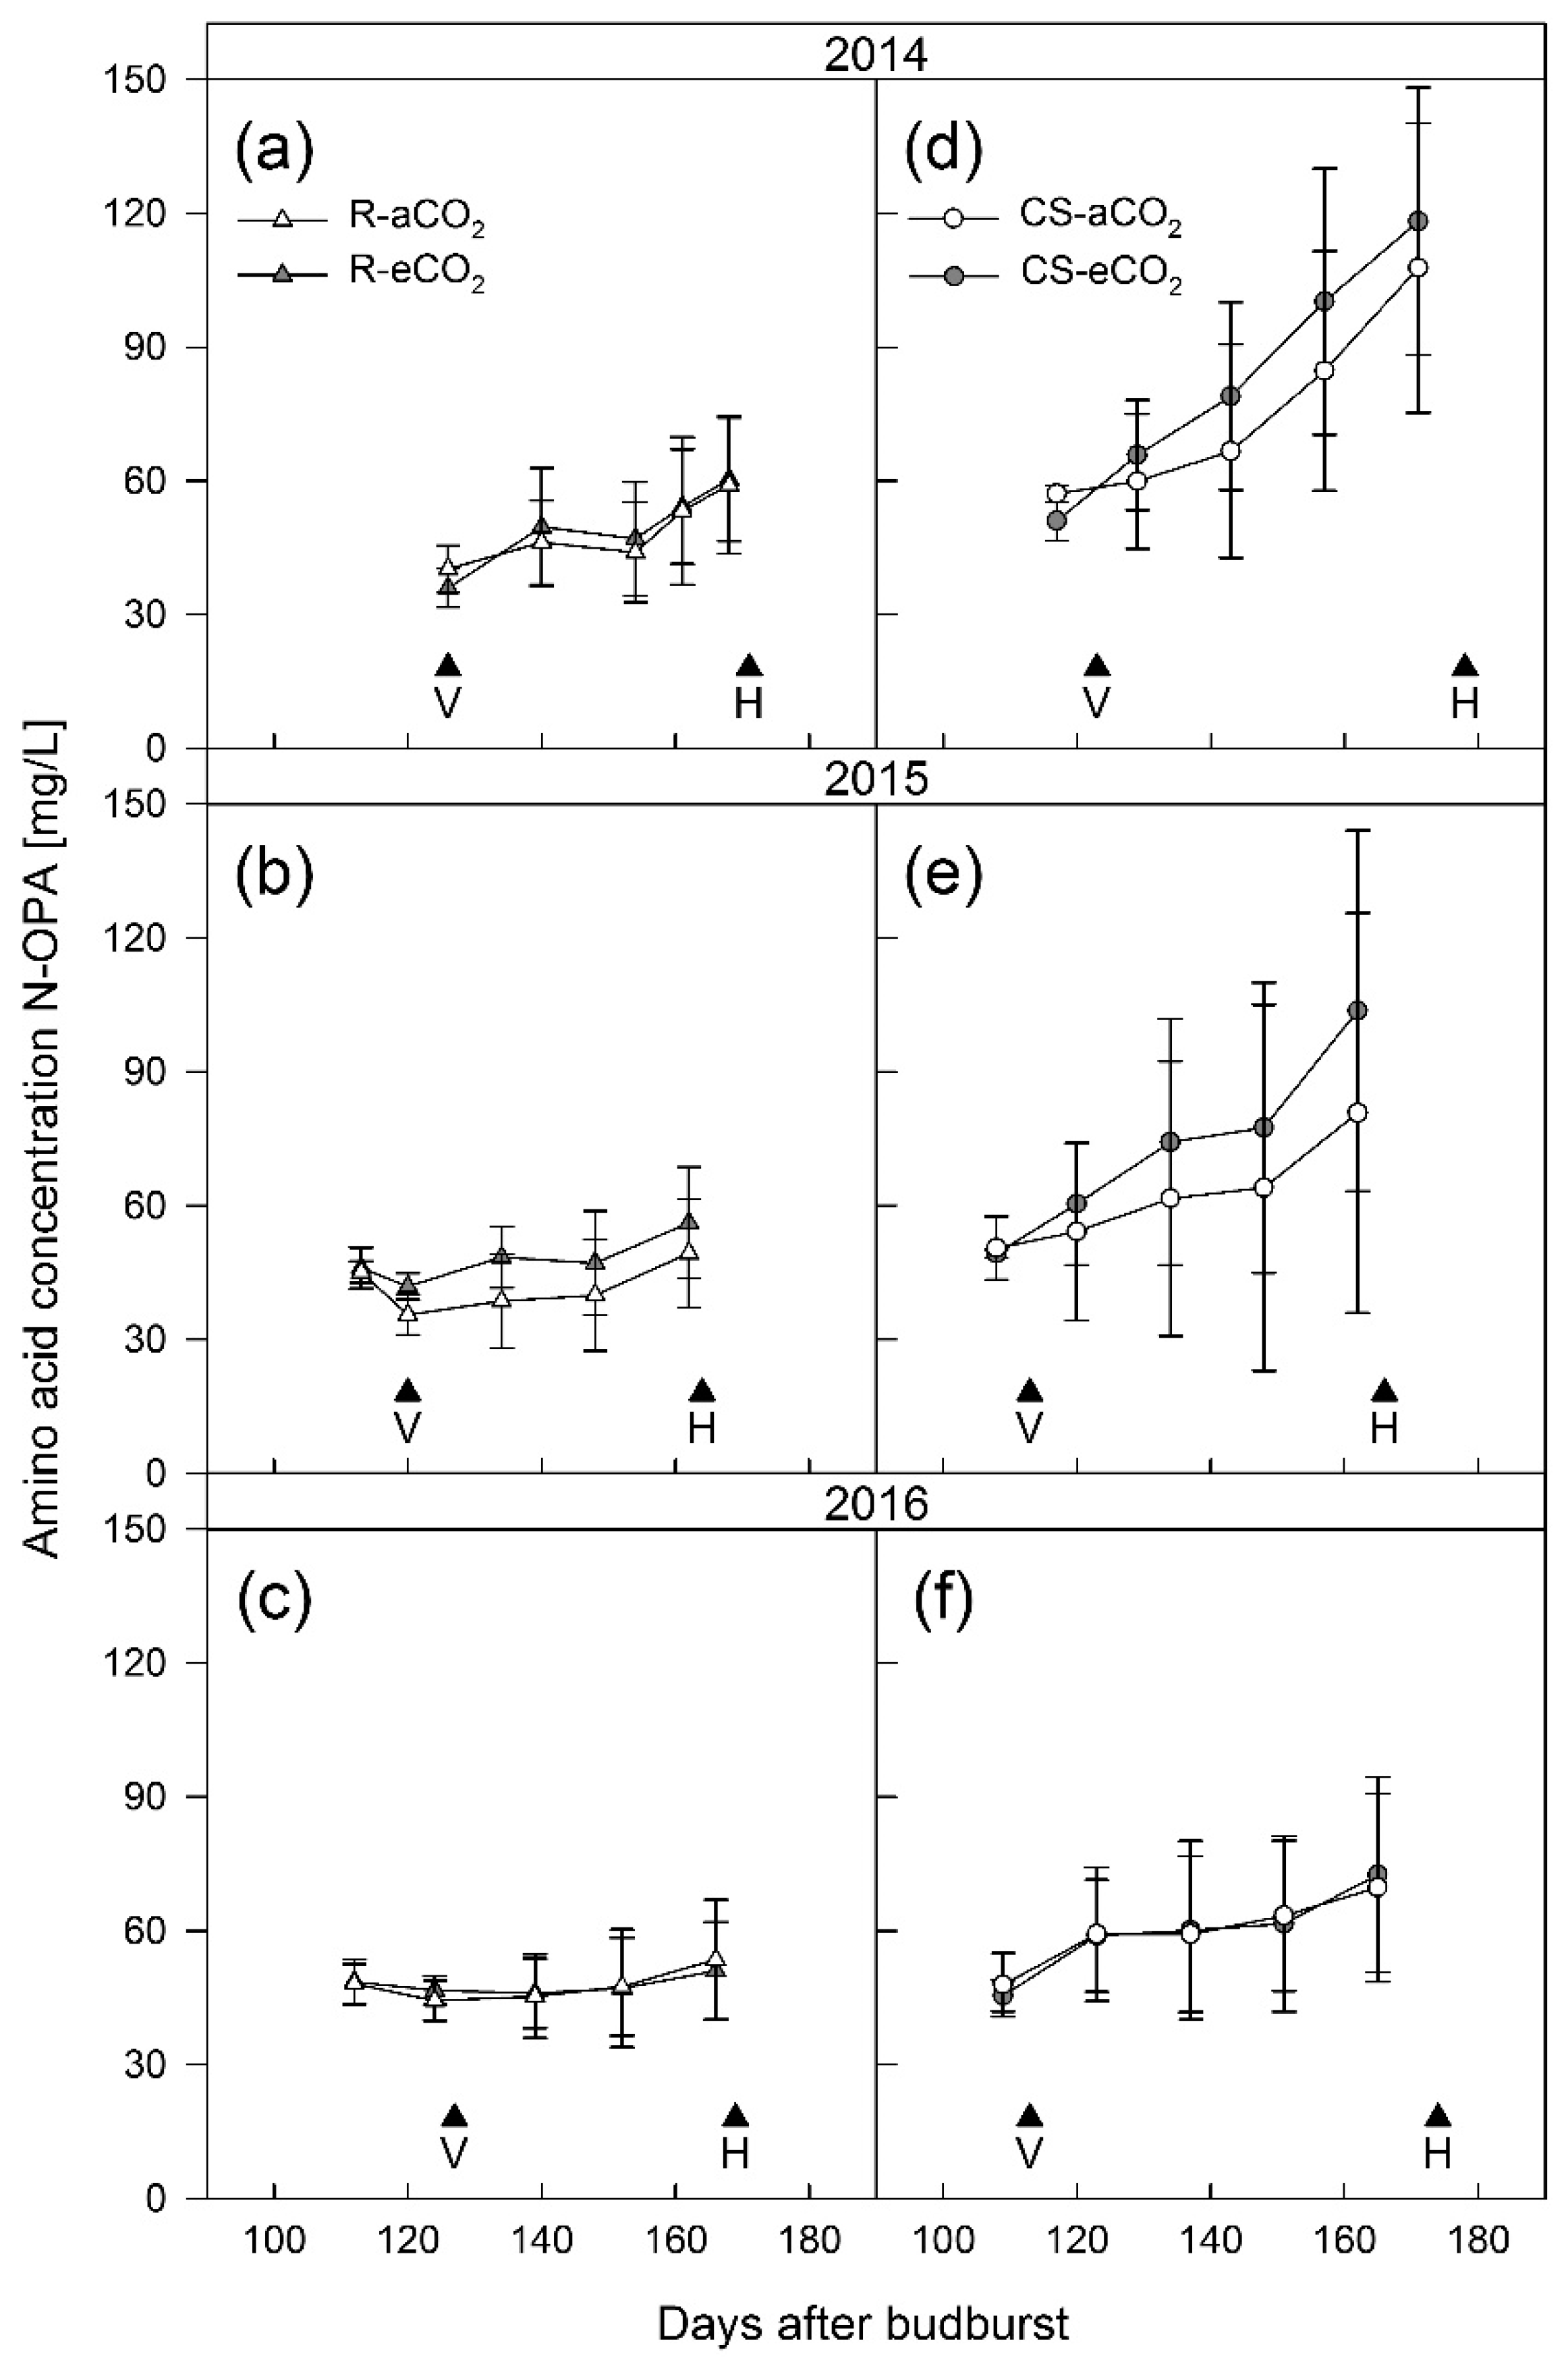
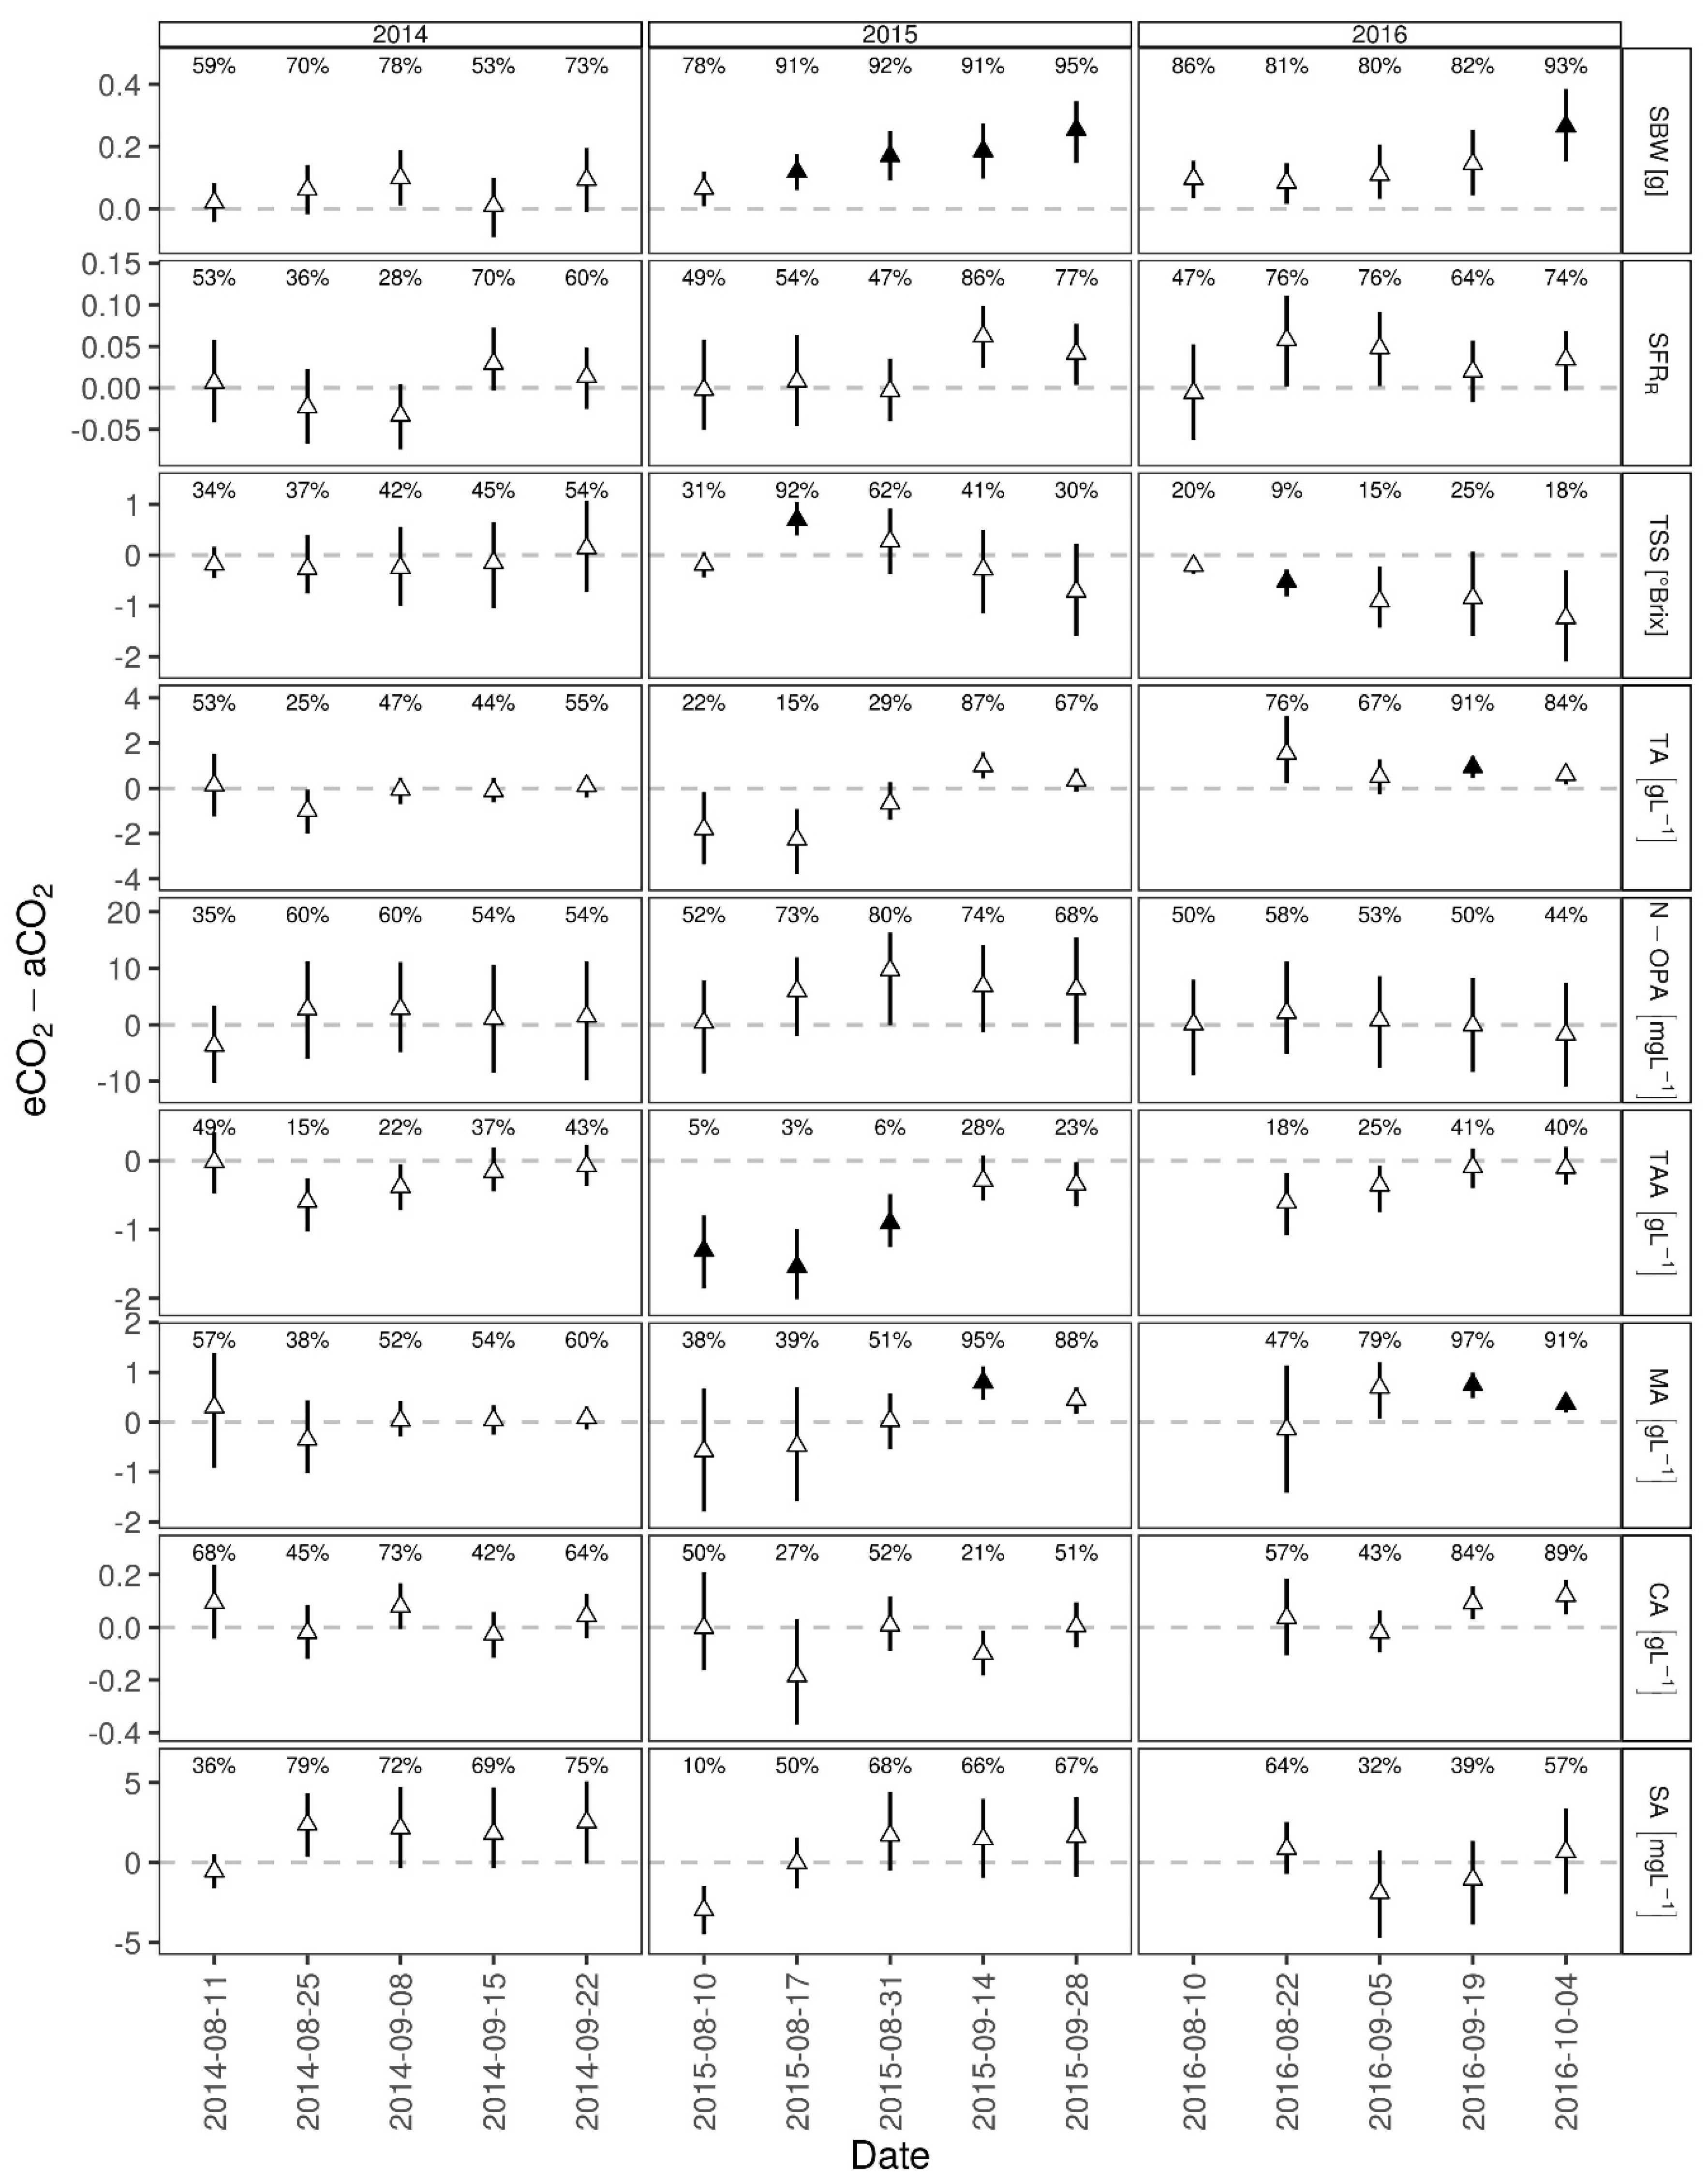
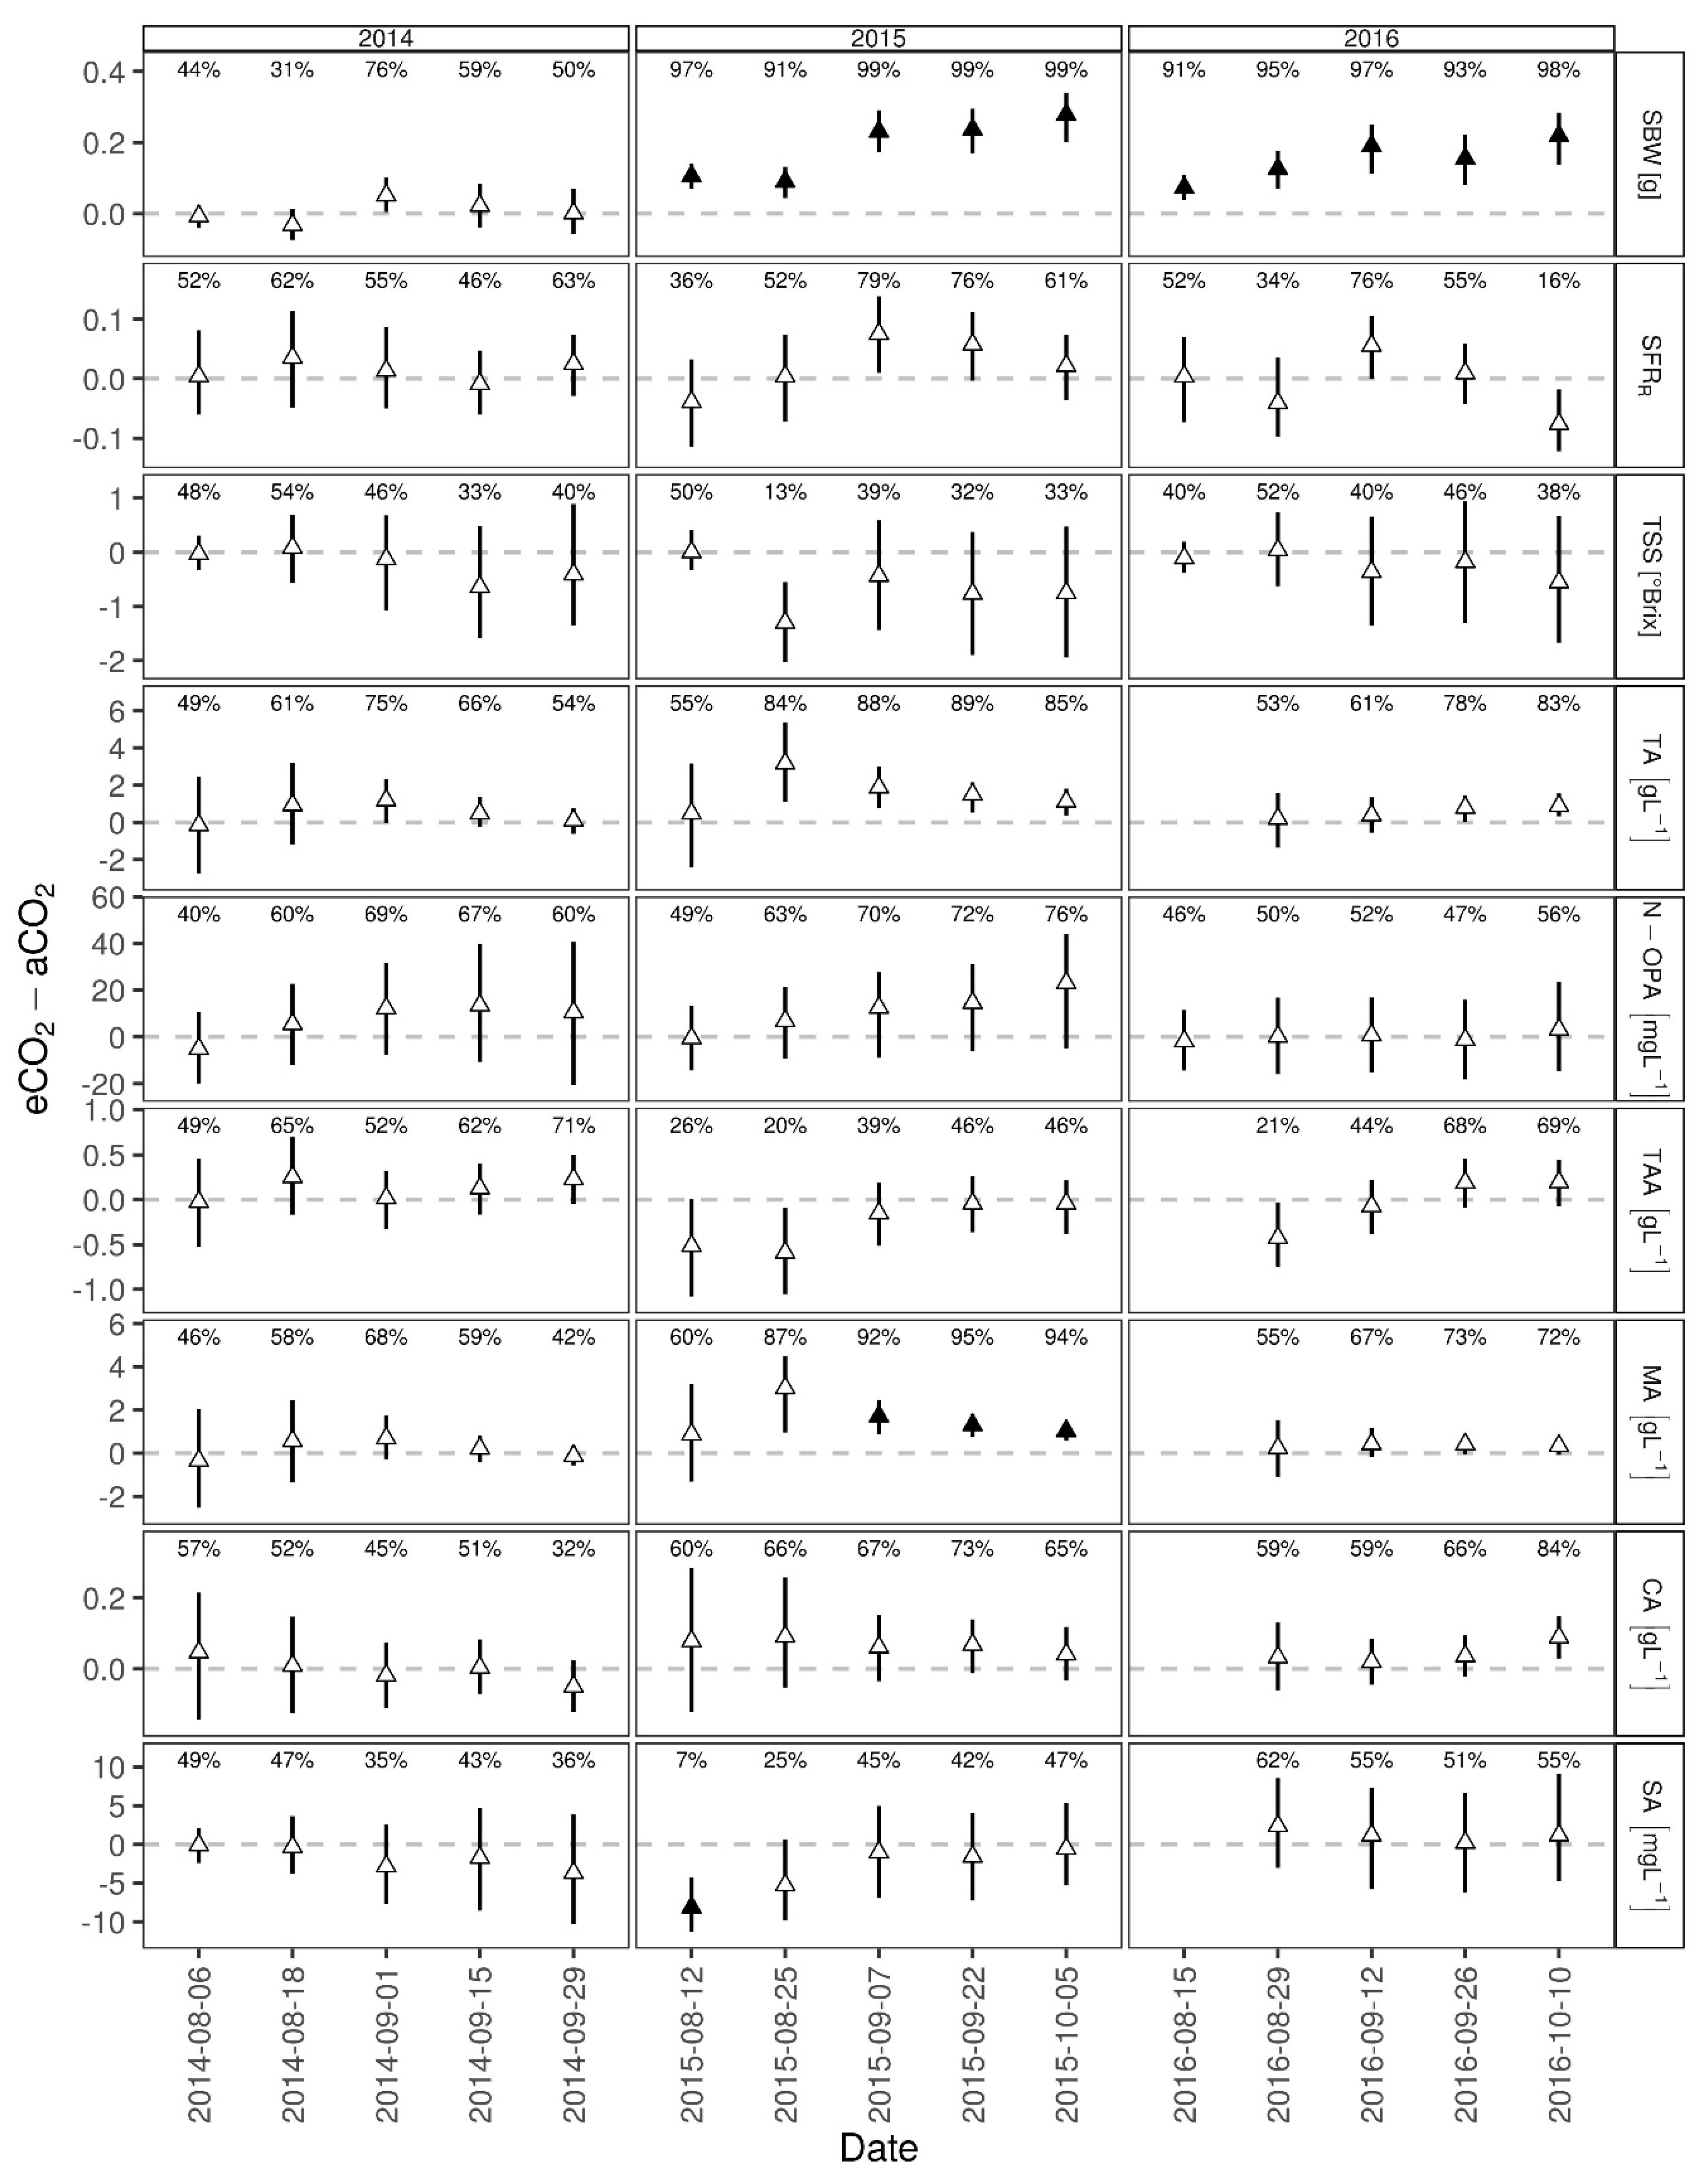
3.1. Berry Development

In Figure 1, single berry weight during berry development is shown for both cultivars under aCO2 and eCO2 over three consecutive seasons. In contrast to 2014, differences occurred for both cultivars in the following years between the two CO2 treatments during berry development (Figure 1). In 2015, Riesling showed higher single berry weights under eCO2 on the last four out of five sampling dates (Figure 1b) and, in 2016, the date closest to harvest (Figure 1c). This last sampling date in 2016 also showed the highest overall single berry weights for Riesling with 1.7 and 2.0 g per berry for aCO2 and eCO2, respectively.
Single berry weights of Cabernet Sauvignon increased for all dates during ripening in 2015 (Figure 1e) and 2016 (Figure 1f). Cabernet Sauvignon highest single berry weights were also detected at the end of 2016 season with 1.4 and 1.7 g for aCO2 and eCO2, respectively. The berry weight of Cabernet Sauvignon in general was lower compared to Riesling berries over all three years. For both cultivars, higher single berry weights under eCO2 usually occurred on sampling dates close to harvest where differences between treatments were higher than at the beginning of veraison.
The Bayesian generalized linear mixed model analyses of the berry quality parameter single berry weight (SBW) was attested to be affected by elevated CO2 conditions when comparing posterior predictions of the differences between eCO2 and aCO2 for both cultivars (Figures 8 and 9). No significant differences, i.e., 90% of the one-sided posterior predicted differences being larger (lower) than zero, were found for the year 2014 and both cultivars. SBWs on measurement dates in 2015 and 2016 were most affected with probabilities of 78%–95% and 91%–99% for Riesling (Figure 8) and Cabernet Sauvignon (Figure 9), respectively. The single berry weight of Cabernet Sauvignon was consistently and significantly higher throughout both years for eCO2 compared to aCO2 (Figure 9). Riesling was affected less consistently throughout the years. As shown in Figure 8, for both years, the estimated SBW close to harvest date was significantly higher for eCO2 compared to aCO2 by probabilities of a difference greater than zero of 95% (2015) and 93% (2016). For both cultivars, median differences close to harvest were estimated to be approximately 0.2 g. In 2015 and 2016, the median difference appeared to increase with time and, therefore, with maturity of the berries.
In accordance with the Bayesian generalized linear mixed model analyses for single berry weight, Figure 2 shows the effect of eCO2 on single berry weight of Riesling and Cabernet Sauvignon overall years and for single years (Figure S1, Supplementary Materials). Over all three years, eCO2 stimulated single berry weight of Riesling by 7% (Figure 2a), due to a low response in 2014 with y = 0.9742x + 0.0921, R2 = 0.83352 (Figure S1a, Supplementary Materials). In contrast, the response in 2015 was 20% (y = 1.2042x − 0.0748, R2 = 0.91801) and that in 2016 was 13% (y = 1.1250x − 0.0274, R2 = 0.94525) due to eCO2 (Figure S1a, Supplementary Materials).
The Cabernet Sauvignon single berry weight response was higher for all years compared to Riesling with a 14% increase under eCO2 (Figure 2b). Response of eCO2 in single years was 1% in 2014 (y = 1.0085x – 0.0019, R2 = 0.96297), 28% in 2015 (y = 1.2794x – 0.1173, R2 = 0.96510), and 14% in 2016 (y = 1.1381x – 0.0194, R2 = 0.9667) (Figure S1b, Supplementary Materials). Both cultivars showed the highest eCO2 stimulation of single berry weight in 2015 and the lowest in 2014.
It is shown that, during berry development, the SFR_R ratio decreased when berry color changed from green to yellow for Riesling (Figure 3) or green to red for Cabernet Sauvignon (Figure 4), while total soluble solids (TSS) increased. No differences occurred for SFR_R for both cultivars and for TSS in Cabernet Sauvignon between treatments and over the three years. Highest TSS values were found in 2015 close to harvest for both cultivars with 19.8° and 20.5° Brix for aCO2 and eCO2 in Riesling (Figure 3) and 19.5° and 20.3° Brix in Cabernet Sauvignon (Figure 4), respectively.
Probabilities of the Bayesian generalized linear mixed model analyses for SFR_R and TSS were found to be quite variable (Figures 8 and 9). Hence, the trends for slightly lower TSS in eCO2 compared to aCO2 at the end of the season in 2015 and 2016 cannot be attested as “significantly different”. This was indicated by low probabilities for a positive difference—below 50% for the last sampling dates in 2015 and 2016 (18%–38%)—across both cultivars, with Riesling a little more affected in 2016 than Cabernet Sauvignon (Figures 8 and 9). Surprisingly, TSS probabilities for Riesling at the sampling date closest to veraison showed a significant positive difference in 2015 (92%) and a significant negative difference in 2016 (9%), as shown in Figure 8.
The relationship between SFR_R and TSS (° Brix) in Riesling (Figure 5a) and Cabernet Sauvignon (Figure 5b) berries during ripening showed a better inverse correlation for Riesling (R2 = 0.94186) than for Cabernet Sauvignon (R2 = 0.68841). When excluding the pre-veraison data with TSS values <7° Brix for Cabernet Sauvignon, the correlation increased with R2 = 0.76096. Riesling showed, in general, higher SFR_R values at similar Brix values compared to Cabernet Sauvignon.
Total acidity (TA) and amino-acid concentration (N-OPA) during berry ripening are shown in Figure 6 and Figure 7, respectively. N-OPA presented the highest variation in values for both cultivars and years. Therefore, it was not surprising that there was no distinct difference between eCO2 and aCO2 detected, and, due to the high variability within treatments, this led to less precise predictions.
TA of Riesling showed only one significant probability at the end of 2016 sampling (91%) with a positive difference and a higher TA under eCO2 conditions (Figure 8). Higher probabilities of Cabernet Sauvignon for TA comparing eCO2 to aCO2 during season 2015 (84%–89%) and at the end of 2016 (78%–83%) could not be attested as “significantly different” (Figure 9).
The development of organic acids during berry ripening is shown in Table 2. The single acids did not reveal a consistent behavior. For instance, the probability of tartaric acid (TAA) was significantly affected by eCO2 for Riesling during earlier dates in 2015 (3%–6%), but the difference diminished later in season (Figure 8). All TAA values (Table 2) and probabilities (Figure 8) were lower under eCO2 for Riesling, whereas Cabernet Sauvignon TAA tended to be lower before veraison and became higher values around harvest date in two out of three seasons (Figure 9).
Malic acid (MA) of Riesling was also significantly affected at the last two sampling dates in 2016 (91%–97%) and the second last date in 2015 (95%). Cabernet Sauvignon revealed higher MA probabilities for three out of five sampling dates in 2015 (92%–95%). For both cultivars, higher probability values of malic acid were estimated under eCO2 conditions for the majority of dates within the three seasons.
Shikimic acid (SA) and partly citric acid (CA) provided no distinct differences between eCO2 and aCO2, and, due to a high variability within treatments, these led to less precise predictions. Cabernet Sauvignon showed a significant difference for SA before veraison in 2015. This was indicated by a low probability (7%) for a negative difference in 2015, which disappeared by the end of season.

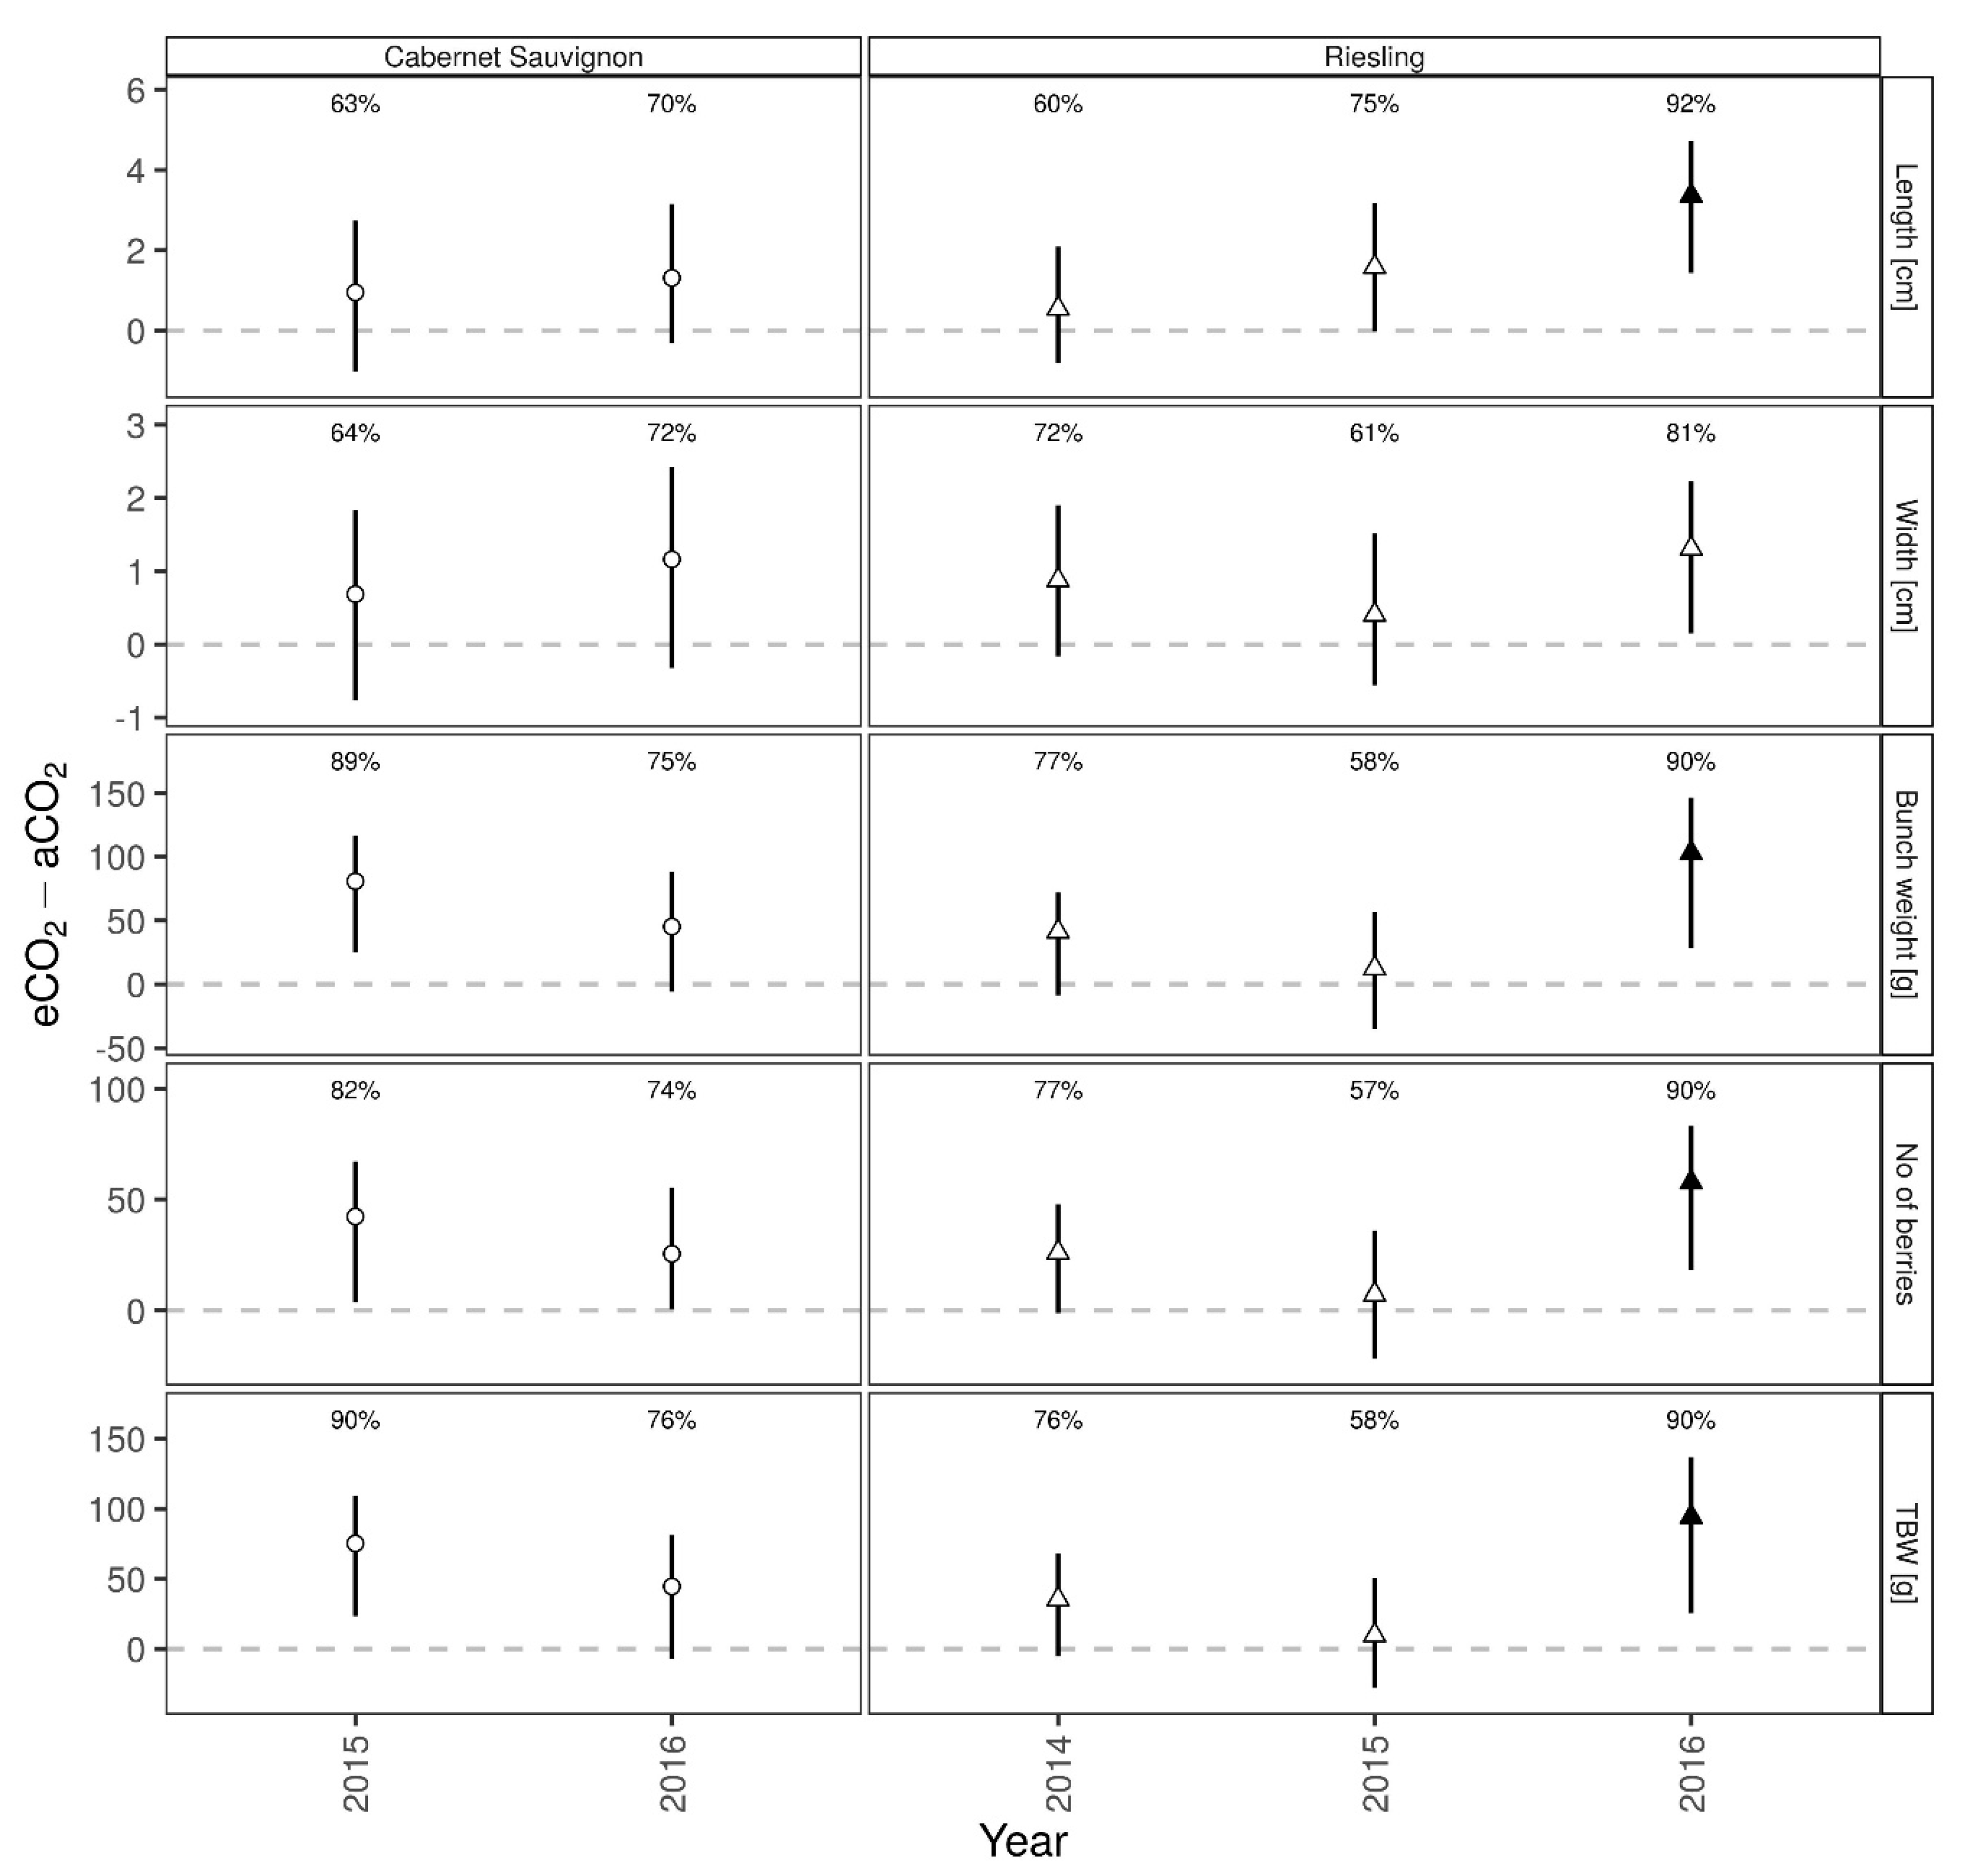
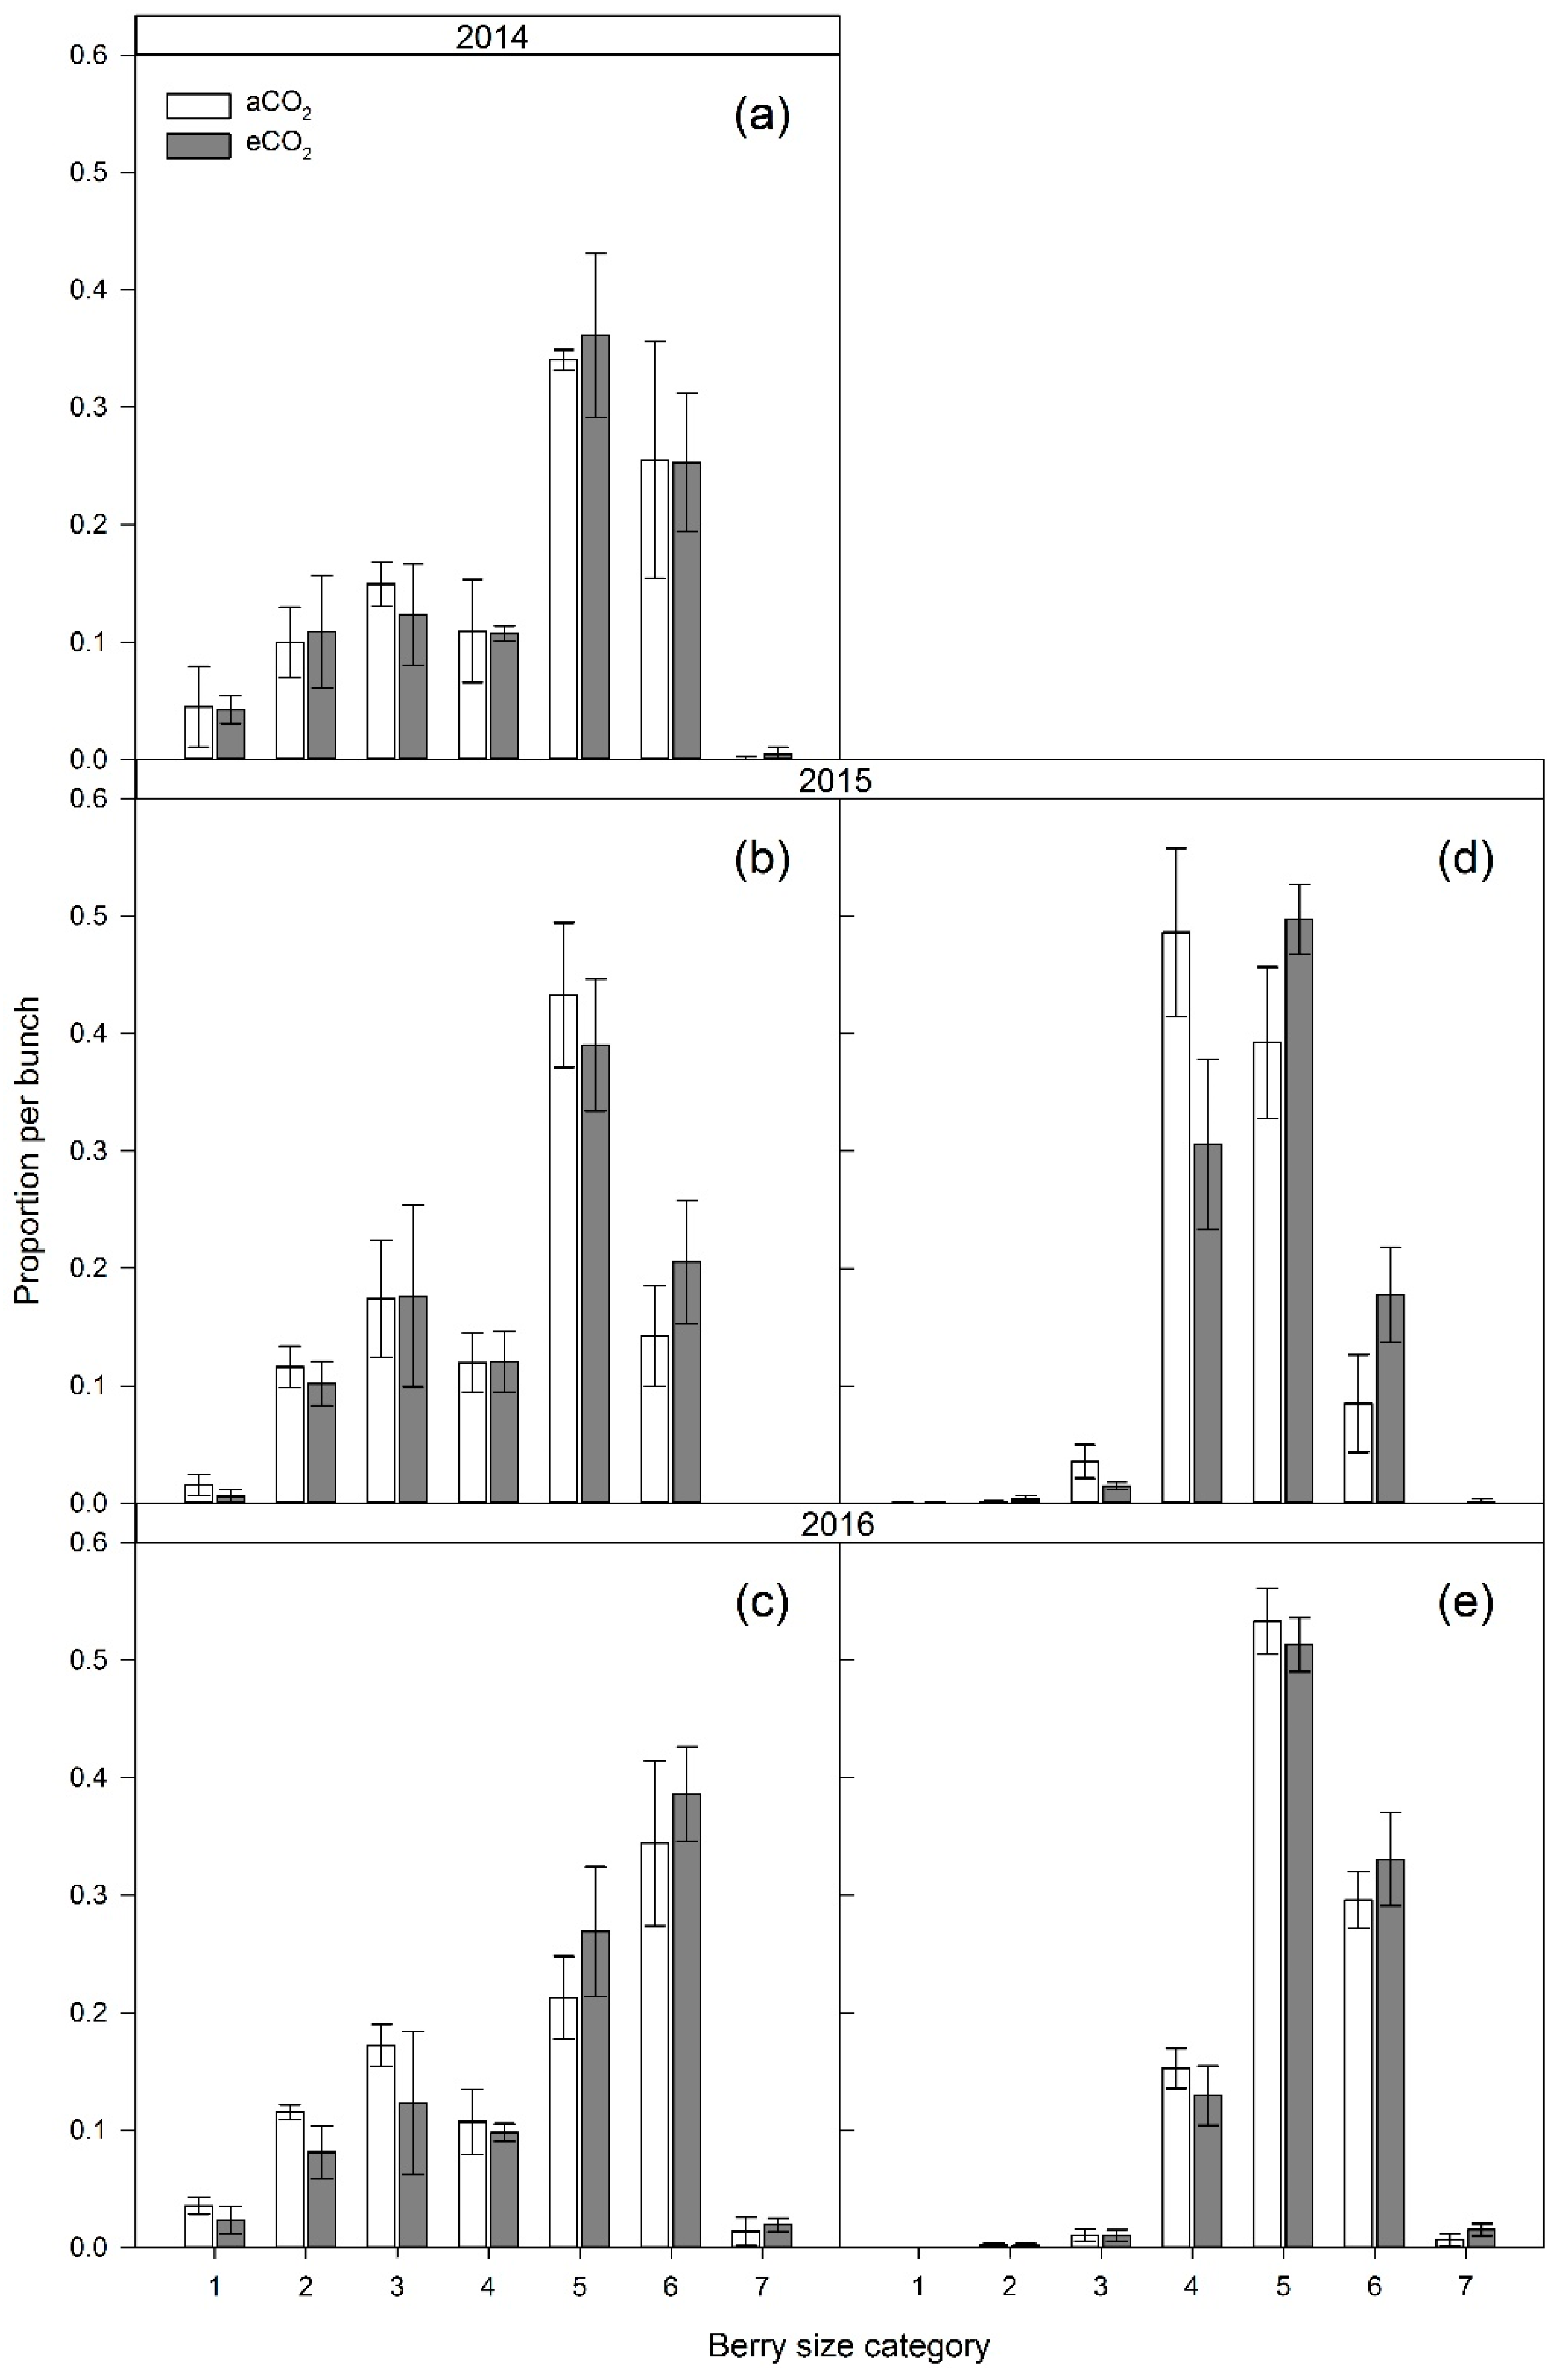
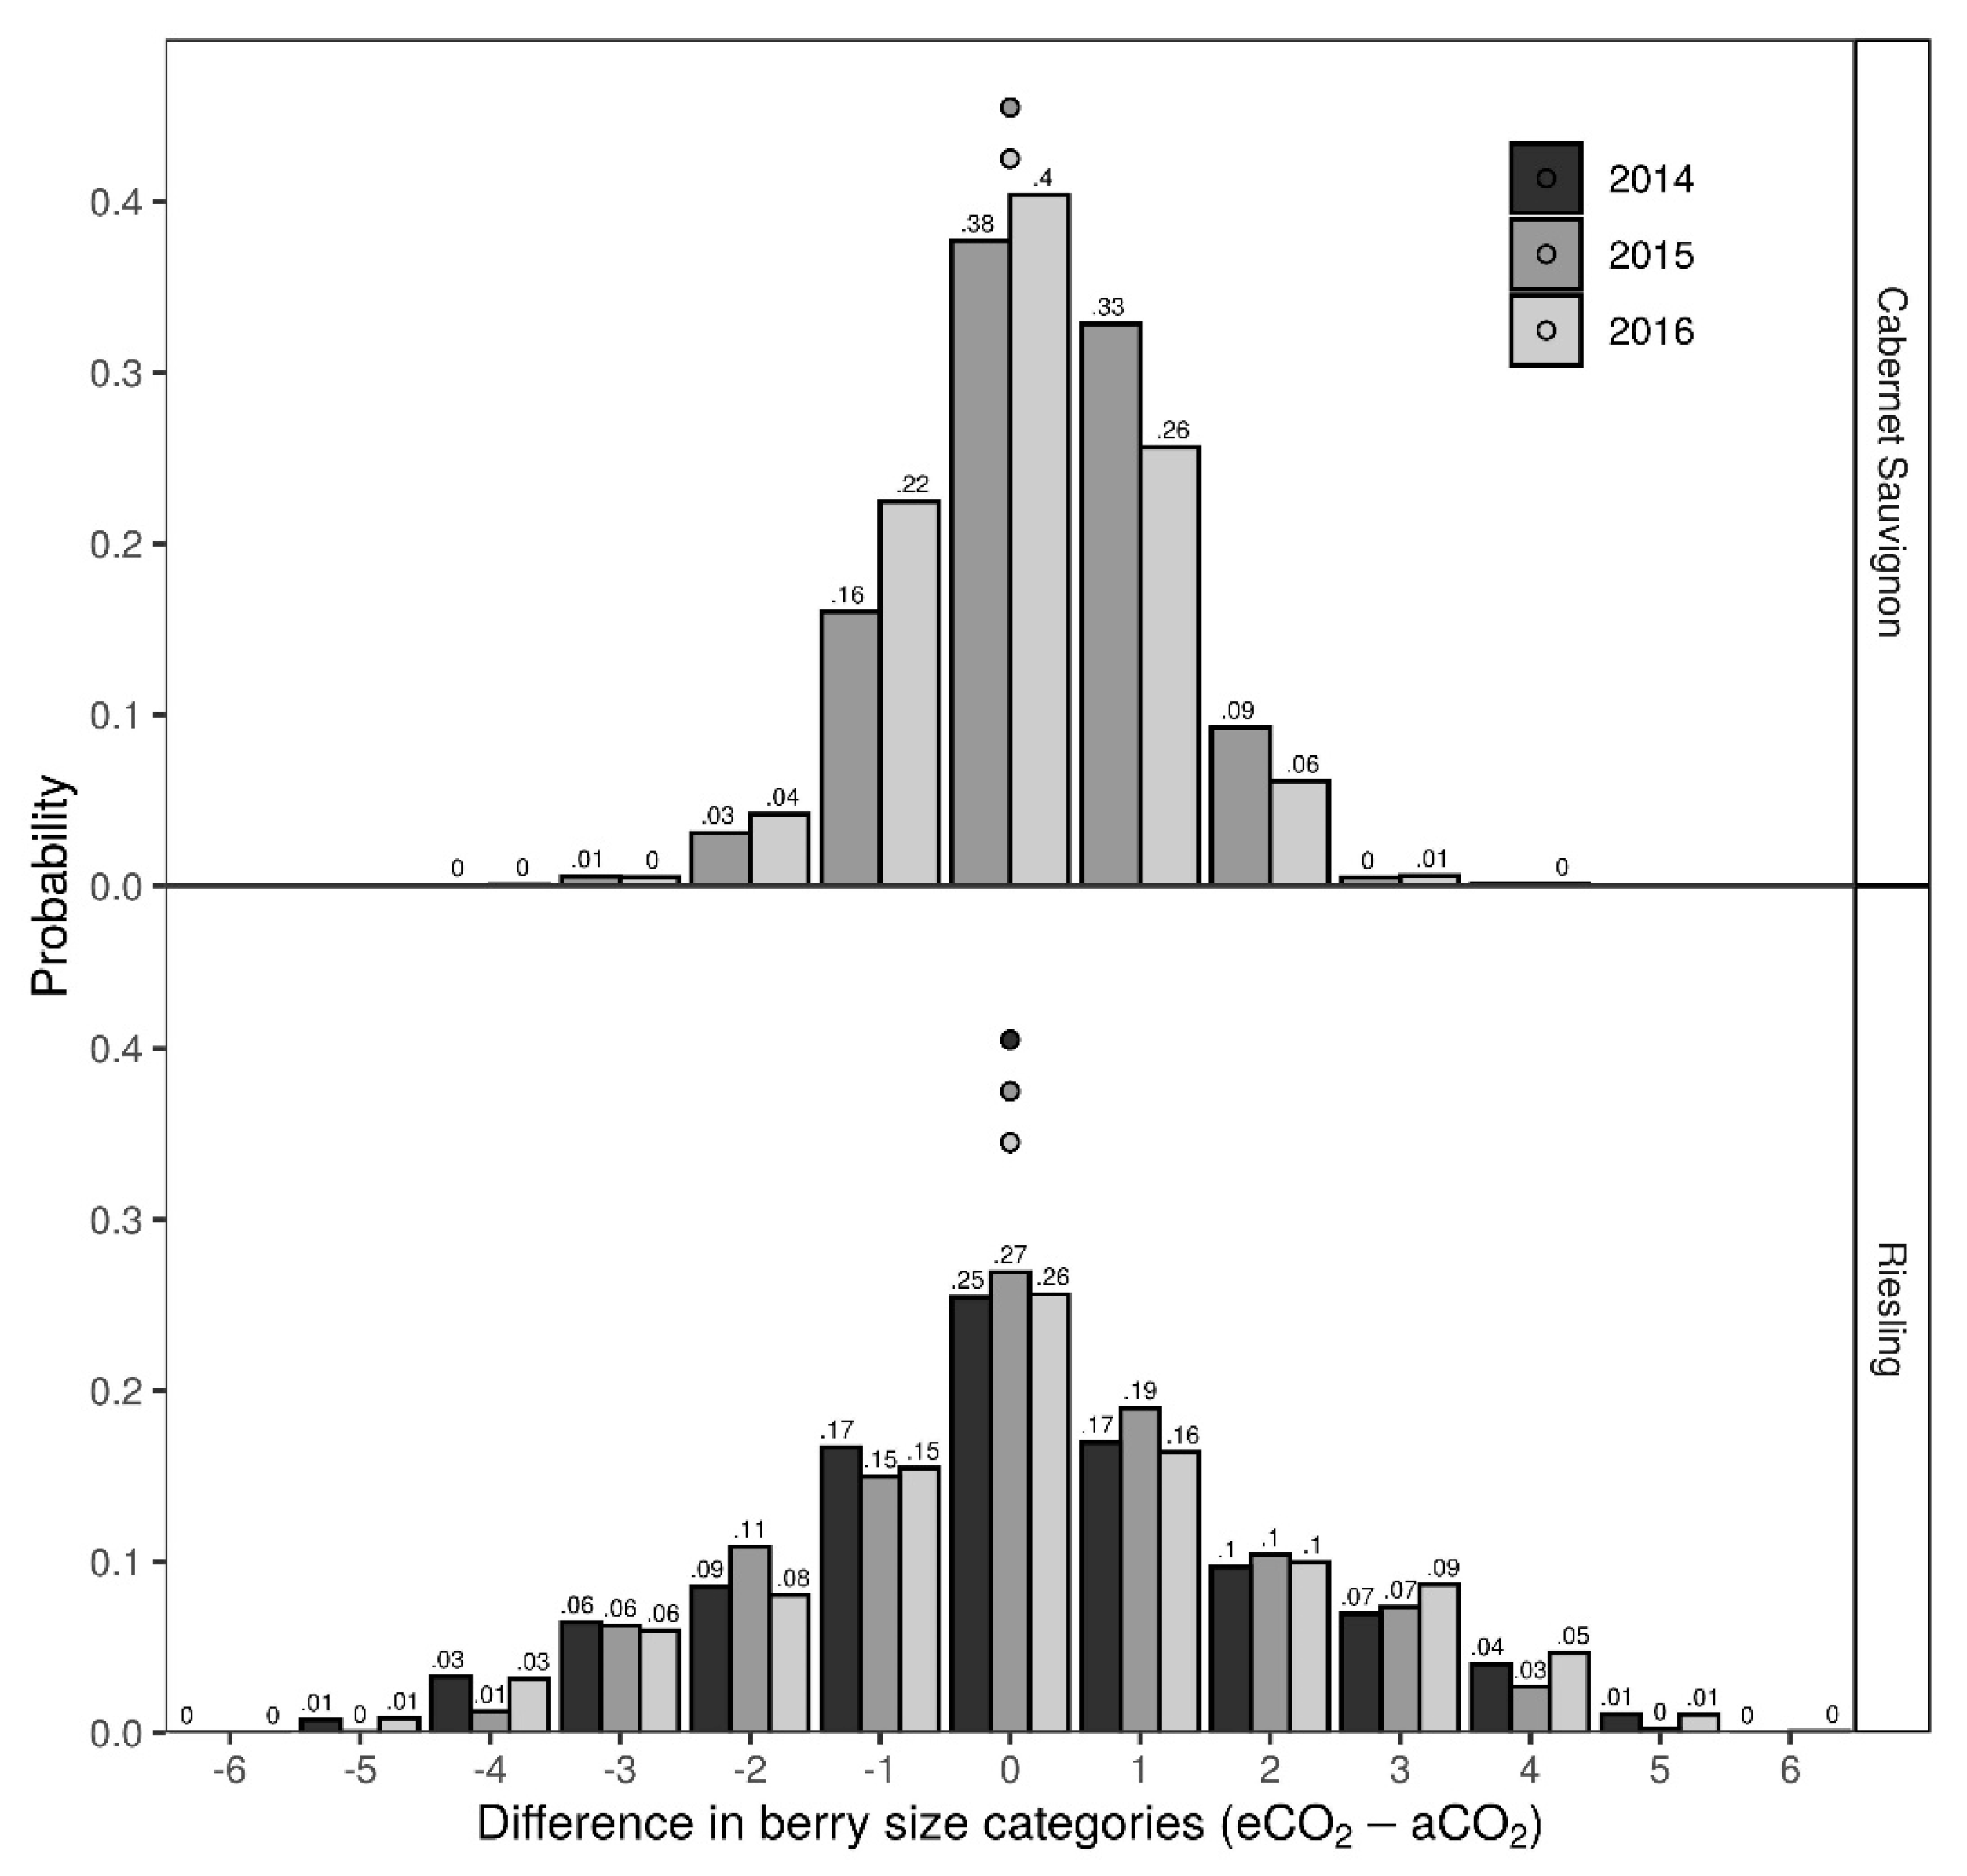
3.2. Bunch Structure Measures

Bunch structure parameters of second position bunches along a shoot are shown in Table 3. Riesling showed an increase in bunch length over years for the eCO2 treatment compared to aCO2. The highest percentage increase in relation to aCO2 treatment was found for all bunch parameters of Riesling in 2016 with increases >80% for bunch weight and total berry weight (TBW). The percentage increase of Cabernet Sauvignon bunch length and width under eCO2 treatment was higher in 2016 compared to 2015, when bunch weight, number of berries, and total berry weight were higher under eCO2 conditions (Table 3).
Posterior predictions of differences between elevated and ambient CO2 conditions for yearly measurements of five different bunch parameters (Figure 10) support inter-annual results (Figure 8 and Figure 9) from a slightly different angle. For 2015 and 2016 data of Cabernet Sauvignon, the maximum probabilities found for an effect were associated with bunch weight at 89% and TBW at 90% in 2015 (Figure 10). In general, there is a trend for higher bunch weight, TBW, length, width, and number of berries, both in Cabernet Sauvignon and Riesling, with probabilities in the range of 57% to 92%. Estimates indicate the Riesling bunch length, weight, TBW, and number of berries in 2016 to be significantly affected with probabilities >90%–92%.
The distribution of berry sizes within second positioned bunches showed a seasonal pattern for both cultivars. Whereas Riesling berry size group 5 (12.5–14 mm) was most frequent in 2014 and 2015, the highest number of berries was detected for size group 6 (14–16 mm) in 2016 (Figure 11). This was already shown by higher single berry weights of Riesling in 2016 compared to the two previous years (Table 3). Between the treatments, no differences occurred in 2014 and 2015 for single berry size categories. In 2016, the eCO2 treatment showed an increase of 10% for the three biggest berry size classes (7 (16–18 mm), 6 (14–16 mm), and 5 (12.5–14 mm)). All smaller berry size classes were less frequent under eCO2 compared to aCO2 treatment in 2016. Within Riesling, smaller berries were found in all years, whereas bigger berries of category 7 were only present in 2016 with more than 1%.
The most frequent berry size for Cabernet Sauvignon in 2015 was category 4 (10–12.5 mm) for aCO2 and category 5 for eCO2 treatment. On average, 9.2% more berries were counted in size category 6 under eCO2 in 2015. In 2016, the most frequent berry size was category 5 for both CO2 treatments. Smaller berries of category 1 and 2 were less than 1% in Cabernet Sauvignon for both years.
The statistical analysis on berry size classes showed no distinct differences between eCO2 and aCO2 for both Riesling and Cabernet Sauvignon within a year (Figure 12). For example, the most probable difference, estimated by the 16,000 posterior predictions of berry size category distances, was associated with “no difference” (zero). This coincided with the median difference for all five analyses. While the distribution for Riesling showed no visual skewness, for Cabernet Sauvignon, especially in 2015, there was a tendency for positive differences being slightly more probable than negative differences. That is, the sum of probabilities for eCO2 berries being categorized as larger with 42% was twice as high as that for being categorized as smaller with 20% (Table S1, Supplementary Materials). For Riesling, all three years showed more or less the same results. As mentioned before, the highest probability comparing one randomly picked berry from each treatment, eCO2 and aCO2, was estimated for “no difference” at probabilities in the range of 25%–27%. Probabilities for being one category apart, positive or negative, were in a similar range of 15%–19% across the years.

4. Discussion

4.1. Berry Development

Berry development of grapevines plays an important role in the formation of fruit quality parameters that are substantial for efficient wine making and the following wine profile. According to previous work, vines exposed to eCO2 conditions predominantly affect total soluble solid accumulation and acid degradation [2,5,7,11]. These two main components are well known to be sensitive to several abiotic factors such as soil, temperature, precipitation, or sunlight [44,45,46,47,48,49], which all count as climate-driven relevant markers. Nevertheless, all studies conducted on field-grown grapevines under eCO2 conditions embraced that there is no positive or negative repercussion of eCO2 on grape or wine quality [2,3,7]. On the other hand, eCO2 was shown to affect grapevine vigor and growth, especially bunch and berry weight or berry number [3,6,9], and it could, therefore, lead to quality changes by altered berry sizes [14,15,16,17,18,19,20,21].
Single berry weight was significantly affected for both cultivars by eCO2 in 2015 and 2016, even though Riesling showed a clear response at full maturity in 2016. As published in a previous paper due to the onset of the experiment [9], the 2014 season did not yet show differences between CO2 treatments in terms of yield, and this can be confirmed in the present study for single berry weight during berry development. That CO2 enrichment started in 2014 and generative growth is attributed to i.a. inflorescence initiation in the season prior, the lack in CO2 effect was already linked to that [9]. Nevertheless, the relation of single berry weight between aCO2 and eCO2 showed an overall eCO2 response of a 7% gain of berry weight for Riesling and a 14% gain for Cabernet Sauvignon over all three years. This result was in agreement with previous field studies of Moutinho-Pereira et al. [3] and Bindi et al. [6] who reported an increased cluster weight and an increased 100-berry weight for two different red cultivars under eCO2. In addition, fruit weight, volume, and diameter of pear, as another example of a perennial crop, were also found to be enhanced under eCO2 [22,23].
Regarding the berry composition during ripening over the three years, both cultivars, Riesling and Cabernet Sauvignon, did not differ in TSS between the two treatments. Even though values for TSS during berry development were predominantly lower under eCO2 and both cultivars, there was no significant difference detected except for one sampling date in 2015 and 2016 for Riesling, showing higher and lower TSS, respectively, at the beginning of berry development. The sugar content of must at harvest date is not influenced by eCO2 [2,7,9]; however, due to higher net assimilation and yield under eCO2, an average of 7% and 10% increases in sugar yield occurred for Riesling and Cabernet Sauvignon, respectively [9]. Interestingly, Bindi et al. [7] demonstrated that TSS of Sangiovese was stimulated by eCO2 during ripening, but the positive effect disappeared when grapes reached maturity. Gonçalves et al. [2] also confirmed this for Touriga Franca, whereas only Edwards et al. [5] indicated that eCO2 resulted in a higher TSS accumulation for Shiraz at harvest. Berries of both cultivars reached a higher sugar concentration for both treatments at maturity in 2015 compared to the other seasons. This disparity could be due to the climatic condition in the 2015 growing season with the highest number of heat days allowing higher sugar accumulation.
In addition to the investigation of TSS accumulation during berry development under eCO2 treatment, we confirmed that the spectroscopic index SFR_R as a chlorophyll index is a good representative of TSS (° Brix) for both white (R) and red (CS) grape cultivars. This was reported earlier for red cultivars Cabernet Sauvignon, Merlot, and Pinot or white cv. Vermentino under Mediterranean climate [30,31]. This gives an additional opportunity of rapid and indirect determination of sugar content during berry ripening in addition to refractometry.
In terms of a changing climate, the combination of increased malic acid and a similar sugar content of Cabernet Sauvignon berries under eCO2 as pronounced in the 2015 season is not affiliated with a degradation of quality. This is especially true for the ongoing process of vinification and microbiological stability. In fact, this leads to a positive output of eCO2 when no manipulation within the vine’s canopy is conducted as performed in the present study. Even though vigor, yield, or bunch compactness of grapevines increased under eCO2 in previous studies, there was no effect on Botrytis cinerea incidence or frequency [3,6,7,8,9]. Riesling was more sensitive to degradation of acidity during berry development, showing significantly lower levels of tartaric acid or significantly higher values of malic acid depending on the growing season. Noticeable for Riesling as a white cool climate cultivar is the fact that tartaric acid under eCO2 was less during the beginning of berry development in 2015, when temperatures were highest and precipitation lowest in comparison to the 2014 and 2016 seasons. The differences of 227 mm of precipitation during vegetation in 2015 compared to 441 and 371 mm for 2014 and 2016, respectively, in combination with the number of days >30 °C, reflect the combined effect of eCO2 with other climatic parameters. This was shown in a previous study when the impact strength of eCO2 on vegetative growth of Riesling was associated with annual climatic variation [9]. Getting closer to the harvest date of Riesling in 2015, the differences in tartaric acid concentration between the two treatments disappeared. Moreover, with continuing berry maturation of Riesling and simultaneous differentiation in single berry weight, malic acid degradation was lowered under eCO2 at the end of 2015 and 2016. This resulted in significantly higher malic acid concentration combined with higher single berry weights under eCO2 at harvest, as shown for Cabernet Sauvignon in 2015. Trials on red cultivars under eCO2 regime reported that either no difference in acid concentration was detected at berry maturity [7] or an increase in total acidity was found, without differences in malic and tartaric acid [2]. So far, on white cultivars, only greenhouse experiments were conducted, showing that there was no eCO2 effect on malic or tartaric acid at berry maturity [12,13]. Interestingly, a previous study on Riesling berry size [19] demonstrated that an increase in berry size was associated with increased malic acid concentration, which could account for a direct eCO2 effect on berry size, and this in turn resulted in an enhancement of malic acid under eCO2. A similar achievement was made for Cabernet Sauvignon, resulting in higher malic acid and lower total acid concentration with increasing berry size classes [20]. The decelerated malic acid degradation under eCO2 could also be merged to an altered microclimate within the bunch zone due to higher vigor, which was shown by various authors vice versa studying fruit zone defoliation trials on berry composition [50,51,52] or different temperature regimes within the bunch zone [53,54,55].
Shikimic acid (SA), citric acid (CA), and N-OPA provided no distinct differences between eCO2 and aCO2 treatment for either cultivar. This can be associated with higher variabilities between measurements, especially within N-OPA values, which led to less precise predictions. Therefore, no positive or negative impact of eCO2 on fruit quality during berry development could be detected.

4.2. Bunch Structure Measures

The response of eCO2 on bunch structure and the proportion of berry size groups showed differences between the two cultivars, Riesling and Cabernet Sauvignon. For example, bunch length was larger for Cabernet Sauvignon than for Riesling, whereas Riesling was more spread over all seven berry size classes compared to Cabernet Sauvignon. Differences between the three seasons were also detected, but less for the CO2 treatment, even though all bunch parameters showed higher values under eCO2 treatment for both cultivars. The higher single berry weight detected for both cultivars in 2015 and 2016 was not approved in proportion of berry size groups. Riesling showed the weakest CO2 response for all bunch structure parameters in 2015, the warmest of all three seasons, compared to 2014 and 2016. In 2016, Riesling showed a significant increase in bunch length and weight, berry number, and total berry weight under eCO2. The higher bunch length for eCO2 in 2016 could be due to more berries per bunch, which led to an elongation of the bunch to preserve a similar bunch density. Contrary to Riesling, Cabernet Sauvignon did not show stronger responses under eCO2 for berry parameters, particularly in berry and bunch weight, as well as berry number in 2015. Greer and Weston [56] already reported these differences in cultivar responses to climatic factors, especially for temperature. Overall, it was previously shown that the bunch compactness of Cabernet Sauvignon increased under eCO2 whereas Riesling did not show differences between the two treatments [9]. As an additionally positive result from that previous study, no differences in incidence or frequency of B. cinerea were detected for both cultivars and the three years under eCO2, even though bunch compactness is known to relate to susceptibility to grapevine diseases [57] and to B. cinerea in particular [58,59,60,61].
Regarding the proportion of the different berry size groups Riesling showed the highest proportion for berry size groups 5 (12.5–14 mm) and 6 (14–16 mm), which was in accordance with previous literature [19]. In contrast, Cabernet Sauvignon berries were almost entirely in classes 4 (10–12.5 mm), 5 and 6. As a consequence of this, the Riesling distribution was more spread out over all berry size classes compared to the Cabernet Sauvignon, indicating a higher intrinsic berry size variability for this variety that was—based on this early dataset—not significantly affected by elevated CO2 conditions.
Overall, with no differences in 2014 and an increase in probable differences in the following years, it is reasonable to assume that, in grapevines, there is some kind of adaptation period to elevated CO2 conditions. Hence, this dataset of three years allows a first glimpse of what we might expect in possible changing climatic conditions in the future.

5. Conclusions

The present study provides evidence that eCO2 did alter some bunch and berry parameters without causing any negative effects on fruit quality during berry development and structure of bunches.
During berry development, eCO2 resulted in higher single berry weight and malic acid for both cultivars in two seasons and lower tartaric acid for Riesling in one season. Effects were evident from the second season of investigations after CO2 enrichment was applied. So far, no substantial differences were detected for total soluble solids or for citric, shikimic, and amino acid concentration.
As vinification from smaller berries supposedly results in higher quality wines due to a higher concentration of compounds located in the grape skin such as flavonols or anthocyanins [14], it is advisable to investigate if the higher single berry weights derived from eCO2 treatment might have a negative effect on the amount of grape skin compounds in both cultivars. Additionally, the variation in berry size among Riesling clones is reported not to be responsible for different levels of C13-norisoprenoid aroma compounds like 1,1,6-trimethyl-1,2-dihydronaphthalene (TDN) [21], well known to produce petrol-like off-flavors in Riesling wine [62]. Therefore, it could be of interest to study the impact of different CO2 environments on TDN concentration in Riesling.
Based on the results of this study starting from the initial adaption of perennial plants to CO2 enrichment, seasonal measurements of the berry compounds should be continued to investigate the long-term response of the two different cultivars to elevated CO2 concentration.

Supplementary Materials

The following are available online at https://0-www-mdpi-com.brum.beds.ac.uk/2076-3417/10/7/2486/s1: Figure S1: Regression between aCO2 and eCO2 values of single berry weight [g] for Riesling (a) and Cabernet Sauvignon (b) of the three single datasets of the three different seasons (2014, 2015, and 2016); Table S1: Posterior predicted probabilities for differences in berry size categories between eCO2 and aCO2 being different from zero (P (difference < 0) and P (difference > 0)) for each year and both cultivars, Cabernet Sauvignon (CS) and Riesling (R), from Bayesian mixed-effects adjacent category models.

Author Contributions

Conceptualization, Y.W. and M.S.; methodology, Y.W., S.T., D.S., D.R., and M.S.; formal analysis, Y.W. and D.S.; investigation, Y.W. and S.T.; resources, D.S., D.R., and M.S.; data curation, Y.W., S.T., and D.S.; writing—original draft preparation, Y.W., S.T., M.S., D.S., D.R., and B.H.; writing—review and editing, Y.W., S.T., M.S., D.S., D.R., and B.H.; visualization, Y.W. and D.S.; supervision, M.S. and B.H.; project administration, Y.W., S.T., and M.S. All authors read and agreed to the published version of the manuscript.

Funding

The LOEWE excellence cluster FACE2FACE of the Hessian State Ministry of Higher Education, Research and the Arts (HMWK) funded this research.

Acknowledgments

We acknowledge the technical staff of the Department of General and Organic Viticulture for operating vineyard management of the VineyardFACE. Thanks are due to the laboratory team of the Department for helping with sampling, preparation, and analyzation of juices. We thank Heike Semmler and Melanie Brandt for conducting HPLC analyses and preparation of samples. Furthermore, the authors would like to thank the Bachelor and Master students J.A. Dittrich, P. Birkner, T. Lacoste, B. Lakatos, E. Laize, J. Lunn, and N.T. Hernandez for their help in the field and laboratory.

Conflicts of Interest

The authors declare no conflicts of interest.

References

  1. Ciais, P.; Sabine, C.; Bala, G.; Bopp, L.; Brovkin, V.; Canadell, J.; Chhabra, A.A.; Defries, R.; Galloway, J.; Heimann, M.; et al. Carbon and other biogeochemical cycles. In Climate Change 2013: The Physical Science Basis. Contribution of Working Group I to the Fifth Assessment Report of the Intergovernmental Panel on Climate Change; Stocker, T.F., Qin, D., Plattner, G.-K., Tignor, M., Allen, S.K., Boschung, J., Nauels, A., Xia, Y., Bex, V., Midgley, P.M., Eds.; Cambridge University Press: Cambridge, UK, 2013; pp. 465–570. [Google Scholar]
  2. Gonçalves, B.; Falco, V.; Moutinho-Pereira, J.M.; Bacelar, E.; Peixoto, F.; Correia, C. Effects of elevated CO2 on grapevine (Vitis vinifera L.): Volatile composition, phenolic content and in vitro antioxidant activity of red wine. J. Agric. Food Chem. 2009, 57, 265–273. [Google Scholar]
  3. Moutinho-Pereira, J.M.; Goncalves, B.; Bacelar, E.; Boaventura, C.; Coutinho, J.; Correia, C.M. Effects of elevated CO2 on grapevine (Vitis vinifera L.): Physiological and yield attributes. Vitis 2009, 48, 159–165. [Google Scholar]
  4. Edwards, E.J.; Unwin, D.J.; Sommer, K.J.; Downey, M.O.; Mollah, M. The response of commercially managed, field grown, grapevines (Vitis vinifera L.) to a simulated future climate consisting of elevated CO2 in combination with elevated air temperature. Acta Hortic. 2016, 1115, 103–110. [Google Scholar] [CrossRef]
  5. Edwards, E.J.; Unwin, D.; Kilmister, R.; Treeby, M. Multi-seasonal effects of warming and elevated CO2 on the physiology, growth and production of mature, field grown, Shiraz grapevines. Oeno One 2017, 51, 127–132. [Google Scholar] [CrossRef] [Green Version]
  6. Bindi, M.; Fibbi, L.; Gozzini, B.; Orlandini, S.; Seghi, L. The effect of elevated CO2 concentration on grapevine growth under field conditions. Acta Hort. 1996, 427, 325–330. [Google Scholar] [CrossRef]
  7. Bindi, M.; Fibbi, L.; Miglieta, F. Free air CO2 enrichment (FACE) of grapevine (Vitis vinifera L.): II. Growth and quality of grape and wine in response to elevated CO2 concentrations. Eur. J. Agron. 2001, 14, 145–155. [Google Scholar] [CrossRef]
  8. Bindi, M.; Raschi, A.; Lanini, M.; Miglietta, F.; Tognetti, R. Physiological and yield responses of grapevine (Vitis vinifera L.) exposed to elevated CO2 concentrations in a free air CO2 enrichment (FACE). J. Crop Improv. 2005, 13, 345–359. [Google Scholar] [CrossRef]
  9. Wohlfahrt, Y.; Smith, J.; Tittmann, S.; Honermeier, B.; Stoll, M. Primary productivity and physiological responses of Vitis vinifera L. cvs. under free air carbon dioxide enrichment (FACE). Eur. J. Agron. 2018, 101, 149–162. [Google Scholar] [CrossRef]
  10. Wohlfahrt, Y.; Collins, C.; Stoll, M. Grapevine bud fertility under conditions of elevated carbon dioxide. Oeno One 2019, 2, 303–314. [Google Scholar] [CrossRef]
  11. Salazar Parra, C.; Aguirreolea, J.; Sánchez-Díaz, M.; Irigoyen, J.J.; Morales, F. Effects of climate change scenarios on Tempranillo grapevine (Vitis vinifera L.) ripening: Response to a combination of elevated CO2 and temperature, and moderate drought. Plant Soil 2010, 337, 179–191. [Google Scholar] [CrossRef]
  12. Kizildeniz, T.; Mekni, I.; Santesteban, H.; Pascual, I.; Morales, F.; Irigoyen, J.J. Effects of climate change including elevated CO2 concentration, temperature and water deficit on growth, water status, and yield quality of grapevine (Vitis vinifera L.) cultivars. Agric. Water Manag. 2015, 159, 155–164. [Google Scholar] [CrossRef] [Green Version]
  13. Kizildeniz, T.; Pascual, I.; Irigoyen, J.J.; Morales, F. Using fruit-bearing cuttings of grapevine and temperature gradient greenhouses to evaluate effects of climate change (elevated CO2 and temperature, and water deficit) on the cv. red and white Tempranillo. Yield and must quality in three consecutive growing seasons (2013–2015). Agric. Water Manag. 2018, 202, 299–310. [Google Scholar]
  14. Singleton, V.L. Effects on red wine quality of removing juice before fermentation to simulate variation in berry size. Am. J. Enol. Vitic. 1972, 23, 106–113. [Google Scholar]
  15. Roby, G.; Matthews, M. Relative proportions of seed, skin and flesh, in ripe berries from Cabernet Sauvignon grapevines grown in a vineyard either well irrigated or under water deficit. Aust. J. Grape Wine Res. 2004, 10, 74–82. [Google Scholar] [CrossRef]
  16. Roby, G.; Harbertson, J.F.; Adams, D.A.; Matthews, M.A. Berry size and vine water deficits as factors in winegrape composition: Anthocyanins and tannins. Aust. J. Grape Wine Res. 2004, 10, 100–107. [Google Scholar] [CrossRef]
  17. Šuklje, K.; Lisjak, K.; Ĉesnik, H.B.; Janeš, L.; Du Toit, W.; Coetzee, Z.; Vanzo, A.; Deloire, A. Classification of grape berries according to diameter and total soluble solids to study the effect of light and temperature on methoxypyrazine, glutathione, and hydroxycinnamate evolution during ripening of Sauvignon blanc (Vitis vinifera L.). J. Agric. Food Chem. 2012, 60, 9454–9461. [Google Scholar]
  18. Melo, M.S.; Schultz, H.R.; Volschenk, C.G.; Hunter, J.J. Berry size variation of Vitis vinifera L. cv. Syrah: Morphological dimensions, berry composition and wine quality. S. Afr. J. Enol. Vitic. 2015, 36, 1–10. [Google Scholar] [CrossRef] [Green Version]
  19. Friedel, M.; Sorrentino, V.; Blank, M.; Schuettler, A. Influence of berry diameter and colour on some determinants of wine composition of Vitis vinifera L. cv. Riesling. Aust. J. Grape Wine Res. 2016, 22, 215–225. [Google Scholar] [CrossRef]
  20. Chen, W.-K.; He, F.; Wang, Y.-X.; Liu, X.; Duan, C.-Q.; Wang, J. Influences of berry size on fruit composition and wine quality of Vitis vinifera L. cv. Cabernet Sauvignon grapes. S. Afr. J. Enol. Vitic. 2018, 39, 67–76. [Google Scholar] [CrossRef] [Green Version]
  21. Ziegler, M.; Wegmann-Herr, P.; Schmarr, H.-G.; Gök, R.; Winterhalter, P.; Fischer, U. Impact of rootstock, clonal selection and berry size of Vitis vinifera sp. Riesling on the formation of TDN, vitispiranes and other volatile compounds. J. Agric. Food Chem. 2020, 68, 3834–3849. [Google Scholar] [CrossRef]
  22. Ito, J.; Hasegawa, S.; Fujita, K.; Ogasawara, S.; Fujiwara, T. Effect of CO2 enrichment on fruit growth and quality in Japanese pear (Pyrus serotina Reheder cv. Kosui). Soil Sci. Plant Nutr. 1999, 45, 385–393. [Google Scholar] [CrossRef] [Green Version]
  23. Han, J.-H.; Cho, J.G.; Son, I.-C.; Kim, S.H.; Lee, I.-B.; Choi, I.M.; Kim, D. Effects of elevated carbon dioxide and temperature on photosynthesis and fruit characteristics of ‘Niitaka’ pear (Pyrus pyrifolia Nakai). Hort. Env. Biotechnol. 2012, 53, 357–361. [Google Scholar] [CrossRef]
  24. Idso, S.B.; Kimball, B.A. Effects of long-term atmospheric CO2 enrichment on the growth and fruit production of sour orange trees. Glob. Chang. Biol. 1997, 3, 89–96. [Google Scholar] [CrossRef]
  25. Sung, F.J.M.; Chen, J.J. Gas exchange rate and yield response of strawberry to carbon dioxide enrichment. Sci. Hortic. 1991, 48, 241–251. [Google Scholar] [CrossRef]
  26. Wang, S.Y.; Bunce, J.A. Elevated carbon dioxide affects fruit flavor in field-grown strawberries (Fragaria × Ananassa Duch). J. Sci. Food Agric. 2004, 84, 1464–1468. [Google Scholar] [CrossRef]
  27. Mochizuki, M.J.; Daugovish, O.; Ahumada, M.H.; Ashkan, S.; Lovatt, C.J. Carbon dioxide enrichment may increase yield of field-grown red raspberry under high tunnels. HortTechnology 2010, 20, 213–219. [Google Scholar] [CrossRef] [Green Version]
  28. Cozzolino, D.; Cynkar, W.U.; Dambergs, R.G.; Gishen, M.; Smith, P. Grape (Vitis vinifera) compositional data spanning ten successive vintages in the context of abiotic growing parameters. Agric. Ecosyst. Env. 2010, 139, 565–570. [Google Scholar] [CrossRef]
  29. Schultz, H.R. Climate change and viticulture: A European perspective on climatology, carbon dioxide and UV-B effects. Aust. J. Grape Wine Res. 2000, 6, 2–12. [Google Scholar] [CrossRef]
  30. Ben Ghozlen, N.; Cerovic, Z.G.; Germain, C.; Toutain, S.; Latouche, G. Non-destructive optical monitoring of grape maturation by proximal sensing. Sensors 2010, 10, 10040–10068. [Google Scholar] [CrossRef]
  31. Agati, G.; D’Onofrio, C.; Ducci, E.; Cuzzola, A.; Remorini, D.; Tuccio, L.; Lazzini, F.; Mattii, G. Potential of a multiparametric optical sensor for determining in situ the maturity components or red and white Vitis vinifera wine grapes. J. Agric. Food Chem. 2013, 61, 12211–12218. [Google Scholar] [CrossRef]
  32. Dukes, B.C.; Butzke, C.E. Rapid determination of primary amino acids in grape juice using an o-Phthaldialdehyde/N-Acetyl-L-Cysteine spectrophotometric assay. Am. J. Enol. Vitic. 1998, 49, 125–134. [Google Scholar]
  33. Schneider, A.; Gerbi, V.; Redoglia, M. A rapid HPLC method for separation and determination of major organic acids in grape musts and wines. Am. J. Enol. Vitic. 1987, 38, 151–155. [Google Scholar]
  34. Knoll, C.; Fritsch, S.; Schnell, S.; Grossmann, M.; Rauhut, D.; du Toit, M. Influence of pH and ethanol on malolactic fermentation and volatile aroma compound composition in white wines. Lwt. Food Sci. Technol. 2011, 44, 2077–2086. [Google Scholar] [CrossRef]
  35. The R Project for Statistical Computing. Available online: https://www.r-project.org/ (accessed on 4 December 2019).
  36. Bürkner, P.-C. Brms: An R package for bayesian multilevel models using stan. J. Stat. Softw. 2017, 80, 1–28. [Google Scholar] [CrossRef] [Green Version]
  37. Bürkner, P.-C. Advanced bayesian multilevel modeling with the R package brms. R. J. 2018, 10, 395–411. [Google Scholar] [CrossRef]
  38. Carpenter, B.; Gelman, A.; Hoffman, M.D.; Lee, D.; Goodrich, B.; Betancourt, M.; Brubaker, M.; Guo, J.; Li, P.; Riddell, A. Stan: A probabilistic programming language. J. Stat. Softw. 2017, 76, 1–32. [Google Scholar] [CrossRef] [Green Version]
  39. Kaur, A.; Gregori, D.; Patil, G.P.; Taillie, C. Ecological applications of generalized linear models and quasi-likelihood methods–An overview. Stat. Appl. 1996, 8, 59–82. [Google Scholar]
  40. Bürkner, P.-C.; Vuorre, M. Ordinal regression models in psychology: A tutorial. Adv. Methods Pract. Psychol. Sci. 2019, 2, 77–101. [Google Scholar] [CrossRef] [Green Version]
  41. Vehtari, A.; Gelman, A.; Simpson, D.; Carpenter, B.; Bürkner, P.-C. Rank-normalization, folding, and localization: An improved $\widehat{R}$ for assessing convergence of MCMC. arxiv 2019, arXiv:1903.08008. [Google Scholar]
  42. Flegal, J.M.; Hughes, J.; Vats, D.; Dai, N. mcmcse: Monte Carlo Standard Errors for MCMC. Available online: https://rdrr.io/cran/mcmcse/ (accessed on 4 December 2019).
  43. Vats, D.; Flegal, J.M.; Jones, G.L. Multivariate output analysis for Markov chain Monte Carlo. Biometrika 2019, 106, 321–337. [Google Scholar] [CrossRef] [Green Version]
  44. Martinez-Lüscher, J.; Kizildeniz, T.; Vucetic, V.; Dai, Z.; Luedeling, E.; Van Leeuwen, C.; Gomes, E.; Pascual, I.; Irigoyen, J.J.; Morales, F.; et al. Sensitivity of grapevine phenology to water availability, temperature and CO2 concentration. Front. Env. Sci. 2016, 4, 48. [Google Scholar] [CrossRef]
  45. Mira de Orduna, R. Climate change associated effects on grape and wine quality and production. Food Res. Int. 2010, 43, 1844–1855. [Google Scholar] [CrossRef]
  46. Coombe, B.G. Influence of temperature on composition and quality of grapes. Acta Hort. 1987, 206, 23–35. [Google Scholar] [CrossRef]
  47. Ollat, N.; Diakou-Verdin, P.; Carde, J.-P.; Barrieu, F.; Gaudillère, J.-P.; Moing, A. Grape berry development: A review. J. Int. Sci. Vigne Vin 2002, 36, 109–131. [Google Scholar]
  48. Keller, M. Managing grapevines to optimise fruit development in a challenging environment: A climate change primer for viticulturists. Aust. J. Grape Wine Res. 2010, 16, 56–69. [Google Scholar] [CrossRef]
  49. Jackson, D.I.; Lombard, P.B. Environmental and management practices affecting grape composition and wine quality—A review. Am. J. Enol. Vitic. 1993, 44, 409–430. [Google Scholar]
  50. Kliewer, W.M.; Bledsoe, A.M. Influence of hedging and leaf removal on canopy microclimate, grape composition, and wine quality under California conditions. Acta Hort. 1987, 206, 157–168. [Google Scholar] [CrossRef]
  51. Zoecklein, B.W.; Wolf, T.K.; Duncan, N.W.; Judge, J.M.; Cook, M.K. Effects of fruit zone leaf removal on yield, fruit composition, and fruit rot incidence of chardonnay and white riesling (Vitis vinifera L.) grapes. Am. J. Enol. Vitic. 1992, 43, 139–148. [Google Scholar]
  52. Smart, R.E. Principles of grapevine canopy microclimate manipulation with implications for yield and quality. A review. Am. J. Enol. Vitic. 1985, 36, 230–239. [Google Scholar]
  53. Lakso, A.N.; Kliewer, W.M. The influence of temperature on malic acid metabolism in grape berries: I. Enzyme responses. Plant. Physiol. 1975, 56, 370–372. [Google Scholar] [CrossRef] [Green Version]
  54. Ruffner, H.P. Metabolism of tartaric and malic acids in Vitis: A review—part B. Vitis 1982, 21, 346–358. [Google Scholar]
  55. Etienne, A.; Genard, M.; Lobit, P.; Mbeguie-A.-Mbeguie, D.; Bugaud, C. What controls fleshy fruit acidity? A review of malate and citrate accumulation in fruit cells. J. Exp. Bot. 2013, 64, 1451–1469. [Google Scholar] [CrossRef] [PubMed] [Green Version]
  56. Greer, D.H.; Weston, C. Heat stress affects flowering, berry growth, sugar accumulation and photosynthesis of Vitis vinifera cv. Semillon grapevines grown in a controlled environment. Funct. Plant. Biol. 2010, 37, 206–214. [Google Scholar] [CrossRef]
  57. Tello, J.; Ibanez, J. What do we know about grapevine bunch compactness? A state-of-the-art review. Aust. J. Grape Wine Res. 2018, 24, 6–23. [Google Scholar] [CrossRef]
  58. Vail, M.E.; Marois, J.J. Grape cluster architecture and the susceptibility of berries to Botrytis cinerea. Phytopathology 1991, 81, 188–191. [Google Scholar] [CrossRef]
  59. Vail, M.E.; Wolpert, J.A.; Gubler, W.D.; Rademacher, M.R. Effect of cluster tightness on botrytis bunch rot in six Chardonnay clones. Plant. Dis. 1998, 82, 107–109. [Google Scholar] [CrossRef] [Green Version]
  60. Alonso-Villaverde, V.; Boso, S.; Santiago, J.L.; Gago, P.; Martínez, M.C. Relationship between susceptibility to botrytis bunch rot and grape cluster morphology in the Vitis vinifera L. cultivar Albariño. Int. J. Fruit Sci. 2008, 8, 251–265. [Google Scholar] [CrossRef]
  61. Hed, B.; Ngugi, H.K.; Travis, J.W. Relationship between cluster compactness and bunch rot in vignoles grapes. Plant. Dis. 2009, 93, 1195–1201. [Google Scholar] [CrossRef] [Green Version]
  62. Simpson, R.F. 1,1,6-Trimethyl-1,2-dihydronaphthalene: An important contributor to the bottle aged bouquet of wine. Chem. Ind. 1978, 1, 37. [Google Scholar]
Figure 1. Single berry weights of Riesling (ac) and Cabernet Sauvignon (df) for the two treatments aCO2 and eCO2 and the three seasons 2014, 2015, and 2016 during berry development. Letters indicate development stages veraison (V) and harvest (H). Mean values per treatment ± SD of the three FACE rings.
Applsci 10 02486 g001
Figure 2. Relation between aCO2 and eCO2 values of single berry weight [g] between pre-veraison and harvest for Riesling (a) and Cabernet Sauvignon (b) of three independent sets of data collected in three different seasons 2014, 2015, and 2016.
Applsci 10 02486 g002
Figure 3. Chlorophyll index (SFR_R) and sugar accumulation (TSS) in aCO2 and eCO2 Riesling berries over the three seasons 2014 (a,d), 2015 (b,e), and 2016 (c,f). Letters indicate seasonal development stages veraison (V) and harvest (H). Mean values per treatment ± SD of the three FACE rings.
Applsci 10 02486 g003
Figure 4. Chlorophyll index (SFR_R) and sugar accumulation (TSS) in aCO2 and eCO2 Cabernet Sauvignon berries over the three seasons 2014 (a,d), 2015 (b,e), and 2016 (c,f). Letters indicate seasonal development stages veraison (V) and harvest (H). Mean values per treatment ± SD of the three FACE rings.
Applsci 10 02486 g004
Figure 5. Relationship between SFR_R and total soluble solids (TSS) in Riesling (a) and Cabernet Sauvignon (b) berries of the two treatments aCO2 and eCO2.
Applsci 10 02486 g005
Figure 6. Total acidity degradation during berry ripening in 2014, 2015, and 2016 for Riesling (ac) and Cabernet Sauvignon (df) and the two treatments aCO2 and eCO2. Letters indicate seasonal development stages veraison (V) and harvest (H). Total acidity is expressed as tartaric acid in g/L. Mean values per treatment ± SD of the three FACE rings.
Applsci 10 02486 g006
Figure 7. Amino acid concentration during ripening periods of the three seasons 2014, 2015, and 2016 for the two varieties Riesling (ac) and Cabernet Sauvignon (df) and the two treatments aCO2 and eCO2. Letters indicate seasonal development stages veraison (V) and harvest (H). Mean values per treatment ± SD of the three FACE rings.
Applsci 10 02486 g007
Figure 8. Posterior predicted difference (median and 50% HDI) between eCO2 and aCO2 for each measurement date from Bayesian generalized linear mixed effects models on berry quality parameters of Riesling. Percentages represent the probability of eCO2−aCO2 > 0. Filled symbols indicate “significant differences”, if the probability is >90% (positive difference) or <10% (negative difference).
Applsci 10 02486 g008
Figure 9. Posterior predicted difference (median and 50% HDI) between eCO2 and aCO2 for each measurement date from Bayesian generalized linear mixed effects models on berry quality parameters of Cabernet Sauvignon. Percentages represent the probability of eCO2−aCO2 > 0. Filled symbols indicate “significant differences”, if the probability is >90% (positive difference) or <10% (negative difference).
Applsci 10 02486 g009
Figure 10. Posterior predicted difference (median and 50% HDI) between eCO2 and aCO2 for each measurement year from Bayesian generalized linear mixed effects models on bunch parameters of Riesling and Cabernet Sauvignon. Percentages represent the probability of eCO2-aCO2 > 0. Filled symbols indicate “significant differences”, if the probability is >90% (positive difference) or <10% (negative difference).
Applsci 10 02486 g010
Figure 11. Proportion per bunch of Riesling berry size groups for aCO2 and eCO2 in 2014 (a), 2015 (b), and 2016 (c) and Cabernet Sauvignon in 2015 (d) and 2016 (e). Berry size categories represent the following berry size classes: 1 (<6.3 mm), 2 (6.3–8 mm), 3 (8–10 mm), 4 (10–12.5 mm), 5 (12.5–14 mm), 6 (14–16 mm), and 7 (16–18 mm). Mean values per treatment ± SD of the three FACE rings.
Applsci 10 02486 g011
Figure 12. Posterior predicted probabilities for differences in berry size categories between eCO2 and aCO2 for each year from Bayesian mixed effects adjacent category models with category specific effects for both cultivars, Cabernet Sauvignon and Riesling. Point estimates represent the median difference for each year and variety.
Applsci 10 02486 g012
Table 1. Climatic data for Geisenheim, Rheingau, Germany for growing seasons 2014 to 2016, 1 April–31 October.
Vegetation PeriodMean Daily Max. Temperature (°C)Mean Daily Min. Temperature (°C)No. of Heat Days (>30 °C)Precipitation (mm)
201421.611.310441
201521.510.526227
201621.510.517371
Table 2. Concentration of organic acids during ripening period of cvs. Riesling (R) and Cabernet Sauvignon (CS) under two CO2 treatments and three seasons.
CultivarDateTartaric Acid (g∙L−1)Malic Acid (g∙L−1)Citric Acid (g∙L−1)Shikimic Acid (mg∙L−1)
R2014aCO2eCO2aCO2eCO2aCO2eCO2aCO2eCO2
11/0813.86 ± 0.3213.84 ± 0.2919.12 ± 0.4319.38 ± 0.420.28 ± 0.010.30 ± 0.0215.2 ± 1.714.6 ± 0.8
25/0812.17 ± 0.1111.58 ± 0.4812.53 ± 0.2412.19 ± 0.250.21 ± 0.010.21 ± 0.0226.4 ± 0.728.8 ± 2.0
08/0910.67 ± 0.1110.29 ± 0.106.14 ± 0.156.17 ± 0.160.17 ± 0.020.18 ± 0.0233.9 ± 2.036.1 ± 1.3
15/099.91 ± 0.149.75 ± 0.124.87 ± 0.024.92 ± 0.120.18 ± 0.020.17 ± 0.0034.0 ± 3.135.9 ± 1.2
22/099.31 ± 0.089.23 ± 0.083.87 ± 0.313.96 ± 0.160.17 ± 0.010.18 ± 0.00 34.3 ± 2.836.8 ± 1.8
2015
10/0817.21 ± 0.1515.91 ± 0.5121.10 ± 0.3420.53 ± 0.640.38 ± 0.020.38 ± 0.0222.4 ± 3.219.3 ± 0.6
17/0816.57 ± 0.5115.02 ± 0.3019.96 ± 1.2219.48 ± 0.670.42 ± 0.020.39 ± 0.0121.9 ± 2.321.8 ± 1.6
31/0812.42 ± 0.0511.50 ± 0.209.40 ± 0.099.43 ± 0.170.21 ± 0.000.21 ± 0.0033.3 ± 1.235.0 ± 1.0
14/0910.31 ± 0.4510.01 ± 0.395.17 ± 0.375.97 ± 0.440.18 ± 0.010.16 ± 0.0033.8 ± 2.735.3 ± 1.1
28/0910.02 ± 0.249.67 ± 0.084.15 ± 0.264.61 ± 0.340.17 ± 0.020.17 ± 0.0234.0 ± 2.535.6 ± 1.2
2016
22/0814.56 ± 0.5013.94 ± 0.1022.11 ± 0.8021.96 ± 0.390.29 ± 0.010.30 ± 0.0121.7 ± 1.322.5 ± 0.8
05/0910.71 ± 0.2210.35 ± 0.119.07 ± 0.959.76 ± 0.890.16 ± 0.030.16 ± 0.0138.3 ± 3.836.3 ± 1.7
19/098.96 ± 0.108.86 ± 0.043.96 ± 0.244.72 ± 0.500.12 ± 0.000.14 ± 0.0136.7 ± 3.035.6 ± 0.7
04/108.38 ± 0.248.29 ± 0.103.07 ± 0.023.45 ± 0.350.12 ± 0.020.14 ± 0.0136.6 ± 1.237.4 ± 1.1
CultivarDateTartaric Acid (g∙L−1)Malic Acid (g∙L−1)Citric Acid (g∙L−1)Shikimic Acid (mg∙L−1)
CS2014aCO2eCO2aCO2eCO2aCO2eCO2aCO2eCO2
06/0813.45 ± 0.3813.41 ± 0.3424.85 ± 0.7124.42 ± 1.260.49 ± 0.020.50 ± 0.0227.1 ± 3.127.0 ± 2.0
18/0811.37 ± 0.2311.63 ± 0.4320.30 ± 0.6720.85 ± 0.720.36 ± 0.020.37 ± 0.0244.5 ± 3.344.2 ± 3.8
01/098.68 ± 0.168.69 ± 0.1710.56 ± 0.1111.27 ± 0.920.25 ± 0.010.25 ± 0.0162.7 ± 3.259.7 ± 3.4
15/097.42 ± 0.307.55 ± 0.326.52 ± 0.456.72 ± 0.290.20 ± 0.010.21 ± 0.0179.1 ± 3.777.2 ± 3.8
29/097.20 ± 0.187.42 ± 0.114.97 ± 0.404.83 ± 0.240.20 ± 0.010.19 ± 0.01 86.5 ± 5.382.7 ± 6.4
2015
12/0814.99 ± 0.5214.47 ± 0.3024.11 ± 0.7024.96 ± 0.200.54 ± 0.040.56 ± 0.0245.1 ± 9.136.6 ± 3.9
25/0813.20 ± 0.1512.61 ± 0.2417.15 ± 2.2520.13 ± 1.420.41 ± 0.010.43 ± 0.0265.3 ± 6.859.6 ± 1.7
07/099.50 ± 0.309.35 ± 0.237.45 ± 1.059.17 ± 1.050.20 ± 0.010.22 ± 0.0171.4 ± 3.570.2 ± 1.4
22/098.44 ± 0.448.39 ± 0.164.77 ± 0.586.08 ± 0.390.20 ± 0.010.22 ± 0.0168.2 ± 6.566.4 ± 1.5
05/108.08 ± 0.388.03 ± 0.203.95 ± 0.344.97 ± 0.270.20 ± 0.010.21 ± 0.0264.8 ± 5.664.0 ± 2.9
2016
29/089.94 ± 0.119.51 ± 0.1614.17 ± 1.8314.43 ± 1.440.26 ± 0.030.27 ± 0.0368.1 ± 4.570.5 ± 2.4
12/098.44 ± 0.138.36 ± 0.076.97 ± 0.807.38 ± 0.730.17 ± 0.020.18 ± 0.0177.1 ± 5.478.1 ± 3.4
26/097.21 ± 0.177.40 ± 0.164.72 ± 0.545.14 ± 0.710.15 ± 0.020.16 ± 0.0178.0 ± 6.777.9 ± 4.0
10/107.00 ± 0.207.20 ± 0.043.96 ± 0.354.32 ± 0.600.15 ± 0.020.17 ± 0.0282.2 ± 8.283.3 ± 7.0
Values are the mean ± SD of three FACE rings per treatment.
Table 3. Bunch structure of second positioned bunches of cvs. Riesling (R) and Cabernet Sauvignon (CS) at two CO2 levels (aCO2 and eCO2) one day prior harvest date in 2014, 2015, and 2016. Percentages show the changes of eCO2 related to aCO2 treatment.
CultivarYearLength (cm)Width (cm)Bunch Weight (g)No of BerriesTotal Berry Weight (g)
R aCO2eCO2aCO2eCO2aCO2eCO2aCO2eCO2aCO2eCO2
20149.92 ± 0.1910.46 ± 0.316.29 ± 0.957.17 ± 0.89108.14 ± 5.90151.88 ± 9.1185.9 ± 8.20112.7 ± 1.8100.26 ± 15.36138.77 ± 7.24
% +5.4 +14.0 +40.4 +31.2 +38.4
201510.56 ± 0.2412.19 ± 0.826.69 ± 0.657.08 ± 0.22143.67 ± 7.35158.40 ± 28.82113.6 ± 9.5122.1 ± 18.4125.18 ± 6.47137.86 ± 25.29
% +15.4 +5.8 +10.3 +7.5 +10.1
20169.67 ± 0.2213.06 ± 0.976.00 ± 0.227.33 ± 0.51130.07 ± 13.09237.98 ± 16.4697.2 ± 10.8156.3 ± 3.1121.06 ± 12.95222.02 ± 15.90
% +35.1 +22.2 +83.0 +60.8 +83.4
CS201515.58 ± 0.4616.50 ± 0.366.81 ± 1.007.47 ± 0.39136.81 ± 20.38219.00 ± 3.97110.9 ± 9.2154.4 ± 3.9127.79 ± 19.75205.48 ± 4.22
% +5.9 +9.7 +60.1 +39.2 +60.8
201614.31 ± 0.1715.64 ± 0.216.86 ± 0.248.08 ± 0.66164.04 ± 10.95212.15 ± 11.11102.1 ± 4.9128.9 ± 4.6153.95 ± 9.12200.40 ± 10.68
% +9.3 +17.8 +29.3 +26.2 +30.2
Values are the mean ± SD of three FACE rings per treatment.

