Dynamic Modeling for Resilience Measurement: NATO Resilience Decision Support Model


1
NATO Headquarters Supreme Allied Commander Transformation, Norfolk, VA 23551, USA
2
STM Savunma Teknolojileri Mühendislik ve Ticaret A.S., Ankara 06530, Turkey
3
Department of Intelligence Support, University of Defence, 66210 Brno, Czech Republic
4
Department of Tactics, University of Defence, 66210 Brno, Czech Republic
*
Author to whom correspondence should be addressed.
Appl. Sci. 2020, 10(8), 2639; https://0-doi-org.brum.beds.ac.uk/10.3390/app10082639
Submission received: 10 March 2020
/
Revised: 30 March 2020
/
Accepted: 9 April 2020
/
Published: 11 April 2020
(This article belongs to the Special Issue New Frontiers in Computational Intelligence)
Abstract
:Featured Application
The prototype of the resilience decision support model is used by the NATO operational community to support their daily business, particularly in the evaluation of Civil Preparedness factors in the Area of Operations and describing the risk related to operations when strategic shocks are being introduced. The model complements the NATO modeling and simulation decision support framework.
Abstract
Despite its conceptual uncertainty, resilience is mostly about the measurement of capacity. Current studies confirm the importance of resilience measurement and the necessity to support policy makers with a measurement mechanism. A holistic approach considering the measurement of different resilience domains interactively and concurrently is the critical element in this endeavor. In parallel with the rise of popularity of resilience in international organizations, NATO has initiated a project with the objective to discover whether the resilience capacity of a country can be evaluated in a dynamic way via a prototype model execution. The implemented model running both baseline (without any shock) and extraordinary scenarios (with strategic shocks), clearly demonstrates its capacity to represent quantitatively the resilience related factors of a country in the complex operational environment. Moreover, the outputs of the model substantially comply with the resilience concept existing in the literature and NATO applications. One of the main strengths of the model is its almost infinite capacity to create various scenarios and make what-if analysis limited only by the current number of endogenous parameters of the model. It allows studying the secondary and the third order effects of events introduced in scenarios. The user interfaces (input and output dashboards) of the model help decision makers modify the values of selected endogenous parameters, see and compare the time-based values of the resilience factors, and doing so to evaluate risk related to the Area of Operations. Subject matter experts have validated the model and identified the main areas of improvement. The further development brings more countries to the model and implements an aggregation mechanism for output values of both resilience capacity and risk functions. The model will form the core of the NATO Resilience expert system.
1. Introduction
The concept of resilience has been defined in various forms and studied especially in natural disaster and hazards domains [1]. Having reviewed numerous resilience definitions, Manyena et al. [2] conclude that resilience is a fuzzy concept and has epistemological and operational challenges. Ribeiro and Gonçalves [3] provide resilience definitions for various scientific areas such as social, environmental, engineering, and biological sciences. Ran et al. [4] make a conclusion of resilience within the scope of their literature review as follows: “The ability of a system, community or person to prepare for, cope with, recover from and adapt to a hazard or hazardous event”. The United Nations [5] defines resilience as “the ability of a system, community or society exposed to hazards to resist, absorb, accommodate to and recover from the effects of a hazard in a timely and efficient manner, including the preservation and restoration of its essential basic structures and functions.” Although expressed by different terminologies, “resist”, “recover”, “adapt”, and “transform” [2,3,6,7] can generally be considered as the main pillars of the resilience concept. There are both theoretical and practical studies in the literature using this modality.
The pervasiveness of risks upon hazardous events (i.e., shocks) and understanding systematic vulnerabilities to prepare for potential future shocks show the close relation between risk management/assessment and the resilience concept. Glas et al. [8] focus on risk assessment and risk management together with the resilience concept while discussing flood risk mapping. Al-Saidi and Saliba [9] stress the importance of investing appropriately in both risk management and resilience policies. Cuthbertson et al. [10] deal with the opportunities and recommendations in enhancing resilience while building disaster risk management. Enhancing resilience capacity enables threat anticipation, reduces vulnerability, and contributes to risk management [4,11].
Despite its conceptual uncertainty, resilience is mostly about the measurement of capacity [2]. Jones and d’Errico [12] focus on the importance of resilience measurement and the necessity to support policy makers with a measurement mechanism. Manyena et al. [2] consider the measurement of resilience capacity as a major challenge. Ribeiro and Gonçalves [3] talk about the lack of tools and methods to make a thorough resilience evaluation. Hosseini et al. [13] emphasize the advantages of dynamic modeling over analytical techniques to deal with such a complex problem such as resilience measurement. Literature review on resilience models for critical infrastructures highlights the importance of describing the complex interactions and dynamic behaviours (e.g., Australian Critical Infrastructure Protection Modeling and Analysis—CIPMA system dynamics model) instead of immediate effects, which are central in most of the existing models [14].
Therefore, a need to apply a holistic approach considering the measurement of different resilience domains interactively and concurrently emerges. Within the context of resilience evaluation, holism including the interconnectedness and interrelatedness among all related agents is a critical concept [15]. The integrative and dynamic aspects systems thinking and modeling methodology (system dynamics) differentiates this study among others.
Systems thinking focuses on simply revealing parts of complex structures and their relationships examining different perspectives on these complex structures, and addressing power relations and potential conflicts of interest among these aspects [16].
The system dynamics methodology facilitates the policy determination process in management of complex system behaviours over time and policy application process for adapting to a complex environment [17]. System dynamics models provide foresights about situational behaviour changes in a system over time. Moreover, the what-if scenario capacity of the model developed in this study enables creation of alternative decisions for the policy makers.
Ran et al. [4] highlight the need for more hypothesis/discovery-driven experiments against descriptive mapping exercises to understand better the mechanisms through which vulnerability and resilience shape the capacity to prepare for, respond to, and recover from disasters. Resilience situations that are seen as mostly qualitative, very abstract, vague, and weak both theoretically and operationally [2] may benefit from this study.
In parallel to the rise of popularity of resilience in international organizations such as the United Nations [12], NATO has recently made resilience central. Accordingly, NATO with the aim of developing a NATO Resilience expert system initiated a discovery experiment, which is the subject of this study. NATO approved and implemented an approach to the experimentation that recognized three types of experiments [18]. Discovery experiment is a test to determine the efficacy of something previously untried, Hypothesis testing experiment is to examine the validity of a hypothesis, and Validation experiment demonstrates a known truth. The main objective of this discovery experiment is to evaluate whether the resilience capacity of a country can be described in a dynamic way via a designed model execution and if the operational risk can be expressed as a function of resilience factors. The outcome of the NATO discovery experiment is the prototype of the resilience model employing a system dynamics paradigm. The model representing the interrelationships among various resilience domains (Continuity of Government, Energy Supplies, Movement of People, Food and Water, Mass Casualties, Communication, and Transportation) provides a holistic methodology for a comprehensive resilience assessment for NATO. The model produces quantitative outputs by integrating the interactions among various resilience factors that have mostly been viewed as vague. Moreover, the developed model helps enhance the risk management and resilience building capacities of NATO that is continually experimenting and conducting scenario-driven operations.
2. Materials and Methods
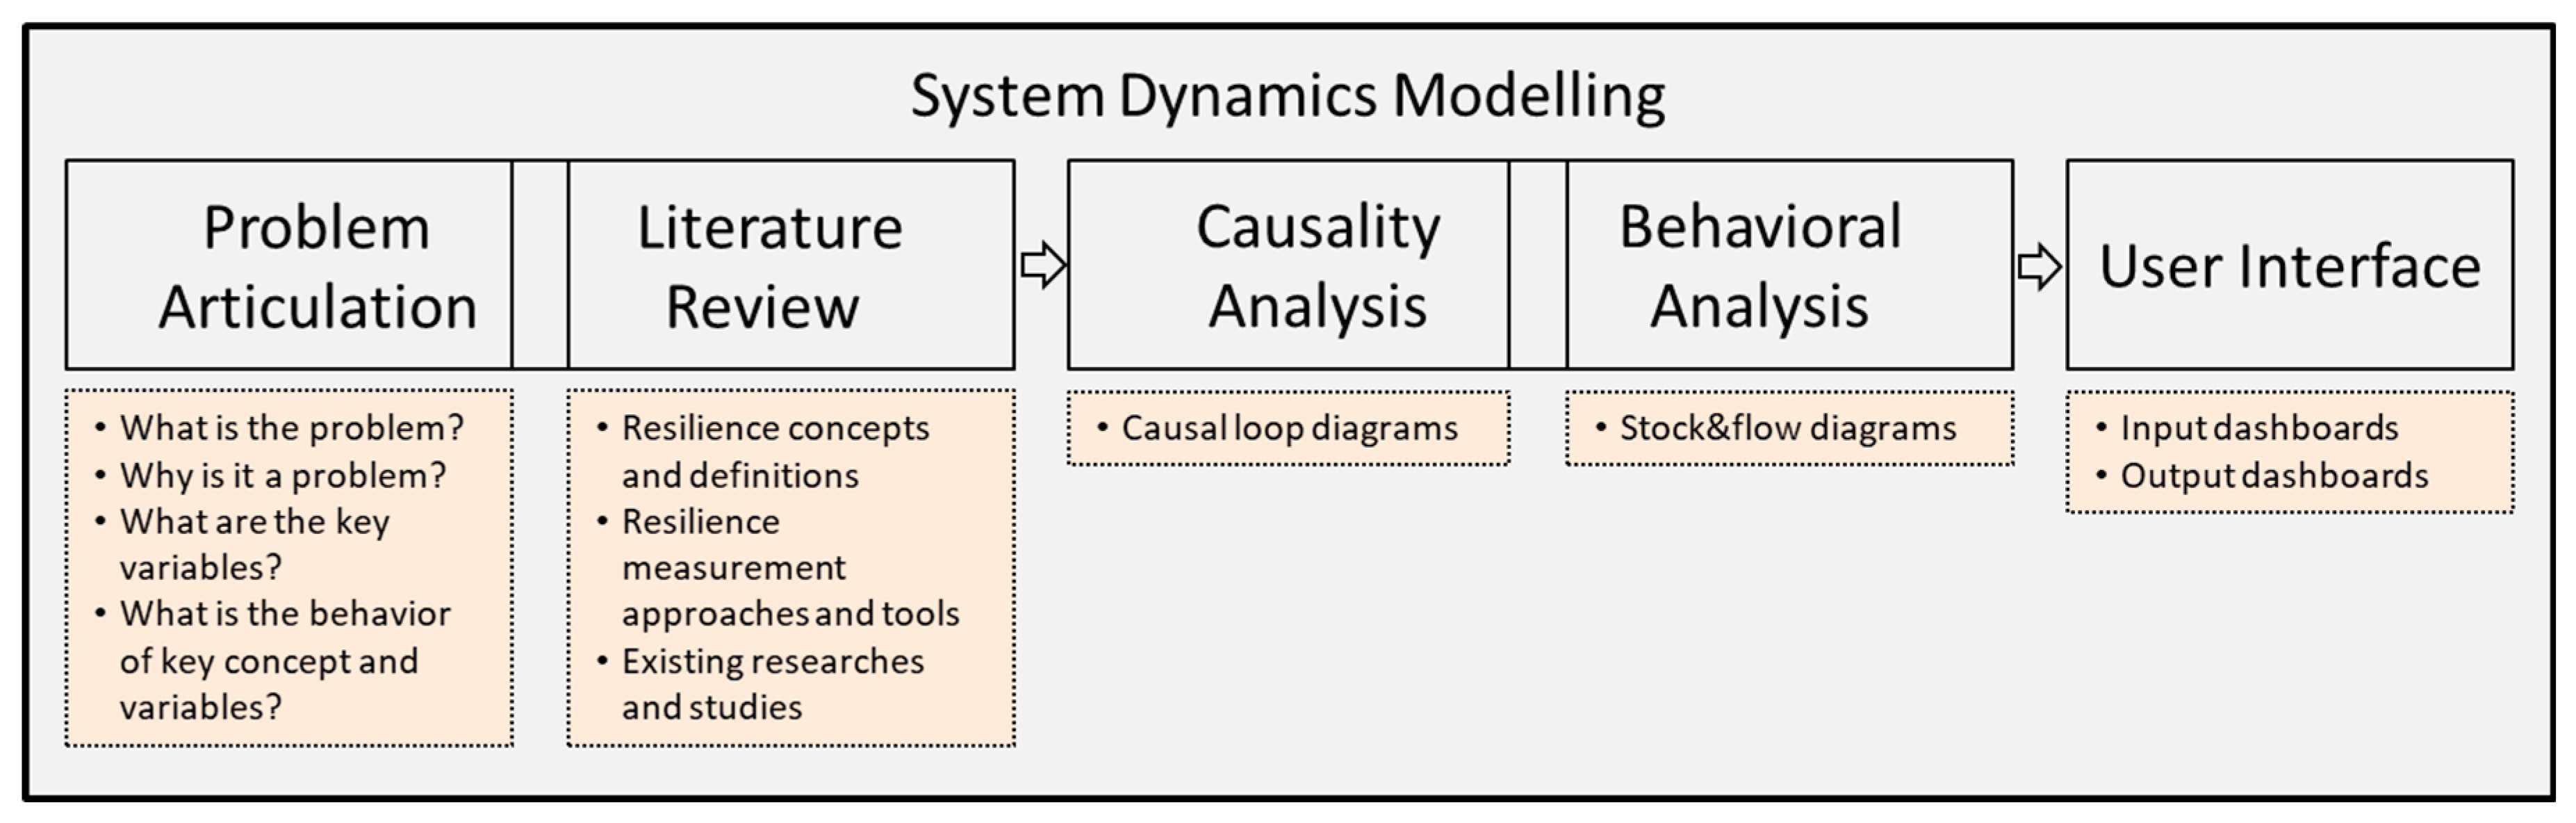
The system dynamics modeling and simulation paradigm is driving the methodology of the resilience model development. Figure 1 depicts the steps of the methodology. Having conducted problem articulation and literature review concurrently, we have made causality and behavioural analysis and developed the prototype model consisting of a user interface.
System dynamics is a mathematical modeling technique that is widely used to understand the nonlinear behaviour of complex systems [19,20]. The technique founded in the systems thinking approach uses computerized simulations to analyse dependencies, relationships, or interactions between the components that make up a system.
Resilience as a complex system has nonlinear behaviour; that is, a change in the input parameter does not cause a proportional change in the output. In order to reflect this nonlinear behaviour over time and to understand the complexity of the system, we have used system dynamics entities such as causal loops, modules, stocks, flows, and converters in the modeling process.
The system dynamics technique operates continuously to achieve results with high precision [19]. Calculations are repeated at each unit of time, and each calculation depends on the previous one. This causality feature is one of the strengths of the system dynamics approach. Consequently, the system dynamics technique creates a reliable visual reality for critical and complex problems.
2.1. Problem Articulation and Literature Review
We have conducted a literature review on concept and measurement techniques of resilience while defining the problem. This model development uses NATO’s resilience concept and definition (i.e., resilience through civil preparedness) mostly complying with the extant researches.
Defining the real problem is the starting point of any modeling process [20]. Therefore, the problem—has been identified as “how can resilience through civil preparedness (RtCP) be applied to deliver understanding of civil environment and its impact on NATO military operations”. RtCP is the individual and collective capacity to resist and recover from military, civilian, economic or commercial shocks, absorb damage, and resume function as quickly and efficiently as possible [21,22].
The main rationale behind discussing RtCP as a (complex) problem is that RtCP is almost infinitely complex and multidimensional with countless nodes and layers of interdependency, and is influenced transnationally by a range of pressures applied by diplomatic, information, military, and economic instruments [21,22,23]. Moreover, resilience should not be viewed and analyzed discretely; a shock in one area may be mitigated by capacity in another or it may have cascading impacts that indiscriminately propagate across national borders and increase in scope and complexity [23].
Having articulated the problem, we have identified key variables. These variables include measurable metrics and calculated indicators. Metrics comprise seven baseline requirements (Continuity of Government, Energy Supplies, Movement of People, Food and Water, Mass Casualties, Communication, and Transportation) [21,22] and shocks (Electricity Blackout, Cyber Attack, Martial Law Enforcement, Big Human Movement, State of War, and Armed Conflict) [24]. Indicators involve resilience main domains (Civil support to the military, Continuity of Government, and Continuity of Essential Services) [21] and risk assessment functions (Command and Control, Protection, Movement/Maneuver, and Sustain).
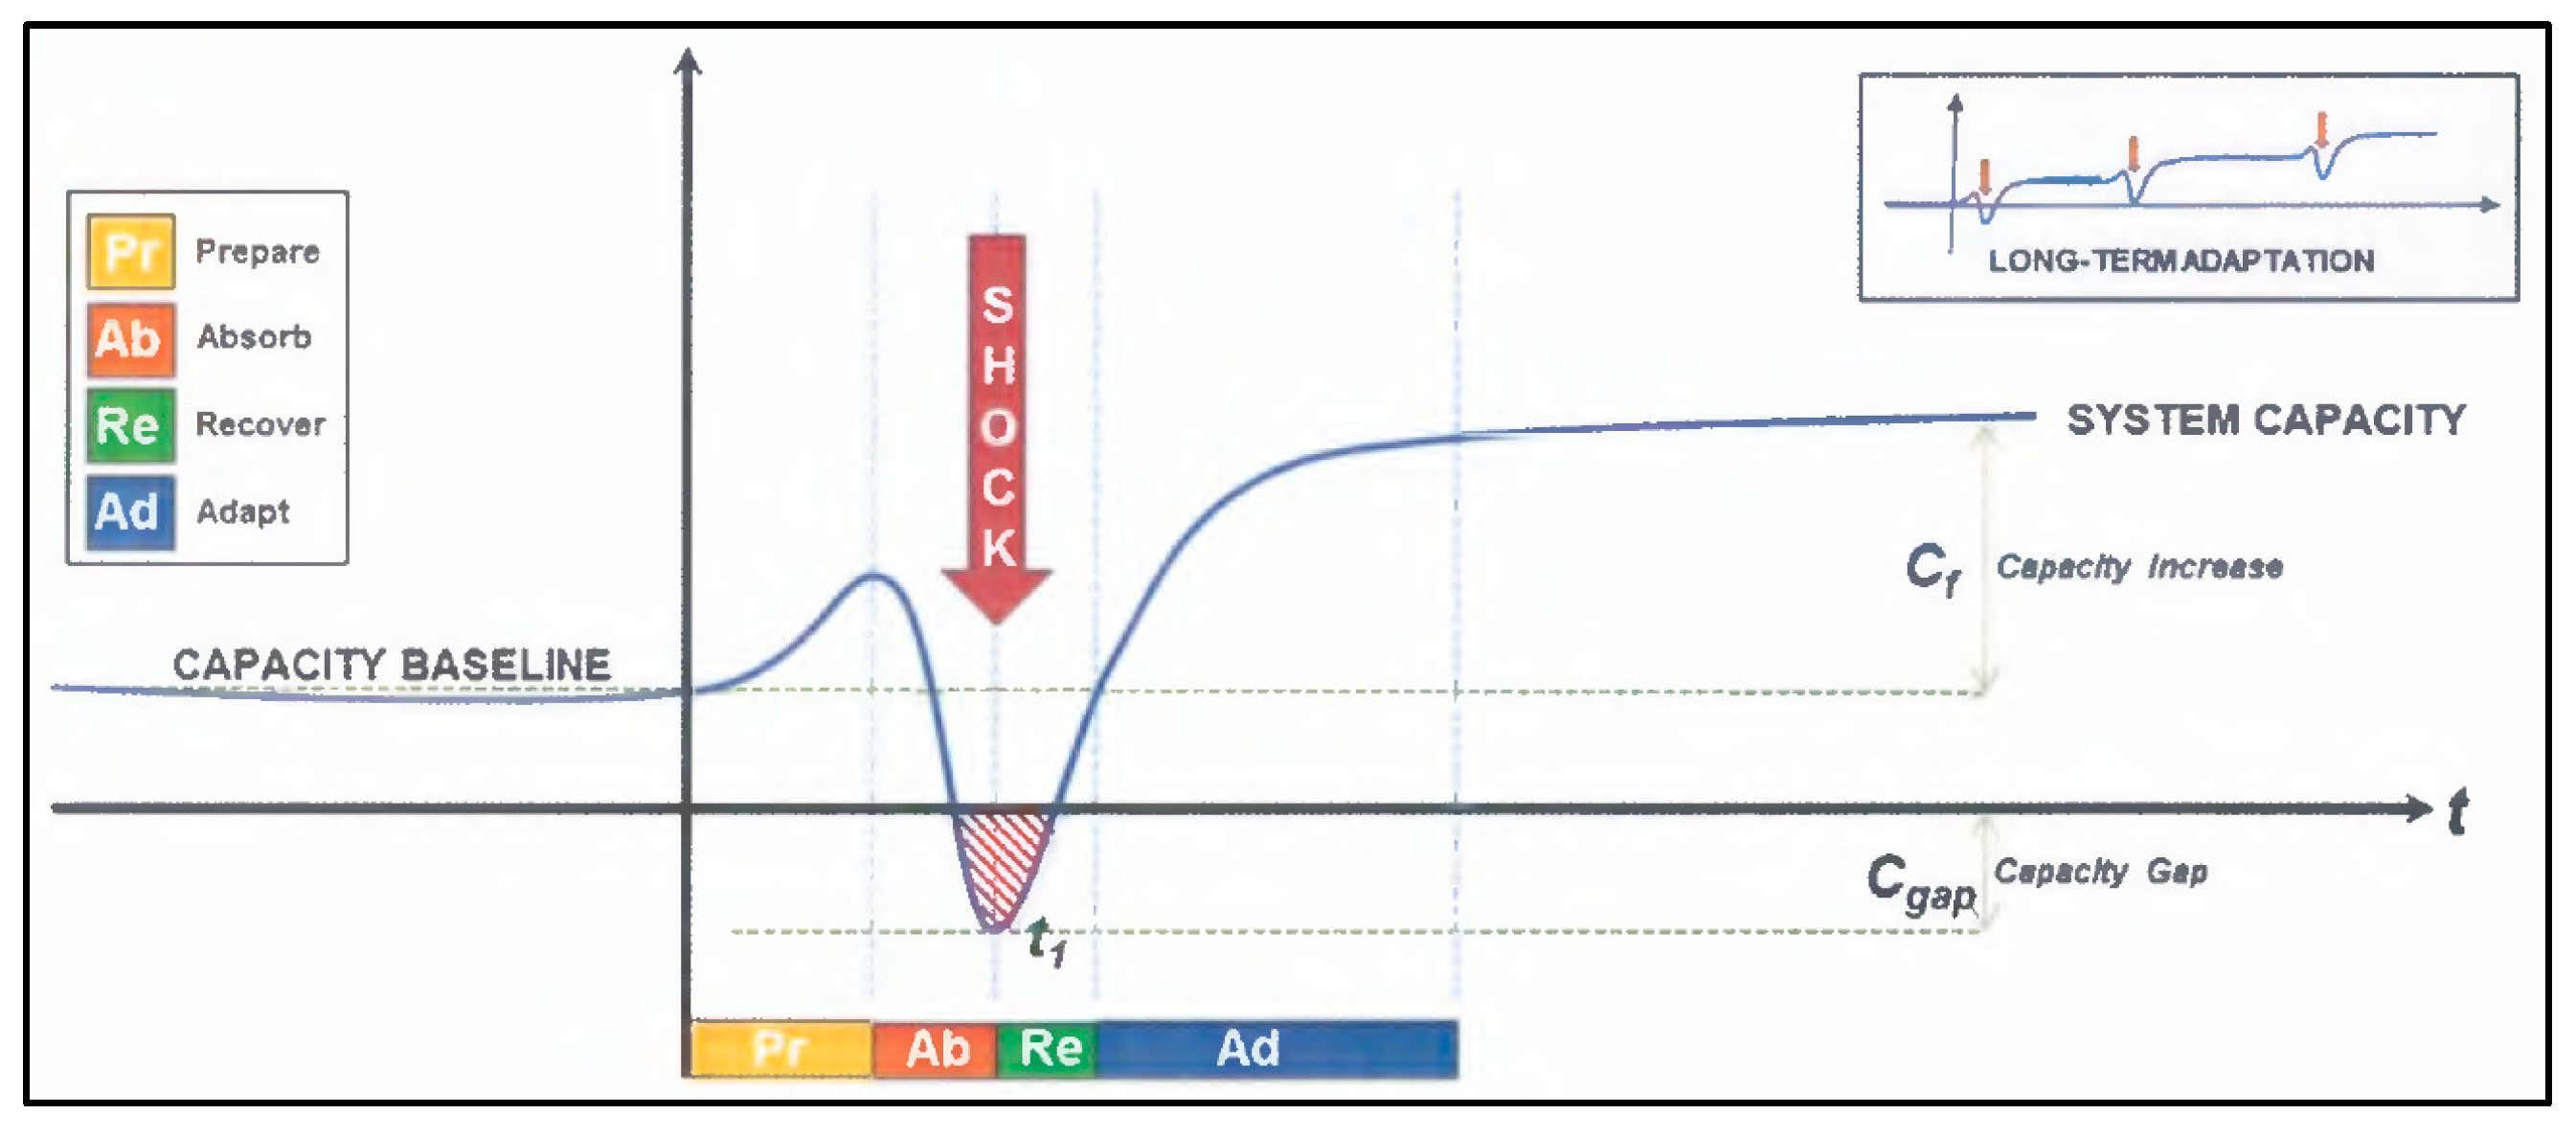
NATO’s strategic resilience concept (Figure 2) is an adaptive process in which resilience performance is measured by absorbing strategic shocks with minimal impact (Cgap) while maintaining essential functions at an acceptable level, then recovering functionality at a reasonable time (t1) and at a reasonable cost. Therefore, a well-integrated system focuses specifically on managing the local consequences of an attack and isolating the event from the overall system function, thus making the adversary’s value proposition unfavorable. Then, the system adapts and increases its capacity (Cf) to withstand future shocks with a reduced surface area of vulnerability exposed to the adversary and increased speed of system recovery [23].
2.2. Causality and Behavioural Analysis
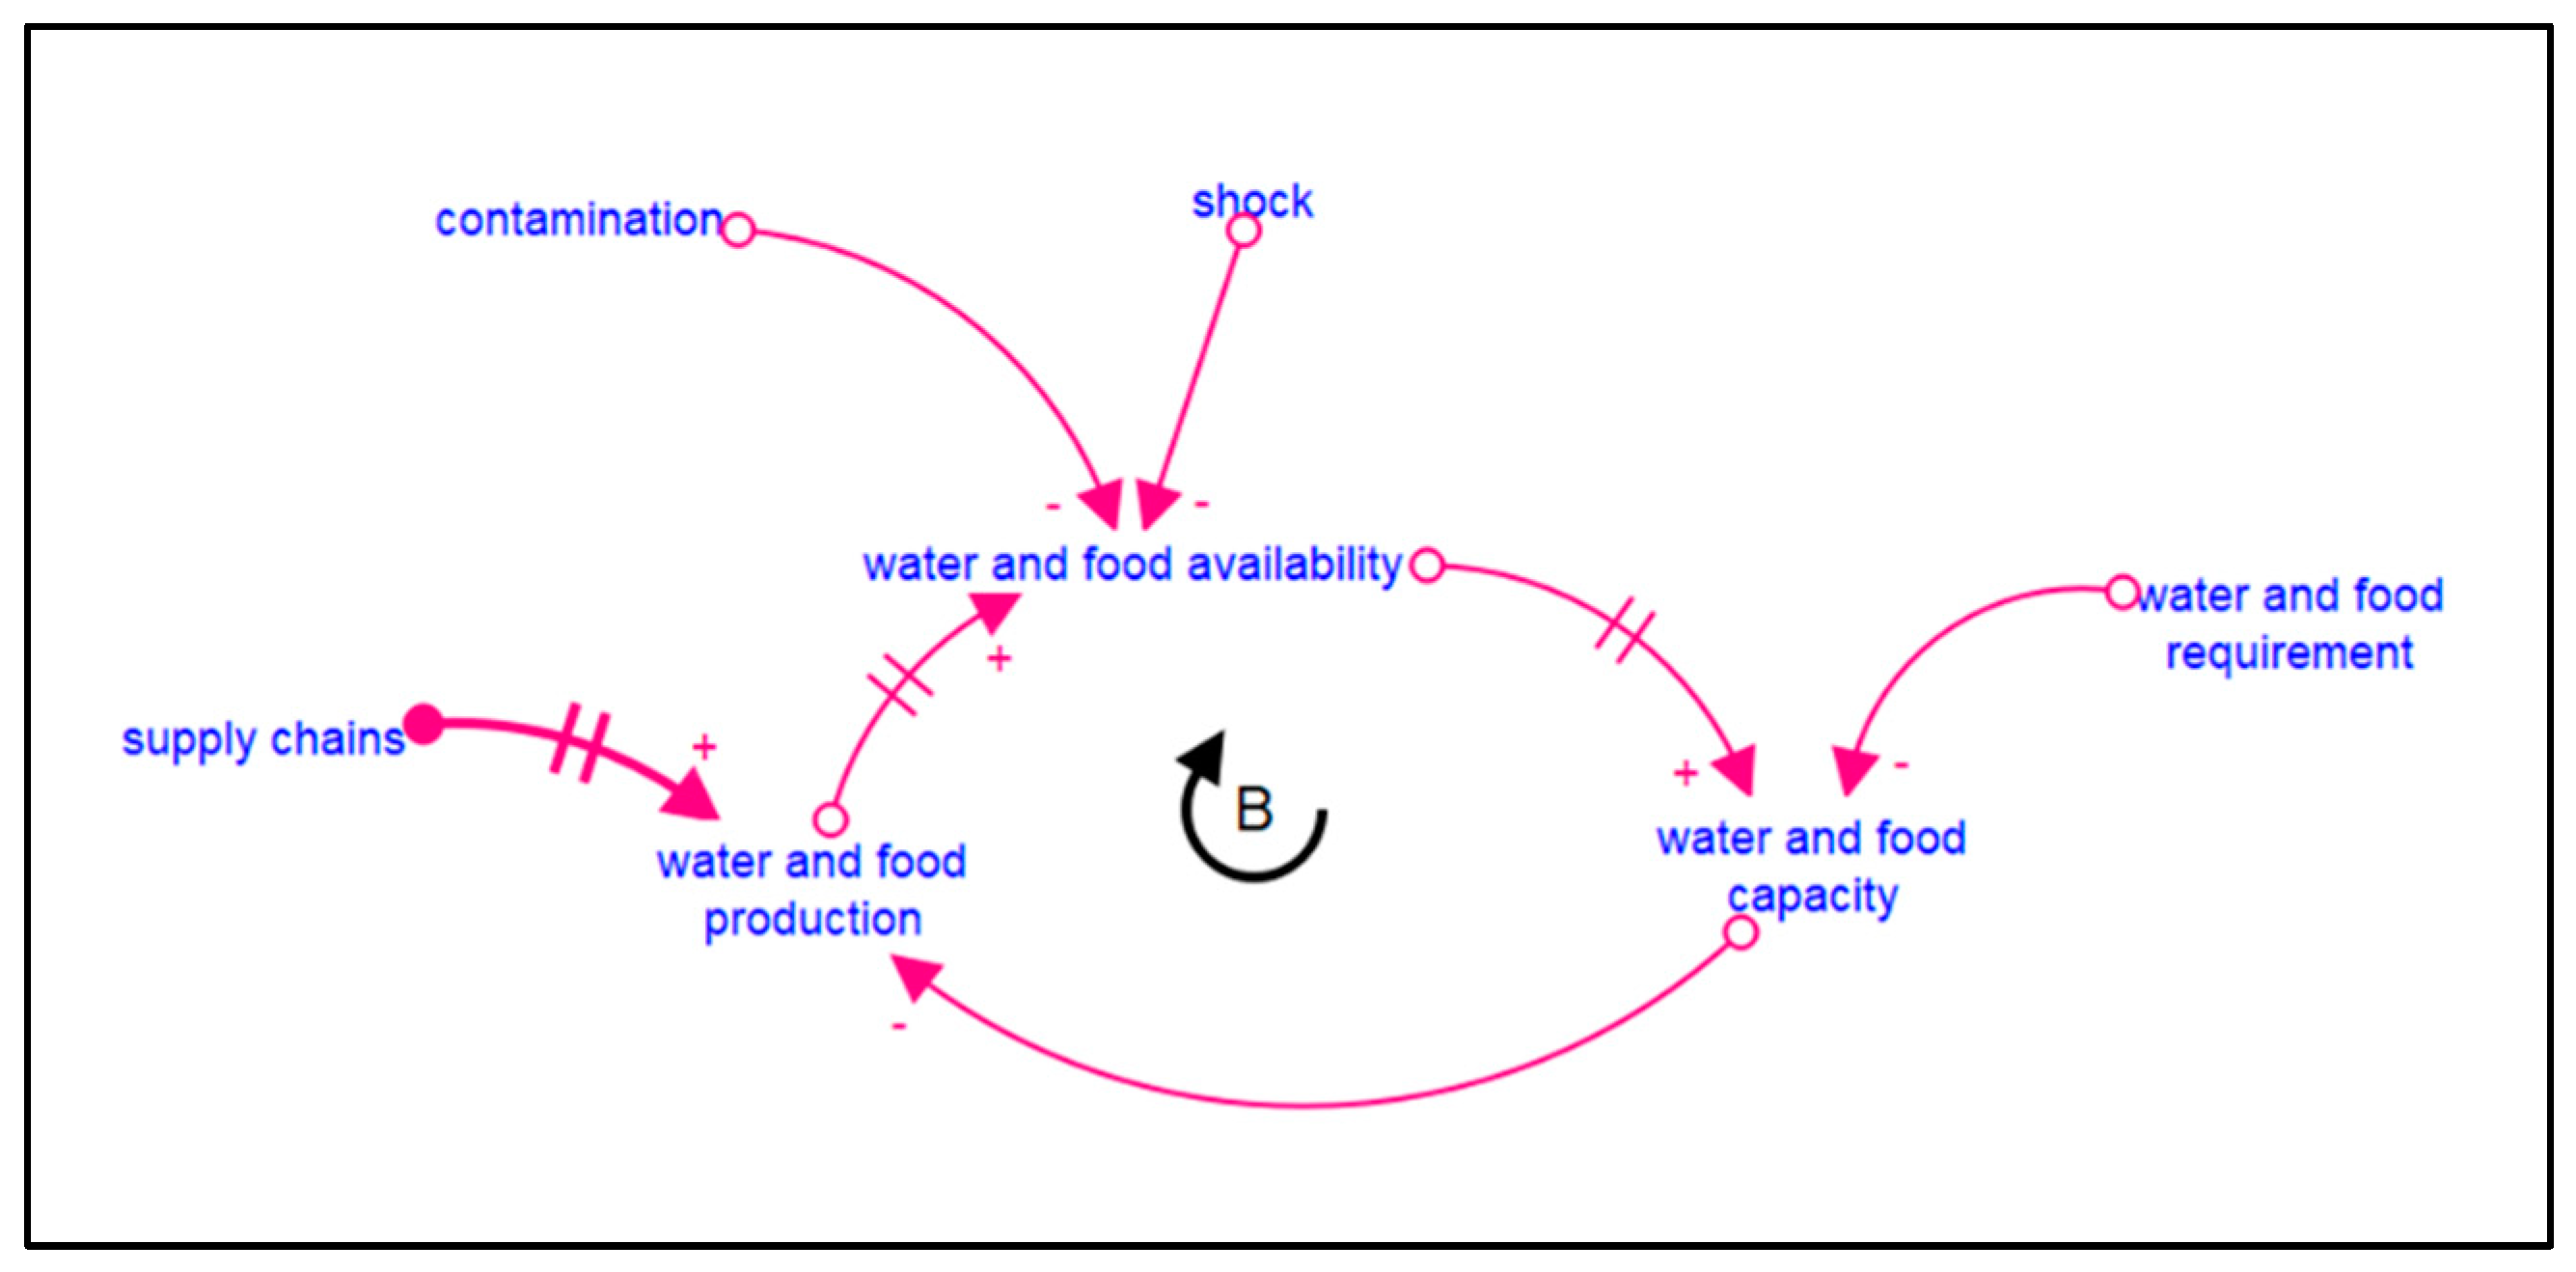
We have built causal loop diagrams for each Resilience with seven baseline requirements. These diagrams are good at communicating the important feedback that is responsible for the complex problem in focus [20]. Feedback loops representing interactions among the parts of a system rather than the number of the parts enables better understanding of complex systems [25]. Parameters (there are around 150 parameters in the prototype model) shaping the structure and behavior of each baseline requirement have been defined (with an endogenous focus) via NATO’s resilience evaluation criteria matrix that is used to evaluate the NATO countries’ resilience level. As a sample, Figure 3 depicts a causal loop diagram of food and water baseline requirements.
Parameters having causal relations are connected with links that are labeled with appropriate polarities. If a link is denoted with “+”, then parameters that are the subject of that particular link move in the same direction (i.e., if the cause increases the effect increases and if the cause decreases the effect decreases). If the polarity of a link is “−”, then the relevant parameters move in the opposite direction (i.e., if the cause increases the effect decreases and if the cause decreases the effect increases). Important feedback loops are also labeled with either “B” as balancing (negative) or “R” as reinforcing (positive). Different modes of behaviour in complex systems are identified with balancing or reinforcing feedback mechanisms, where the growth mode is generated by a reinforcing loop, goal-seeking mode is generated by a balancing loop, and oscillations are created by balancing loops with time delays [20]. Delays being the most salient factors to create dynamics are denoted with double stripes on the links within the causal loop diagrams.
When we consider the water and food baseline, a requirement emerges both from civilian and military stakeholders. As the level of requirement increases, the water and food capacity decreases accordingly. The decreasing water and food capacity increase the volume of production that can also be increased by supplies with time delays from various chains. As the volume of the produced and/or acquired water and food increases, the water and food availability increases with a time delay because of logistics and administrative delays. Yet, a possible contamination case and/or a shock happening balance the level of water and food availability. Therefore, we have constructed an oscillated structure complying with the resilience behaviour concept for the water and food baseline.
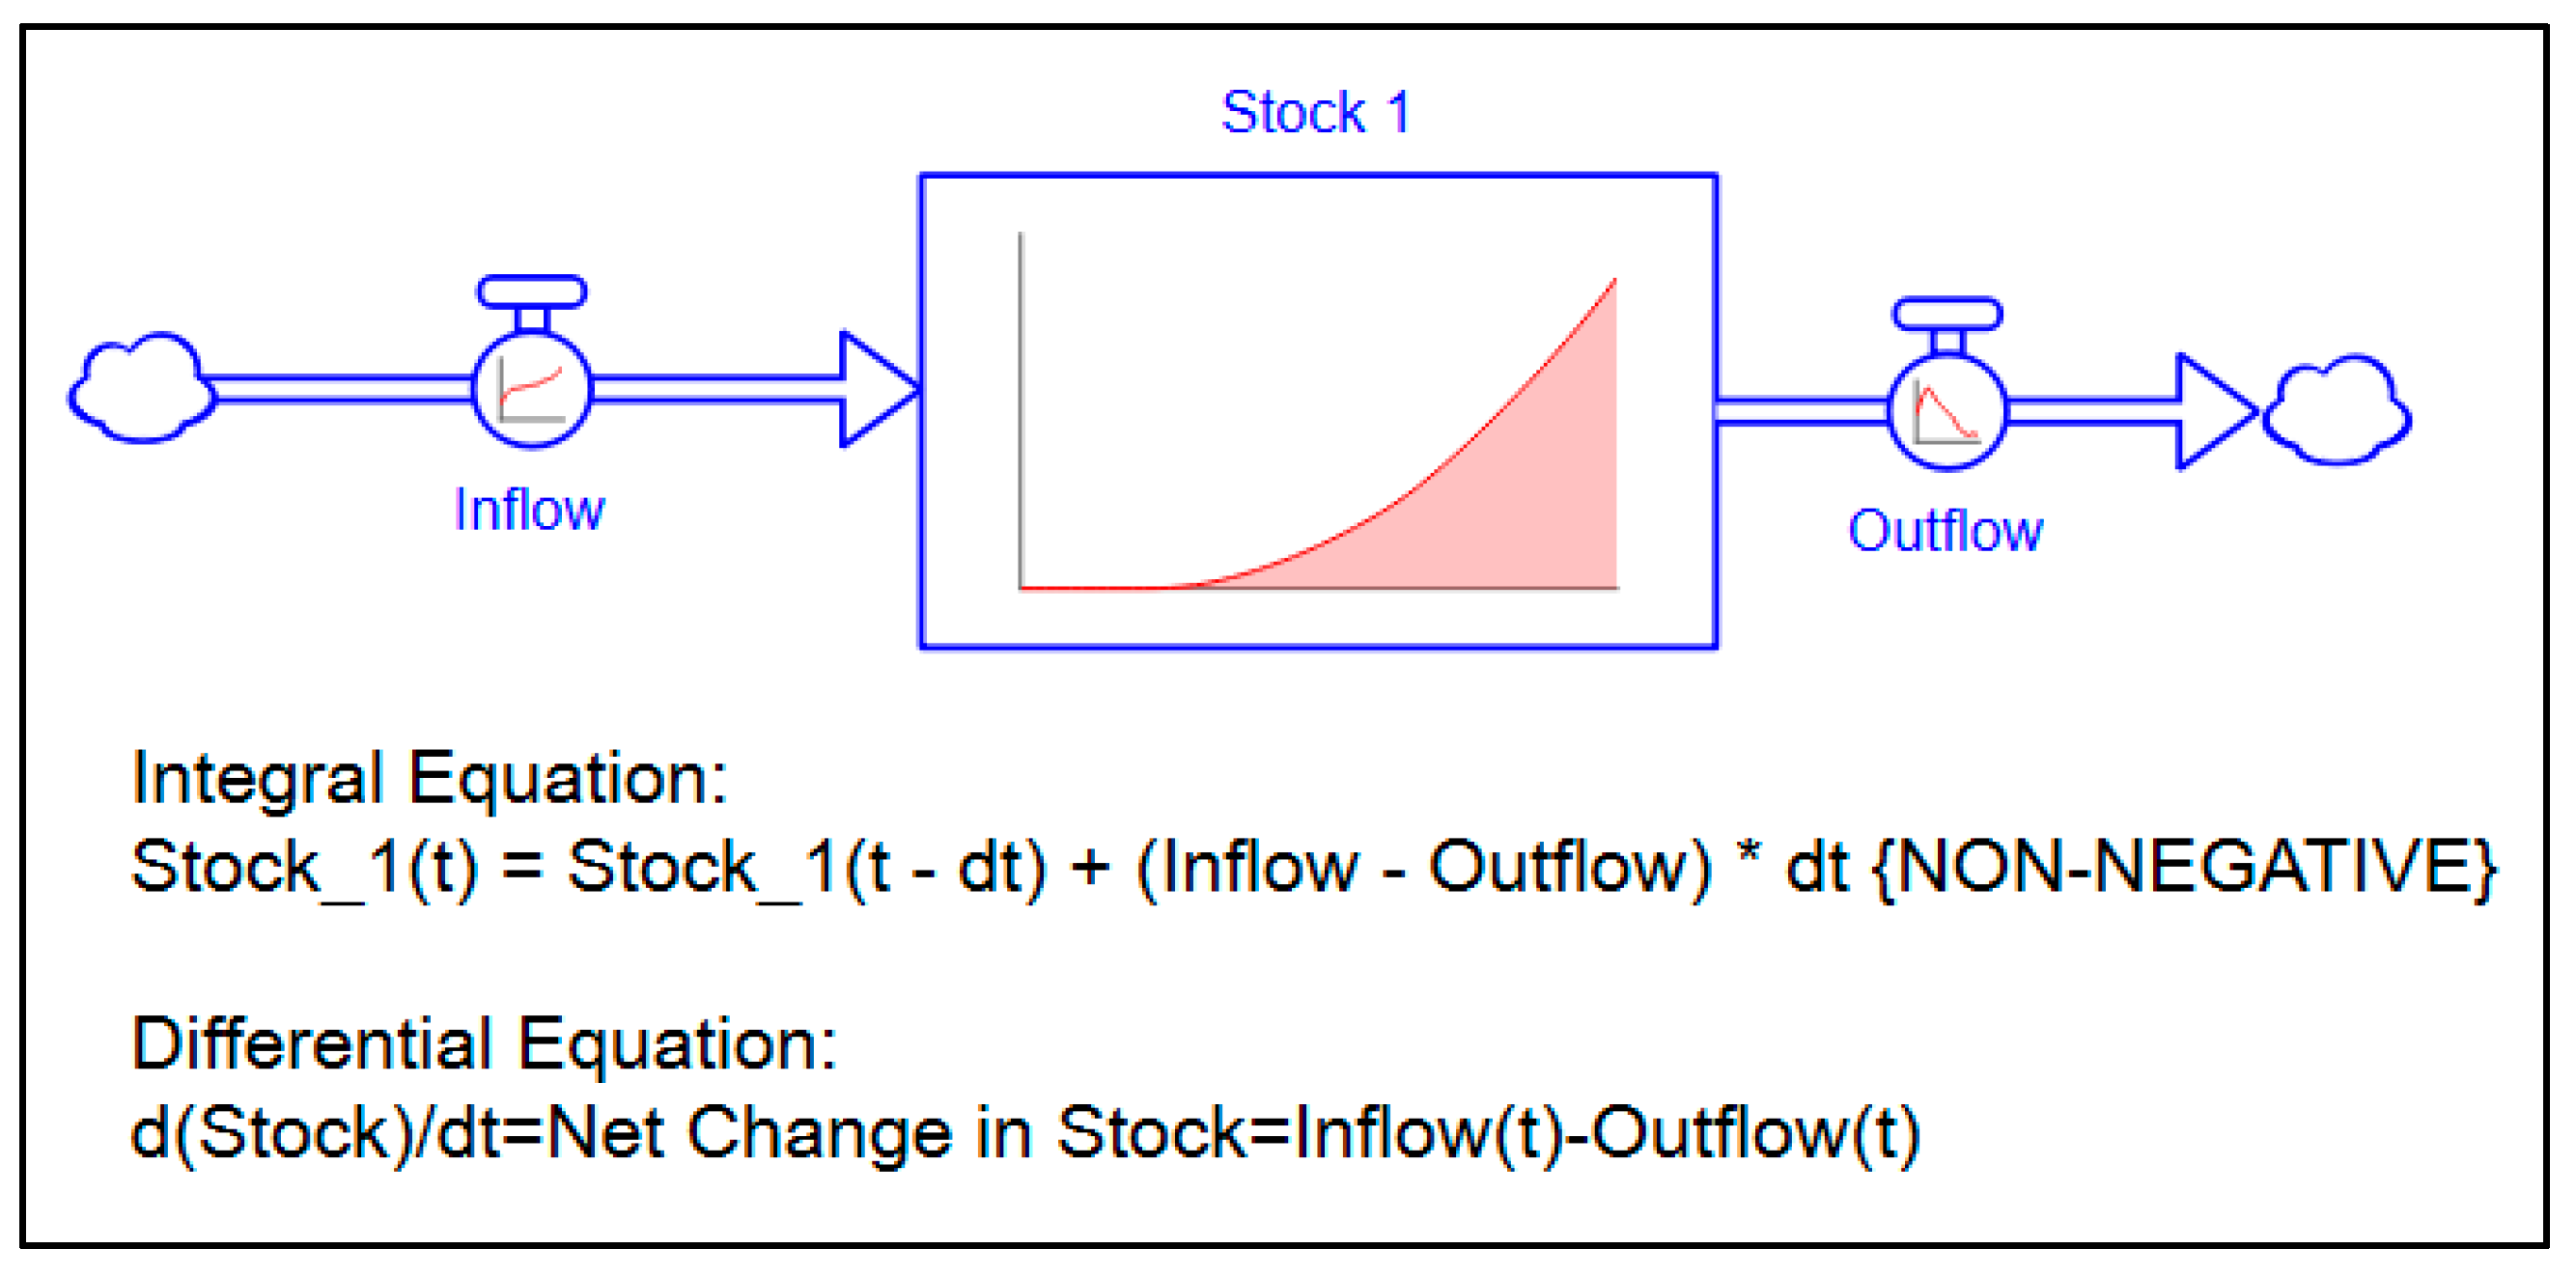
Along with the causal loop diagrams, we have modeled the dynamics of each baseline requirement via stock and flow diagrams. Figure 4 shows a generic stock and flow structure.
Stocks of which content is managed through an inflow and outflow characterize the state of a system and provide inertia and memory [20]. The stock and flow structure can also be represented by either an integral equation (inflow represents the value of the inflow at any time between the initial time and current time) or equivalently by a differential equation (the net change of any stock—inflow less the outflow) [20].
We have aggregated relevant parameters under the baseline requirements by using converters to model three resilience main domains and four-risk assessment functions, while modeling the resilience capacity for each baseline requirement via stock and flows.
2.3. User Interface
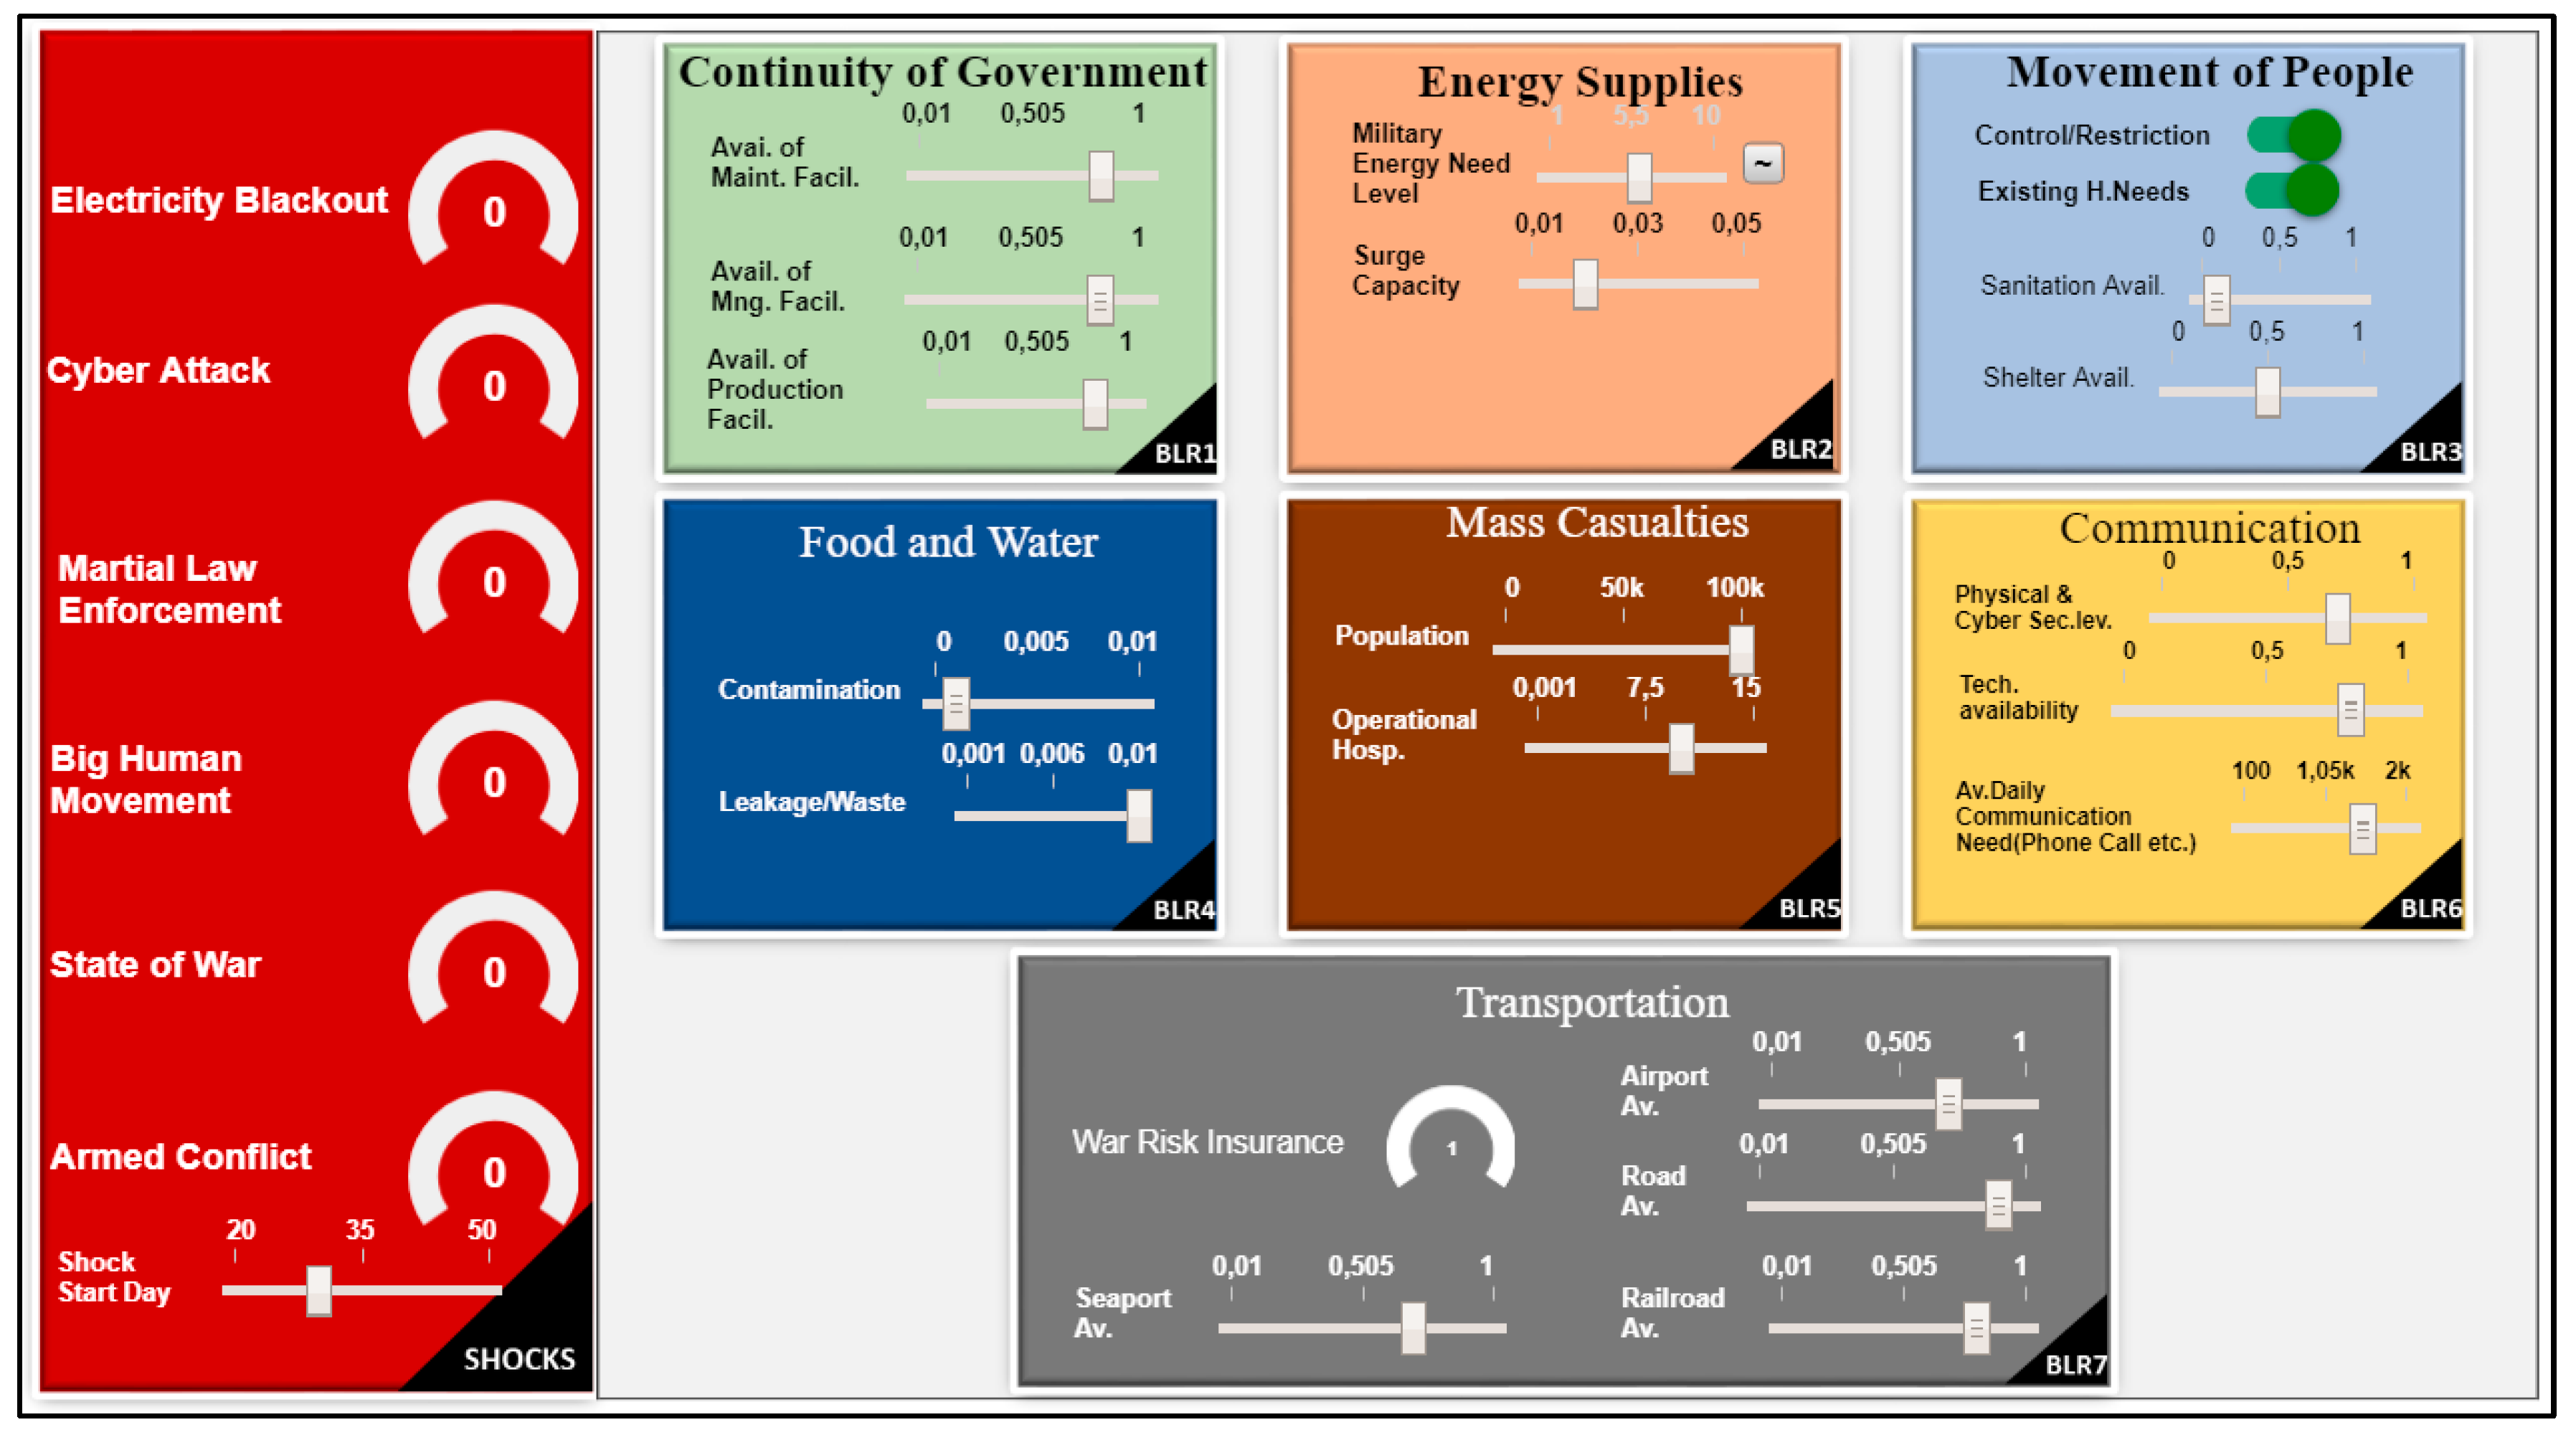
The prototype resilience model includes both input and output dashboards. The input dashboard (Figure 5) provides a cockpit for the users (decision makers) to generate various scenarios by modifying both shocks and baseline requirements parameters.
The input dashboard includes different scaling options for shock types and baseline requirements. Shocks can be turned on and off and start days of the shocks can be determined on the dashboard. Users can create various what-if analysis by changing the values of these parameters in the input dashboard. Therefore, the prototype model has the capacity to measure time-based NATO’s resilience within various scenarios and enables studying of the secondary and third effects.
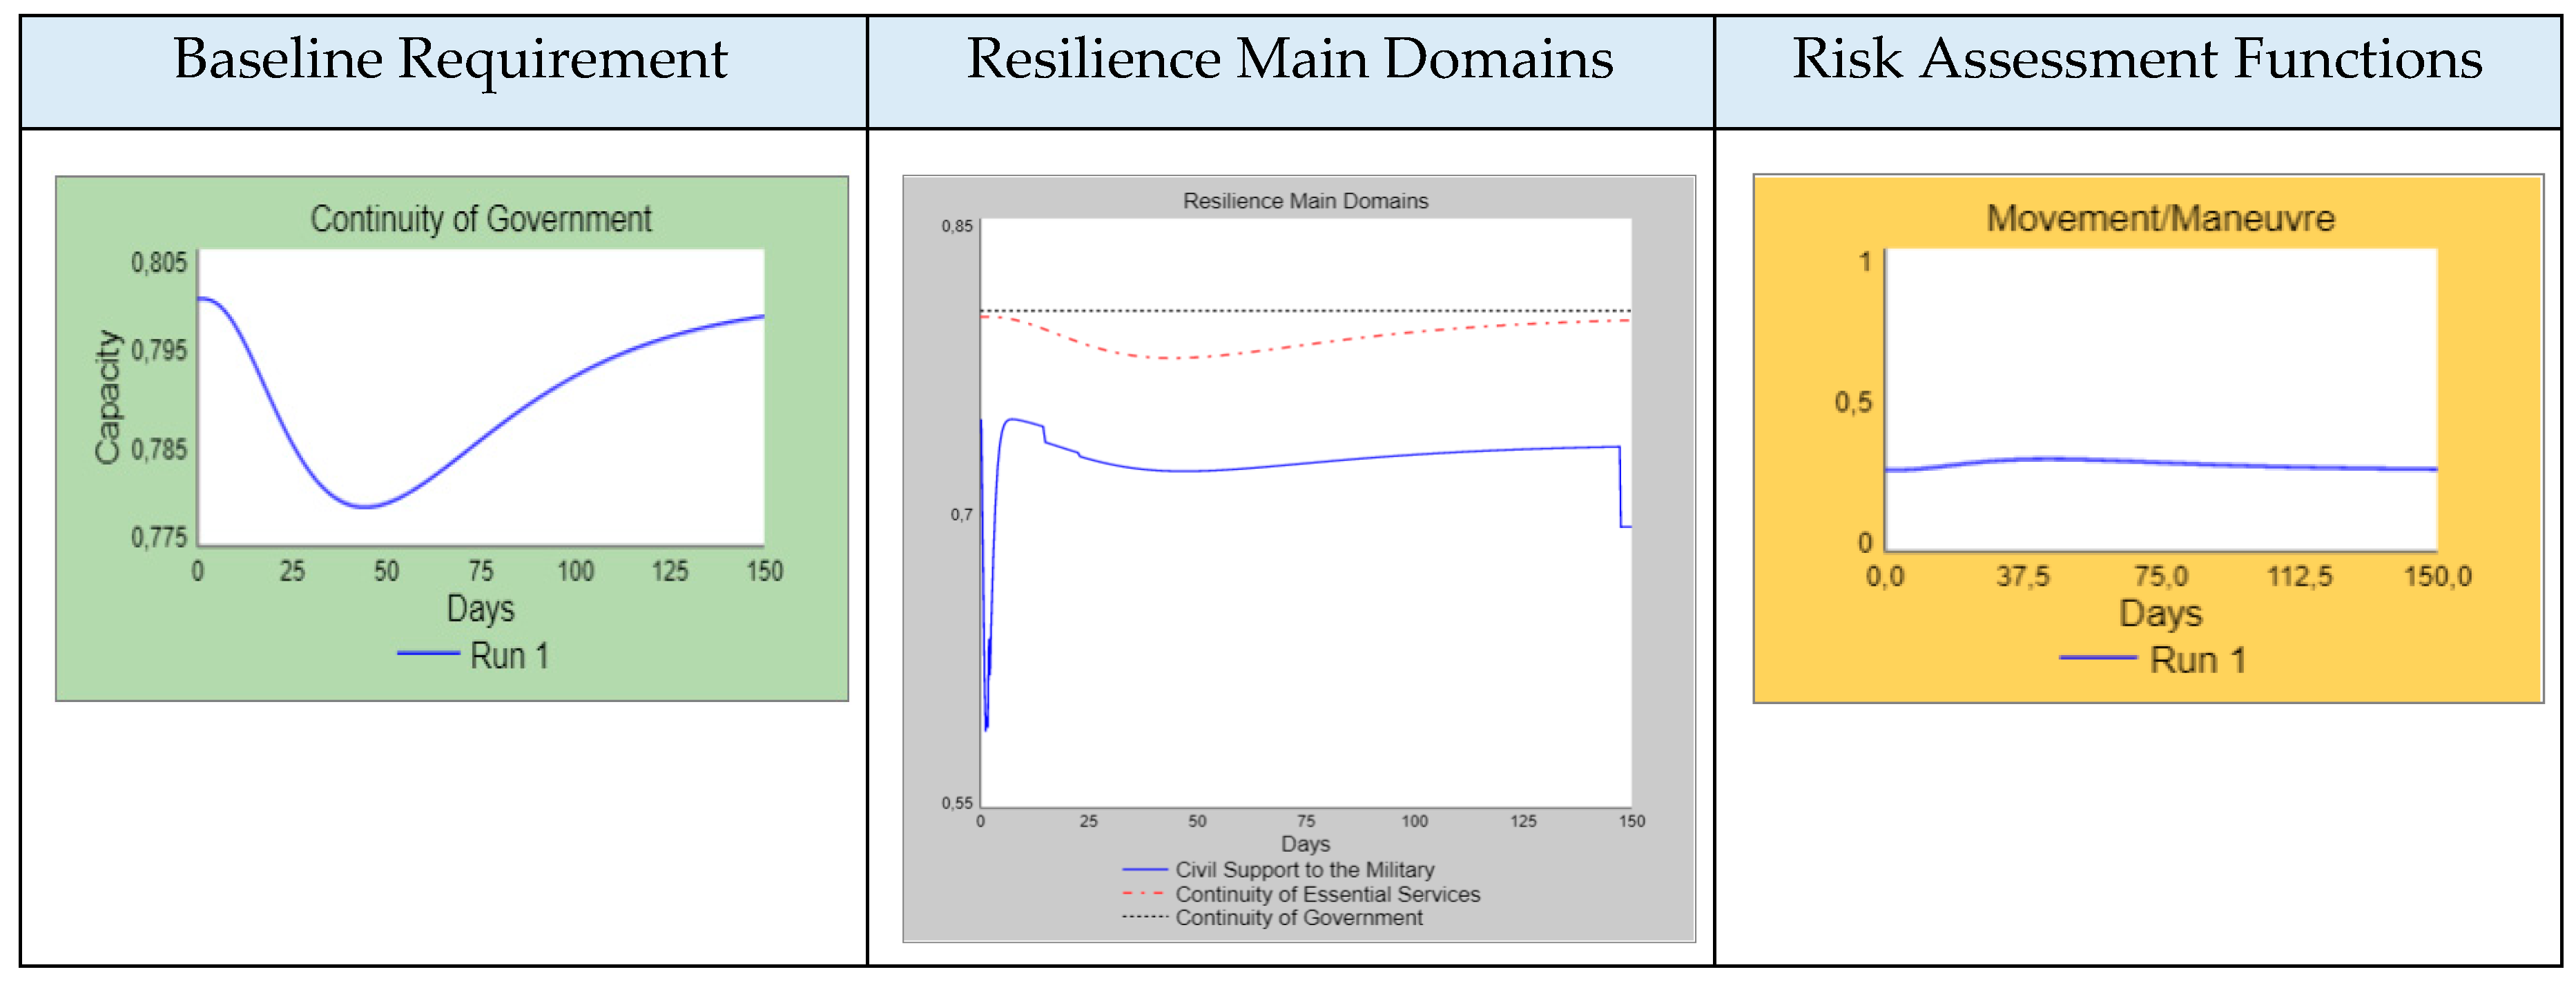
We have developed the output dashboard as three separate pages to provide output graphs showing resilience capacities of each baseline requirement and resilience main domain, and level of risk for each risk assessment function. Figure 6 depicts sample graphs extracted from the output dashboard.
Users have the opportunity to see the (time-based) results of each simulation run on the related graph concurrently. Therefore, the prototype model provides a benchmarking capability for the results obtained from different scenarios. In Figure 6, the left part demonstrates the Continuity of Government as one of the resilience baseline requirements as a time function driven by baseline scenario parameters. The middle part in Figure 6 describes the resilience main domains (Civil Support to the Military, Continuity of Government, and Continuity of Essential Services) capacities as a time function, and finally the right part in Figure 6 describes the risk assessment function (Movement/Manoeuvre).
3. Results
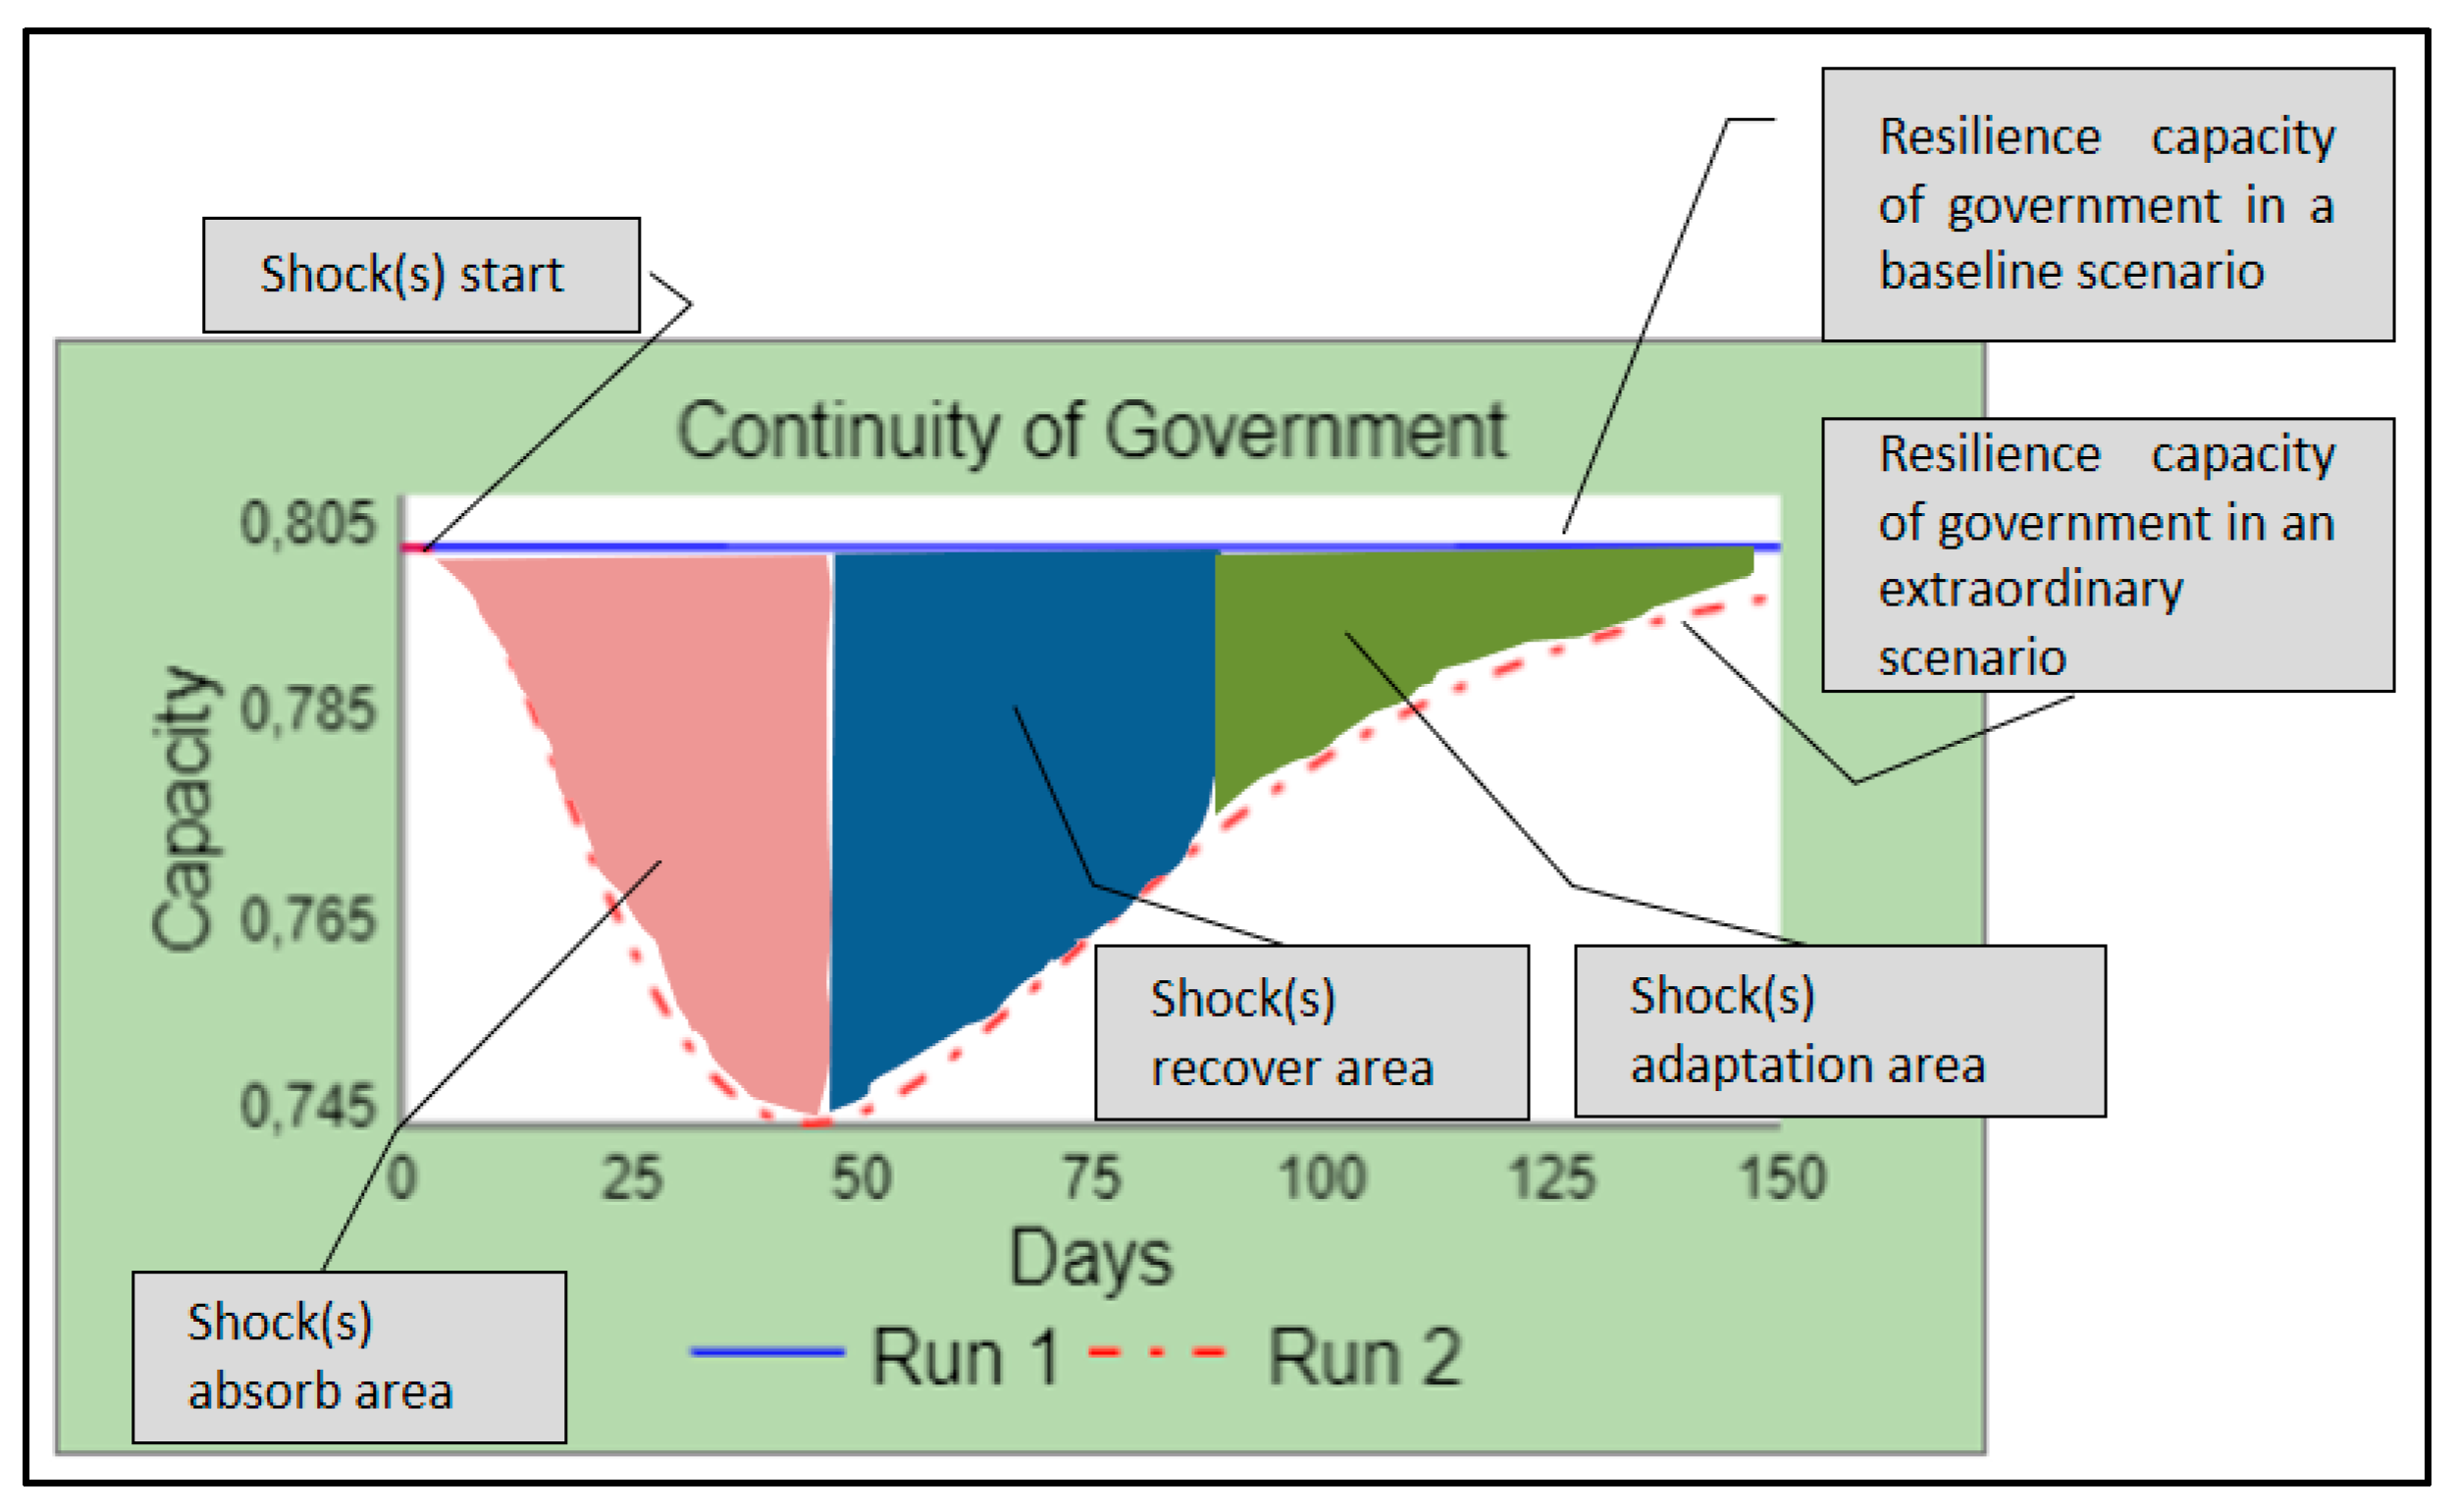
Users defined the initial values of the input parameters based on the baseline scenario during the validation workshop. The baseline scenario corresponds to the current situation of Day 0 in the Area of Operation. When the model is run with the baseline scenario (without any shock effect), we get the normal capacity of the baseline requirements, resilience main domains, and the normal risk values. When the model is run with shock injections (extraordinary scenario), we see the effects of the shocks on the output values. Figure 7 shows a sample graph depicting both baseline and extraordinary scenario outputs for continuity of government baseline requirements.
Within the baseline scenario, the simulation starts at time t0 (Run 1), and resilience capacity of continuity of government follows a steady pattern around 0.8 for 150 days. When the extraordinary scenario where all shock types are turned on takes place (Run 2), the resilience capacity of continuity of government follows a pattern converging to the NATO resilience concept. In the latter scenario, the effects of shocks start to be seen around t10, and those effects increasingly continue until around t50 (shocks absorb area in the graph). After the absorption phase, continuity of government baseline behaves for recovering the effects of shocks (shocks recover area in the graph) until around t90. The resilience capacity starts to go up to the normal pattern as depicted in the shock adaptation area in the graph (t90–t150).
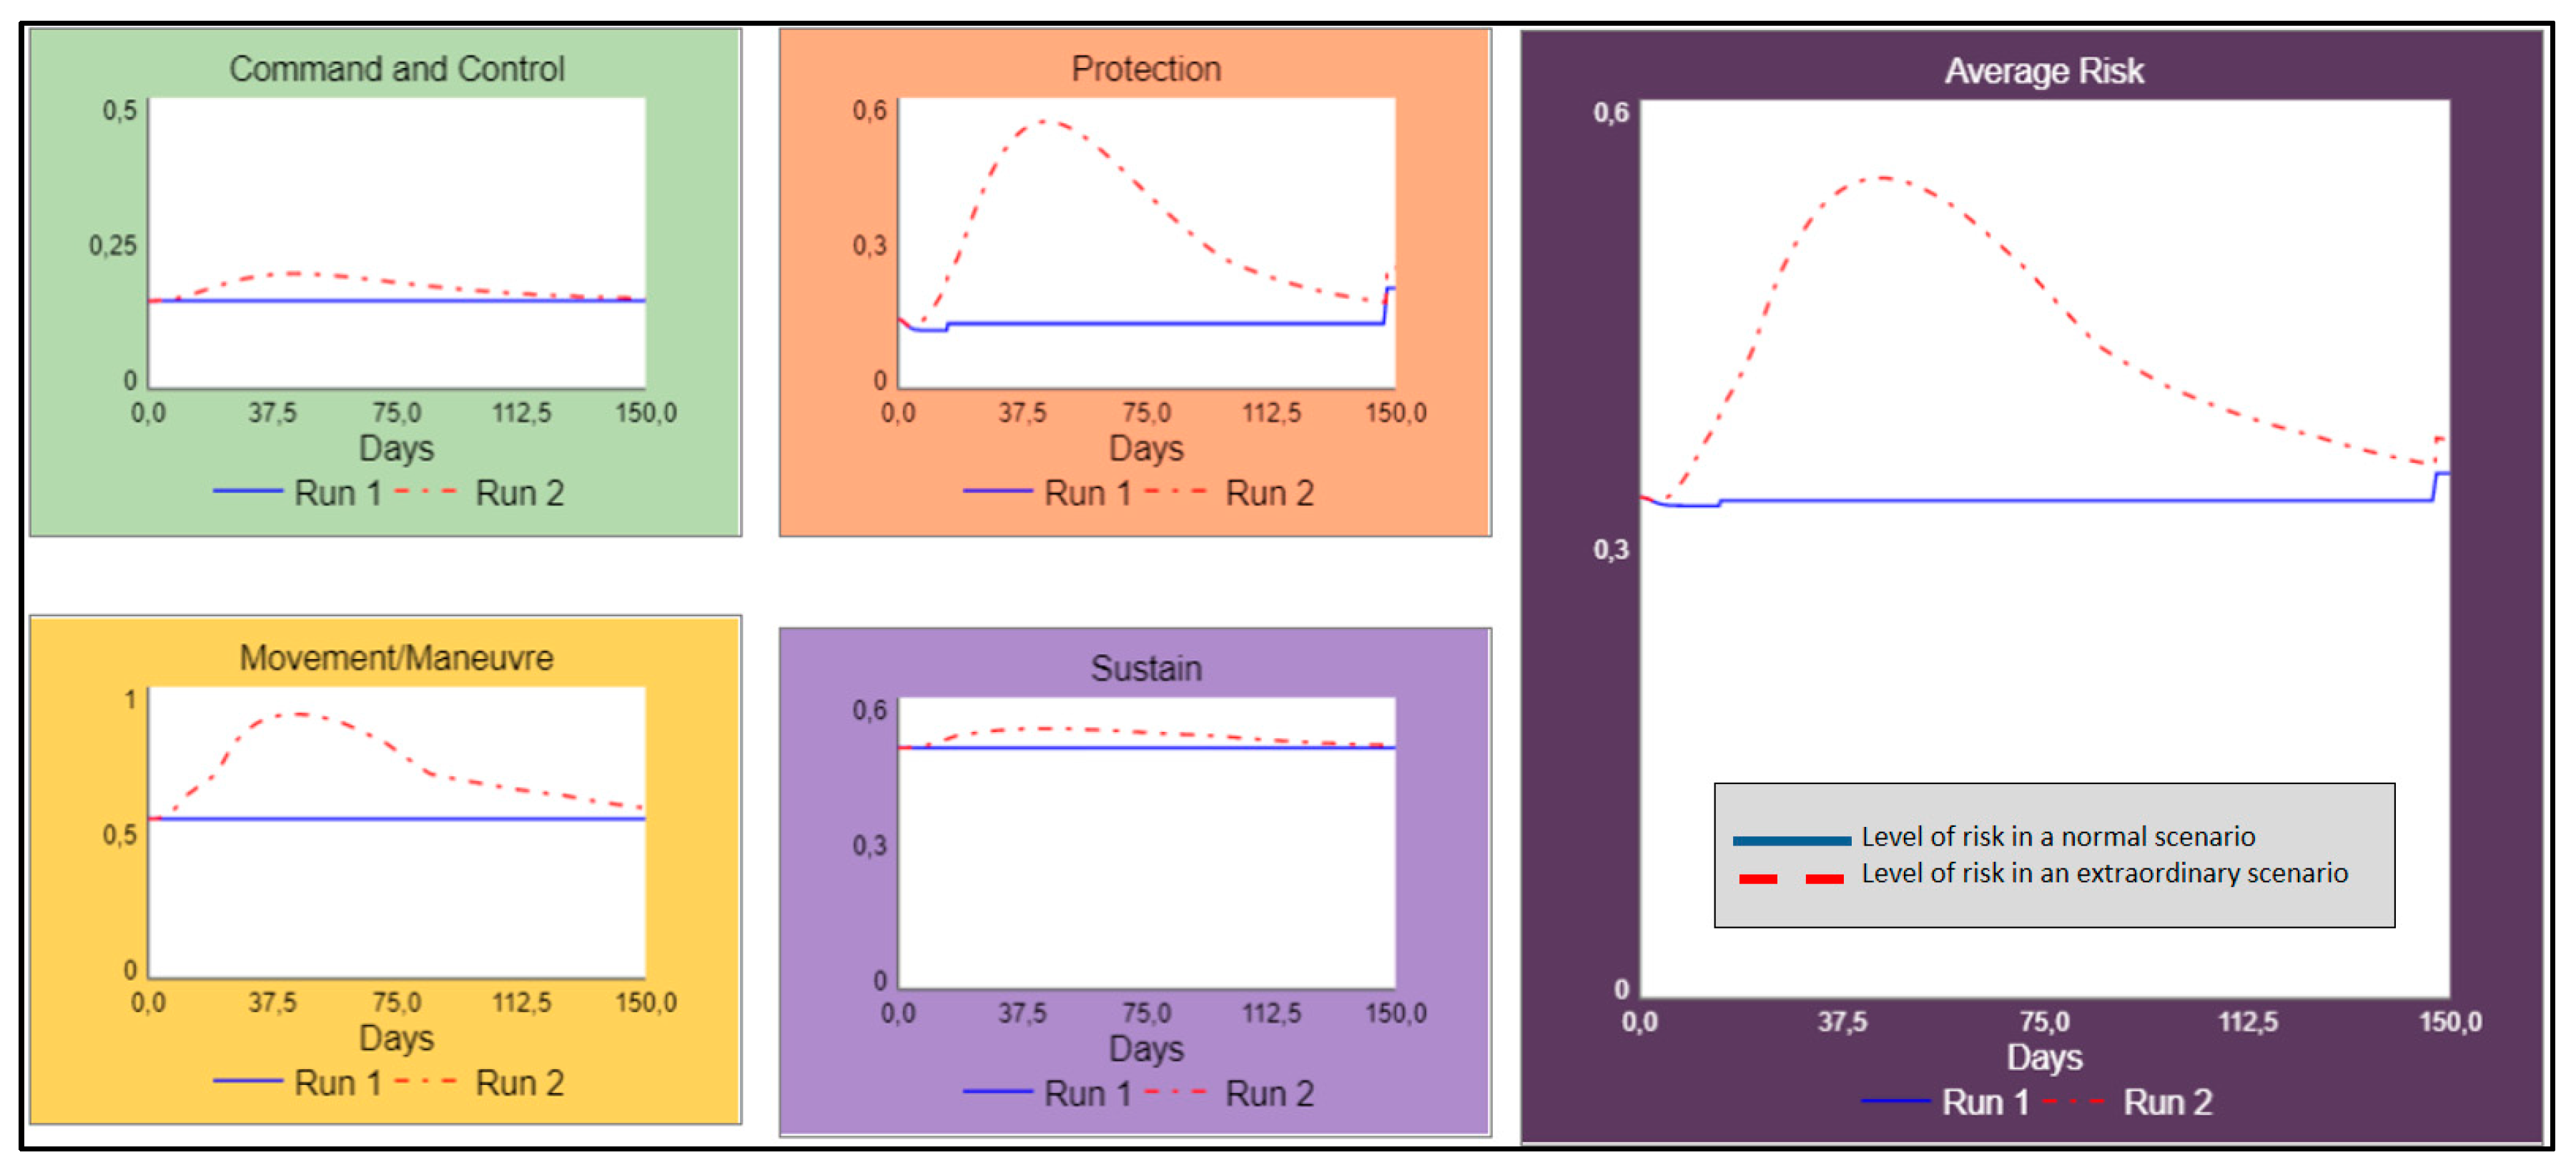
We have determined the risk assessment functions by an inverse function of the resilience capacity. The higher the resilience capacity occurs, the lower the level of risk for four different risk assessment functions (Command and Control, Protection, Movement/Manoeuvre, and Sustain). Figure 8 provides risk assessment output graphs.
The above graphs in Figure 8 show that all risk functions have acceptable levels of risk when the model runs the baseline scenario (Run 1). When the extraordinary scenario is inserted into the simulation (Run 2), the risk levels behave in the opposite direction of the resilience capacities.
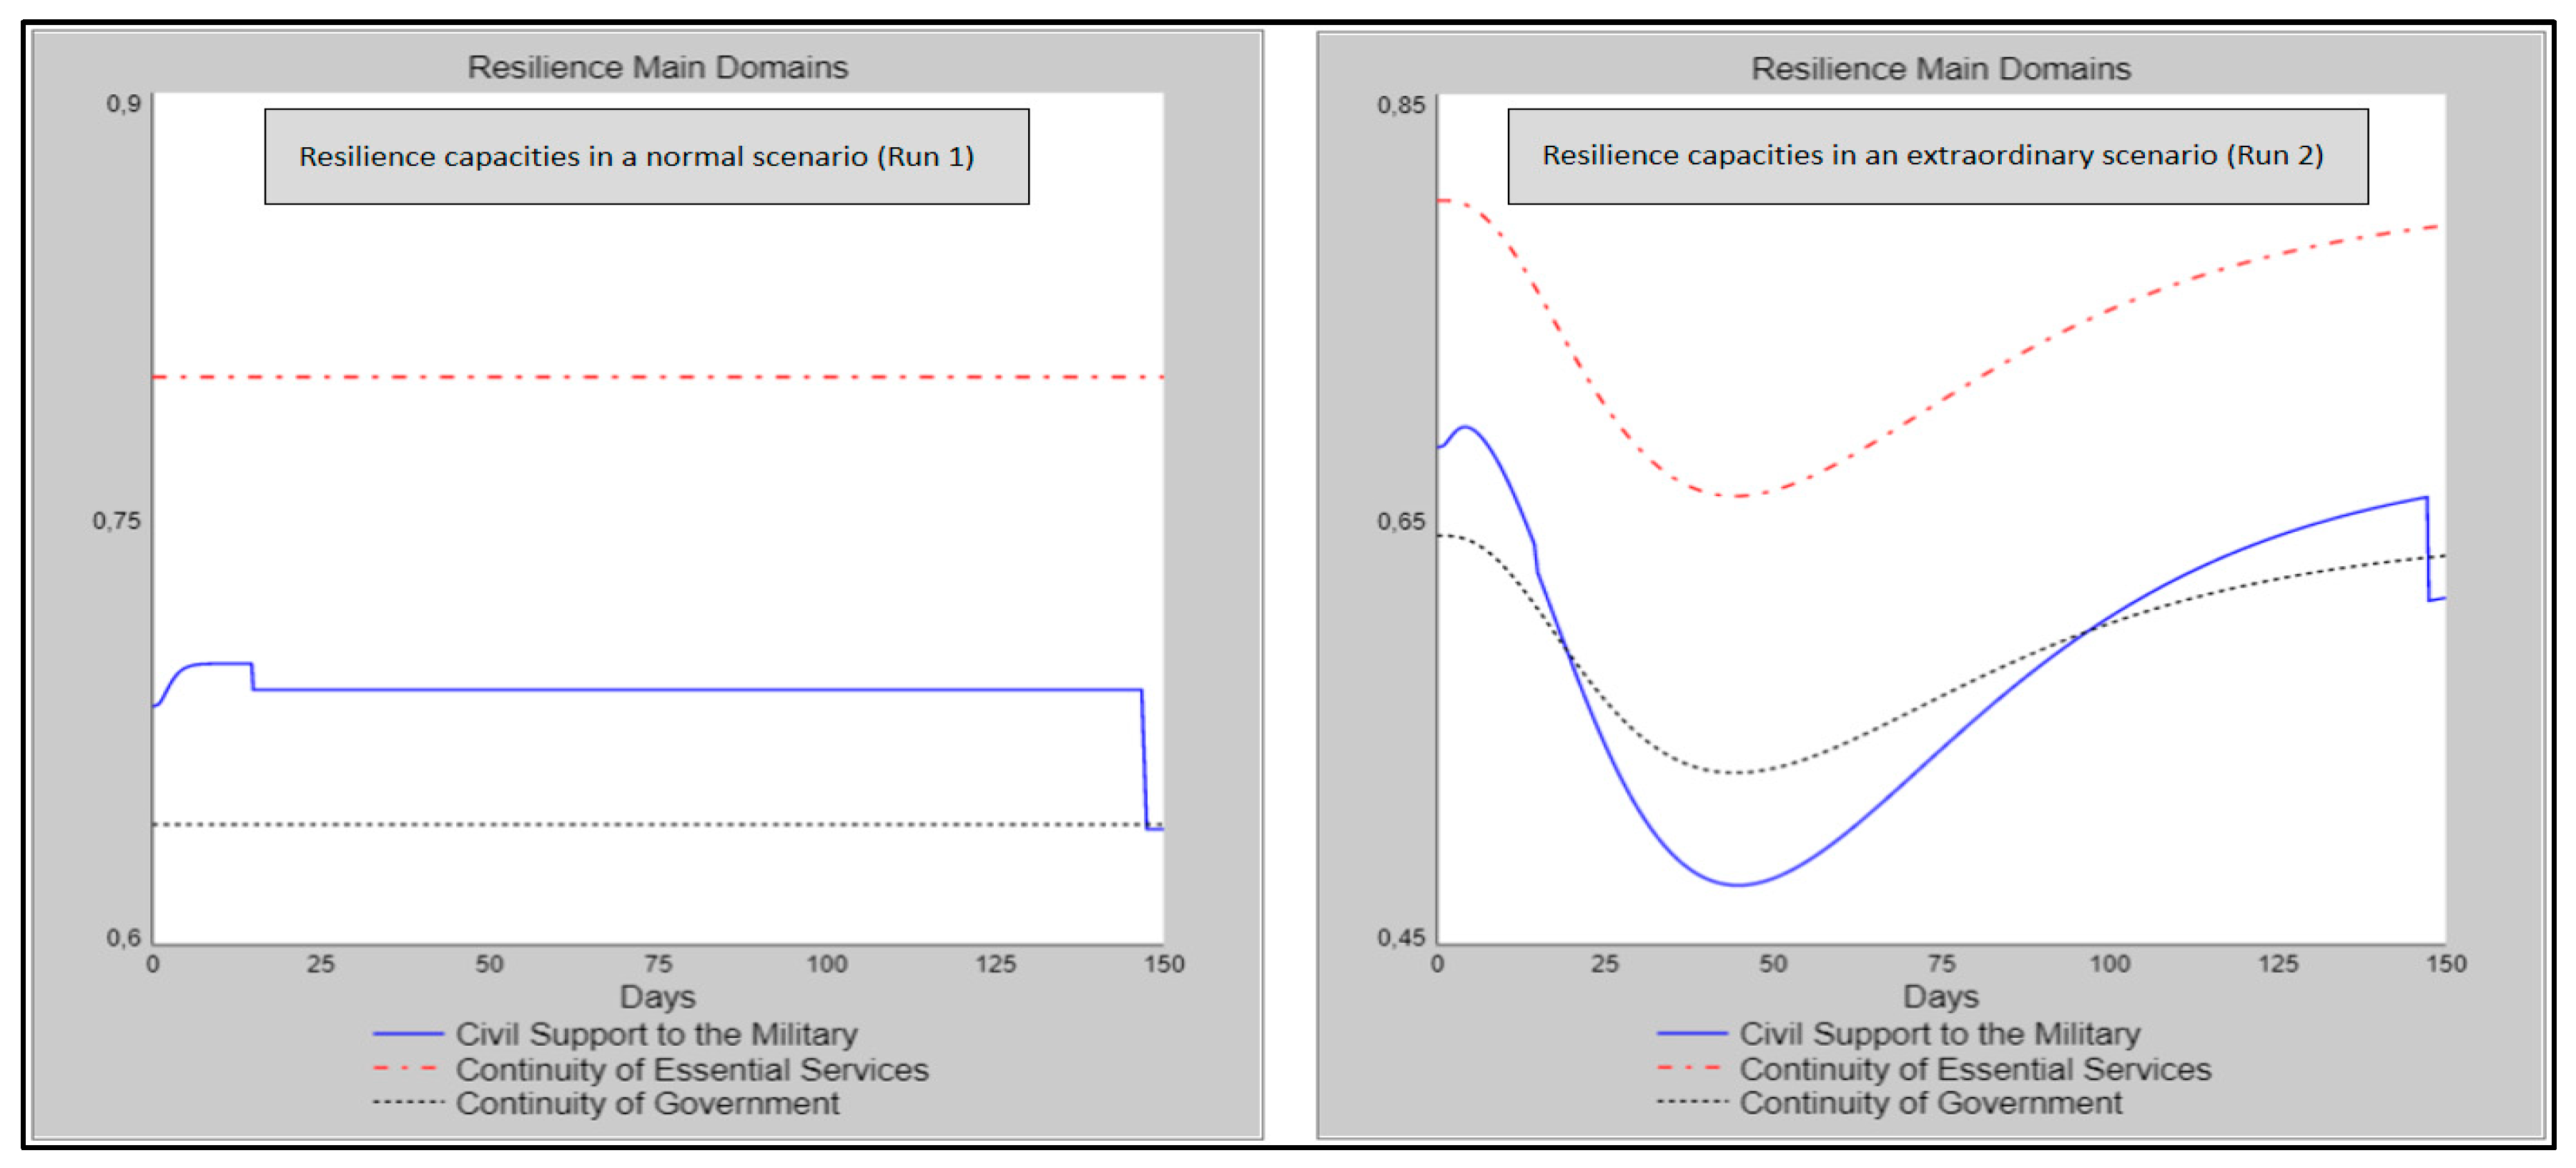
Figure 9 gives the resilience capacities of resilience main domains in baseline and extraordinary scenarios. In the baseline scenario conditions, three main domains follow an almost steady pattern between t0 and t150 (Run 1). When the simulation runs in extraordinary conditions, having the shocks turned on, main resilience domains behave in parallel to the baseline requirements (Run 2).
4. Discussion
This study discusses the prototype resilience model that has been developed in order to discover whether the NATO resilience capacity can be measured in a dynamic way. The model was developed using a system dynamics approach to be able to reflect the interactions among related variables and parameters to the maximum extent. The rationale behind choosing this approach is to converge the model interrelations and interactions to the real-world behaviours in the resilience domain.
The implemented model running both baseline (without any shock) and extraordinary scenarios (with strategic shocks) clearly demonstrates its capacity to represent quantitatively the resilience related factors of a country in a complex operational environment in a dynamic way.
Moreover, the outputs of the prototype model substantially comply with the resilience concept existing in the literature and NATO applications.
One of the main strengths of the prototype model is its almost infinite capacity to create various scenarios and make a lot of what-if analysis limited only by the current number of endogenous parameters of the model. It allows studying the second and third order effects of events introduced in the scenarios as the critical activity for understanding the resilience concept and related risk to the military operations.
The user interfaces (input and output dashboards) of the model help decision makers modify the values of selected endogenous parameters, see and compare the time-based values of the resilience factors, and doing so to evaluate risk related to the area of NATO operation.
The prototype model can provide foresights about situational behaviour changes in the NATO resilience system over time. The outputs of the model can also be used as add-in alternatives together with other extant descriptive results.
Users’ validation workshops revealed that a descriptive methodology that transforms scenario data into the model input parameters values is the most critical aspect of the model’s successful employment. Without explicit formulation of the transformation mechanisms, the qualitative output of the resilience model may be misleading.
The aforementioned model has space for further development, as the users are identified through the model validation series of workshops. Adding more countries to the model and bringing the aggregation mechanism to output values of both resilience capacity and risk functions over a single area of NATO operation is the main project way ahead. Extension of the current set of existing shocks and bringing more user-defined parameters can be another objective for the development of the NATO Resilience expert system.
Author Contributions
Conceptualization, J.H. and H.Ö.; methodology, J.H., P.S., and J.D.; software, G.Ö. and H.Ö.; validation, J.H., H.Ö., and G.Ö.; formal analysis, J.H. and H.Ö.; investigation, H.Ö. and G.Ö.; writing—G.Ö. and H.Ö.; original draft preparation, P.S. and J.D.; writing—review and editing, W.B., J.H., and P.S.; visualization, G.Ö. and H.Ö.; supervision, P.S. and J.H.; project administration, J.H.; funding acquisition, J.H. All authors have read and agreed to the published version of the manuscript.
Funding
This research project was funded by NATO HQ SACT.
Conflicts of Interest
The authors declare no conflict of interest.
References
- Keating, A.; Hanger-Kopp, S. Practitioner Perspectives of Disaster Resilience in International Development. Int. J. Disaster Risk Reduct. 2020, 42, 101355. [Google Scholar] [CrossRef]
- Manyena, B.; Machingura, F.; O’Keefe, P. Disaster Resilience Integrated Framework for Transformation (DRIFT): A New Approach to Theorising and Operationalising Resilience. World Dev. 2019, 123, 104587. [Google Scholar] [CrossRef]
- Ribeiro, P.J.G.; Gonçalves, L.A.P.J. Urban Resilience: A Conceptual Framework. Sustain. Cities Soc. 2019, 50, 101625. [Google Scholar] [CrossRef]
- Ran, J.; MacGillivray, B.H.; Gong, Y.; Hales, T.C. The Application of Frameworks for Measuring Social Vulnerability and Resilience to Geophysical Hazards within Developing Countries: A Systematic Review and Narrative Synthesis. Sci. Total Environ. 2020, 711, 134486. [Google Scholar] [CrossRef] [PubMed]
- United Nations. UN System Task Team on the Post 2015 UN Development Agenda, Disaster Risk and Resilience Thematic Think Piece. May 2012. Available online: https://www.un.org/en/development/desa/policy/untaskteam_undf/thinkpieces/3_disaster_risk_resilience.pdf (accessed on 1 February 2020).
- Jufri, F.H.; Widiputra, V.; Jung, J. State-of-the-art Review on Power Grid Resilience to Extreme Weather Events: Definitions, Frameworks, Quantitative Assessment Methodologies, and Enhancement Strategies. Appl. Energy 2019, 239. [Google Scholar] [CrossRef]
- Hossain, N.U.I.; Nur, F.; Hosseini, S.; Jaradat, R.; Marufuzzaman, M.; Puryear, S.M. A Bayesian Network Based Approach for Modeling and Assessing Resilience: A Case Study of a Full Service Deep Water Port. Reliability Engineering and System Safety. Reliab. Eng. Syst. Saf. 2019, 189, 378–396. [Google Scholar] [CrossRef]
- Glas, H.; Rocabado, I.; Huysentruyt, S.; Maroy, E.; Salazar Cortez, D.; Coorevits, K.; De Maeyer, P.; Deruyter, G. Flood Risk Mapping Worldwide: A Flexible Methodology and Toolbox. Water 2019, 11, 2371. [Google Scholar] [CrossRef] [Green Version]
- Al-Saidi, M.; Saliba, S. Water, Energy and Food Supply Security in the Gulf Cooperation Council (GCC) Countries—A Risk Perspective. Water 2019, 11, 455. [Google Scholar] [CrossRef] [Green Version]
- Cuthbertson, J.; Rodriguez-Llanes, J.M.; Robertson, A.; Archer, F. Current and Emerging Disaster Risks Perceptions in Oceania: Key Stakeholders Recommendations for Disaster Management and Resilience Building. Int. J. Environ. Res. Public Health 2019, 16, 460. [Google Scholar] [CrossRef] [PubMed] [Green Version]
- Ghaffarian, S.; Kerle, N.; Filatova, T. Remote Sensing-Based Proxies for Urban Disaster Risk Management and Resilience: A Review. Remote Sens. 2018, 10, 1760. [Google Scholar] [CrossRef] [Green Version]
- Jones, L.; d’Errico, M. Whose Resilience Matters? Like-for-like Comparison of Objective and Subjective Evaluations of Resilience. World Dev. 2019, 124. [Google Scholar] [CrossRef]
- Hosseini, S.; Ivanov, D.; Dolgui, A. Review of Quantitative Methods for Supply Chain Resilience Analysis. Transp. Res. Part E Logist. Transp. Rev. 2019, 25. [Google Scholar] [CrossRef]
- Wang, J.; Zuo, W.; Rhode-Barbarigos, L.; Lu, X.; Wang, J.; Lin, Y. Literature Review on Modeling and Simulation of Energy Infrastructures from a Resilience Perspective. Reliab. Eng. Syst. Saf. 2019, 183, 360–373. [Google Scholar] [CrossRef]
- Thomas, J.E.; Eisenberg, D.A.; Seager, T.P. Holistic Infrastructure Resilience Research Requires Multiple Perspectives, Not Just Multiple Disciplines. Infrastructures 2018, 3, 30. [Google Scholar] [CrossRef] [Green Version]
- Reynolds, M.; Holwell, S. Introducing Systems Approaches. Systems Approaches to Managing Change: A Practical Guide; Springer: London, UK, 2010; pp. 1–23. [Google Scholar] [CrossRef] [Green Version]
- Gallego-García, S.; Reschke, J.; García-García, M. Design and Simulation of a Capacity Management Model Using a Digital Twin Approach Based on the Viable System Model: Case Study of an Automotive Plant. Appl. Sci. 2019, 9, 5567. [Google Scholar] [CrossRef] [Green Version]
- Experimentation Directive (Bi-SC 75-4). NATO. 2010. Available online: https://www.act.nato.int/images/stories/events/2011/cde/rr_bi-sc_exp_dir.pdf (accessed on 28 March 2020).
- Forrester, J.W. System Dynamics, Systems Thinking, and Soft OR. Syst. Dyn. Rev. 1994, 10, 245–256. [Google Scholar] [CrossRef]
- Sterman, J.D. Business Dynamics: Systems Thinking and Modeling for a Complex World; Irwin/McGraw-Hill: Boston, MA, USA, 2000. [Google Scholar]
- NATO Web Site. Available online: https://www.nato.int/cps/en/natohq/topics_132722.htm (accessed on 17 February 2020).
- Civil-Military Cooperation Centre of Excellence Web Site. Available online: https://www.cimic-coe.org/wp-content/uploads/2019/07/Resilience-through-Civil-Preparedness.pdf (accessed on 17 February 2020).
- ACO Interim Direction and Guidance for Resilience through Civil Preparedness (SH/PD/BJM/0092-19); ACO: Merchtem, Belgium, 2019.
- Evaluation Criteria on Resilience PO(2017)0094 (INV); Civil Emergency Planning Committee (CEPC): Brussels, Belgium, 2019.
- Laimon, M.; Mai, T.; Goh, S.; Yusaf, T. Energy Sector Development: System Dynamics Analysis. Appl. Sci. 2020, 10, 134. [Google Scholar] [CrossRef] [Green Version]
Figure 1.
Methodology of the study.

Figure 2.
NATO’s strategic resilience concept [23].
Figure 2.
NATO’s strategic resilience concept [23].

Figure 3.
Causal loop diagram of food and water.

Figure 4.
General stock and flow structure.

Figure 5.
Input dashboard outlook.

Figure 6.
Sample graphs from output dashboard.

Figure 7.
Sample output graph of continuity of government baseline requirements for baseline and extraordinary scenarios.
Figure 7.
Sample output graph of continuity of government baseline requirements for baseline and extraordinary scenarios.

Figure 8.
Sample output graph of risk assessment functions for baseline (normal) and extraordinary scenarios.
Figure 8.
Sample output graph of risk assessment functions for baseline (normal) and extraordinary scenarios.

Figure 9.
Sample output graph of resilience main domains for baseline (normal) and extraordinary scenarios.
Figure 9.
Sample output graph of resilience main domains for baseline (normal) and extraordinary scenarios.

© 2020 by the authors. Licensee MDPI, Basel, Switzerland. This article is an open access article distributed under the terms and conditions of the Creative Commons Attribution (CC BY) license (http://creativecommons.org/licenses/by/4.0/).
Share and Cite
MDPI and ACS Style
Hodicky, J.; Özkan, G.; Özdemir, H.; Stodola, P.; Drozd, J.; Buck, W. Dynamic Modeling for Resilience Measurement: NATO Resilience Decision Support Model. Appl. Sci. 2020, 10, 2639. https://0-doi-org.brum.beds.ac.uk/10.3390/app10082639
AMA Style
Hodicky J, Özkan G, Özdemir H, Stodola P, Drozd J, Buck W. Dynamic Modeling for Resilience Measurement: NATO Resilience Decision Support Model. Applied Sciences. 2020; 10(8):2639. https://0-doi-org.brum.beds.ac.uk/10.3390/app10082639
Chicago/Turabian StyleHodicky, Jan, Gökhan Özkan, Hilmi Özdemir, Petr Stodola, Jan Drozd, and Wayne Buck. 2020. "Dynamic Modeling for Resilience Measurement: NATO Resilience Decision Support Model" Applied Sciences 10, no. 8: 2639. https://0-doi-org.brum.beds.ac.uk/10.3390/app10082639
Note that from the first issue of 2016, this journal uses article numbers instead of page numbers. See further details here.