1. Introduction
The determination of the mutational status of cell-free DNA (cfDNA) is becoming a fundamental and attractive tool in the liquid biopsy field of cancer patients [
1,
2,
3]. CfDNA is also released by normal cells during physiological processes (e.g., apoptosis and necrosis), thus discrimination between scant circulating tumor DNA (ctDNA) derived from tumor cells from normal cells can be challenging [
4]. Additionally, since molecular findings by genomic characterization of ctDNA are able to drive treatment decisions, clinical laboratories have been adopting highly sensitive and accurate assays for a precise identification of different DNA alterations.
In this scenario, next-generation sequencing (NGS) approaches provide interesting application choices to deal with rare ctDNA molecules diluted within cfDNA and are rapidly gaining traction as a valid assay for cancer.
Since many tumors, including non-small cell lung cancer (NSCLC), may harbor subclonal mutations with molecular allele frequencies (MAFs) down to 0.1%, it is advisable to use NGS assays sensitive as well as accurate enough to detect such low-abundance alterations.
At present, some technology improvements have allowed researchers to develop NGS panels able to improve the performance levels of the NGS approach in liquid biopsy. Molecular barcoding is one of the possible solutions when dealing with challenging clinical samples since unique molecular tags, also known as unique molecular index (UMI), are added into every DNA molecule, prior to library amplification [
5,
6,
7,
8,
9,
10]. This has the great advantage to increase the sensitivity by keeping track of the DNA molecules intercepted, meanwhile reducing polymerase chain reaction (PCR) and/or sequencing artefacts [
11,
12,
13,
14], also when compared to amplicon-based NGS [
15].
The Oncomine
TM Lung cell-free DNA Assay (OLcfA, ThermoFisher Scientific) is an NGS panel based on molecular tagging technical method, that we have already wet-lab tested with the main goal to detect low MAFs of
EGFR Thr790Met mutation in plasma samples from tyrosine kinase inhibitors (TKIs)-treated NSCLC patients [
16]. We also showed that the NGS results for the search of Thr790Met mutation were comparable with those obtained with a digital PCR (dPCR) approach, achieving a 100% of concordance in terms of sensitivity and specificity [
16].
Here, we extended the assessment to a large cohort of 76 NSCLC patients and demonstrated, through a deep NGS data analysis of covered target regions, that the OLcfA performance makes this test suitable and reliable when used in the routine liquid biopsy practice in the NSCLC clinical setting.
2. Materials and Methods
2.1. Patients, Plasma Collection and Panel Sequencing
Ninety-two plasma samples from 76 advanced NSCLC post-TKI patients were collected and tested for EGFR Thr790Met mutation. The present study was approved by the Ethics Committee of Liguria Region (Italy) (P.R.273REG2016) and conducted according to the principle of the Declaration of Helsinky. For each patient included in the study a written informed consent was obtained.
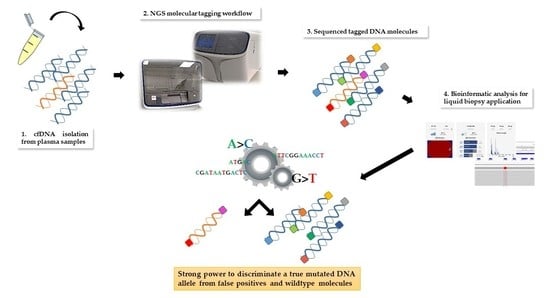
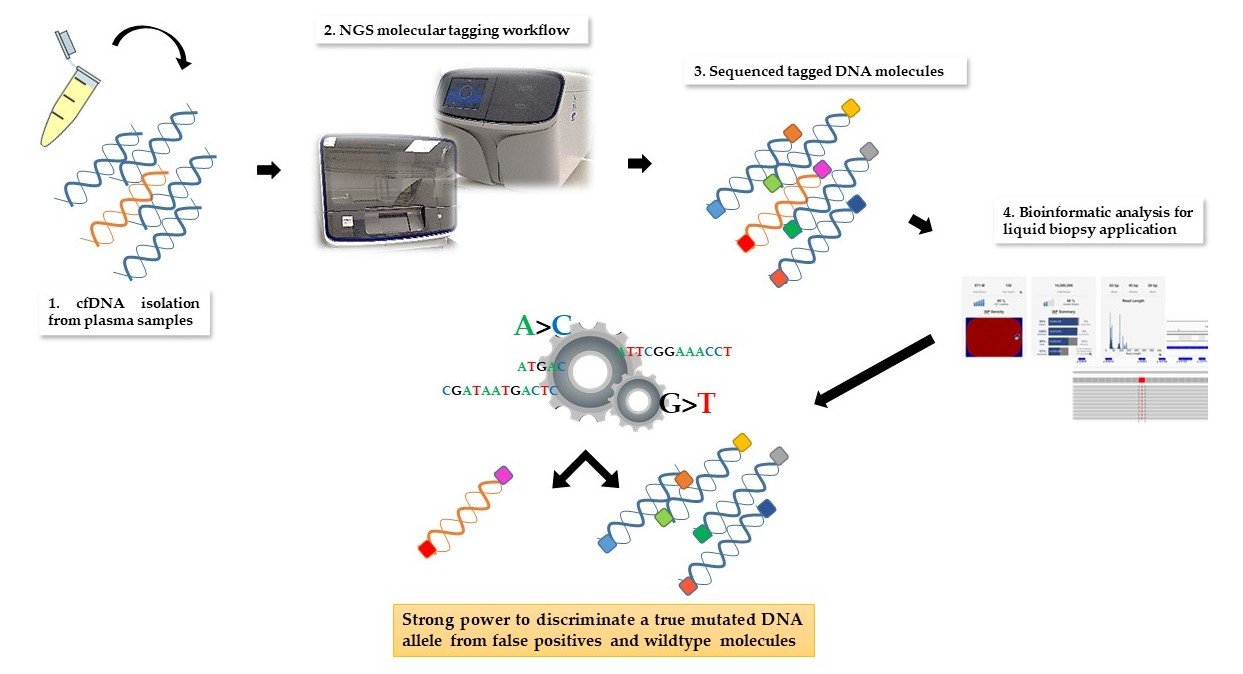
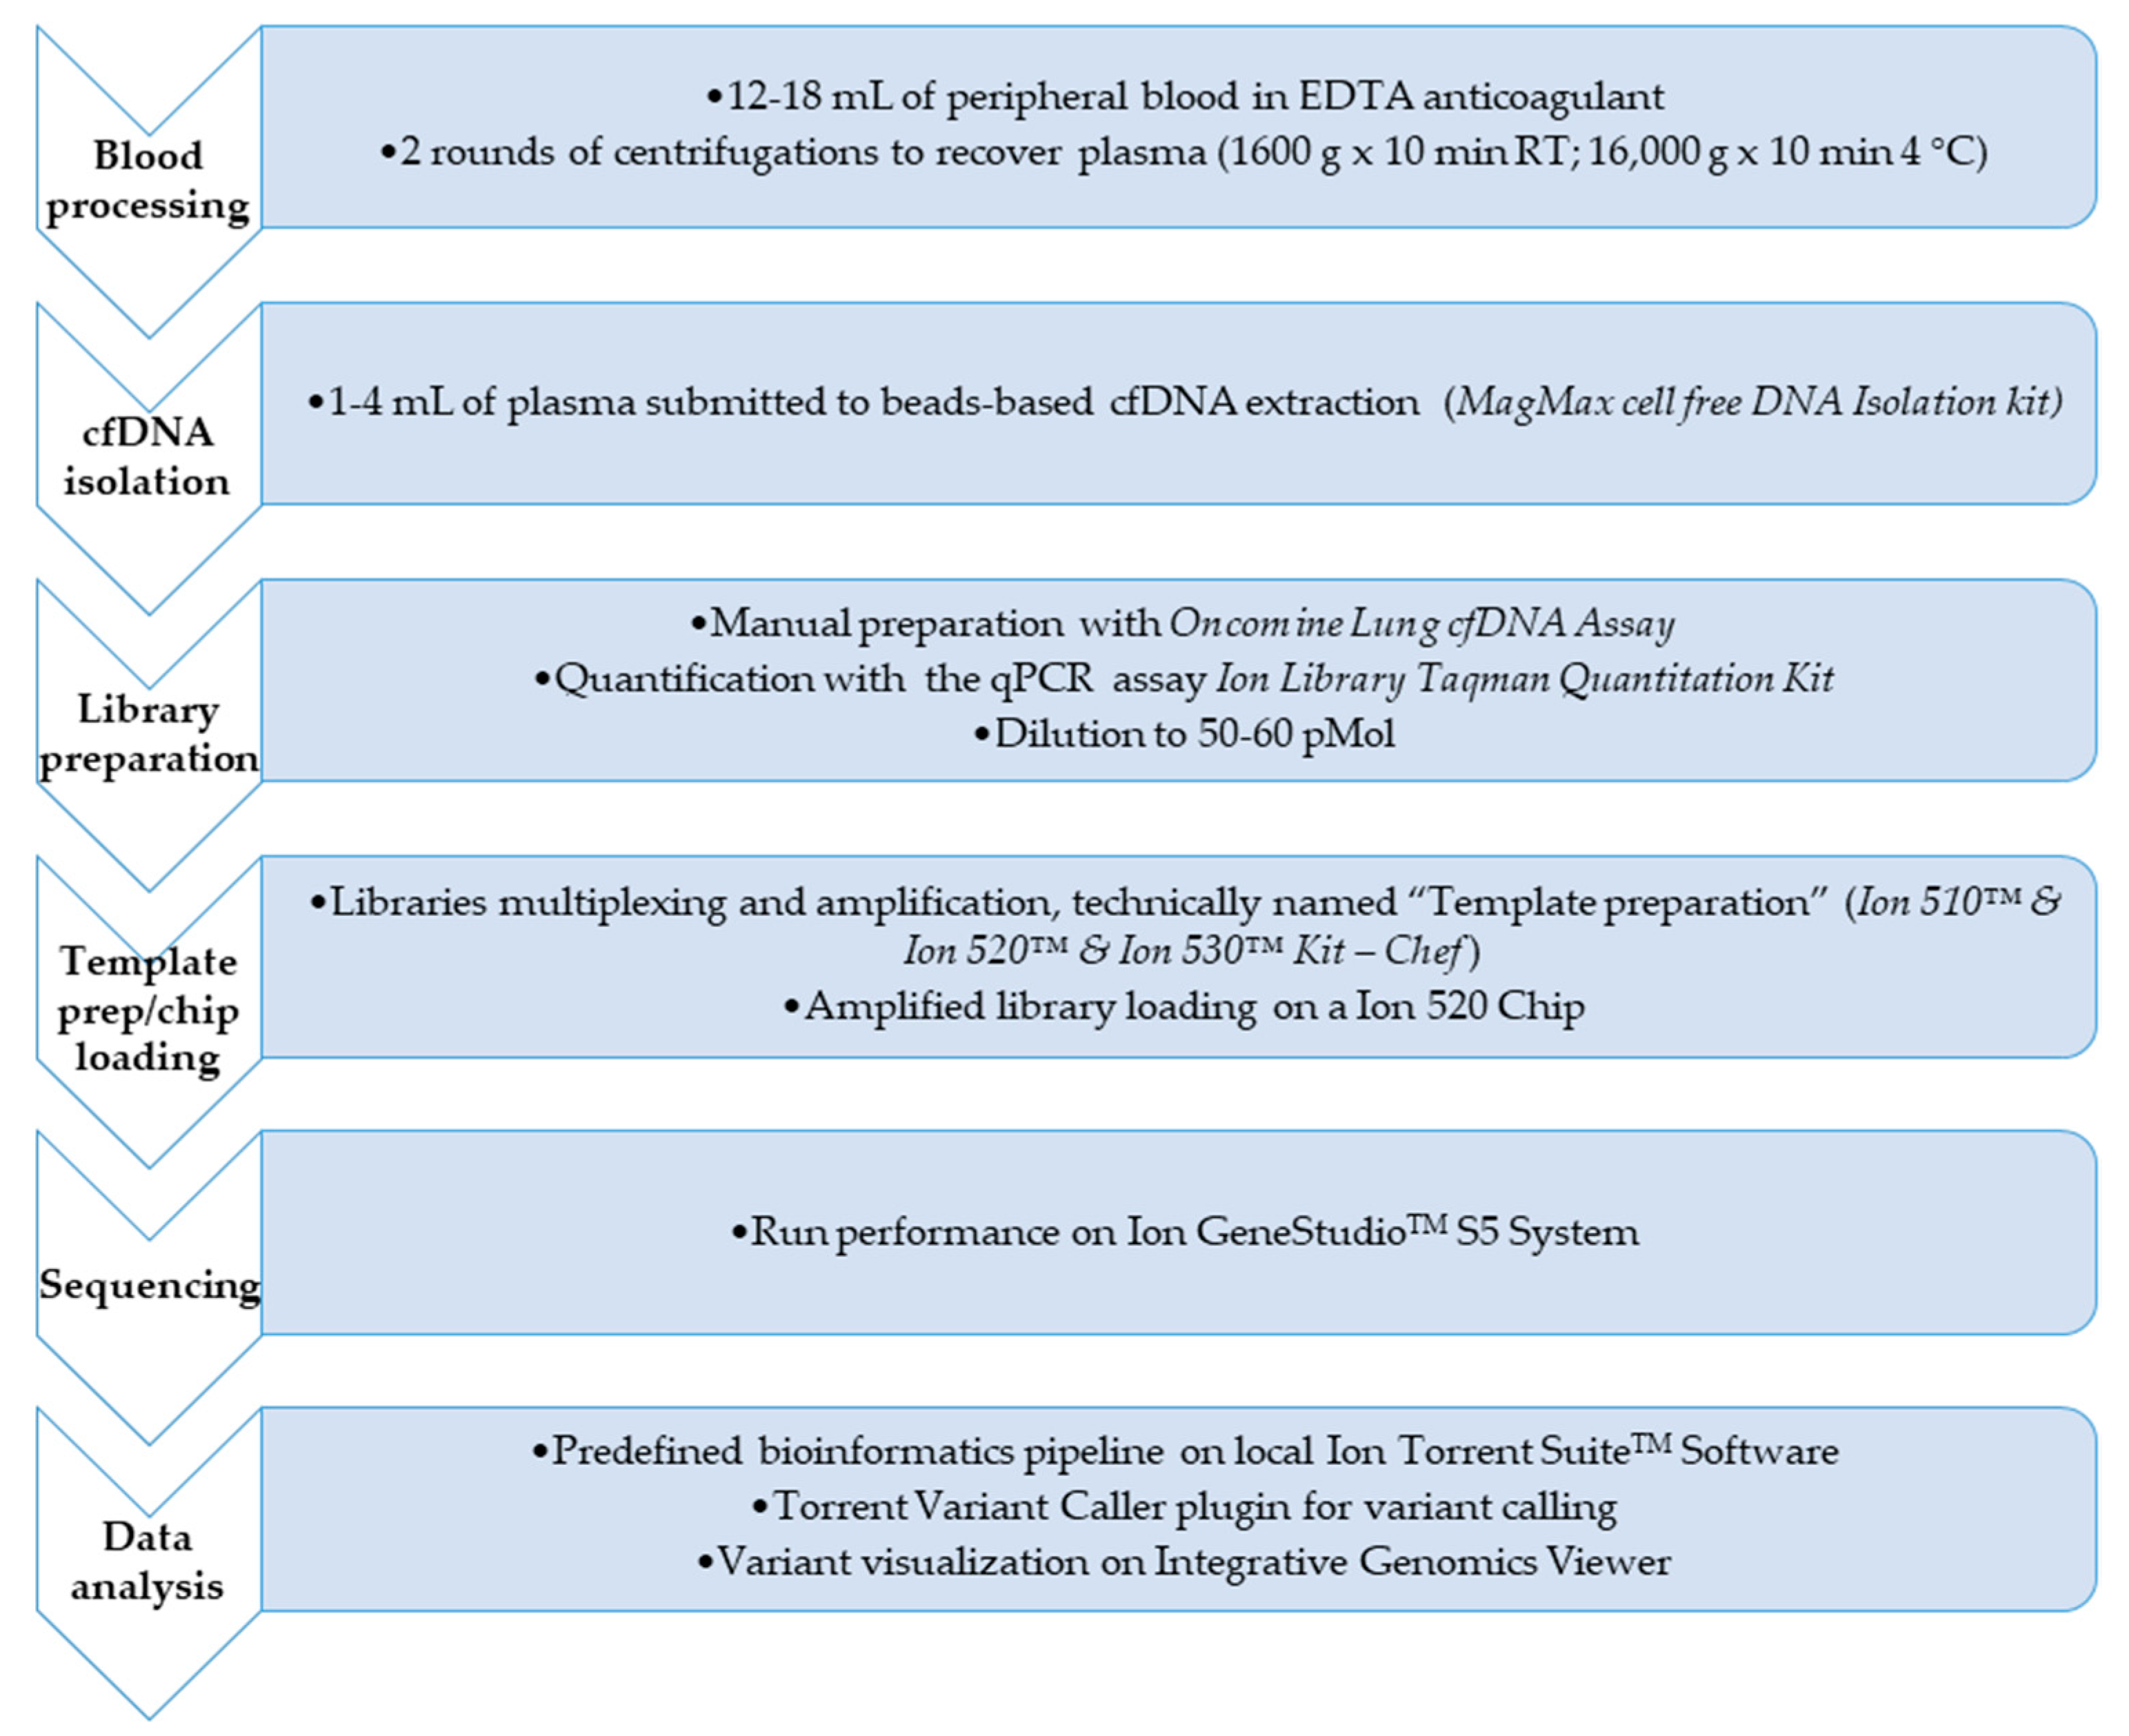
Procedures for molecular tagging-based NGS testing are described in details in reference 16 and here briefly retraced and displayed in
Figure 1.
Plasma samples were isolated from 12–18 mL of peripheral blood collected into EDTA-containing tubes and up to 4 mL processed for cfDNA extraction using the MagMAX™ Cell-Free DNA Isolation Kit (ThermoFisher Scientific, Waltham, MA, USA), followed by quantification with a Qubit 3TM Fluorometer (ThermoFisher Scientific).
Genomic profiling of samples by targeted NGS was performed by using the above cited OLcfA, covering DNA target regions containing hotspots variants relevant in pathogenetic and resistance molecular mechanisms in NSCLC (169 key hotspot mutations across 11 genes such as ALK, BRAF, EGFR, ERBB2, KRAS, MAP2K1, MET, NRAS, PIK3CA, ROS1 and TP53).
Oncomine library quantities were determined by qPCR using the Ion Library TaqMan Quantitation Kit (ThermoFisher Scientific) and then diluted to a final concentration of 50–60 pmol/L. Next, sample barcoded libraries were pooled together for template preparation on the Ion ChefTM Instrument and loaded onto a Ion 520 chip (Ion 520TM Chip Kit, ThermoFisher Scientific).
The chip was sequenced on a Ion GeneStudio TM S5 System (ThermoFisher Scientific), and the unaligned BAM (Binary Alignment Map) files generated by the sequencer were mapped against the human reference genome (GRCh37/hg19) using the Torrent Mapping Alignment Program (TMAP), with default parameters and Ion Torrent Suite™ Software (TSS, version 5.10).
Analysis and annotation of variants were locally carried out with Torrent Variant Caller (TVC, version 5.10) plugin using preconfigured parameter settings for liquid biopsy application.
NGS data of library performance and variant calling quality were considered and presented for all plasma samples analyzed. The manufacturer recommends a Median Read Coverage (MedReadCov) >25,000 and Median Molecular Coverage (MedMolCov) >2500 to detect a variant with a MAF of 0.1%.
The output variant caller format (VCF) files from each sequenced sample were reviewed for further visual analysis on the Integrative Genomics Viewer (IGV, version 2.6, Broad Institute). VCF files were uploaded on IGV and the wild type/mutated molecular alleles aligned to the reference genome hg19 (GRCh37).
Reproducibility of the Oncomine Lung cfDNA panel was already evaluated in our previous paper [
16]. Specifically, a high sensitivity tool such as the dPCR was tested on 26 cfDNA samples: 10 T790M-negative and 16 T790M-positive, with a 100% of concordance in both samples demonstrated.
2.2. Statistical Analysis
Statistical evaluation of the data in this study was performed using GraphPad Prism version 6 software. Threshold for statistical significance was considered to be p < 0.05.
3. Results
We initially evaluated the OLcfA performance using the Multiplex I cfDNA Reference Standard set–Horizon Discovery 780 (HD780). This commercial kit contains low allele frequencies variants (5%, 1% and 0.1%) at 8 hotspot genomic positions in genes
EGFR,
KRAS,
NRAS and
PIK3CA, covered by the Oncomine panel. Notably, 4 key alterations were investigated for
EGFR gene (Leu858Arg, Thr790Met, Glu746_Ala750del, Val769_Asp770insAlaSerVal), 1 for
KRAS (Gly12Asp), 2 for
NRAS (Ala59Thr, Gln61Lys) and 1 for
PIK3CA (Glu545Lys) and results shown in
Table 1.
Each reference standard was tested by using 30 ng of cfDNA, as described by the manufacturer (ThermoFisher Scientific,
https://assets.thermofisher.com/TFS-Assets/LSG/brochures/verification-oncomine-lung-cfdna-ion-s5-white-paper.pdf). Additionally, we checked reproducibility in critical samples (i.e., those with cfDNA input <30 ng) and tested the HD780 reference standard at 0.1% MAF by using 20 ng of cfDNA in a duplicate experiment. Detailed data on MAFs are reported in
Table 1. The overall variant-based sensitivity was 92.5%. Specifically, only in one case did the system fail to call a low frequency variant at 0.1% and it was relative to the hotspot Glu545Lys in
PIK3CA gene. In addition, two hotspots, i.e., the deletion Glu746_Ala750del and the missense mutation Leu858Arg were filtered out by the bioinformatics pipeline in the 20 ng cfDNA replicates at 0.1% MAF, because not enough molecular families had been reached to enable a call.
Furthermore, reference cfDNA HD780 at 0% MAF, i.e., the standard characterized by the absence of low allele frequencies variants, was examined and no false positives were found at the genomic target regions analyzed, not even visualized on IGV. This indicates a 100% specificity of OLcfA and confirms its reliability to be used in a clinical setting.
3.1. Cell-Free DNA (CfDNA) Quantity and Library Yields in Clinical Specimens
Overall, 76 NSCLC patients and a total of 92 plasma samples were included in our NGS analysis. CfDNA was isolated from 1–4 mL of plasma and a range of 2.6–309 ng /mL of plasma was obtained (median 10.40 ng/mL).
It was possible to proceed with NGS library preparation in all 92 samples and the range of cfDNA used for the NGS reaction was 6.37–59.80 ng, being aware that 23/92 (25%) samples were below the suggested 20 ng cut-off needed to reach the 0.1% LoD.
In addition, when qualitative assessment of cfDNA was performed on a TapeStation 2200 (Agilent Technologies, Santa Clara, USA), it turned out that DNA fragments of about 150–180 bp and multiples were predominant compared to genomic DNA (high molecular weight), thus demonstrating the reliability of the magnetic extraction method in isolating the fragmented cfDNA fraction with a higher chance to be tumor-derived (data not shown).
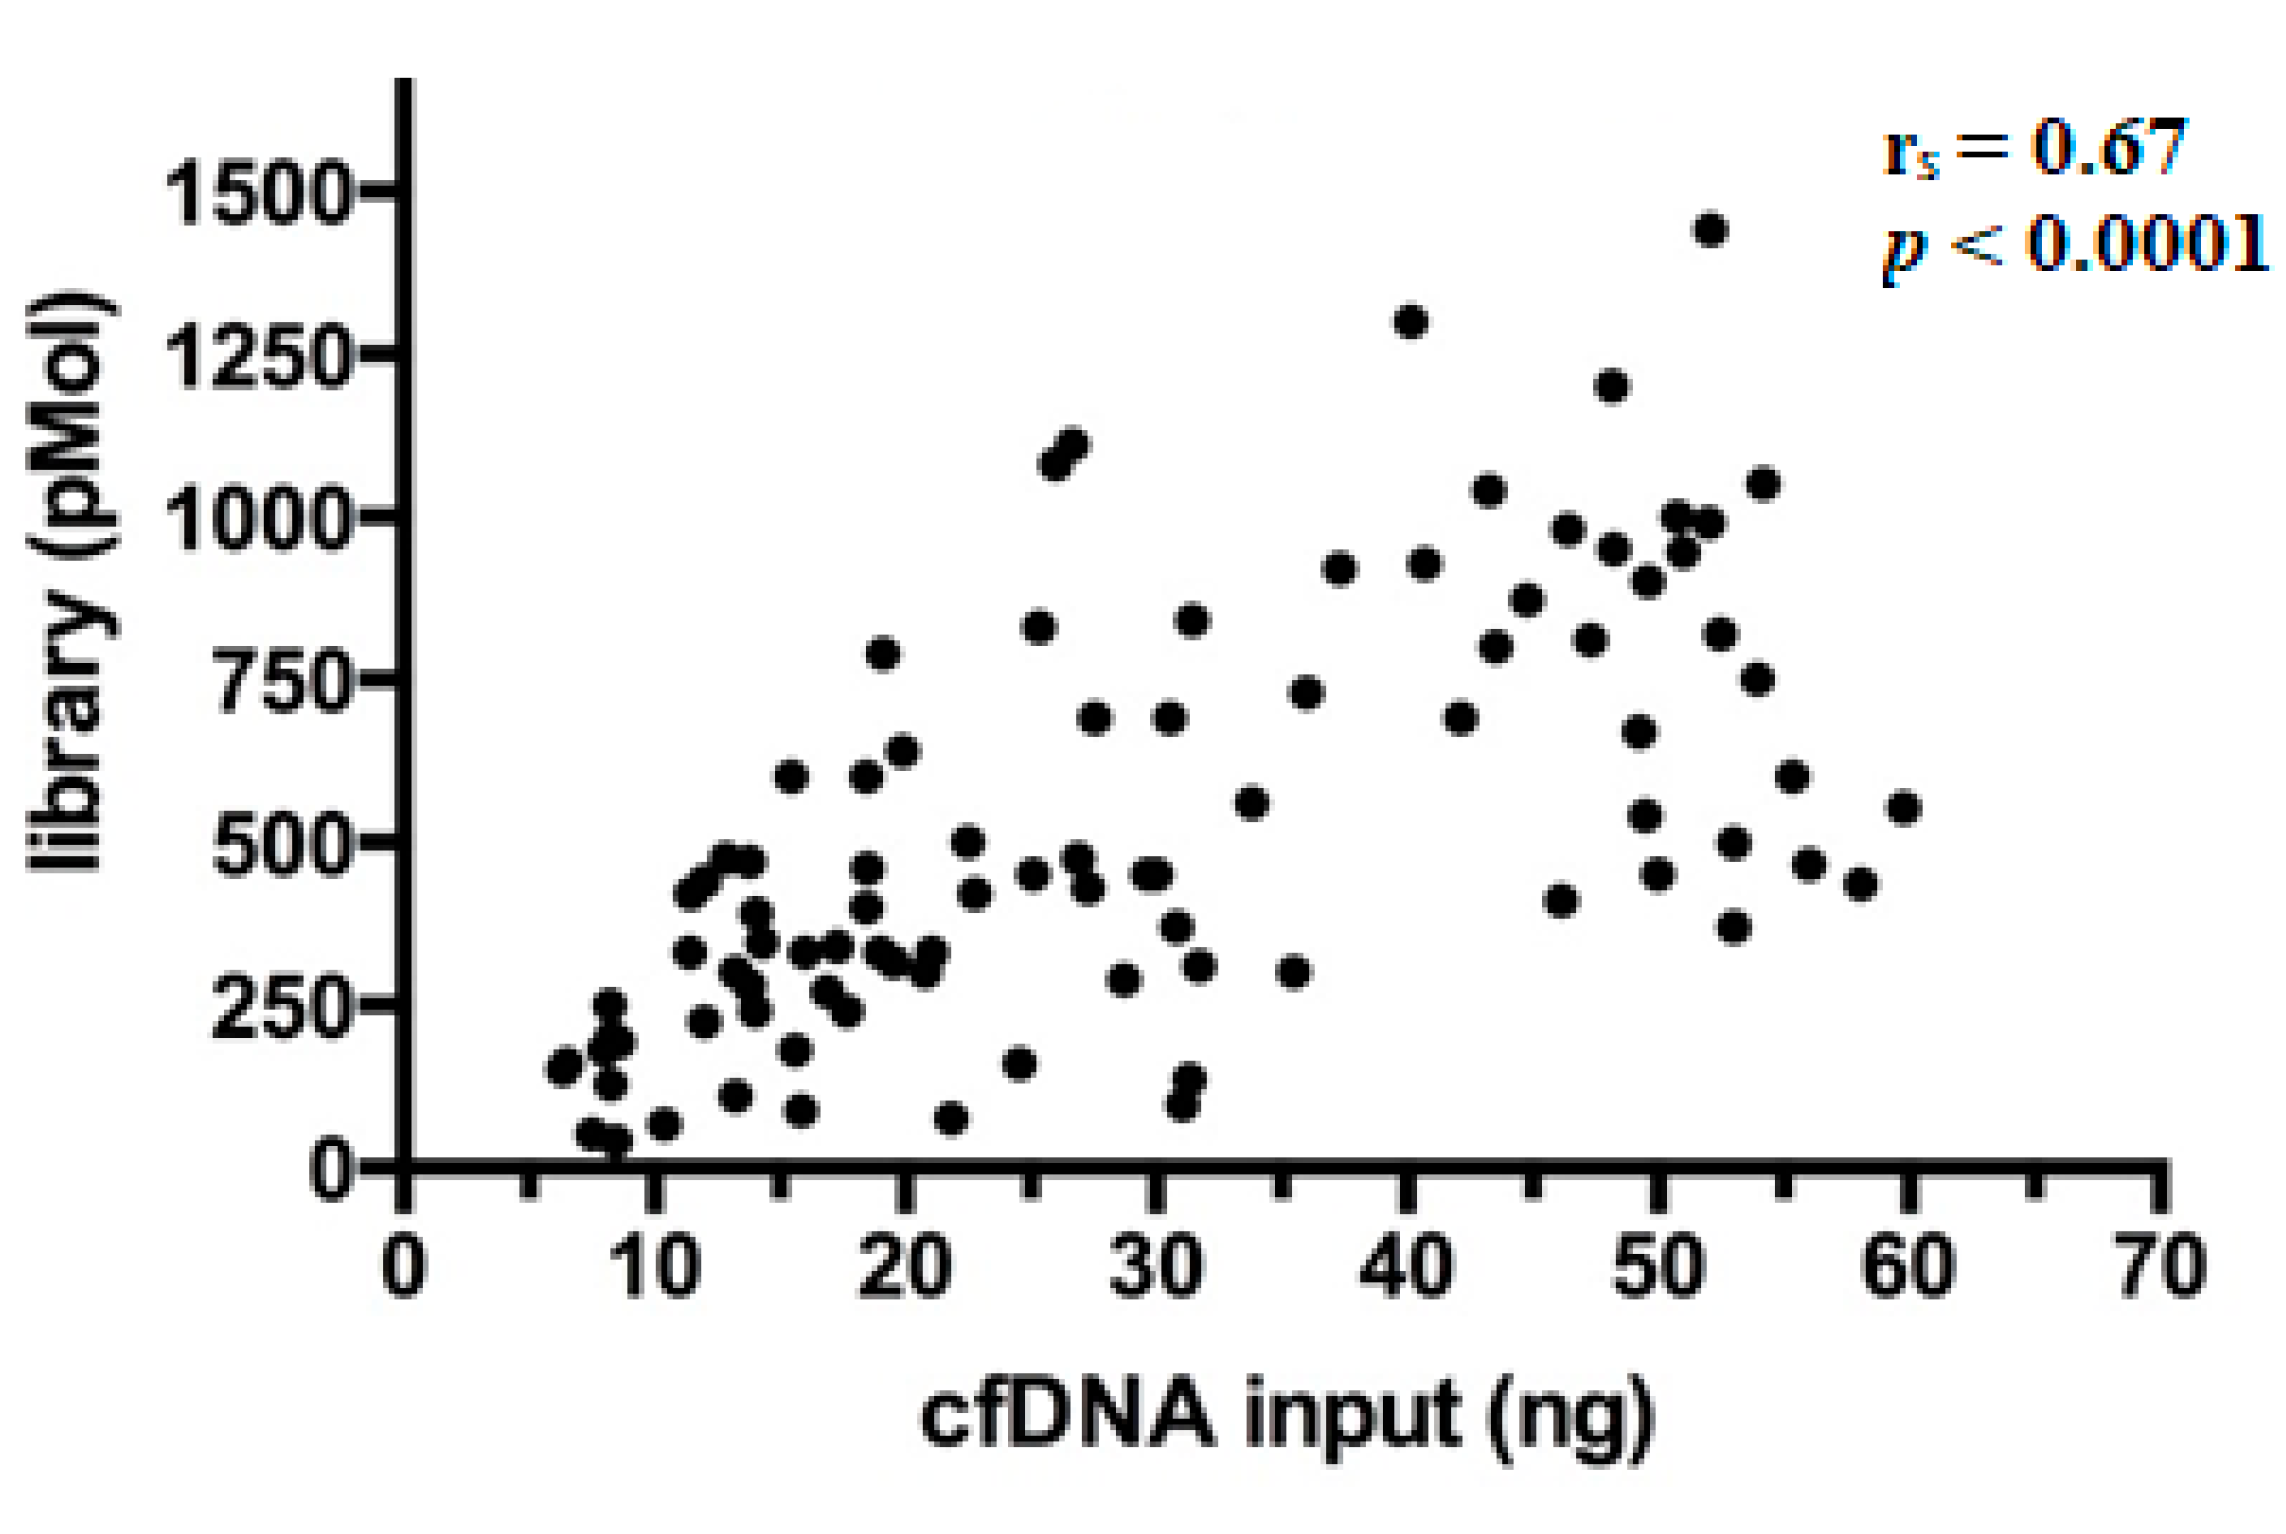
After preparation, libraries were quantified and showed a wide range of concentrations between 40.5–1440 pMol (median 450 pMol). As expected, it was observed that library yields increased proportionally with the amount of cfDNA ng employed per reaction (Spearman’s correlation coefficient (r
s) = 0.67,
p < 0.0001) (
Figure 2), a finding in line with literature [
17].
3.2. Overall Considerations of the OncomineTM Lung Cell-Free DNA Assay (OLcfA) Sequencing Performance Applied to a Real-Life Routine Plasma Cohort
3.2.1. Read Coverage through Panel Amplicons
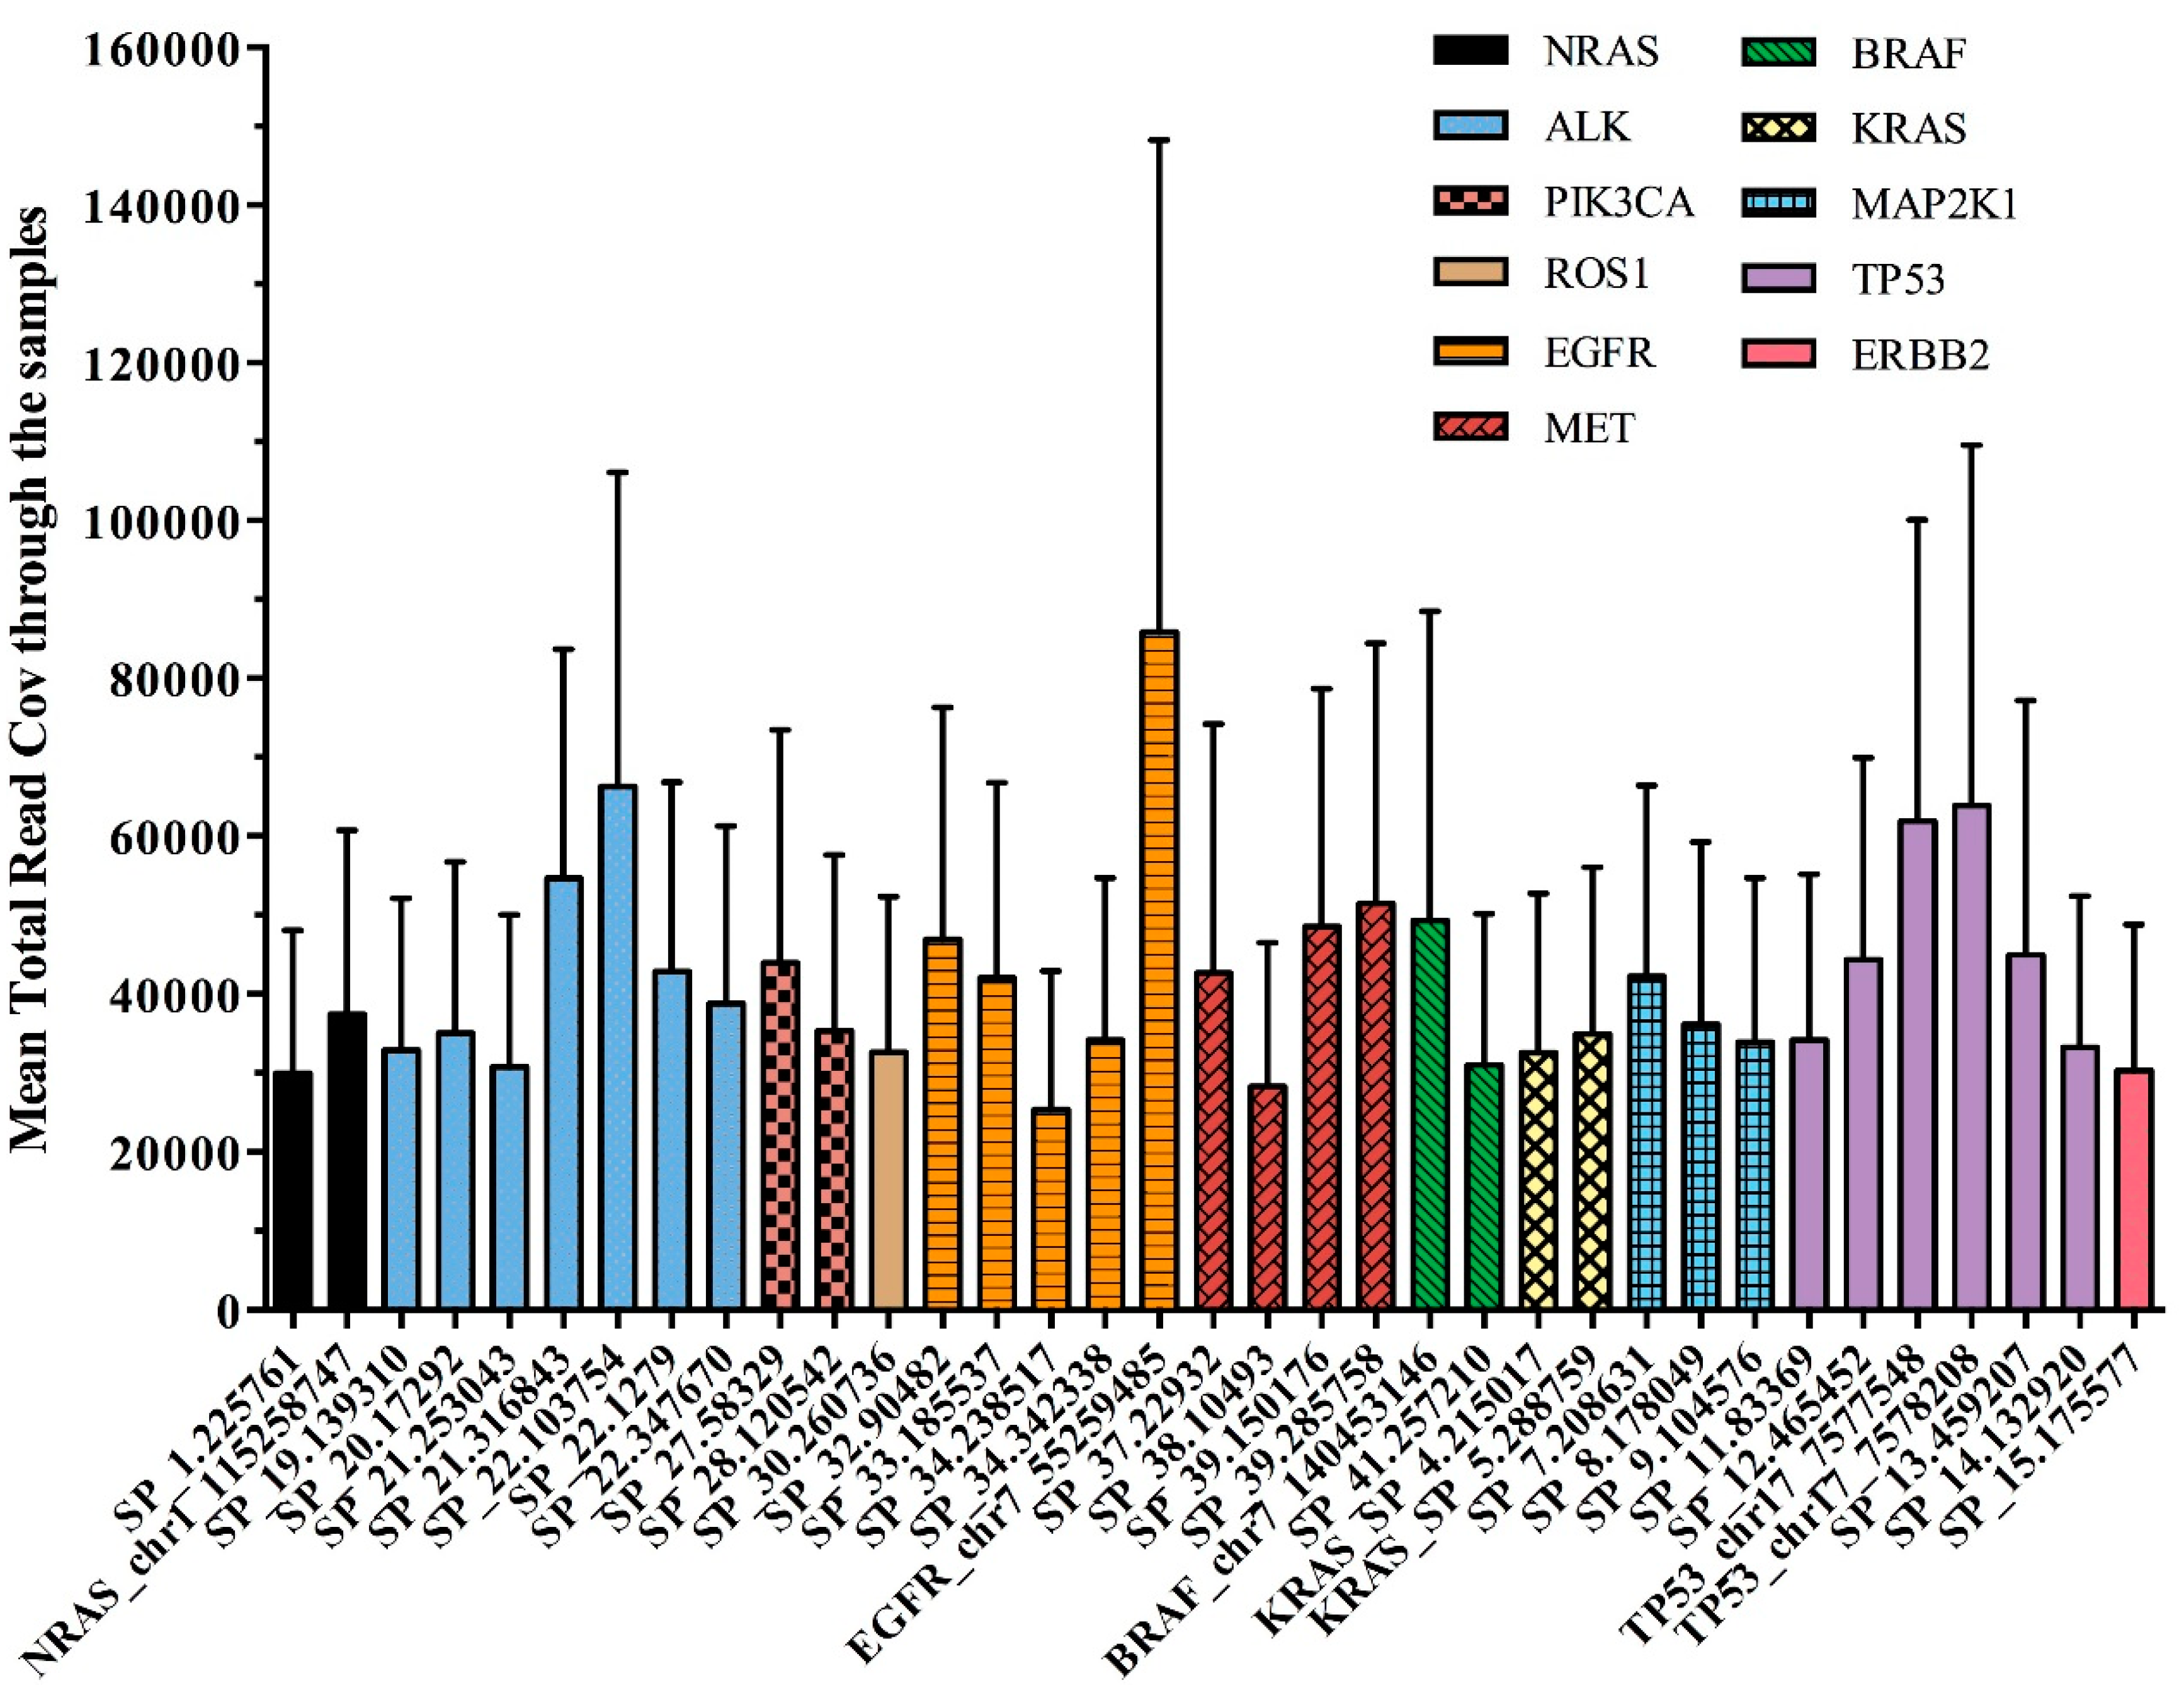
The overall panel performance was assessed by average amplicon coverage across all the 92 samples studied. All 35 amplicons were covered on average to a minimum of 25,352 reads and a maximum of 85,866 reads.
Figure 3 reported the performance of each single DNA region observed in our cohort of plasma samples, distributed across the 11 genes of the OLcfA. A high rate of variability in amplicon coverage was observed and it seems not to be related to cfDNA amounts used for libraries preparation (data not shown) but rather to the intrinsic technical characteristics of the panel. Indeed, the assay is based on a single tube multiplex PCR and primer pairs work under the same thermal conditions, and some differences in performance along the amplicons are expected.
The variability was also identified at an intragenic level, as reported in
Figure 3. For example, the
EGFR gene, represented by 5 amplicons covering exons 18–21 (orange histograms), contained both the best and the worst performing amplicons of the panel (i.e., 85,866 and 25,352 reads, respectively). Notably, the first corresponds to a target region covering hotspot positions in exon 21, instead the second one partly covers exon 20 of the
EGFR gene.
3.2.2. Molecular and Read Coverage of Sequenced Libraries
In all sequenced samples it was possible to proceed with NGS data analysis to validate both library quality and variant call.
Library performance was in particular evaluated by two TSS parameters such as MedReadCov and MedMolCov, i.e., the median number of reads across target regions and original DNA molecules identified (tagged), respectively.
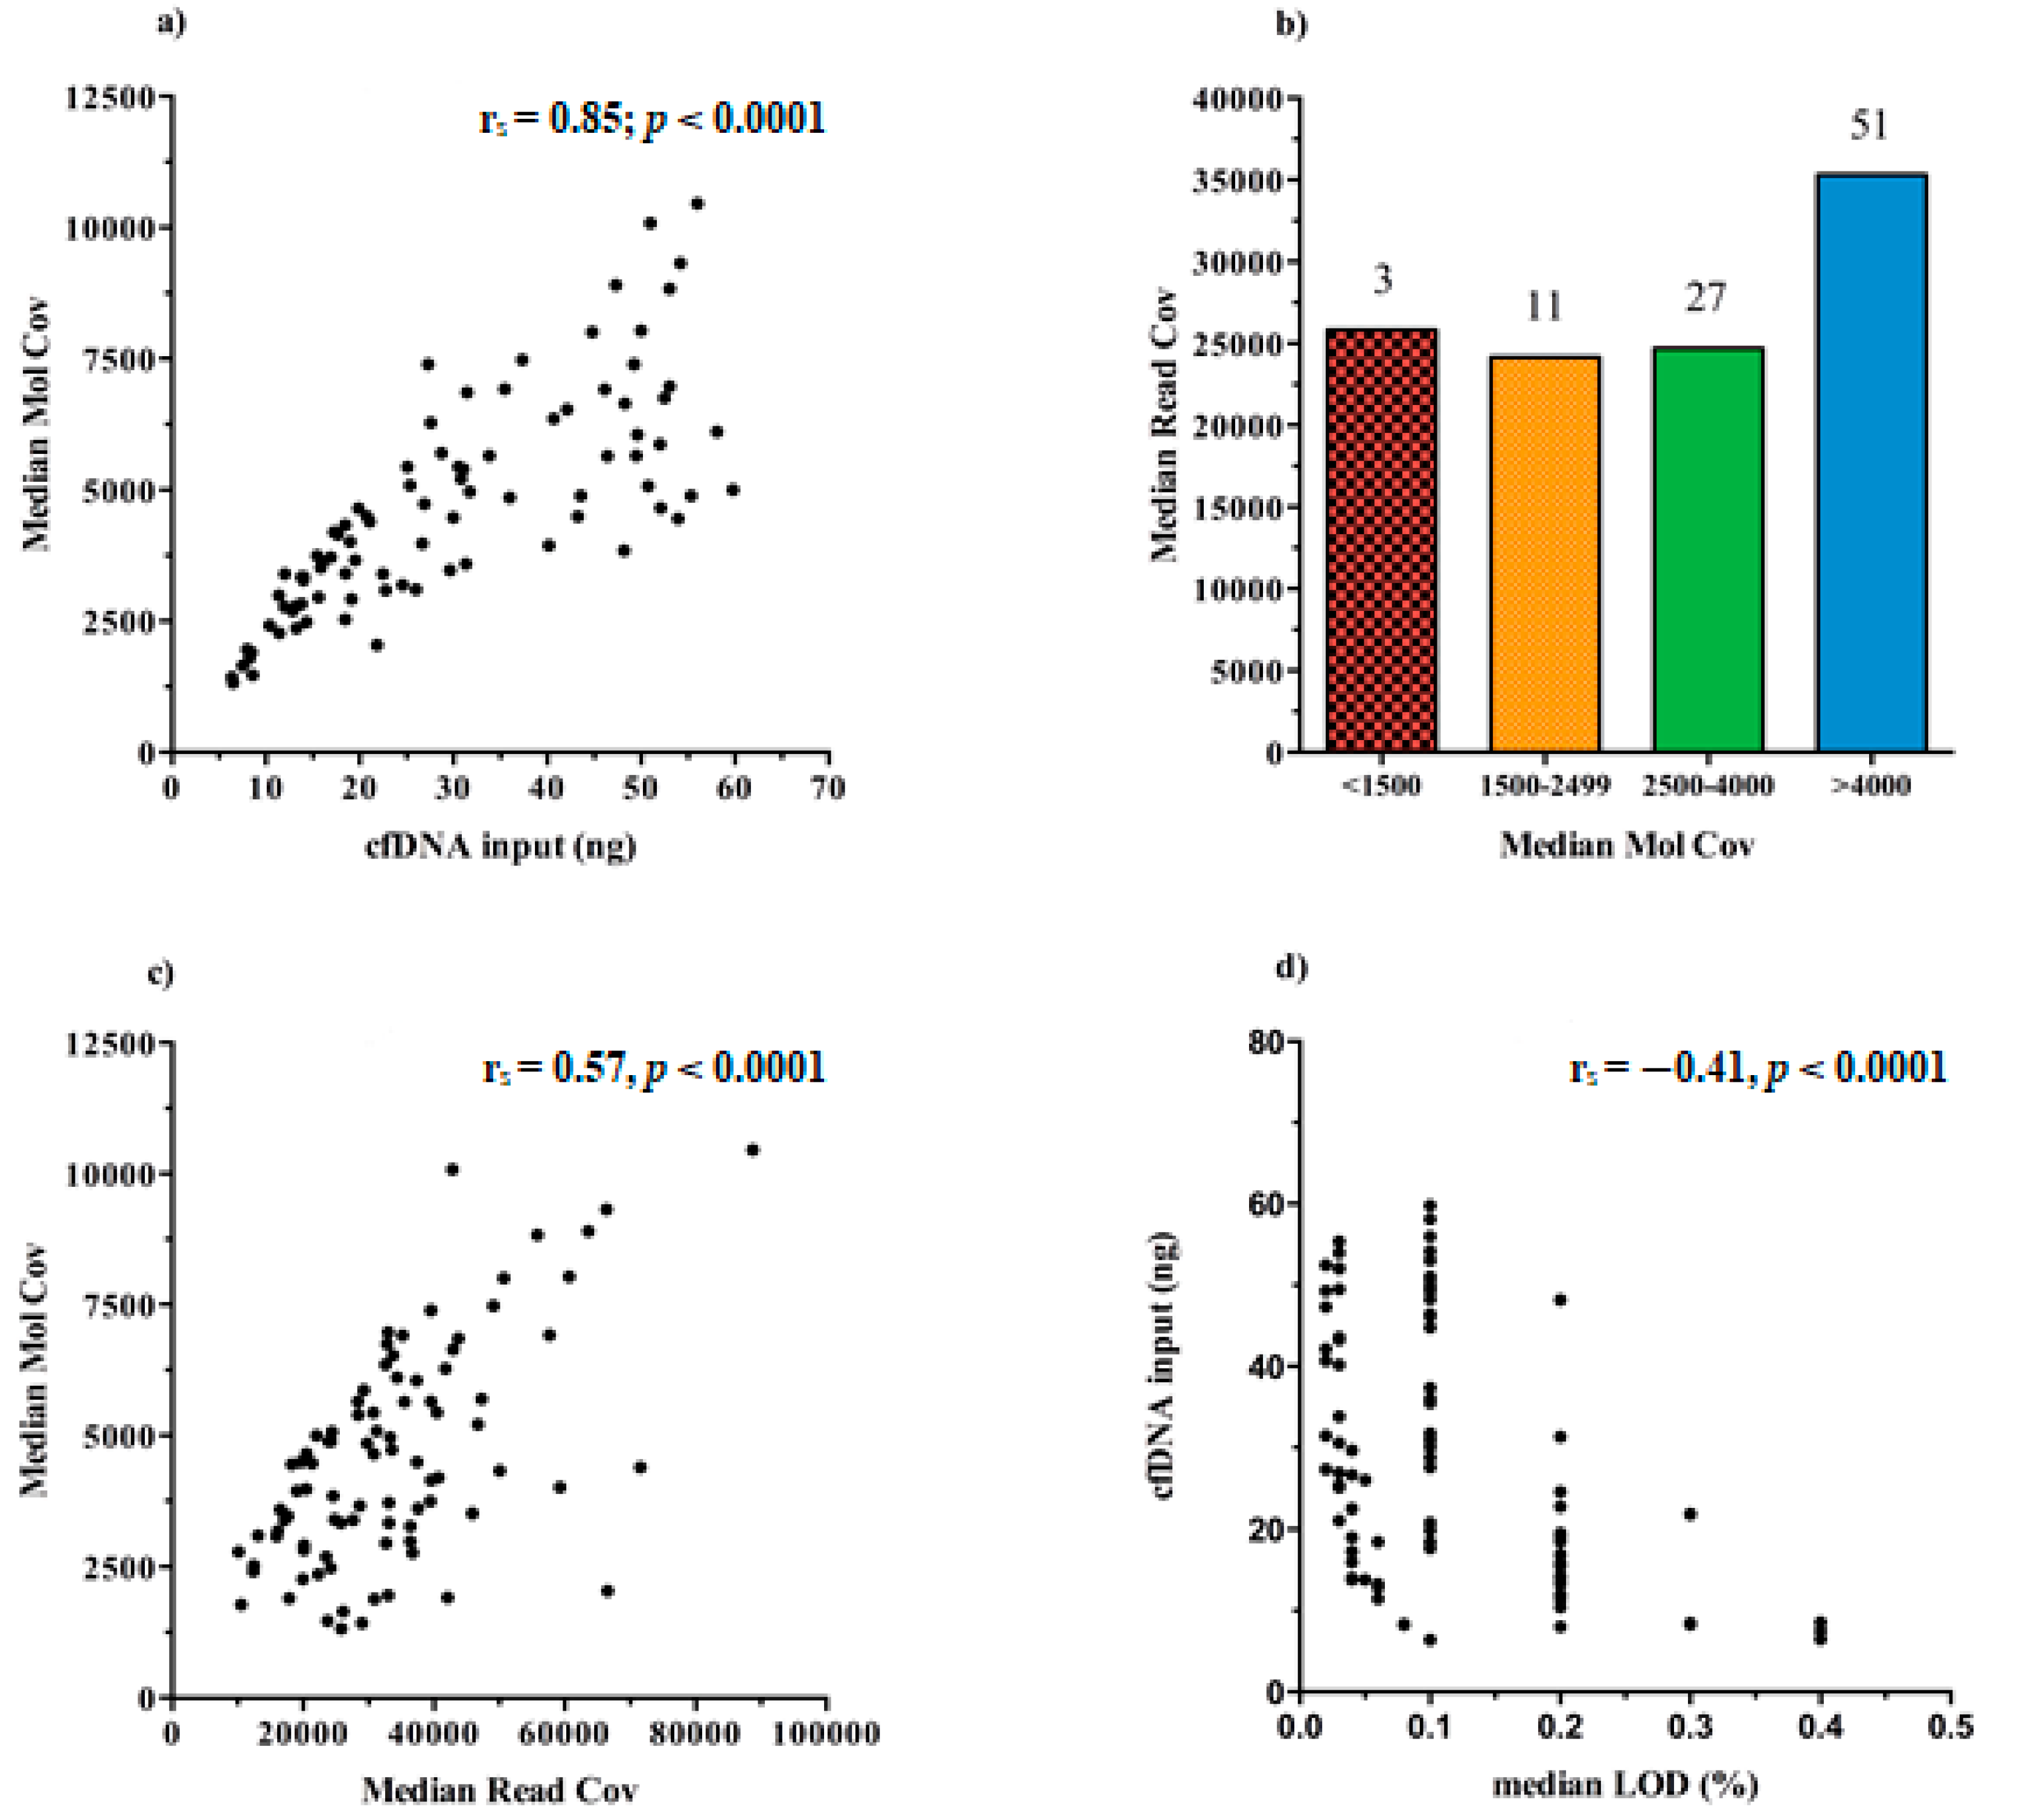
We found that the increasing cfDNA input (ng) used for test leads to higher rates of MedMolCov (r
s = 0.85;
p < 0.0001) and consequently to a more confident number of DNA molecules investigated for mutational search (
Figure 4a).
Taking into account all the 92 sequenced libraries, it emerged that 51/92 achieved a MedMolCov >4000, with a median value of MedReadCov across the samples of 37,405 (range 18,252–88,731), whereas 27/92 samples obtained a MedMolCov between 2500–4000 with a median value of MedReadCov of 24,801 (range 10,116–45,861). Of the remaining 14 samples, 11 showed a MedMolCov between 1500–2500 and only 3 samples <1500, with a median MedReadCov of 24,170 and 25,826, respectively (
Figure 4b).
Since the assay was designed to reach as optimal yield a MedReadCov >25,000 and a MedMolCov >2500 in order to obtain reliable sequencing results and reach a LoD of 0.1%, we showed that in our setting, a complete fulfillment of both parameters was found in 56/92 samples (60.9%). Separately, 81/92 (88%) libraries reached outperforming values of MedMolCov >2500 whereas 63/92 (68.5%) achieved values of MedReadCov >25,000.
An overall moderate positive correlation was revealed between the values of MedMolCov and MedReadCov (r
s = 0.57,
p < 0.0001) (
Figure 4c), thus confirming an optimal NGS workflow performance involving both library generation and amplification steps.
In regard to LoD values of the assay, i.e., the lowest variant allelic frequency that could be reliably detected, in our 92 plasma samples we obtained a median LoD of 0.10%, (range 0.02–0.40%), and as expected, these data negatively correlated with cfDNA input amount (r
s = −0.41,
p < 0.0001) (
Figure 4d). Notably, it was observed that 37/92 samples (40.22%) reached at least 0.1% LoD and among these, 16 (43.24%) initially presented <20 ng of cfDNA input for NGS library preparation.
3.3. cfDNA Input Does Not Determine the EGFR Mutational Status
The relationship between detection of EGFR mutations and cfDNA concentrations, a potential indicator of tumor shedding, was also examined.
To this end, the variant calling analysis was performed by using the cfDNA variant caller plugin with parameters optimized for the “Oncology–Liquid Biopsy” application and in particular, variants were detected when it is found in at least 2 molecular families and when a minimum number of 3 reads with the same tag forms a functional family.
It was observed that 61/92 (66.3%) samples were mutated in hotspot genomic positions within
EGFR gene (
Table S1). In depth, 30/61 carried only one mutation, 30/61 two mutations, whereas only one patient (pt.43) had three mutations (Gly719Cys, Set768Ile and Thr790Met). In all the patients whose plasma resulted in being informative, i.e., positive for the sensitizing EGFR mutations, the variants matched between primary tissue and the corresponding cfDNA (data not shown; see [
16]).
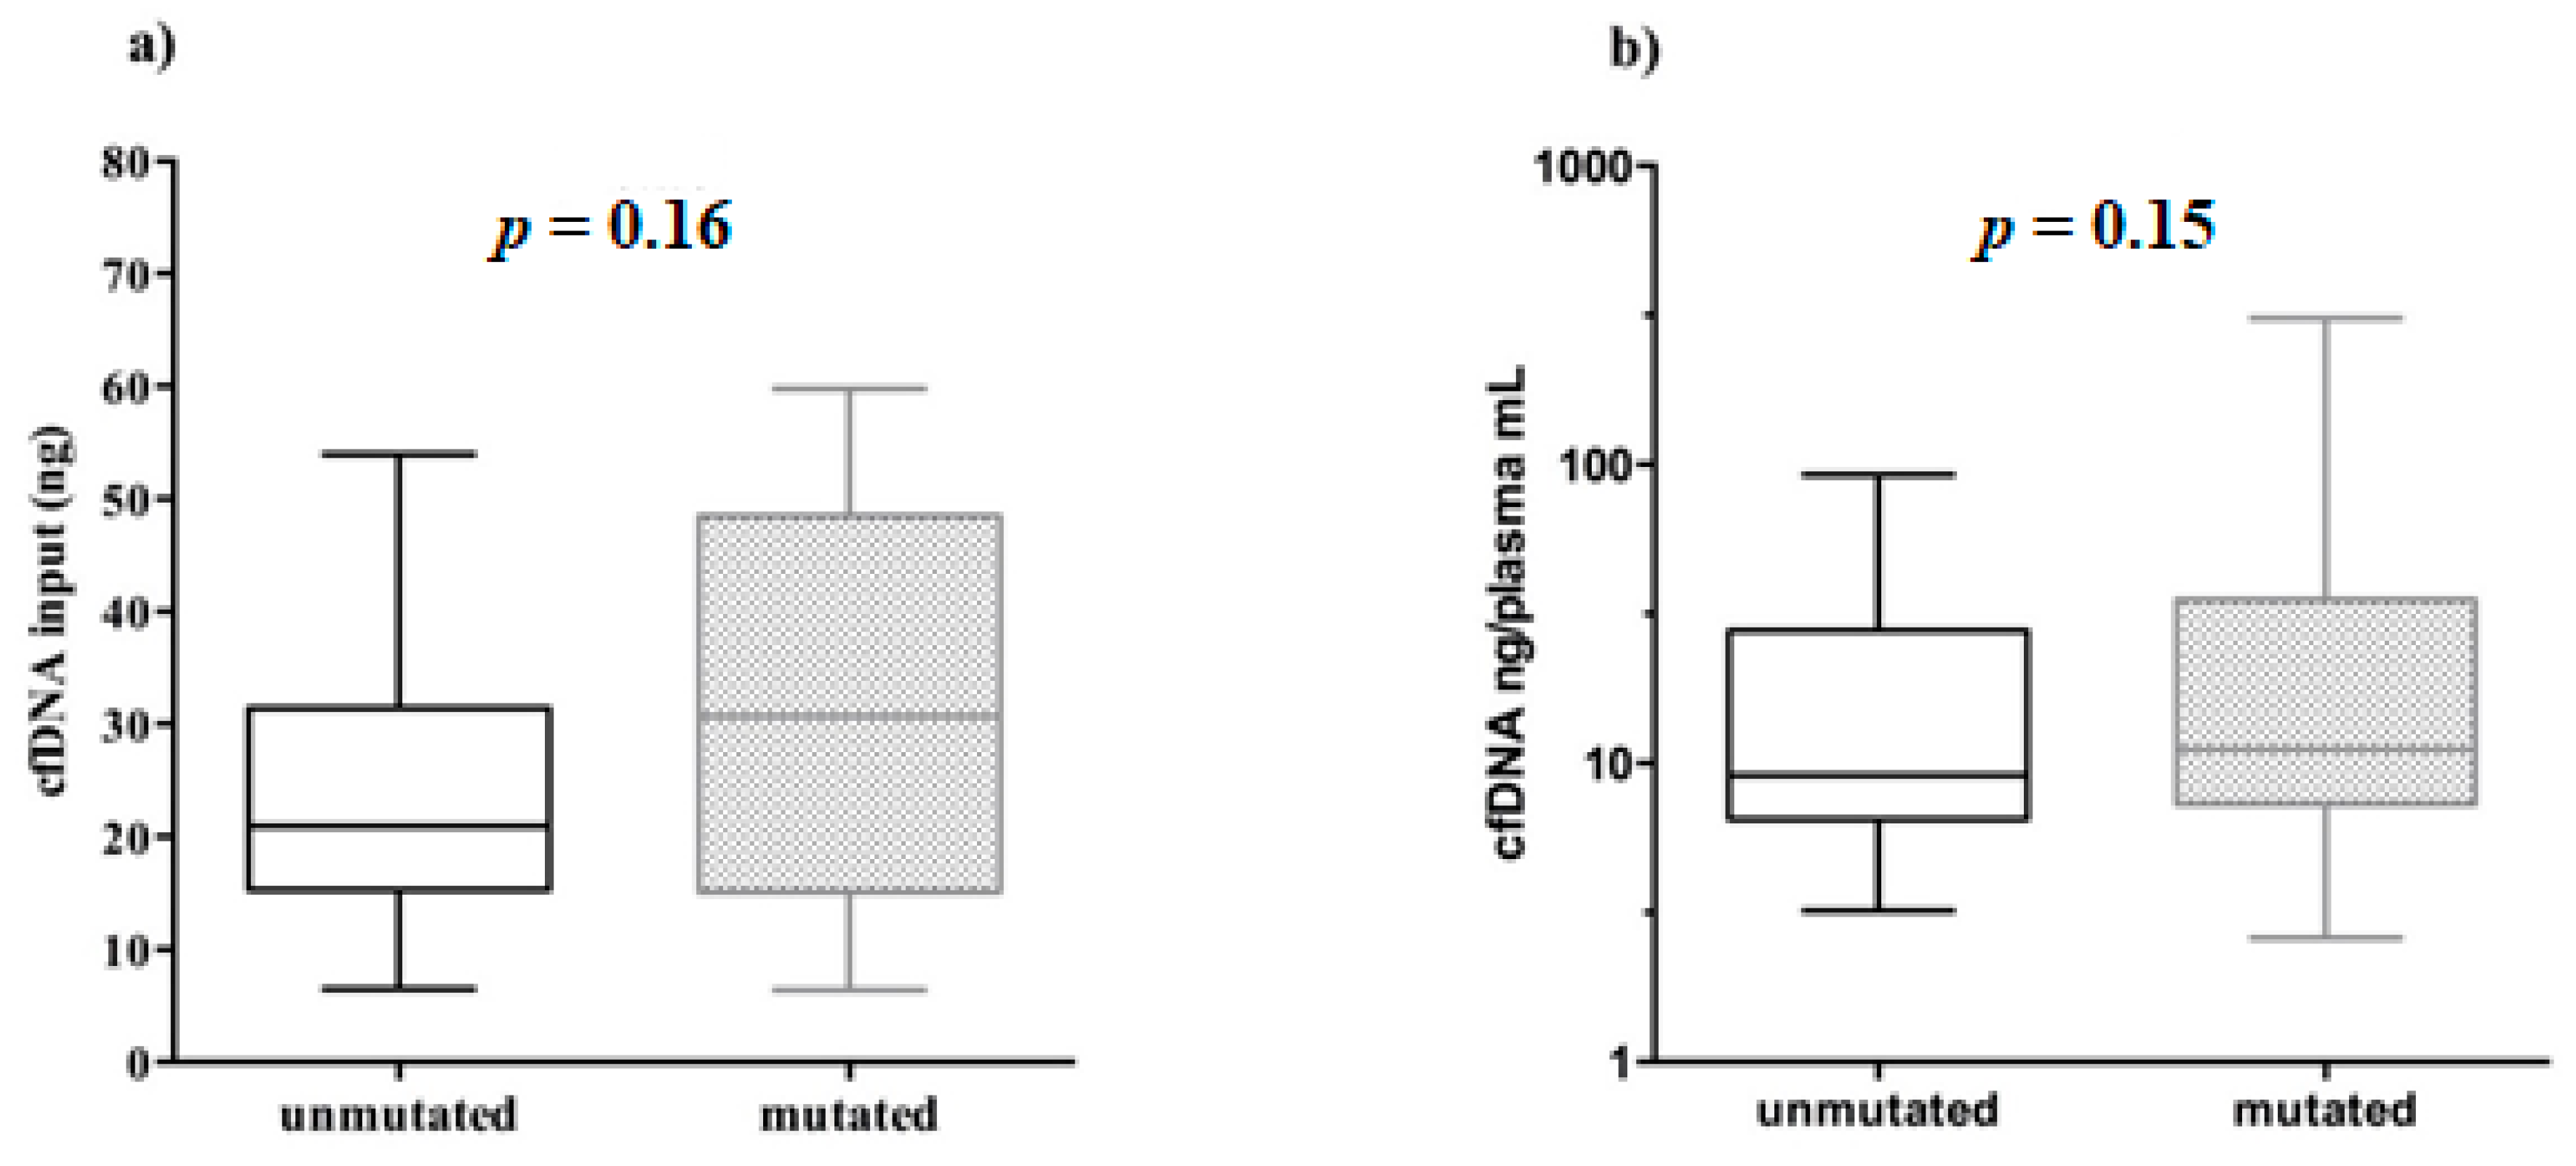
The cfDNA quantity, used for NGS libraries in mutated (6.37–59.80 ng) and unmutated (6.50–53.95 ng) samples was very similar. In addition, no significant correlation was found between the cfDNA input amount used for library preparation and the relative
EGFR mutational status (Mann–Whitney test,
p = 0.16,
Figure 5a).
Furthermore, we showed that even the amount of cfDNA ng/mL plasma did not affect the positivity/negativity of
EGFR mutational testing (Mann–Whitney test,
p = 0.15,
Figure 5b).
Together, these data demonstrate that although we need considerable yields of cfDNA to get more tagged DNA molecules and to intercept even single rare ctDNA molecules diluted within, the mutational detection rely possibly to different aspects mainly associated with biological variability intra- and inter-patients.
3.4. Thr790Met Detection and Torrent Variant Caller (TVC) Metrics Evaluation
The
EGFR Thr790Met variant was detected in 27/61 (44.3%) driver
EGFR mutated plasma samples and co-occurred mostly with exon 19 deletions in 17/27 (63%) and Leu858Arg in 8/27 (29.6%) cases (
Table S1).
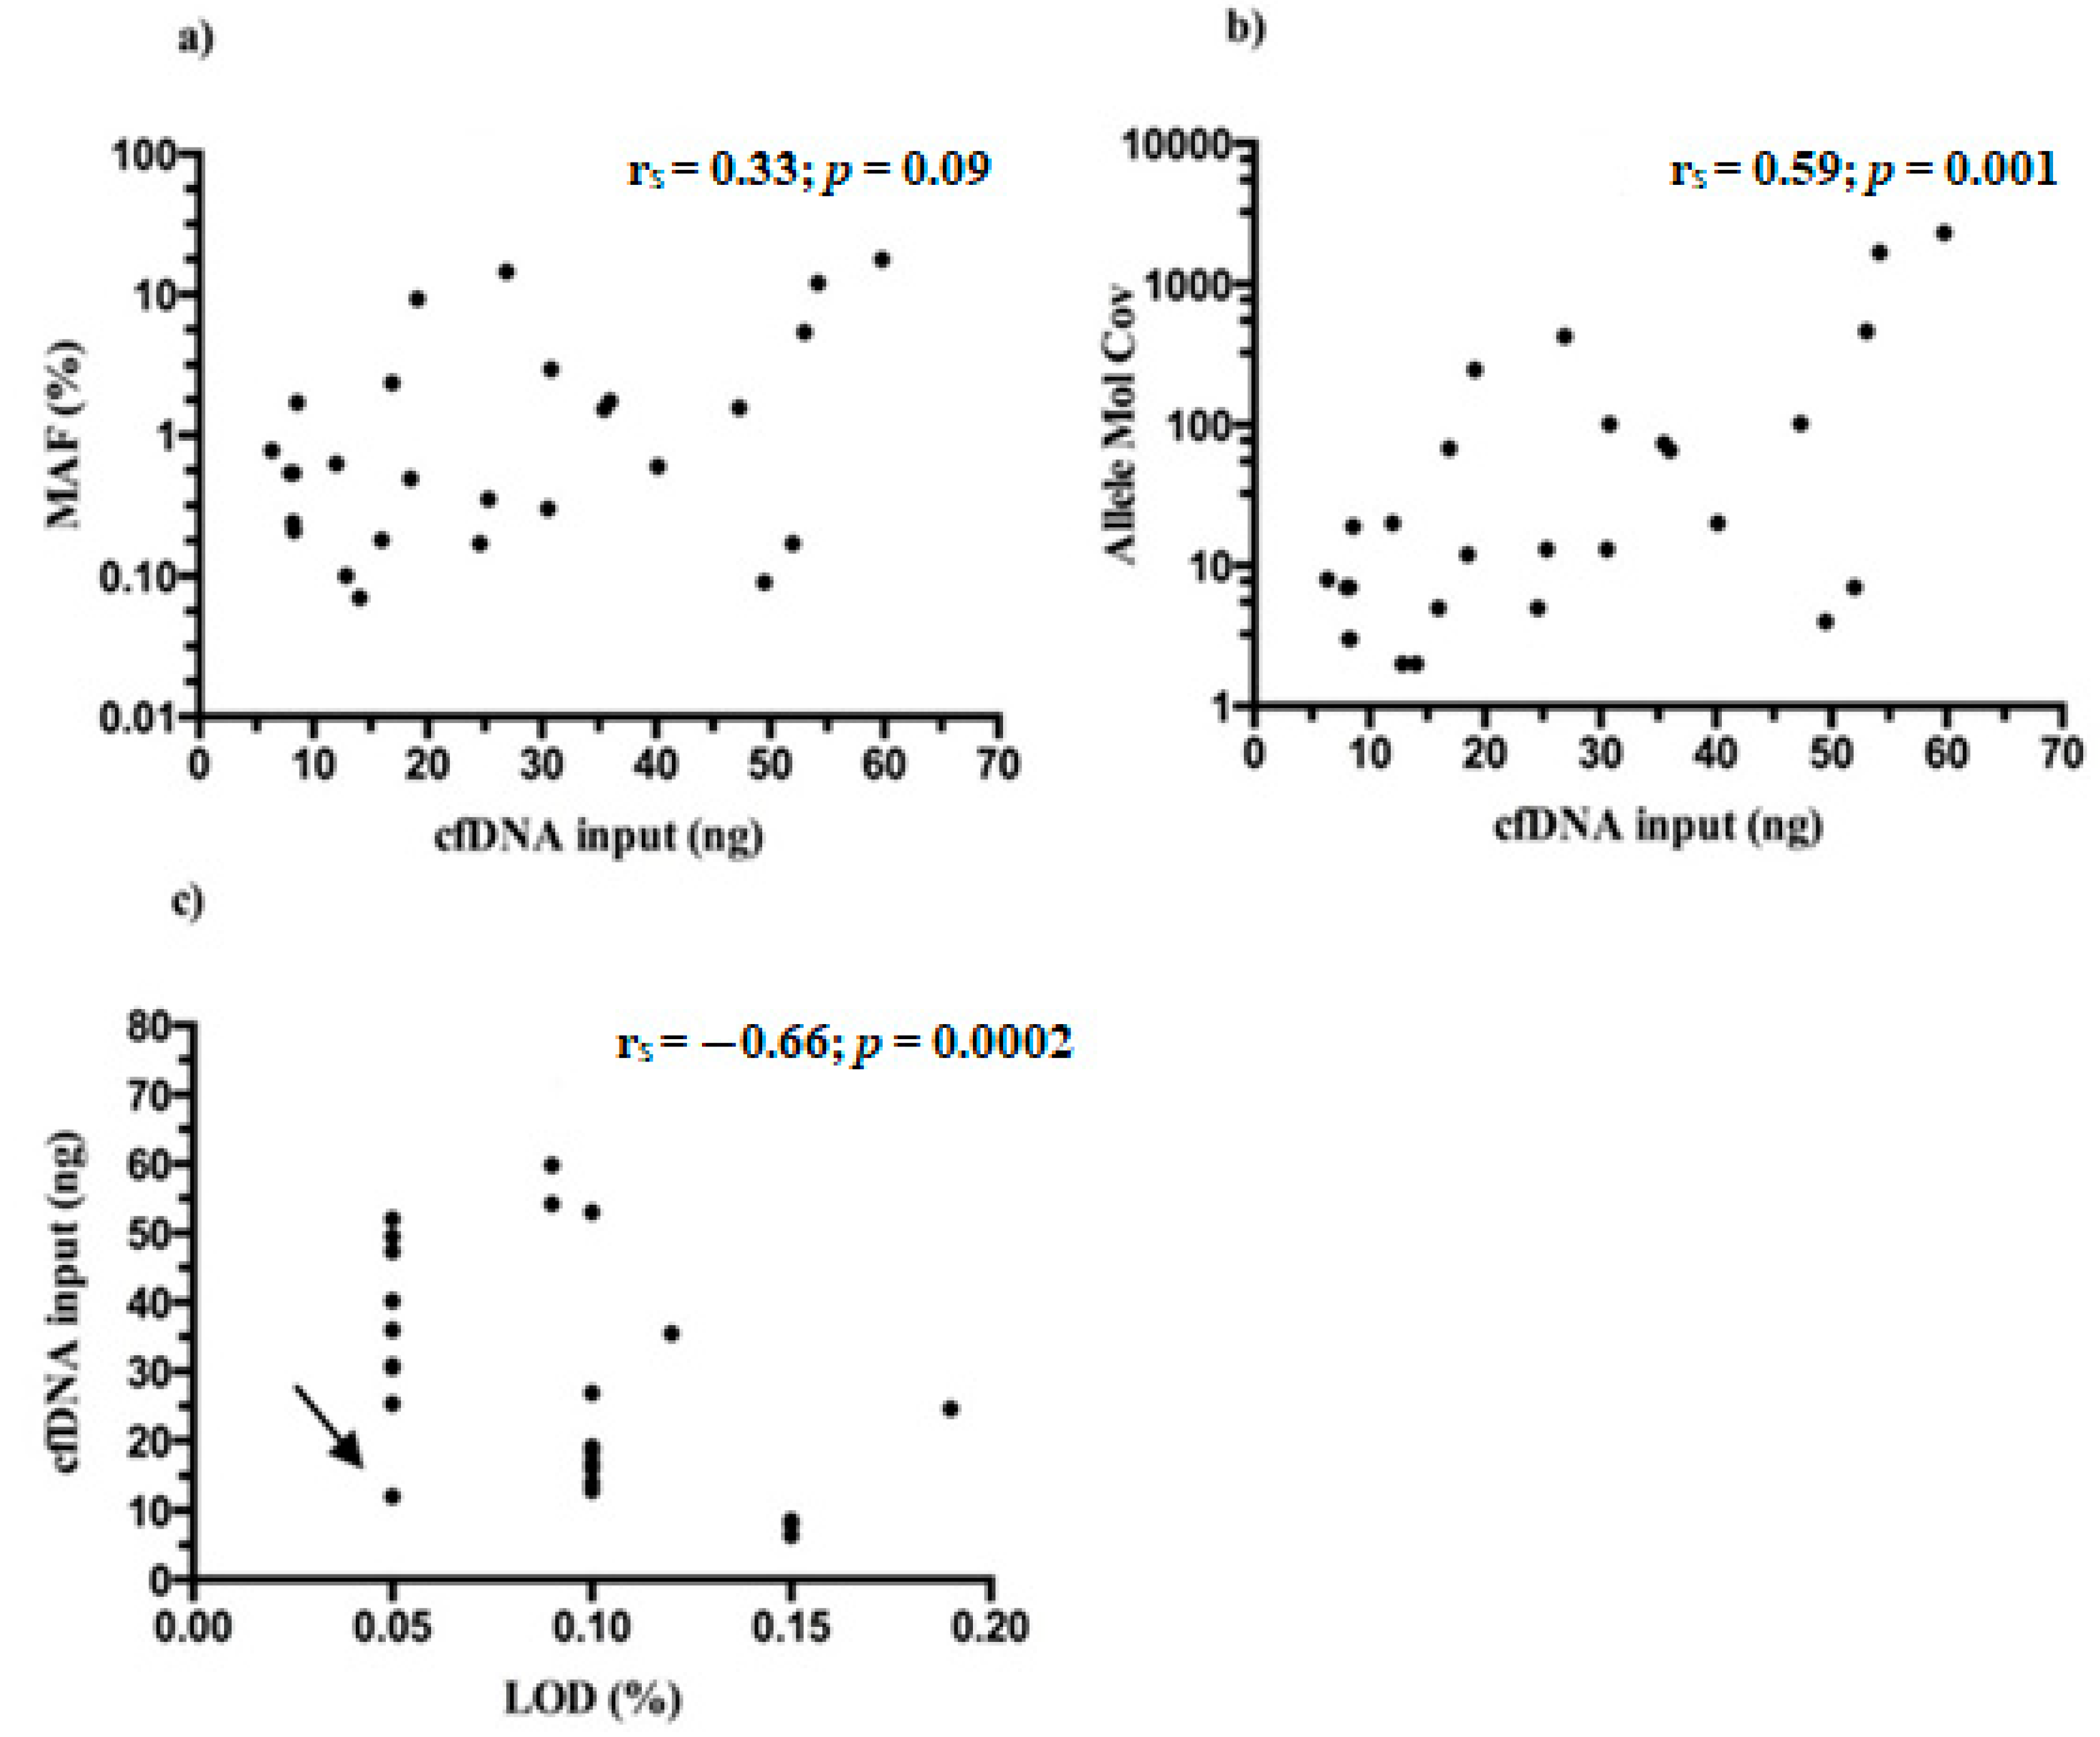
MAFs of Thr790Met detected in mutated samples ranged between 0.06–17.67% (median 0.60%) and almost always were lower than those detected for driver mutation/s in the same patients (
Table S1). No statistical significance was found between the starting NGS input of cfDNA and MAFs found for Thr790Met (r
s = 0.33;
p = 0.09) (
Figure 6a), whereas a moderate correlation was reported when cfDNA amounts were related with allele molecular coverage of tagged DNA molecules containing the variant (r
s = 0.59;
p = 0.001) (
Figure 6b).
Finally, the LoDs reached by Thr790Met variant through the 27 samples (range 0.05–0.15%, median 0.10%) were correlated with the initial cfDNA amount and, as expected, a moderate negative association was found (r
s = −0.66;
p = 0.0002) (
Figure 6c). It is intriguing that in general, the Oncomine NGS panel outperformed, reaching lower LoDs than expected.
3.5. Manual Review of Variant Caller Format (VCF) on Integrative Genomics Viewer (IGV) Evidenced Accuracy and TVC Plugin Gaps
In order to determine if variants found, including single nucleotide variants (SNVs), small insertions and deletions (InDels), were real events or artifacts as well as to exclude the presence of false negatives or misclassification of variant/s, VCF files were manually reviewed by using IGV software.
In our experience, this visual inspection increased the confidence in SNV calls, and in all small canonical InDels in exons 19 and 20 of EGFR gene reported in TSS by TVC. Again, importantly, no variant misclassification was pointed out.
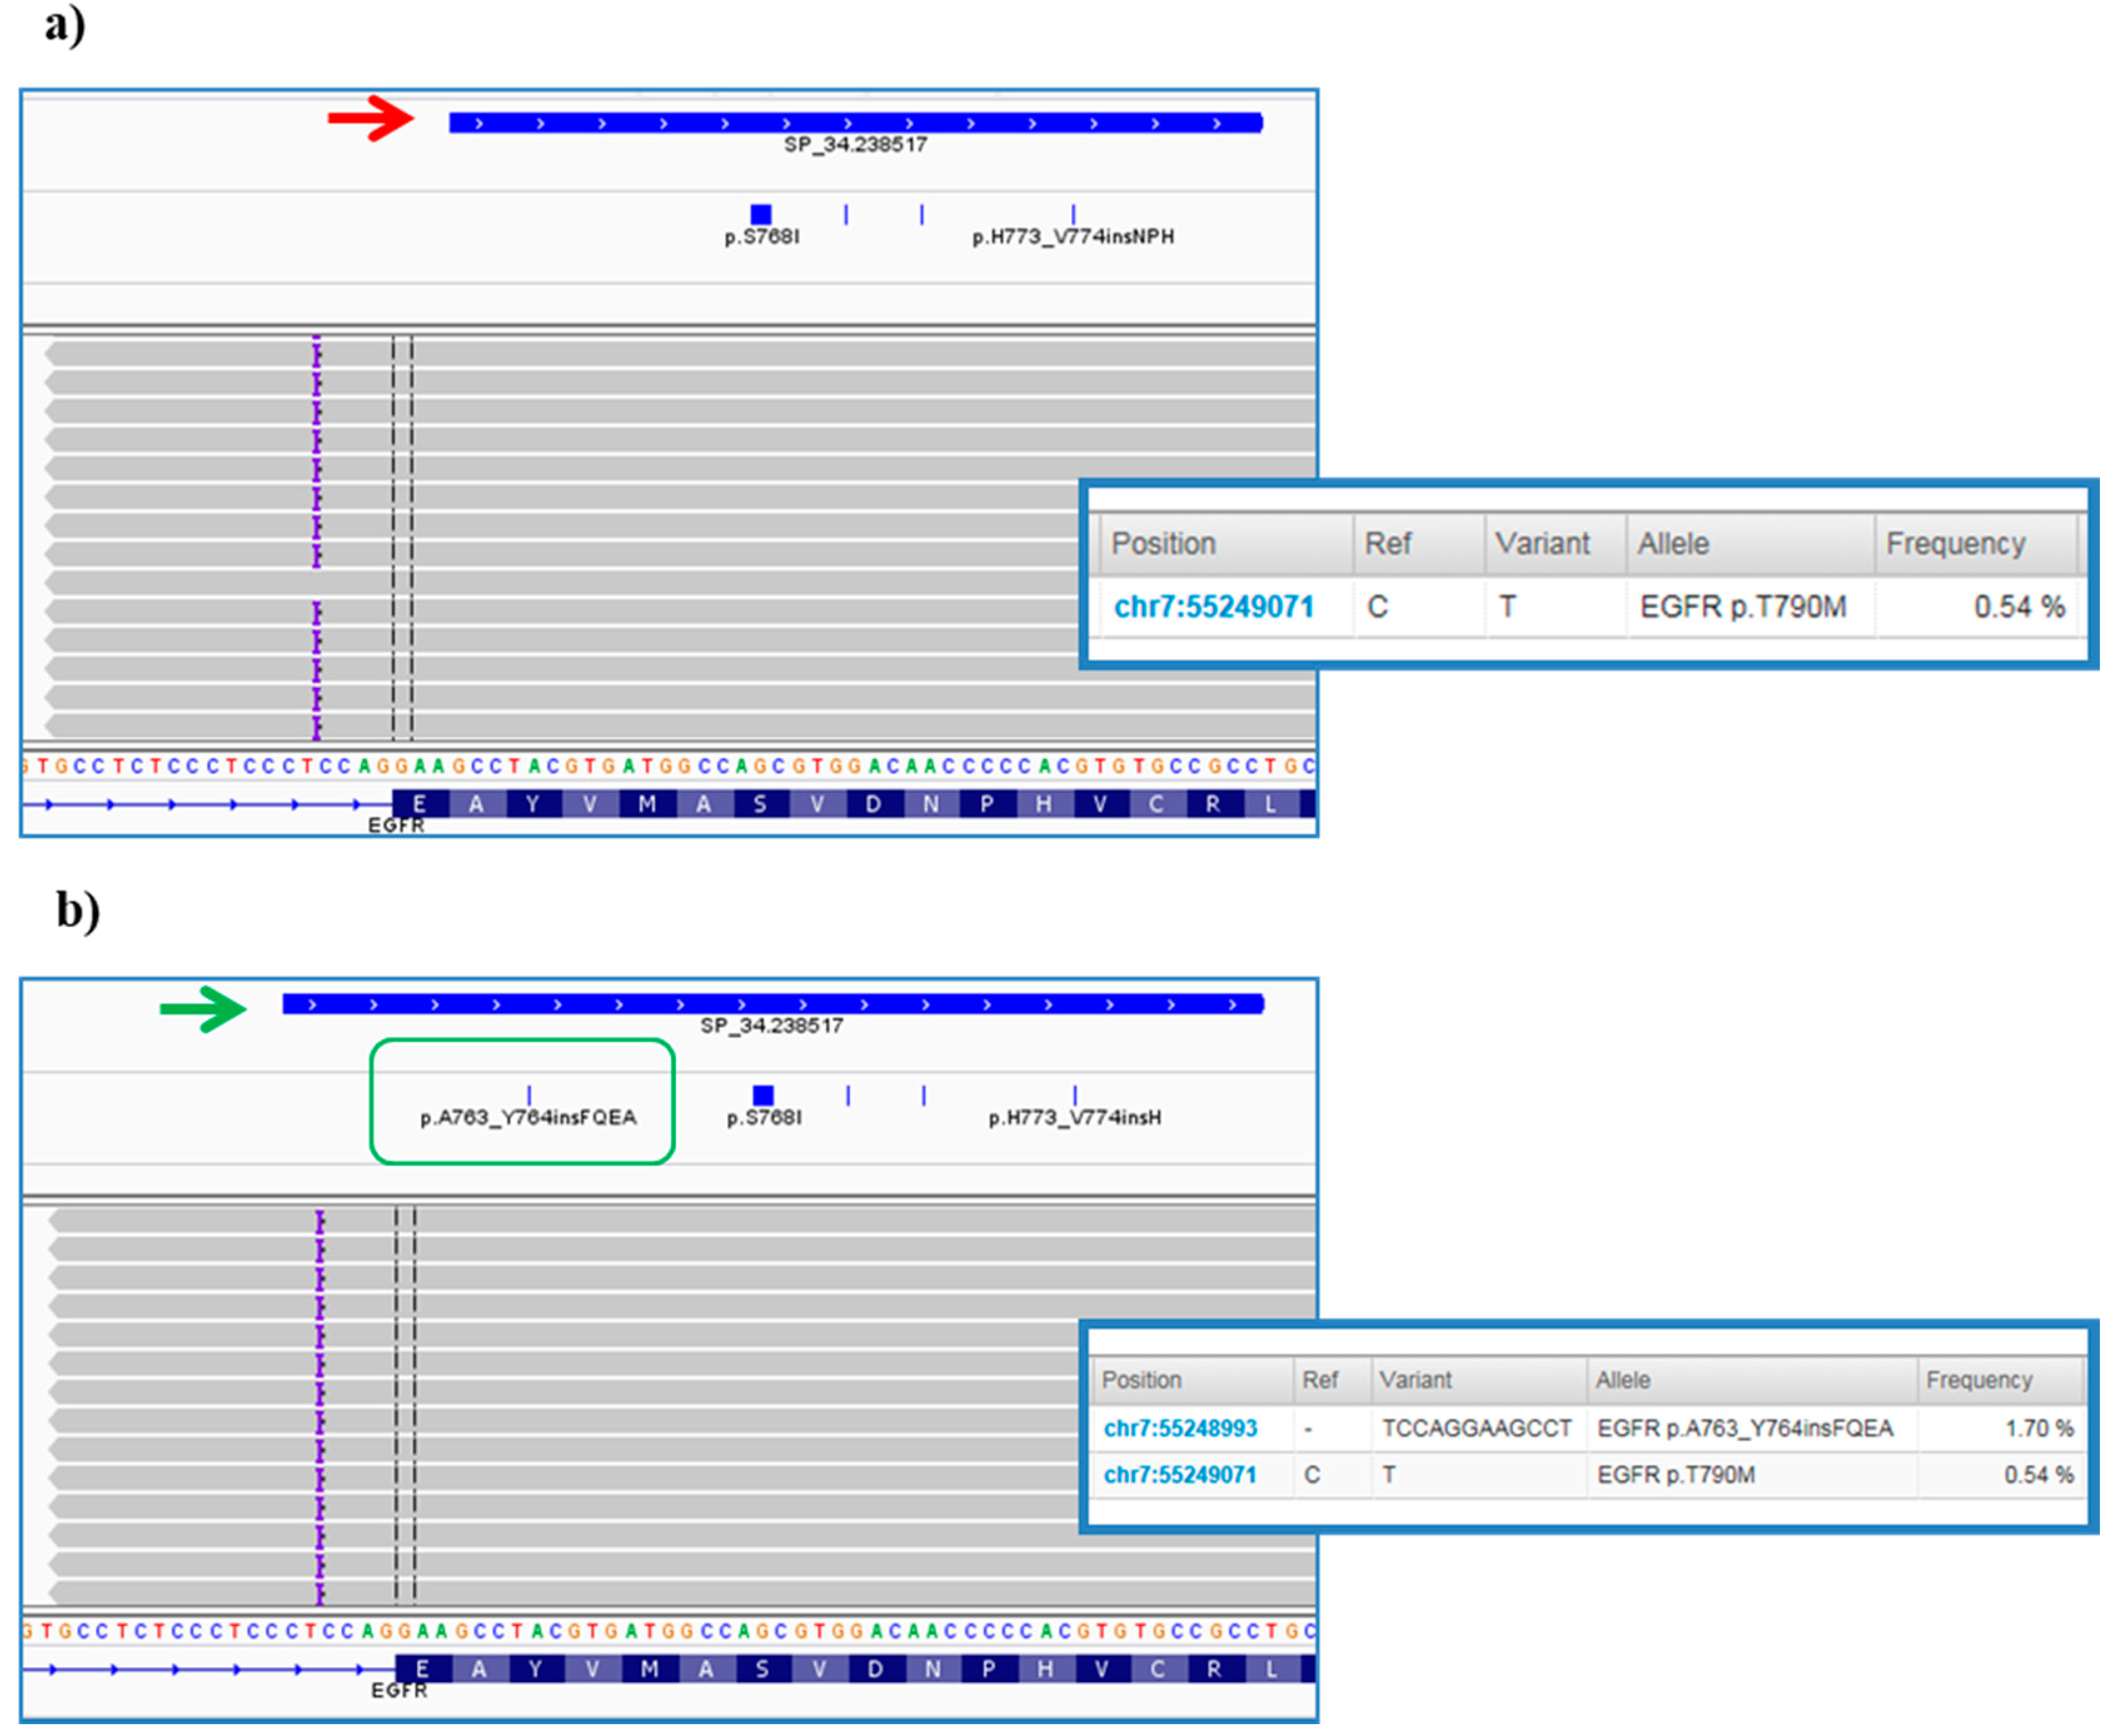
However, further investigation of VCFs allowed us to highlight some critical points of the bioinformatics pipeline predefined by ThermoFisher. In particular, it was noted that the TVC plugin failed to call the
EGFR complex mutations Lys745_Glu746insIleProValAlaIleLys (exon 19) and Ala763_Tyr764insPheGlnGluAla (exon 20) (
Figure 7a), occurring in pt.25 and pt.35, respectively, and previously validated on tissue samples by Sanger sequencing (data not shown). In both cases, the variant falls outside the DNA target regions covered by the Browser Extensible Data (BED) file of the panel, but, only in the second case we were able to obtain the correct variant call, redoing the analysis after an adjustment in analysis configuration of TVC parameters JSON file (version 5.2), specifically within the TMAP string (
Figure 7b). This update was made available to all users by manufacturer in the following versions of the TVC plugin.
Another case of false negative occurred in pt.60, who harbored a complex mutation in EGFR exon 19, i.e., Arg748_Ala755delinsThr. Even in this particular case, the variant was discovered in tissue by Sanger sequencing but found in the plasma only through the IGV visualization.
However, despite fitting the amplicon, the variant was not called and thus a different modification of the TVC parameters, was required. In detail, the parameter "allow_complex" was changed from “0” to “1” and then the variant was found listed into Allele Source “Novel” of TVC plugin section.
4. Discussion
Liquid biopsy has emerged as a promising solution to overcome current limitations associated with tissue biopsies in precision medicine laboratories [
18].
CfDNA represents the most stable genetic material and accessible source in the liquid biopsy field and its assessment allows the detection and monitoring of cancer-specific genomic alterations in blood [
19]. Even if ctDNA analysis is not a replacement for histologic confirmation, it results in being clinically useful in the diagnostic approach. This molecular testing, due to its high specificity, non-invasive nature and fast turnaround time, can represent a valid tool at diagnosis or progression, even preceding tissue genotyping and can be used to guide treatment [
20,
21].
Nevertheless, the analysis of ctDNA is challenging due to the mainly low representation of mutated tumor-derived DNA molecules in the plasma. Furthermore, although plasma of cancer patients contains more cfDNA compared to healthy individuals [
17,
22], the proportion of ctDNA originating from the tumor is highly variable, ranging from <0.1% to >50% of total cfDNA [
23,
24]. Therefore, methods which are able to detect small number of mutated molecules in an abundance of unmutated DNA fragments with high sensitivity and specificity are required.
NGS methods have been revealing a promising approach to detect more sensitive and specific biomarkers for clinical utility. Considering NSCLC management, targeted therapies, like TKIs, require a sensitive and precise mutation profiling of the tumor to ensure identification of every patient who could potentially benefit from therapy. In particular, acquired resistance mutations of the
EGFR gene, for example Thr790Met occurring in up to 60% of NSCLC patients, represent a clinical challenge in the treatment [
25,
26,
27,
28]. In this context the analysis of ctDNA has become a hopeful tool to verify the Thr790Met presence in NSCLC patients, which developed a resistance to TKI therapy [
29,
30]. Therefore, the most relevant requirements for an NGS panel to be used for liquid biopsy purposes are high levels of sensitivity and specificity to ensure true variant calling at very low frequencies. Technically, to overcome the drawbacks of PCR-based NGS (e.g., DNA polymerase errors, etc.), the addition of UMI, i.e., random nucleotide sequences barcoding each DNA molecule prior to PCR amplification, was introduced [
5,
6,
7,
8,
9,
10]. This artifice allows us to distinguish reads amplified from the same original DNA molecule and to identify molecules containing true variants from false positives.
In this study, we tested the feasibility of the OLcfA NGS panel UMI-based on a cohort of NSCLC patients (n = 76) and, mostly, we focused on pre- and analytical details from 92 plasma samples. We validated the assay on both wet bench and bioinformatics processes across a broad spectrum of validation parameters including sequencing performance, analytical sensitivity and specificity and LoD reached. The approach was firstly validated with commercially available cfDNA reference material providing EGFR hotspot variants at MAFs down to 0.1% and confident levels of sensitivity and specificity achieved (92.5% and 100%, respectively).
From an overall view of the sequencing performance of the panel, it emerged that not all amplicons performed similarly. This was likely due to a different PCR amplification efficiency, expected when dealing with multiple genes/target regions panels where DNA library generation occurs in single-tube reactions. According to literature, it is verifiable in both small (as in our case) as well as large NGS panel [
31].
Regarding the pre-analytical parameters, in our cohort we found a considerable rate of heterogeneity in levels of cfDNA abundance across the plasma samples (2.6–309 ng/mL of plasma), indicating that it is not possible to predict how much cfDNA will be achieved, neither at an inter- or intra-patient level. However, this issue is well known, and in fact that the shedding of cfDNA into the bloodstream is affected by several individual characteristics, such as tumor stage, metastasis, inflammation, treatment, and comorbidities [
1,
3,
18,
32].
LoD evaluation through the samples revealed, not surprisingly, that higher quantities of cfDNA input allowed to reach very low levels of LoD (up to 0.02%), as also similarly reported by others [
17], with the advantage to preserve specificity of the NGS workflow. It is interesting to note that at least 0.1% LoD was reached in 37/92 cases (40.22%). In order to achieve such LoD value, the manufacturer recommends to employ at least 20 ng of cfDNA input for NGS library preparation. In our data, we demonstrated that even when <20 ng of cfDNA were available, it was still possible a 0.1% LoD for almost the half (16/37, 43.20%) of these samples. This further suggests that predetermined cfDNA input for LoD can, therefore, only be a vague reference of what would be expected.
Bearing in mind what is reported by manufacturer to reach the main goal of a 0.1% LoD, we showed a fulfillment of the median value of molecular families (MedMolCov >2500) and the median values of read coverage (MedReadCov >25,000) in more than half of sequenced samples (60.9%). Not surprisingly, a strong correlation between the cfDNA input and MedMolCov was found, since it is expected that the more cfDNA that is introduced for NGS libraries, the higher will be the number of molecular families sequenced, as already reported [
17]. By contrast, no significant association was found between DNA quantity (both cfDNA input and cfDNA abundance) and the
EGFR mutational status (
p > 0.15). However, this finding is not surprising, indeed it is known as the ctDNA portion can widely vary of total cfDNA, also in NSCLC [
33,
34]. Anyways, our data are encouraging since we showed that it is possible to carry out mutations even in plasma samples with low amounts of cfDNA, with the huge advantage of a reduced number of “non-informative” blood draws in routine clinical practice.
These data together demonstrate, first of all, the high translational strength of the assay that is shown to be reliable and sensitive. Secondly, the automatic bioinformatics pipeline allows us to directly have the output files (BAM and VCF) for each sequenced sample and execute a graphical and statistical overall evaluation through predefined parameters available in TSS.
Nevertheless, despite the previous promising results, this cannot still be considered an optimal analysis workflow in all instances; indeed, if on the one hand molecular tagging lowered drastically the rate of false positives, on the other false negatives can still occur. In particular, in our cohort, we reported the variant calling failure of three complex mutations. It is important to note that in these cases the mutations were filtered out by the TVC plugin despite reaching the values of MAF and coverage to enable a call. These were in particular two insertions on exon 19 and 20 and a deletion on exon 19 of EGFR, only displayable through the inspection of the genomic positions of interest on IGV. For two out of three InDels (exon 20 insertion and exon 19 deletion) an adjustment of current default setting, consisting in a lower stringency of specific TVC parameter JSON file, enabled the subsequent successful variant detection. In these cases, the variant interception was facilitated by retrospective molecular analysis on tissues. However, it is not always possible to know a priori the EGFR driver mutation and so it is necessary to obtain help from software visualization (e.g., IGV) and/or a validated external bioinformatics pipeline for variant calling.

 ,
, 


