Article

Surface Defect Detection for Mobile Phone Back Glass Based on Symmetric Convolutional Neural Network Deep Learning

1
State Key Laboratory of Modern Optical Instrumentation, Department of Optical Engineering, Zhejiang University, 38 Zheda Road, Hangzhou 310027, China
2
Zernike Optics Co., Ltd., 10 Shengang Road, Hangzhou 310027, China
*
Author to whom correspondence should be addressed.
Submission received: 2 March 2020 / Revised: 20 May 2020 / Accepted: 22 May 2020 / Published: 23 May 2020

Abstract

:
Defect detection based on machine vision and machine learning techniques has drawn much attention in recent years. Deep learning is very suitable for such segmentation and detection tasks and has become a promising research area. Surface quality inspection is essentially important in the manufacturing of mobile phone back glass (MPBG). Different types of defects are produced because of the imperfection of the manufacturing technique. Unlike general transparent glass, screen printing glass has totally different reflection and scattering characteristics, which means the traditional dark-field imaging system is not suitable for this task. Meanwhile, the imaging system requires high resolution since the minimum defect size can be 0.005 mm2. According to the imaging characteristics of screen printing glass, this paper proposes a coaxial bright-field (CBF) imaging system and low-angle bright-field (LABF) imaging system, and 8K line-scan complementary metal oxide semiconductor(CMOS) cameras are utilized to capture images with the resolution size of 16,000*8092. The CBF system is applied for the weak-scratch and discoloration defects while the LABF system is applied for the dent defect. A symmetric convolutional neural network composed of encoder and decoder structures is proposed based on U-net, which produces a semantic segmentation with the same size as the original input image. More than 10,000 original images were captured, and more than 30,000 defective and non-defective images were manually annotated in the glass surface defect dataset (GSDD). Verified by the experiments, the results showed that the average precision reaches more than 91% and the average recall rate reaches more than 95%. The method is very suitable for the surface defect inspection of screen printing mobile phone back glass.

1. Introduction

Quality control of products is very important in manufacturing industries. The traditional manual visual inspection method needs a lot of well-trained workers, is always labor consuming and inefficient, and the standards can be very different because of personal subjectivity. In the past decades, with the development of the optical technique and computer technique, many automatic optical inspection (AOI) solutions [1,2,3,4] were proposed for the surface defect inspection task. Such a contactless inspection method can essentially improve the inspection accuracy and efficiency, providing guidance in production. The labor expenses can also be tremendously reduced. A typical defect inspection system is mainly composed of an imaging system and image processing algorithms. The imaging system should be carefully designed based on the imaging characteristics of the objects’ surface, and a charge-coupled device(CCD) or CMOS camera applied to capture the images of objects illuminated by a custom-made light source. The camera can be a line-scan camera or matrix camera, which is determined by the object size, imaging resolution, and imaging efficiency requirements. The dark-field imaging system is often used in optical surface defect inspection systems [4,5,6], since the imaging system only receives the scattered light of defects on the smooth optical elements. A bright-field imaging system is also widely used for defect detection because of the sensitivity in high-contrast areas [7,8]. When the images of the object are obtained, the next step is image processing, which is essentially important for the whole system. The defect detection process mainly includes preprocessing, defect detection, and classification. Image denoising and non-uniformity correction in preprocessing would improve the image quality. Hand-crafted approaches like image filters, morphological operations, and other techniques are utilized to extract the features of defects, and classical machine-vision methods, such as Support Vector Machine(SVM) [9], decision trees [10], and k-Nearest Neighbor(kNN) [11], are applied for defect classification.
The automatic detection demand of defects for mobile phone glass is rapidly growing. Different types of defects like a scratch, dent, and discoloration are produced during the glass production process. Many AOI inspection systems have been proposed for the quality inspection of mobile phone glass. Martíne proposed an automated inspection system for the surface quality inspection of transparent parts, and the system is versatile and adaptable to different products and part models [1]. Li Di proposed an automatic defect inspection system. Here, a plane array CMOS camera was utilized to capture images of the mobile phone cover glass and principal components analysis was utilized for five typical cover glass defects’ recognition [12]. Based on the multifractal spectrum, Jian proposed an imbalanced mobile phone screen glass defect classification method, which achieved a 96.61% overall accuracy [13].
With the Industry 4.0 potential transformation from machine dominant manufacturing to digital manufacturing [14], the defect detection task demands higher accuracy. Deep learning based on a deep convolutional neural network achieved a great breakthrough in object recognition and image segmentation tasks [15,16,17,18,19,20,21,22]. In the classical machine vision inspection method, features extraction of an object is crucial [23], as experienced machine vision engineer designs or selects the suitable features according to a certain manually predefined algorithm based on a priori knowledge. On the contrary, the deep convolutional neural network can automatically learn high-level features by feeding enough positive samples and negative samples with a proper network, and there is no need to design hand-crafted features. Zhi-chao proposed an automatic mobile phone cover glass detection system based on backlight line-scanning imaging technology and introduced a modified segmentation method based on deep learning [24]. Weimer proposed a machine vision system, which used basic patch statistics from raw image data combined with a two layer neural network to detect surface defects on arbitrary textured and weakly labeled image data [25]. Using ReLU for the activation function, Faghih-Roohi proposed a deep convolutional neural network solution to detect the defects of rail surface from many hours of automated video recordings [26]. Tabernik proposed a segmentation-based deep-learning architecture using only 25–30 detective training samples for the detection and segmentation of surface anomalies. The segmentation output map was 8-fold reduced in the resolution of the input image [27]. Even though there are many deep learning applications in the area of industrial surface detection, there are some limitations compared with other areas like facial recognition and natural language analysis. Different detection objects have totally different imaging properties, and there are few publicly available image datasets of a specific detection object, making it very difficult to use a unified method to detect all kinds of objects.
This paper proposes an AOI inspection system for the surface defect detection of screen printing mobile phone back glass. Different from normal transparent glass, the surface background of MPBG is complicated with a more inhomogeneous texture. It is a bigger challenge for the imaging system and the detection algorithm. The first important part is the double bright-field imaging systems. Without the use of a traditional dark-field imaging system, the coaxial bright-field (CBF) imaging system and low-angle bright-field (LABF) imaging systems are designed for major defects like a scratch, dent, and discoloration. The second part is presenting the symmetric convolutional neural network for the image segmentation. Here, more than 30,000 images were manually annotated and used as the training sample for the Symmetry-Net. The comparison with the classical traditional machine vision technique is also presented.

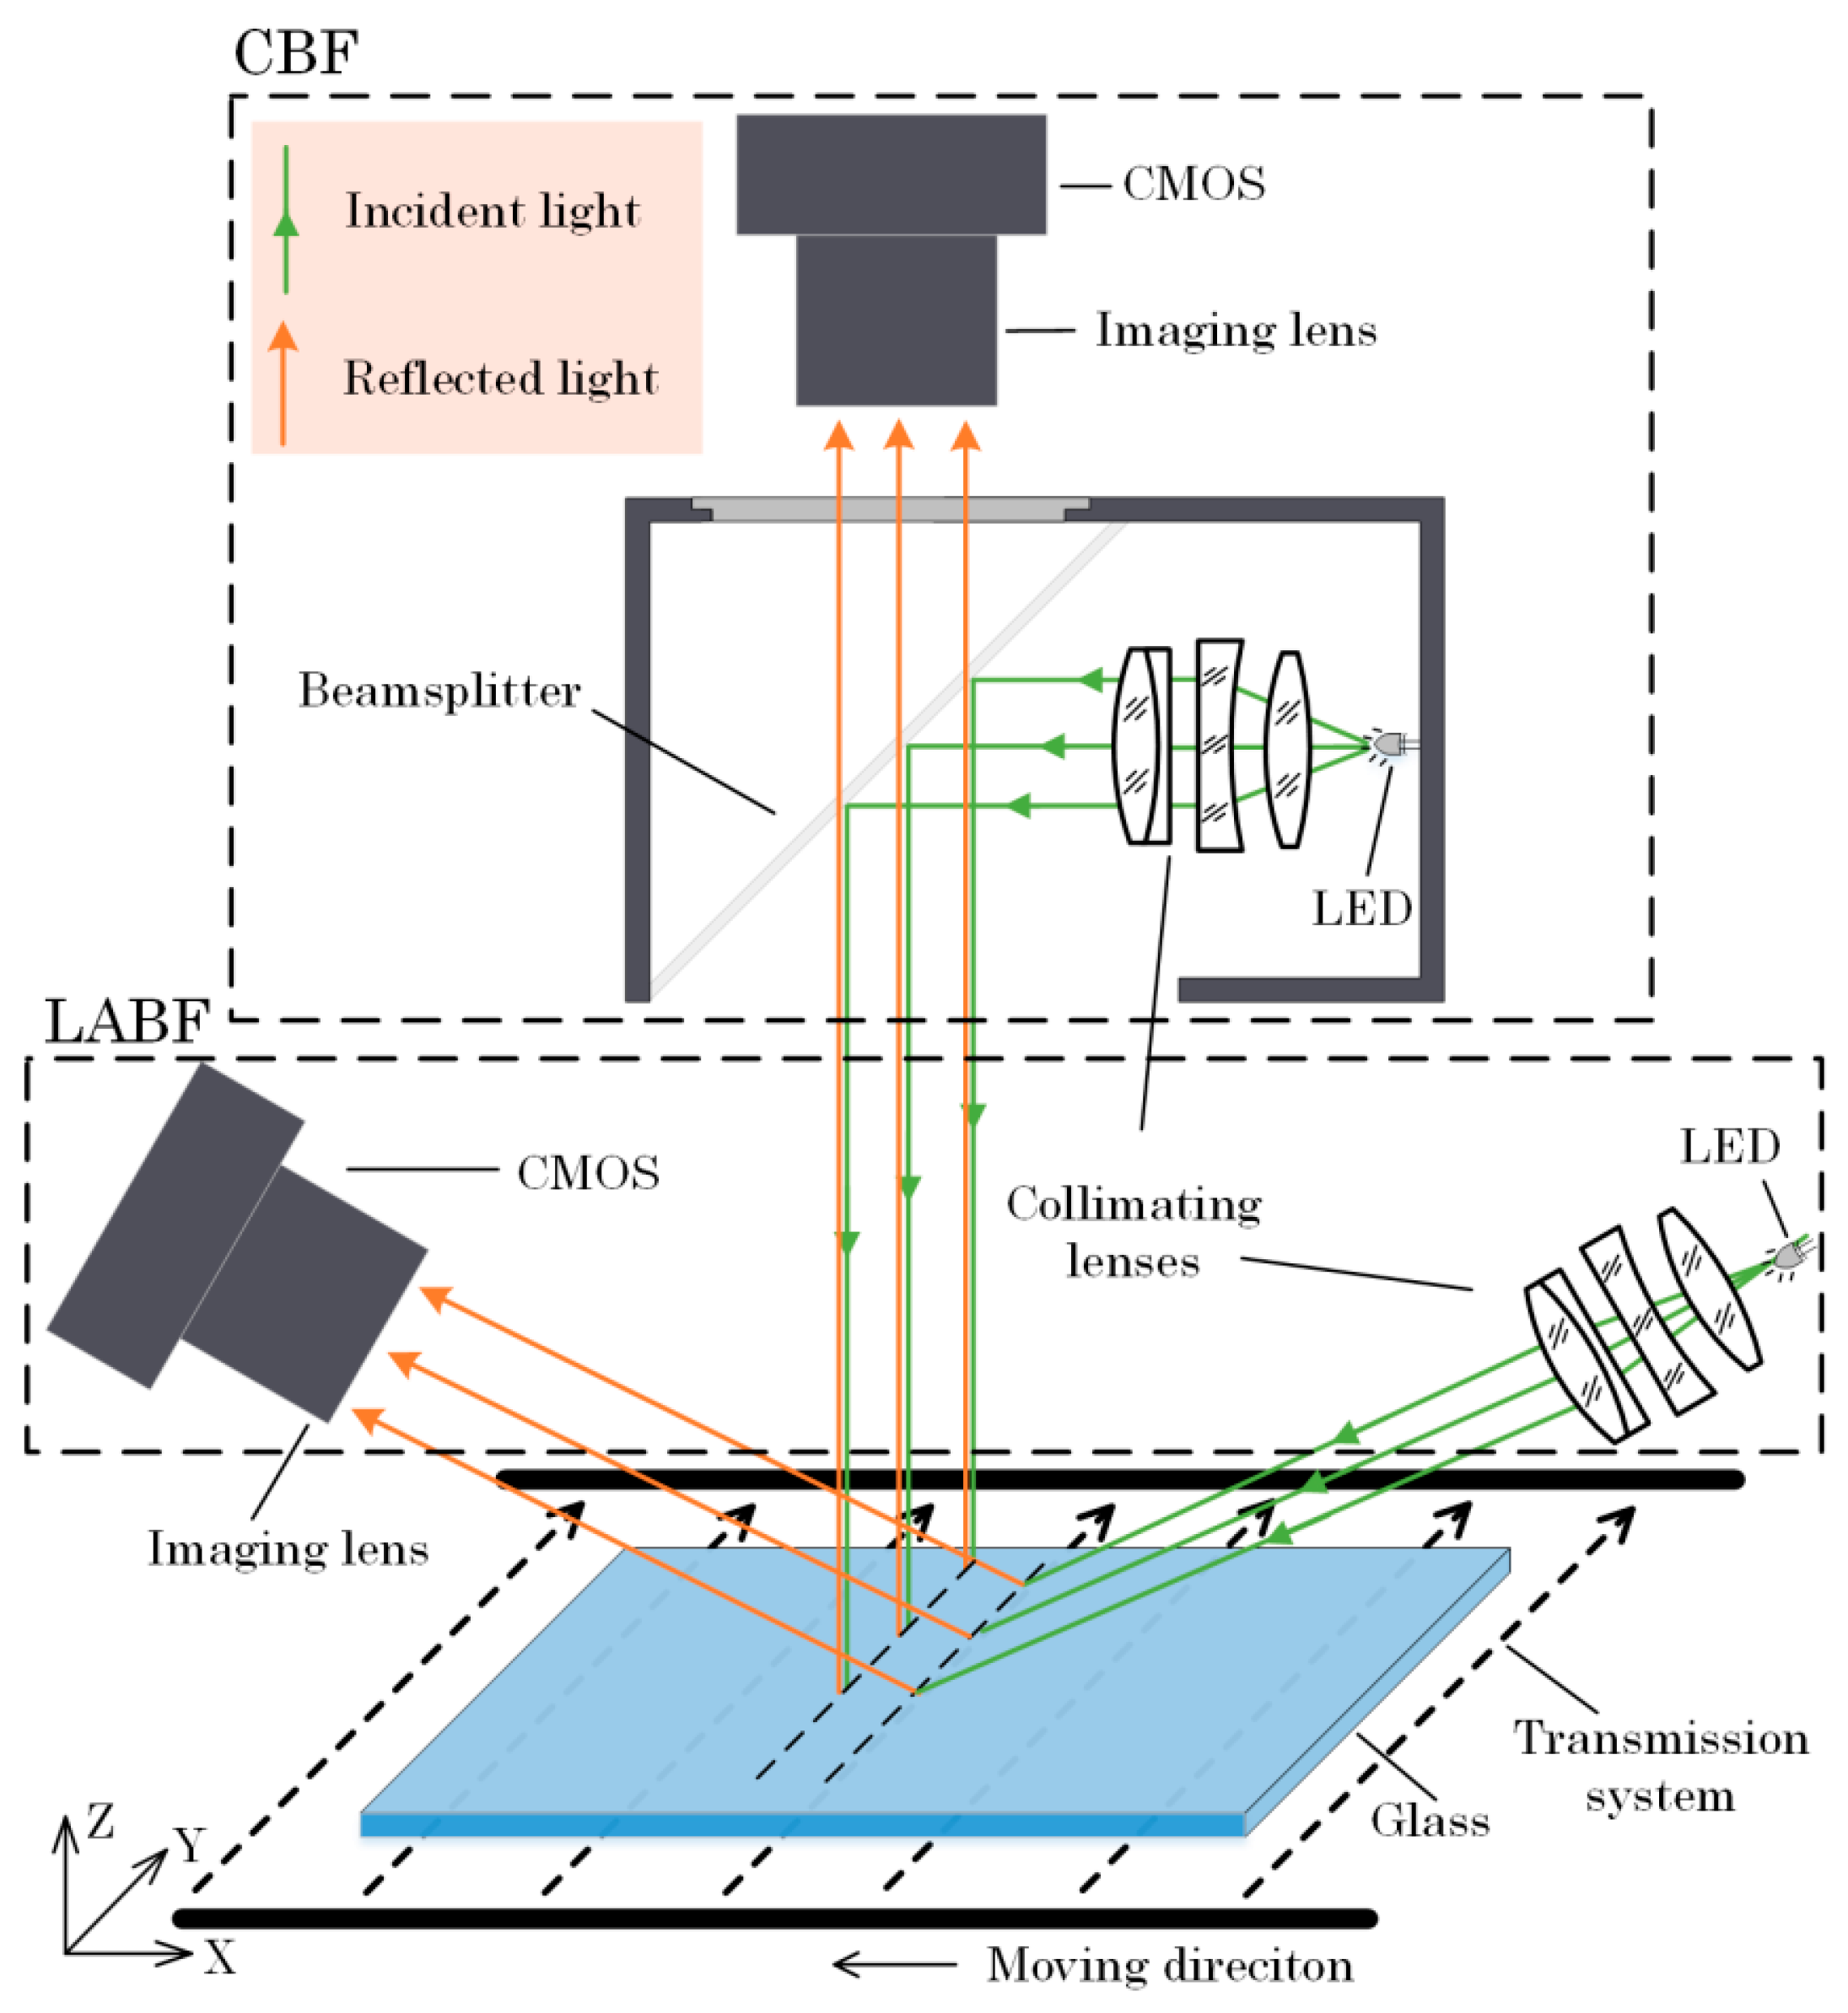
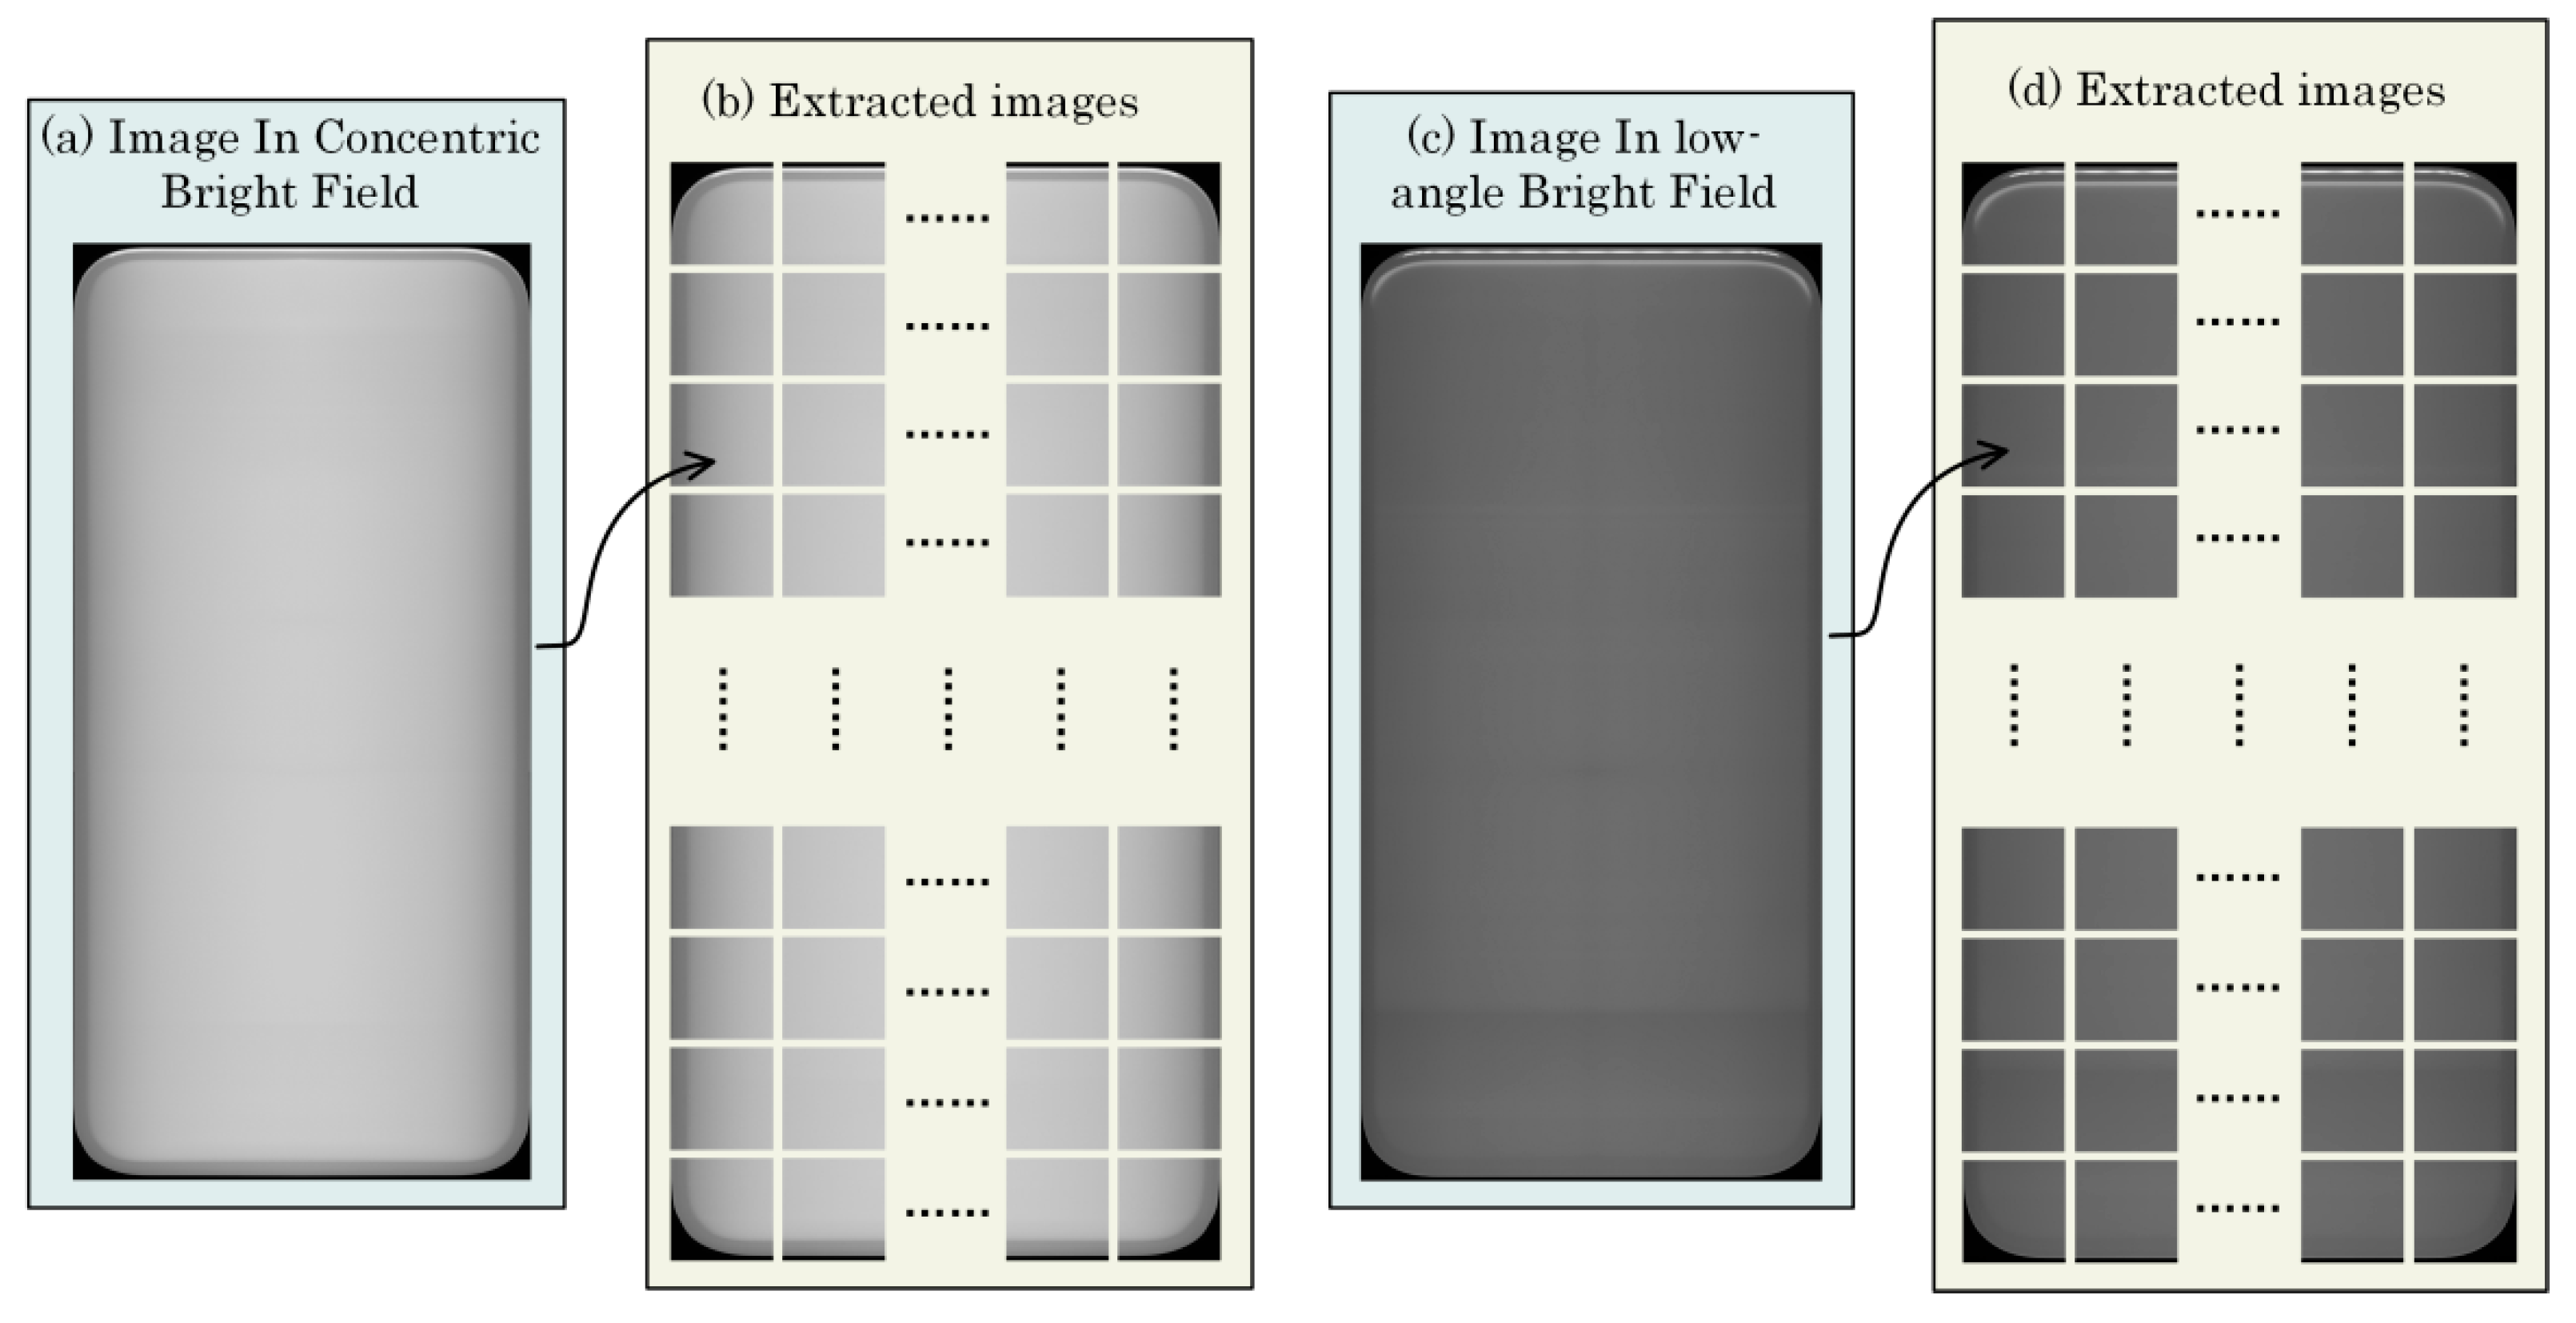
2. Imaging Capture System

The surface quality is determined by the waviness, roughness, and microdefects of the detection object. Since the minimum defect size is 0.005 mm2 and the size of the detection object is bigger than 150*60 mm, it is difficult for the plane array camera to achieve such a high resolution with only a single shot. In order to improve the imaging efficiency, the line-scan cameras were applied for the imaging capture system. In the classical detection system of ordinary transparent glass, the dark-field imaging system was always the first choice [4,6,24,28], as the low-angle light irradiates on the smooth glass plane, and the CMOS camera only accepts the scattered light of defects since the scattered light of the background is always very weak. However, the scattering properties are really different when the surface of the glass is covered with ink, as the scattered light of background becomes stronger, thus bringing more noise disturbance to the image and resulting in a poor imaging performance of shallow scratch and dent defects.
The imaging characteristics of different defects can be very different. In order to obtain a high-quality image for the screen printing mobile phone back cover glass, a coaxial bright-field (CBF) imaging system and low-angle bright-field (LABF) imaging system are applied in this paper; the bright-field type of imaging system captures the reflected light, as shown in Figure 1. The direction of the reflected light is opposite to that of the incident light with the help of the crucial optical element beam-slitter in the CBF system, as shown in Figure 1. A higher contrast image of the shallow scratch defect and discoloration defect can be obtained in CBF while the imaging quality of the dent defect is higher in the LABF system. The low angle means the angle between the direction of incident light and the direction of X axis is small.
Two 8K line-scan CMOS cameras are utilized to capture the images with the unit cell size of the CMOS sensor being 7.04 μm × 7.04 μm. Imaging systems are fixed above the transmission system. To avoid the mutual interference of incident light sources, the focus position of CBF system is at a distance of about 30 mm away from that of the LABF system.
Normal scratch defects can be easily obtained with a high variance value. However, sometimes, there are some scratch defects with a shallow depth below 50 nm. The shallow defect is too weak to be detected in the dark-field imaging system. As shown in Figure 2, the average grayscale value of the images of the CBF system is higher than that of LABF. The region of the shallow scratch defect has a higher variance value in the CBF system, as shown in Figure 2c.
The dent defect is produced by the surface irregular waviness. The region of the dent defect has a much higher variance value in the LABF system, as shown in Figure 3c.
The discoloration defect is produced by non-uniform screen printing. The region of the discoloration defect has a much higher variance value in the CBF system, as shown in Figure 4c.
As shown in Figure 5, the typical defect images and the corresponding ground truth annotations are presented. It can be seen that the surface of MPBG contains various defects with an unevenly distributed background because of the various structures. The contrast of the shallow scratch can be very low, and the size of the dent can be very small while the size of the discoloration can be very large. Some non-defective random speckles can also appear due to fluctuations in the production, as sometimes dust and fibers appear on the surface of MPBG due to the production environment not having enough dust-free protection.

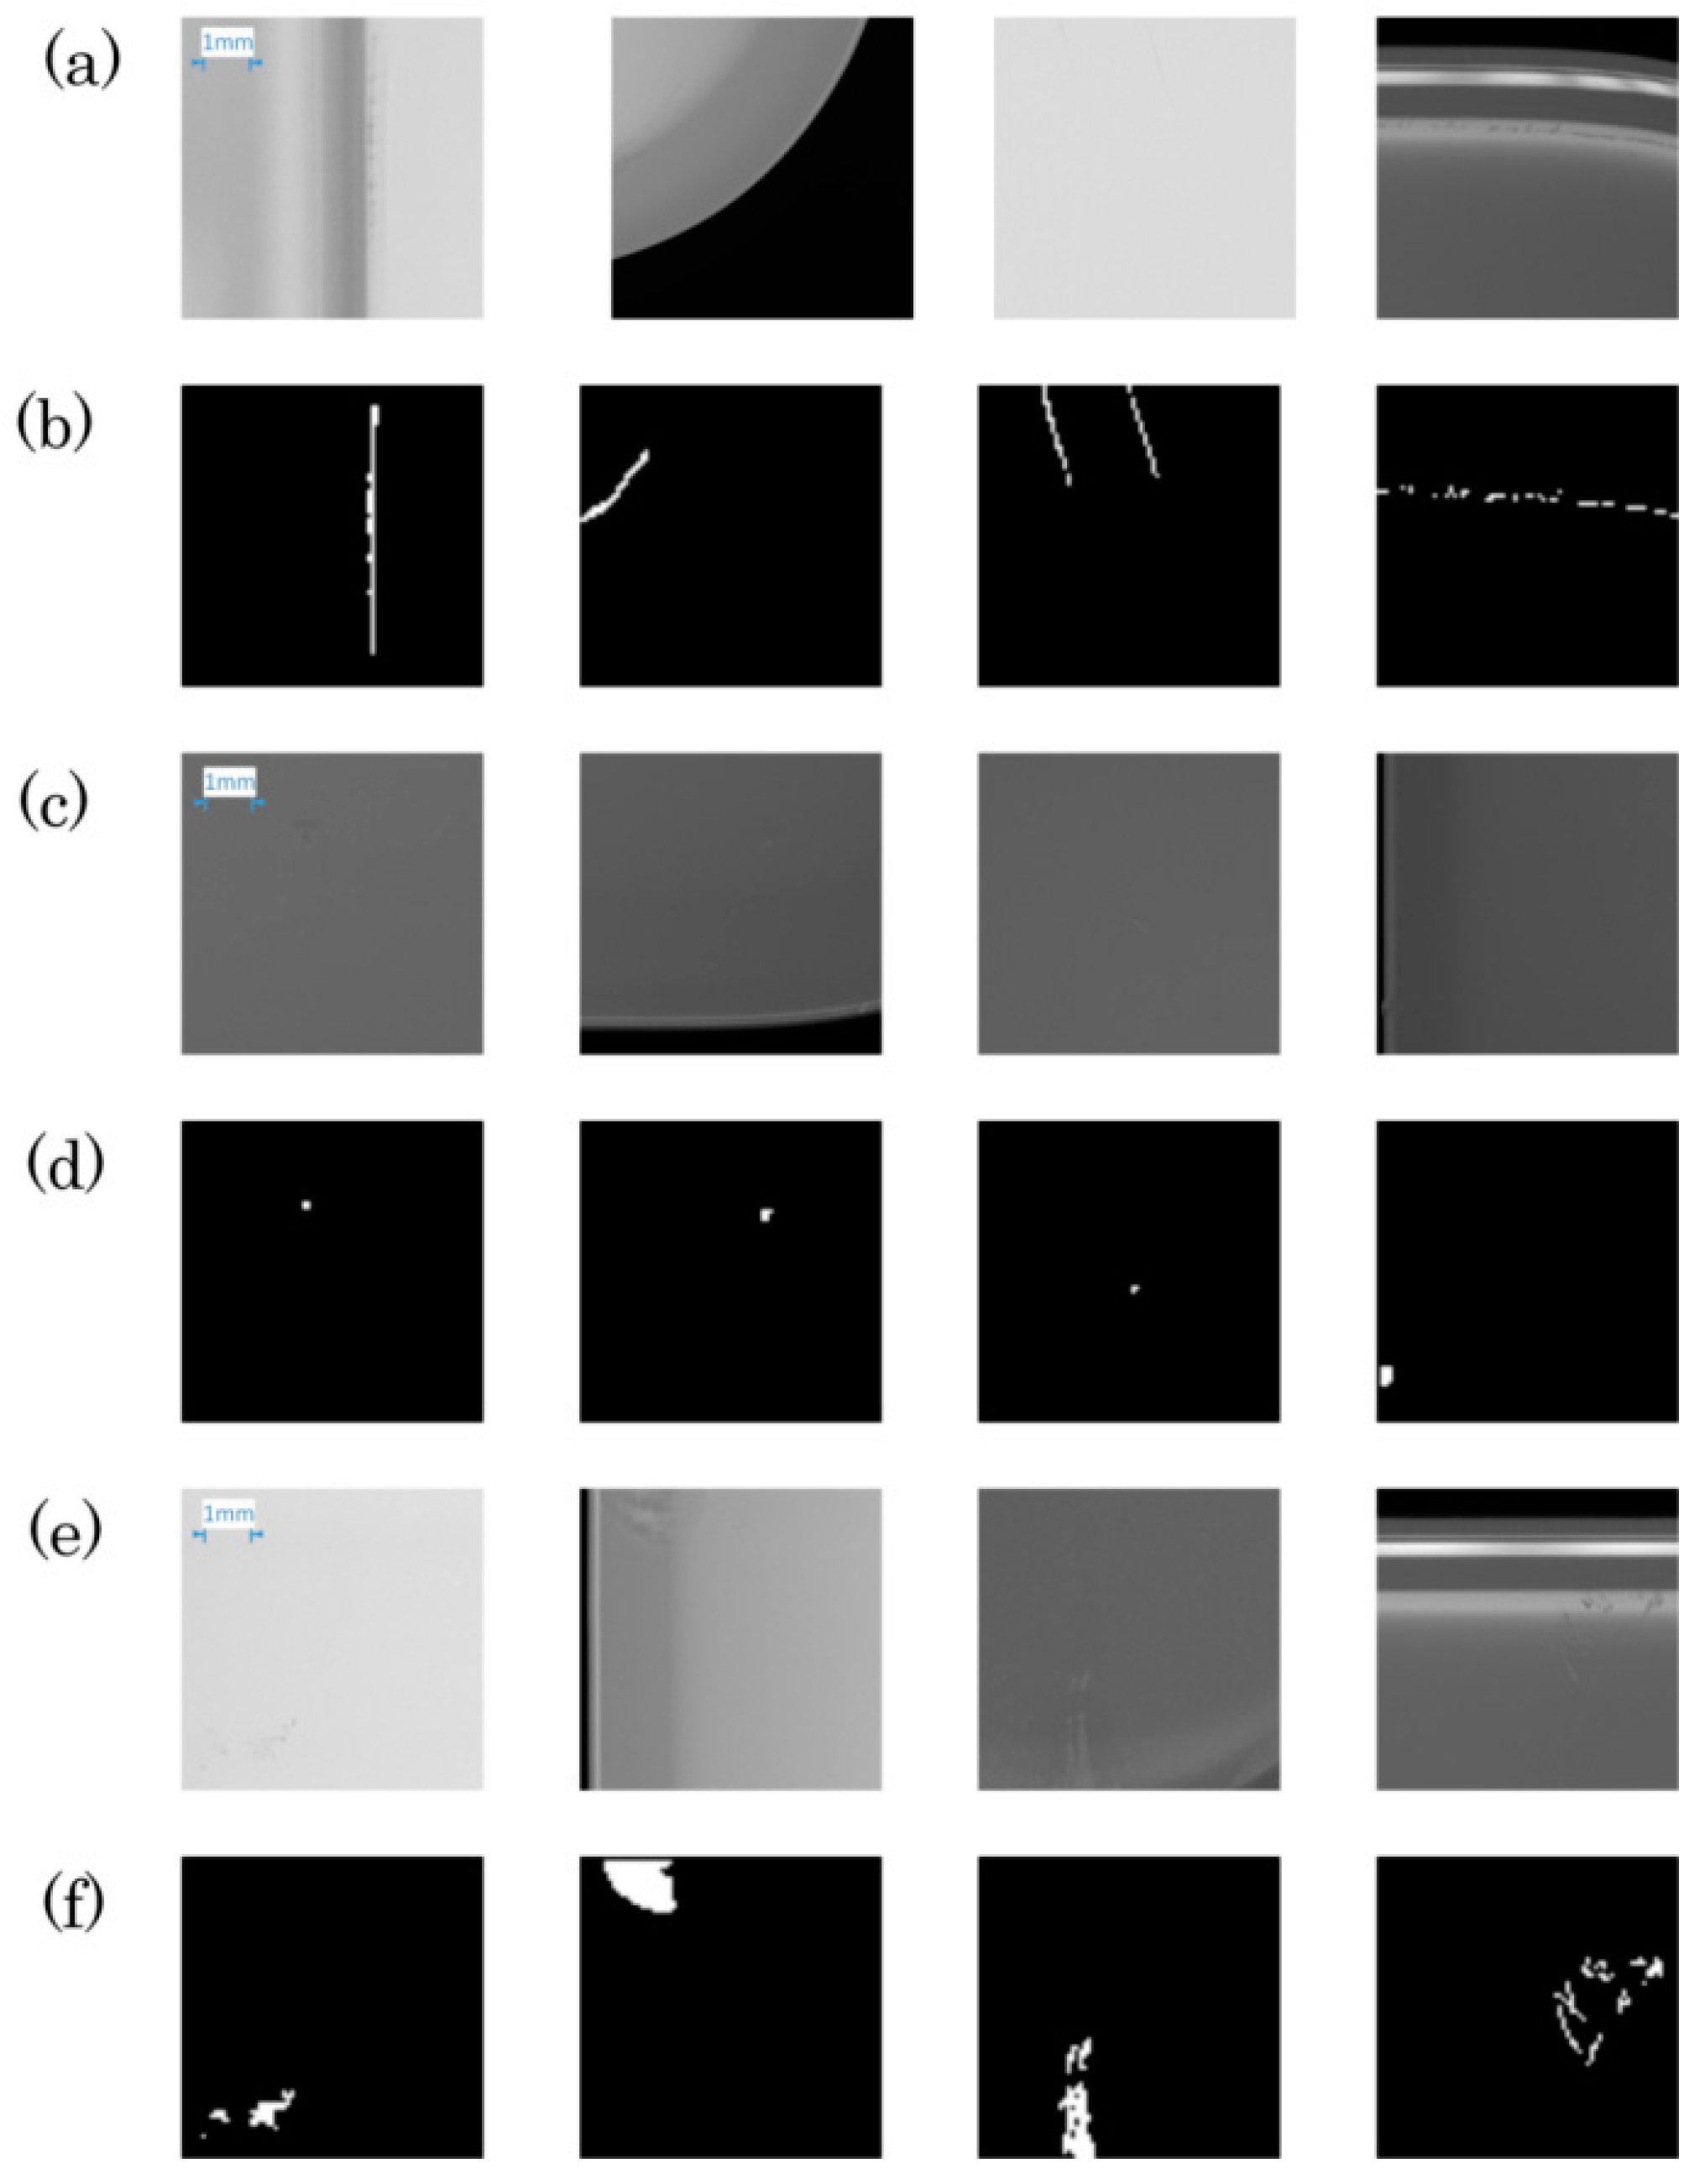
3. Glass Surface Defect Dataset (GSDD)

The image processing is the most important and challenging part of surface defect inspection. The defects are usually darker or brighter than the surrounding background. There can be faker defects like dusts and the image quality can also be affected by non-uniform illumination and a complex texture. The defect detection goal is finding an accurate, efficient, and flexible detection method to meet the production requirements.
Traditional defect detection steps include background correction, contrast enhancement, imaging filtering, morphological operation, segmentation, feature extraction, and classification. All the features and thresholds must be hand-crafted by an experienced engineer. Learning-based classifiers, such as decision tree, SVM, or random forest, are always utilized for defect classification. It is not flexible and versatile enough when the inspection system must be adapted to some different products. The development cycles can also be very long. The classic machine-vision methods are sufficient for some less complicated task, but it is a big challenge for images with an unevenly distributed texture and non-defective random speckles on transition zones, which can essentially increase the misrecognition rate. Deep-learning methods are more powerful than classical defect detection techniques. The image dataset is essentially important for the deep-learning method.
The target of the segmentation task is computing the pixel-wise labels of target images. The original raw image size is 16,000*8092 and the resolution of the image containing glass information is 13,567*6548. It is not practical to directly annotate and train the images with such high resolution. Therefore, 276 images with the size of 600*600 were extracted from the glass image as the training samples, as shown in Figure 6. The neighboring sub-images are cut with a certain overlapping area, and the border region of the original image is extended by mirroring. Sometimes, the size of the defect can be even bigger than that of the overlapping region. When the defects of every sub-image are obtained, the coordinate distribution of the defects on the original image can be easily obtained. The neighboring defects will be merged according to the coordinate distribution, which would reduce the error caused by image cutting. In the practical production, the number of defects in a single raw image is always very small. In order to obtain enough defect images, more than 10,000 glass samples were captured by the CBF system and LABF system. The glass surface defect dataset (GSDD) consists of 34,550 images with 6742 positive samples and 27,808 negative samples, where every positive sample contains at least one defect, and the types of defects mainly consist of a scratch, dent, and discoloration. For every image, a pixel-wise annotation mask is provided by using the LabelMe annotation tool.

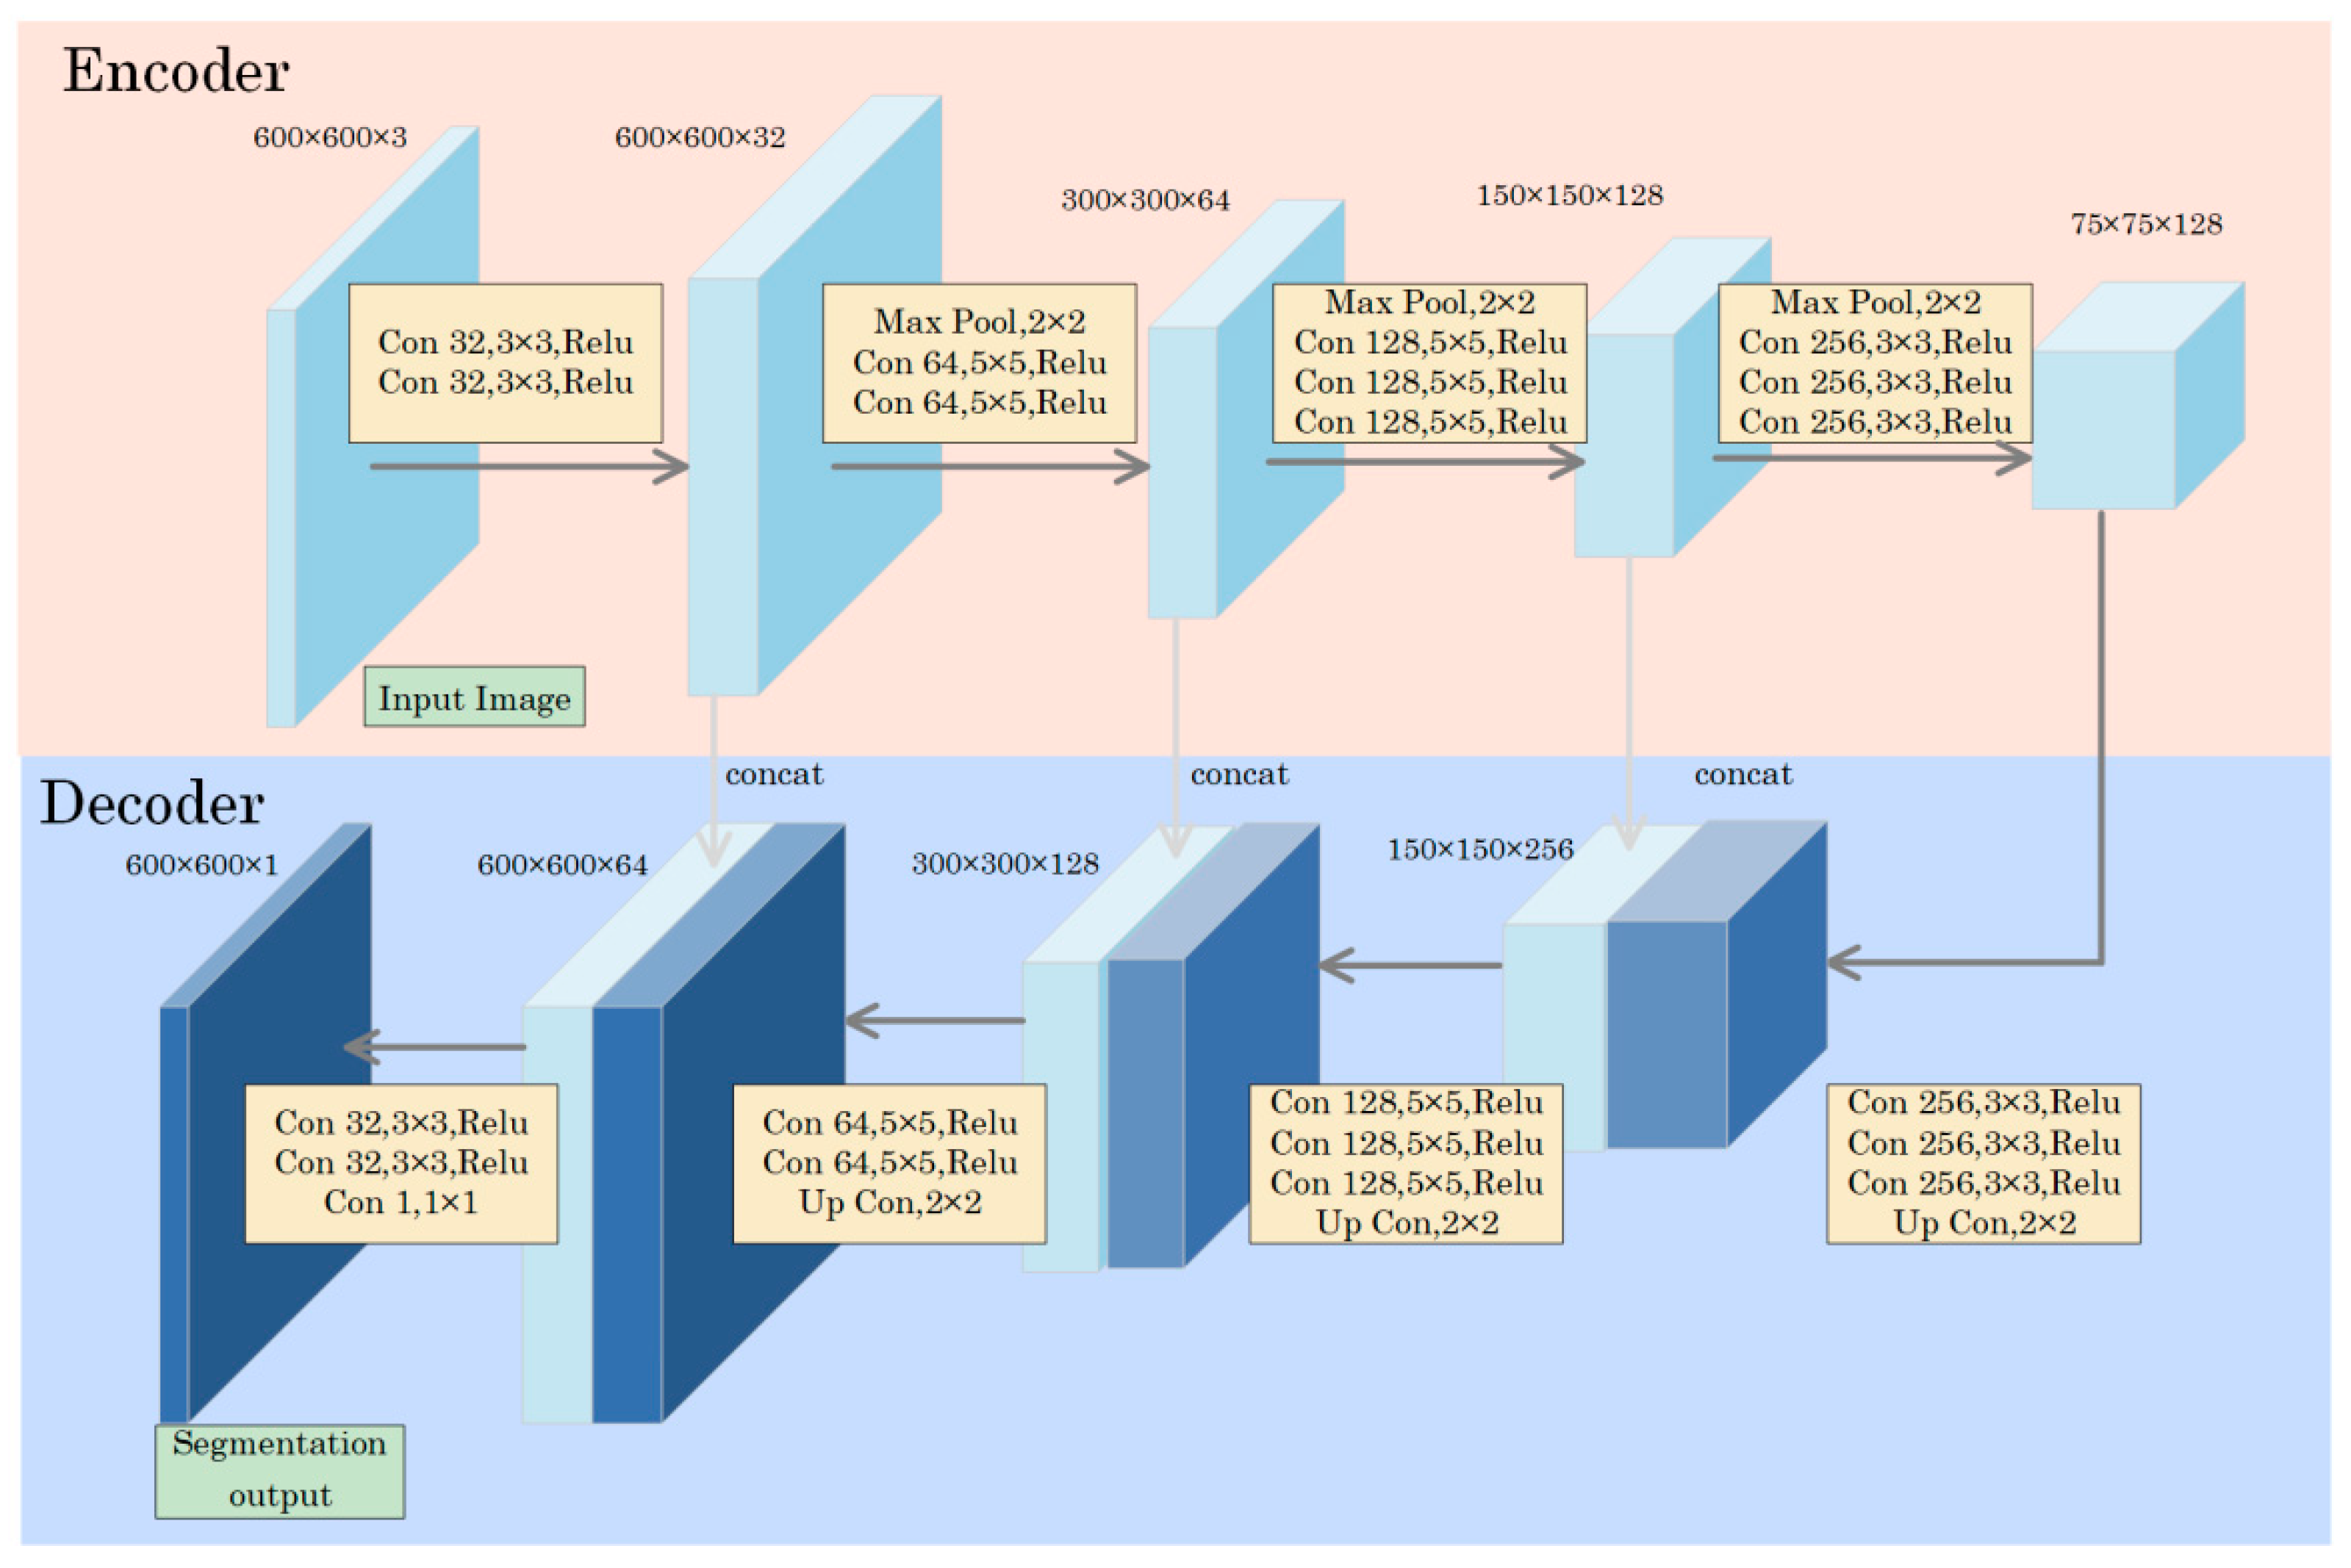
4. Segmentation Model Architecture

The proposed architecture of the segmentation network is presented in Figure 7 composed of an encoder and decoder. It is a modified symmetric network based on U-Net [18]. The size of the feature map is more or less symmetrical in the pipeline of the encoder and decoder. The network consists of both 3 × 3 and 5 × 5 convolutional layers, each followed by a rectified linear unit (ReLu) and batch normalization. The 2 × 2 max-pooling layer is utilized for the downsampling instead of convolutions with a large stride, which ensures detailed information survives the downsampling process.
The goal of the network is balancing the detection for all types of defects. Max-pooling downsampling layers and large kernel sizes would significantly increase the receptive field size. However, the downsampling would result in a loss of accurate spatial information. In order to obtain high resolution features, upsampling of the feature map by a 2 × 2 up-convolution is used, which halves the number of feature channels.
The activation function is sigmoid:
p i j = s i g m o i d ( s i j ) = 1 1 + exp ( s i j ) ,
where sij is the output logical pixel. The cross-entropy loss function is widely used as follows:
l o s s = 1 N × M i = 0 N 1 j = 0 M 1 ( [ y i j × ln p i j + ( 1 y i j ) ln ( 1 p i j ) ] ) ,
where N and N represent the width and height of the input source images, and pij and yij denote the example sigmoid regression prediction of the ground truth example annotation. The network can quickly obtain good performance in the relatively uniform regions; however, the segmentation result in the non-uniform edge regions is not so good. Therefore, the weight map based on local variance information is introduced. The region with a more complex texture would have a higher weight value. The local variance Vij of pixel (i,j) on patch P is given by:
V i j = 1 N P x P ( x x P ¯ ) 2 ,
where region P is centered on (i,j), x donates the pixel grayscale on P, x P ¯ is the mean grayscale of patch P, and Np is the pixel number in P. The weight map is introduced by:
W i j = V i j + b i = 0 N 1 j = 0 M 1 ( V i j + b ) ,
where b is the bias to balance the variance value. Therefore, the loss function would be the following formula:
l o s s = i = 0 N 1 j = 0 M 1 ( [ y i j × ln p i j + ( 1 y i j ) ln ( 1 p i j ) ] ) × W i j .

5. Experiments

5.1. Training Setups

The input images and the corresponding ground truth segmentation map were used to train the network with the stochastic gradient descent implementation of tensorflow. The initial learning rate was 0.03, learning rate decay was 0.95 per epoch, momentum was 0.9, and the size of input image was 600 × 600. Two RTX2080Ti GPUs were used for the asynchronous and each GPU had a batch size 4. The computer was equipped with 64 GB of RAM, and an Intel I9-9900X and tensorflow1.4 framework in an Ubuntu18.04 operating system.

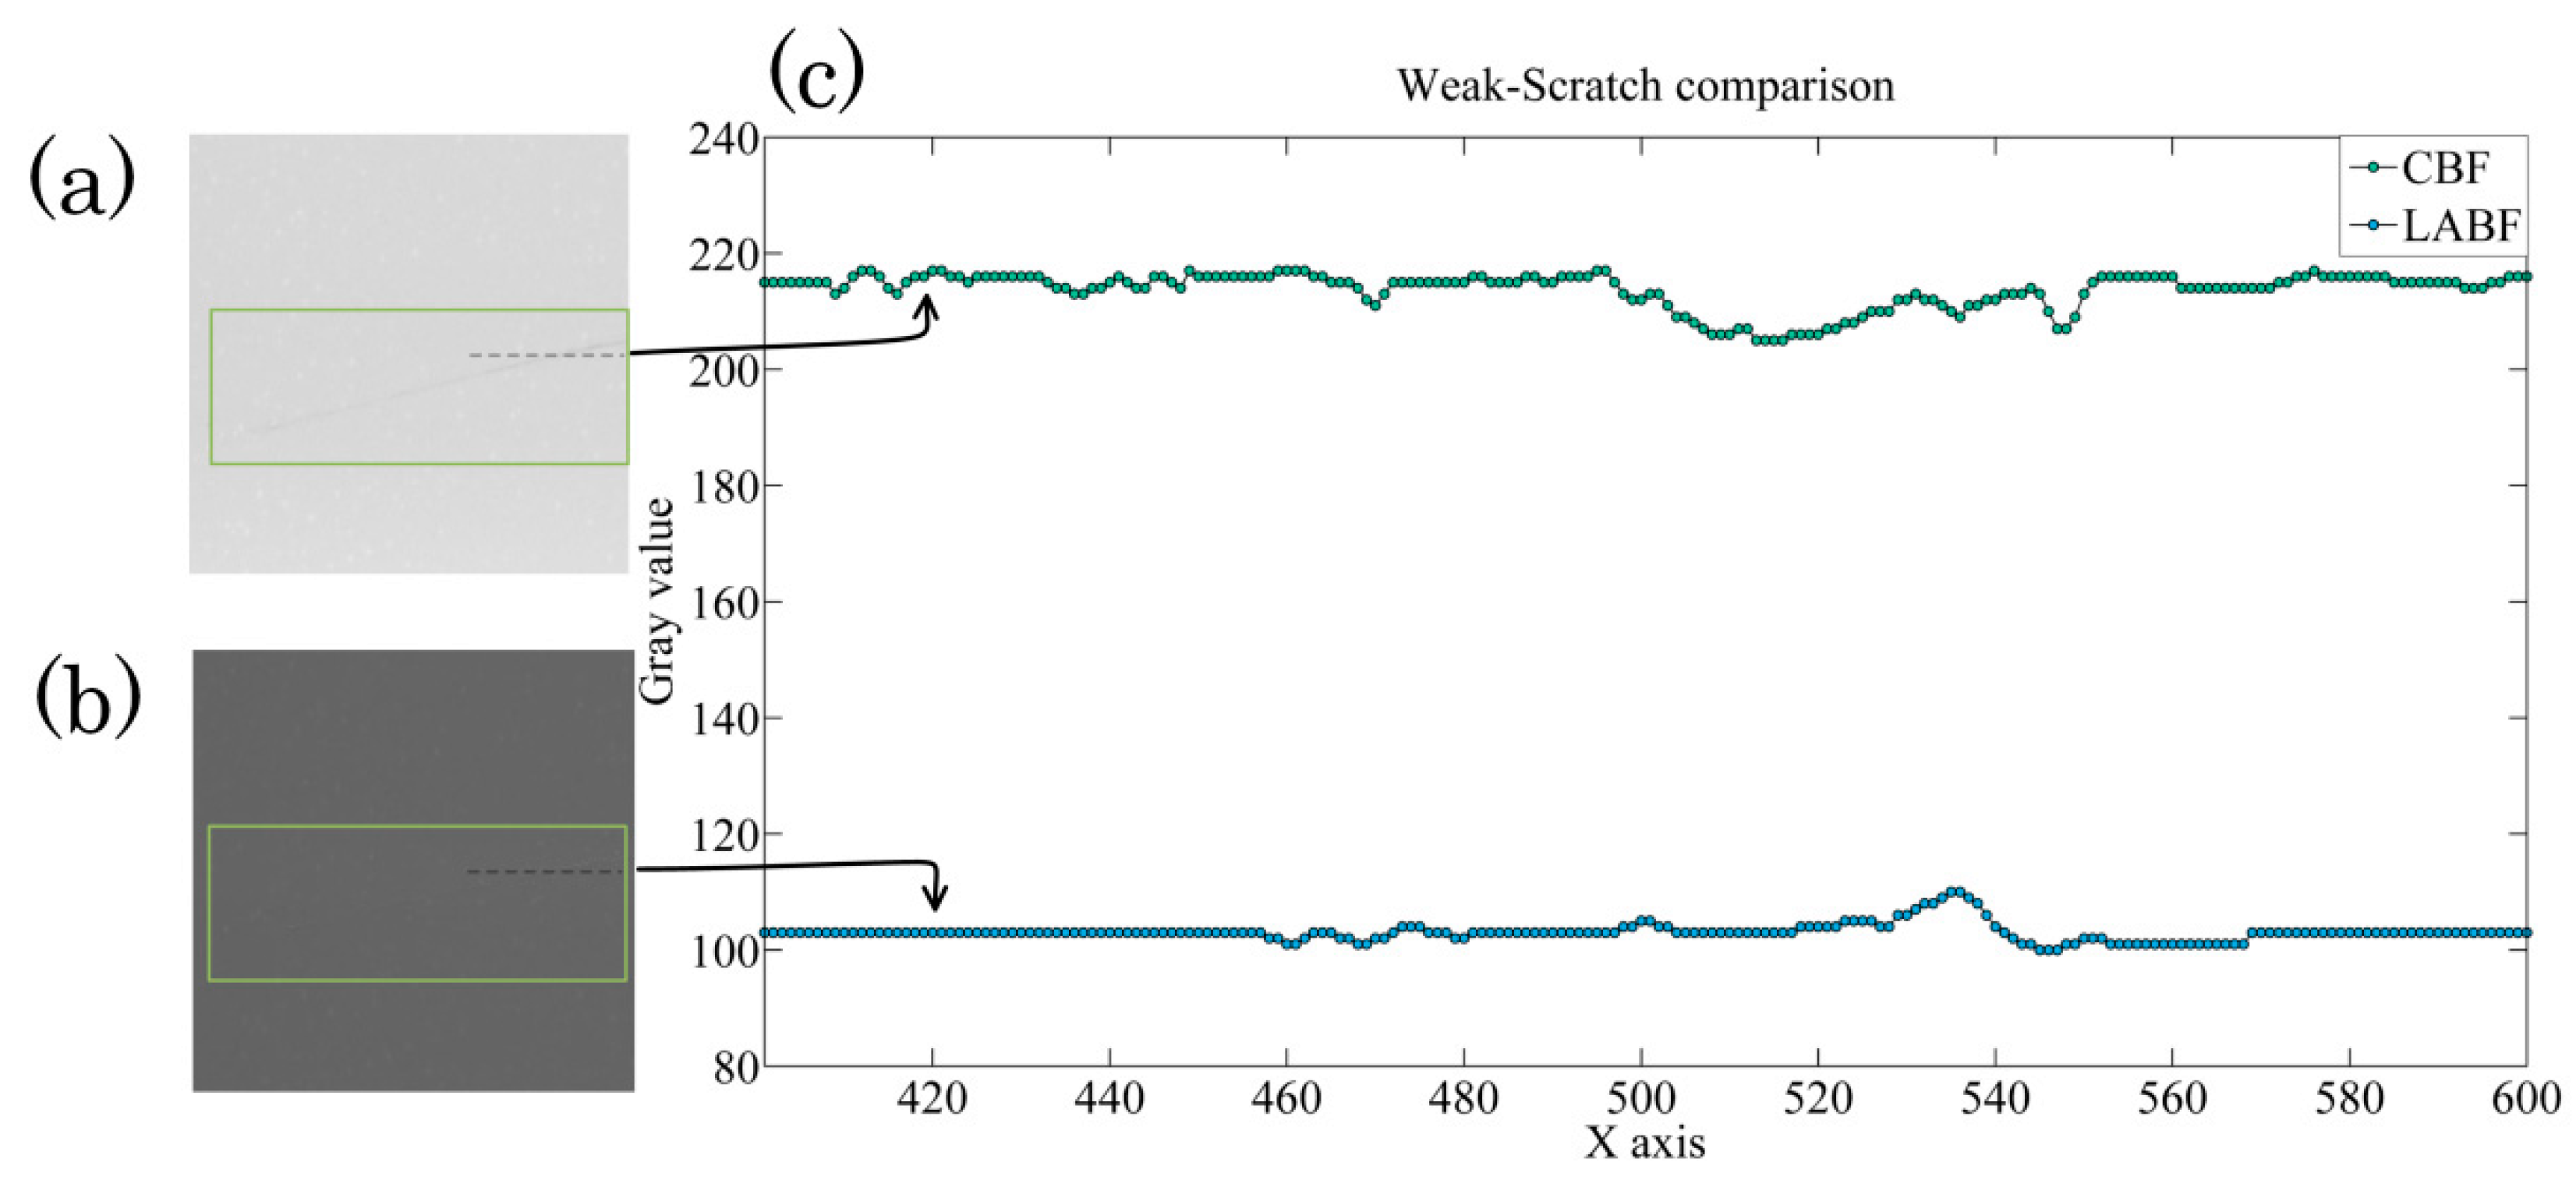
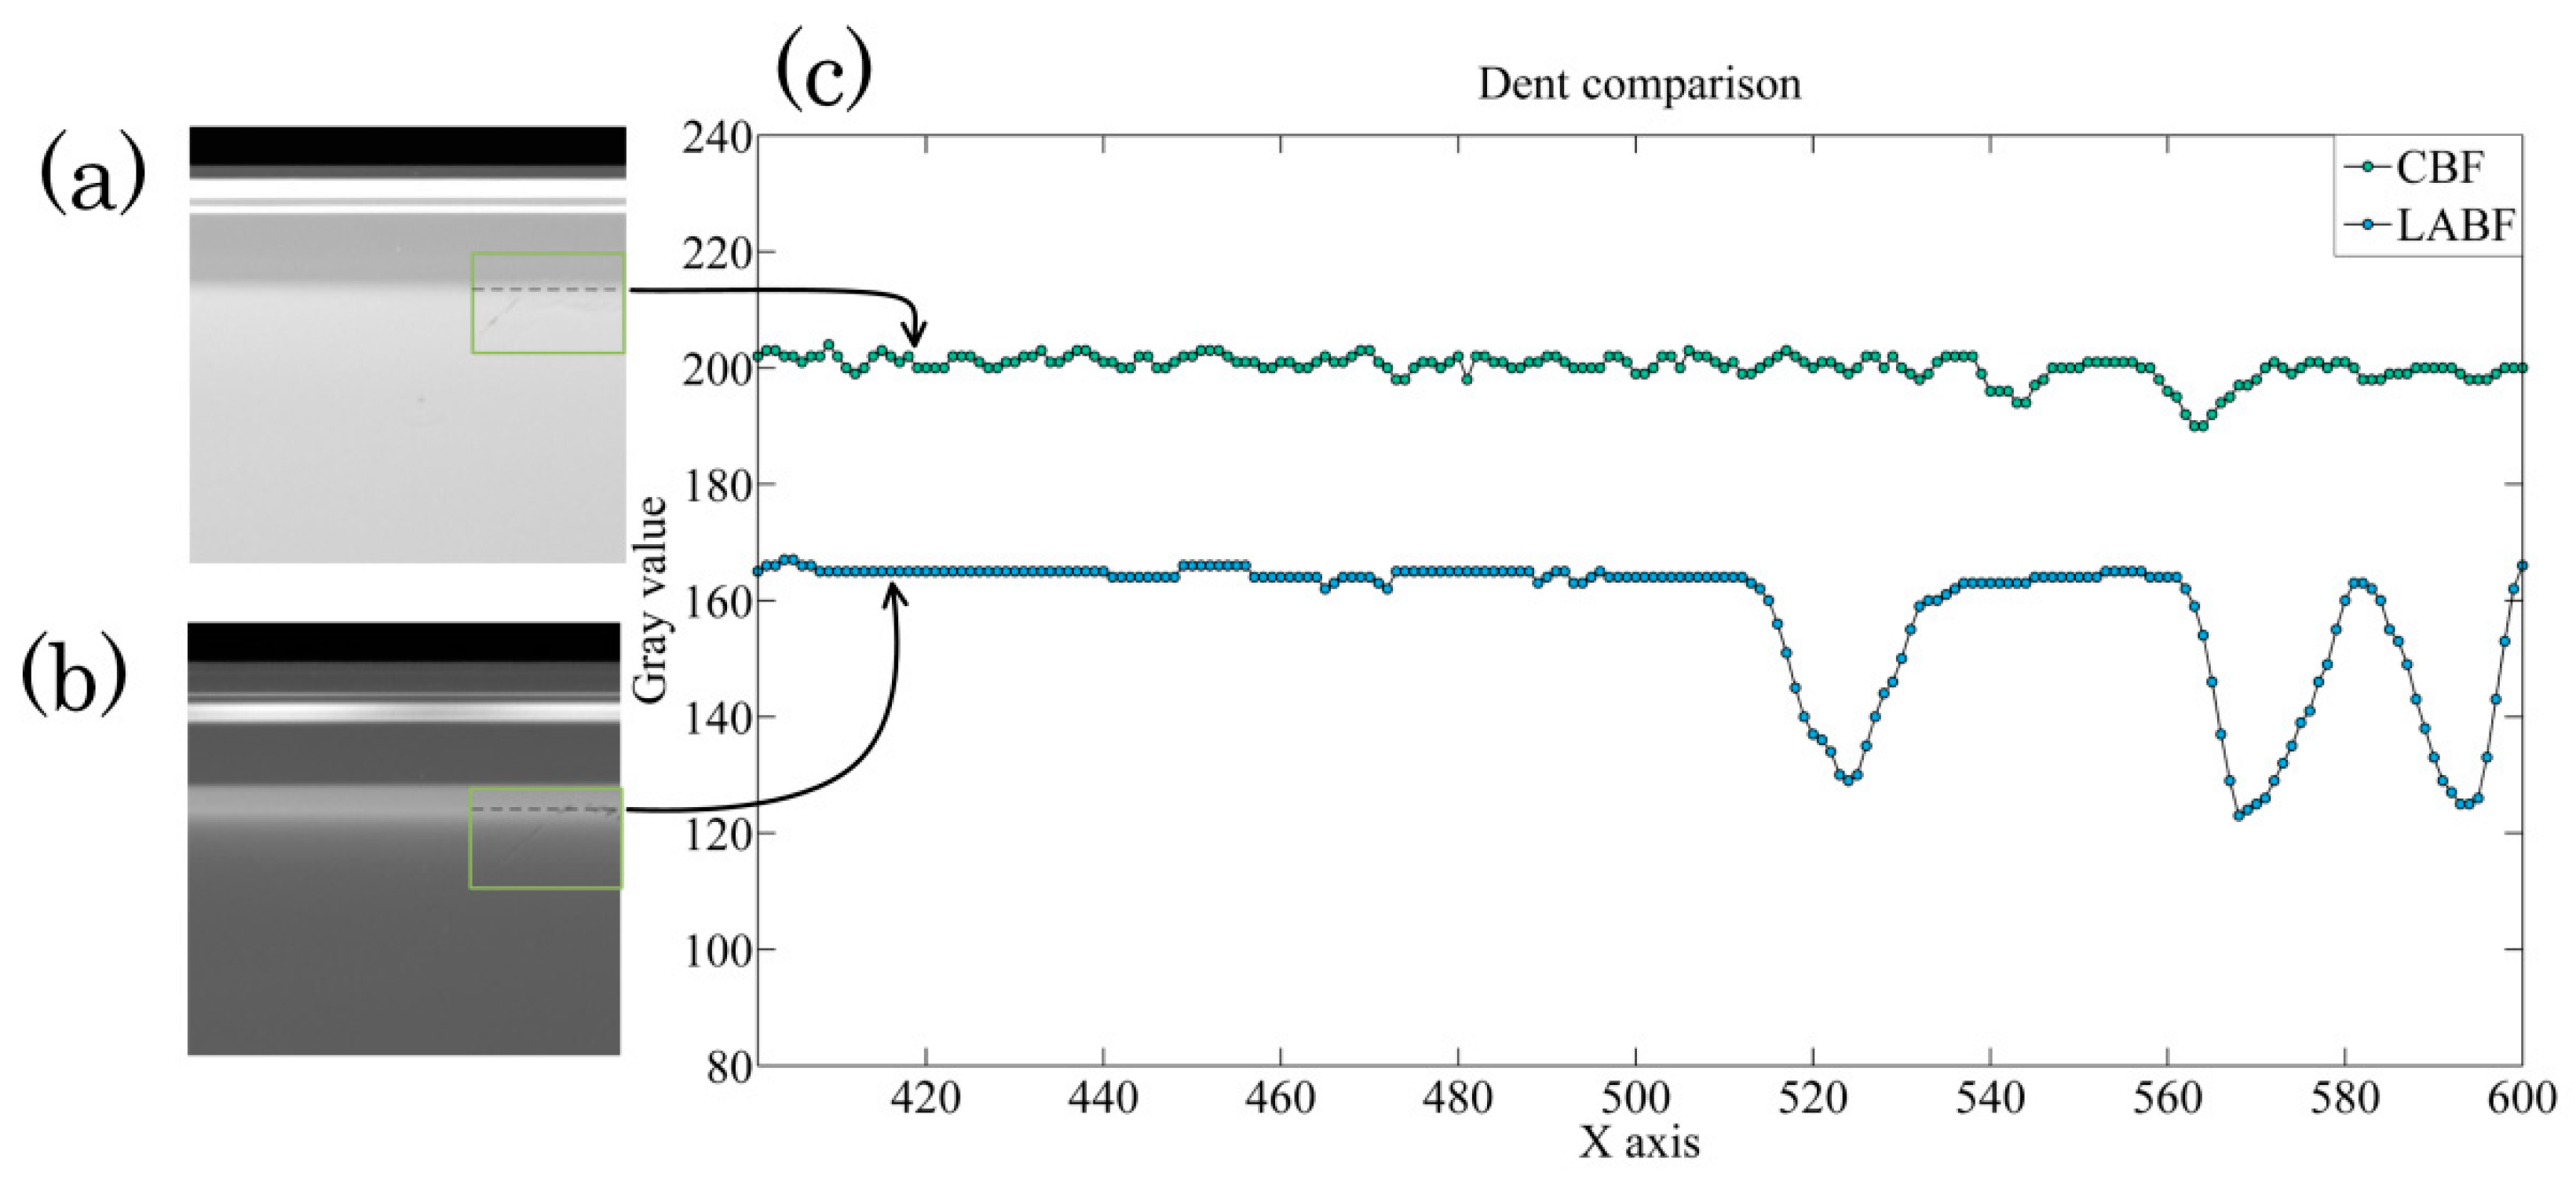
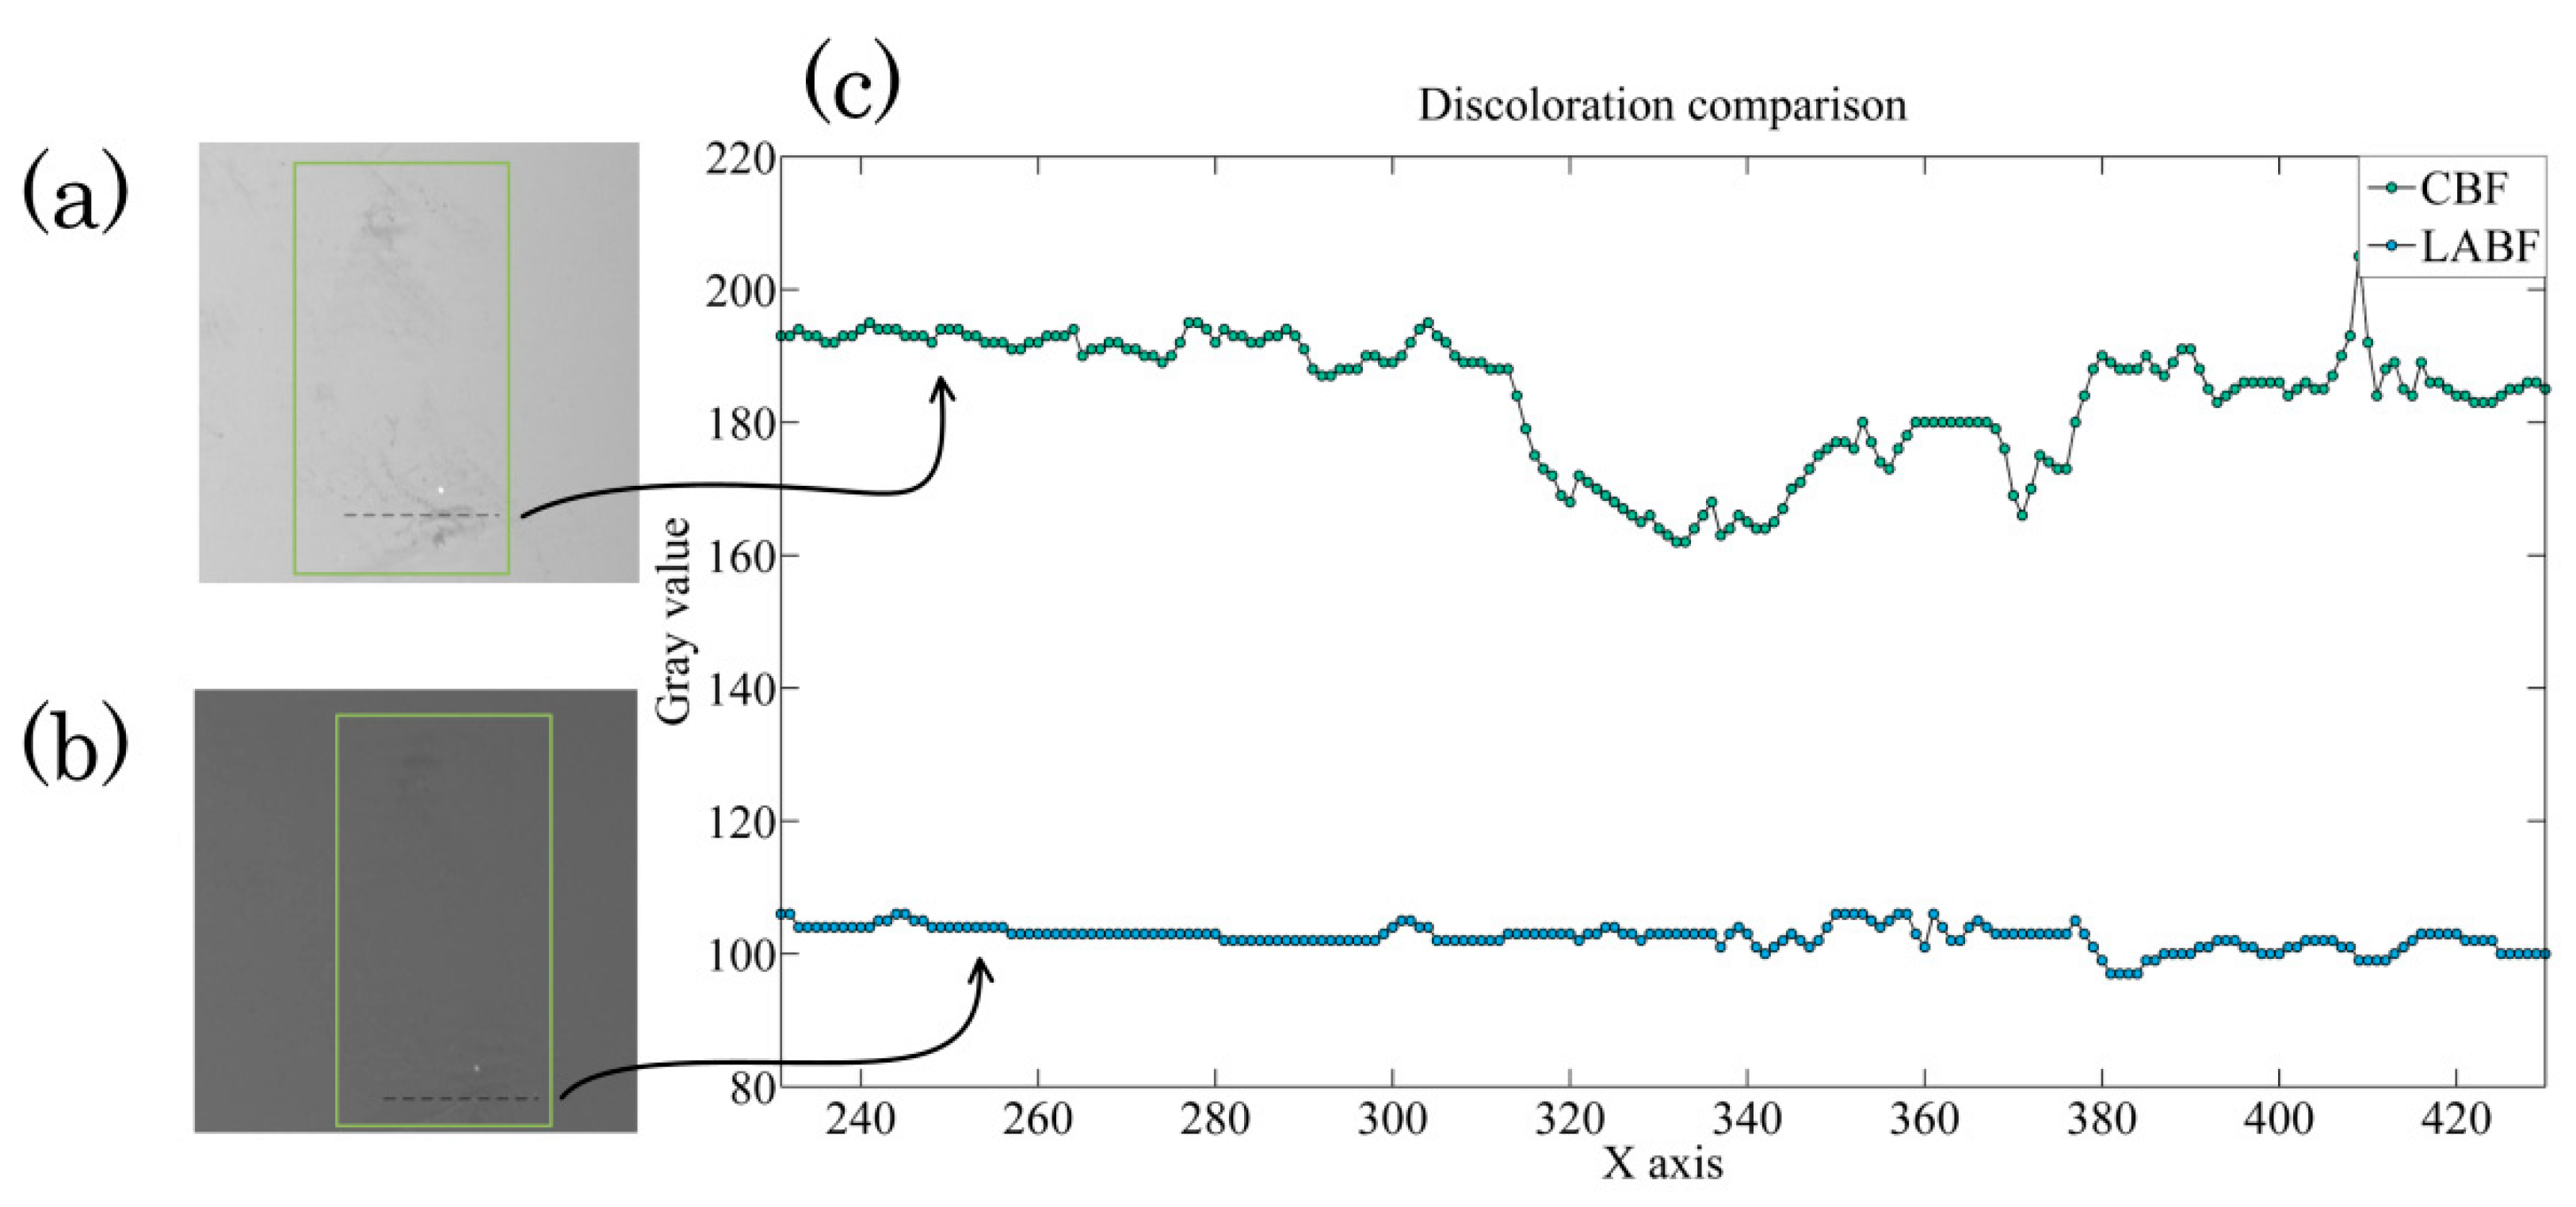
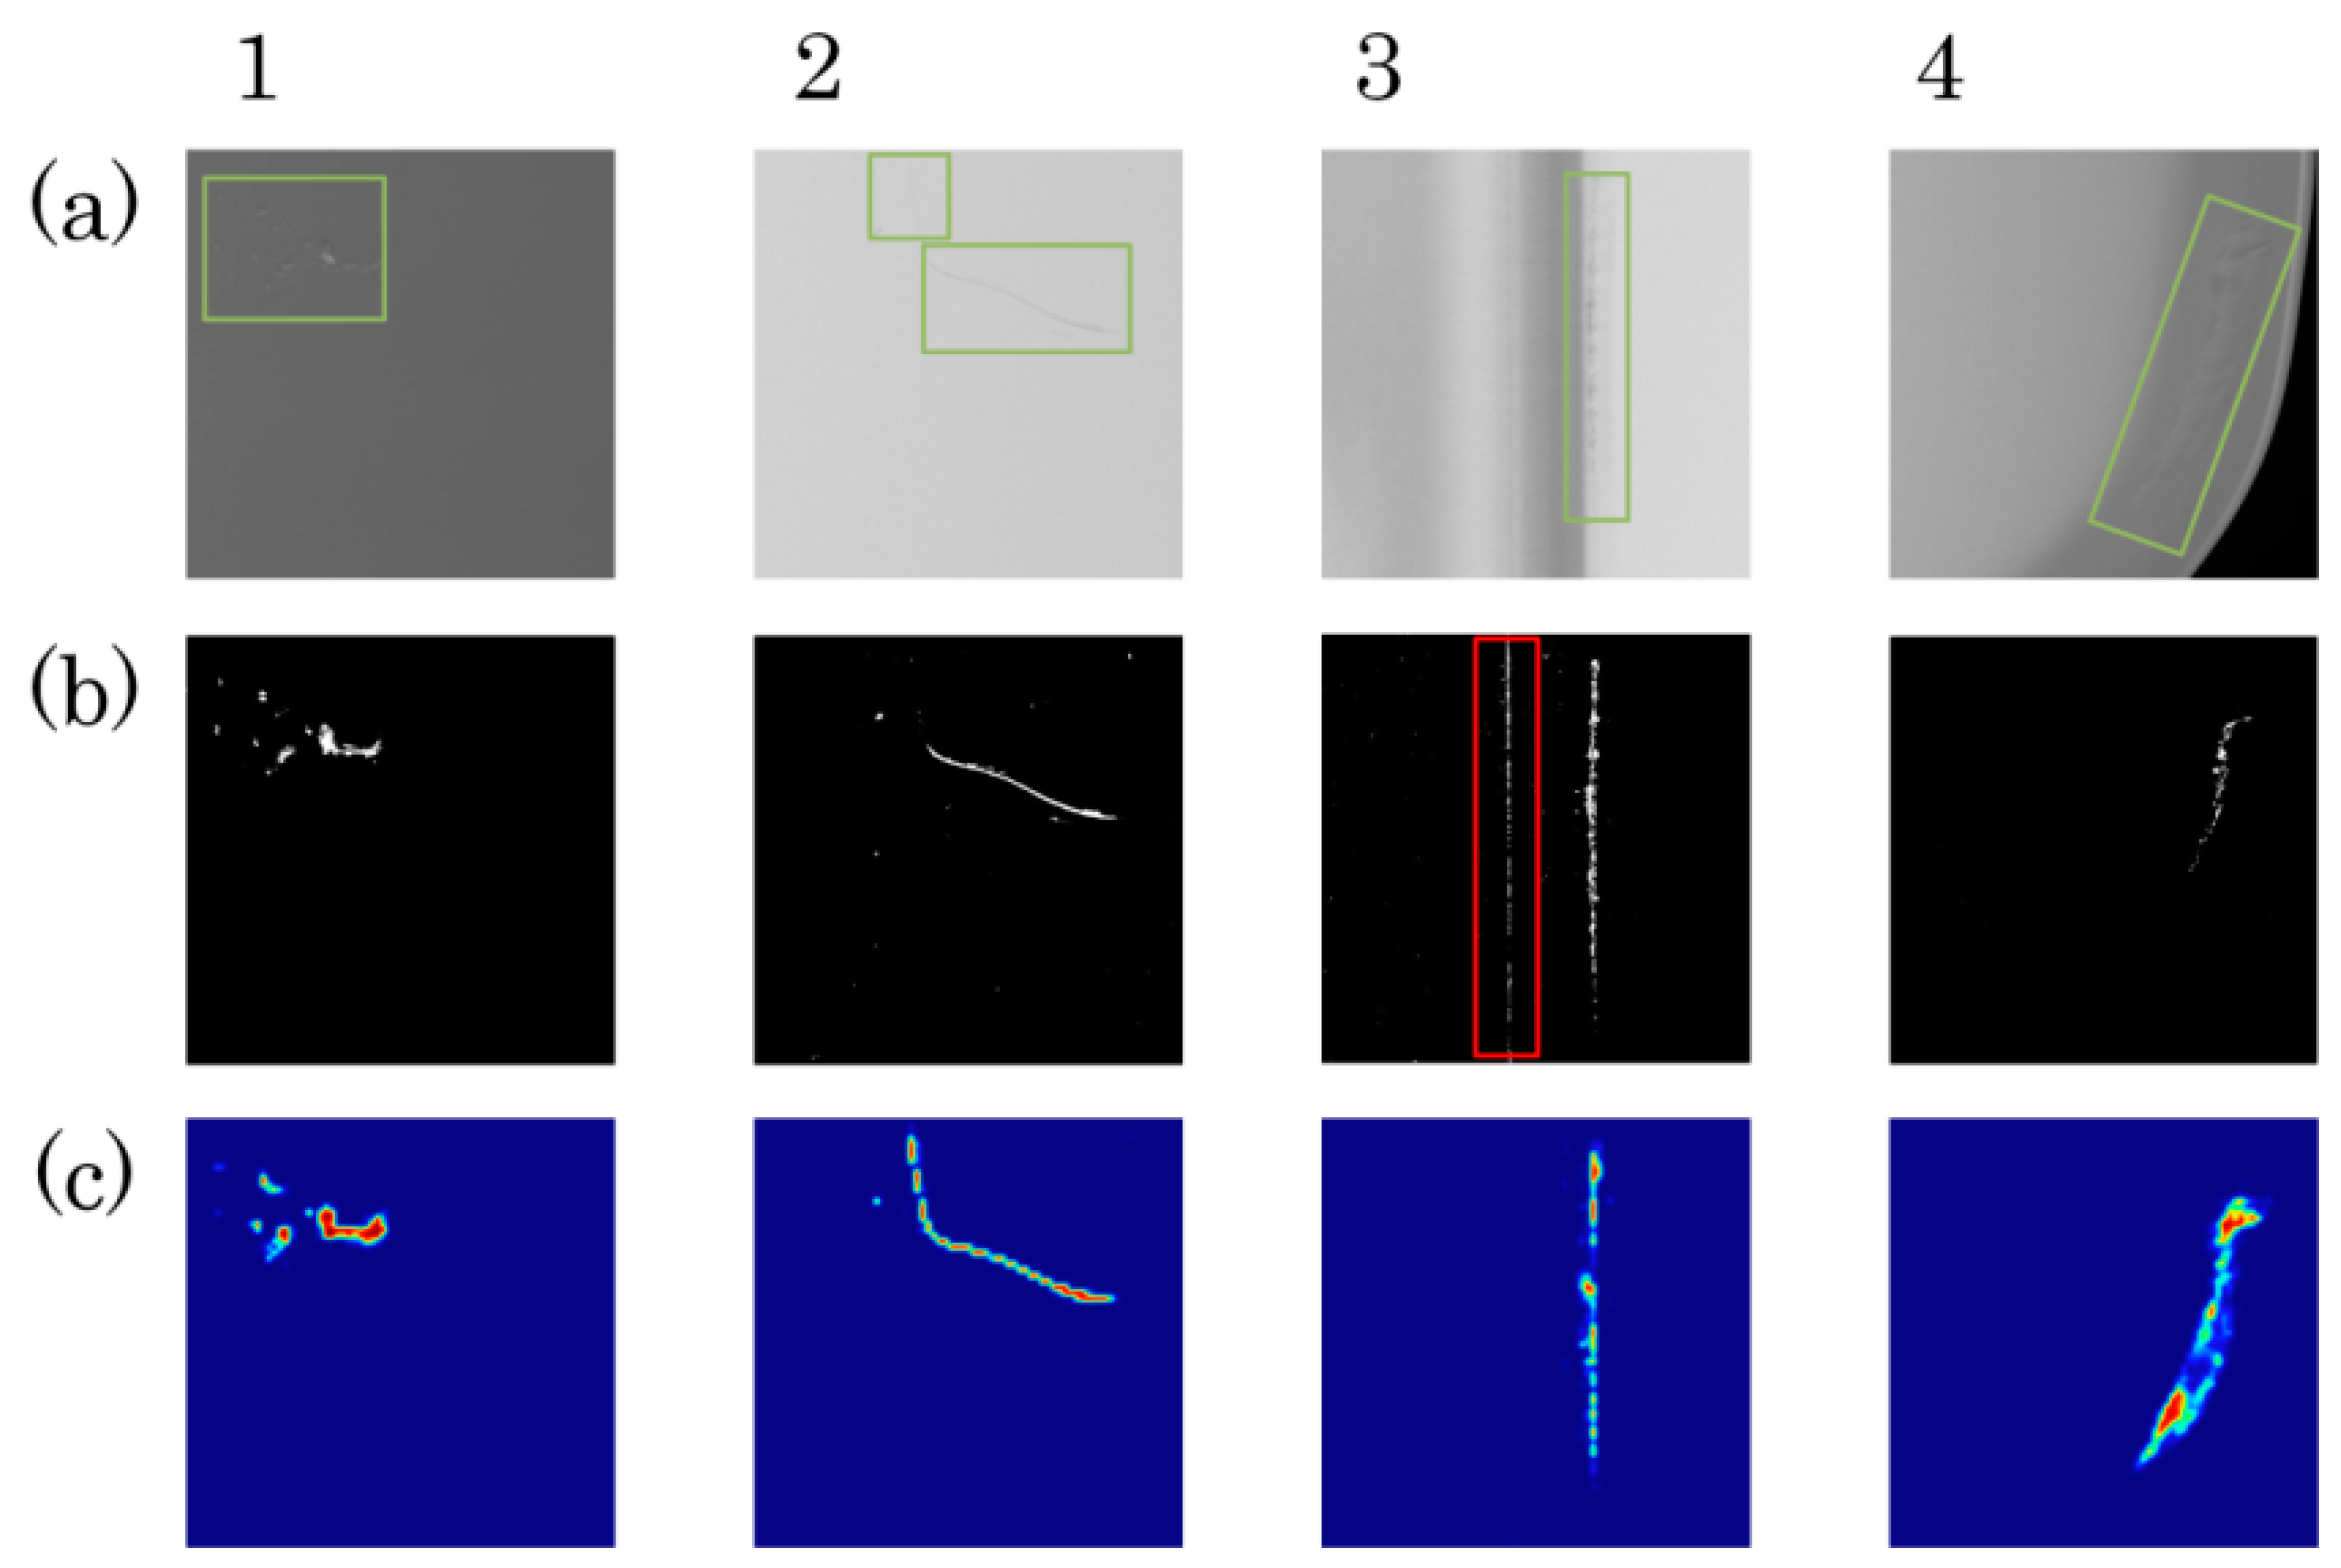
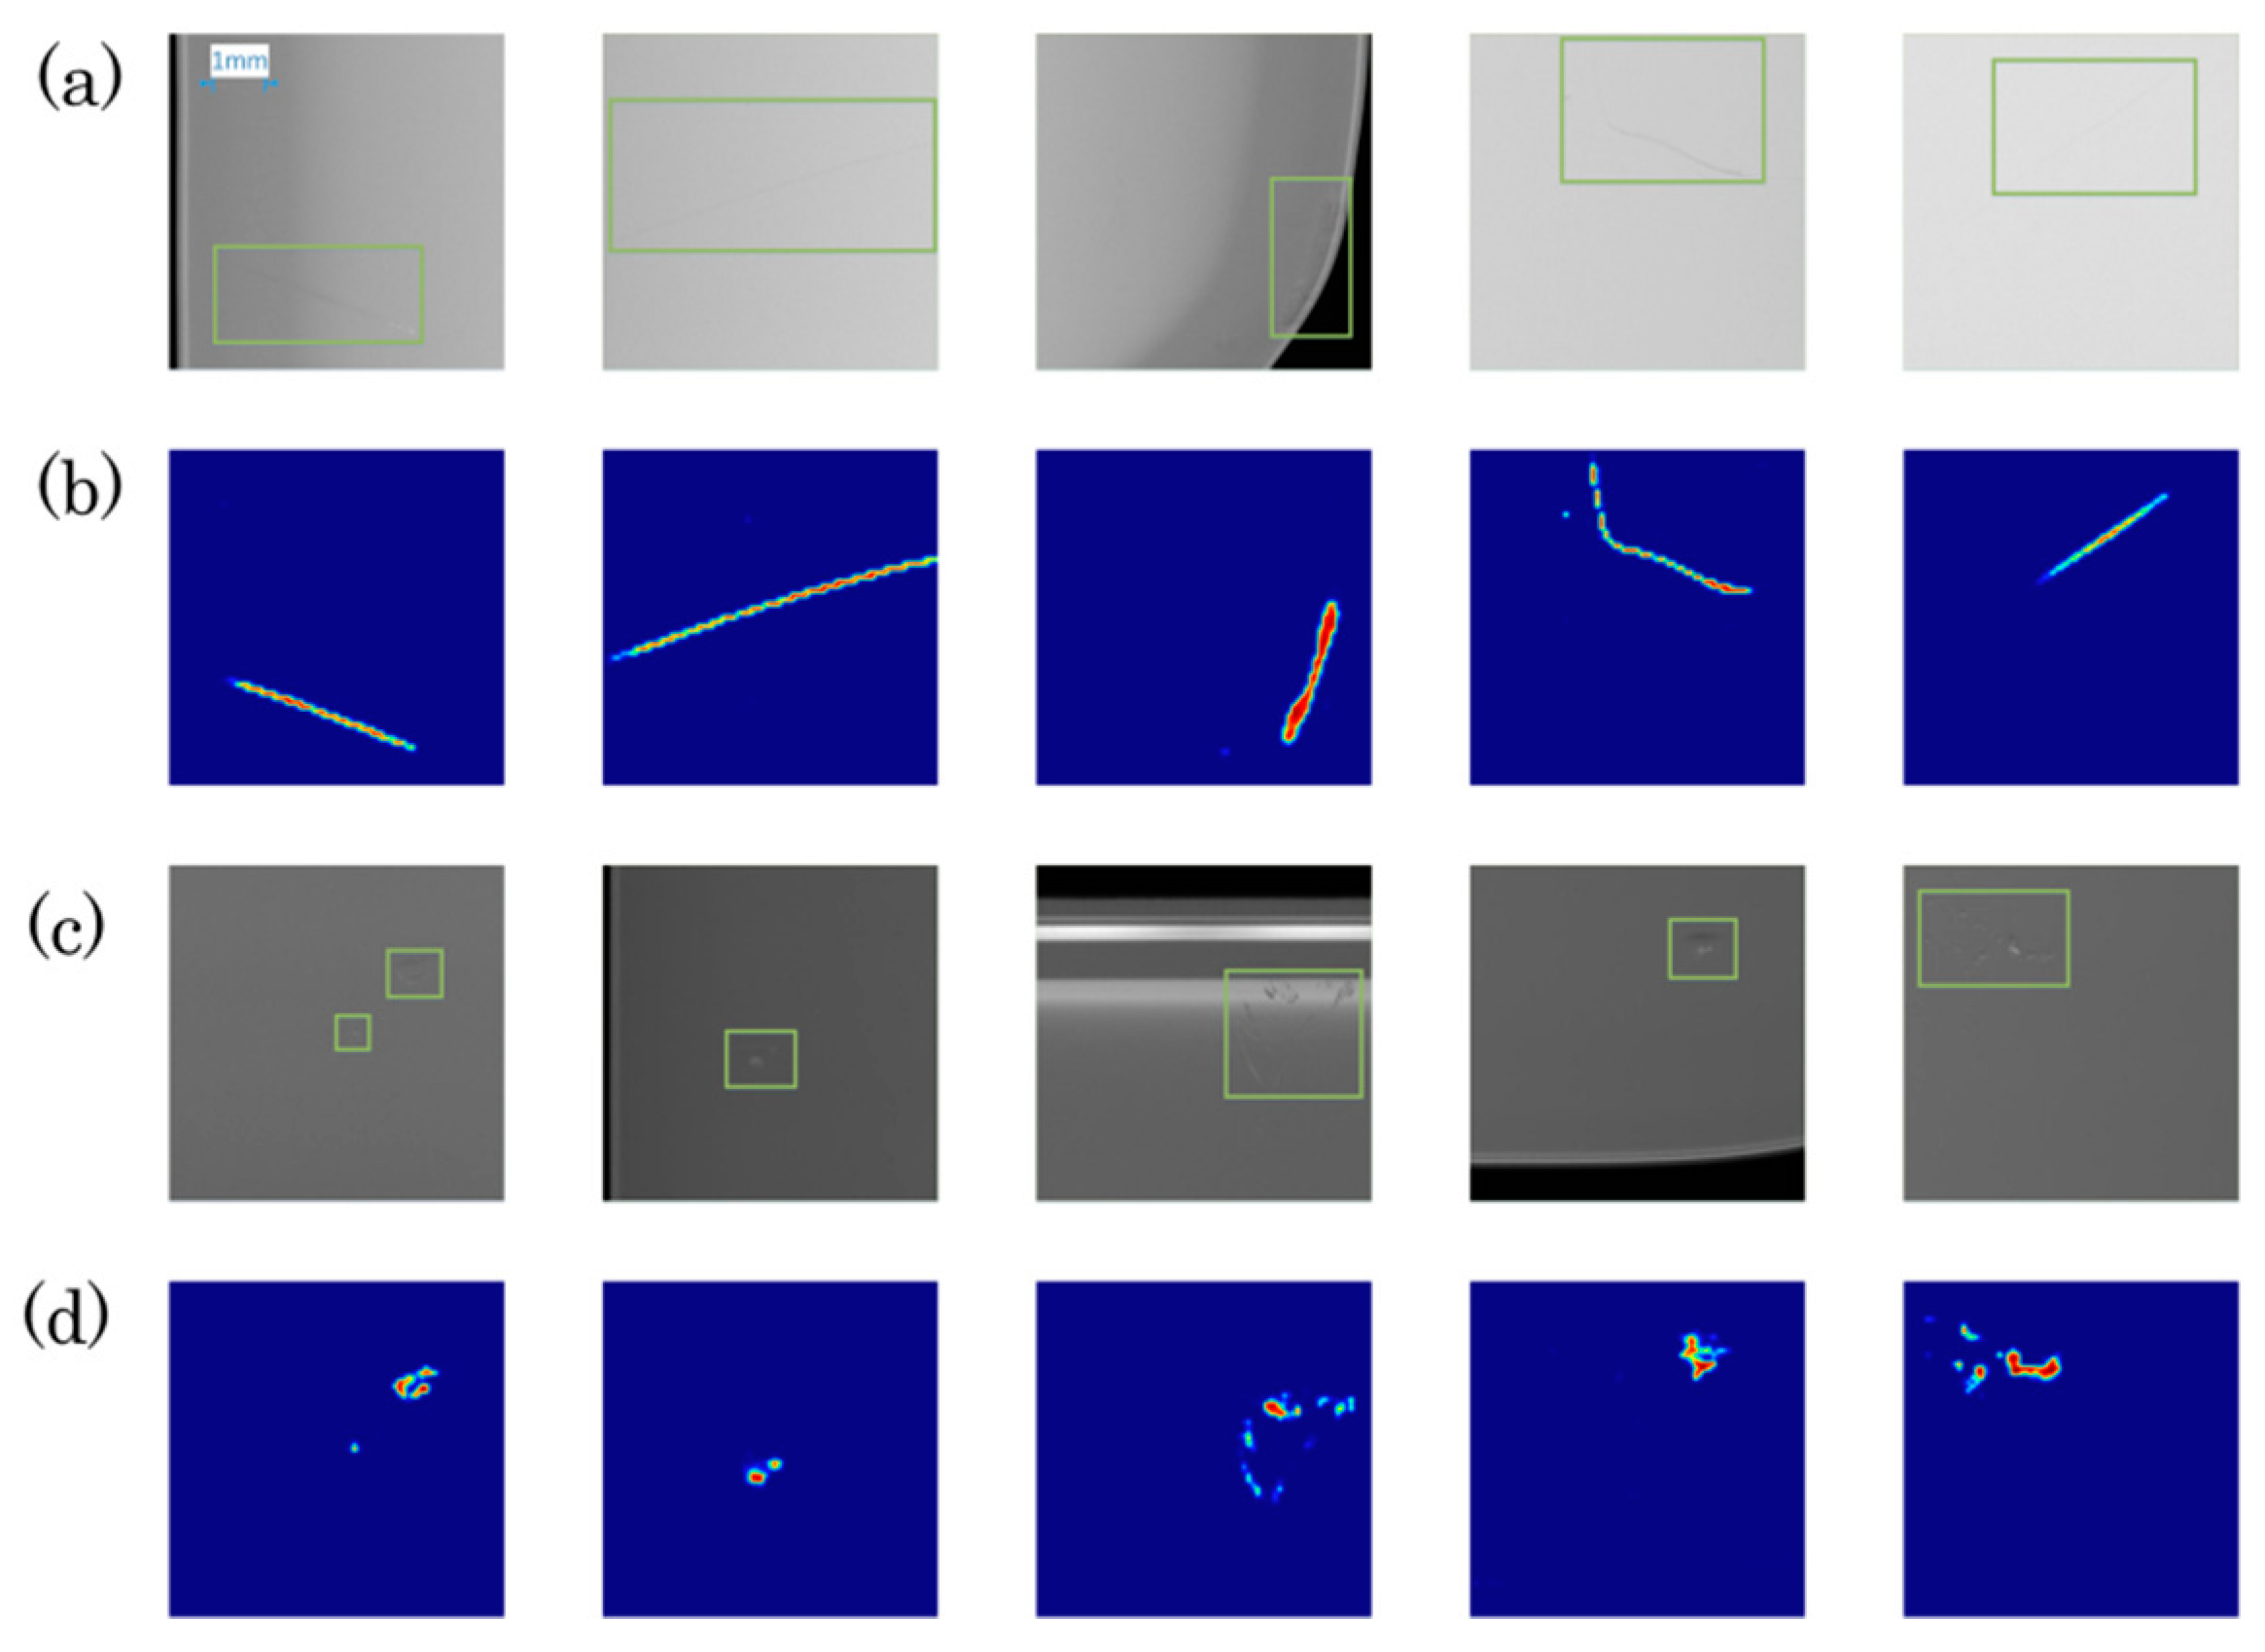
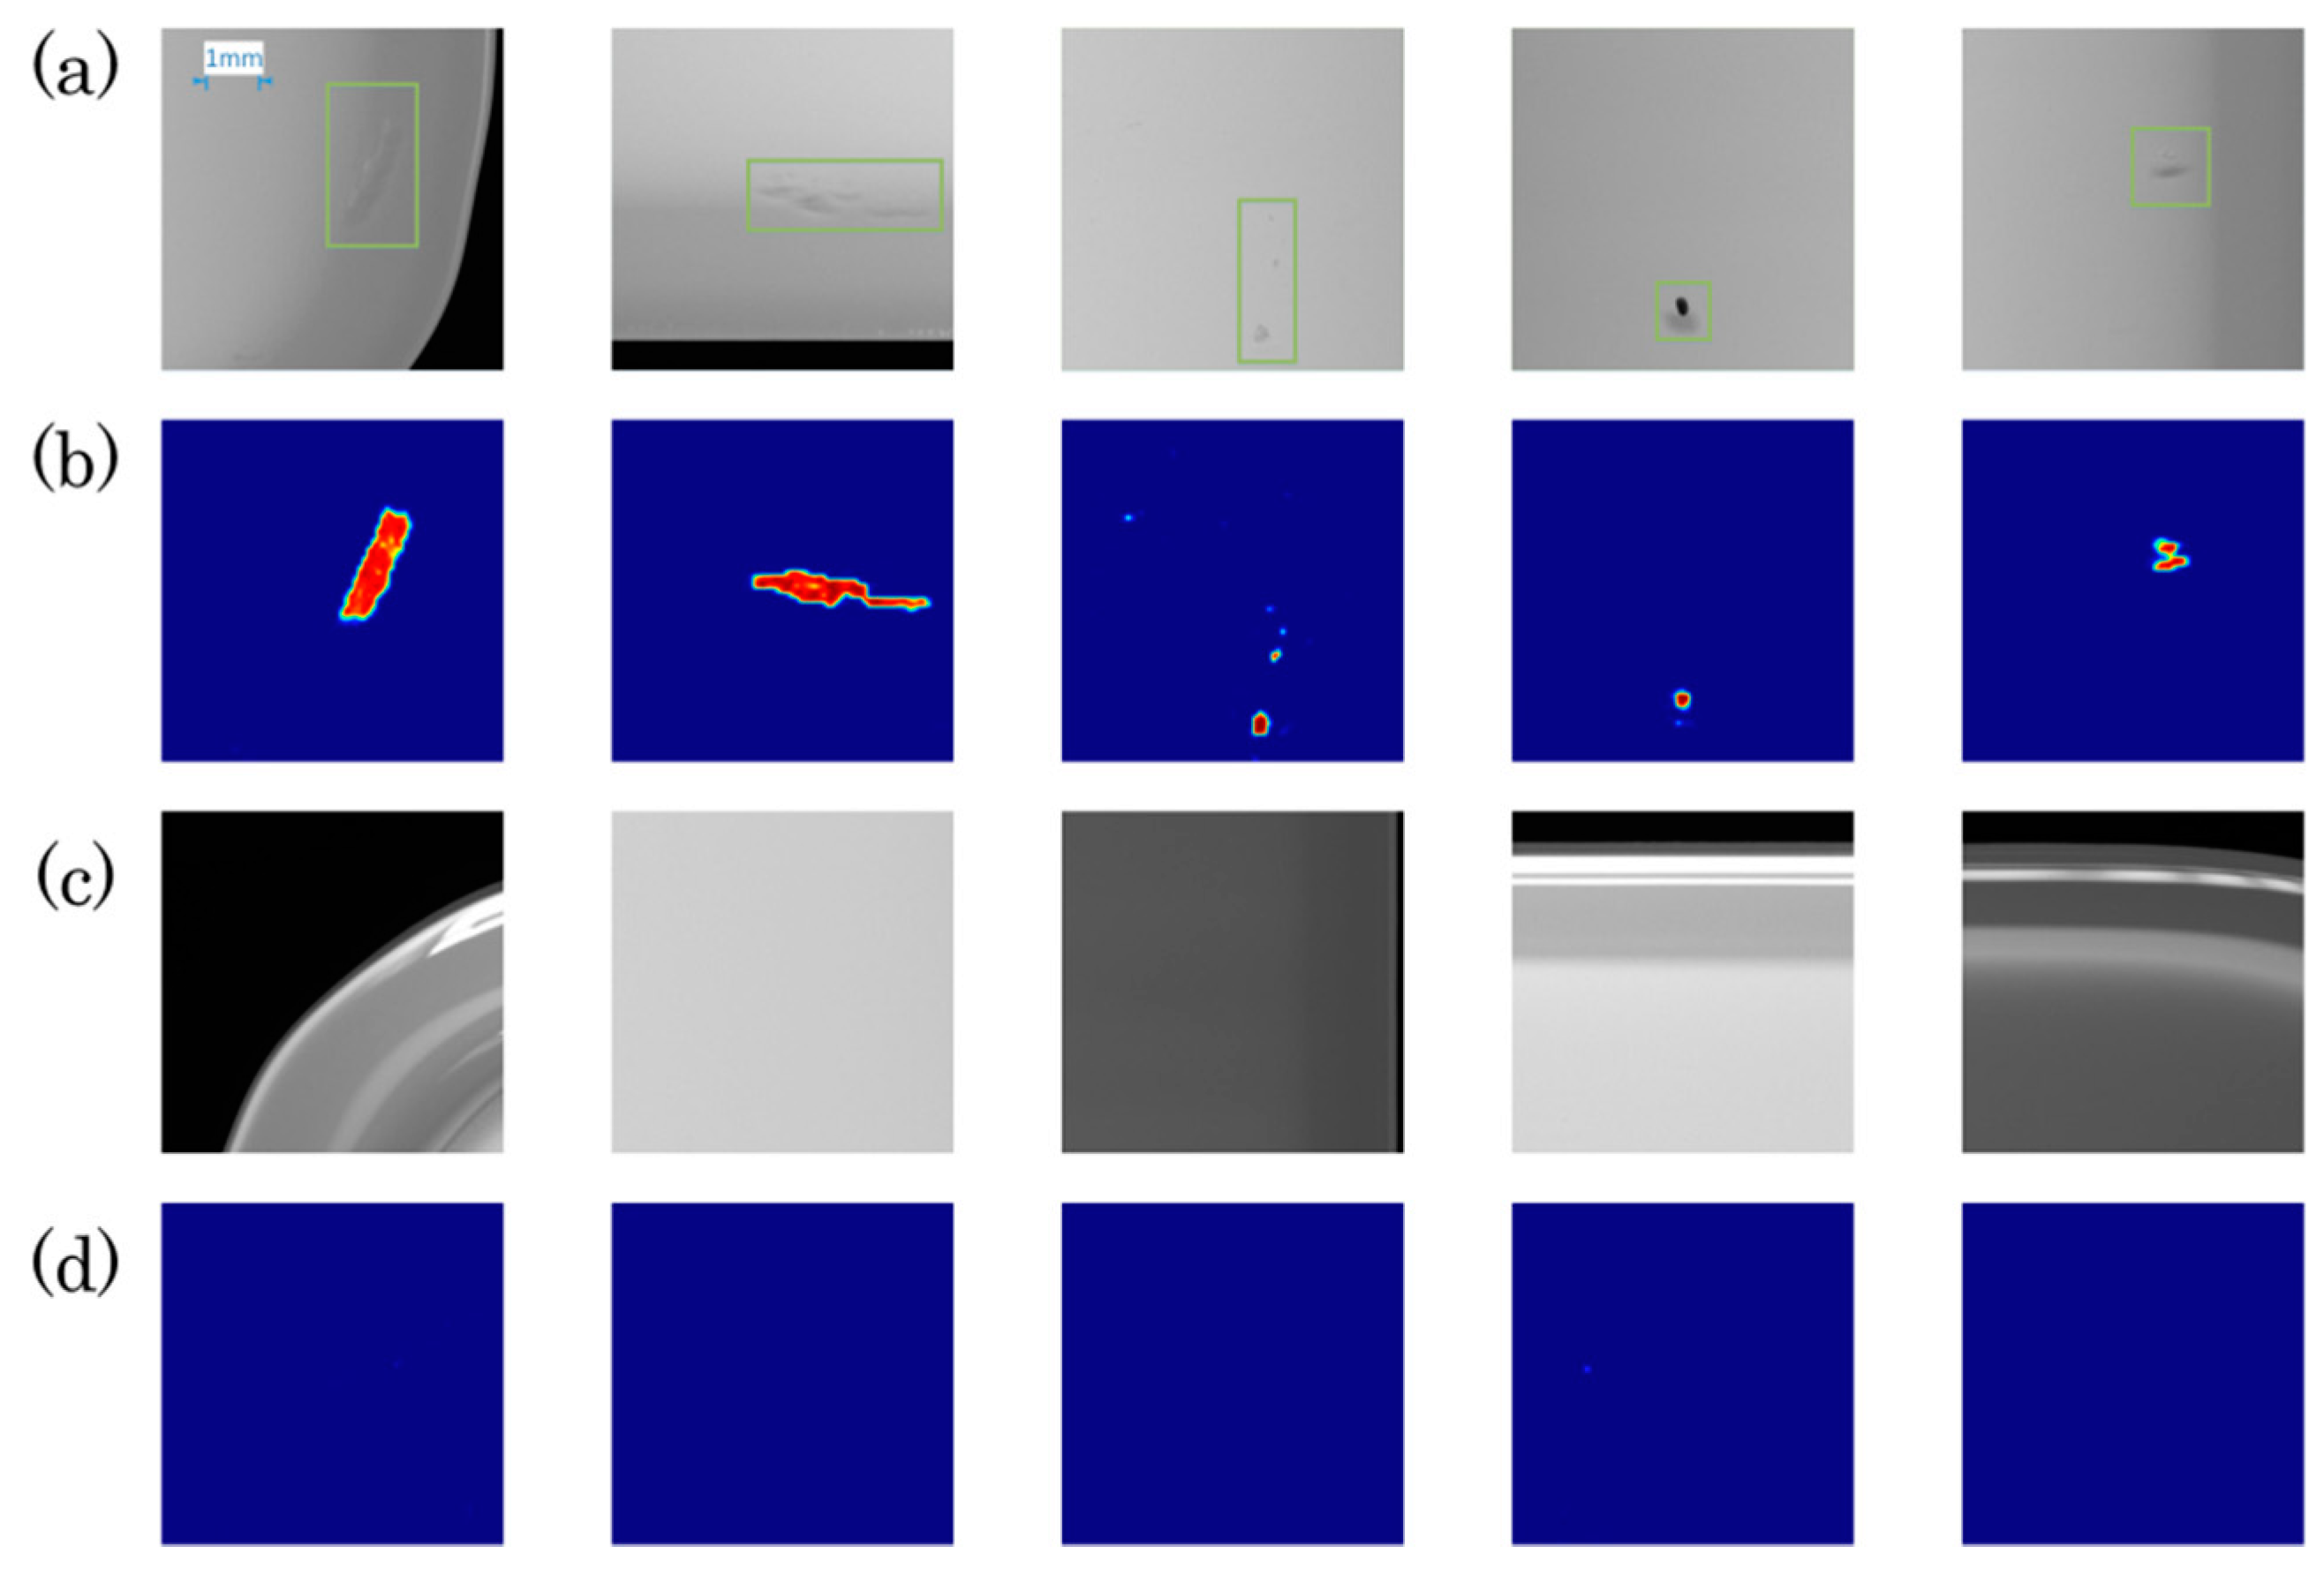
5.2. The Defection Detection Results

An illustration of the segmentation results based on the classical machine vision method and proposed deep-learning method is presented in Figure 8. The acquired defect images of the dent, discoloration, and scratch in the green dashed boxes shown in (a), (b), and (c) are respectively the segmentation result samples based on the classical machine vision method and proposed method, and the non-defective speckle misjudged as the defect is shown in the red box. The deep-learning segmentation results are heat maps that denote the probabilities of pixels belonging to defects and the classical segmentation results are the binary images. For the dent defect image of Figure 8(a1) with an evenly distributed background and high variance, the classical method achieved a good performance. There are two scratches in Figure 8(a2), where one scratch is very obvious while the other shallow scratch looks very weak. It is very difficult to detect such a low-contrast defect because the lower threshold may increase the misjudgment in the classical method. Non-defective random speckle can be misjudged as flaws, as shown in Figure 8(a3). The MPBG contains 2.5D arc edges, which would cause an unevenly distributed texture and result in misjudgment in the classical method. For the discoloration defect in Figure 8(a4), only a small part of the defect is detected because the remaining region of the defect has a low variance value. The detection results show that the deep learning method can extract defects in the unevenly distributed texture. The proposed approach outperformed the classical method.
The detection results of the three types of defects and background based on the proposed method are shown in Figure 9 and Figure 10. The segmentation results of the scratch defects are shown in Figure 9, where scratches could appear on any part of the glass with different lengths and grayscale, and the weak shallow defects can be easily detected. Dent defect detection is the most challenging task for the classical machine vision method because of the tiny size, as shown in Figure 9, and another reason is the presence of tiny dust particles, which are point-like in shape just as some dent defects. The proposed method could essentially reduce the misjudgment rate of the dust particles. The characteristic of discoloration is that it shows various shapes and patterns, including a point shape, curve shape, or irregular shape, as shown in Figure 10. The experimental results show the proposed method can automatically extract higher-level features to detect such defects. The results of the background in Figure 10 demonstrate that even though different parts of the glass have different backgrounds and structures, the false positive number can be small.
The images containing defects are defined as positive samples and the non-defective images are the negative images. The precision rate and recall rate are the most important evaluation criterions. They can represent the performance more accurately than the area under the curve (AUC) because of the large number of non-defective samples in GSDD. The precision P is defined as:
P = TP TP + FP ,
where the true positive (TP) means the number of correctly detected defect regions, and the false positive (FP) means the number of the background regions that are wrongly detected as defects. Recall is defined as:
R = TP TP + FN ,
where the false negative (FN) denotes the number of undetected defect regions. Industrial production always wants the qualification rate to be as high as possible after production inspection, which means strict inspection criterion to make the false negative number small. However, strict inspection criterion may cause a high false positive, which results in low productivity and high costs. A good defection detect system would result in high precision and high recall.
The deep-learning method proposed in this paper is superior to the traditional method. The traditional segmentation method is mainly composed of background correction, image filtering, and morphological operations [29]. Verified by the test experiment with more than 10,000 image samples, the inspection results of the traditional machine vision method and proposed deep learning method are shown in Table 1. The performance of the proposed method is significantly better with higher precision and recall on the defects of dent, scratch, and discoloration. Meanwhile, the average precision of the traditional method is 85.2%, while the proposed deep learning method achieves a precision of 91.8%. The average recall of the proposed method is 4.6% higher than that of the traditional method. The inspection performance on discoloration is obviously better than other defects because the size of discoloration is relatively large and the variance value is higher. The dent defect has the lowest recall because of the inevitable dust particles. The detection result is also better than the manual inspection result.

6. Conclusions

A novel inspection system for screen printing mobile phone back glass (MPBG) was proposed in this paper. High-quality images of MPBG were captured based on CBF and LABF line-scanning imaging systems. A modified segmentation deep convolutional network was constructed to detect the surface defects of MPBG. The network structure is partly symmetric. The performance of the proposed method was achieved by training from a glass surface defect dataset (GSDD), which was composed of 34,550 image samples. Verified by the test experiment, the average precision and recall of all kinds of defects are respectively more than 91% and 95%. The performance of the proposed method is significantly better than that of the traditional method. This paper demonstrated that the performance of the inspection system can satisfy the requirements of defect detection of a specific task (MPBG), and the system also shows great potential for other surface inspection tasks without much modification. For the future work, we will focus on achieving a good detection performance with less defect samples and on improving the computational efficiency. Meanwhile, how to annotate defect images with a higher precision and efficiency is also our destination.

Author Contributions

Conceptualization, Y.Y., P.C., and J.J.; methodology, J.J.; software, J.J., Z.L.; validation, J.J., P.C. and W.L.; formal analysis, J.J.; investigation, W.L.; resources, P.C.; data curation, Z.L.; writing—original draft preparation, J.J.; writing—review and editing, Y.Y.; visualization, P.C.; supervision, Y.Y.; project administration, P.C.; funding acquisition, Y.Y. All authors have read and agreed to the published version of the manuscript.

Funding

This work was supported by National Natural Science Foundation of China (NSFC, 61627825, 61875173).

Acknowledgments

This work was supported by the State Key Laboratory of Modern Optical Instrumentation of Zhejiang University and Zernike Optics Co., Ltd.

Conflicts of Interest

The authors declare no conflict of interest.

References

  1. Satorres, S.; Gómez Ortega, J.; Gamez Garcia, J.; Sánchez García, A.; Estevez, E. An Industrial Vision System for Surface Quality Inspection of Transparent Parts. Int. J. Adv. Manuf. Technol. 2013, 68, 1123–1136. [Google Scholar]
  2. Liang, L.-Q.; Li, D.; Fu, X.; Zhang, W.-J. Touch Screen Defect Inspection Based on Sparse Representation in Low Resolution Images. Multimedia Tools Appl. 2015, 75, 2655–2666. [Google Scholar] [CrossRef]
  3. Wang, S.; Liu, D.; Yang, Y.; Chen, X.; Cao, P.; Li, L.; Yan, L.; Cheng, Z.; Shen, Y. Distortion Correction in Surface Defects Evaluating System of Large Fine Optics. Opt. Commun. 2014, 312, 110–116. [Google Scholar] [CrossRef]
  4. Liu, N.; Wang, S.; Cao, P.; Li, L.; Cheng, Z.; Gao, X.; Yang, Y. Dark-Field Microscopic Image Stitching Method for Surface Defects Evaluation of Large Fine Optics. Opt. Express 2013, 21, 5974–5987. [Google Scholar] [CrossRef] [PubMed]
  5. Juschkin, L.; Maryasov, A.; Herbert, S.; Aretz, A.; Lebert, R. Euv Dark-Field Microscopy for Defect Inspection. In Proceedings of the 10th International Conference on X-ray Microscopy, Chicago, IL, USA, 15–20 August 2011. [Google Scholar]
  6. Li, L.; Liu, D.; Cao, P.; Xie, S.; Li, Y.; Chen, Y.; Yang, Y. Automated Discrimination between Digs and Dust Particles on Optical Surfaces with Dark-Field Scattering microscopy. Appl. Opt. 2014, 53, 5131–5140. [Google Scholar] [CrossRef]
  7. Altamirano, M.M.; Skumanich, A. Enhanced Defect Detection Capability Using Combined Brightfield/Darkfield Imaging. In Proceedings of the SPIE—The International Society for Optical Engineering, Santa Clara, CA, USA, 27 August 1998. [Google Scholar]
  8. Yuan, L.; Zhang, Z.; Xian, T. The Development and Prospect of Surface Defect Detection Based on Vision Measurement Method. In Proceedings of the 2016 12th World Congress on Intelligent Control and Automation (WCICA), Guilin, China, 12–15 June 2016. [Google Scholar]
  9. Platt, J. Sequential minimal optimization: A fast algorithm for training support vector machines. J. Inf. Technol. 1998, 1–28. [Google Scholar]
  10. Quinlan, J.R. Induction of Decision Trees. Mach. Learn. 1986, 1, 81–106. [Google Scholar] [CrossRef] [Green Version]
  11. Altman, N.S. An Introduction to Kernel and Nearest-Neighbor Nonparametric Regression. Am. Stat. 1992, 46, 175–185. [Google Scholar]
  12. Li, D.; Liang, L.; Zhang, W.-J. Defect inspection and extraction of the mobile phone cover glass based on the principal components analysis. Int. J. Adv. Manuf. Technol. 2014, 73, 1605–1614. [Google Scholar] [CrossRef]
  13. Jian, C.; Gao, J.; Ao, Y. Imbalanced Defect Classification for Mobile Phone Screen Glass Using Multifractal Features and a New Sampling Method. Multimedia Tools Appl. 2016, 76, 24413–24434. [Google Scholar] [CrossRef]
  14. Oztemel, E.; Gursev, S. Literature Review of Industry 4.0 and Related Technologies. J. Intell. Manuf. 2018, 31, 127–182. [Google Scholar] [CrossRef]
  15. Krizhevsky, A.; Sutskever, I.; Hinton, G. Imagenet Classification with Deep Convolutional Neural Networks. Adv. Neural Inf. Process. Syst. 2012, 25. [Google Scholar] [CrossRef]
  16. He, K.; Zhang, X.; Ren, S.; Sun, J. Deep Residual Learning for Image Recognition. arXiv 2015, arXiv:1512.03385. [Google Scholar]
  17. Chen, L.C.; Papandreou, G.; Schroff, F.; Adam, H. Rethinking Atrous Convolution for Semantic Image Segmentation(Deeplabv3). arXiv 2017, arXiv:1706.05587. [Google Scholar]
  18. Ronneberger, O.; Fischer, P.; Brox, T. U-Net: Convolutional Networks for Biomedical Image Segmentation. arXiv 2015, arXiv:1505.04597. [Google Scholar]
  19. Szegedy, C.; Liu, W.; Jia, Y.; Sermanet, P.; Reed, S.; Anguelov, D.; Erhan, D.; Vanhoucke, V.; Rabinovich, A. Going Deeper with Convolutions. In Proceedings of the IEEE Conference on Computer Vision and Pattern Recognition, Boston, MA, USA, 7–12 June 2015. [Google Scholar]
  20. Chen, L.-C.; Zhu, Y.; Papandreou, G.; Schroff, F.; Adam, H. Encoder-Decoder with Atrous Separable Convolution for Semantic Image Segmentation (Deeplabv3+). In Proceedings of the European Conference on Computer Vision (ECCV), Munich, Germany, 8–14 September 2018. [Google Scholar]
  21. Long, J.; Shelhamer, E.; Darrell, T. Fully Convolutional Networks for Semantic Segmentation. arXiv 2014, arXiv:1605.06211. [Google Scholar]
  22. Luc, P.; Couprie, C.; Chintala, S.; Verbeek, J. Semantic Segmentation Using Adversarial Networks. arXiv 2016, arXiv:1611.08408. [Google Scholar]
  23. Lei, C.; Zhu, J.; Zeng, H.; Jing, C.; Cai, C. Deep-Learned and Hand-Crafted Features Fusion Network for Pedestrian Gender Recognition. In Proceedings of ELM-2016; Springer: Cham, Germany, 2018; pp. 207–215. [Google Scholar]
  24. Yuan, Z.-C.; Zhang, Z.-T.; Su, H.; Zhang, L.; Shen, F.; Zhang, F. Vision-Based Defect Detection for Mobile Phone Cover Glass using Deep Neural Networks. Int. J. Precis. Eng. Manuf. 2018, 19, 801–810. [Google Scholar] [CrossRef]
  25. Weimer, D.; Thamer, H.; Scholz-Reiter, B. Learning Defect Classifiers for Textured Surfaces Using Neural Networks and Statistical Feature Representations. Procedia CIRP 2013, 7, 347–352. [Google Scholar] [CrossRef] [Green Version]
  26. Faghih-Roohi, S.; Hajizadeh, S.; Nunez, A.; Babuska, R.; De Schutter, B. Deep Convolutional Neural Networks for Detection of Rail Surface Defects. In Proceedings of the International Joint Conference on Neural Networks (IJCNN 2016), Vancouver, BC, Canada, 24–29 July 2016. [Google Scholar]
  27. Tabernik, D.; Šela, S.; Skvarč, J.; Skočaj, D. Segmentation-Based Deep-Learning Approach for Surface-Defect Detection. J. Intell. Manuf. 2019, 31, 759–776. [Google Scholar] [CrossRef] [Green Version]
  28. Zhang, Y.; Yang, Y.; Li, C.; Wu, F.; Chai, H.; Yan, K.; Zhou, L.; Li, Y.; Liu, N.; Bai, J. Defects Evaluation System for Spherical Optical Surfaces Based on Microscopic Scattering Dark-Field Imaging Method. Appl. Opt. 2016, 55, 6162. [Google Scholar] [CrossRef] [PubMed]
  29. Jiang, J.; Xiao, X.; Feng, G.; Lu, Z.; Yang, Y. Detection and Classification of Glass Defects Based on Machine Vision. In Proceedings of the Applied Optical Metrology III, San Diego, USA, 11–15 August 2019. [Google Scholar]
Figure 1. Sketch of the coaxial bright-field (CBF) imaging system and low-angle bright-field (LABF) imaging system, composed of an light emitting diode(LED) light source, collimating lenses, beam-splitter, imaging lens, and CMOS.
Applsci 10 03621 g001
Figure 2. Grayscale distribution of the shallow scratch: (a) The image of the shallow scratch defect in the CBF system; (b) The image of the shallow scratch defect in the LABF system; (c) Grayscale distributions of the shallow scratch in the CBF system and LABF system.
Applsci 10 03621 g002
Figure 3. Grayscale distribution of the dent defect: (a) Typical image of a dent defect in the CBF system; (b) Typical image of a dent defect in the LABF system; (c) Grayscale distributions of a dent defect in the CBF system and LABF system.
Applsci 10 03621 g003
Figure 4. Grayscale distribution of the discoloration defect: (a) Typical image of the discoloration defect in the CBF system; (b) Typical image of the discoloration defect in the LABF system; (c) Grayscale distributions of discoloration defects in the CBF system and LABF system.
Applsci 10 03621 g004
Figure 5. Typical defect samples and corresponding ground truth defect images: (a,b) are respectively scratch defects and the corresponding ground truth annotations; (c,d) are respectively dent defects and the corresponding ground truth annotations; (e,f) are respectively discoloration defects and the corresponding ground truth annotations.
Applsci 10 03621 g005
Figure 6. Typical captured images: (a) Original glass image captured by the CBF system; (b) extracted images by 23 rows and 12 columns from original image in (a); (c) Original image captured by the LABF system; (d) extracted images by 23 rows and 12 columns from original image in (c).
Applsci 10 03621 g006
Figure 7. Proposed architecture of the segmentation network.
Applsci 10 03621 g007
Figure 8. Results of the defect detection: (a) acquired defect images of the dent, discoloration, and scratch in the green dashed boxes; (b,c) are respectively segmentation result samples based on the classical machine vision method and proposed method; the non-defective speckle misjudged as the defect is shown in the red box.
Applsci 10 03621 g008
Figure 9. Segmentation results of scratch defects and dent defects: (a,b) are the respectively acquired defect images and segmentation results of scratch defects; (c,d) are the respectively acquired defect images and segmentation results of dent defects.
Applsci 10 03621 g009
Figure 10. Segmentation results of discoloration defects and negative samples: (a,b) are the respectively acquired defect images and segmentation results of discoloration; (c,d) are the respectively acquired defect images and segmentation results of negative samples.
Applsci 10 03621 g010
Table 1. Precision and recall results of the traditional machine vision method and proposed deep learning method.
MethodsDefect TypeAverage PrecisionRecallAverage Recall
Traditional methodDent85.2%87.8%90.7%
Scratch91.0%
Discoloration92.9%
Proposed deep learning methodDent91.8%93.1%95.3%
Scratch95.5%
Discoloration97.0%

