Fatty Acids from Ganoderma lucidum Spores: Extraction, Identification and Quantification

 , , ,
, , ,  and
and
Abstract
:Featured Application
Abstract
1. Introduction
2. Materials and Methods
2.1. General Experimental Procedures
2.2. Spore Source
2.3. Extraction of the Lipid Component
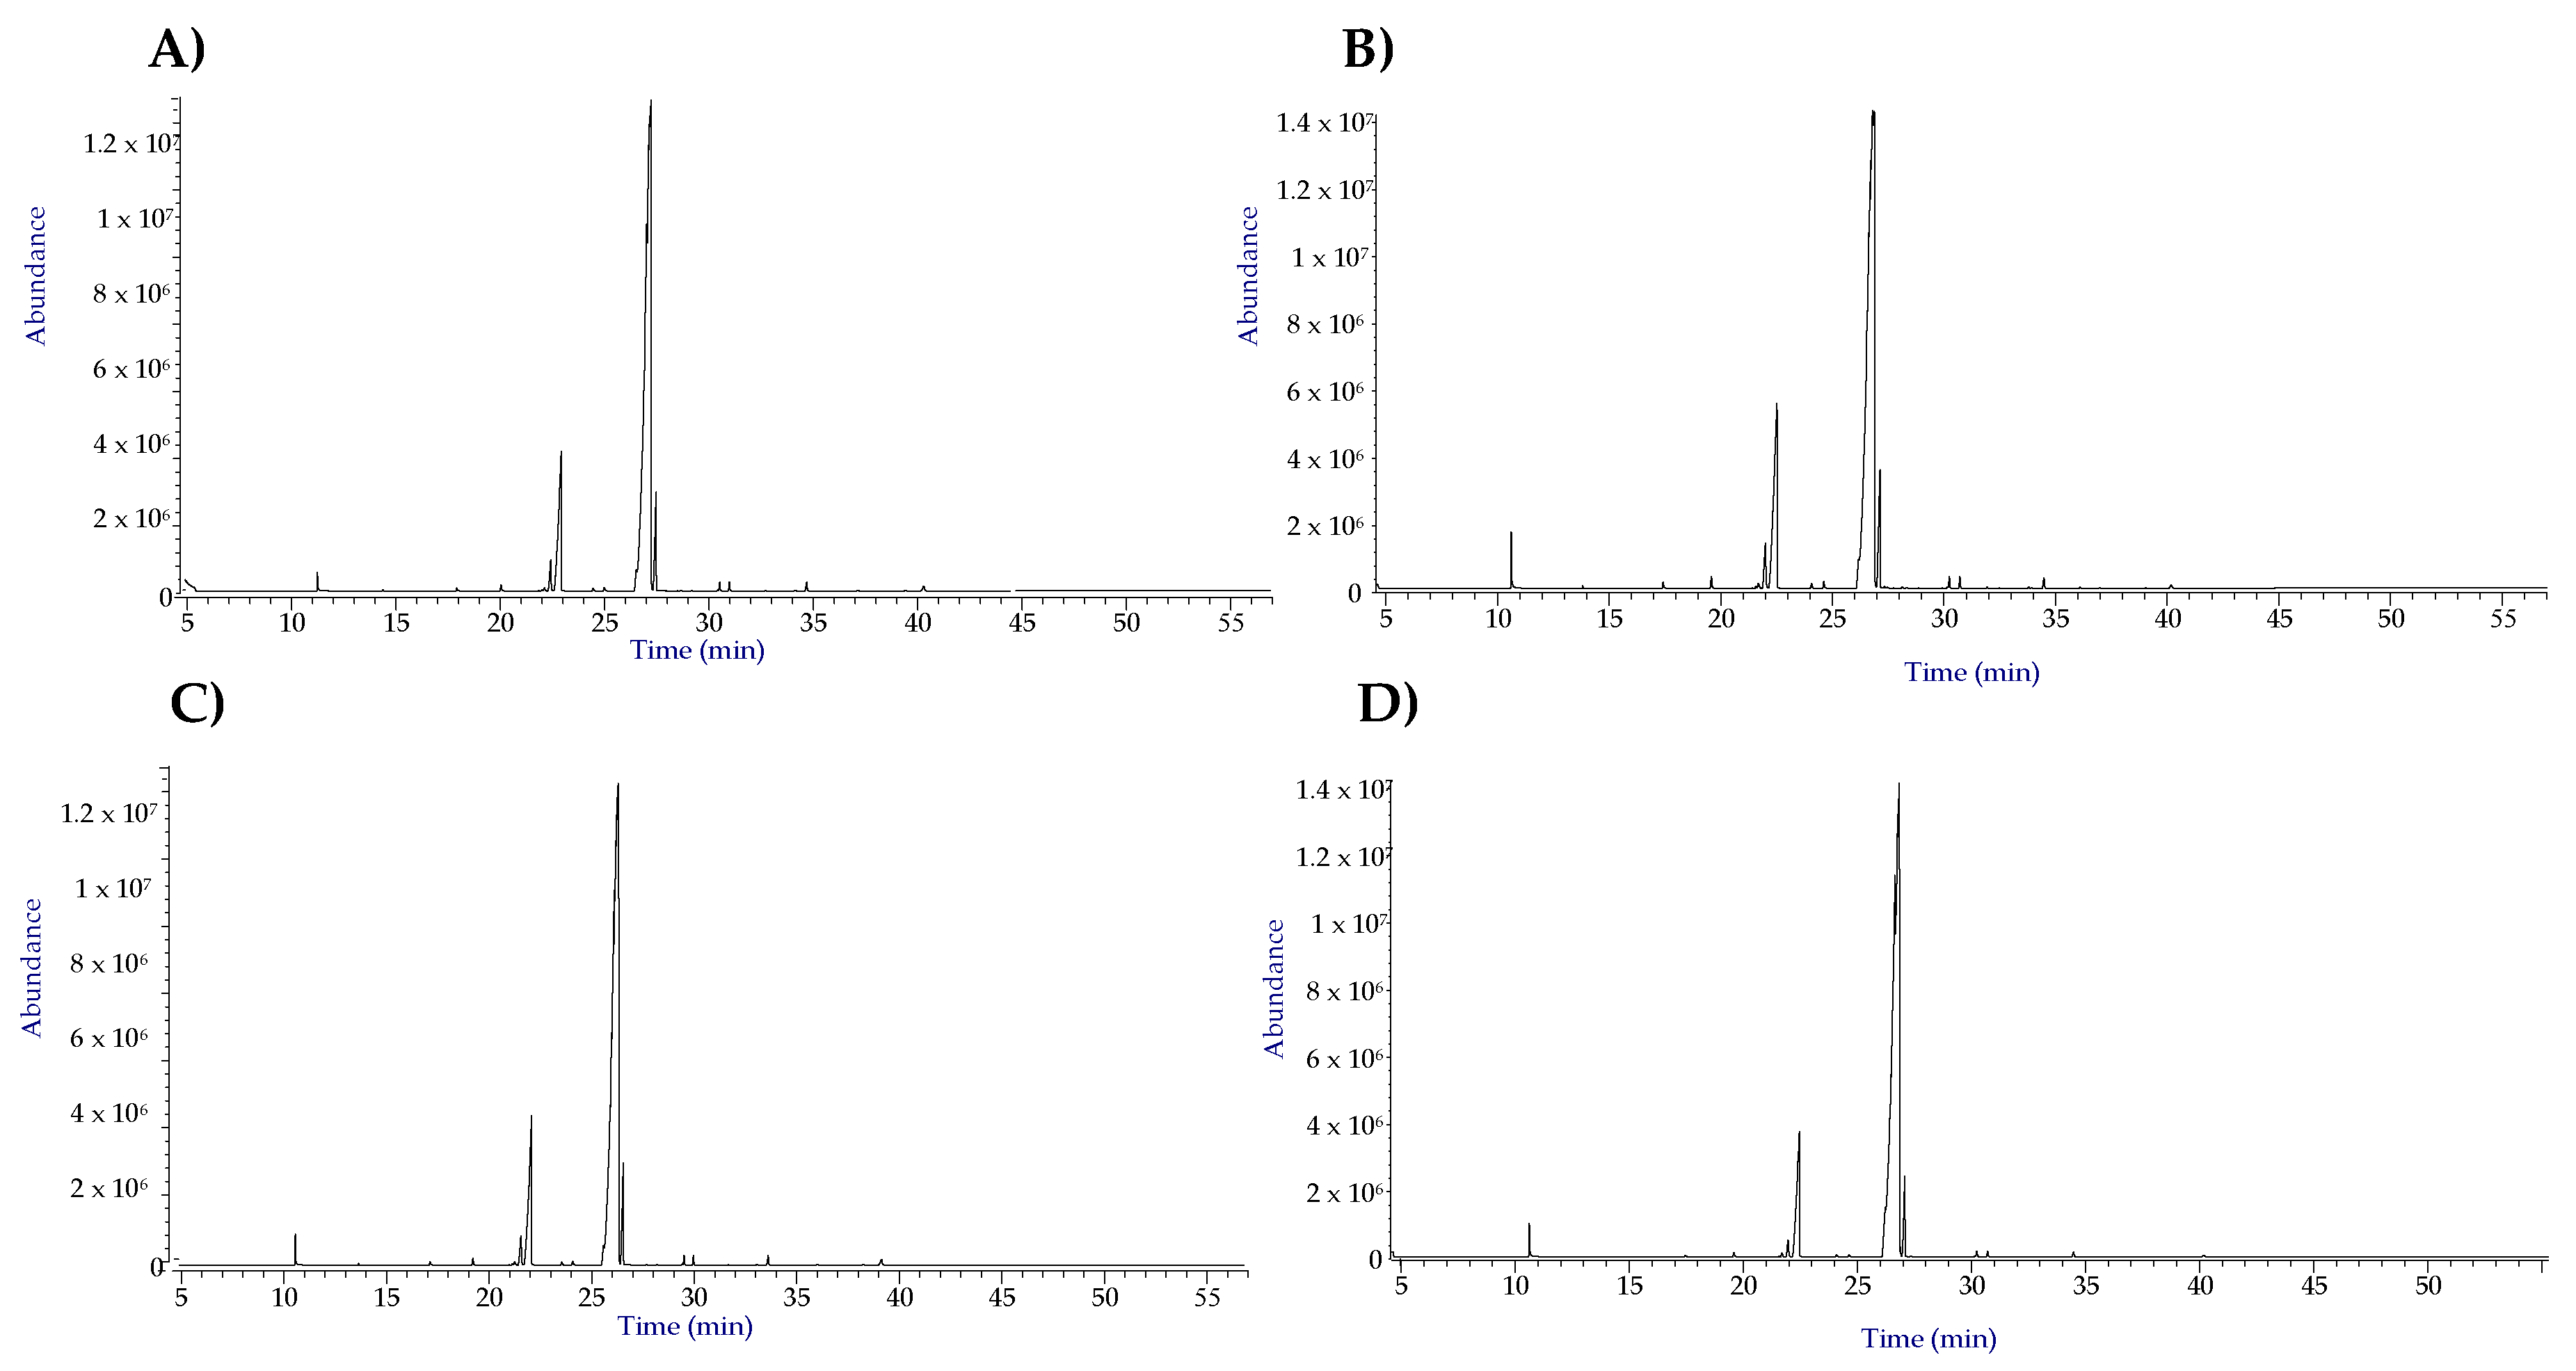
2.3.1. Extraction with n-Hexane
2.3.2. Extraction in Soxhlet Apparatus with n-Hexane
2.3.3. Reflux Extraction with Chloroform
2.4. Sample Preparation
2.5. Qualitative and Quantitative Analysis of the Lipid Components
2.6. Optimization of GC-MS Method
3. Results
4. Discussion
5. Conclusions
Author Contributions
Funding
Conflicts of Interest
References
- Wang, X.C.; Xi, R.J.; Li, Y.; Wang, D.M.; Yao, Y.J. The species identity of the widely cultivated Ganoderma, ‘G. lucidum’ (Ling-zhi), in China. PLoS ONE 2012, 7, e40857. [Google Scholar] [PubMed] [Green Version]
- Li, J.Q.; Zhang, J.H.; Chen, H.M.; Chen, X.D.; Lan, J.; Liu, C. Complete mitochondrial genome of the medicinal mushroom Ganoderma lucidum. PLoS ONE 2013, 8, e72038. [Google Scholar]
- Bishop, K.S.; Kao, C.H.; Xu, Y.; Glucina, M.P.; Paterson, R.R.M.; Ferguson, L.R. From 2000 years of Ganoderma lucidum to recent developments in nutraceuticals. Phytochemistry 2015, 114, 56–65. [Google Scholar] [CrossRef] [PubMed] [Green Version]
- Boh, B.; Berovic, M.; Zhang, J.; Zhi-Bin, L. Ganoderma lucidum and its pharmaceutically active compounds. Biotechnol. Annu. Rev. 2007, 13, 265–301. [Google Scholar] [PubMed]
- Boh, B. Ganoderma lucidum: A potential for biotechnological production of anti-cancer and immunomodulatory drugs. Recent Pat. Anticancer Drug Discov. 2013, 8, 255–287. [Google Scholar] [CrossRef] [PubMed]
- Hsu, K.D.; Cheng, K.C. From nutraceutical to clinical trial: Frontiers in Ganoderma development. Appl. Microbiol. Biotechnol. 2018, 102, 9037–9051. [Google Scholar] [CrossRef] [PubMed]
- Siwulski, M.; Sobieralski, K.; Golak-Siwulska, I.; Sokół, S.; Sękara, A. Ganoderma lucidum (Curt.: Fr.) Karst.-health-promoting properties. A review. Herba Pol. 2015, 61, 105–118. [Google Scholar] [CrossRef] [Green Version]
- Taofiq, O.; Heleno, S.A.; Calhelha, R.C.; Alves, M.J.; Barros, L.; González-Paramás, A.M.; Borreiro, M.F.; Ferreira, I.C. The potential of Ganoderma lucidum extracts as bioactive ingredients in topical formulations, beyond its nutritional benefits. Food Chem. Toxicol. 2017, 108, 139–147. [Google Scholar] [CrossRef] [Green Version]
- Chen, S.D.; Li, X.M.; Yong, T.Q.; Wang, Z.G.; Su, J.Y.; Jiao, C.W.; Xie, Y.Z.; Yang, B.B. Cytotoxic lanostane-type triterpenoids from the fruiting bodies of Ganoderma lucidum and their structure-activity relationships. Oncotarget 2017, 8, 10071–10084. [Google Scholar] [CrossRef] [Green Version]
- Cör, D.; Knez, Ž.; Knez Hrnčič, M. Antitumour, antimicrobial, antioxidant and antiacetylcholinesterase effect of Ganoderma lucidum terpenoids and polysaccharides: A review. Molecules 2018, 23, 649. [Google Scholar]
- Ahmad, M.F. Ganoderma lucidum: Persuasive biologically active constituents and their health endorsement. Biomedicine 2018, 107, 507–519. [Google Scholar] [CrossRef] [PubMed]
- Min, B.S.; Nakamura, N.; Miyashiro, H.; Bae, K.W.; Hattori, M. Triterpenes from the spores of Ganoderma lucidum and their inhibitory activity against HIV-1 protease. Chem. Pharm. Bull. 1998, 46, 1607–1612. [Google Scholar] [CrossRef] [PubMed] [Green Version]
- Lin, Z.B.; Wang, P.Y. The pharmacological study of Ganoderma spores and their active components. J. Peking Univ. 2006, 38, 541–547. [Google Scholar]
- Soccol, C.R.; Bissoqui, L.Y.; Rodrigues, C.; Rubel, R.; Sella, S.R.; Leifa, F.; Porto de Souza Vandenberghe, L.; Soccol, V.T. Pharmacological properties of biocompounds from spores of the lingzhi or reishi medicinal mushroom Ganoderma lucidum (Agaricomycetes): A review. Int. J. Med. Mushrooms 2016, 18, 757–767. [Google Scholar] [CrossRef]
- Xu, J.; Li, P. Researches and application of Ganoderma spores powder. In Ganoderma and Health; Springer: Singapore, 2019; pp. 157–186. ISBN 978-981-13-9866-7. [Google Scholar]
- Liu, X.; Xu, S.P.; Wang, J.H.; Yuan, J.P.; Guo, L.X.; Li, X.; Huang, X.N. Characterization of Ganoderma spore lipid by stable carbon isotope analysis: Implications for authentication. Anal. Bioanal. Chem. 2007, 388, 723–731. [Google Scholar] [CrossRef]
- Deng, Z.L.; Yuan, J.P.; Zhang, Y.; Xu, X.M.; Wu, C.F.; Peng, J.; Wang, J.H. Fatty acid composition in ergosteryl esters and triglycerides from the fungus Ganoderma lucidum. J. Am. Oil Chem. Soc. 2013, 90, 1495–1502. [Google Scholar] [CrossRef]
- Salvatore, M.M.; Ciaravolo, M.; Cirino, P.; Toscano, A.; Salvatore, F.; Gallo, M.; Naviglio, D.; Andolfi, A. Fatty acids from Paracentrotus lividus sea urchin shells obtained via Rapid Solid Liquid Dynamic Extraction (RSLDE). Separations 2019, 6, 50. [Google Scholar] [CrossRef] [Green Version]
- NIST Standard Reference Data. Available online: http://www.nist.gov/srd/nist1a.cfm (accessed on 12 May 2020).
- Sparkman, O.D.; Penton, Z.E.; Kitson, F.G. Gas Chromatography and Mass Spectrometry: A Practical Guide, 2nd ed.; Elsevier: Burlington, MA, USA, 2011; ISBN 978-0-12-373628-4. [Google Scholar]
- Salvatore, M.M.; Giambra, S.; Naviglio, D.; DellaGreca, M.; Salvatore, F.; Burruano, S.; Andolfi, A. Fatty acids produced by Neofusicoccum vitifusiforme and N. parvum, fungi associated with grapevine botryosphaeria dieback. Agriculture 2018, 8, 189. [Google Scholar] [CrossRef] [Green Version]
- AMDIS NET. Available online: http://www.amdis.net/ (accessed on 12 April 2020).
- Salvatore, M.M.; Nicoletti, R.; Salvatore, F.; Naviglio, D.; Andolfi, A. GC-MS approaches for the screening of metabolites produced by marine-derived Aspergillus. Mar. Chem. 2018, 206, 19–33. [Google Scholar] [CrossRef]
- Nieva-Echevarría, B.; Encarnación Goicoechea, M.; Manzanos, J.; Guillén, M.D. A method based on 1H NMR spectral data useful to evaluate the hydrolysis level in complex lipid mixtures. Food Res. Int. 2014, 66, 379–387. [Google Scholar] [CrossRef] [Green Version]
- Miller, J.; Miller, J.C. Statistics and Chemometrics for Analytical Chemistry, 4th ed.; Pearson Education: Harlow, UK, 2018; ISBN 0-131-29192-0. [Google Scholar]
- Lavagnini, I.; Magno, F. A statistical overview on univariate calibration, inverse regression, and detection limits: Application to gas chromatography/mass spectrometry technique. Mass Spectrom. Rev. 2007, 26, 1–18. [Google Scholar] [CrossRef] [PubMed]
- Sanodiya, B.S.; Thakur, G.S.; Baghel, R.K.; Prasad, G.B.; Bisen, P.S. Ganoderma lucidum: A potent pharmacological macrofungus. Curr. Pharm. Biotechnol. 2009, 10, 717–742. [Google Scholar] [CrossRef] [PubMed]
- Baby, S.; Johnson, A.J.; Govindan, B. Secondary metabolites from Ganoderma. Phytochemistry 2015, 114, 66–101. [Google Scholar] [CrossRef] [PubMed]
- Sales-Campos, H.; Reis de Souza, P.; Crema Peghini, B.; Santana da Silva, J.; Ribeiro Cardoso, C. An overview of the modulatory effects of oleic acid in health and disease. Mini Rev. Med. Chem. 2013, 13, 201–210. [Google Scholar] [PubMed]
- Cardoso, C.R.; Favoreto, S., Jr.; Oliveira, L.L.D.; Vancim, J.O.; Barban, G.B.; Ferraz, D.B.; Silva, J.S.D. Oleic acid modulation of the immune response in wound healing: A new approach for skin repair. Immunobiology 2011, 216, 409–415. [Google Scholar] [CrossRef] [PubMed]
- Carrillo, C.; Alonso-Torre, S.R. Antitumor effect of oleic acid; mechanisms of action. A review. Nutr. Hosp. 2012, 27, 1860–1865. [Google Scholar] [PubMed] [Green Version]
- Mancini, A.; Imperlini, E.; Nigro, E.; Montagnese, C.; Daniele, A.; Orrù, S.; Buono, P. Biological and nutritional properties of palm oil and palmitic acid: Effects on health. Molecules 2015, 20, 17339–17361. [Google Scholar] [CrossRef]


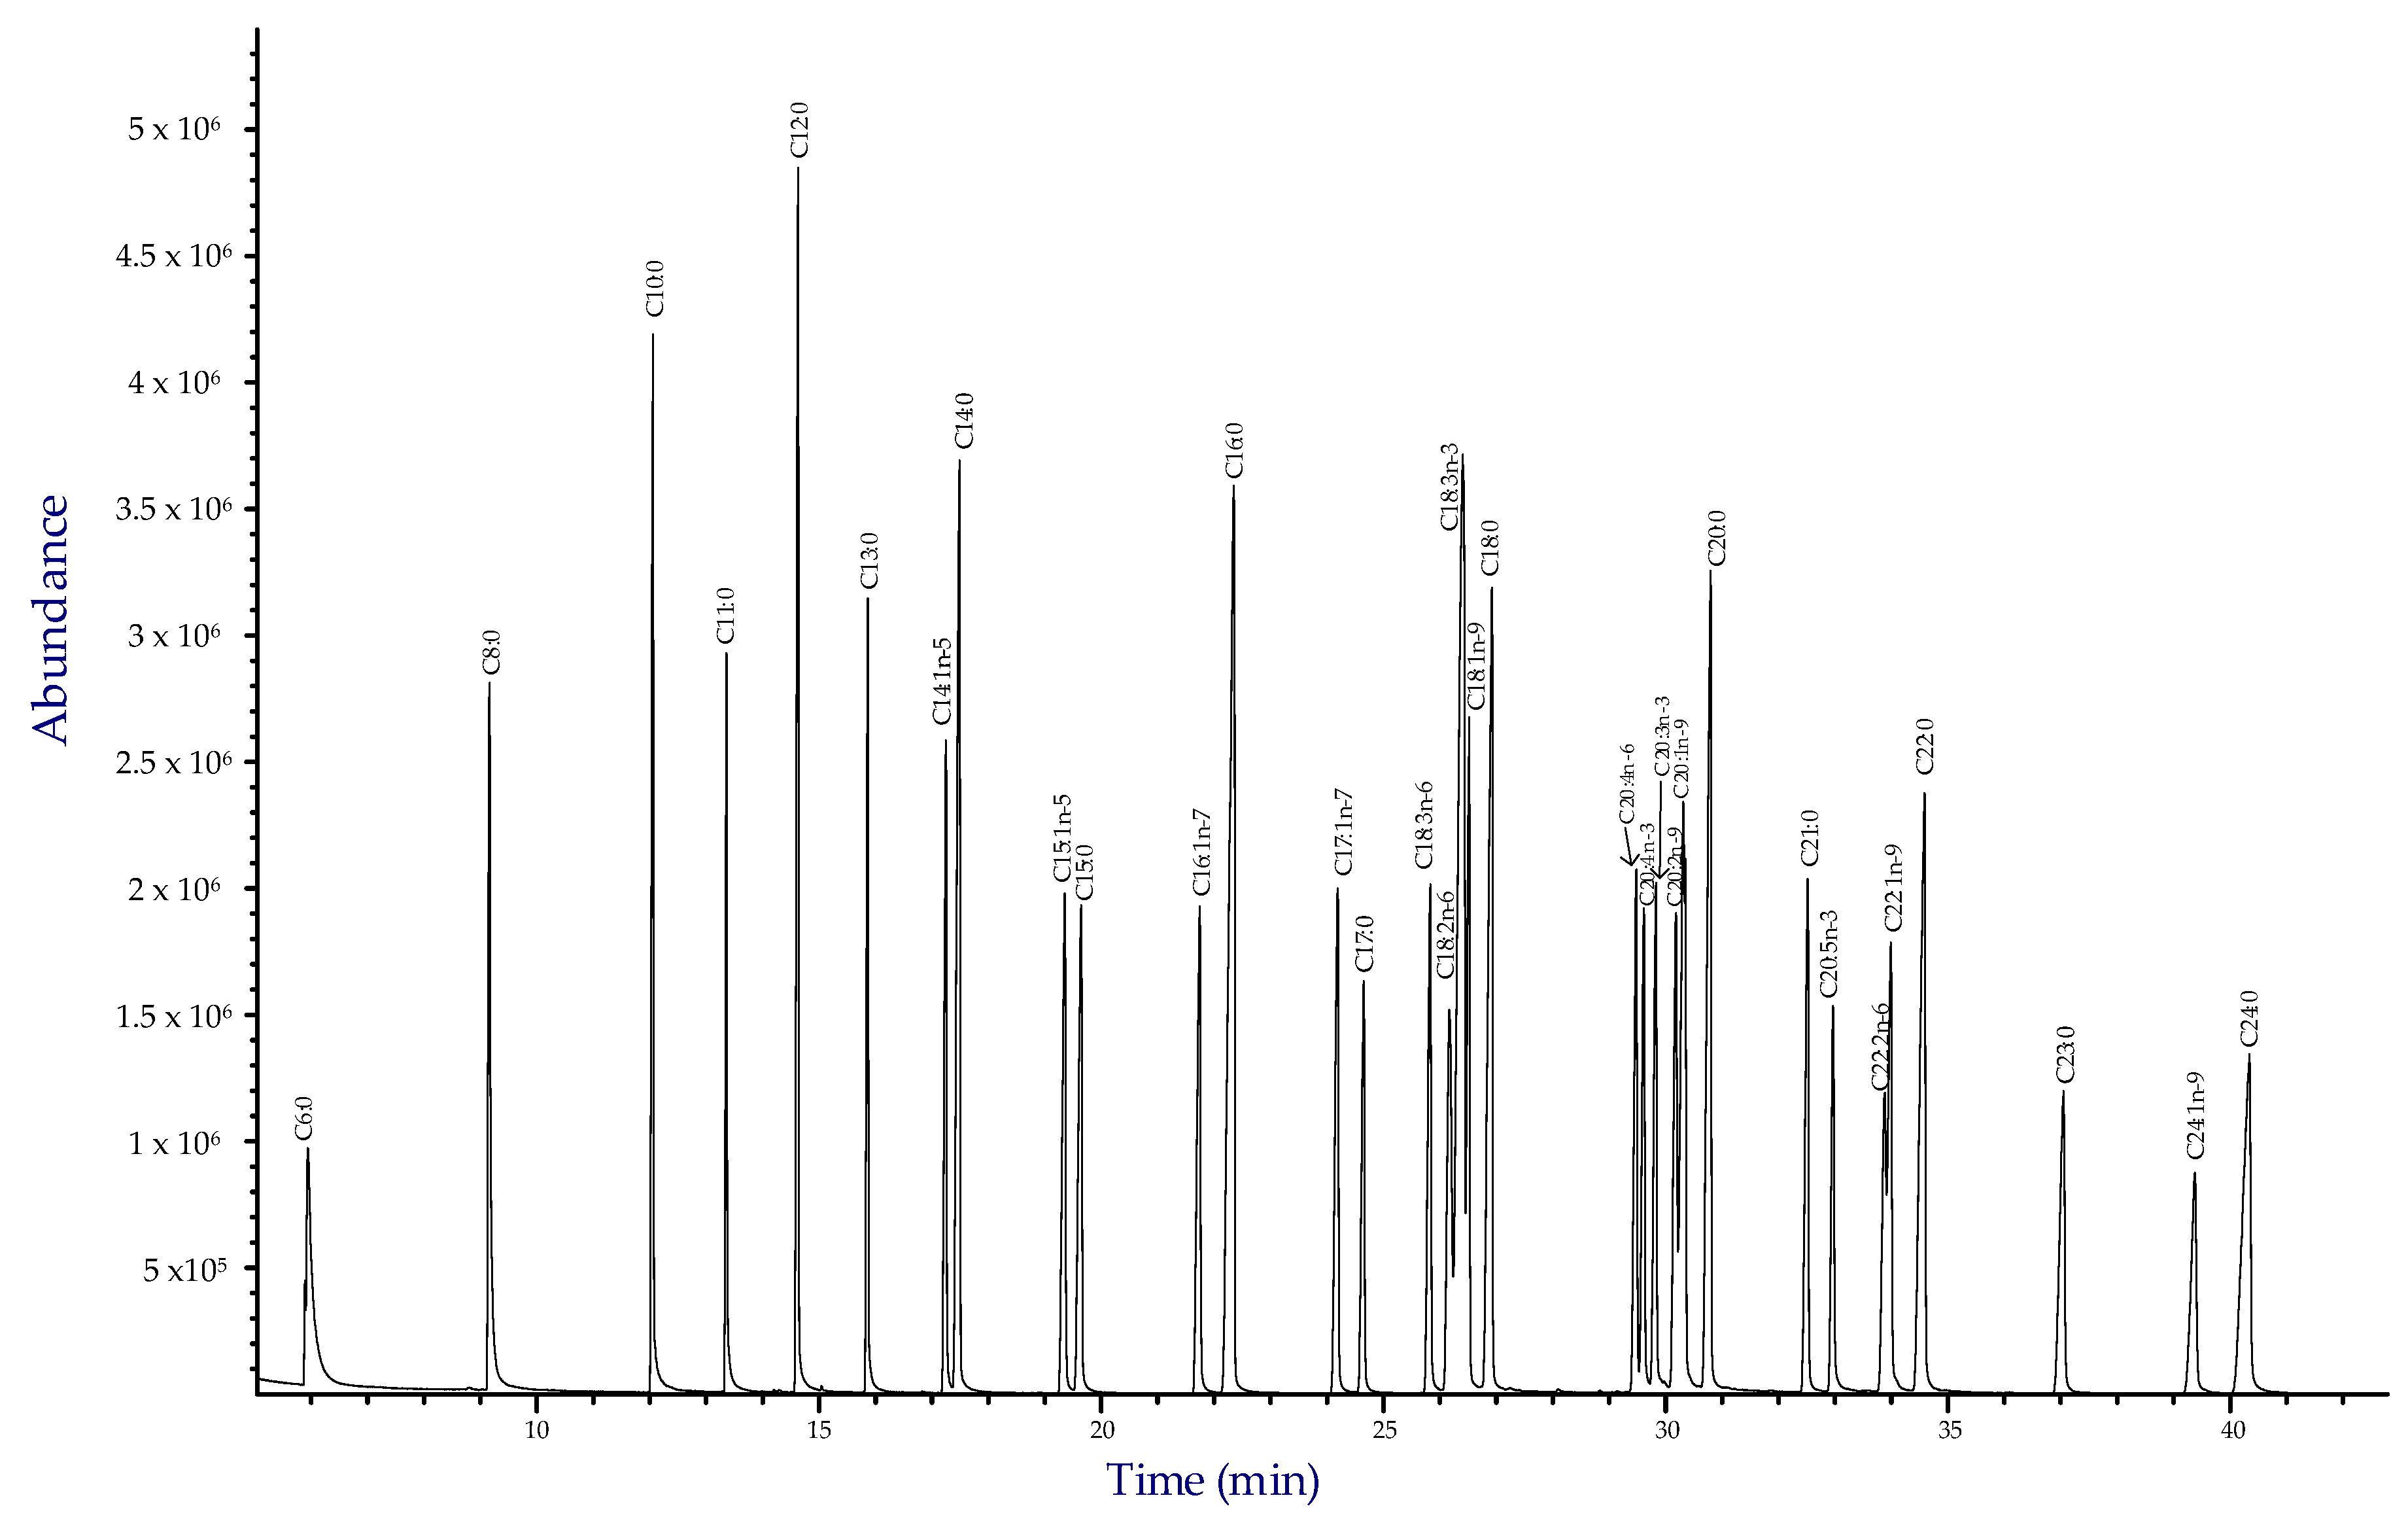
| Name * | tr (min) | KI | Intercept | Slope | R2 | LOD (mg L−1) | LOQ (mg L−1) | |
|---|---|---|---|---|---|---|---|---|
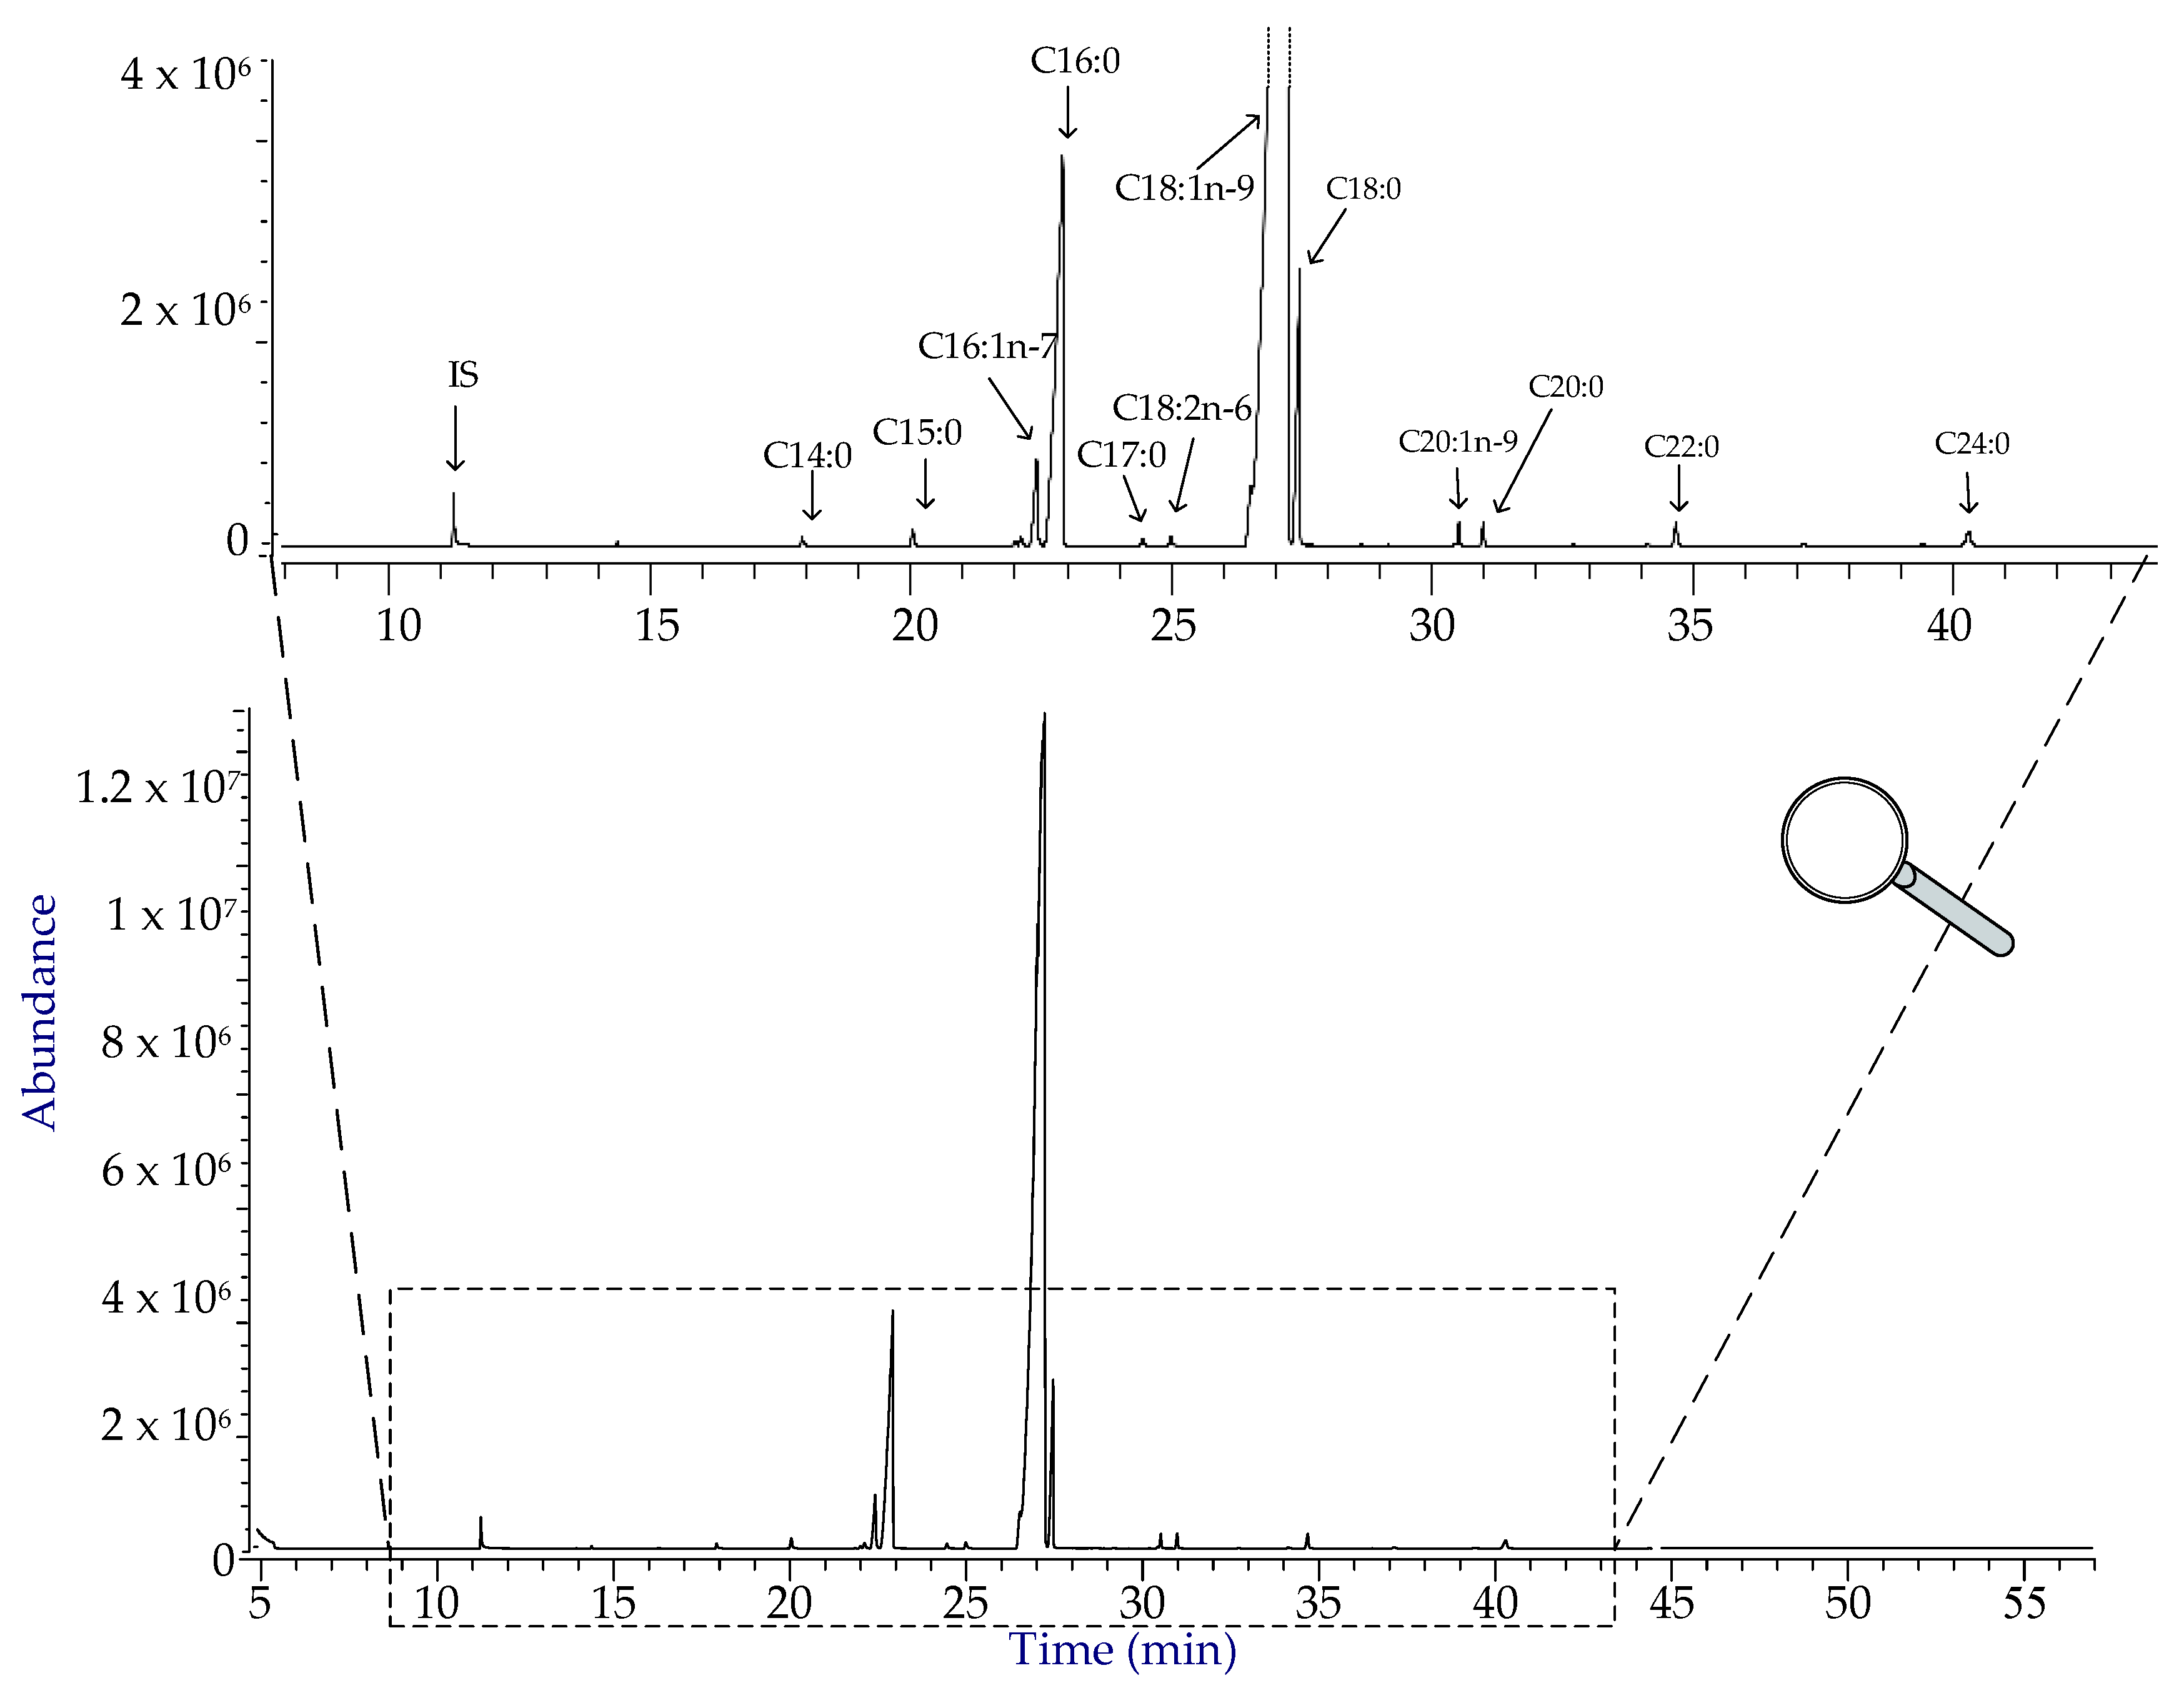
| C14:0 | Myristic acid | 17.42 | 1720 | 0.000 ± 0.024 | 0.01306 ± 0.00032 | 0.998 | 6.0 | 18.3 |
| C15:0 | – | 19.58 | 1821 | −0.016 ± 0.011 | 0.00707 ± 0.00015 | 0.998 | 5.1 | 15.6 |
| C16:1n-7 | Palmitoleic acid | 22.00 | 1916 | −0.0095 ± 0.0093 | 0.00665 ± 0.00012 | 0.999 | 4.7 | 14.3 |
| C16:0 | Palmitic acid | 22.51 | 1936 | −0.005 ± 0.024 | 0.01408 ± 0.00026 | 0.998 | 5.6 | 17.1 |
| C17:0 | Margaric acid | 24.62 | 2024 | −0.0033 ± 0.0094 | 0.00481 ± 0.00012 | 0.998 | 6.4 | 19.4 |
| C18:2n-6 | Linoleic acid | 25.18 | 2094 | −0.0148 ± 0.0093 | 0.00686 ± 0.00011 | 0.999 | 4.5 | 13.6 |
| C18:1n-9 | Oleic acid | 26.81 | 2124 | −0.018 ± 0.045 | 0.02674 ± 0.00057 | 0.998 | 5.6 | 16.8 |
| C18:0 | Stearic acid | 27.14 | 2140 | 0.000 ± 0.025 | 0.0149 ± 0.00033 | 0.998 | 5.6 | 16.9 |
| C20:1n-9 | Gadoleic acid | 30.24 | 2299 | −0.021 ± 0.019 | 0.00793 ± 0.00025 | 0.996 | 7.9 | 24.0 |
| C20:0 | Arachidic acid | 30.71 | 2326 | 0.002 ± 0.026 | 0.00838 ± 0.00046 | 0.988 | 10.2 | 31.0 |
| C22:0 | Behenic acid | 34.47 | 2523 | 0.006 ± 0.035 | 0.01417 ± 0.00045 | 0.996 | 8.2 | 24.7 |
| C24:0 | Lignoceric acid | 40.17 | 2724 | 0.030 ± 0.030 | 0.02064 ± 0.00050 | 0.997 | 4.8 | 14.5 |
| Name 1 | Extraction with n-Hexane (% ± SD 2) | Extraction in Soxhlet (% ± SD) | Reflux Extraction with Chloroform (% ± SD) | Commercial Liquid Extract (% ± SD) | |
|---|---|---|---|---|---|
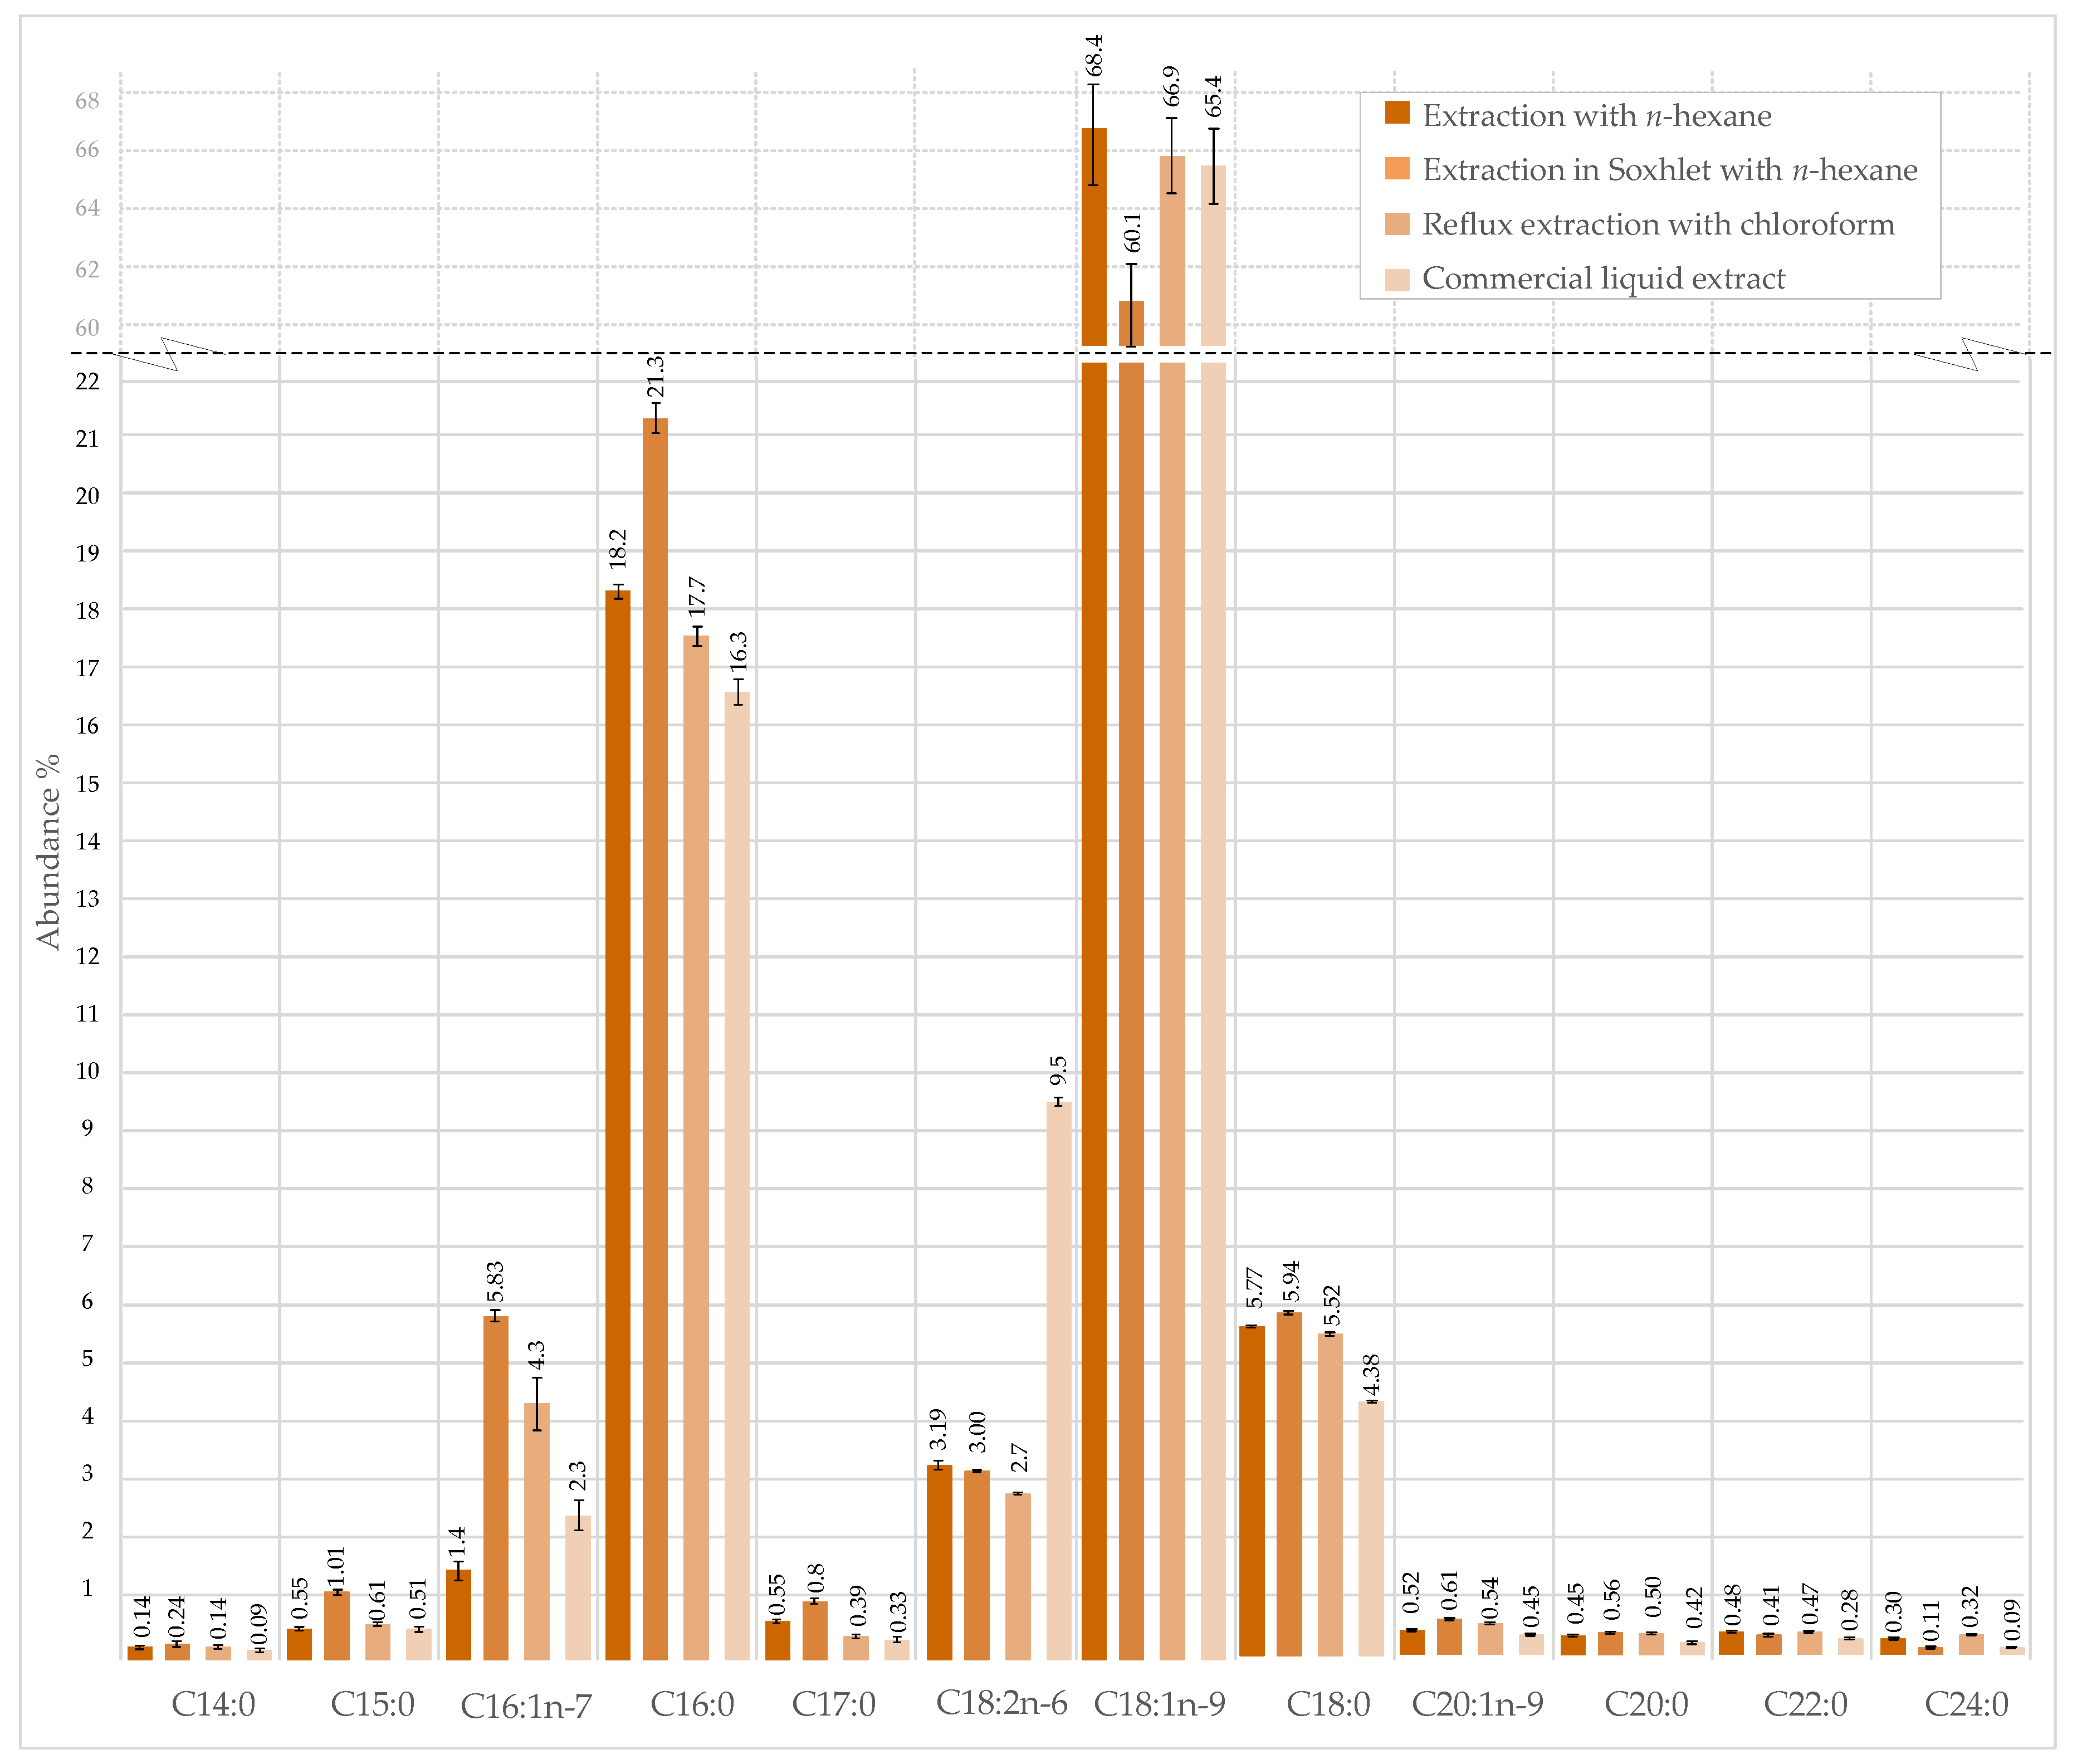
| C14:0 | Myristic acid | 0.14 ± 0.03 | 0.24 ± 0.06 | 0.14 ± 0.03 | 0.09 ± 0.04 |
| C15:0 | – | 0.55 ± 0.03 | 1.01 ± 0.05 | 0.61 ± 0.03 | 0.51 ± 0.05 |
| C16:1n-7 | Palmitoleic acid | 1.4 ± 0.15 | 5.83 ± 0.07 | 4.3 ± 0.4 | 2.3 ± 0.3 |
| C16:0 | Palmitic acid | 18.2 ± 0.15 | 21.3 ± 0.24 | 17.7 ± 0.21 | 16.3 ± 0.2 |
| C17:0 | Margaric acid | 0.55 ± 0.02 | 0.80 ± 0.03 | 0.39 ± 0.02 | 0.33 ± 0.03 |
| C18:2n-6 | Linoleic acid | 3.19 ± 0.03 | 3.00 ± 0.03 | 2.68 ± 0.03 | 9.5 ± 0.10 |
| C18:1n-9 | Oleic acid | 68.4 ± 0.97 | 60.1 ± 0.84 | 66.9 ± 0.90 | 65.4 ± 0.91 |
| C18:0 | Stearic acid | 5.77 ± 0.03 | 5.94 ± 0.04 | 5.52 ± 0.04 | 4.38 ± 0.03 |
| C20:1n-9 | Gadoleic acid | 0.52 ± 0.02 | 0.61 ± 0.03 | 0.54 ± 0.02 | 0.45 ± 0.03 |
| C20:0 | Arachidic acid | 0.45 ± 0.02 | 0.56 ± 0.05 | 0.50 ± 0.03 | 0.42 ± 0.04 |
| C22:0 | Behenic acid | 0.48 ± 0.02 | 0.41 ± 0.04 | 0.47 ± 0.02 | 0.28 ± 0.03 |
| C24:0 | Lignoceric acid | 0.30 ± 0.02 | 0.11 ± 0.03 | 0.32 ± 0.01 | 0.09 ± 0.03 |
| % Total FA 1 | % SFA ± SD 2 | % MUFA ± SD | % PUFA ± SD | |
|---|---|---|---|---|
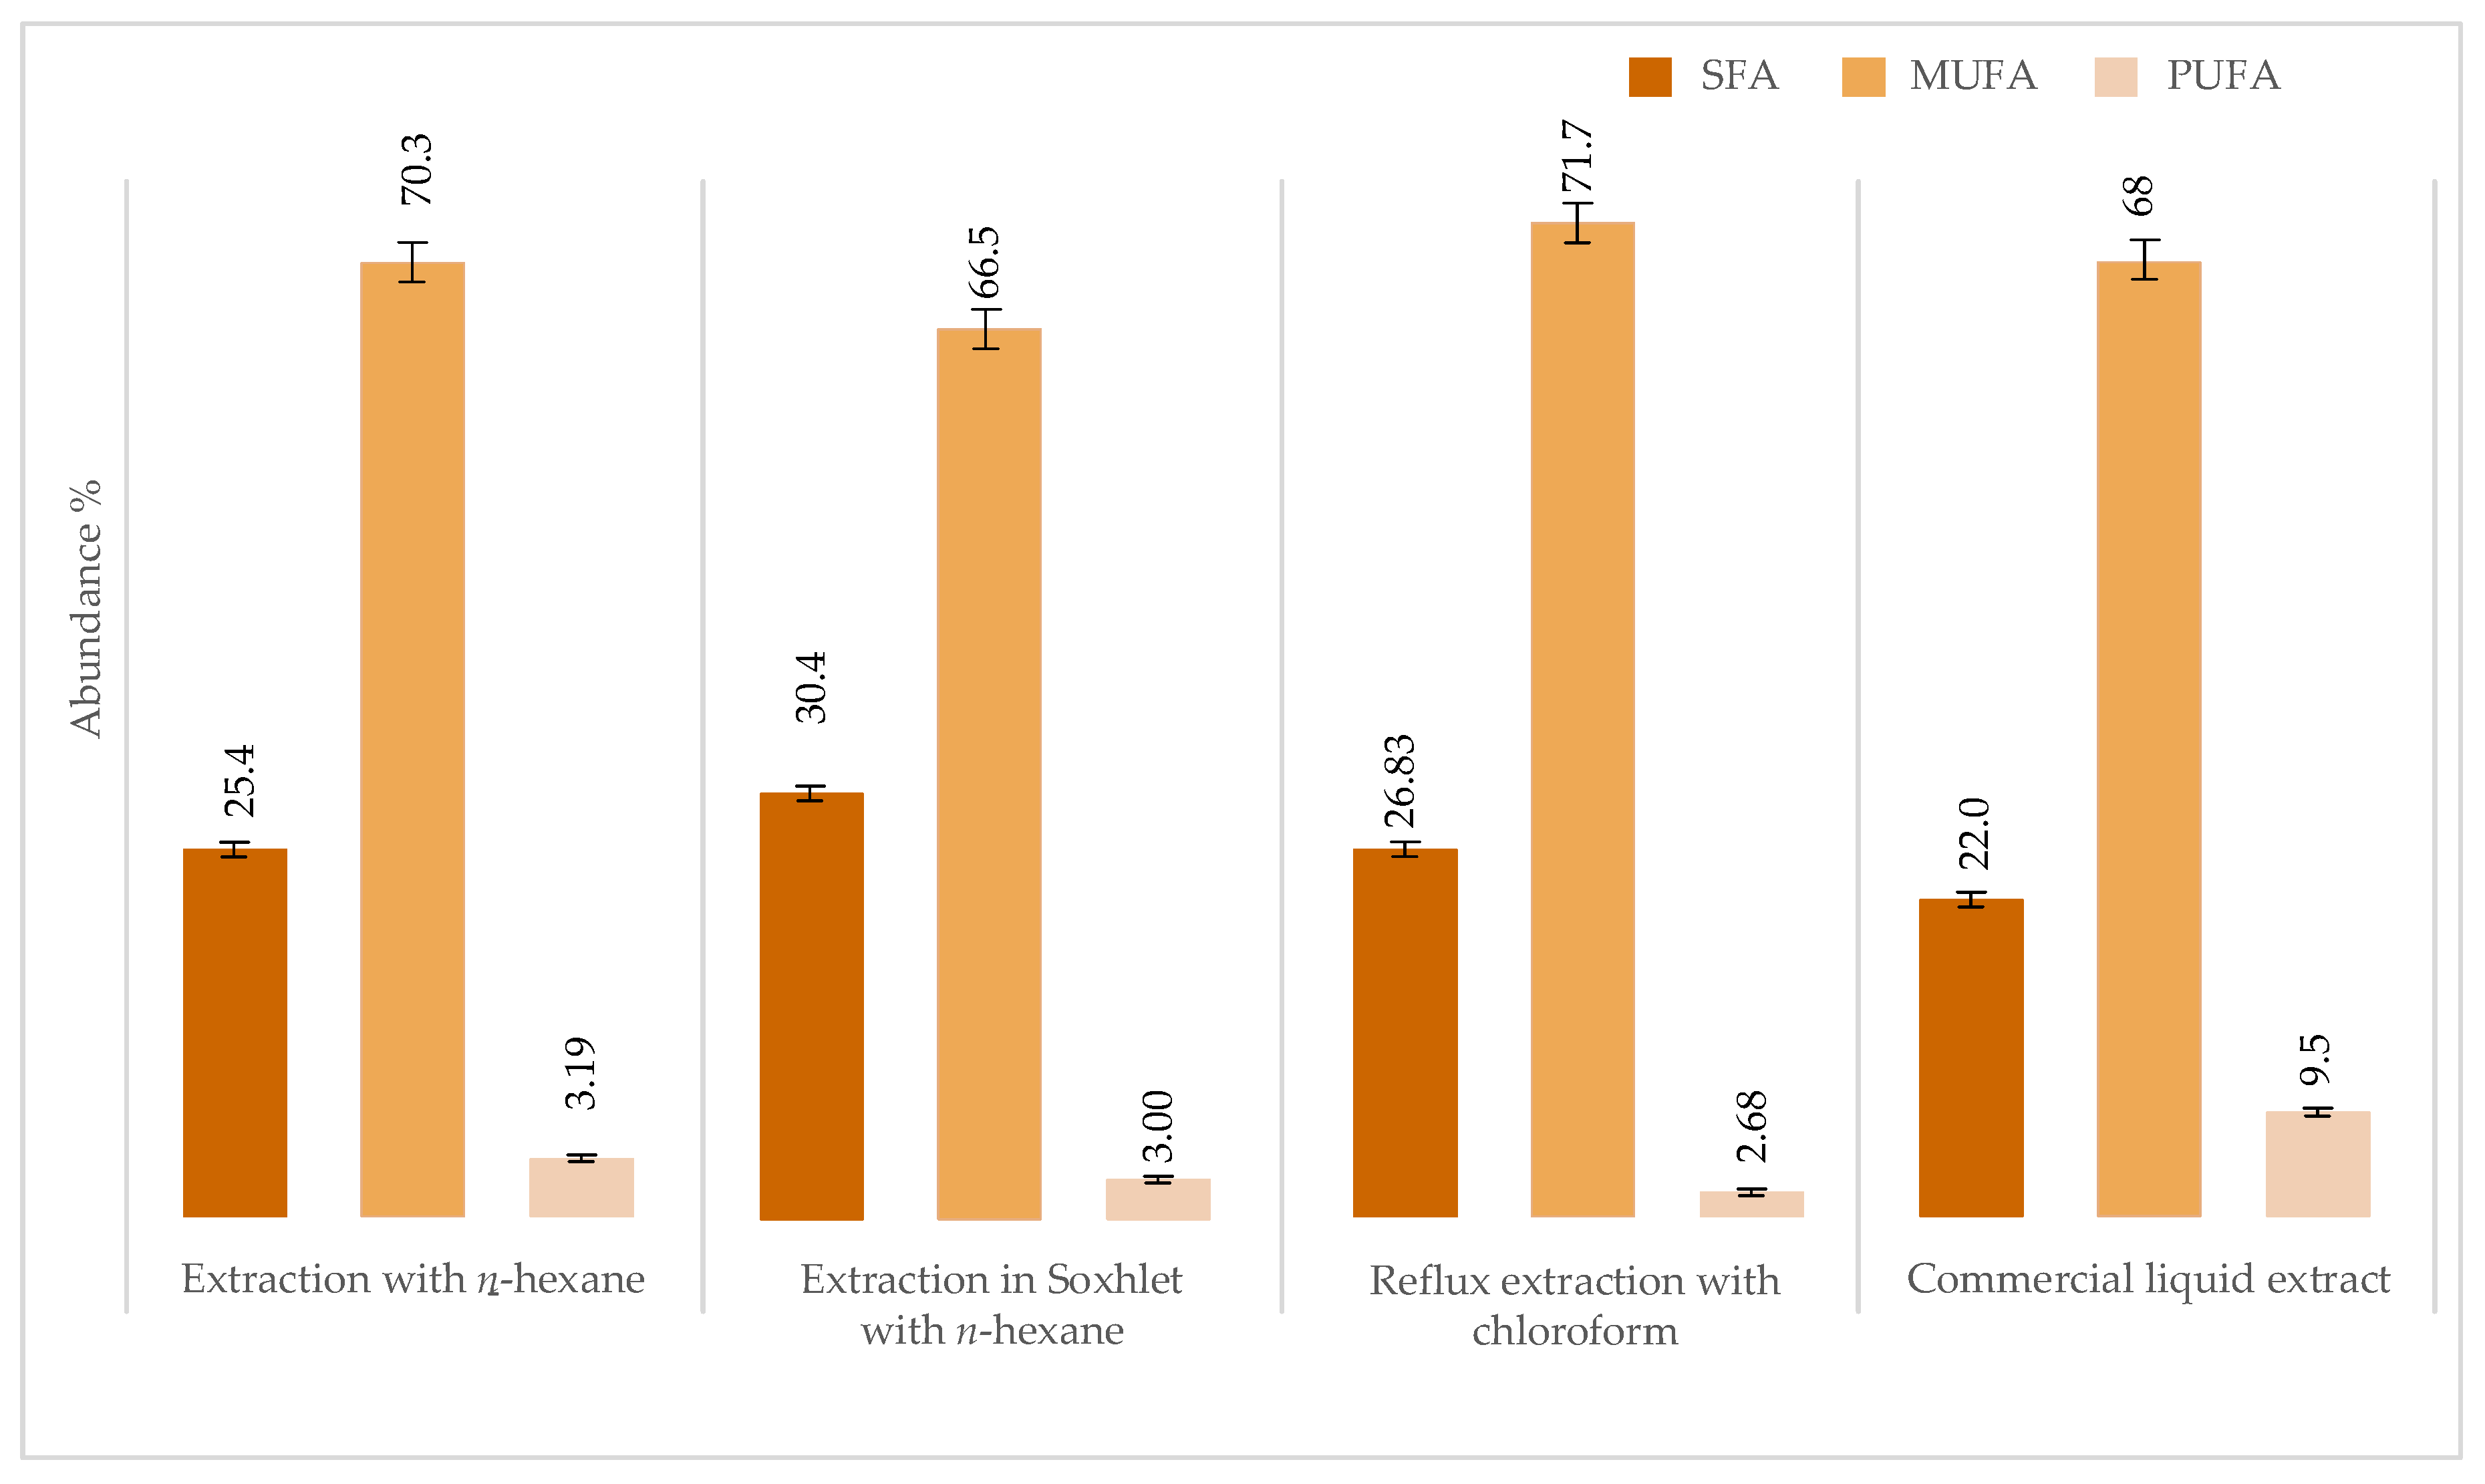
| Extraction with n-hexane | 26.43 | 26.4 ± 0.16 | 70.3 ± 0.98 | 3.19 ± 0.03 |
| Extraction in Soxhlet | 32.65 | 30.4 ± 0.27 | 66.5 ± 0.84 | 3.00 ± 0.03 |
| Reflux extraction with chloroform | 26.83 | 25.7 ± 0.22 | 71.7 ± 0.99 | 2.68 ± 0.03 |
| Commercial liquid extract | – | 22.0 ± 0.22 | 68 ± 1.00 | 9.5 ± 0.1 |
© 2020 by the authors. Licensee MDPI, Basel, Switzerland. This article is an open access article distributed under the terms and conditions of the Creative Commons Attribution (CC BY) license (http://creativecommons.org/licenses/by/4.0/).
Share and Cite
Salvatore, M.M.; Elvetico, A.; Gallo, M.; Salvatore, F.; DellaGreca, M.; Naviglio, D.; Andolfi, A. Fatty Acids from Ganoderma lucidum Spores: Extraction, Identification and Quantification. Appl. Sci. 2020, 10, 3907. https://0-doi-org.brum.beds.ac.uk/10.3390/app10113907
Salvatore MM, Elvetico A, Gallo M, Salvatore F, DellaGreca M, Naviglio D, Andolfi A. Fatty Acids from Ganoderma lucidum Spores: Extraction, Identification and Quantification. Applied Sciences. 2020; 10(11):3907. https://0-doi-org.brum.beds.ac.uk/10.3390/app10113907
Chicago/Turabian StyleSalvatore, Maria Michela, Alessandro Elvetico, Monica Gallo, Francesco Salvatore, Marina DellaGreca, Daniele Naviglio, and Anna Andolfi. 2020. "Fatty Acids from Ganoderma lucidum Spores: Extraction, Identification and Quantification" Applied Sciences 10, no. 11: 3907. https://0-doi-org.brum.beds.ac.uk/10.3390/app10113907