Review

Nanodiamonds: Synthesis and Application in Sensing, Catalysis, and the Possible Connection with Some Processes Occurring in Space

Department of Physics, University of Trento, Via Sommarive 14, 38123 Povo, Italy
*
Author to whom correspondence should be addressed.
Submission received: 22 May 2020 / Revised: 9 June 2020 / Accepted: 10 June 2020 / Published: 14 June 2020
(This article belongs to the Section Nanotechnology and Applied Nanosciences)

Abstract

:
The relationship between the unique characteristics of nanodiamonds (NDs) and the fluorescence properties of nitrogen-vacancy (NV) centers has lead to a tool with quantum sensing capabilities and nanometric spatial resolution; this tool is able to operate in a wide range of temperatures and pressures and in harsh chemical conditions. For the development of devices based on NDs, a great effort has been invested in researching cheap and easily scalable synthesis techniques for NDs and NV-NDs. In this review, we discuss the common fluorescent NDs synthesis techniques as well as the laser-assisted production methods. Then, we report recent results regarding the applications of fluorescent NDs, focusing in particular on sensing of the environmental parameters as well as in catalysis. Finally, we underline that the highly non-equilibrium processes occurring in the interactions of laser-materials in controlled laboratory conditions for NDs synthesis present unique opportunities for investigation of the phenomena occurring under extreme thermodynamic conditions in planetary cores or under warm dense matter conditions.

Graphical Abstract

1. Introduction

Nanodiamonds are diamond nanoparticles; they have most of the unique properties of bulk diamond but at a nanoscale. For this reason, nanodiamonds (NDs) have attracted a great deal of interest and, consequently, active research. These properties [1] include high hardness, the most known characteristic of the diamond-phase; high thermal conductivity and electrical resistivity; chemical stability; biocompatibility; a tunable surface structure; and resistance to harsh environments. These physical properties make NDs suitable for many applications in different fields: tribology, catalysis [2], biomedical applications [3], and drug delivery [4]. In the last decade, fluorescent nanodiamonds (NDs) have received a lot of attention.
The fluorescence of NDs is caused by point-defects in the diamond structure, known as color centers. The nitrogen-vacancy (NV) center is the most studied color center. This defect consists of a substitutional nitrogen atom in a diamond lattice site having a carbon vacancy as its nearest neighbor. NV centers exist in two charge states: neutral, NV0, and negatively charged, NV. Of the two states, NV is the most investigated and probably the most interesting in terms of quantum technology applications [5,6]. This is because of its optical properties. The NV shows bright and stable photoluminescence (PL) under excitation by visible light (usually a 532 nm laser source is used). The NV PL emission has a zero phonon line at 637 nm, with a sideband due to NV–phonon coupling extending to ~800 nm. The NV emission is highly suitable for many applications given its photostability (no bleaching is observed at room temperature) and short relaxation time (~10 ns) [7]. However, the most important property of NV optical transitions is their dependence on electron spin-states [8]. This means that NV fluorescence intensity changes in the presence of perturbations acting on the spin-state, such as electromagnetic fields. This, combined with the possibility of accurately manipulating the population of spin levels in the ground state, has allowed NV centers to be used as quantum sensors of environmental physical parameters with nanoscale precision, such as for magnetic [9] or electric fields [10], temperature [11] (from cryogenic to well above 300 K), pressure, as well as in harsh chemical environments. These sensors can be used in biological material given NDs’ non-toxicity. Measurements of temperature [12] and magnetic/electric fields [13] with NV-enriched NDs have already been reported. Additionally, as NDs can be chemically attached to a large variety of species (from DNA molecules to proteins) [14], NV-fluorescence can be used to track the position of the macromolecules [15]. Moreover, NDs linked to cell membranes could provide a sensor to study cell activity [16]. Furthermore, spin-dependent fluorescence intensity can be used to read-out the NV spin-state [17]. This property, together with the possibility of optically pumping most of the electrons in specific spin-sublevels with very large spin-coherence lifetimes [18] (as long as milliseconds), makes NV centers an ideal solid-state qubit for quantum information science. Finally, it was shown that the NV spin polarization can be transferred to the surrounding environment [19], such as 13C nuclear spin, opening the potential for use in nuclear magnetic resonance (NMR) applications [20].
Given the wide application field of NV-enriched NDs, an efficient technique for their synthesis is critical for further development. Many ND production methods have been proposed, the main ones being detonation [1] and milling [21] of macroscopic diamond synthesized either by chemical vapor deposition (CVD) or high pressure, high temperature (HPHT). These standard techniques, however, present common drawbacks: The control of the size and shape of NDs is poor, and the synthesis process often introduces contaminants, thus requiring post-production processes to clean ND surfaces (usually strong chemical treatments are required) [22]. Moreover, the nitrogen doping of the NDs, which is the first step to obtain NV centers, is inefficient, since only the native nitrogen atoms in the carbon precursor are exploited, resulting in NDs with a small density of NVs. To increase the NV number, a multi-step, post-synthesis treatment of the NDs is required, consisting in nitrogen ions implantation and subsequent annealing at high temperatures to create the NV center [23]. An alternative means of NDs production is represented by pulsed laser ablation (PLA). PLA is a standard top-down technique for the synthesis of a wide variety of nanoparticles [24]. It consists on irradiating the surface of a bulk target with short (ps, ns) and intense (GW cm−2) laser pulses; the nanoparticles are mainly formed in a well-known physical phenomenon called phase explosion [25] or collisional cooling. Indeed, PLA can be performed in different environments, both liquid or gaseous, to cause chemical reactions between the ablated species and the atoms of the confining medium. When PLA is performed on a graphite target, the extreme thermodynamic conditions reached during laser irradiation, namely high temperature and pressure, allow for the transition of the nanodroplets expelled from the surface from liquid carbon into diamond. As is reported in this review, when laser ablation occurs in a nitrogen containing medium, direct synthesis of NDs containing NV centers is achieved. Standard production techniques will also be reviewed together with the applications of these NDs-based systems. In detail, the first part of this paper describes NDs synthesis techniques, focusing on the ones used for commercial production of NDs. Moreover, standard synthesis of fluorescent NDs is reported, together with the latest updates, in particular, regarding laser-assisted synthesis methods. The second part details the application of fluorescent NDs as sensors for environmental parameters, such as electromagnetic field and temperature. The subsequent section reviews the results obtained in catalysis by using NDs, where the number of investigated reactions is still limited, but the potential interest for these materials is high. Finally, the last section discusses an open astrophysical problem, the so-called extended red emission, and its possible relation with fluorescent NDs. The production of fluorescent NDs with PLA techniques allows us to establish the pressure and temperature conditions necessary to obtain these nanosystems for study, in addition to the correct relative composition of carbon and nitrogen. The study of these specific conditions is more difficult when using traditional techniques.

2. Nanodiamonds Synthesis Techniques

It is well known that the stable allotrope of carbon at ambient pressure and room temperature is graphite. As can be seen in the carbon phase diagram of Figure 1, diamond requires extreme conditions of temperature and pressure to be formed. For instance, natural diamond may be formed in the Earth’s mantle, 140−200 km below the surface [26], where the temperature and pressure are in the range of 900−1400 °C and 4.5−6 GPa, respectively [27]. Once the diamond phase is formed, the transition back to graphite at ambient conditions is avoided by the high energy barrier for phase transition. Indeed, even if graphite is thermodynamically favored (energy difference of 0.02 eV per atom between diamond and graphite), a 0.4 eV energy barrier must be overcome to move from sp2 to sp3 chemical bonds. This makes diamond a metastable phase, as it is thermodynamically unstable, but the transition kinetics to graphite is prohibitive. Currently, many different methods for artificial synthesis of NDs are available [1]. In the following sections, the three main techniques commercially available are described: detonation, chemical vapor deposition (CVD), and milling of high-pressure, high-temperature (HPHT) micro-sized diamonds.

2.1. Detonation Synthesis

In detonation synthesis, the energy of an explosion is used to drive the diamond phase formation [28]. In a closed metallic chamber, explosives with a negative oxygen balance are detonated; usually a mixture of 60% TNT (C6H2(NO2)CH3) and 40% hexogen (C3H6N6O6) is employed (Figure 2) [1]. The carbon atoms that eventually form the NDs are provided either by the molecules of the explosives or by precursor graphite put inside the detonation chamber. The synthesis is called “dry” or “wet” when the chamber is filled with a gas (N2, Ar, CO2) or with water (ice), respectively, that act as coolants. The cooling media play an important role in the carbon yield, which is usually around 10% of the explosive weight [29]. The process leading to NDs formation is schematized in Figure 2. After detonation, the carbon atoms released during the explosive molecule’s dissociation condense and crystallize into nanoclusters [30]. The pressure/temperature increase (Figure 1) reached in the chamber during the detonation leads to crystallization of the carbon nanoclusters into diamond phase. Finally, the formed NDs grow and agglomerate, resulting in NDs of size 4−5 nm. The main drawback of this technique is that the resulting sample, called detonation soot, must be purified to remove contaminants. Indeed, detonation soot is not only made of diamond phase, but also of non-diamond carbon (25–85 wt %) and metals coming from the wall of the chamber (1−8 wt %) [31]. To remove the impurities, cleaning of the detonation soot in a strong acid environment (usually a mixture of HNO3/H2SO4/HClO4) is required [28], which is a dangerous and expensive process. Another problem is NDs agglomeration occurring during synthesis, where NDs clusters of several hundreds of nanometers are obtained. To isolate the single 4−5 nm sized NDs, milling with ceramic microbeads (that again introduces contaminants) or ultrasonic disintegration are the standard de-aggregation methods [32].

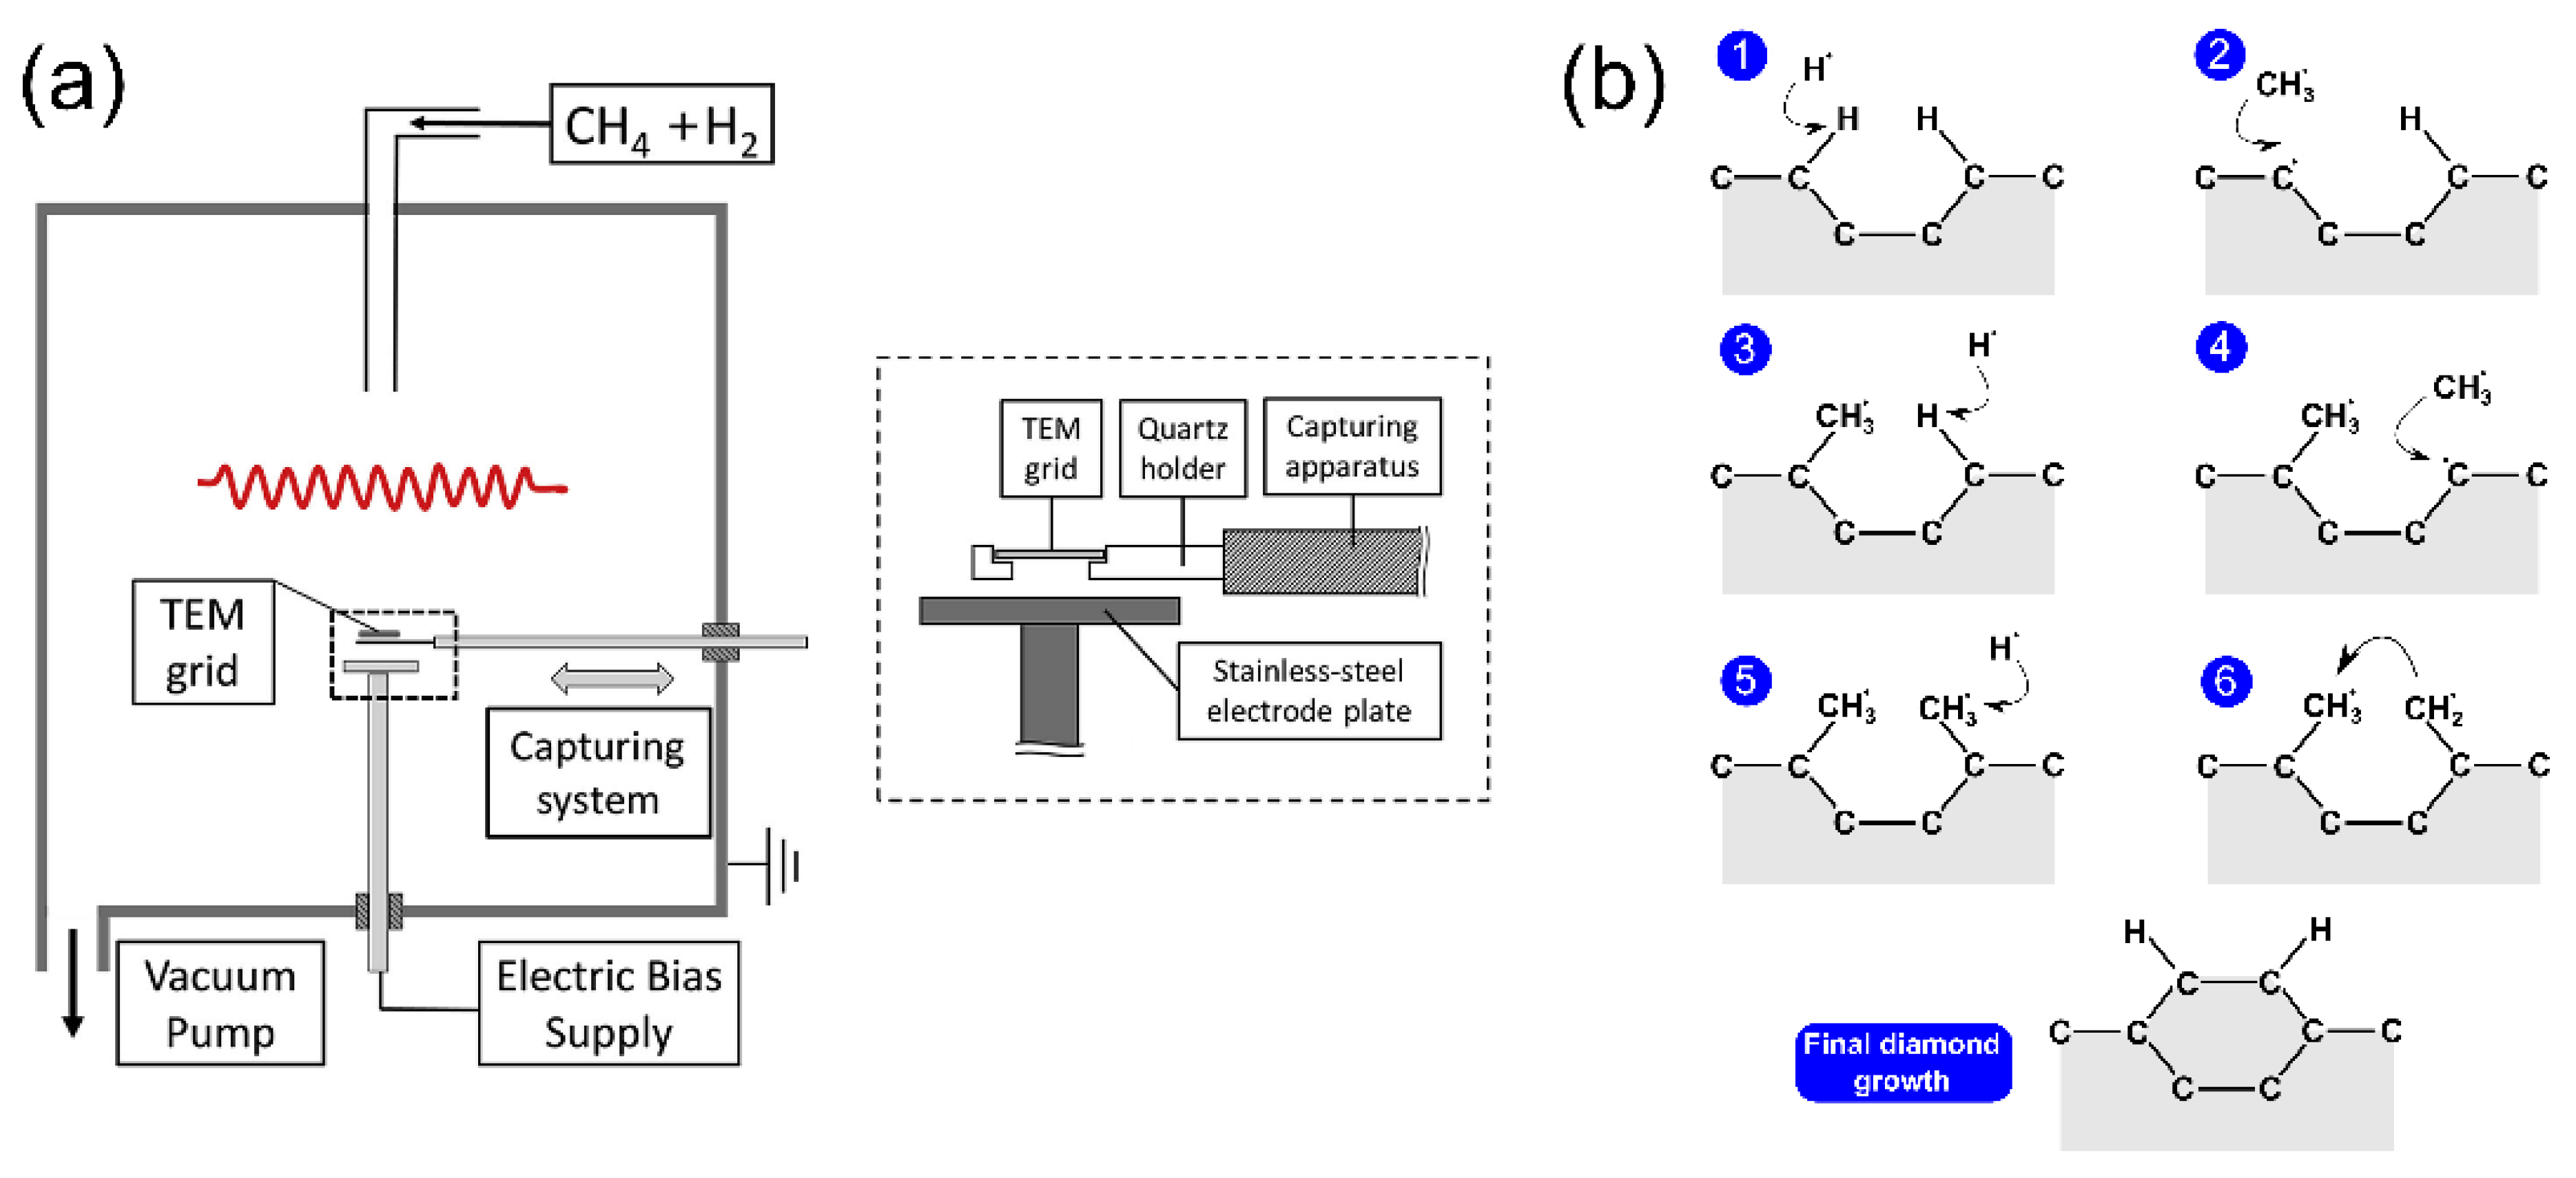
2.2. Chemical Vapor Deposition (CVD)

Chemical vapor deposition is one of the most popular methods for the deposition of thin film, and it has been used for the synthesis of nanocrystalline diamond film [33]. In detail, the deposition of carbon atoms occurs during decomposition of a gas mixture with a carbon containing species, usually methane CH4, in an excess of hydrogen. The gas phase is decomposed by using a hot filament or a microwave plasma to form radicals such as H and CH3, which are essential for diamond growth. The ND film forms on a substrate, typically a silicon wafer coated with a micrometer sized diamond powder acting as a seed for ND nucleation [33], and eventually forms a continuous film. The typical set-up [34] for CVD synthesis is reported in Figure 3a. The size of the grains composing the film ranges to tens of micron down to a few nanometers, depending on CH4/H2 relative concentration [35].
A weak concentration of CH4 produces microcrystalline diamonds, whereas a high value of the CH4/H2 ratio decreases grain size to the order of tens of nanometers for 1−5% CH4/H2. The standard diamond growth mechanism [35] is schematized in Figure 3b. Carbon atoms at the surface of diamond seeds are left with dangling bonds after hydrogen abstraction by H radicals. These bonds are then filled by CH3 molecules. When this process takes place in two adjacent sites, the new carbons can bond together, and finally be locked into the diamond lattice.

2.3. Milling of High-Pressure, High-Temperature (HPHT) Microdiamonds

The HPHT synthesis technique resembles the natural process of diamond formation, where a carbon precursor, usually graphite, is brought to a state of high pressure and high temperature. Inside a chamber, the temperature is brought to ~2000 °C and a set of anvils increases the pressure up to several GPa [36]. This technique allows for the formation of bulk or microdiamonds, which must be milled to obtain NDs [21]. The milling process does not allow for good control of nanoparticle size and shape [37], so additional work-up is required. For instance, an acid treatment to remove the contaminants coming from the milling process or centrifugation and filtration to isolate NDs with a narrower size distribution.

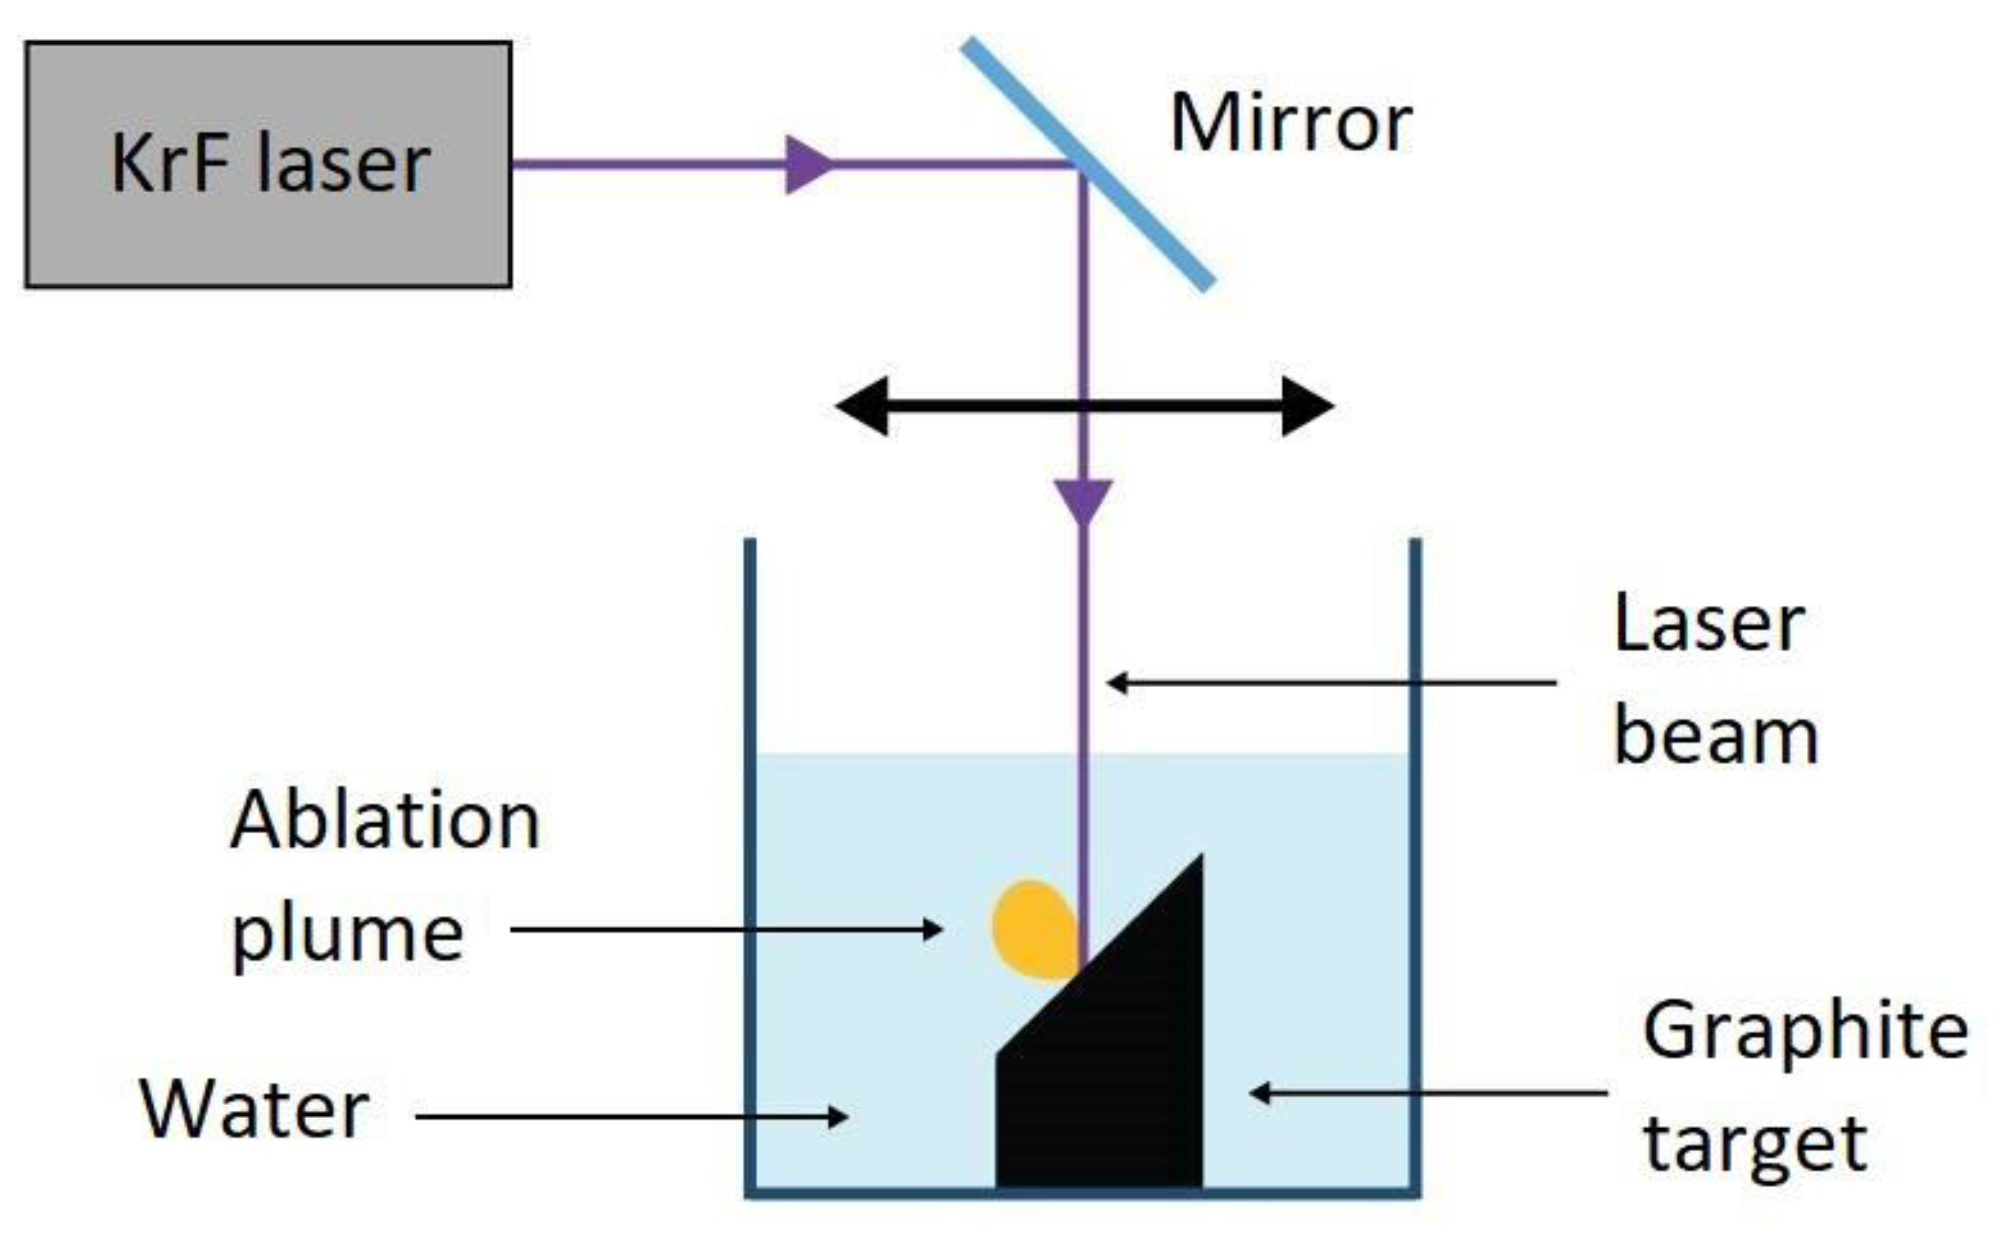
2.4. Pulsed Laser Ablation

Starting from the pioneering work of Yang et al. [38], PLA has become a viable method for the synthesis of NDs. A standard PLA experimental setup for NDs is given in Figure 4. The laser beam is focused on the top surface of a graphite target that is immersed in a liquid, which is typically water, but NDs production has been observed in other liquid environments, such as cyclohehexane [39]. A pulsed laser is used in order to release an extremely high power on the target; usually, laser pulses in the ns region with energies in the order of 100 mJ, for a final power density of up to GW cm−2, are employed.
In pulsed laser ablation, the water plays a double role; it is a medium, where nanoparticles are suspended and collected during ablation, and it confines the ablation plume, which favors the diamond-phase formation. Indeed, the presence of a confining layer in front of the target is a fundamental aspect of the transition from sp2 carbon atoms of graphite to sp3 hybridization of the diamond phase. The details of the formation mechanism are provided in [40,41]. The synthesis of NDs upon the PLA of graphite in water occurs in three steps:
  • The absorption of the high power laser pulse induces melting of the graphite surface. As the laser energy is deposited in a short timescale, the target surface rapidly becomes a superheated liquid. When the temperature of this liquid reaches a value of about 90% of the critical temperature, TC, a process known as phase explosion occurs [25], leading to the ejection of nanodroplets [42] that eventually turn into nanoparticles after solidification.
  • Strong vaporization of the graphite target and phase explosion lead to the emission of a plasma plume containing the ablated material; inside the liquid, a state of extreme thermodynamic conditions of temperature and pressure is created, of 5000–6000 K [43] and 2–4 GPa [41,44], respectively.
  • The last step concerns the cooling of the ablation plume. Due to the confinement effect, the ablation plume dissipates excess heat very efficiently through collisional cooling with the liquid molecules, resulting in a short quenching time. The fast cooling rate is the most peculiar characteristic of laser ablation in liquid, which can be in the order of 1010–1011 K s−1 [45]. This strong and fast reduction in the temperature is enough to produce the carbon nanodroplets in an undercooling regime in a few nanoseconds. In this condition of undercooling, NDs form as a metastable phase, starting from the nanodroplets expelled by phase explosion. The transition to the thermodynamic stable allotrope of carbon, namely graphite, is prevented by the rapid quenching; the metastable phase is literally frozen under the undercooling action.
Figure 5 shows the characterization of NDs produced through the PLA of graphite in water as reported in [40].
PLA for NDs synthesis presents some advantages compared to the standard production processes, such as HPHT or detonation. For instance, the sample is not contaminated by metallic impurities that require harsh chemical purification. NDs produced by laser ablation only require removal of the graphitic shell covering the nanoparticles. Indeed, when the temperature and pressure conditions inside the ablation plume are no longer the ones required for diamond phase formation, a sp2 shell forms around the NDs. An efficient and simple way to remove the shell was found by Osawa Osswald [31]; it consists of air oxidation at ~400 °C. Furthermore, the main advantage of PLA for NDs production is the possibility of achieving diamond phase formation with a simple and cheap experimental apparatus, and performing the synthesis process at ambient pressure and temperature conditions.

2.5. Nanodiamond Purification Methods

Work-up and post-processing procedures aimed at purifying reaction products are often a critical step in the synthesis of NDs. Several methodologies have been developed to cope with the two most common and abundant contaminants: other forms of carbon (mostly graphitic) and metals and their oxides.
For the carbon contaminants, the common principle underlying purification is selective oxidation, exploiting the higher reactivity of sp2 carbon with respect to the sp3 carbon of the diamond phase. Examples are the above mentioned oxidation in air reported by Osawa Osswald [31], which was further investigated in a subsequent paper [46] where selectivity towards sp2 carbon was achieved by keeping the temperature in the range of 400–430 °C. This procedure provides a simple and effective solution for the case of PLA NDs where, even though metallic impurities are avoided, the sp2 carbon fraction can be so high as to actually be the main reaction product. A similar method, but employing boric anhydride to enhance selectivity, was also reported [47]. Another route that has been explored is oxidation with ozone-enriched air [48,49,50], though these procedures require significantly more complex equipment.
Liquid-phase oxidation reactions are by far the most commonly employed procedures. These generally require strong acids, which provide the additional advantage of also removing some metal-based impurities. Examples include HClO4, concentrated HNO3, H2SO4 alone and in combination with HNO3, HCl in combination with HNO3, and HF [29,51,52,53]. These treatments require temperatures from 80 °C to more than 200 °C, thus, specialized equipment is needed that adds to the complexity and cost. Yet, this is necessary, especially in the case of detonation NDs, where metal-based impurities are present in significant quantities, coming from the equipment involved in these processes, such as steel detonation chambers. For a comprehensive review, though it is focused on detonation NDs, the reader should consider Aleksenskii [54].

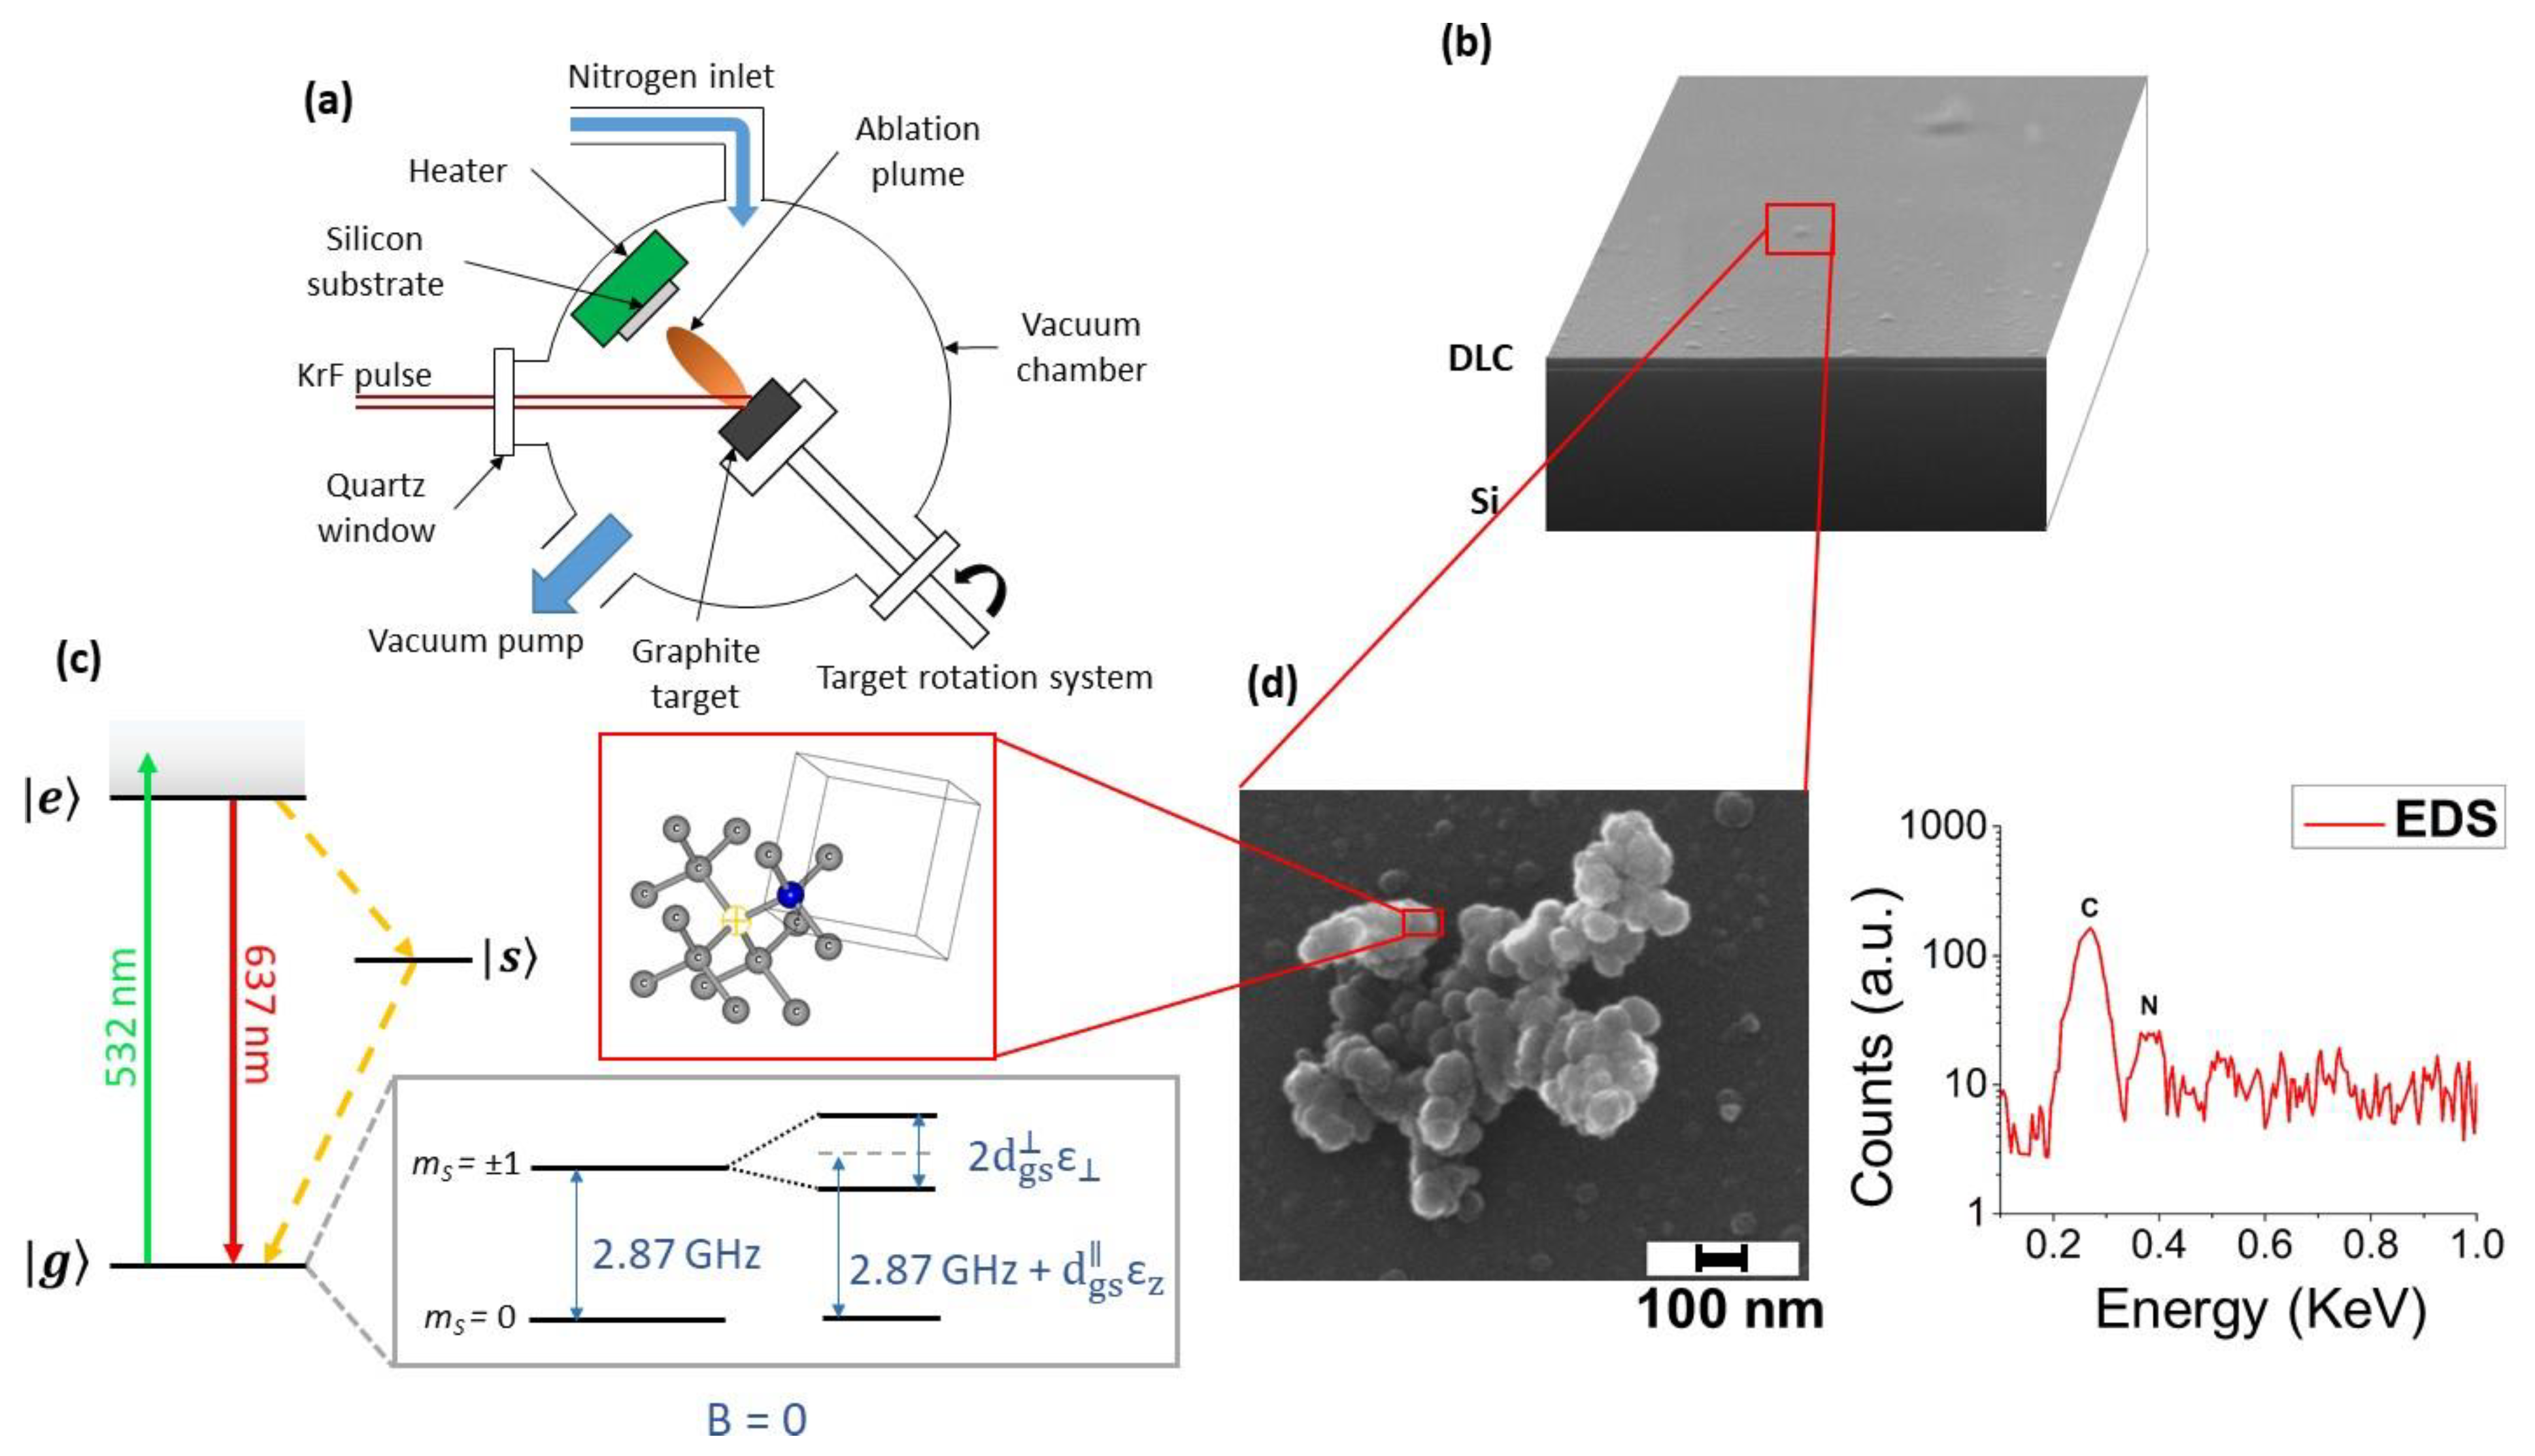
2.6. Synthesis of Nitrogen-Vacancy (NV)Centers-Enriched Nanodiamonds (NDs)

Recently, Reineck et al. [55] reported the observation of NV emissions from unprocessed detonation NDs, with a brightness comparable to what is obtained with highly processed fluorescent 100 nm HPHT NDs. Moreover, diamond CVD synthesis of highly-oriented NV centers was reported [56], with the possibility of crushing fluorescent bulk diamond into NDs [57].
Despite that, the standard way to produce NV-centers-enriched NDs is a complex, multi-step, and expensive process. Synthetic HPHT diamonds typically contain 100 ppm of nitrogen atoms as an impurity in the diamond structure [58] and to form NV centers, vacancies are created in the lattice by high-energy particle irradiation (electrons, protons, He+) followed by a vacuum annealing at 700–1000 °C [59]. The role of the annealing is to increase the mobility of the nitrogen atoms inside the lattice, which are then trapped by the carbon vacancies to form NVs. One could directly irradiate NDs to increase the NV-fluorescence, but it has been proven by density functional theory [60] and Monte Carlo simulations [61] that NV concentration increases non-linearly with crystal size. In particular, the probability of forming NV centers in 5 nm sized NDs is 4.5 and 25 times lower compared to 20 and 55 nm NDs, respectively [61]. Thus, it is more efficient to increase NV concentration in micro-sized diamonds and then reduce their size to obtain fluorescent NDs. This was done by Boudou et al. [23], in what has become the standard fluorescent NDs synthesis technique. The procedure is shown in Figure 6. The starting material is HPHT-synthesized microdiamonds that are then irradiated with a 10 MeV electron beam to form vacancies. The following step is annealing at 750 °C to form fluorescent microdiamonds. The next step is the reduction of diamond size, achieved by nitrogen jet milling and ball milling to obtain NDs with a crystal size smaller than 10 nm. For bioimaging, which is the main field of application for fluorescent NDs, the number of NV centers should be as high as possible. For this reason, only HPHT diamonds that contain a relevant amount of nitrogen impurities are used. In contrast, CVD diamond films contain a very small number of nitrogen atoms [62]. Consequently, highly fluorescent NDs are not produced by this mechanism; rather CVD is used to produce nanocrystalline diamond films with single NV centers, suitable for quantum information technologies.

2.7. Fluorescent NDs Synthesis by Pulsed Laser Ablation

PLA has been demonstrated to be a promising process for the direct synthesis of NV-enriched NDs. Narayan et al. [63] achieved synthesis of NV-doped diamond in the form of single-crystal nanodiamonds, nanoneedles, microneedles, and thin films by pulsed laser irradiation of N-doped carbon film. Diamond phase formation is obtained through conversion of the sp2 carbon atoms through rapid melting in a super undercooled state and consequent quenching at ambient temperatures and pressures in air. Recently, we demonstrated direct synthesis of NV-centers-enriched NDs through the PLA of graphite in two different nitrogen-containing media: controlled nitrogen atmosphere [64] and liquid nitrogen [65]. In the first case, graphite is laser ablated inside a vacuum chamber filled with 1 Pa of nitrogen gas, and the ablated material deposits onto a silicon substrate. The resulting sample is a diamond-like carbon (DLC) film embedded with the fluorescent NDs (Figure 7).
In the case of ablation in liquid nitrogen, the NDs are directly dispersed into the liquid medium. In both cases, NDs show intense native photoluminescence (PL) without the need of post-synthesis thermal activation or additional procedures. Proof of NV centers formation is obtained through optically detected magnetic resonance (ODMR), reported in Figure 8, for synthesis in liquid nitrogen.
The mechanism responsible for ND formation is the same reported in Section 2.4. The whole graphite–liquid–diamond transition is represented by the purple arrow in the carbon phase diagram [41] in Figure 9a. The tilted red lines indicate the region where undercooled liquid carbon and metastable diamond coexist, referred to as a “diamond-like” liquid [66]. The transition to diamond phase occurs because in this thermodynamic condition, the energy barrier for diamond formation is lower than that for graphite formation [67]. It is important to note the presence of atomic nitrogen, which is required for NV-centers formation. The energy of the atoms, ions (from C+ to C4+), and electrons leaving the laser ablated target can be higher than 100 eV for the typical laser fluence used [68]. This energy is enough to break the N2 molecules, having a bond dissociation energy at room temperature of 9.79 eV. Thus, the ablated energetic species can easily break N2 molecules, and single N atoms may be trapped inside the nanodroplets expelled from the graphite target. Interestingly, we performed a comparison between these two methods (ablation of graphite in gas and liquid nitrogen) in term of the total PL emission of the produced sample (Figure 9b,c).
The results, shown in Figure 9d, prove that the LN2-NDs present a PL emission intensity (7000 ± 2000 a.u.) that is more than one order of magnitude higher with respect to DLC-NDs (400 ± 100 a.u.). The explanation of this larger NV-enriched ND production efficiency can be related to the different conditions attained inside the ablation plume. In particular, a strong sp2 contamination of the NV-enriched NDs surface is observed for laser ablation in a gaseous environment [65] due to both lower pressure and smaller cooling rates achieved in the ablation plume.

3. Optical Sensing with NDs

The reason behind the quest for fluorescent NV-NDs resides in the peculiar properties that such a point-like color center possesses. In fact, the NV-related fluorescence is strongly influenced, even at room temperature, by surrounding electrical and magnetic fields as well as by local environmental parameters such as temperature. The dependence of the electronic energy levels on the surrounding electromagnetic fields or temperature is responsible for such behavior. Panel (c) of Figure 7 shows how the ground level population is responsible for the activation of the more or less efficient fluorescent recombination processes after green optical pumping of the electronics states. In this section, we review the main sensing capabilities of NV-NDs [69,70,71,72,73,74,75,76,77,78,79].

3.1. Magnetic Sensing

Magnetic field sensing with commercial NV-NDs has been demonstrated to detect feeble magnetic fields with a limit of sensitivity down to ≈ nT/ Hz [13,18]. The spatial scale involved within this detection scheme is potentially a nanometric one, and this astonishing spatial resolution is inherently due to the point-like nature of the NV color center and to its nm-proximity to the ND surface. The interest in measuring nanometrically-resolved tiny magnetic fields is strong, and a few examples include their use for measurement of in-vivo neuronal activity [11], blood hemoglobin oxygenation [80], or more generally non-invasive biological measurements of intra-cellular moving charge states. The basic idea and the experiments behind such detection schemes are reported in Figure 10.
NV-NDs are good candidates for biological magnetic field sensing due to the B-sensitivity they offer. A continuous wave electron paramagnetic resonance (CW-EPR)optically-detected magnetic resonance (ODMR) B-detection scheme capable of sensing magnetic fields down to few mT was recently demonstrated (Figure 11) [82].
Another interesting magneto-optical application of commercial NDs is related to the magnetic modulation of the red NV-fluorescent signal, allowing for background-free imaging of the fluorescence of complex biological systems containing NDs, where the sensing characteristics of NDs are exploited to filter out the target fluorescence signals. As evidenced by [83], the magnetic modulation achieved by [84] allowed for the creation of high-contrast imaging of NV-PL in high background environments (see Figure 12 for more details).
The cutting edge of research in the field of opto-magnetic imaging of NDs is represented in the work by the authors of [86], who successfully monitored the position of fluorescent NDs by using them as beacons for the early diagnosis/imaging of tumors via their positioning inside biological tissues. The NV center is suitable for intra-tissue imaging because it emits fluorescence in the near-infrared. Nearly 70% of its light emission lies in the near-infrared (NIR) window from 650 to 1350 nm (Figure 13) [87], where light has the maximum penetration depth in biological tissue [88].
Fluorescent commercial NDs where observed with optically detected magnetic resonance (ODMR) imaging through 1.5 to 5 mm thick sections of breast tissue of chicken. The idea behind this imaging scheme is to detect the 0-magnetic-field fluorescence signal, slicing the biological tissue with B gradient, as in normal magnetic resonance imaging, but collecting the red NV B-dependent fluorescence, see Figure 14. It is clear that the main advantage of fluorescent NDs with respect to a normal MRI is that the first one pumps and collects optical waves (with a potential resolution close to the wavelength of observation, i.e., sub-micrometric resolution) whereas in the usual MRI, the RF pumping and collection limits the resolution to millimeters. In the case of tumor diagnosis/imaging, this can mean earlier observation of the insurgence of the illness.
Other magnetic detection schemes with NDs have been demonstrated, and comprehensive lists can be found in References [89,90,91,92,93,94,95,96,97,98,99].

3.2. Electric Field Sensing

The electric field sensing capability of the NV-NDs is related to electric-field-dependent shifts in energy levels [10]. The Stark shift in the excited triplet states of NV centers was detected at low temperature [100], and the ground state Stark shift of NV ensembles was proven at low temperature [101]. A voltage [10] was applied to a gold layer deposited on a bulk diamond sample containing NV centers, to generate the electric field (see Figure 15b). To generate and orientate the applied magnetic field, two Helmholtz coil pairs (x-y axes) and a single coil (z-axis) were used. A set of coils, fabricated as part of the gold layer, generated the resonant microwave field. To measure the shifts of spin sub-levels induced by the electric field, the electron spin resonance transition between the ms = 0 and ms = ±1 sub-levels in the triplet ground state of the NV center was optically detected. Upon application of an electric field of ca. 1000 V/cm, resonance line shifts of 28.4 kHz were observed. The final estimated electric field sensitivity was 202.6 V cm−1 Hz−0.5.

3.3. Temperature Sensing

ODMR is very useful for testing the temperature sensing properties of NV centers in diamond and ND. Both the spin resonance and coherence time of the NV center are sensitive to the variations of temperature at the nanoscale [16]. In Reference [102], the ODMR spectra of single 100-nm NDs under a green laser pump (Figure 16a,b) were measured, and temperatures with a precision of 0.1 K were demonstrated (Figure 16c). The local nano-sources of heat were gold nanoparticles independently laser-heated and made to interact with the fluorescent NDs (Figure 16b). More complex magneto-optical detection schemes demonstrated that fluorescent NDs can achieve temperature sensitivities down to the 1 mK Hz–1/2 regime [102,103,104]. These results prove that the NDs are among the most sensitive temperature probes known.
Some other temperature sensing schemes have been demonstrated, and selection of them can be found in [105,106,107,108,109,110].

3.4. Other Implementations of NV-NDs

Local, environmental, mechanical stress acts as a strain field on the fluorescent PLA NDs that can be detected via ODMR as an additional source of the ODMR fluorescence dip splitting. We demonstrated in [64] that such a field is well explained by taking into account the spin-Hamiltonian of the NV center with the added of a potential term, Vgs, which accounts for the interaction of the NV center with the local strain field e. Strain fields down to 10−5 were detected and good compatibility with Raman peak shifts was proven. Figure 17 reports the wide-field ODMR where micrometric-sized regions-of-interest (ROIs) can be extrapolated in ODMR curves [64].
NDs are able to determine the structure of single proteins like ferritin. Ermakova et al. [111] where able to detect the presence of ferritin molecules on the NDs’ surface via the increased magnetic relaxation experienced in such a situation compared to uncoated NDs. The strongly fluctuating spin bath created by the ferritin coating at room temperature made the spin relaxation time (T1) of the NV center relax 10 times faster than that of the uncoated NDs, see Figure 18. It is worth mentioning here that single Gd ions have been detected on the surface of NDs with this technique [112].
To conclude this section on sensing by NV-containing NDs, we want to underline that PLA NDs permit “doping” of the NDs with, for example, silicon, germanium, or other dopants, by using doped graphite targets. This will contribute to the exploration of other emission spectral regions (see Figure 19), which could open a wealth of new sensing opportunities.

4. Nanodiamonds as Catalysts

NDs recently attracted attention in the catalysis field where they have been investigated in two main roles: as a support material to be functionalized with a catalyst or as a proper catalyst material. In the former case, NDs are attractive due to their chemical and mechanical stability, large surface area, and relatively easy surface functionalization, allowing them to load a variety of catalysts. The catalysis function is then only loosely influenced by the NDs’ properties and this body of literature will not be considered here. For a recent review we point the reader to Campisciano et al. [114]. The following section will instead be focused only on those investigations where NDs are reported as catalyst materials themselves. Catalysis by NDs has been reported for a few reactions of industrial interest, including oxidative dehydrogenations and dechlorination reactions. Recently, conductive NDs were also considered as electrocatalysts for CO2-reduction schemes with promising results.
Dehydrogenation of ethylbenzene is the main route for the industrial synthesis of styrene, employed for more than 80% of its production worldwide [115]. Styrene is then used to obtain a variety of specialty polymers applied as resins, synthetic rubbers, and plastics. The process generally involves a Fe2O3 catalyst and requires superheated steam to limit an otherwise rapid catalyst poisoning by carbon-based species. [116]. When investigated as an alternative catalyst, NDs compared favorably with respect to the benchmark, providing longer duration without requiring superheated steam [117]. The activity was attributed to high surface area and to a partially-ordered geometry promoting reagent adsorption. However, the NDs employed were powders from detonation synthesis, which are of limited industrial interest due to incompatibility with fixed-bed configurations. Steps towards solving this issue by immobilizing NDs were taken by using a SiC foam [118] or few-layered graphene [119] as the supporting material.
Dechlorination is a class of reactions where chlorine in an organochlorine compound is removed. Three main routes are commonly employed: the high temperature removal of HCl (dehydrochlorination), reductive replacement of chlorine with hydrogen from catalyst-activated hydrogen gas (hydro-dechlorination), and chlorine gas extraction by a metal-based catalyst (simple dechlorination). These reactions are used in industrial synthesis and are especially important for the disposal of chlorinated chemicals, such as chlorinated solvents. The high temperature and/or metal-based catalysis requirement generated interest towards investigating carbon-based catalysts as replacements. NDs in particular proved to be active for the dechlorination of 1,2-dichloroethane in relatively mild conditions (300 °C), promoting a combination of hydro-dechlorination and simple dechlorination. Interestingly, hydro-dechlorination took place from hydrogen-terminated surface sites on NDs [120].
Electrocatalytic reduction to fuels (CH4, CO, ethanol) or value-added chemicals (acetic acid, formic acid, methanol, ethylene, propanols) is currently one of the most promising routes for CO2 conversion, providing at the same time a storage method for intermittent renewable energy sources and CO2 extraction from the atmosphere [121,122]. Materials requirements for a CO2-reduction electrocatalyst are quite strict: In addition to long-term stability, a high activity is needed to overcome the difficult kinetics dictated by the multi-electron redox nature of the reaction. Another important point is selectivity, as the hydrogen evolution reaction often competes successfully with the CO2 reduction pathway [123,124]. As a result, the field is very active and rapidly evolving with novel materials being investigated at a quick pace. In this context, carbon-based materials are attractive because they can offer a cost-effective alternative with reasonably high conductivity, surface area, and the possibility of tuning their properties by doping. In fact, while carbon materials in general were found to be poor CO2-reduction catalysts with poor selectivity [125], doping with nitrogen [126] or boron [127] resulted in very different properties. In both cases, doping induced a lower onset potential and very high (77% for N and 74% for B) faradaic efficiency, associated to acetate and formate production, respectively, indicating a remarkable selectivity.
While the number of reports investigating NDs as catalysts is still small, the potential of NDs in this field is apparent and makes the development of reliable, cheap, and tunable synthesis methods an important task.

5. Possible Connections with Some Processes Occurring in Space

There has also been evidence that NV centers in NDs could be at the very origin of a long-lasting, puzzling, visible (red) emission observed in particular classes of nebulae, in particular, carbon-rich planetary nebulae. This is the so-called extended red emission (ERE) that has been a literature topic since the 1980s [128,129,130]. In Figure 20 we report the spectrum of the extended red emission (ERE) from the so called red rectangle (right panel), from [129], collected at different observation angles and compared with a typical spectrum of crushed CVD NDs with an average tail ≈40 nm. As can be seen, the ERE emission from the red rectangle (which is 25 times more intense than the other ERE nebular emissions, probably explaining why in all other lower signal strength spectra, they have not been resolved) is compatible with the photoluminescence spectrum of commercial uncoated Bikanta [131] 40 nm-tailed NDs, if the VIS (532 nm) pumping redshift with respect to far-UV pumping is taken into account, as was done in [131]. In particular, it is evident how the zero-phonon-line (ZPL) of the NV emission is present both in the ERE as well as in the crushed commercial NDs, thus suggesting a significant VIS pumping versus the far-UV pumping of the NDs causing the ERE emission from the red rectangle [128,132].
Nanometer-tailed fluorescent NDs produced via PLA techniques and the proposed thermodynamic model for their formation can contribute to interpretation of ERE space emission because in the PLA technique, high pressure, high temperature, and fast cooling conditions are controllable quantities that permit us to infer the circumstellar environmental conditions. Figure 21 gives an idea of the relevance of this type of cross-analysis.
Moreover, in a recently published paper regarding the liquid state of carbon [134], it was pointed out that while the temperature–pressure conditions to have liquid carbon are hardly ever found on earth, this is not the case in stellar and planetary interiors [135,136], where the existence of the liquid state is quite probable. Indeed, as pointed out by Ross [136], the thermodynamic conditions in the liquid central layers of, for example, Uranus and Neptune planets, favor the pyrolysis of methane gas into a mixture of elemental carbon and hydrogen. In the PLA synthesis of NDs [41,64,65] the conditions to generate liquid carbon from which NDs are formed are investigated fairly well in controlled experimental conditions. These studies then allow us to generate laboratory conditions that help to formulate plausible hypotheses in relation to some astrophysical processes.
Finally, a comprehensive list of papers on regarding the liquid state of carbon in stellar and planetary interiors, and possible nanodiamond-related origin of ERE can be found in References [135,136,137,138,139,140,141,142,143,144,145].

6. Conclusions and Perspectives

The interest in NDs and in particular fluorescent NDs in a large variety of science fields is pushing the research on this particular nanoparticle. This interest is due to the properties of fluorescent NDs, which in turn leads, as described in this review, to many different applications. Indeed, the significant and growing potential for commercial applications of nanodiamonds is testified to by the volume and timeline of published patents. A search using the “nanodiamonds” keyword on the Espacenet database yields 2077 results [146], steadily rising in a time window starting in 1995 and peaking in 2017. The largest group concerns fabrication and modification/functionalization methods (570), but patents regarding specific applications are the second largest group (240) and are concentrated in the last five years. To date, several industrial-grade producers are active, and commercial nanodiamonds for research purposes are available via both general chemical suppliers Sigma-Aldrich (St Louis, MO, USA) and specialized companies such as Ray Techniques Ltd. (Jerusalem, Israel), Adàmas Nanotechnologies (Raleigh, NC, USA), PlasmaChem (Berlin, Germany), Tong Li Chemicals (Shenzhen, China), and TCI Chemicals (Tokyo, Japan), among others.
However, many challenges remain, in particular concerning the synthesis process. To enable a wide use of nanodiamonds, large-volume cost-effective production is required, as well as a better control of the surface chemistry, which is essential for certain applications. In addition, control of the size of NDs with limited dispersion and established content of NV centers are objectives to be pursued. Moreover, preventing aggregation during synthesis of ultrasmall fluorescent nanodiamonds (<4 nm) is a fundamental step towards improving sensing capabilities. In summary, synthesis techniques should be improved to obtain fluorescent NDs with a quality closer to bulk diamond. This research would lead to a better control of NDs’ properties and thus to novel applications.

Author Contributions

Conceptualization, L.B., M.C., M.O. and A.M; writing—original draft preparation, L.B., M.C., M.O. and A.M.; writing—review and editing, L.B., M.C., M.O. and A.M.; supervision, A.M. All authors have read and agreed to the published version of the manuscript.

Funding

This research received no external funding.

Conflicts of Interest

The authors declare no conflict of interest.

References

  1. Mochalin, V.N.; Shenderova, O.; Ho, D.; Gogotsi, Y. The properties and applications of nanodiamonds. Nat. Nanotechnol. 2011, 7, 11–23. [Google Scholar] [CrossRef] [PubMed]
  2. Bogatyreva, G.P.; Marinich, M.A.; Ishchenko, E.V.; Gvyazdovskaya, V.L.; Bazalii, G.A.; Oleinik, N.A. Application of modified nanodiamonds as catalysts of heterogeneous and electrochemical catalyses. Phys. Solid State 2004, 46, 738–741. [Google Scholar] [CrossRef]
  3. Vaijayanthimala, V.; Chang, H.-C. Functionalized fluorescent nanodiamonds for biomedical applications. Nanomedicine 2009, 4, 47–55. [Google Scholar] [CrossRef] [PubMed]
  4. Zhu, Y.; Li, J.; Li, W.; Zhang, Y.; Yang, X.; Chen, N.; Sun, Y.; Zhao, Y.; Fan, C.; Huang, Q. The Biocompatibility of Nanodiamonds and Their Application in Drug Delivery Systems. Theranostics 2012, 2, 302–312. [Google Scholar] [CrossRef] [PubMed]
  5. Childress, L.; Hanson, R. Diamond NV centers for quantum computing and quantum networks. MRS Bull. 2013, 38, 134–138. [Google Scholar] [CrossRef] [Green Version]
  6. Hong, S.; Grinolds, M.S.; Pham, L.M.; le Sage, D.; Luan, L.; Walsworth, R.L.; Yacoby, A. Nanoscale magnetometry with NV centers in diamond. MRS Bull. 2013, 38, 155–161. [Google Scholar] [CrossRef] [Green Version]
  7. Collins, A.T.; Thomaz, M.F.; Jorge, M.I.B. Luminescence decay time of the 1.945 eV centre in type Ib diamond. J. Phys. C Solid State Phys. 1983, 16, 2177–2181. [Google Scholar] [CrossRef] [Green Version]
  8. Doherty, M.W.; Manson, N.B.; Delaney, P.; Jelezko, F.; Wrachtrup, J.; Hollenberg, L.C.L. The nitrogen-vacancy colour centre in diamond. Phys. Rep. 2013, 528, 1–45. [Google Scholar] [CrossRef] [Green Version]
  9. Degen, C.L. Scanning magnetic field microscope with a diamond single-spin sensor. Appl. Phys. Lett. 2008, 92, 243111. [Google Scholar] [CrossRef] [Green Version]
  10. Dolde, F.; Fedder, H.; Doherty, M.W.; Nöbauer, T.; Rempp, F.; Balasubramanian, G.; Wolf, T.; Reinhard, F.; Hollenberg, L.C.L.; Jelezko, F.; et al. Electric-field sensing using single diamond spins. Nat. Phys. 2011, 7, 459–463. [Google Scholar] [CrossRef]
  11. Acosta, V.M.; Bauch, E.; Ledbetter, M.P.; Waxman, A.; Bouchard, L.-S.; Budker, D. Temperature Dependence of the Nitrogen-Vacancy Magnetic Resonance in Diamond. Phys. Rev. Lett. 2010, 104. [Google Scholar] [CrossRef] [PubMed] [Green Version]
  12. Sotoma, S.; Terada, D.; Segawa, T.F.; Igarashi, R.; Harada, Y.; Shirakawa, M. Enrichment of ODMR-active nitrogen-vacancy centres in five-nanometre-sized detonation-synthesized nanodiamonds: Nanoprobes for temperature, angle and position. Sci. Rep. 2018, 8. [Google Scholar] [CrossRef] [PubMed] [Green Version]
  13. Maze, J.R.; Stanwix, P.L.; Hodges, J.S.; Hong, S.; Taylor, J.M.; Cappellaro, P.; Jiang, L.; Dutt, M.V.G.; Togan, E.; Zibrov, A.S.; et al. Nanoscale magnetic sensing with an individual electronic spin in diamond. Nature 2008, 455, 644–647. [Google Scholar] [CrossRef]
  14. Krueger, A.; Lang, D. Functionality is Key: Recent Progress in the Surface Modification of Nanodiamond. Adv. Funct. Mater. 2012, 22, 890–906. [Google Scholar] [CrossRef]
  15. McGuinness, L.P.; Yan, Y.; Stacey, A.; Simpson, D.A.; Hall, L.T.; Maclaurin, D.; Prawer, S.; Mulvaney, P.; Wrachtrup, J.; Caruso, F.; et al. Quantum measurement and orientation tracking of fluorescent nanodiamonds inside living cells. Nat. Nanotechnol. 2011, 6, 358–363. [Google Scholar] [CrossRef]
  16. Schirhagl, R.; Chang, K.; Loretz, M.; Degen, C.L. Nitrogen-Vacancy Centers in Diamond: Nanoscale Sensors for Physics and Biology. Annu. Rev. Phys. Chem. 2014, 65, 83–105. [Google Scholar] [CrossRef] [PubMed] [Green Version]
  17. Acosta, V.; Hemmer, P. Nitrogen-vacancy centers: Physics and applications. MRS Bull. 2013, 38, 127–130. [Google Scholar] [CrossRef] [Green Version]
  18. Balasubramanian, G.; Neumann, P.; Twitchen, D.; Markham, M.; Kolesov, R.; Mizuochi, N.; Isoya, J.; Achard, J.; Beck, J.; Tissler, J.; et al. Ultralong spin coherence time in isotopically engineered diamond. Nat. Mater. 2009, 8, 383–387. [Google Scholar] [CrossRef]
  19. Álvarez, G.A.; Bretschneider, C.O.; Fischer, R.; London, P.; Kanda, H.; Onoda, S.; Isoya, J.; Gershoni, D.; Frydman, L. Local and bulk 13C hyperpolarization in nitrogen-vacancy-centred diamonds at variable fields and orientations. Nat. Commun. 2015, 6. [Google Scholar] [CrossRef]
  20. King, J.P.; Jeong, K.; Vassiliou, C.C.; Shin, C.S.; Page, R.H.; Avalos, C.E.; Wang, H.-J.; Pines, A. Room-temperature in situ nuclear spin hyperpolarization from optically pumped nitrogen vacancy centres in diamond. Nat. Commun. 2015, 6. [Google Scholar] [CrossRef]
  21. Boudou, J.-P.; Curmi, P.A.; Jelezko, F.; Wrachtrup, J.; Aubert, P.; Sennour, M.; Balasubramanian, G.; Reuter, R.; Thorel, A.; Gaffet, E. High yield fabrication of fluorescent nanodiamonds. Nanotechnology 2009, 20, 235602. [Google Scholar] [CrossRef] [PubMed]
  22. Dolmatov, V.Y. Detonation synthesis ultradispersed diamonds: Properties and applications. Russ. Chem. Rev. 2001, 70, 607–626. [Google Scholar] [CrossRef]
  23. Boudou, J.-P.; Tisler, J.; Reuter, R.; Thorel, A.; Curmi, P.A.; Jelezko, F.; Wrachtrup, J. Fluorescent nanodiamonds derived from HPHT with a size of less than 10nm. Diam. Relat. Mater. 2013, 37, 80–86. [Google Scholar] [CrossRef]
  24. Zeng, H.; Du, X.-W.; Singh, S.C.; Kulinich, S.A.; Yang, S.; He, J.; Cai, W. Nanomaterials via Laser Ablation/Irradiation in Liquid: A Review. Adv. Funct. Mater. 2012, 22, 1333–1353. [Google Scholar] [CrossRef]
  25. Miotello, A.; Kelly, R. Laser-induced phase explosion: New physical problems when a condensed phase approaches the thermodynamic critical temperature. Appl. Phys. A Mater. Sci. Process. 1999, 69, S67–S73. [Google Scholar] [CrossRef]
  26. Shirey, S.B.; Cartigny, P.; Frost, D.J.; Keshav, S.; Nestola, F.; Nimis, P.; Pearson, D.G.; Sobolev, N.V.; Walter, M.J. Diamonds and the geology of mantle carbon. Rev. Mineral. Geochem. 2013, 75, 355–421. [Google Scholar] [CrossRef] [Green Version]
  27. Gordon Davies, I. Properties and growth of diamond. INSPEC Publ. Inst. Electr. Eng. 1994. [Google Scholar]
  28. Shenderova, O.; Gruen, D.M. Preface. In Ultrananocrystalline Diamond; Elsevier: Amsterdam, The Netherlands, 2006; pp. xix–xx. [Google Scholar]
  29. Dolmatov, V.Y. The Influence of Detonation Synthesis Conditions on the Yield of Condensed Carbon and Detonation Nanodiamond Through the Example of Using TNT-RDX Explosive Mixture. J. Superhard Mater. 2018, 40, 290–294. [Google Scholar] [CrossRef]
  30. Danilenko, V.V. Synthesis, Properties and Applications of Ultrananocrystalline Diamond; Gruen, D.M., Shenderova, O.A., Vul’, A.Y., Eds.; Springer: Berlin, Germany, 2005. [Google Scholar]
  31. Osswald, S.; Yushin, G.; Mochalin, V.; Kucheyev, S.O.; Gogotsi, Y. Control of sp2/sp3Carbon Ratio and Surface Chemistry of Nanodiamond Powders by Selective Oxidation in Air. J. Am. Chem. Soc. 2006, 128, 11635–11642. [Google Scholar] [CrossRef]
  32. Ōsawa, E. Recent progress and perspectives in single-digit nanodiamond. Diam. Relat. Mater. 2007, 16, 2018–2022. [Google Scholar] [CrossRef]
  33. Butler, J.E.; Sumant, A.V. The CVD of Nanodiamond Materials. Chem. Vap. Depos. 2008, 14, 145–160. [Google Scholar] [CrossRef]
  34. Park, J.-W.; Kim, K.-S.; Hwang, N.-M. Gas phase generation of diamond nanoparticles in the hot filament chemical vapor deposition reactor. Carbon 2016, 106, 289–294. [Google Scholar] [CrossRef]
  35. May, P.W.; Ashfold, M.N.R.; Mankelevich, Y.A. Microcrystalline, nanocrystalline, and ultrananocrystalline diamond chemical vapor deposition: Experiment and modeling of the factors controlling growth rate, nucleation, and crystal size. J. Appl. Phys. 2007, 101, 53115. [Google Scholar] [CrossRef] [Green Version]
  36. Akaishi, M.; Kanda, H.; Yamaoka, S. Synthesis of diamond from graphite-carbonate system under very high temperature and pressure. J. Cryst. Growth 1990, 104, 578–581. [Google Scholar] [CrossRef]
  37. Rehor, I.; Cigler, P. Precise estimation of HPHT nanodiamond size distribution based on transmission electron microscopy image analysis. Diam. Relat. Mater. 2014, 46, 21–24. [Google Scholar] [CrossRef]
  38. Yang, G.-W.; Wang, J.-B.; Liu, Q.-X. Preparation of nano-crystalline diamonds using pulsed laser induced reactive quenching. J. Phys. Condens. Matter 1998, 10, 7923. [Google Scholar] [CrossRef]
  39. Pearce, S.R.J.; Henley, S.J.; Claeyssens, F.; May, P.W.; Hallam, K.R.; Smith, J.A.; Rosser, K.N. Production of nanocrystalline diamond by laser ablation at the solid/liquid interface. Diam. Relat. Mater. 2004, 13, 661–665. [Google Scholar] [CrossRef]
  40. Basso, L.; Gorrini, F.; Bazzanella, N.; Cazzanelli, M.; Dorigoni, C.; Bifone, A.; Miotello, A. The modeling and synthesis of nanodiamonds by laser ablation of graphite and diamond-like carbon in liquid-confined ambient. Appl. Phys. A 2018, 124, 72. [Google Scholar] [CrossRef]
  41. Gorrini, F.; Cazzanelli, M.; Bazzanella, N.; Edla, R.; Gemmi, M.; Cappello, V.; David, J.; Dorigoni, C.; Bifone, A.; Miotello, A. On the thermodynamic path enabling a room-temperature, laser-assisted graphite to nanodiamond transformation. Sci. Rep. 2016, 6, 35244. [Google Scholar] [CrossRef]
  42. Mazzi, A.; Gorrini, F.; Miotello, A. Liquid nanodroplet formation through phase explosion mechanism in laser-irradiated metal targets. Phys. Rev. E 2015, 92, 031301. [Google Scholar] [CrossRef]
  43. Saito, K.; Takatani, K.; Sakka, T.; Ogata, Y.H. Observation of the light emitting region produced by pulsed laser irradiation to a solid liquid interface. Appl. Surf. Sci. 2002, 197–198, 56–60. [Google Scholar] [CrossRef]
  44. Fabbro, R.; Fournier, J.; Ballard, P.; Devaux, D.; Virmont, J. Physical study of laser-produced plasma in confined geometry. J. Appl. Phys. 1990, 68, 775–784. [Google Scholar] [CrossRef]
  45. Yan, Z.; Chrisey, D.B. Pulsed laser ablation in liquid for micro-/nanostructure generation. J. Photochem. Photobiol. C Photochem. Rev. 2012, 13, 204–223. [Google Scholar] [CrossRef]
  46. Bradac, C.; Osswald, S. Effect of structure and composition of nanodiamond powders on thermal stability and oxidation kinetics. Carbon 2018, 132, 616–622. [Google Scholar] [CrossRef]
  47. Chiganov, A.S. Selective inhibition of the oxidation of nanodiamonds for their cleaning. Phys. Solid State 2004, 46, 620–621. [Google Scholar] [CrossRef]
  48. Li, L.; Davidson, J.L.; Lukehart, C.M. Surface functionalization of nanodiamond particles via atom transfer radical polymerization. Carbon 2006, 44, 2308–2315. [Google Scholar] [CrossRef]
  49. Shenderova, O.; Koscheev, A.; Zaripov, N.; Petrov, I.; Skryabin, Y.; Detkov, P.; Turner, S.; van Tendeloo, G. Surface Chemistry and Properties of Ozone-Purified Detonation Nanodiamonds. J. Phys. Chem. C 2011, 115, 9827–9837. [Google Scholar] [CrossRef]
  50. Ackermann, J.; Krueger, A. Efficient surface functionalization of detonation nanodiamond using ozone under ambient conditions. Nanoscale 2019, 11, 8012–8019. [Google Scholar] [CrossRef]
  51. Schrand, A.M.; Hens, S.A.C.; Shenderova, O.A. Nanodiamond Particles: Properties and Perspectives for Bioapplications. Crit. Rev. Solid State Mater. Sci. 2009, 34, 18–74. [Google Scholar] [CrossRef]
  52. Ha, S.; Hong, S.P.; Lee, M.; Lee, S.; Lee, S.W. Chemical purification of detonation-synthesized nanodiamond: Recycling of H2SO4 and optimization of process parameters. Mater. Today Commun. 2019, 21, 100571. [Google Scholar] [CrossRef]
  53. Hong, S.P.; Ha, S.W.; Lee, S.W. Atmospheric-pressure chemical purification of detonation-synthesized nanodiamond by using perchloric acid: Intensive parametric study to control sp3/sp2carbon ratio. Diam. Relat. Mater. 2018, 81, 27–32. [Google Scholar] [CrossRef]
  54. Aleksenskii, A. Technology of Preparation of Detonation Nanodiamond. In Detonation Nanodiamonds; Pan Stanford Publishing: Singapore, Singapore, 2014; pp. 37–72. [Google Scholar]
  55. Reineck, P.; Capelli, M.; Lau, D.W.M.; Jeske, J.; Field, M.R.; Ohshima, T.; Greentree, A.D.; Gibson, B.C. Bright and photostable nitrogen-vacancy fluorescence from unprocessed detonation nanodiamond. Nanoscale 2017, 9, 497–502. [Google Scholar] [CrossRef] [PubMed]
  56. Michl, J.; Teraji, T.; Zaiser, S.; Jakobi, I.; Waldherr, G.; Dolde, F.; Neumann, P.; Doherty, M.W.; Manson, N.B.; Isoya, J.; et al. Perfect alignment and preferential orientation of nitrogen-vacancy centers during chemical vapor deposition diamond growth on (111) surfaces. Appl. Phys. Lett. 2014, 104, 102407. [Google Scholar] [CrossRef] [Green Version]
  57. Neu, E.; Arend, C.; Gross, E.; Guldner, F.; Hepp, C.; Steinmetz, D.; Zscherpel, E.; Ghodbane, S.; Sternschulte, H.; Steinmüller-Nethl, D.; et al. Narrowband fluorescent nanodiamonds produced from chemical vapor deposition films. Appl. Phys. Lett. 2011, 98, 243107. [Google Scholar] [CrossRef] [Green Version]
  58. Hui, Y.Y.; Cheng, C.-A.; Chen, O.Y.; Chang, H.-C. Bioimaging and Quantum Sensing Using NV Centers in Diamond Nanoparticles. In Carbon Nanoparticles and Nanostructures; Springer International Publishing: Basel, Switzerland, 2016; pp. 109–137. [Google Scholar]
  59. Orwa, J.O.; Santori, C.; Fu, K.M.C.; Gibson, B.; Simpson, D.; Aharonovich, I.; Stacey, A.; Cimmino, A.; Balog, P.; Markham, M.; et al. Engineering of nitrogen-vacancy color centers in high purity diamond by ion implantation and annealing. J. Appl. Phys. 2011, 109, 83530. [Google Scholar] [CrossRef]
  60. Bradac, C.; Gaebel, T.; Naidoo, N.; Rabeau, J.R.; Barnard, A.S. Prediction and Measurement of the Size-Dependent Stability of Fluorescence in Diamond over the Entire Nanoscale. Nano Lett. 2009, 9, 3555–3564. [Google Scholar] [CrossRef] [Green Version]
  61. Smith, B.R.; Inglis, D.W.; Sandnes, B.; Rabeau, J.R.; Zvyagin, A.V.; Gruber, D.; Noble, C.J.; Vogel, R.; Osawa, E.; Plakhotnik, T. Five-Nanometer Diamond with Luminescent Nitrogen-Vacancy Defect Centers. Small 2009, 5, 1649–1653. [Google Scholar] [CrossRef]
  62. Abe, E.; Sasaki, K. Tutorial: Magnetic resonance with nitrogen-vacancy centers in diamondmicrowave engineering, materials science, and magnetometry. J. Appl. Phys. 2018, 123, 161101. [Google Scholar] [CrossRef] [Green Version]
  63. Narayan, J.; Bhaumik, A. Novel synthesis and properties of pure and NV-doped nanodiamonds and other nanostructures. Mater. Res. Lett. 2017, 5, 242–250. [Google Scholar] [CrossRef] [Green Version]
  64. Basso, L.; Gorrini, F.; Cazzanelli, M.; Bazzanella, N.; Bifone, A.; Miotello, A. An all-optical single-step process for production of nanometric-sized fluorescent diamonds. Nanoscale 2018, 10, 5738–5744. [Google Scholar] [CrossRef]
  65. Basso, L.; Bazzanella, N.; Cazzanelli, M.; Miotello, A. On the route towards a facile fluorescent nanodiamonds laser-synthesis. Carbon 2019, 153, 148–155. [Google Scholar] [CrossRef]
  66. Ghiringhelli, L.M.; Los, J.H.; Meijer, E.J.; Fasolino, A.; Frenkel, D. Modeling the Phase Diagram of Carbon. Phys. Rev. Lett. 2005, 94. [Google Scholar] [CrossRef] [PubMed] [Green Version]
  67. Basharin, A.Y.; Dozhdikov, V.S.; Kirillin, A.V.; Turchaninov, M.A.; Fokin, L.R. Phase diagram with a region of liquid carbon-diamond metastable states. Tech. Phys. Lett. 2010, 36, 559–562. [Google Scholar] [CrossRef]
  68. Ionin, A.A.; Kudryashov, S.I.; Seleznev, L.V. Near-critical phase explosion promoting breakdown plasma ignition during laser ablation of graphite. Phys. Rev. E 2010, 82. [Google Scholar] [CrossRef]
  69. Fu, C.-C.; Lee, H.-Y.; Chen, K.; Lim, T.-S.; Wu, H.-Y.; Lin, P.-K.; Wei, P.-K.; Tsao, P.-H.; Chang, H.-C.; Fann, W. Characterization and application of single fluorescent nanodiamonds as cellular biomarkers. Proc. Natl. Acad. Sci. USA 2007, 104, 727–732. [Google Scholar] [CrossRef] [Green Version]
  70. Fang, C.-Y.; Vaijayanthimala, V.; Cheng, C.-A.; Yeh, S.-H.; Chang, C.-F.; Li, C.-L.; Chang, H.-C. The Exocytosis of Fluorescent Nanodiamond and Its Use as a Long-Term Cell Tracker. Small 2011, 7, 3363–3370. [Google Scholar] [CrossRef] [PubMed]
  71. Hui, Y.Y.; Hsiao, W.W.-W.; Haziza, S.; Simonneau, M.; Treussart, F.; Chang, H.-C. Single particle tracking of fluorescent nanodiamonds in cells and organisms. Curr. Opin. Solid State Mater. Sci. 2017, 21, 35–42. [Google Scholar] [CrossRef]
  72. Faklaris, O.; Garrot, D.; Joshi, V.; Druon, F.; Boudou, J.-P.; Sauvage, T.; Georges, P.; Curmi, P.A.; Treussart, F. Detection of Single Photoluminescent Diamond Nanoparticles in Cells and Study of the Internalization Pathway. Small 2008, 4, 2236–2239. [Google Scholar] [CrossRef]
  73. Tisler, J.; Balasubramanian, G.; Naydenov, B.; Kolesov, R.; Grotz, B.; Reuter, R.; Boudou, J.-P.; Curmi, P.A.; Sennour, M.; Thorel, A.; et al. Fluorescence and Spin Properties of Defects in Single Digit Nanodiamonds. ACS Nano 2009, 3, 1959–1965. [Google Scholar] [CrossRef]
  74. Mohan, N.; Tzeng, Y.-K.; Yang, L.; Chen, Y.-Y.; Hui, Y.Y.; Fang, C.-Y.; Chang, H.-C. Sub-20-nm Fluorescent Nanodiamonds as Photostable Biolabels and Fluorescence Resonance Energy Transfer Donors. Adv. Mater. 2010, 22, 843–847. [Google Scholar] [CrossRef]
  75. Tzeng, Y.-K.; Tsai, P.-C.; Liu, H.-Y.; Chen, O.Y.; Hsu, H.; Yee, F.-G.; Chang, M.-S.; Chang, H.-C. Time-Resolved Luminescence Nanothermometry with Nitrogen-Vacancy Centers in Nanodiamonds. Nano Lett. 2015, 15, 3945–3952. [Google Scholar] [CrossRef] [PubMed]
  76. Neugart, F.; Zappe, A.; Jelezko, F.; Tietz, C.; Boudou, J.P.; Krueger, A.; Wrachtrup, J. Dynamics of Diamond Nanoparticles in Solution and Cells. Nano Lett. 2007, 7, 3588–3591. [Google Scholar] [CrossRef] [PubMed]
  77. Hui, Y.Y.; Zhang, B.; Chang, Y.-C.; Chang, C.-C.; Chang, H.-C.; Hsu, J.-H.; Chang, K.; Chang, F.-H. Two-photon fluorescence correlation spectroscopy of lipid-encapsulated fluorescent nanodiamonds in living cells. Opt. Express 2010, 18, 5896. [Google Scholar] [CrossRef] [PubMed]
  78. Chang, Y.-R.; Lee, H.-Y.; Chen, K.; Chang, C.-C.; Tsai, D.-S.; Fu, C.-C.; Lim, T.-S.; Tzeng, Y.-K.; Fang, C.-Y.; Han, C.-C.; et al. Mass production and dynamic imaging of fluorescent nanodiamonds. Nat. Nanotechnol. 2008, 3, 284–288. [Google Scholar] [CrossRef] [PubMed]
  79. Faklaris, O.; Joshi, V.; Irinopoulou, T.; Tauc, P.; Sennour, M.; Girard, H.; Gesset, C.; Arnault, J.-C.; Thorel, A.; Boudou, J.-P.; et al. Photoluminescent Diamond Nanoparticles for Cell Labeling: Study of the Uptake Mechanism in Mammalian Cells. ACS Nano 2009, 3, 3955–3962. [Google Scholar] [CrossRef] [Green Version]
  80. Gorrini, F.; Giri, R.; Avalos, C.E.; Tambalo, S.; Mannucci, S.; Basso, L.; Bazzanella, N.; Dorigoni, C.; Cazzanelli, M.; Marzola, P.; et al. Fast and Sensitive Detection of Paramagnetic Species Using Coupled Charge and Spin Dynamics in Strongly Fluorescent Nanodiamonds. ACS Appl. Mater. Interfaces 2019, 11, 24412–24422. [Google Scholar] [CrossRef]
  81. Lai, N.D.; Zheng, D.; Treussart, F.; Roch, J.-F. Optical determination and magnetic manipulation of a single nitrogen-vacancy color center in diamond nanocrystal. Adv. Nat. Sci. Nanosci. Nanotechnol. 2010, 1, 15014. [Google Scholar]
  82. Kianinia, M.; Shimoni, O.; Bendavid, A.; Schell, A.W.; Randolph, S.J.; Toth, M.; Aharonovich, I.; Lobo, C.J. Robust, directed assembly of fluorescent nanodiamonds. Nanoscale 2016, 8, 18032–18037. [Google Scholar] [CrossRef] [Green Version]
  83. Chang, H.-C.; Hsiao, W.W.-W.; Su, M.-C. Fluorescent Nanodiamonds; John Wiley & Sons, Ltd: Hoboken, NJ, USA, 2018. [Google Scholar]
  84. Chapman, R.; Plakhotnik, T. Quantitative luminescence microscopy on Nitrogen-Vacancy Centres in diamond: Saturation effects under pulsed excitation. Chem. Phys. Lett. 2011, 507, 190–194. [Google Scholar] [CrossRef]
  85. Su, L.-J.; Wu, M.-S.; Hui, Y.Y.; Chang, B.-M.; Pan, L.; Hsu, P.-C.; Chen, Y.-T.; Ho, H.-N.; Huang, Y.-H.; Ling, T.-Y.; et al. Fluorescent nanodiamonds enable quantitative tracking of human mesenchymal stem cells in miniature pigs. Sci. Rep. 2017, 7. [Google Scholar] [CrossRef] [Green Version]
  86. Hegyi, A.; Yablonovitch, E. Molecular Imaging by Optically Detected Electron Spin Resonance of Nitrogen-Vacancies in Nanodiamonds. Nano Lett. 2013, 13, 1173–1178. [Google Scholar] [CrossRef] [PubMed]
  87. Vaijayanthimala, V.; Cheng, P.-Y.; Yeh, S.-H.; Liu, K.-K.; Hsiao, C.-H.; Chao, J.-I.; Chang, H.-C. The long-term stability and biocompatibility of fluorescent nanodiamond as an in vivo contrast agent. Biomaterials 2012, 33, 7794–7802. [Google Scholar] [CrossRef] [PubMed]
  88. Weissleder, R.; Ntziachristos, V. Shedding light onto live molecular targets. Nat. Med. 2003, 9, 123–128. [Google Scholar] [CrossRef] [PubMed]
  89. Rondin, L.; Tetienne, J.-P.; Spinicelli, P.; Savio, C.D.; Karrai, K.; Dantelle, G.; Thiaville, A.; Rohart, S.; Roch, J.-F.; Jacques, V. Nanoscale magnetic field mapping with a single spin scanning probe magnetometer. Appl. Phys. Lett. 2012, 100, 153118. [Google Scholar] [CrossRef] [Green Version]
  90. Rugar, D.; Mamin, H.J.; Sherwood, M.H.; Kim, M.; Rettner, C.T.; Ohno, K.; Awschalom, D.D. Proton magnetic resonance imaging using a nitrogen vacancy spin sensor. Nat. Nanotechnol. 2014, 10, 120–124. [Google Scholar] [CrossRef] [Green Version]
  91. Lim, K.; Ropp, C.; Shapiro, B.; Taylor, J.M.; Waks, E. Scanning Localized Magnetic Fields in a Microfluidic Device with a Single Nitrogen Vacancy Center. Nano Lett. 2015, 15, 1481–1486. [Google Scholar] [CrossRef] [Green Version]
  92. Aman, H.; Plakhotnik, T. Accuracy in the measurement of magnetic fields using nitrogen-vacancy centers in nanodiamonds. J. Opt. Soc. Am. B 2016, 33, B19. [Google Scholar] [CrossRef]
  93. Kayci, M.; Chang, H.-C.; Radenovic, A. Electron Spin Resonance of Nitrogen-Vacancy Defects Embedded in Single Nanodiamonds in an ABEL Trap. Nano Lett. 2014, 14, 5335–5341. [Google Scholar] [CrossRef]
  94. Kumar, P.; Bhattacharya, M. Magnetometry via spin-mechanical coupling in levitated optomechanics. Opt. Express 2017, 25, 19568. [Google Scholar] [CrossRef] [Green Version]
  95. Ziem, F.C.; Götz, N.S.; Zappe, A.; Steinert, S.; Wrachtrup, J. Highly Sensitive Detection of Physiological Spins in a Microfluidic Device. Nano Lett. 2013, 13, 4093–4098. [Google Scholar] [CrossRef]
  96. Kaufmann, S.; Simpson, D.A.; Hall, L.T.; Perunicic, V.; Senn, P.; Steinert, S.; McGuinness, L.P.; Johnson, B.C.; Ohshima, T.; Caruso, F.; et al. Detection of atomic spin labels in a lipid bilayer using a single-spin nanodiamond probe. Proc. Natl. Acad. Sci. USA 2013, 110, 10894–10898. [Google Scholar] [CrossRef] [PubMed] [Green Version]
  97. Steinert, S.; Ziem, F.; Hall, L.T.; Zappe, A.; Schweikert, M.; Götz, N.; Aird, A.; Balasubramanian, G.; Hollenberg, L.; Wrachtrup, J. Magnetic spin imaging under ambient conditions with sub-cellular resolution. Nat. Commun. 2013, 4. [Google Scholar] [CrossRef] [PubMed] [Green Version]
  98. Rendler, T.; Neburkova, J.; Zemek, O.; Kotek, J.; Zappe, A.; Chu, Z.; Cigler, P.; Wrachtrup, J. Optical imaging of localized chemical events using programmable diamond quantum nanosensors. Nat. Commun. 2017, 8. [Google Scholar] [CrossRef] [PubMed]
  99. Horowitz, V.R.; Aleman, B.J.; Christle, D.J.; Cleland, A.N.; Awschalom, D.D. Electron spin resonance of nitrogen-vacancy centers in optically trapped nanodiamonds. Proc. Natl. Acad. Sci. USA 2012, 109, 13493–13497. [Google Scholar] [CrossRef] [PubMed] [Green Version]
  100. Tamarat, P.; Gaebel, T.; Rabeau, J.R.; Khan, M.; Greentree, A.D.; Wilson, H.; Hollenberg, L.C.L.; Prawer, S.; Hemmer, P.; Jelezko, F.; et al. Stark Shift Control of Single Optical Centers in Diamond. Phys. Rev. Lett. 2006, 97. [Google Scholar] [CrossRef] [Green Version]
  101. Van Oort, E.; Glasbeek, M. Electric-field-induced modulation of spin echoes of N-V centers in diamond. Chem. Phys. Lett. 1990, 168, 529–532. [Google Scholar] [CrossRef]
  102. Kucsko, G.; Maurer, P.C.; Yao, N.Y.; Kubo, M.; Noh, H.J.; Lo, P.K.; Park, H.; Lukin, M.D. Nanometre-scale thermometry in a living cell. Nature 2013, 500, 54–58. [Google Scholar] [CrossRef]
  103. Toyli, D.M.; de las Casas, C.F.; Christle, D.J.; Dobrovitski, V.V.; Awschalom, D.D. Fluorescence thermometry enhanced by the quantum coherence of single spins in diamond. Proc. Natl. Acad. Sci. USA 2013, 110, 8417–8421. [Google Scholar] [CrossRef] [Green Version]
  104. Neumann, P.; Jakobi, I.; Dolde, F.; Burk, C.; Reuter, R.; Waldherr, G.; Honert, J.; Wolf, T.; Brunner, A.; Shim, J.H.; et al. High-Precision Nanoscale Temperature Sensing Using Single Defects in Diamond. Nano Lett. 2013, 13, 2738–2742. [Google Scholar] [CrossRef] [Green Version]
  105. Plakhotnik, T.; Doherty, M.W.; Cole, J.H.; Chapman, R.; Manson, N.B. All-Optical Thermometry and Thermal Properties of the Optically Detected Spin Resonances of the NV Center in Nanodiamond. Nano Lett. 2014, 14, 4989–4996. [Google Scholar] [CrossRef] [Green Version]
  106. Brites, C.D.S.; Lima, P.P.; Silva, N.J.O.; Millán, A.; Amaral, V.S.; Palacio, F.; Carlos, L.D. Thermometry at the nanoscale. Nanoscale 2012, 4, 4799. [Google Scholar] [CrossRef] [PubMed] [Green Version]
  107. Jaque, D.; Vetrone, F. Luminescence nanothermometry. Nanoscale 2012, 4, 4301. [Google Scholar] [CrossRef]
  108. Piñol, R.; Brites, C.D.S.; Bustamante, R.; Martinez, A.; Silva, N.J.O.; Murillo, J.L.; Cases, R.; Carrey, J.; Estepa, C.; Sosa, C.; et al. Joining Time-Resolved Thermometry and Magnetic-Induced Heating in a Single Nanoparticle Unveils Intriguing Thermal Properties. ACS Nano 2015, 9, 3134–3142. [Google Scholar] [CrossRef] [PubMed]
  109. Cordero, M.L.; Verneuil, E.; Gallaire, F.; Baroud, C.N. Time-resolved temperature rise in a thin liquid film due to laser absorption. Phys. Rev. E 2009, 79. [Google Scholar] [CrossRef] [Green Version]
  110. Doherty, M.W.; Acosta, V.M.; Jarmola, A.; Barson, M.S.J.; Manson, N.B.; Budker, D.; Hollenberg, L.C.L. Temperature shifts of the resonances of the NV-center in diamond. Phys. Rev. B 2014, 90. [Google Scholar] [CrossRef] [Green Version]
  111. Ermakova, A.; Pramanik, G.; Cai, J.-M.; Algara-Siller, G.; Kaiser, U.; Weil, T.; Tzeng, Y.-K.; Chang, H.C.; McGuinness, L.P.; Plenio, M.B.; et al. Detection of a Few Metallo-Protein Molecules Using Color Centers in Nanodiamonds. Nano Lett. 2013, 13, 3305–3309. [Google Scholar] [CrossRef]
  112. Sushkov, A.O.; Chisholm, N.; Lovchinsky, I.; Kubo, M.; Lo, P.K.; Bennett, S.D.; Hunger, D.; Akimov, A.; Walsworth, R.L.; Park, H.; et al. All-Optical Sensing of a Single-Molecule Electron Spin. Nano Lett. 2014, 14, 6443–6448. [Google Scholar] [CrossRef] [Green Version]
  113. Tchernij, S.D.; Lühmann, T.; Herzig, T.; Küpper, J.; Damin, A.; Santonocito, S.; Signorile, M.; Traina, P.; Moreva, E.; Celegato, F.; et al. Single-Photon Emitters in Lead-Implanted Single-Crystal Diamond. ACS Photonics 2018, 5, 4864–4871. [Google Scholar] [CrossRef]
  114. Campisciano, V.; Gruttadauria, M.; Giacalone, F. Modified Nanocarbons for Catalysis. ChemCatChem 2018, 11, 90–133. [Google Scholar] [CrossRef]
  115. James, D.H.; Castor, W.M. Styrene. In Ullmann’s Encyclopedia of Industrial Chemistry; Wiley-VCH: Weinheim, Germany, 2000. [Google Scholar]
  116. Lee, E.H. Iron Oxide Catalysts for Dehydrogenation of Ethylbenzene in the Presence of Steam. Catal. Rev. 1974, 8, 285–305. [Google Scholar] [CrossRef]
  117. Zhang, J.; Su, D.S.; Blume, R.; Schlögl, R.; Wang, R.; Yang, X.; Gajović, A. Surface Chemistry and Catalytic Reactivity of a Nanodiamond in the Steam-Free Dehydrogenation of Ethylbenzene. Angew. Chem. Int. Ed. 2010, 49, 8640–8644. [Google Scholar] [CrossRef] [PubMed]
  118. Ba, H.; Liu, Y.; Mu, X.; Doh, W.-H.; Nhut, J.-M.; Granger, P.; Pham-Huu, C. Macroscopic nanodiamonds/β-SiC composite as metal-free catalysts for steam-free dehydrogenation of ethylbenzene to styrene. Appl. Catal. A Gen. 2015, 499, 217–226. [Google Scholar] [CrossRef]
  119. Ba, H.; Podila, S.; Liu, Y.; Mu, X.; Nhut, J.-M.; Papaefthimiou, V.; Zafeiratos, S.; Granger, P.; Pham-Huu, C. Nanodiamond decorated few-layer graphene composite as an efficient metal-free dehydrogenation catalyst for styrene production. Catal. Today 2015, 249, 167–175. [Google Scholar] [CrossRef]
  120. Tveritinova, E.A.; Zhitnev, Y.N.; Kulakova, I.I.; Cherkasov, N.; Maslakov, K.I.; Nesterova, E.A.; Ivanov, A.S.; Savilov, S.V.; Lunin, V.V. The role of structure and surface chemistry of carbon nanomaterials in catalytic conversion of 1,2-dichloroethane. Appl. Surf. Sci. 2015, 355, 74–81. [Google Scholar] [CrossRef]
  121. Qiao, J.; Liu, Y.; Hong, F.; Zhang, J. A review of catalysts for the electroreduction of carbon dioxide to produce low-carbon fuels. Chem. Soc. Rev. 2014, 43, 631–675. [Google Scholar] [CrossRef] [PubMed]
  122. Kondratenko, E.V.; Mul, G.; Baltrusaitis, J.; Larrazábal, G.O.; Pérez-Ramirez, J. Status and perspectives of CO2 conversion into fuels and chemicals by catalytic, photocatalytic and electrocatalytic processes. Energy Environ. Sci. 2013, 6, 3112. [Google Scholar] [CrossRef] [Green Version]
  123. Lewis, N.S. Developing a scalable artificial photosynthesis technology through nanomaterials by design. Nat. Nanotechnol. 2016, 11, 1010–1019. [Google Scholar] [CrossRef]
  124. Tu, W.; Zhou, Y.; Zou, Z. Photoconversion: Photocatalytic Conversion of CO2 into Renewable Hydrocarbon Fuels: State-of-the-Art Accomplishment, Challenges, and Prospects. Adv. Mater. 2014, 26, 4598. [Google Scholar] [CrossRef]
  125. Lum, Y.; Kwon, Y.; Lobaccaro, P.; Chen, L.; Clark, E.L.; Bell, A.T.; Ager, J.W. Trace Levels of Copper in Carbon Materials Show Significant Electrochemical CO2 Reduction Activity. ACS Catal. 2015, 6, 202–209. [Google Scholar] [CrossRef] [Green Version]
  126. Liu, Y.; Chen, S.; Quan, X.; Yu, H. Efficient Electrochemical Reduction of Carbon Dioxide to Acetate on Nitrogen-Doped Nanodiamond. J. Am. Chem. Soc. 2015, 137, 11631–11636. [Google Scholar] [CrossRef]
  127. Nakata, K.; Ozaki, T.; Terashima, C.; Fujishima, A.; Einaga, Y. High-Yield Electrochemical Production of Formaldehyde from CO2 and Seawater. Angew. Chem. Int. Ed. 2013, 53, 871–874. [Google Scholar] [CrossRef] [PubMed]
  128. Warren-Smith, R.F.; Scarrott, S.M.; Murdin, P. Peculiar optical spectrum of the Red Rectangle. Nature 1981, 292, 317–319. [Google Scholar] [CrossRef]
  129. Witt, A.N.; Boroson, T.A. Spectroscopy of extended red emission in reflection nebulae. Astrophys. J. 1990, 355, 182. [Google Scholar] [CrossRef]
  130. Chang, H.-C. Diamonds in space: A brief history and recent laboratory studies. J. Phys. Conf. Ser. 2016, 728, 62004. [Google Scholar] [CrossRef] [Green Version]
  131. Available online: http://bikanta.com/products (accessed on 21 May 2020).
  132. Lu, H.-C.; Peng, Y.-C.; Chou, S.-L.; Lo, J.-I.; Cheng, B.-M.; Chang, H.-C. Far UV Excited Luminescence of Nitrogen-Vacancy Centers: Evidence for Diamonds in Space. Angew. Chem. Int. Ed. 2017, 56, 14469–14473. [Google Scholar] [CrossRef]
  133. Witt, A.N.; Vijh, U.P. Extended Red Emission: Photoluminescence by Interstellar Nanoparticles. Asp. Conf. Ser. 2004, 309, 115–138. [Google Scholar]
  134. Hull, C.J.; Raj, S.L.; Saykally, R.J. The liquid state of carbon. Chem. Phys. Lett. 2020, 749, 137341. [Google Scholar] [CrossRef]
  135. Phillips, A.C. The Physics of Stars; John Wiley & Sons Ltd: Hoboken, NJ, USA, 2013. [Google Scholar]
  136. Ross, M. The ice layer in Uranus and Neptune—Diamonds in the sky? Nature 1981, 292, 435–436. [Google Scholar] [CrossRef]
  137. Jones, A.P.; Hendecourt, L.B.; Sheu, S.-Y.; Chang, H.-C.; Cheng, C.-L.; Hill, H.G.M. Surface C-H stretching features on meteoritic nanodiamonds. Astron. Astrophys. 2004, 416, 235–241. [Google Scholar] [CrossRef]
  138. Chen, C.-F.; Wu, C.-C.; Cheng, C.-L.; Sheu, S.-Y.; Chang, H.-C. The size of interstellar nanodiamonds revealed by infrared spectra of C-H on synthetic diamond nanocrystal surfaces. J. Chem. Phys. 2002, 116, 1211–1214. [Google Scholar] [CrossRef]
  139. Habart, E.; Testi, L.; Natta, A.; Carbillet, M. Diamonds in HD 97048: A Closer Look. Astrophys. J. 2004, 614, L129–L132. [Google Scholar] [CrossRef]
  140. Sheu, S.-Y.; Lee, I.-P.; Lee, Y.T.; Chang, H.-C. Laboratory Investigation of Hydrogenated Diamond Surfaces: Implications for the Formation and Size of Interstellar Nanodiamonds. Astrophys. J. 2002, 581, L55–L58. [Google Scholar] [CrossRef]
  141. Witt, A.N.; Mandel, S.; Sell, P.H.; Dixon, T.; Vijh, U.P. Extended Red Emission in High Galactic Latitude Interstellar Clouds. Astrophys. J. 2008, 679, 497–511. [Google Scholar] [CrossRef]
  142. Cohen, M.; Anderson, C.M.; Cowley, A.; Coyne, G.V.; Fawley, W.; Gull, T.R.; Harlan, E.A.; Herbig, G.H.; Holden, F.; Hudson, H.S.; et al. The peculiar object HD 44179 (“The red rectangle”). Astrophys. J. 1975, 196, 179. [Google Scholar] [CrossRef]
  143. Schmidt, G.D.; Cohen, M.; Margon, B. Discovery of optical molecular emission from the bipolar nebula surrounding HD 44179. Astrophys. J. 1980, 239, L133. [Google Scholar] [CrossRef]
  144. Duley, W.W. Evidence for hydrogenated amorphous carbon in the Red Rectangle. Mon. Not. R. Astron. Soc. 1985, 215, 259–263. [Google Scholar] [CrossRef] [Green Version]
  145. Cohen, M.; van Winckel, H.; Bond, H.E.; Gull, T.R. Hubble Space TelescopeImaging of HD 44179, The Red Rectangle. Astron. J. 2004, 127, 2362–2377. [Google Scholar] [CrossRef]
  146. Espacenet—Patent Search. Available online: https://worldwide.espacenet.com/patent/search?q=nanodiamonds (accessed on 4 June 2020).
Figure 1. Carbon phase diagram indicating graphite (grey), diamond (white), and liquid (yellow). In addition, pressure-temperature conditions reached with different synthesis technique are indicated. HPHT: high pressure, high temperature. PECVD: Plasma Enhanced Chemical Vapor Deposition.
Applsci 10 04094 g001
Figure 2. (a) Detonation process. A mixture of 60% TNT (C6H2(NO2)CH3) and 40% hexogen (C3H6N6O6) is detonated inside a metallic chamber filled either with water (liquid or ice) or gas (an atmosphere of N2, Ar, or CO2). Then, 4–5 nm sized nanodiamonds (NDs) agglomerated into sub-micrometer clusters are obtained. (b) Schematics of NDs synthesis upon shock wave propagation. The detonation (I) leads to chemical dissociation of the carbon precursor (II), which can be the explosive molecules or graphite. The dashed line (III) represents the region where the pressure required to form the diamond phase is reached. The detonation products expand (IV), and the carbon atoms condense and crystallize (V) to form nanoclusters (VI). Finally, NDs crystallize, starting from carbon nanoclusters, grow, and agglomerate (VII). Reproduced with permission from [1], Springer, 2012.
Applsci 10 04094 g002
Figure 3. (a) Experimental setup for chemical vapor deposition (CVD) synthesis. The hot filament is required to dissociate the gas phase (CH4/H2 mixture) into radicals, whereas the electrode plate is used to attract those radicals (mainly H and CH) toward the substrate. Reproduced with permission from [34], Elsevier, 2016. (b) Schematization of the standard growth mechanism of nanocrystalline diamond film during CVD synthesis.
Applsci 10 04094 g003
Figure 4. Experimental setup of pulsed laser ablation in liquid. Reproduced with permission from [40], Springer, 2018.
Applsci 10 04094 g004
Figure 5. Characterization of the NDs from graphite ablation in water. (a) Typical Scanning Electron Microscopy (SEM) image, after removal of the non-diamond phase of carbon, showing clustered nanoparticles of about 100 nm size. (b) Energy-dispersive X-ray Spectroscopy (EDXS) spectrum of the nanoparticles. The carbon peak is detected at 0.27 keV. Moreover, the peaks of silicon at 1.74 keV and of oxygen at 0.52 keV are observed. They come from the substrate on which the particles are deposited and from the oxidized surface layers of the ablated powders, respectively. (c) Raman spectrum (obtained under 532 nm excitation wavelength) of purified particles. The main peak at 1580 cm−1 is the graphite G peak, while the peak at 1335 cm−1 (shown in detail in the inset) is attributed to compressively-strained NDs. Reproduced with permission from [40], Springer, 2018.
Applsci 10 04094 g005
Figure 6. Nitrogen-vacancy (NV)-enriched NDs preparation. Reproduced with permission from [23], Elsevier, 2013.
Applsci 10 04094 g006
Figure 7. (a) Experimental setup of pulsed laser ablation (PLA). (b) SEM image of the synthesized sample: on the Si substrate a thin diamond-like carbon (DLC) film is deposited over which NDs are dispersed. (c) NV center energy levels. When the NV is excited by using a green laser (green arrow), it can relax either radiatively (red arrow) or non-radiatively (yellow dotted arrow). The effect of the lattice strain, both in its parallel and perpendicular components with respect to the NV axis, on the degenerated ms = 1 spin states is represented (see text for details). In the red box: scheme of diamond crystal structure with an NV center, consisting of a nitrogen atom (blue sphere) and a nearest-neighbor carbon-vacancy (yellow circle) along the (111) direction. (d) Left-hand side: SEM image of one microparticle deposited on the DLC film, consisting of clustered C-nanoparticles with sizes below 50 nm. Right-hand side: corresponding EDXS spectrum. The carbon and nitrogen peaks are detected at, respectively, 0.27 and 0.38 KeV, indicating that the nitrogen is contained inside the nanoparticles’ cluster. In addition, the silicon peak from the Si substrate was detected at 1.74 KeV (not shown). Reproduced with permission from [64], Royal Society of Chemistry, 2018.
Applsci 10 04094 g007
Figure 8. (a) Wide field optical image and (b) relative photoluminescence (PL) image. (c,d) Typical ODMR spectra obtained from the bright spot of (b), confirming the Nitrogen-Vacancy (NV) origin of the collected PL. The intensity reduction at 2.87 GHz is evident in (c), while in (d) a double resonance is observed due to strain of the NDs hosting the NV centers and removing the degeneracy of the ms = ±1 states. Reproduced with permission from [65], Elsevier, 2019.
Applsci 10 04094 g008
Figure 9. (a) Carbon phase diagram. Stability regions of diamond (D), graphite (G), vapor (V), and liquid carbon (L) are indicated, respectively, in white, grey, blue, and green. The purple arrow shows the graphite–liquid–diamond transition used to explain ND formation under pulsed laser irradiation of graphite in LN2. The tilted red lines show the region known as “diamond-like liquid” [33], where undercooled liquid carbon and metastable diamond coexist. Typical PL wide-field images of NDs synthesized by Pulsed Laser Deposition (PLD) in nitrogen atmosphere (b) and by PLA in liquid nitrogen (c). (d) PL strength comparison between the two samples, obtained by integrating the intensity of the whole PL image after background subtraction: LN2-NDs show a more than 10× higher emission compared to Diamond-like Carbon (DLC)-embedded NDs. The error bars of (d) are given by the standard deviation of the different integrated images. Reproduced with permission from [65], Elsevier, 2019.
Applsci 10 04094 g009
Figure 10. (a) Photoluminescence spectrum of an ensemble of NV centers under 532 nm laser pumping. The NV0 (575 nm) and NV (638 nm) zero phonon lines are indicated. The red phonon sideband (PSB) is evident. (b) Continuous wave optically-detected magnetic resonance (CW-ODMR) spectrum of NV centers at zero magnetic field (b) recorded using the optically detected magnetic resonance technique. (c) CW-ODMR with an external magnetic field B ≠ 0, where the degeneracy of the ms = ±1 states is removed, thus leading to two different optical transitions split by the Zeeman factor 2γB, with γ being the electron gyromagnetic ratio. Panels (b,c) adapted from [81].
Applsci 10 04094 g010
Figure 11. ODMR spectra under external magnetic field: zero-field (red curve), 1 mT (blue curve), and 3 mT (green curve). The circles are the experimental data while the lines are multi-gaussian fits. Adapted with permission from [82], Royal Society of Chemistry, 2016.
Applsci 10 04094 g011
Figure 12. (a) Fluorescence spectrum of NDs in water under 532 nm Continuous-Wave (CW)-laser pumping. (b) Temporal evolution of the fluorescence intensity at 687 nm under 2 Hz magnetic modulation. The inset shows Fourier transformed frequency spectrum. (c) Normalized fluorescence spectrum of NDs in water (black) and its Fast Fourier Transform (FFT) spectrum (red) after demodulation (NDs concentration in water 0.1 μg mL−1). The asterisk indicates Raman peaks of water. Reproduced with permission from [85], Springer, 2017.
Applsci 10 04094 g012
Figure 13. Fluorescence spectrum (red curve) of NDs superimposed on the near-infrared window of biological tissues. The black and gray curves are the absorption spectra of water (H2O), oxygen bound hemoglobin (HbO2), and hemoglobin (Hb), respectively. Reprinted with permission from [87], Elsevier, 2012.
Applsci 10 04094 g013
Figure 14. Panel (a) ND phantoms made of commercial NDs. (b) Chicken breast illuminated by an LED. The stripe on the chicken breast marks the edge of the phantom, which is placed within the chicken breast, 5 mm behind the front surface, facing the LED emitting at 621 nm. Fluorescence is collected out to the side. (c) ND phantoms imaged outside of the chicken breast. Reprinted with permission from [86]. Reproduced with permission of the American Chemical Society, 2013.
Applsci 10 04094 g014
Figure 15. (a) Schematic drawing of the NV center; (b) simulated electric field 6 µm below the microstructure (where the NV is located) for 1 V voltage applied; (c) observed shift of the ODMR resonance lines for different voltages applied; (d) schematic of the used confocal setup with Helmholtz coils for magnetic field alignment. Reprinted with permission from [10], Springer, 2011.
Applsci 10 04094 g015
Figure 16. (a) ODMR spectrum around the NV center of a single ND. The four red points indicate the RF frequencies used to extract the temperature (maximum slope of the dip). (b) Confocal spatial map of fluorescent NDs (circles) and gold nanoparticles (cross). (c) Temperature of a single ND as a function of laser power with (red) or without (blue) laser illumination on a nearby gold nanoparticle. (d) Temperature changes of a single ND, as a function of the distance from the illuminated gold nanoparticle indicated by the cross. Reprinted with permission from [102], Springer, 2013.
Applsci 10 04094 g016
Figure 17. Spatially resolved OMDR wide-field imaging and strain-field dependence. Panel (a): Schematics of the inverted wide-field ODMR microscope. The green laser is steered onto the sample and focused through the 40× objective through a dichroic mirror transmitting the red photoluminescence. The RF irradiation is obtained with an Au-coated copper loop, here represented by the microwave antenna wire located under the sample’s surface. Panel (b): Temporal diagram of the continuous wave electron spin resonance experiment. The camera detects the PL image synchronously with the RF irradiation, and the laser is kept ON all along the measurement time. Panel (c) Photoluminescence images as the RF frequency sweeps in the 2.85–2.90 GHz range. An ROI (red square) containing a bright spot was selected and the average intensity inside that ROI was plotted as a function of the RF frequency to generate an ODMR spectrum. Panel (d) reports three typical examples of signals on diamond nano-agglomerates showing different strain effects (curves d1, d2, and d3). Reproduced with permission from [64], Royal Society of Chemistry, 2018.
Applsci 10 04094 g017
Figure 18. (a) High resolution Transmission Electron Microscopy (TEM) of ferritin molecules (right) showing the iron-containing core and a single ND covered with ferritin (left). (b) The spin relaxation time T1 of naked NV (left) and in ferritin-coated NDs (left, inset). Statistical distribution of the T1 for bare NDs (right, blue bars) and for ferritin-coated NDs (right, red bars). Reprinted with permission from [111], American Chemical Society, 2013.
Applsci 10 04094 g018
Figure 19. Fluorescence spectra of color centers in diamonds under 532 nm laser excitation. Lead-related (Pb-rel), germanium-vacancy (GeV), tin-vacancy (SnV), and silicon-vacancy (SiV). Reproduced with permission from [113], Springer, 2013.
Applsci 10 04094 g019
Figure 20. Comparison between a typical photoluminescence spectrum of 40 nm crushed NDs obtained under 532 nm optical pumping and the extended red emission (ERE) emission from the red rectangle. The peak at 637/638 nm is strongly reproducible and was first observed in [128]. Its compatibility with the zero phonon line of the NV center in NDs is evidenced with a vertical line. A better, longer wavelength, PL-tail compatibility is expected under far-UV irradiation, as from Reference [132]. The peak at around 580 nm could be correlated with the NV0 zero phonon line. Data of ERE (blue and red curve) are reproduced from [129].
Applsci 10 04094 g020
Figure 21. The black line is the PL spectrum under a 532 nm pump of PLA NDs containing NV centers, while the blue and red curves are typical ERE emissions, pertinent to NGC2023 and NGC7023 nebulae Data reproduced from [64] (black curve), [133] (red curve) and [129] (blue curve).
Applsci 10 04094 g021

