Article

Application of a Prediction Model for Ambient Noise Levels and Acoustical Capacity for Living Rooms in Nursing Homes Hosting Older People with Dementia

1
Department of Information Technology, Ghent University, 9052 Ghent, Belgium
2
Institute for Environmental Design and Engineering, University College London, London WC1H0NN, UK
3
Department of Occupational Therapy, Artevelde University College, 9000 Ghent, Belgium
4
Department of Internal Medicine and Pediatrics, Ghent University, 9000 Ghent, Belgium
*
Author to whom correspondence should be addressed.
Submission received: 13 May 2020 / Revised: 15 June 2020 / Accepted: 16 June 2020 / Published: 19 June 2020
(This article belongs to the Special Issue Advances in Room Acoustics of Non-performing Public Spaces)

Abstract

:
Acoustic comfort is becoming an increasingly important dimension for practitioners in the context of design of care facilities for older adults, namely nursing homes. Defining the quality of these spaces based on room acoustics criteria alone might be challenging if aspects related to their functioning (e.g., speech-based activities) are not taken into account. The acoustical capacity concept has been previously proposed for eating establishments as a way to provide a quality assessment based on both physical characteristics of the space and the perceived quality of verbal communication. In this study, a revised version of a prediction model for ambient noise levels based on occupancy and an estimation of acoustical capacity are proposed for nursing homes hosting people with dementia, and the corresponding parameters of slope, group size and absorption per person are optimized for the specific application, using a Nursing Home in Flanders (Belgium) participating to the AcustiCare project as case study. Results show that, compared to normal eating establishments, lower absorption per person values and higher group size values should be used in nursing homes to reduce errors in ambient noise levels prediction. Furthermore, using a retrofit intervention carried out in the living room of the Nursing Home, the enhanced acoustical capacity of the space was analysed. Results, in this case, show that, prior to the retrofit intervention, the acoustical capacity was already exceeded with average occupancy (i.e., saturated in normal functioning conditions), while the reduction in reverberation time achieved with the retrofit increased considerably the acoustical capacity of the space, shifting the quality of verbal communication in the living room from insufficient to satisfactory.

1. Introduction

There is a growing research interest for the acoustics of long-term care facilities for older adults [1,2,3]—i.e., nursing homes [4]—as part of a broader discourse about the health and well-being of ageing populations, which is becoming a major societal concern [5]. Defining acoustic comfort in such environments is not an easy task when so many factors come into play, such as the particular groups of people involved (e.g., staff members, nursing home residents) and their perception, the activities taking place with their potentially conflicting sound sources, and building and room acoustics itself [6,7,8,9]. Characterizing the acoustic environments of nursing homes (NHs) with adequate indicators is crucial to inform design guidelines and eventually provide supportive living environments for their users [10,11,12,13].
Long-term care environments qualify as both work and residence spaces. The literature about the effects of noise exposure in occupational contexts for end users is extensive [14,15,16]. The impact of undue/unwanted sounds can lead to significant adverse health effects [17,18,19,20]. This implies that the acoustic performance of care facilities in terms of building elements and overall qualities of a space is typically regulated at national levels (e.g., [21]), because they host people who are more likely to be vulnerable to environmental stressors because of their condition. However, applications of auditory-aware strategies in the specific setting of long-term care facilities for older adults are limited and often qualitative in nature [22], and the stakeholders’ interest in quantifiable measures and impacts is growing [1].
This work was carried out in the context of the AcustiCare project (http://www.acusticare.be), involving five nursing homes in Flanders, Belgium and a number of stakeholders of the sector, with the overarching aim of proposing active soundscape management and design recommendations for nursing homes hosting older people with Behavioural and Psychological Symptoms of Dementia (BPSD) [12,23]. While the main focus was on active strategies (e.g., artificially controlled sound environments with electroacoustic systems), the project also looked at passive acoustic requirements and room acoustics conditions in the main spaces of the nursing homes, namely the living rooms, where staff and nursing home residents spend most of their time during the day [7]. Adequate conditions for good verbal communication are a necessary requirement for the living rooms of nursing homes, where most of the interactions between staff members and residents occur, and where key social functions take place (common activities, family visits, dining, etc.).
The concept of “acoustical capacity” proposed by Rindel approximately a decade ago [24] might be applied to the context of Nursing Homes (NHs). The goal of this paper is to investigate the most appropriate values for model parameters to apply in Rindel’s prediction equation of ambient noise level for the living rooms of nursing homes hosting older adults with dementia. The rationale for extending the scope of the model to this specific case study is two-fold: (1) the occupancy of living rooms in nursing homes is typically lower (typically ca. 20–30 people, including residents, staff and occasional visitors) compared to what has been tested to date (typically 50–500 people), so there is a need to check whether this statistical approach is applicable at this smaller scale [24]; (2) the verbal communication dynamics of living rooms hosting (among others) people with dementia are likely to differ from other facilities hosting older adults—for instance, because of staff members speaking with increased vocal effort to be heard by people with a hearing impairment or because of shouting behaviours that sometimes occur for people with BPSD [25].
For this purpose, a set of measurements of noise levels and occupancy carried out in one of the nursing homes of the AcustiCare project was used to optimize and validate the prediction model of ambient noise levels. Furthermore, the acoustical capacity variation was analysed in this case study after an acoustical retrofit intervention was implemented in the living room.

2. Theoretical Background

Some studies have approached the assessment of the acoustic quality of care facilities in terms of background noise levels monitoring [26,27]. However, this work aims to make a further step: because speech-related functions are so important there, it is probably more appropriate to refer to parameters that can take into account (and parametrize) more factors at the same time, such as background noise levels, desired function (verbal communication in this case), room acoustics conditions (reverberation and volume), and occupancy. Acoustical capacity can serve this purpose: it was introduced as a concept in Rindel’s work about the acoustics of eating establishments and places for social gatherings in general [24,28], and is defined as “the maximum number of persons allowed in the room for sufficient quality of verbal communication” [29], where “sufficient” implies that the signal-to-noise ratio (SNR) is better than -3 dB, or that the ambient noise level does not exceed 71 dB. The concept of acoustical capacity relies on a prediction model reported in Equation (1) [24] for expected noise levels in the investigated eating facility, which is a function of the volume (V), the reverberation time (T0) and number of people gathered in the room (N)
L N , A = 1 1 c · 69 c · 45 10 log g · 0.16 · V T 0 · N + A p dB
where Ap is the sound absorption per person in m2, c is the Lombard slope (dB/dB), and g is the group size, defined as the average number of people per speaking person (i.e., g = N/Ns). Rindel observed that, for the majority of eating establishments, the prediction model gives the most accurate results (within a range of ±2 dB) with c = 0.5 dB/dB and Ap = 0.2 m2. The main source of uncertainty indeed appears to be the group size parameter g. The model reported in Equation (1) was validated using data from Hodgson et al. [30], where a relatively broad range (in terms of number of seats, eating style, and physical and acoustic features) of eating establishments was considered.
For the sake of generalizability, Rindel proposes a simplified relationship to calculate the acoustical capacity (Nmax) based on (1)
N max V 20 · T
where V is the volume in m3 of the room and T is the reverberation time (s) in furnished but unoccupied condition at mid-frequencies. The formula (2) is obtained from the prediction model (1), based on a maximum ambient noise level of 71 dB (threshold for a sufficient quality of verbal communication), a slope value c = 0.5 dB/dB, a group size value g = 3.5 (average of the 3–4 N/Ns range observed to work for most eating establishments), and an absorption per person value Ap = 0.35 m2 (average of the 0.2–0.5 m2 range observed to work for most eating establishments) [24,29]. However, it was observed that depending on the type of gathering and social arousal, the parameter g could range from values as low as 2 (very lively gatherings), to 3–4 for more common settings (e.g., food courts, bistros, restaurants, etc.), up to more extreme situations of 8 for the dining rooms of residences for older adults. The focus of this paper is indeed on this latter case.

3. Methods

One of the five Nursing Homes (NHs) of the project was selected and its living room was considered in this study. The NH is located in Flanders (Belgium); the building hosting the facility dates back to the 1980s and it underwent several local renovations and technical adjustments over the past 30 years. The rationale for selecting this facility in particular was two-fold: (1) the living room of the department under investigation is slightly bigger in size (ca. double volume) and hosts on average more residents (ca. 10 more, on average), compared to the other four NH living rooms; (2) in the context of the AcustiCare project, this facility is the only one where retrofit interventions were implemented, aimed specifically at reducing reverberation time in the living room (which is an important factor of influence on acoustical capacity). Living rooms in the departments for people with dementia and the often related BPSD in the Nursing Homes of the project are conceived to host a number of residents, ranging approximately between 20 and 30 people at the time, including staff and visitors (e.g., resident’s family members, friends, doctors, etc.); for the case study, the number of residents typically ranges between 15 and 30 people. The layout of the living room (Figure 1) shows a few tables for 3–6 persons each spread across the space, with a desk/console/kitchen area for staff on one side, and a smaller, more flexible area where group activities might happen (soft gym, watching TV, listening to radio, etc.).
The protocol for data collection is reported in Ref. [7]. Data collection for the living room included: reverberation time, ambient noise levels measurements for a 12-h period (07:00 am–07:00 pm), and occupancy (i.e., number of people in the living room) for a 12-h period (07:00 am–07:00 pm).
Volumetric data of the living rooms were acquired; reverberation time (T) was measured in accordance with the ISO 3382-2:2008 standard [31]. Measurements were conducted in unoccupied conditions, while the rest of the facility was still functioning. Therefore, considering the proximity of potentially sensitive receivers, it was not suitable to use loud signals to elicit the rooms and T20 was used instead of T30.
For noise levels, sensor nodes were installed in the living room during a typical day of activity of the facility; data would be sent over the internet to the Ghent University server infrastructure and subsequently processed further through an agent-based approach and eventually stored in a warehouse database [7]. These customized sensor nodes are conceived to provide remote data access and have been described in previous work [7], performing equivalently at least to “Class 2” equipment and being suitable for the measurement of the sound levels and their daily variation, as observed in the current study. A-weighted equivalent sound levels were calculated on a 30-min basis (LAeq,30min). To the best of the author’s knowledge, no specific protocol is available to formulate a proper uncertainty balance for the kind of measurements proposed in this study, using these specific devices. Yet, it is still possible to get a sense of the error the devices might incur in, and it is worthwhile highlighting that the sources of uncertainty that might emerge in indoor context and for a relatively narrow range of sound levels are likely less than those one might have to consider for outdoor environmental noise measurements (e.g., road traffic noise). Before deploying the sensor nodes at the nursing home, these were tested at the Ghent University Lab: they were calibrated using a Svantek SV 35A acoustic calibrator and the same procedure of indoor testing as proposed in Ref. [32], which is based on direct comparison of measurements with a Class 1 sound level meter, was performed, leading to an error of less than 0.2 dB on average. This is a well-accepted approach in literature, in order to check for the accuracy and reliability of acoustic sensor nodes [32,33,34,35].
For occupancy data, a researcher’s observation covered the same 12-h period of ambient noise levels measurements. The researcher would sit in the living room in silence, without interacting with staff, residents, or their family members and/or friends. Every 30 min, the researcher would take note of the number of persons present in the living room, assessing “overall” presence (i.e., disregarding people briefly leaving/entering the living rooms, unless they were contributing significantly to the acoustic environment by generating very loud or particular sounds) during the previous 30-min slot (i.e., at 11:00 am, the researcher would annotate data related to presence between 10:30 and 11:00 am), as well as taking brief field notes about the main events and/or activities developing during that slot (“staff serving breakfast to residents”; “residents watching TV”, etc.) [7]. This approach was deemed to be sensible, bearing in mind that the rhythm of an NH living room is not as fast-paced as it might be in other eating establishments for the general public; residents (some of them with limited mobility) rarely move more than 3–4 times between the living room and their private bedrooms during a day.
As part of the engagement and demonstration activities of the AcustiCare project, a number of acoustical retrofit interventions were deployed in each of the participating NHs; these included, among others, the installation of suspended and wall-mounted absorbing elements, installation of acoustic curtains and installation of noise-reducing ventilation grids (more details about the demo interventions are reported in [13]). For the living room of the present study, approximately 110 m2 of absorbing gypsum tiles (Gyptone Tile Quattro 50 and Rigitone 12/25 Q by Gyproc), applied to cover hard plaster ceiling, and a floating acoustic floor (Moduleo) on top of the existing floor, were installed [13]. Reverberation time measurements and noise-level-monitoring via sensor nodes were repeated in the same conditions after the installation of the acoustic materials. Consequent volumetric variations in the living room (e.g., cavity for the modular ceilings elements) were deemed small enough to be disregarded.

4. Results

This section is organised into three subsections: Section 4.1 reports the results of the reverberation time measurements, and the sound levels and occupancy levels monitored during the 12-h observation slot; Section 4.2 reports the analysis to identify the best parameters values to include in the prediction model of ambient noise levels adapted for nursing homes; Section 4.3 compares the acoustical capacity in the living room before and after the acoustical retrofit interventions were implemented.

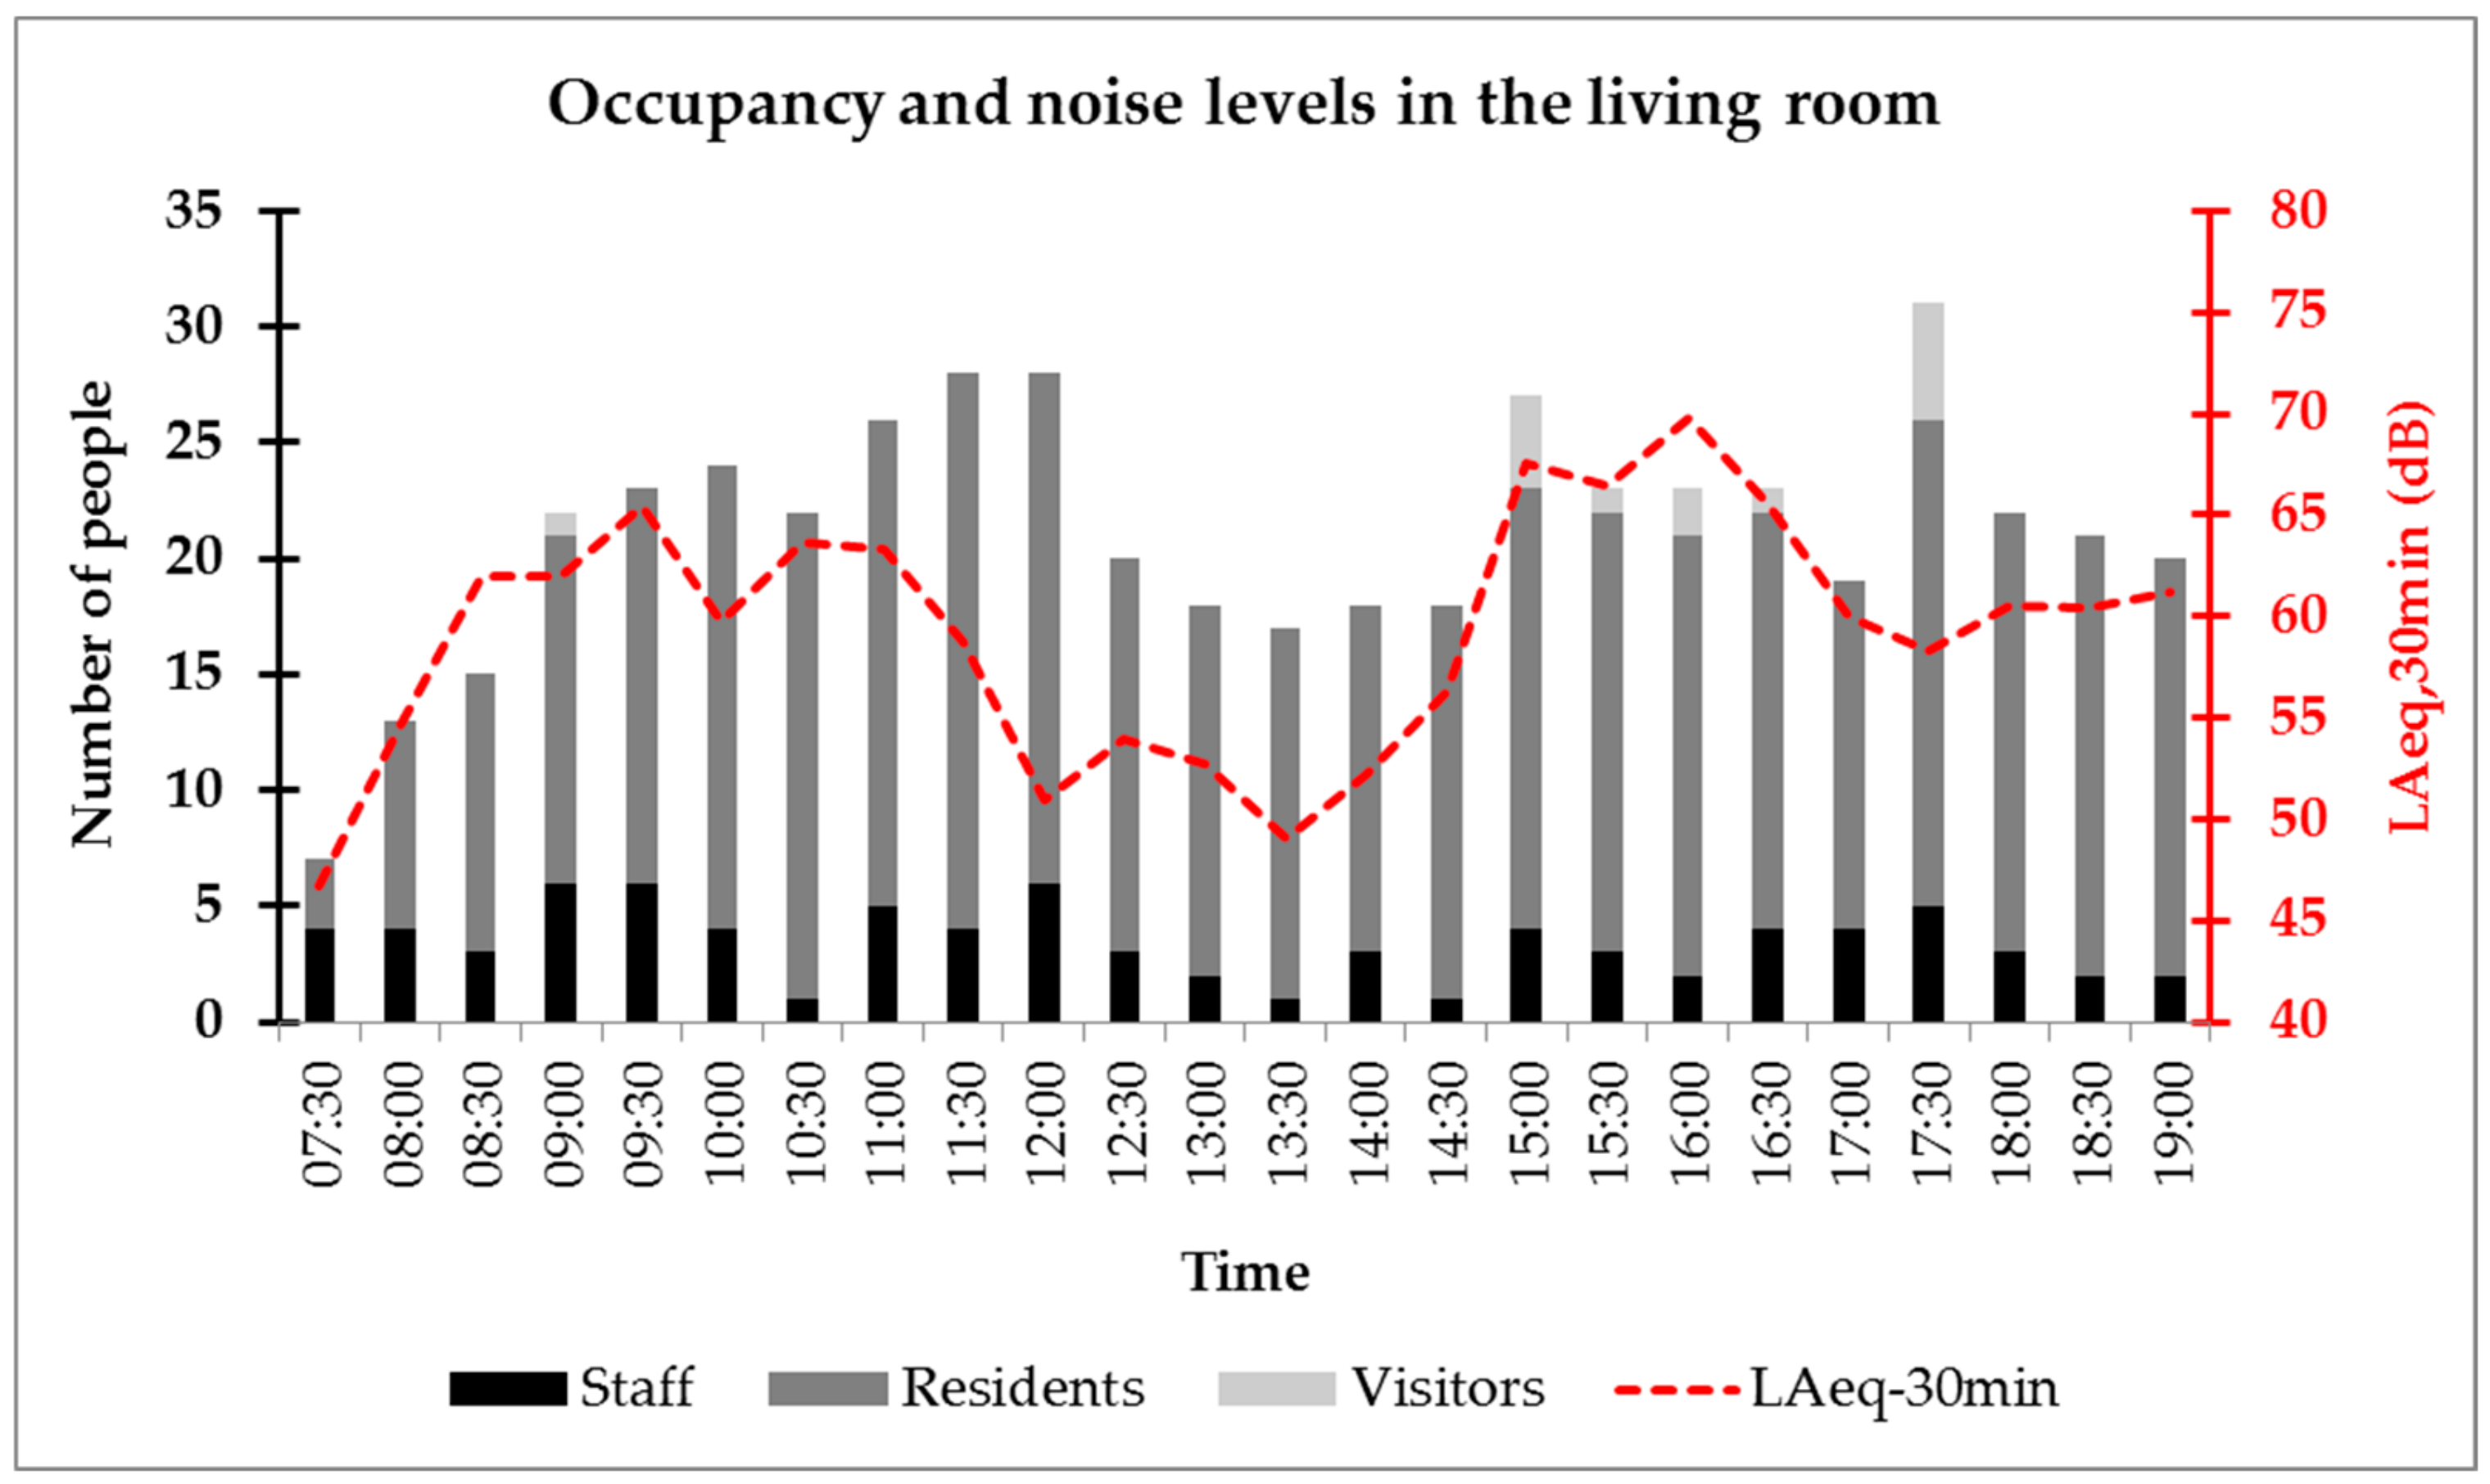
4.1. Acoustic and Occupancy Data in the NH Living Room

The living room space under investigation had a volume of approximately 615 m3 (h = 3 m, on average). The measured reverberation time prior to the acoustical retrofit intervention was 0.91 s and it represents the arithmetic average of the T20 values measured in the 0.5–2 kHz frequency range (T0.5–2kHz). This choice was made to stay aligned with regional guidelines for the acoustic performance of such spaces: the recommended value for living rooms is 0.8 s [36], signifying that acoustic correction for the investigated space was desirable. The reverberation time measurements were repeated after the installation of the floating acoustic floor and absorbing ceilings and the new T0.5–2kHz value was 0.39 s, showing a considerable improvement [13].
Figure 2 shows occupancy and noise level data in the living room during the 12-h observation slot. People count is organized in three categories: staff, residents and visitors (the researcher carrying out the observation was excluded from this count). The 30-min slots were arranged to match the LAeq,30min intervals. A pattern with two daily peaks for both sound levels and occupancy can be observed in the morning during breakfast, common activities time and early lunch, and in the afternoon with visitors’ presence and dinner; between those peaks, levels go down as some residents return to their private bedrooms. LAeq,30min generally range between 50 and 70 dB, showing that the acoustic environment of the living room was never particularly quiet. Sound level monitoring was repeated after the acoustical retrofit intervention and some differences were observed, but they are discussed in more detail in [13], as the topic is out of the scope of the present paper. In general, Figure 2 suggests that in the NH living room low ambient noise levels might also be associated with relatively higher occupancy (like in the slots 11:30–12:00 h or 17:00–17:30 h); in those cases, field notes confirmed that several residents were listening to a radio or watching TV (thus, constant noise and fewer people speaking). This supports the claims that NH living rooms exhibit different behavioural patterns if compared with other eating establishments.

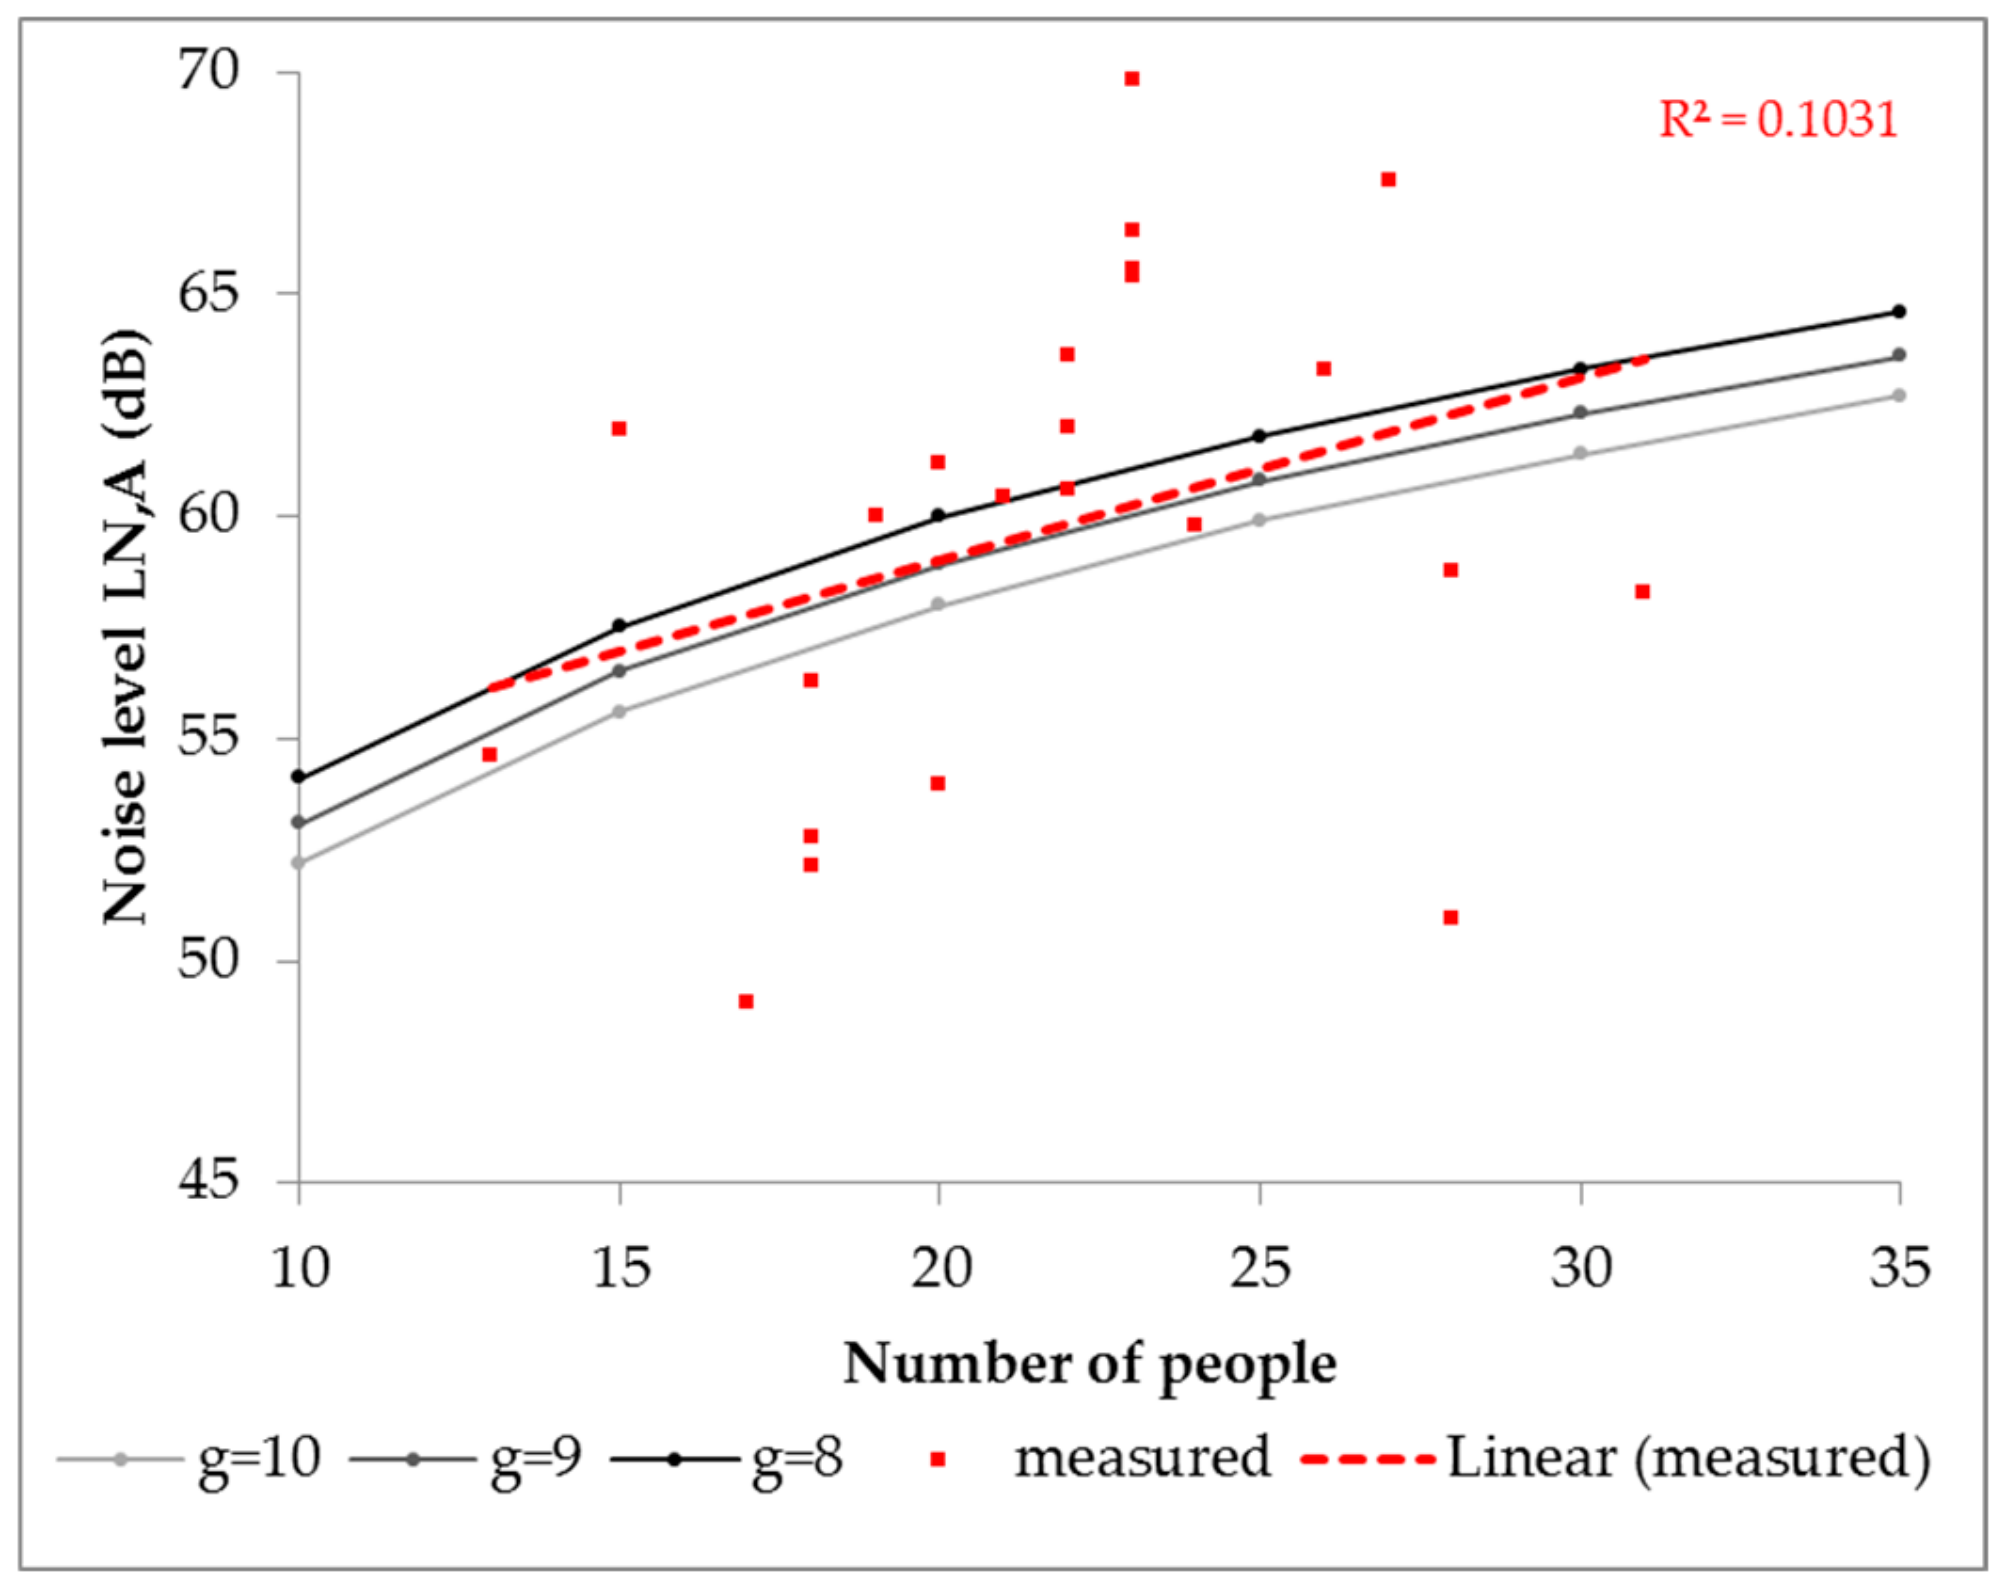
4.2. Optimization of the g Value for Prediction of Ambient Noise Levels

Figure 3 reports the results from the sound levels and occupancy monitoring in the living room and compares them with the prediction model (1) for ambient noise levels, considering a Lombard slope values c = 0.5 dB/dB, a sound absorption per person value Ap = 0.2 m2, and the group size values g of 8, 9 and 10, accordingly [24]. Assuming that groups size g values in the 8–10 persons range were being considered, datapoints related to occupancy lower than eight people in the living room were removed (i.e., since g represents the ratio between present persons and speaking persons, it does not make sense to have “less than 1 person” speaking in the room). From the trend line (linear regression) of the sound levels measured on site, it can be observed that a group size value g = 9 gives the best match between the prediction model and the measured noise levels values.
Following the work developed by Rindel [24], additional values of the Lombard slope and absorption per person were tested, as a function of group size. For this purpose, predicted ambient noise levels were determined according to the model in (1) using actual occupancy levels, under different configurations of c, Ap and g values; these were then compared with measured noise levels and average deviations were calculated. Table 1 shows that only for c = 0.5 dB/dB are the average deviations from measured levels reasonably small (0.8–1.2 dB), with the smallest deviation using g = 9 (0.3 dB). When looking at the same information (g = 9) from the point of view of absorption per person, Table 2 shows that a variation in Ap from 0.2 to 0.5 m2 leads to a rather small effect on the average deviations (0.1–0.5 dB). Therefore, the application of the prediction model to the present case study would return the most accurate results with c = 0.5 dB/dB, Ap = 0.2 m2 and g = 9; this suggests that, in the case of facilities hosting older adults in special care, values higher than g = 8 [24,30] might be appropriate.

4.3. Acoustical Capacity Pre- and Post-Intervention

As mentioned in the Introduction, Rindel [28,29] suggests that, for a room with known physical and room acoustics characteristics, it is possible to estimate the maximum number of persons—i.e., the acoustical capacity (Nmax)—in order to have a sufficient quality of verbal communication by means of Equation (2). However, the formula (2) assumes Ap = 0.35 m2 and g = 3.5, whilst the analysis reported in Section 4.2 shows that, for the specific case of a NH hosting people with BPSD among other residents, the most accurate set of parameters to feed into the model was: Ap = 0.2 m2 and g = 9. Furthermore, it would not be accurate to assume 71 dB as the threshold value for sufficient quality of verbal communication for the particular group of users of this case study. The relationship between speech level (LS,A,1m) and ambient noise level (LN,A) has been extensively discussed in the literature [25,37]: considering the relation between these two parameters in terms of signal-to-noise ratio (SNR), Lazarus [38] suggests that for a reference listener, the quality of verbal communication is sufficient if SNR > −3 (LN,A < 71 dB). Nevertheless this criterion should apply only for normal hearing people, and the ISO 9921:2003 reports that “people with a slight hearing disorder (in general older people) or non-native listeners require a higher signal-to-noise ratio (approximately 3 dB)” [39]. This implies that in the case of an NH, where profound rather than slight hearing disorder is likely to affect many residents, the most appropriate choice could indeed be an even higher SNR than the 0 dB (LN,A < 65 dB) recommended by the ISO [40]. For this reason, a condition with SNR > 3 dB (LN,A < 59 dB) was considered to reflect a “sufficient” quality of verbal communication for this group of users. Figure 4 reports a comparison between these three conditions, where a 3-dB and a 6-dB shift can be observed for slight and profound hearing disorders, accordingly, in the assessment of quality of verbal communication.
Therefore, assuming the new set of parameters, considered at the sufficient quality level for profound hearing disorder, the revised relationship for acoustical capacity in Nursing Homes (NH) would result in
N max , NH V 33.6 · T
where V is the volume in m3 of the room and T is the reverberation time (s) in furnished but unoccupied condition at mid-frequencies.
Using the formula (3), the acoustical capacity of the NH living room prior to the acoustical retrofit interventions can be calculated and it is Nmax,NH = 20. From observation data on site, the average occupancy was 21 people; thus, the acoustical capacity would already be exceeded, and the saturation ratio N/Nmax,NH would be 1.05, giving the living room an insufficient quality of verbal communication [29,38].
The acoustical retrofit interventions in the living room (Figure 5) had a number of positive implications in terms of airborne and impact sound transmission from the living room to adjacent spaces (corridors and bedrooms) [13], but the most significant improvements were observed for reverberation time with a 57% reduction. While there was no urgent need for such a drastic reduction, it was decided together with manufacturers and NH management that the intervention would be deployed to its full potential to demonstrate the margins of improvement in other conditions. The new acoustical capacity of the living room after the acoustical correction was calculated and was Nmax,NH = 47. Considering the same 21 people for occupancy as before, the new condition is providing a saturation ratio of 0.45, pushing the average quality of verbal communication of the living room from insufficient to “satisfactory” [29]. Considering the Equation (3), this means that the highest acceptable reverberation time prior to the acoustic retrofit would have been 0.87 s (instead of the actual 0.91 s).

5. Discussion

The living room of a nursing home (NH) hosting people with BPSD (among other residents) was considered as a case study to test the applicability of a prediction model of ambient noise levels and a simplified equation to determine the acoustical capacity of a space, as proposed by Rindel [24]. The original model was developed for eating establishments, and it was validated on different types of facilities, such as bistros, cafeterias and restaurants, and senior residence dining rooms, the latter being the closest type of facility to a NH living room, as included in the AcustiCare project. In particular, for the definition of the acoustical capacity relationship as a function of volume and reverberation time, the Equation (2) assumes a group size value g = 3.5, an absorption per person value Ap = 0.35 m2, and a reference ambient noise level that does not exceed LN,A = 71 dB to guarantee sufficient quality of verbal communication. However, the living rooms of NHs are quite an extreme case on the spectrum of possible facilities and the results of this study show that if the general formula were to be used with the abovementioned parameters values, the actual acoustical capacity of the NH living room would be overestimated by approximately 65%.
The group size g value is an indicator of the level of arousal of the gathering and for the NH living room it was expected to be much higher than the 3–4 range typically working for average facilities. Rindel [24] proposes that for senior residence dining rooms, a group size as high as g = 8 should be considered, because the conversation might not be very lively. Results from the present study suggest that, for the specific group of people with dementia (with some of them expressing BPSD) in nursing homes, levels of interaction/conversation might be even lower because of (among other aspects) cognitive impairment, thus leading to higher g values. Because the levels of arousal are likely to vary at any facility over time, the optimal value for group size g might change accordingly. In [24], an example is provided for a reception in a public eating establishment where guests are served alcohol: the arousal level could increase with time, leading to a decreasing group size (i.e., more people talking) and increasing noise level with time. To some extent, similar dynamics of arousal and activity variations might also be expected in the case of a nursing home. Thus, further research might consider this aspect and test different g values depending on the activity taking place in the NH living room. Indeed, verbal communication is certainly a key function of the NHs living rooms, but it is not the only function contributing to ambient noise levels, as both Figure 2 and Figure 3 seem to confirm.
According to Rindel [24], the absorption per person Ap value should range between 0.2 and 0.5 m2. This is affected by people’s behaviour in the environment (e.g., whether they are sitting or standing) and the type of clothes they are wearing. Rindel highlights that Ap would have a smaller effect on the accuracy of the model than the actual equivalent absorption area per person in the room, and in the case of seated people, Ap should be considered as the additional amount of absorption compared to the empty chairs. For seated persons wearing light summer clothes, Rindel suggests that the lowest value of the range should be considered [24]. The results of this study are in line with this suggestion, and this could be explained by the fact that the majority of NH residents are indeed sitting for most of the time and, being in a domestic environment, they tend to wear lighter clothes than other people would in a publicly accessible facility; the same applies, to some extent, to staff members who wear standard uniform for care personnel.
Finally, the ambient noise level taken as reference for a sufficient quality of verbal communication also has a considerable effect on the determination of the acoustical capacity. Considering the relation between the vocal effort of a person, the speech level and the ambient noise level, Lazarus [38] assumes that for normal listeners an SNR > −3 dB would suffice for acceptable quality of verbal communication; however, empirical evidence suggests that a more conservative limit should be adopted for people with profound hearing impairment (which has a higher prevalence on older adults with dementia), thus this approach was adopted in the present application and an SNR = 3 dB was used instead. Where the ISO standard relates the ageing to a shift in SNR of 3 dB, higher levels could be considered, at least for elderly with a profound hearing deficit. Indeed, it has been shown [40] that elderly patients with cochlear implantations show an improved speech perception in noise (44% at SNR + 15 dB, 37% at SNR + 10 dB and 27% at + 5dB) and additional improvements in global cognitive functioning, indicating the importance of the level of deficit affecting elderly in general, and the strong impact of an improved SNR on their speech perception and functioning.
When applying this model in the context of nursing homes living rooms, and calculating the acoustical capacity, the lower level of arousal expressed as higher g value that would lead to potentially higher levels of occupancy is compensated by a more stringent threshold for ambient noise levels related to the quality of verbal communication for hearing impaired groups. Using a group size value g = 9, while keeping the acceptable ambient noise level to 71 dB for sufficient quality of verbal communication, would result in acoustical capacity values that are unrealistic (e.g., 200+ people in the living room with reverberation time retrofitted to 0.39 s).
On a different note, nursing homes are facilities that function with a relatively constant routine. The living rooms represent the space where social interaction happens and this is affected also by how the NH management plans the activities and the layout of the space (e.g., how tables and other furniture are arranged, what time slots—if any—are scheduled for external visitors’ access, how and when food is served, etc.). This implies that many other sound sources are present/dominant at specific times of the day that go beyond human conversation: it is one of the limitations of this study, where further research would require additional processing of the acoustic data to isolate speech and disregard other sources (staff cleaning, trolleys in the room, etc.). Larger deviations of the predicted values from the measured data are indeed observed when moving away from the peak times of activity of the NH living room (i.e., when meals are being served). However, this issue is common to other eating establishments, where conversations are just one of the sources contributing to the acoustic climate of a place and many other non-verbal events are occurring, so, to some extent, the model has to statistically take into account that as well.

6. Conclusions

Applying the prediction model for ambient noise levels (1) for eating establishments with the average parameters proposed by Rindel to calculate the acoustical capacity of the Nursing Home considered in this work might give misleading results. If no special consideration is made, the simplified formula (2) would return an acoustical capacity of 33 people (sufficient for the average occupancy of the living room), while the optimization of the model for the specific case led to a revised formula (3) that has the acoustical capacity of the investigated living room capped at 20 people (thus insufficient, if no correction is made on reverberation time). One of the limitations of this study is that its dataset currently does not differentiate between sound levels that are generated by verbal communication or rather other sound sources. Future works should possibly consider algorithms for sound sources recognition and separation to explain larger amounts of variance in the prediction models.
For the investigated case, the model (1) for ambient noise levels was found to provide reasonably good prediction of measured data when the key parameters Ap and g are optimized. The main outcomes of the study are:
  • In the living room of a nursing home hosting people with BPSD, the prediction model gave the best results with a set of parameters that deviates considerably from those proposed for other eating establishments; namely, c = 0.5 dB/dB, Ap = 0.2 m2 and g = 9;
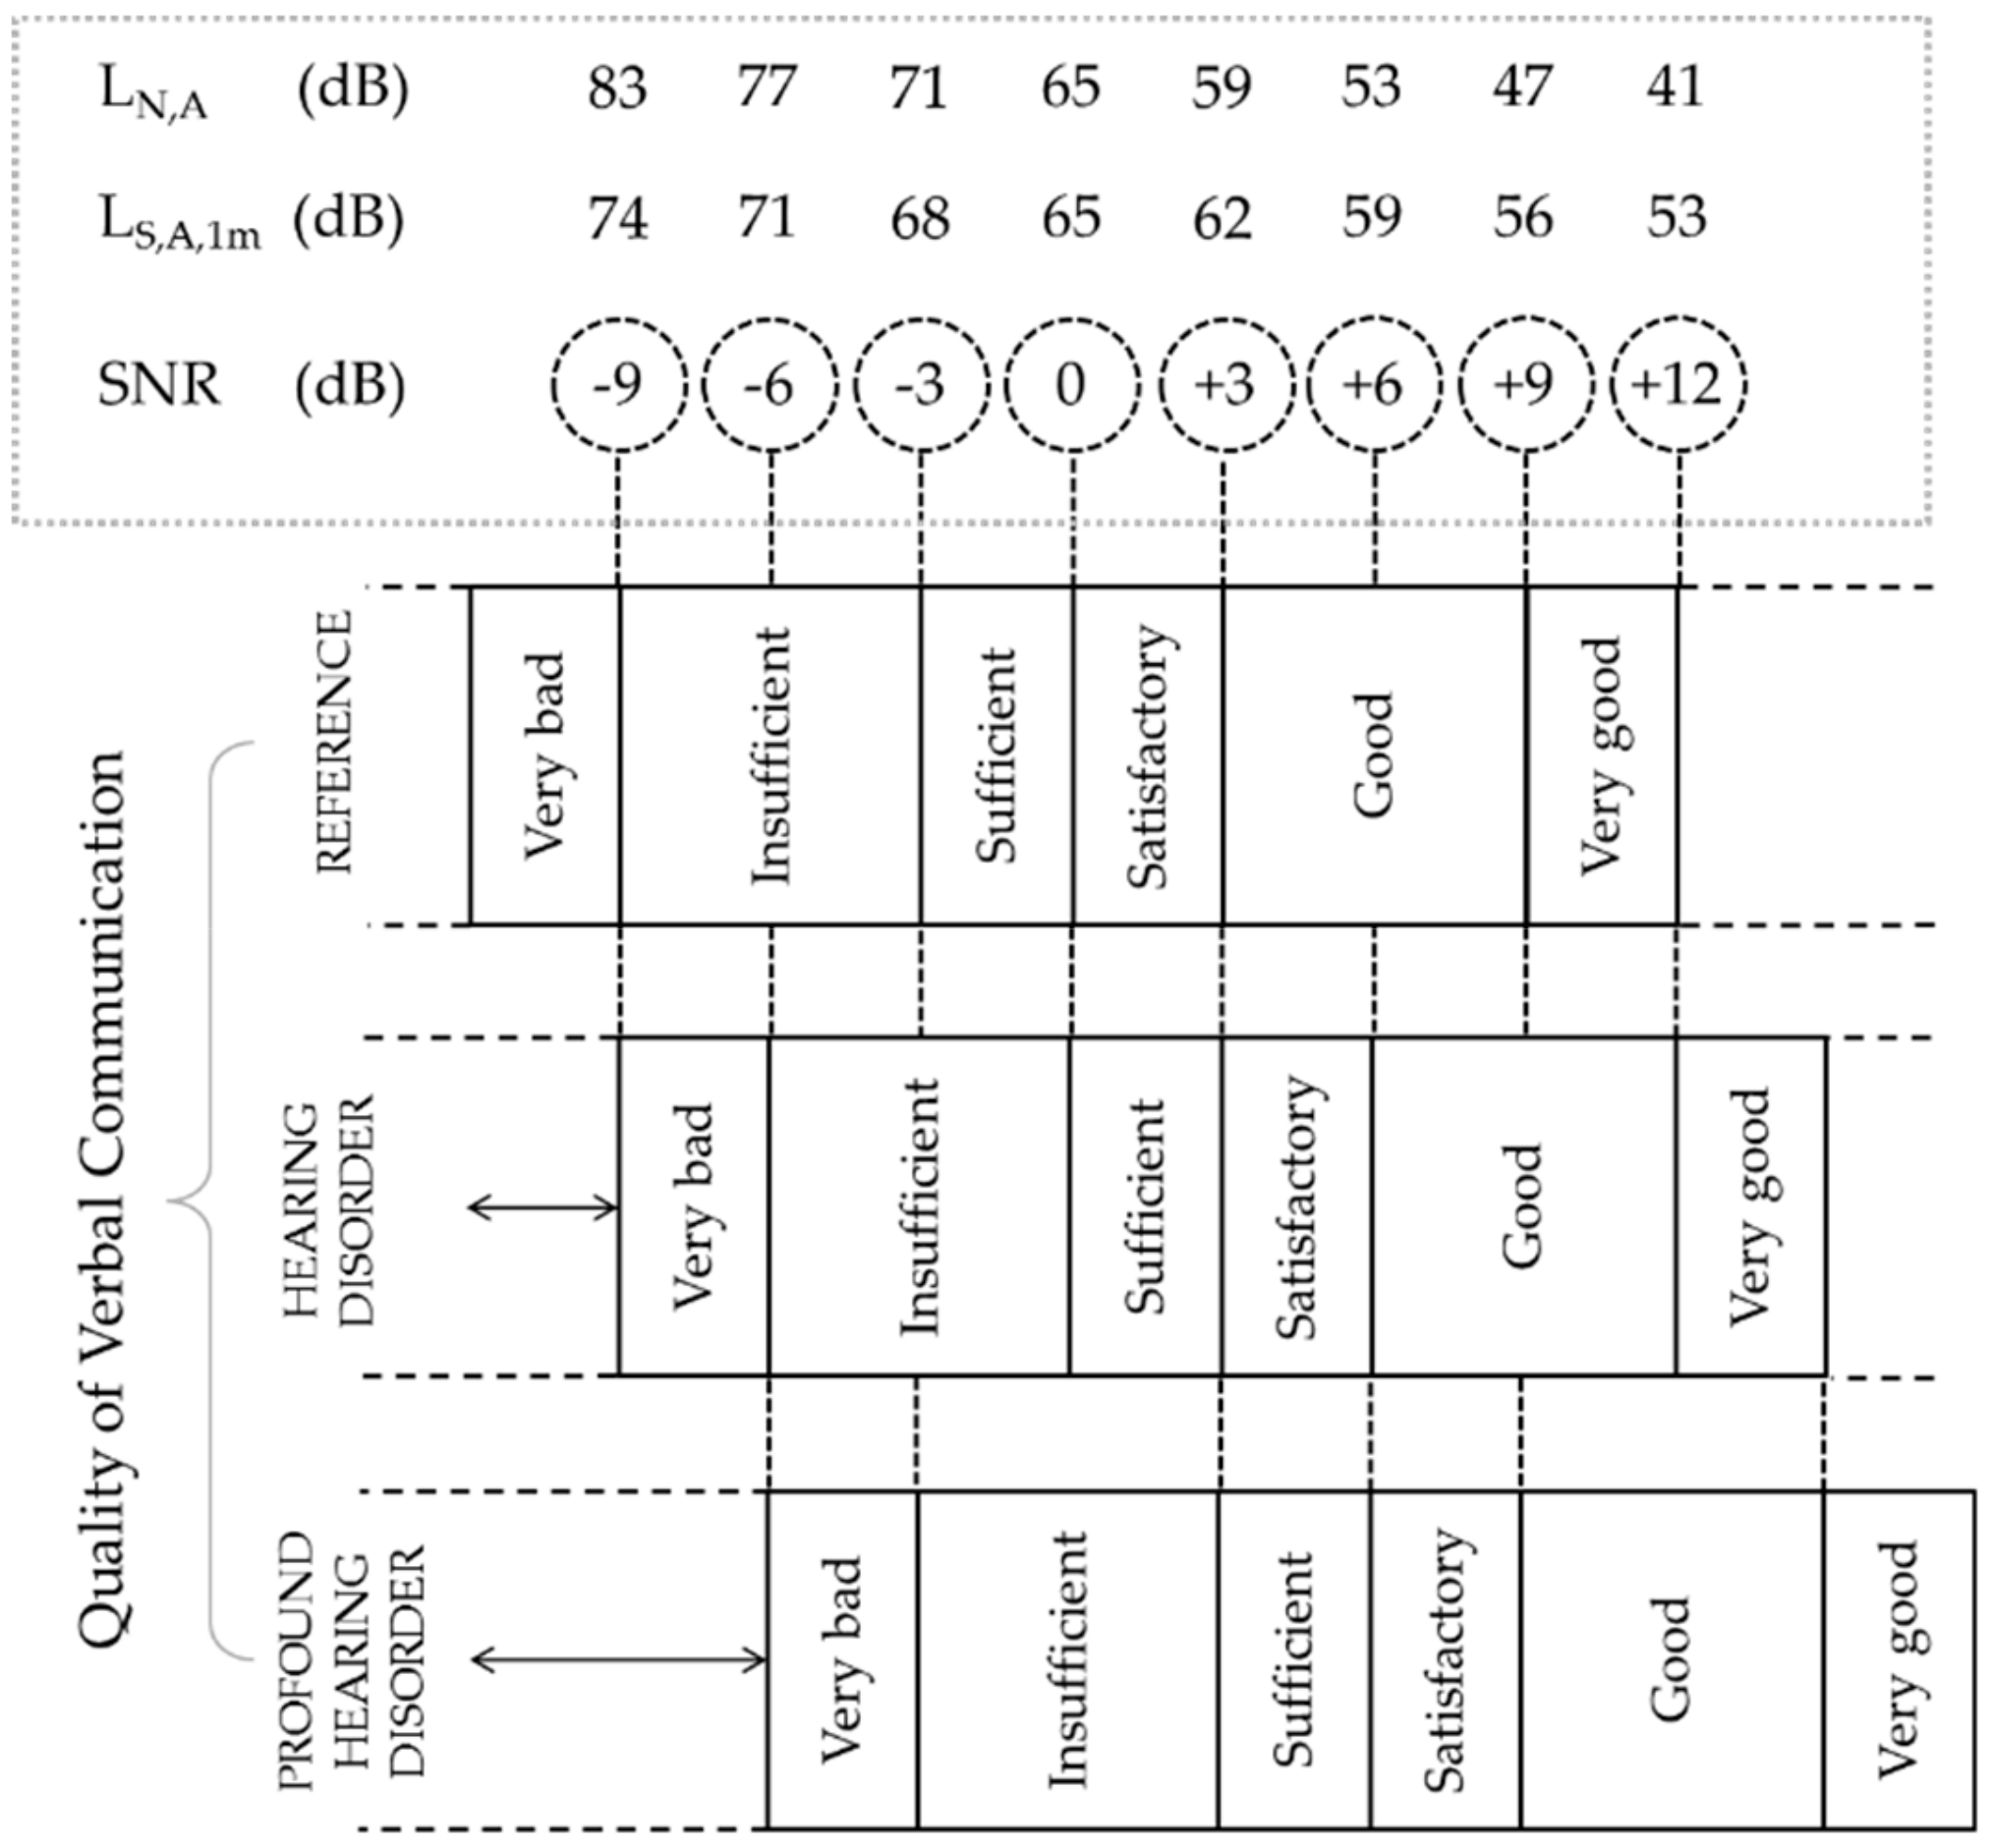
  • The admissible ambient noise level used as reference in determining the threshold for sufficient quality of verbal communication had to be adjusted to LN,A = 59 dB to return realistic values of acoustical capacity for the living room;
  • The acoustical retrofit intervention implemented in the living room of the AcustiCare case study increased the acoustical capacity of the space by 27 people, leading to a much lower occupancy saturation ratio under normal functioning conditions and an improved quality of verbal communication from “insufficient” to “satisfactory”.
Altogether, the findings of this study highlight the importance of having specific acoustic design criteria for care facilities, considering the potentially vulnerable groups of user that they host. Poor acoustic quality in such spaces might be detrimental to personal conditions for residents and exacerbate work-induced stress for staff. This work shows that there is scope to apply the acoustical capacity concept in nursing homes hosting older adults with dementia as a further design parameter to integrate with those that are conventionally used in general building and room acoustics practice; this will provide useful information for NH management about the number of residents a living space can comfortably accommodate, while guaranteeing good quality of verbal communication and less stress for both residents and staff.

Author Contributions

Conceptualization, F.A. and P.D.; methodology, F.A. and P.D.; formal analysis, F.A.; investigation, F.A., P.T., T.V.M., P.D.; resources, P.D., D.V.d.V., P.D.V., D.B.; data curation, F.A., P.T., P.D.; writing—original draft preparation, F.A.; writing—review and editing, all authors; supervision, P.D., M.P.; project administration, P.D.; funding acquisition, P.D., D.V.d.V., P.D.V, D.B. During the AcustiCare project F.A. was a post-doctoral researcher at Ghent University. All authors have read and agreed to the published version of the manuscript.

Funding

The AcustiCare project is supported by the Flemish Agency for Innovation and Entrepreneurship (VLAIO) under the TETRA program for applied research (grant no. HBC.2016.0089).

Acknowledgments

The authors are grateful to the staff members of the nursing homes, their residents and their relatives, the acoustic consultants and companies for their participation in the project.

Conflicts of Interest

The authors declare no conflict of interest.

References

  1. Van den Bosch, K.A. Safe and Sound: Soundscape Research in Special Needs Care; University of Groningen: Groningen, The Netherlands, 2015. [Google Scholar]
  2. Brown, J.; Fawzi, W.; Shah, A.; Joyce, M.; Holt, G.; McCarthy, C.; Solomon-Ayeh, K. Low stimulus environments: Reducing noise levels in continuing care. BMJ Open Qual. 2016, 5, u207447. [Google Scholar] [CrossRef] [Green Version]
  3. Peng, J.; Zeng, Y.; Zhao, L.; Zeng, J. An investigation of acoustical environments in the elderly care facilities. Appl. Acoust. 2018, 137, 45–50. [Google Scholar] [CrossRef]
  4. Sanford, A.M.; Orrell, M.; Tolson, D.; Abbatecola, A.M.; Arai, H.; Bauer, J.M.; Goel, A. An International Definition for “Nursing Home”. J. Am. Med Dir. Assoc. 2015, 16, 181–184. [Google Scholar] [CrossRef]
  5. United Nations. World Population Ageing: 1950–2050; Department of Economic and Social Affairs—Population Division, United Nations Publications: New York, NY, USA, 2001. [Google Scholar]
  6. Van den Bosch, K.A.; Andringa, T.C.; Başkent, D.; Vlaskamp, C. The Role of Sound in Residential Facilities for People With Profound Intellectual and Multiple Disabilities. J. Policy Pract. Intellect. Disabil. 2016, 13, 61–68. [Google Scholar] [CrossRef]
  7. Aletta, F.; Botteldooren, D.; Thomas, P.; Vander Mynsbrugge, T.; De Vriendt, P.; Van de Velde, D.; Devos, P. Monitoring Sound Levels and Soundscape Quality in the Living Rooms of Nursing Homes: A Case Study in Flanders (Belgium). Appl. Sci. 2017, 7, 874. [Google Scholar] [CrossRef] [Green Version]
  8. Aletta, F.; Vander Mynsbrugge, T.; Van de Velde, D.; De Vriendt, P.; Thomas, P.; Filipan, K.; Devos, P. Awareness of 'sound' in nursing homes: A large-scale soundscape survey in Flanders (Belgium). Build. Acoust. 2018, 25, 43–59. [Google Scholar] [CrossRef]
  9. Van den Bosch, K.A.; Andringa, T.C.; Post, W.J.; Ruijssenaars, W.A.; Vlaskamp, C. The relationship between soundscapes and challenging behavior: A small-scale intervention study in a healthcare organization for individuals with severe or profound intellectual disabilities. Build. Acoust. 2018, 25, 123–135. [Google Scholar] [CrossRef]
  10. Hayne, M.J.; Fleming, R. Acoustic design guidelines for dementia care facilities. In Proceedings of the Internoise 2014 Conference, Melbourne, Australia, 16–19 November 2014. [Google Scholar]
  11. Fleming, R.; Purandare, N. Long-term care for people with dementia: Environmental design guidelines. Int. Psychogeriatr. 2010, 22, 1084–1096. [Google Scholar] [CrossRef] [Green Version]
  12. Devos, P.; Aletta, F.; Thomas, P.; Petrovic, M.; Vander Mynsbrugge, T.; Van de Velde, D.; Botteldooren, D. Designing Supportive Soundscapes for Nursing Home Residents with Dementia. Int. J. Environ. Res. Public Health 2019, 16, 4904. [Google Scholar] [CrossRef] [Green Version]
  13. Thomas, P.; Aletta, F.; Filipan, K.; Vander Mynsbrugge, T.; De Geetere, L.; Dijckmans, A.; Devos, P. Noise environments in nursing homes: An overview of the literature and a case study in Flanders with quantitative and qualitative methods. Appl. Acoust. 2020, 159, 107103. [Google Scholar] [CrossRef]
  14. Milisen, K.; Abraham, I.; Siebens, K.; Darras, E.; Dierckx de Casterlé, B. Work environment and workforce problems: A cross-sectional questionnaire survey of hospital nurses in Belgium. Int. J. Nurs. Stud. 2006, 43, 745–754. [Google Scholar] [CrossRef]
  15. Xie, H.; Kang, J.; Mills, G.H. Clinical review: The impact of noise on patients' sleep and the effectiveness of noise reduction strategies in intensive care units. Crit. Care 2009, 13, 208. [Google Scholar] [CrossRef] [Green Version]
  16. Xie, H.; Kang, J. The acoustic environment of intensive care wards based on long period nocturnal measurements. Noise Health 2012, 14, 230–236. [Google Scholar]
  17. Gopinath, B.; Thiagalingam, A.; Teber, E.; Mitchell, P. Exposure to workplace noise and the risk of cardiovascular disease events and mortality among older adults. Prev. Med. 2011, 53, 390–394. [Google Scholar] [CrossRef]
  18. Passchier-Vermeer, W.; Passchier, W.F. Noise exposure and public health. Environ. Health Perspectve 2000, 108, 123–131. [Google Scholar]
  19. World Health Organization. Burden of Disease from Environmental Noise; WHO Regional Office for Europe: Copenhagen, Denmark, 2011. [Google Scholar]
  20. Śliwińska-Kowalska, M.; Zaborowski, K. WHO Environmental Noise Guidelines for the European Region: A Systematic Review on Environmental Noise and Permanent Hearing Loss and Tinnitus. Int. J. Environ. Res. Public Health 2017, 14, 1139. [Google Scholar] [CrossRef]
  21. Department of Health. Health Technical Memorandum 08-01: Acoustics; Specialist Services; Department of Health: London, UK, 2013. Available online: https://assets.publishing.service.gov.uk/government/uploads/system/uploads/attachment_data/file/144248/HTM_08-01.pdf (accessed on 12 May 2020).
  22. Graham, M.E. Re-socialising sound: Investigating sound, selfhood and intersubjectivity among people living with dementia in long-term care. Sound Stud. 2018. [Google Scholar] [CrossRef]
  23. Devos, P.; Aletta, F.; Vander Mynsbrugge, T.; Thomas, P.; Filipan, K.; Petrovic, M.; Botteldooren, D. Soundscape Design for Management of Behavioral Disorders: A Pilot Study among Nursing Home Residents with Dementia. In Proceedings of the Internoise 2018 Conference, Chicago, IL, USA, 26–29 August 2018. [Google Scholar]
  24. Rindel, J.H. Verbal communication and noise in eating establishments. Appl. Acoust. 2010, 71, 1156–1161. [Google Scholar] [CrossRef]
  25. Devos, P.; Thomas, P.; Aletta, F.; Vander Mynsbrugge, T.; De Vriendt, P.; Van de Velde, D.; Botteldooren, D. Towards understanding healthy and supportive acoustic environments: The case of a nursing home. In Proceedings of the International Conference on Acoustics ICA 2019, Aachen, Germany, 9–13 September 2019. [Google Scholar]
  26. Van Hout, N.H.; Hak, C.C.; Suren, S.; Kort, H.S. Acoustic measurements of sound levels in common rooms and sleeping rooms of care facilities for older adults. Gerontechnology 2014, 13, 86–87. [Google Scholar]
  27. Wiratha, M.S.; Tsaih, L. Acoustic comfort in long-term care facilities based on listening impressions from normal hearing individuals. Proc. Meet. Acoust. 2015, 25, 015003. [Google Scholar] [CrossRef] [Green Version]
  28. Rindel, J.H. The acoustics of places for social gatherings. In Proceedings of the Euronoise 2015 Conference, Maastricht, The Netherlands, 31 May–3 June 2015; pp. 2429–2436. [Google Scholar]
  29. Rindel, J.H. Acoustical capacity as a means of noise control in eating establishments. In Proceedings of the Joint Baltic-Nordic Acoustic Meeting BNAM 2012, Odense, Denmark, 18–20 June 2012. [Google Scholar]
  30. Hodgson, M.; Steininger, G.; Razavi, Z. Measurement and prediction of speech and noise levels and the Lombard effect in eating establishments. J. Acoust. Soc. Am. 2007, 121, 2023–2033. [Google Scholar] [CrossRef]
  31. International Organization for Standardization. ISO 3382-2:2008 Acoustics—Measurement of Room Acoustic Parameters—Part 2: Reverberation Time in Ordinary Rooms; ISO: Geneva, Switzerland, 2008. [Google Scholar]
  32. Fernandez-Prieto, J.A.; Cañada-Bago, J.; Gadeo-Martos, M.A. Wireless Acoustic Sensor Nodes for Noise Monitoring in the City of Linares (Jaén). Sensors 2020, 20, 124. [Google Scholar] [CrossRef] [Green Version]
  33. Alías, F.; Alsina-Pagès, R.M. Review of Wireless Acoustic Sensor Networks for Environmental Noise Monitoring in Smart Cities. J. Sens. 2019, 7634860. [Google Scholar] [CrossRef] [Green Version]
  34. Van Renterghem, T.; Thomas, P.; Dominguez, F.; Dauwe, S.; Touhafi, A.; Dhoedt, B.; Botteldooren, D. On the ability of consumer electronics microphones for environmental noise monitoring. J. Environ. Monit. 2011, 13, 544–552. [Google Scholar] [CrossRef]
  35. Picaut, J.; Can, A.; Fortin, N.; Ardouin, J.; Lagrange, M. Low-Cost Sensors for Urban Noise Monitoring Networks—A Literature Review. Sensors 2020, 20, 2256. [Google Scholar] [CrossRef]
  36. Flemish Government. Eindrapport Ontwikkeling Van Specifieke Energieprestatie-Indicatoren Voor Rusthuizen; Department of Welfare, Public Health and Family: Brussels, Belgium, 2010. [Google Scholar]
  37. Lazarus, H. Prediction of Verbal Communication is Noise—A review: Part 1. Appl. Acoust. 1986, 19, 439–464. [Google Scholar] [CrossRef]
  38. Lazarus, H. Prediction of verbal communication in noise—A development of generalized SIL curves and the quality of communication (Part 2). Appl. Acoust. 1987, 20, 245–261. [Google Scholar] [CrossRef]
  39. International Organization for Standardization. ISO 9921:2003 Ergonomics—Assessment of Speech Communication; ISO: Geneva, Switzerland, 2003. [Google Scholar]
  40. Mosnier, I.; Bebear, J.P.; Marx, M.; Fraysse, B.; Truy, E.; Lina-Granade, G.; Mondain, M.; Sterkers-Artières, F.; Bordure, P.; Robier, A.; et al. Improvement of Cognitive Function After Cochlear Implantation in Elderly Patients. JAMA Otolaryngol. Head Neck Surg. 2015, 141, 442–450. [Google Scholar] [CrossRef]
Figure 1. Living room of the case study NH.
Applsci 10 04205 g001
Figure 2. Occupancy levels stratified by user types and A-weighted equivalent sound levels as a function of time during the monitoring day in the living rooms.
Applsci 10 04205 g002
Figure 3. Prediction curves of the assumed group size parameter g [24]: measured (with linear regression) and predicted ambient noise levels as a function of occupancy.
Applsci 10 04205 g003
Figure 4. Threshold values of speech levels and ambient noise levels for the quality of verbal communication and its relation to SNR as suggested: by Lazarus [38] for reference listeners; inferred from ISO 9921 for listeners with slight hearing disorders [39]; hypothesised for listeners with profound hearing disorders [40].
Applsci 10 04205 g004
Figure 5. Picture of the nursing home (NH) living room after the installation of the acoustic floating floor and absorbing ceilings.
Applsci 10 04205 g005
Table 1. Average deviations between predicted and measured noise levels in the living room, using Ap = 0.2 m2 and different values for the parameters c and g.
c (dB/dB)Average Deviation (dB)
Group Size, g
8910
0.41.82.73.4
0.5−0.80.31.2
0.6−4.6−3.3−2.2
0.7−11.1−9.4−7.9
Table 2. Average deviations between predicted and measured noise levels in the living room, using c = 0.5 dB/dB and different values for the parameters Ap and g.
Ap (m2)Average Deviation (dB)
Group Size, g
8910
0.2−0.80.31.2
0.3−0.60.41.4
0.4−0.40.61.5
0.5−0.30.81.7

