Wireless Home Energy Management System with Smart Rule-Based Controller


1
Department of Electrical Engineering, United Arab Emirates University, P.O. Box 15551, Al-Ain 15258, UAE
2
Department of Electrical and Electronic Engineering, Eastern Mediterranean University, 99628 Gazimagusa, Northern Cyprus, 10 Mersin, Turkey
*
Author to whom correspondence should be addressed.
Appl. Sci. 2020, 10(13), 4533; https://0-doi-org.brum.beds.ac.uk/10.3390/app10134533
Submission received: 7 April 2020
/
Revised: 28 April 2020
/
Accepted: 2 May 2020
/
Published: 30 June 2020
(This article belongs to the Special Issue CITIES: Energetic Efficiency, Sustainability; Infrastructures, Energy and the Environment; Mobility and IoT; Governance and Citizenship)
Abstract
:Despite the increasing utilization of renewable energy resources, such as solar and wind energy, most residential buildings still rely on conventional energy supply by public utility services. Such utility services often use time-of-use energy pricing, which compels residential consumers to reduce their energy usage. This paper presents a wireless home energy management (HEM) system that enables the automatic control of home appliances to reduce energy consumption to assist such energy users. The system consists of multiple smart sockets that measure the energy that is consumed by the connected appliances and are capable of implementing on/off commands. The system includes other support components for supplying data to a central controller, which utilizes a rule-based HEM algorithm. The control rules were designed, such that the lifestyle of the user would be preserved while the energy consumption and daily energy cost were reduced. The experimental results showed that the central controller could effectively receive data and control multiple devices. The system was also found to afford significant reductions of 23.5 kWh and $2.898 in the total daily energy consumption and bill of the considered household setup, respectively. The proposed HEM system promises to be particularly useful for households with a high daily energy consumption.
1. Introduction
The world still mainly relies on non-renewable resources for residential energy supply through public utility services, despite the increasing integration of renewable energy sources in the electricity generation process. In this framework, residential consumers are compelled to minimize their energy usage in order to benefit from government incentives that encourage efficient public energy utilization by adjusting the time of energy usage and efficient devices, like LED lamps [1]. However, the main obstacle to the development of such energy management systems is the user inconvenience that results from the regulated energy use. Thus, many researches have attempted to develop home energy management (HEM) systems that minimize energy utilization while maintaining the highest possible level of user comfort.
A greedy iterative algorithm was used in [2] to schedule multiple user appliances in a smart grid system. The objective was to minimize the aggregated energy usage of all the consumers, mainly while using the day-ahead hourly energy price. However, the conclusions of the authors were only based on simulations and, thus, had no practical validation. In addition, a sufficient amount of constraints, such as user preference and comfort, were not properly incorporated into the optimization problem that minimizes energy consumption.
In [3], an artificial neural network was used to establish a convenient thermal environment in a domestic building by controlling the thermal loads. In a related work, a thermal model of a two-story house while using a novel gray box modeling approach was presented in [4]. With the special focus on thermal device models, a HEM system was developed, in which machine learning (ML) methods were used in [5] to train and optimize the energy consumption. However, the application of the utilized algorithm to many energy variables encountered in practice is not feasible. In [6] and [7], an appliance modeling software and optimization methods were used to consider the realistic operation of various home devices in the simulation of an HEM controller. The main objective of the controller was to reduce the load peaks and smoothen the power consumption trend. The utilized optimization algorithm considered the time of use pricing and outdoor temperature information, together with the preferences of the user. The employed appliance models were realistic for the development of an optimized HEM controller, according to the authors. Adika and Wang in [8] developed a smart demand-side energy management and scheduling system for households with photovoltaic (PV) systems. Similarly, different types of loads are intelligently scheduled in [9] in order to minimize the electricity usage bills when considering the maximal demand limit. The scheduler computed the expected load profile and PV generation of the user based on the weather forecast for a specific day of the week. The aggregated energy consumption of all the appliances was used to minimize the energy consumption by means of an optimized schedule that utilized a PV generator whenever possible [8]. However, this simulation-based work did not consider user comfort and user override constraints and actual PV output.
Similar to [5], in the simulation in [10], three types of loads were considered in the optimization problem of energy usage. The proposed controller received the outdoor temperature, energy cost, and pricing signal as inputs to the optimization problem. A convex cost function was used as the main objective function, with the maximization of user comfort. The use of a convex objective function might not be accurate from a practical perspective, because appliance-switching operations cause discontinuity in the energy consumption pattern. In [11], smart meter data consisting of the energy consumption and pricing signal from the supplier were used to simulate a HEM system. The system performed multi-objective optimization to minimize the daily electricity cost while maximizing the user convenience. The main shortcoming of the work was the use of limited constraints (only room and water temperatures) in the optimization. In a related effort, Moghaddam et al. [12] developed a programming model for solving the mixed-objective optimization problem of energy usage and user comfort. Instead of using smart meter data, the authors assumed that the required data could be acquired from users and local energy resources, such as PV systems. Although the simulation algorithm was used to decrease the energy consumption and user satisfaction, in practice the work did not consider manual bypass by the user [12]. Recently, reinforcement learning (RL), which is a Markov decision process based technique, has been applied in the EMS problems. Q-learning RL algorithm was applied in [13] to automatically schedule appliance tasks according to the demand response signals as well as customers’ requests and evaluations. However, the Q-learning RL discards the current data sample after every update, leading to the inefficient use of data. A detailed review that discusses the demand response schemes, the communication protocols, and the scheduling controller techniques, which are all required for the intelligent home EMSs, can be found in [14]. In this work, the scheduling controller techniques can be classified into rule-based, artificial intelligence (AI)-based, and optimization-based techniques.
References [15,16] bridge the gap between the simulations and practical implementation of HEM systems. The authors in [15] developed a test bed for the scheduling of lighting loads attached to a smart plug. The control scheme was based on the power consumption information received at the controller terminal, which, in turn, actuates the on/off commands for the loads. However, the work did not consider other important loads, such as thermal loads, which are major energy consumers and user comfort factors in practical households [15, 17] applied a binary backtracking search algorithm to optimally schedule and control various appliances using wireless smart sockets in order to reduce customer energy consumption during peak hours on real time basis.
As an advancement on previous works, [18] presented a comprehensive HEM algorithm that considered distributed generation and a battery storage system (BSS). The aim of the controller was the optimization of the utilization schedule through battery charging and discharge to minimize the daily energy cost of the household. The main contribution of the research was its consideration of a large number of home appliances and the use of real data to simulate multiple energy usage scenarios. A practical implementation of an energy management systems consisting of a home server and Zigbee-connected home appliances was also proposed in [19]. The server acquired weather forecast information from the Internet and used the data in order to estimate the required energy generation from connected distributed generators (DGs). A user interface was established in order to display the previous load profile and the generation history of the DGs, together with weather forecast information. However, the developed test bed could not be used to monitor the information required for the maintenance of user comfort, such as room temperature, thermal appliance set points, and water temperature in the electrical heater, which can also be used to improve the efficiency of an HEM system [19]. In the meantime, several companies have designed and sell home automation systems. For example, General Electric Co. [20], Honda [21], Samsung [22], Fibaro [23], and etc. designed a system that controls home appliances using smartphones. These systems offer strong support to customers by controlling and monitoring devices with smartphone applications. However, the main disadvantage of commercial home automation systems are that the details of their software and hardware are confidential and unavailable for academic research.
The above-mentioned works only considered appliances with low energy consumption and assumed that the management system did not significantly impact the daily bill. In some, many user comfort constraints were not considered, resulting in inefficiency of the developed systems and their inability to maintain user comfort. These issues were considered in the physical system developed in the present study through the use of support circuitries that provide online information regarding inputs related to user comfort and lifestyle, such as room temperature. The main contributions of the work can be summarized, as follows:
- Design and implementation of a complete home energy management system consisting of multiple smart sockets, a programmable air conditioner (AC) remote control, and room condition monitoring nodes for the acquisition of comfort data to be inputted to the main controller. All of these components are wirelessly connected by a Zigbee communication protocol, eliminating the need for complex wiring.
- Consideration of user comfort as the first priority of the energy management process. This makes it easier to integrate the system with the daily routine of the consumer without affecting their lifestyle.
- The development of a rule-based algorithm for reducing the energy consumption within a 24-h period on a repeatable basis.
2. Proposed HEM System
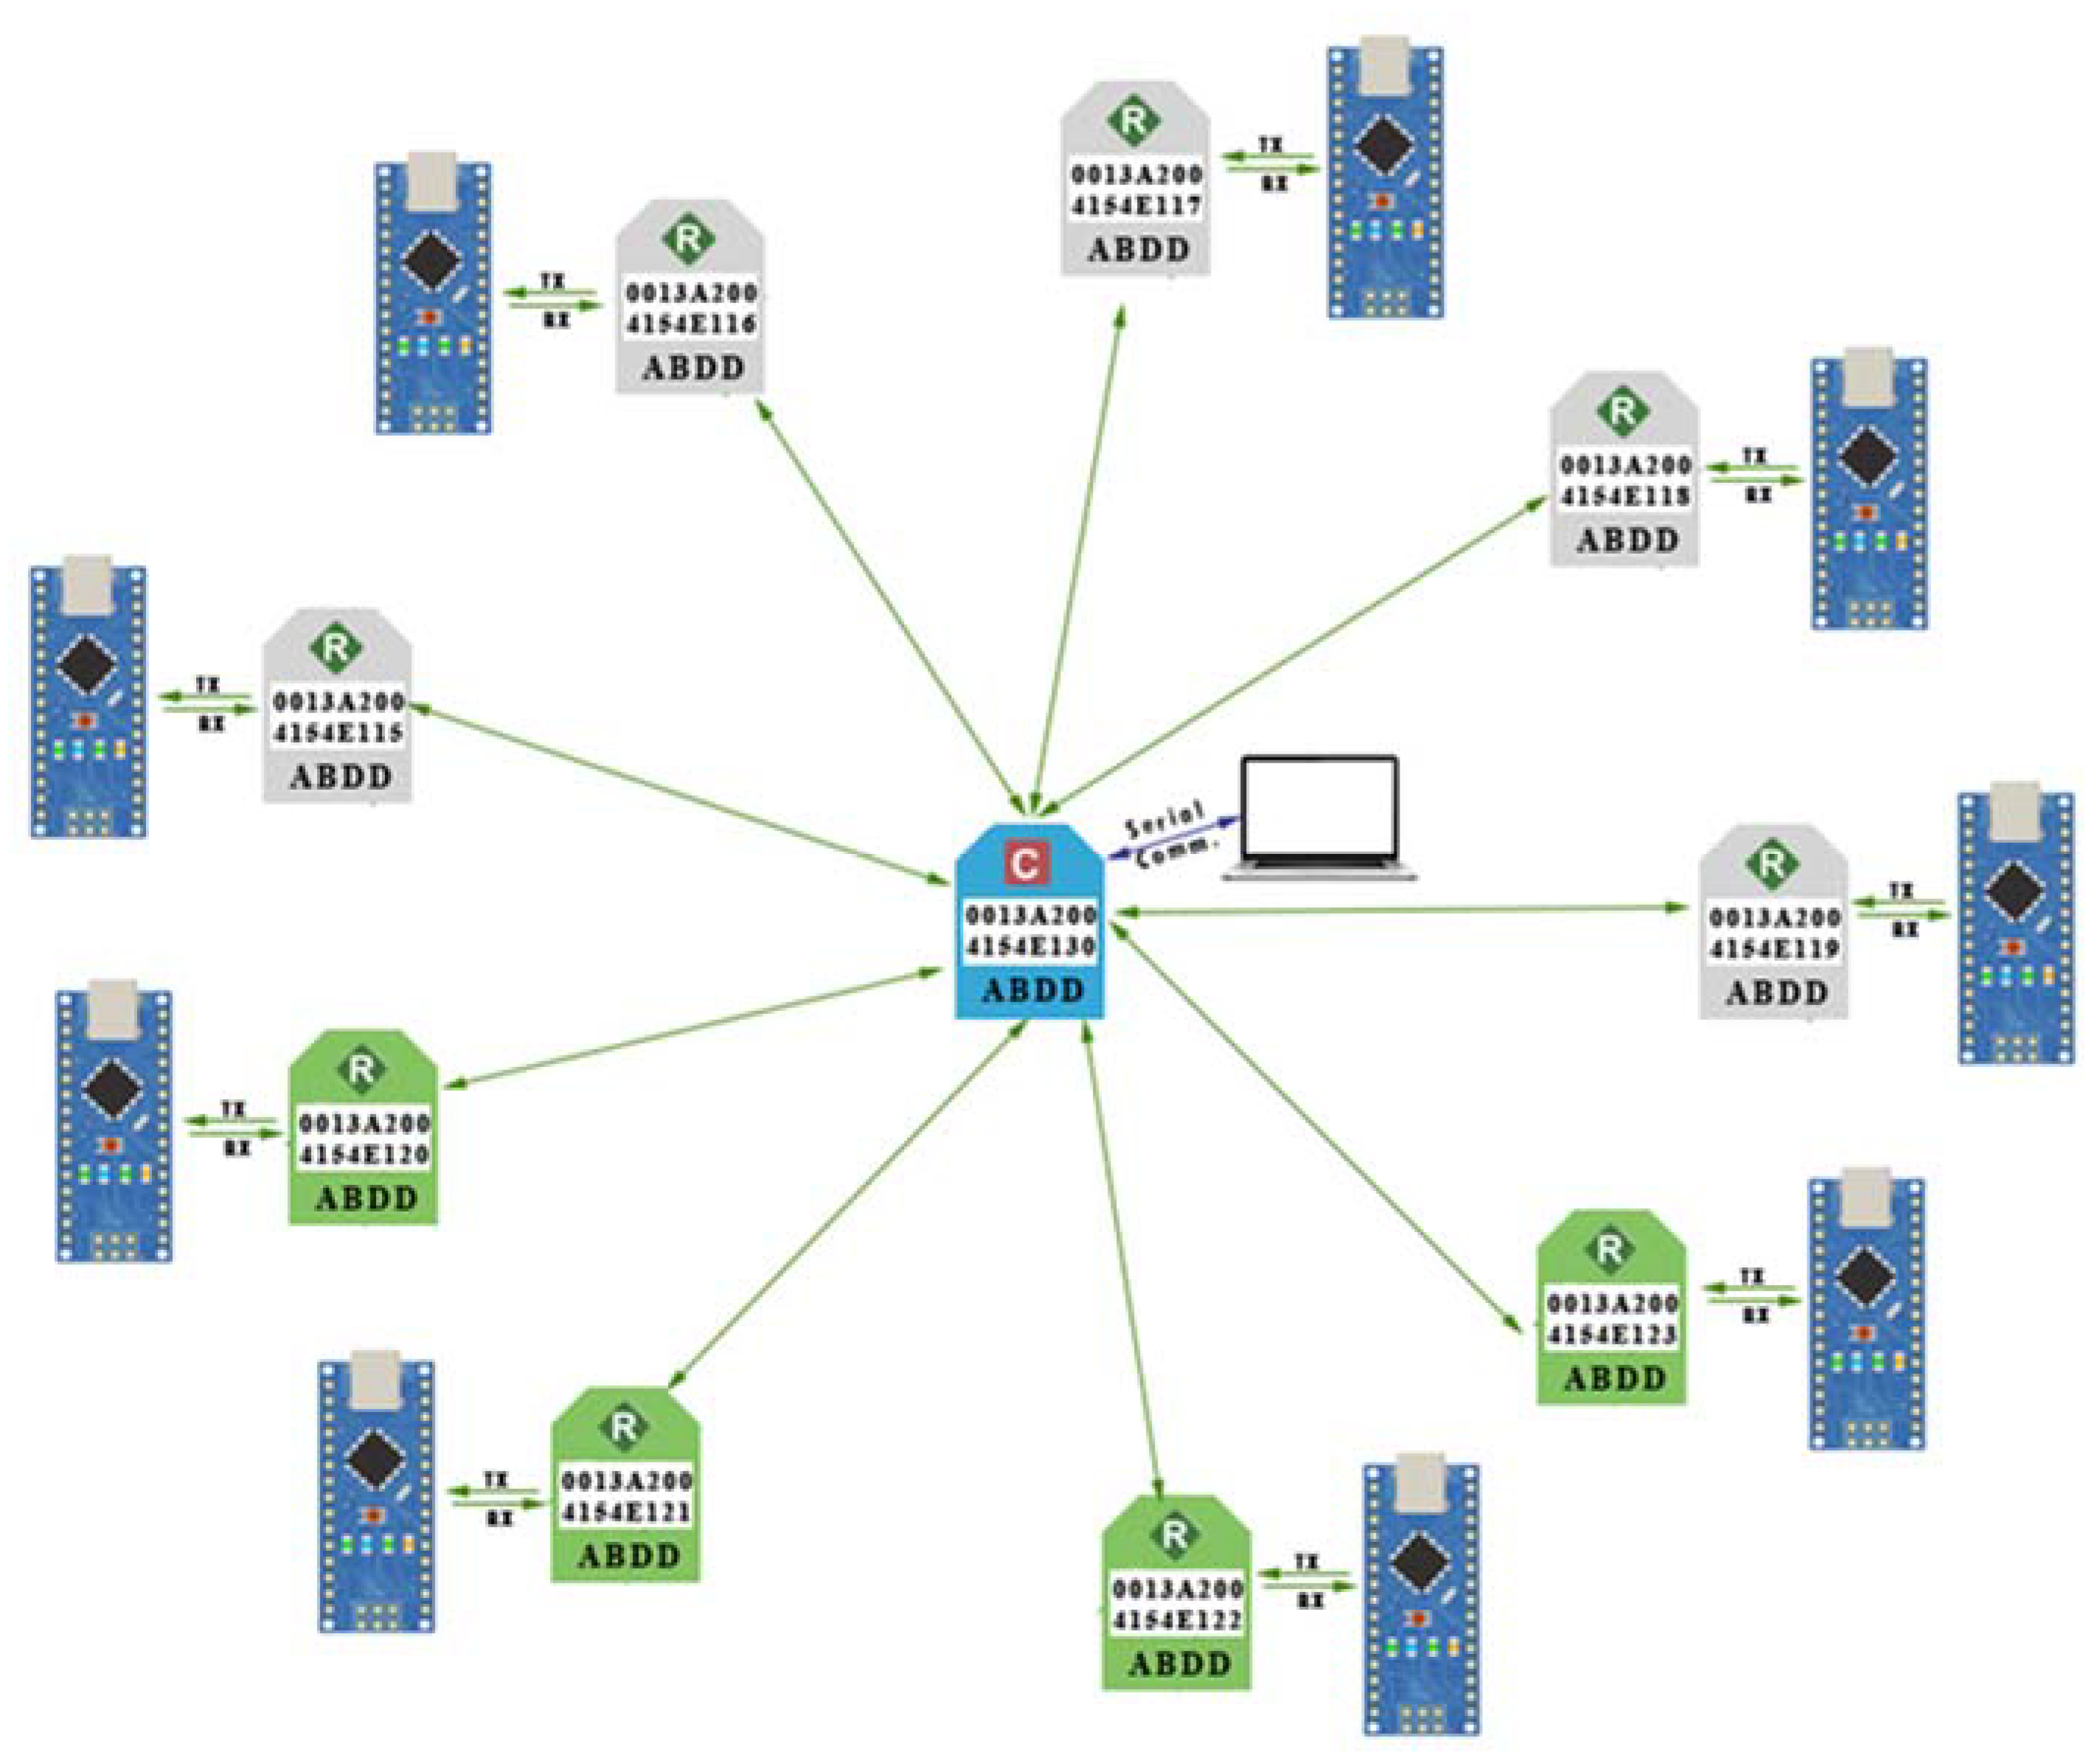
The HEM system developed in this paper consists of three major modules, namely the appliance monitoring and controlling circuitries, room condition monitoring circuitry, and main scheduling terminal. These three modules are connected by a ZigBee wireless communication protocol through XBee microcontrollers that are installed in the modules. The XBee microcontrollers are configured to the API 2 communication mode, which allows for the transmission of data as packets. One of the major advantages of using such packets is that address information it can be integrated into them, enabling the main controller to identify the module sending and receiving any data. However, the data should be coded as string bytes at the transmitting end and decoded as float values at the receiving end to fit into a transmission packet. Figure 1 shows an illustration of the proposed HEM system. Further details on each module are provided in the following subsections.
2.1. Scheduling Terminal
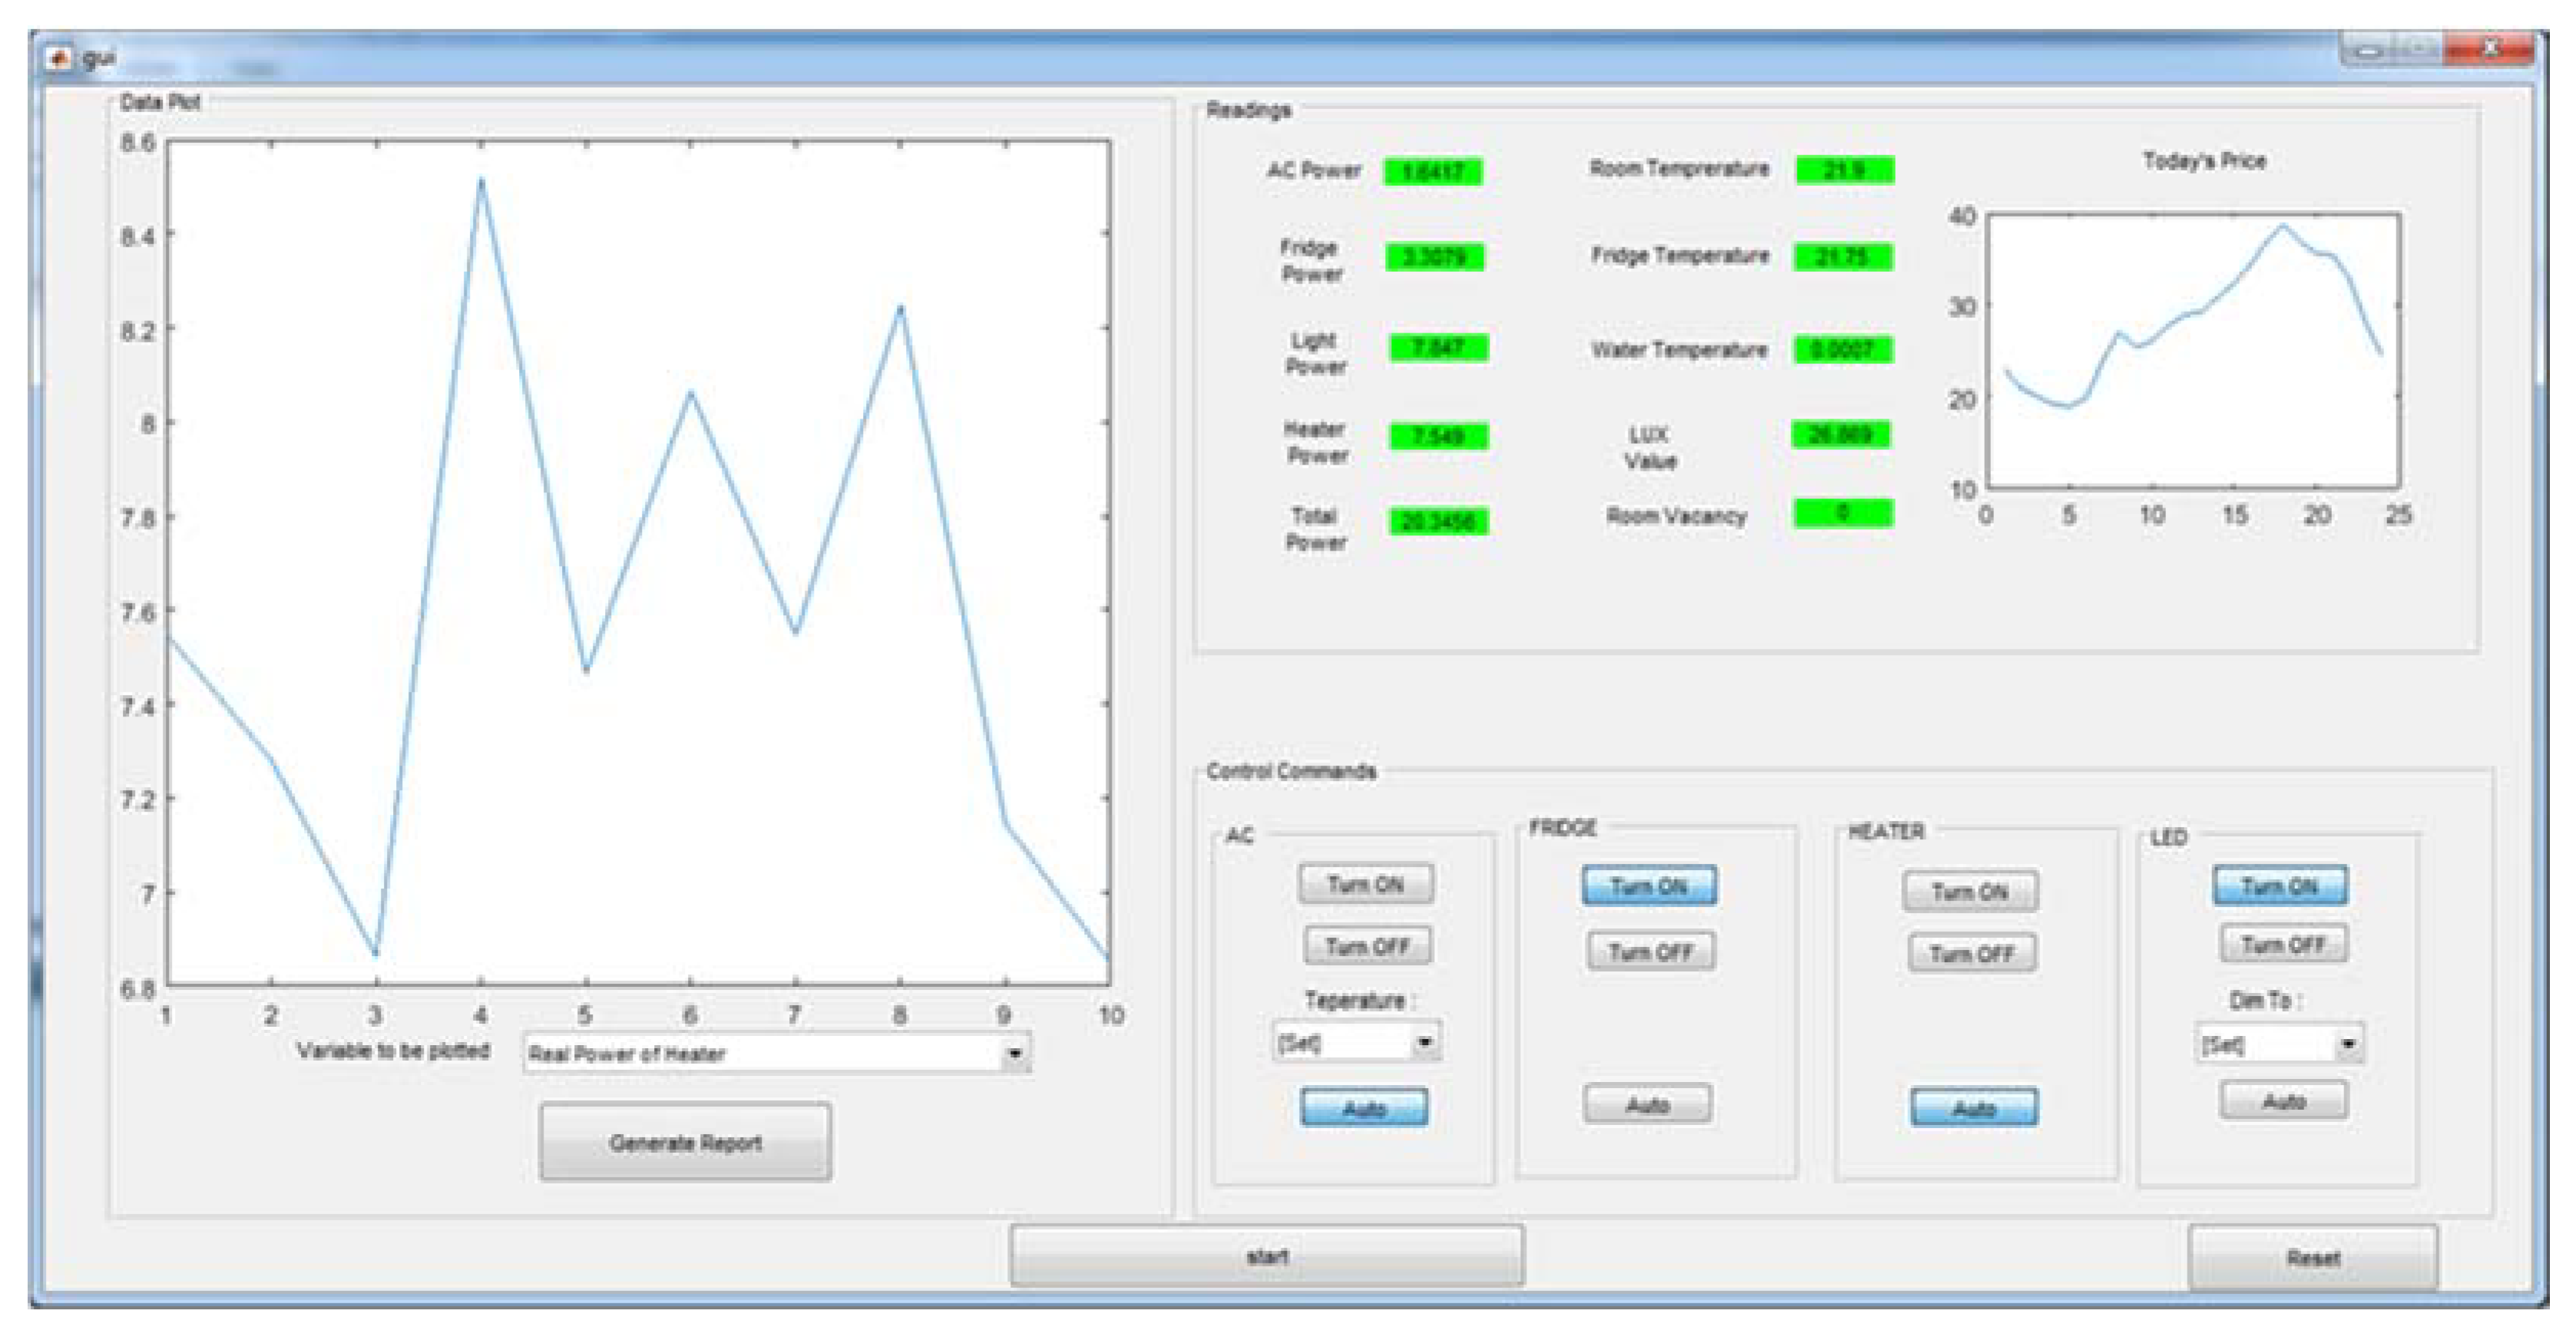
The configured XBee microcontroller is connected to a personal computer (PC) via a USB port and functions as a scheduling coordinator. A MATLAB program that is supported by a graphical user interface (GUI) on the main PC enables the user to input the desired comfort levels in terms of the room temperature, fridge temperature, water heater temperature, and illuminance ranges for the minimum, maximum, and normal pricing hours, respectively. The main scheduler also fetches the day-ahead pricing from the website of the utility service that are specified by the user. The day-ahead pricing trends used in the present study were obtained from [24]. The control commands are generated based on information predefined by the user, together with the power consumption information obtained from the smart sockets that are attached to the appliances, the heater outlet water temperature, and the room condition and occupancy information. The commands are in the form of binary decisions sent to specific smart plugs to turn on/off the connected appliances; dimming commands sent to Zigbee-connected dimmers to reduce/increase the light intensity of dimmable LEDs; and, temperature settings sent to Zigbee-connected infra-red (IR) remote controls to set ACs to specific temperatures. Figure 2 shows a screenshot of the scheduling coordinator’s GUI.
The user is able to manually send commands to the house appliances, to adjust the desired comfort level or the power consumption of a specific appliance or to override an automatic scheduling function of a connected device, as can be seen from Figure 2. It can also be clearly seen that the GUI significantly assists the user in making their decisions by graphically showing the power consumption of any specified appliance. The user can also graphically examine the hourly pricing variation and identify the minimum and maximum pricing hours, which is beneficial to decision making.
2.2. Appliance Monitoring and Controlling Modules
Many circuitries are used to facilitate the monitoring and control of the connected appliances. One circuitry monitors the power consumption and turning on/off of the connected appliances based on the commands that are received from the main controller/scheduler. It is referred to as the smart plug in the rest of this paper. The circuitries of the Zigbee-connected IR remote controls and LED light dimmers have more options for controlling the ACs and LED lights. The room condition monitoring circuits are also used to monitor the necessary inputs to the scheduling algorithm, such as the room temperature, humidity, light intensity (LUX), and CO2 level, as well as the fridge and water heater temperatures. More details regarding these circuitries are explained in the following subsections.
2.2.1. Smart Plug/Socket
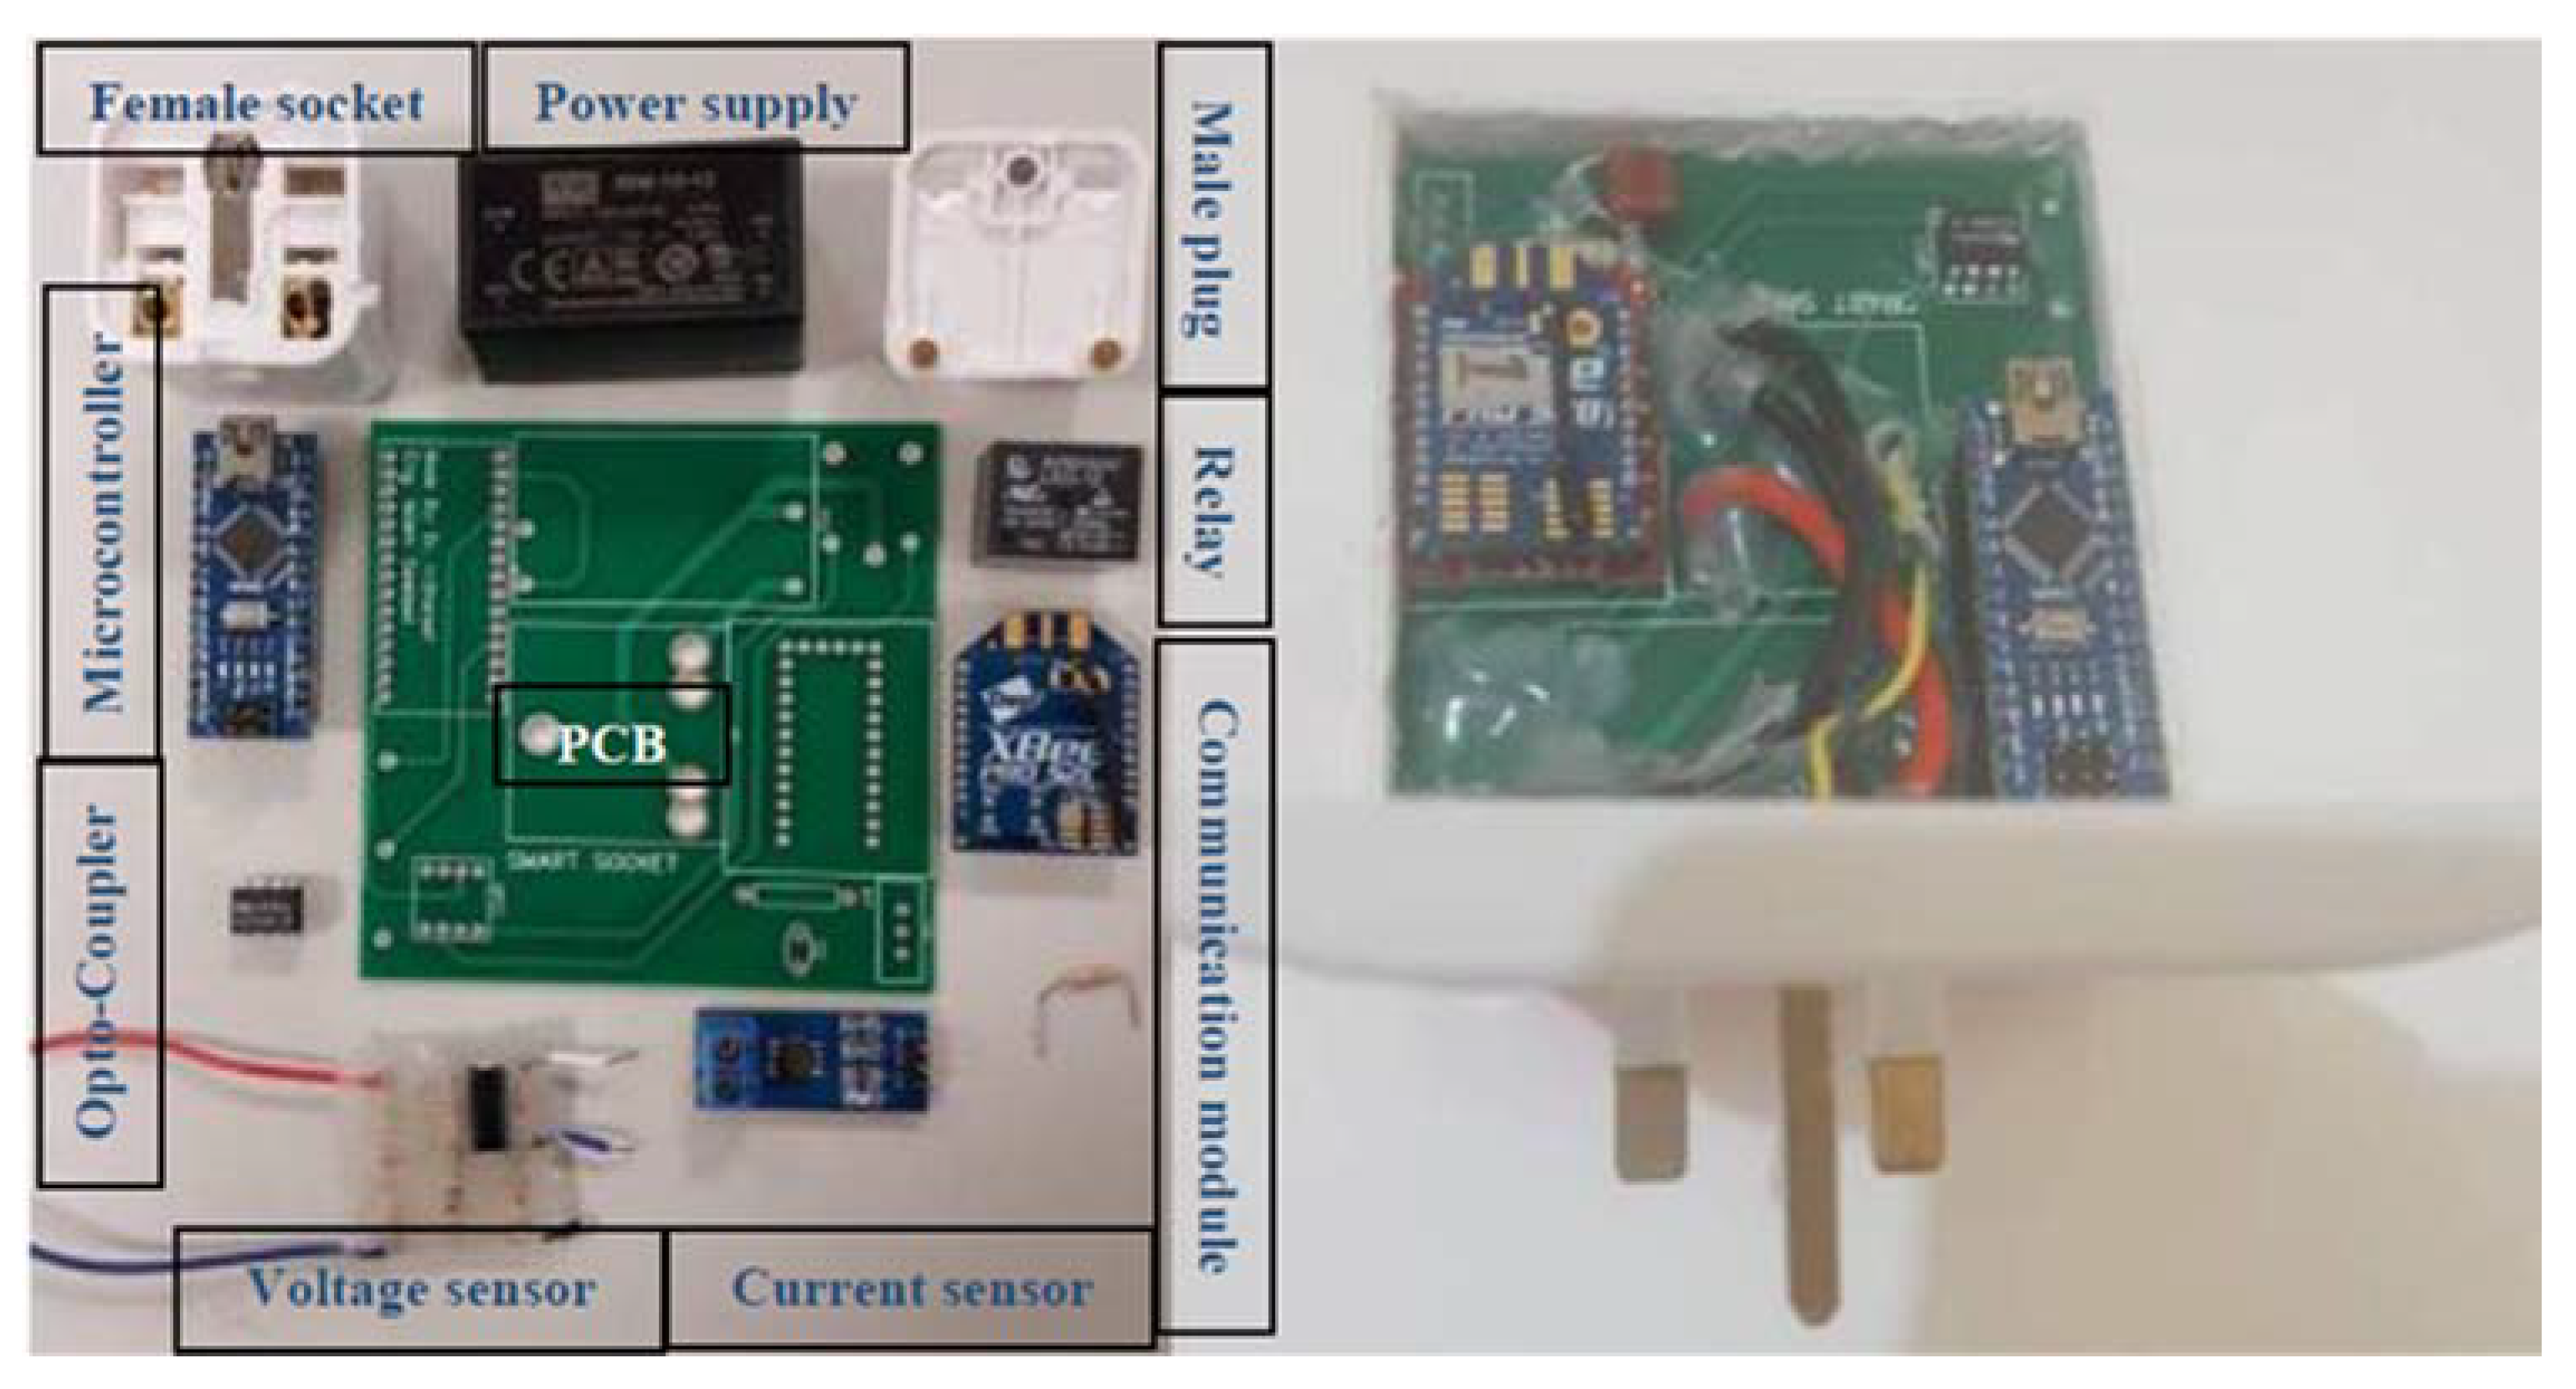
The smart plug/socket is able to monitor the power consumption of a connected appliance with a rating of up to 13 A, and turn it on/off using an integrated relay. The plug/socket determines and processes the single-phase power line voltage and current of the connected device, and then sends the captured data to a connected master node (when used) or the controller. The plug/socket uses the aforementioned wireless communication module and stores raw data provided by the microcontroller. Figure 3 shows the components (left) that were used to develop the plug/socket prototype (right).
A printed circuit board (PCB) is used for most of the wired connections, with copper traces being used to achieve compactness and separate the high- and low-voltage connections. A two-sided PCB is used for high-voltage connection at the bottom of the system, and low-voltage connection at the top. The system components are soldered to the PCB to complete the hardware, which is placed inside an isolated box. The female socket side is used for appliance connection, while the male plug side has three pins that are inserted into the wall power socket. Interested readers can find the details of smart socket construction and software used to develop it in [25].
The following five steps can summarize the operation principle of the smart socket:
- The male side of the smart plug is connected to the normal electricity socket to power up the internal components and prepare the smart socket for the connection of an appliance.
- When an appliance is connected to the smart socket, the sensing modules acquire 100 readings of current and voltage and transmit the data to the microcontroller.
- Based on the received data, the microcontroller calculates the real power, root-mean-square values of the current and voltage, complex power, and power factor.
- The microcontroller transmits the calculated data to the main scheduling terminal at a time interval of 2 s.
- The microcontroller receives and checks feedback data from the scheduling terminal module. If a command is received, the microcontroller sends the appropriate actuating signal to the relay of the smart socket to turn on/off the connected appliance.
2.2.2. Zigbee-Connected IR Remote Control
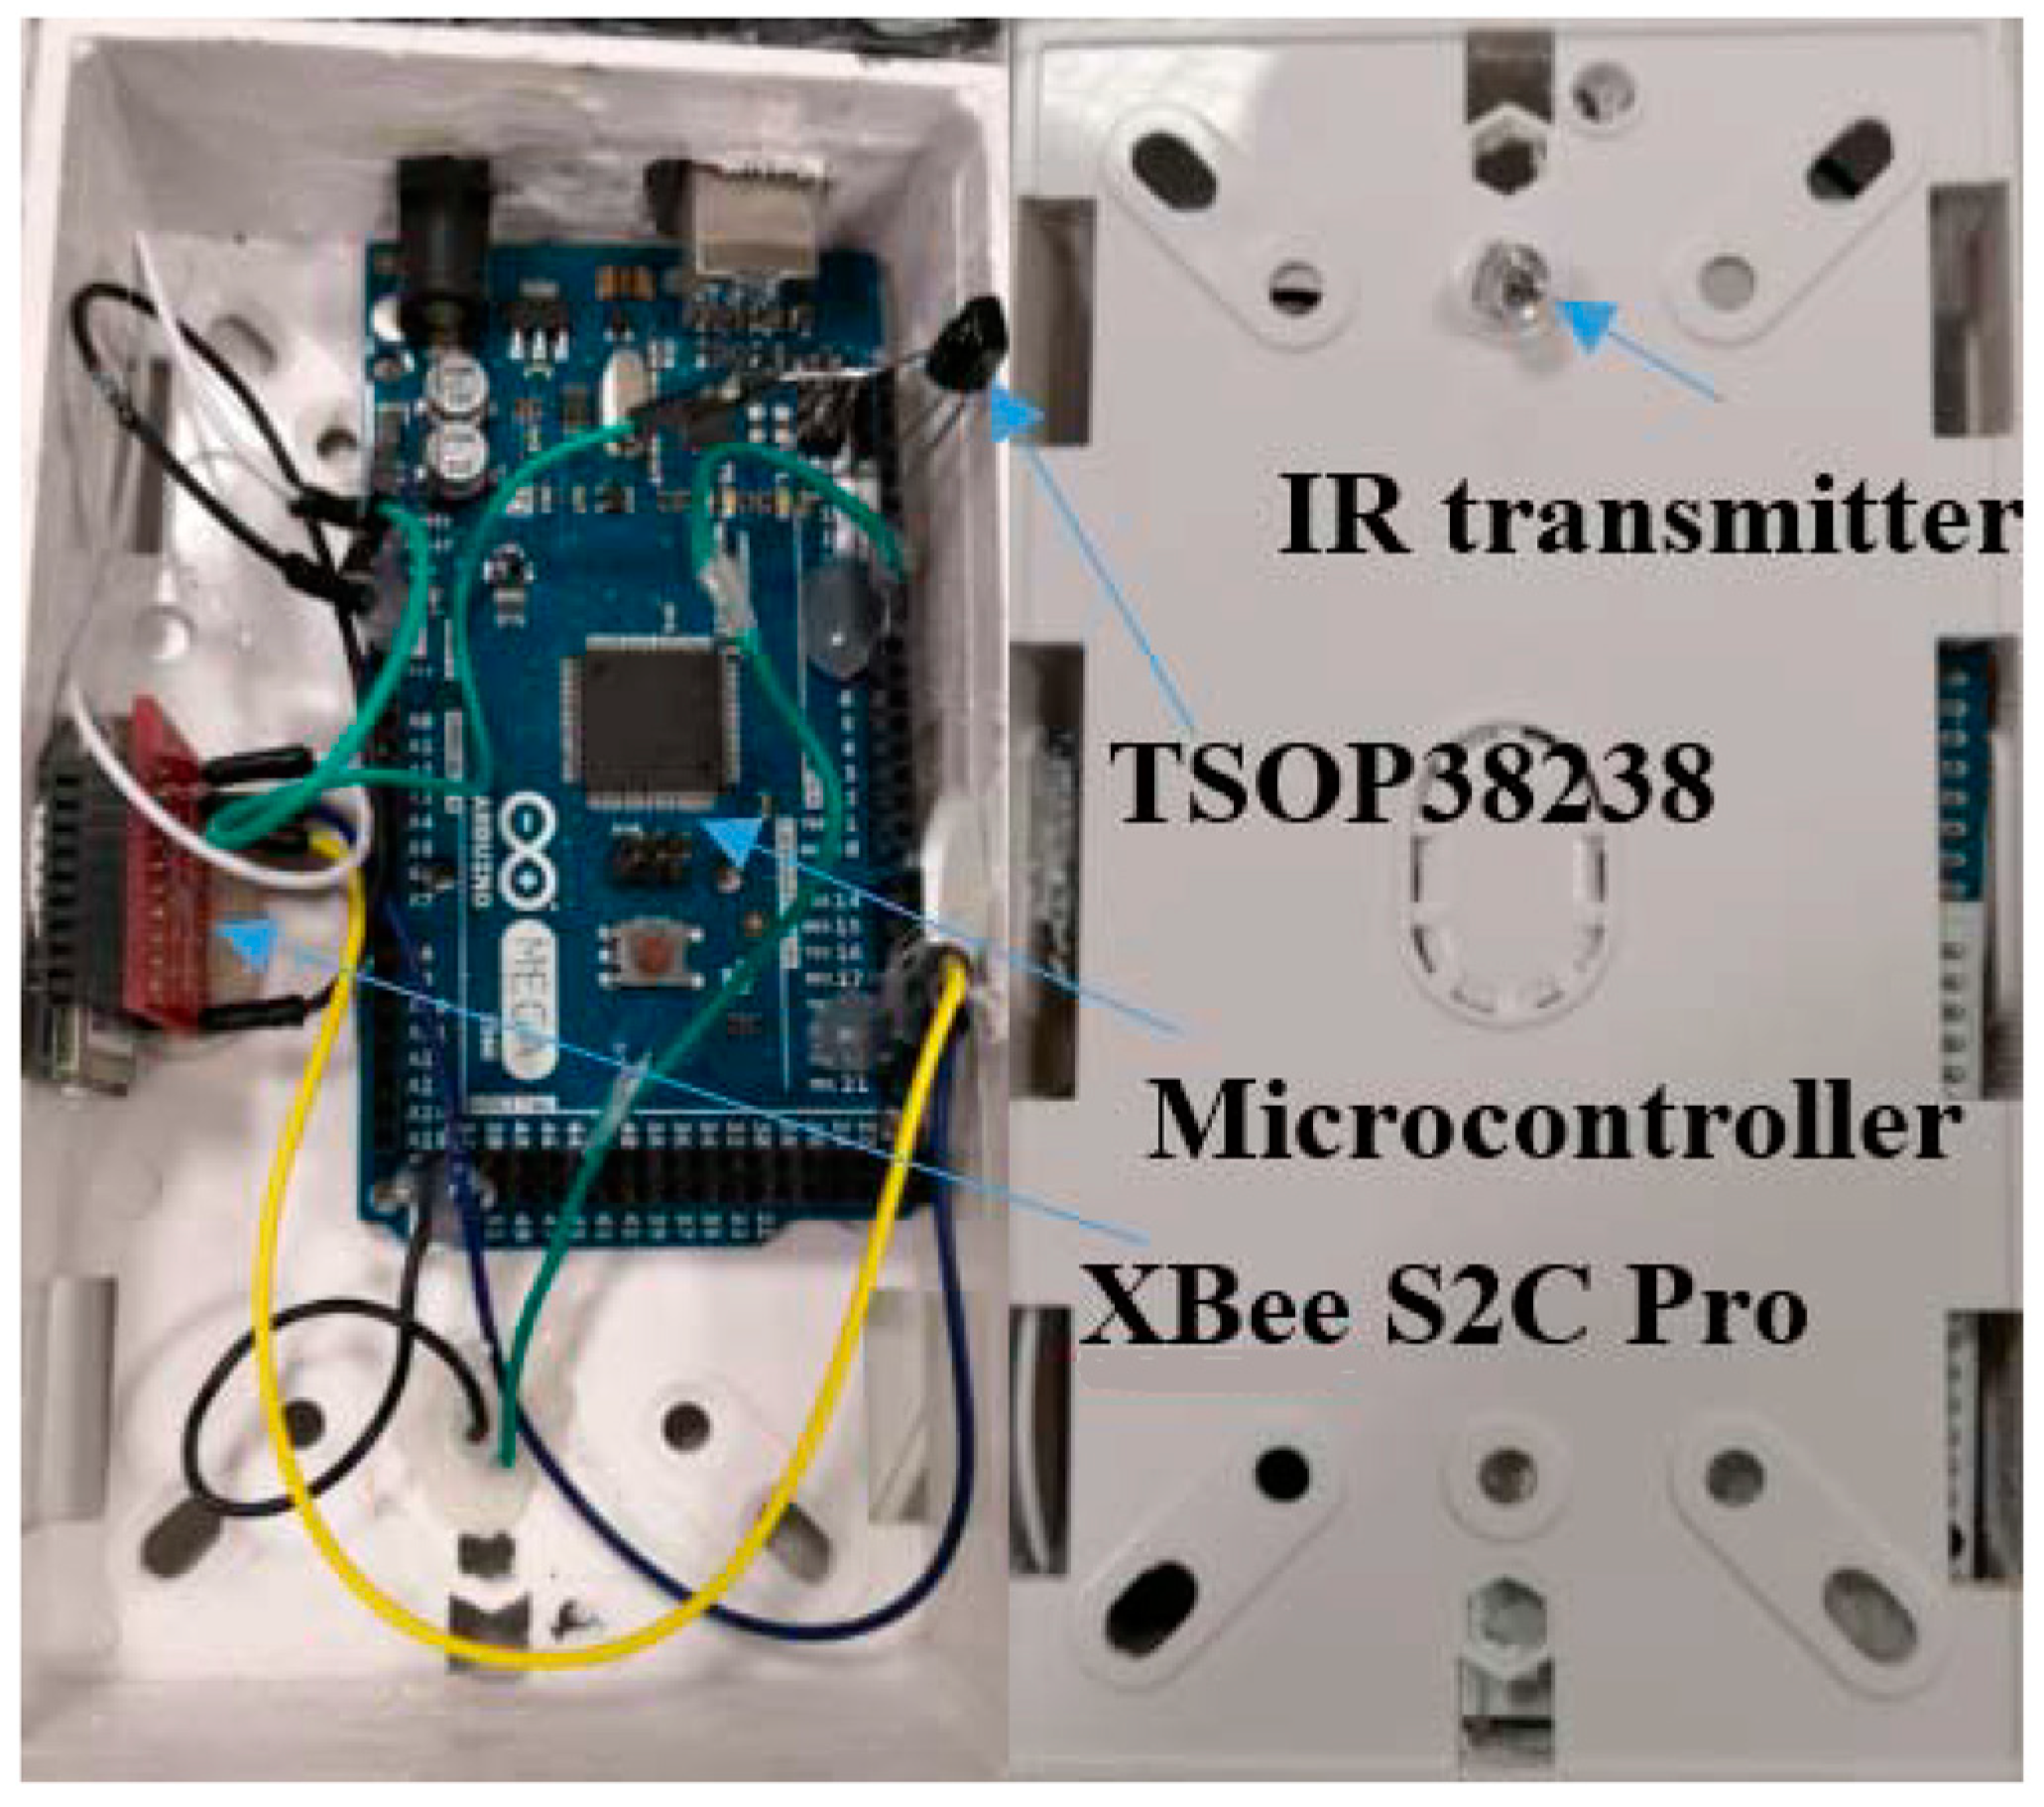
A learner IR remote control with Zigbee connectivity is employed for flexibility in controlling the AC units. The remote control uses an IR receiver diode to learn the preprogrammed IR commands from the original AC remote control. An ordinary IR transmitter is used to actuate the commands received from the scheduling controller terminal. Figure 4 shows the remote control circuitry.
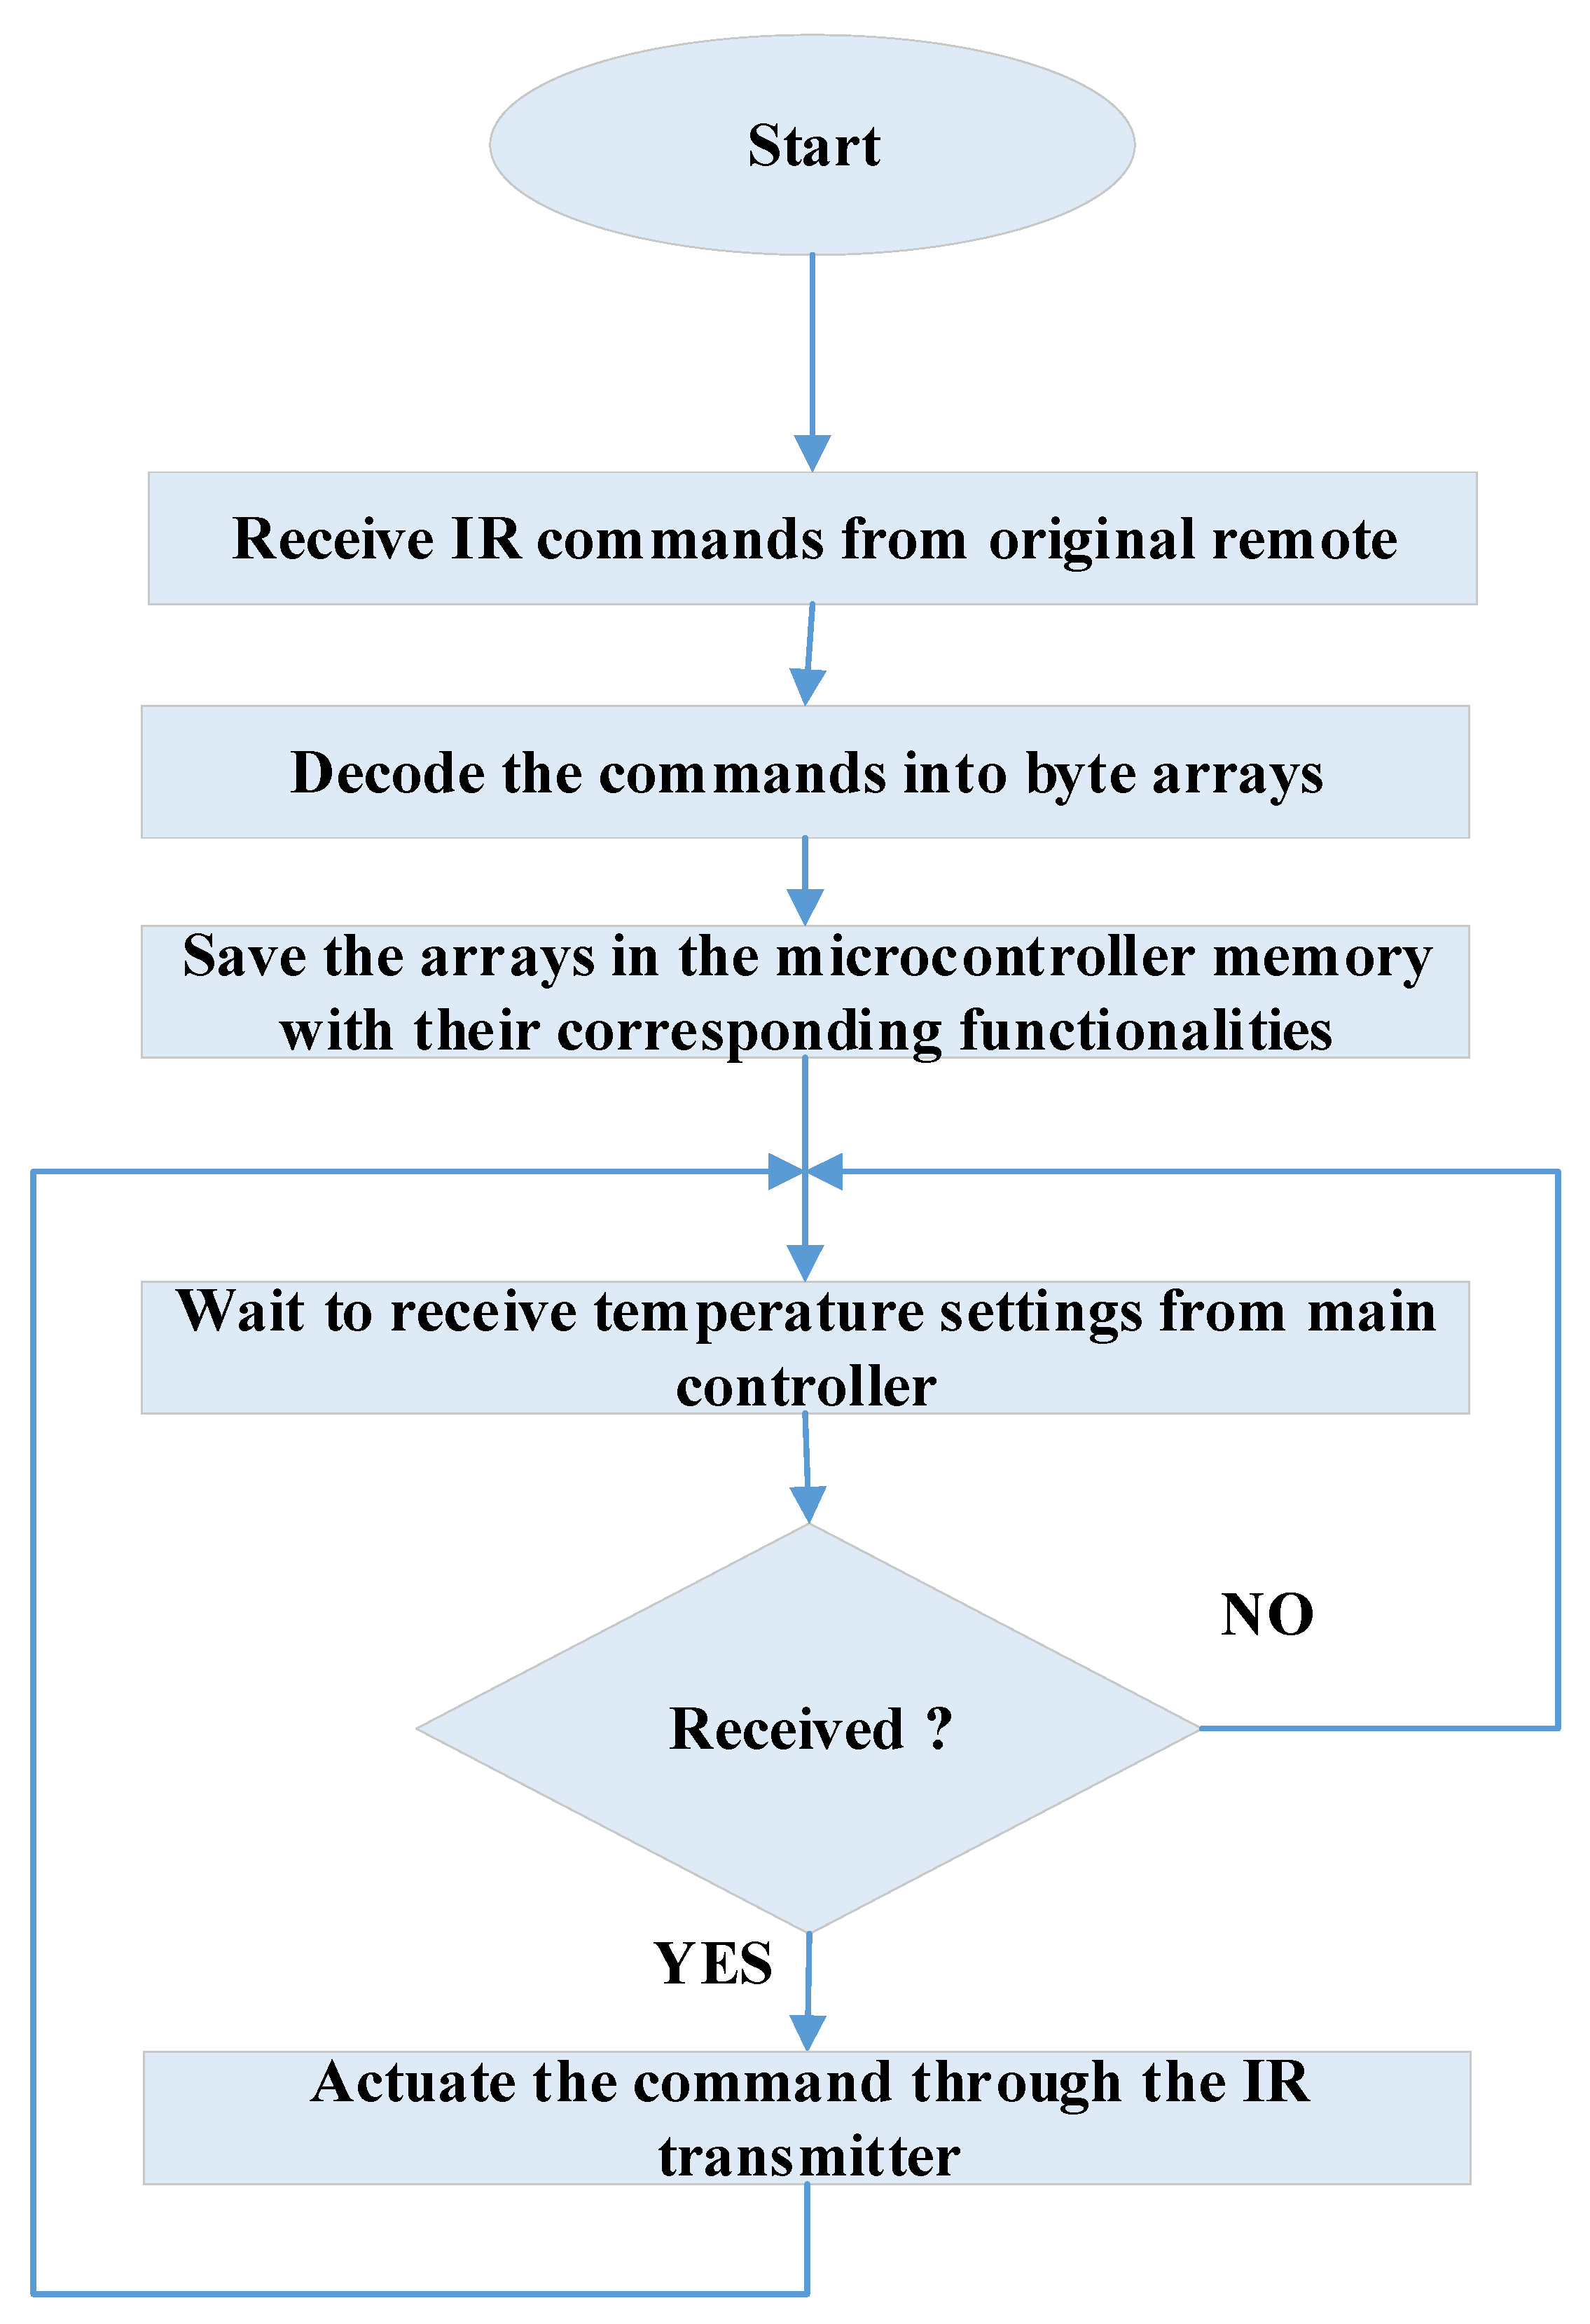
The remote control is capable of learning the IR digital code patterns transmitted by the original AC remote control while using a TSOP decoding diode and an Arduino Mega microcontroller. The microcontroller saves the patterns as digital commands, together with various temperature settings in its internal memory. The microcontroller transmits one of the earlier-learned IR codes through the IR transmitter when a remote command is received from the scheduling controller terminal via the integrated Zigbee communication module. Thus, the Zigbee connectivity of the remote control allows for the user to control the AC units through remote commands from the scheduler algorithm, or by manual commands via the user interface. The advantage of using this Zigbee based IR report is that the controlling the high power AC units do not require contactors with high current rating, as used in [17]. The proposed circuit can be duplicated to control multiple AC units. Figure 5 illustrates the operation of the remote control.
2.2.3. Zigbee-Connected LED Light Dimmer
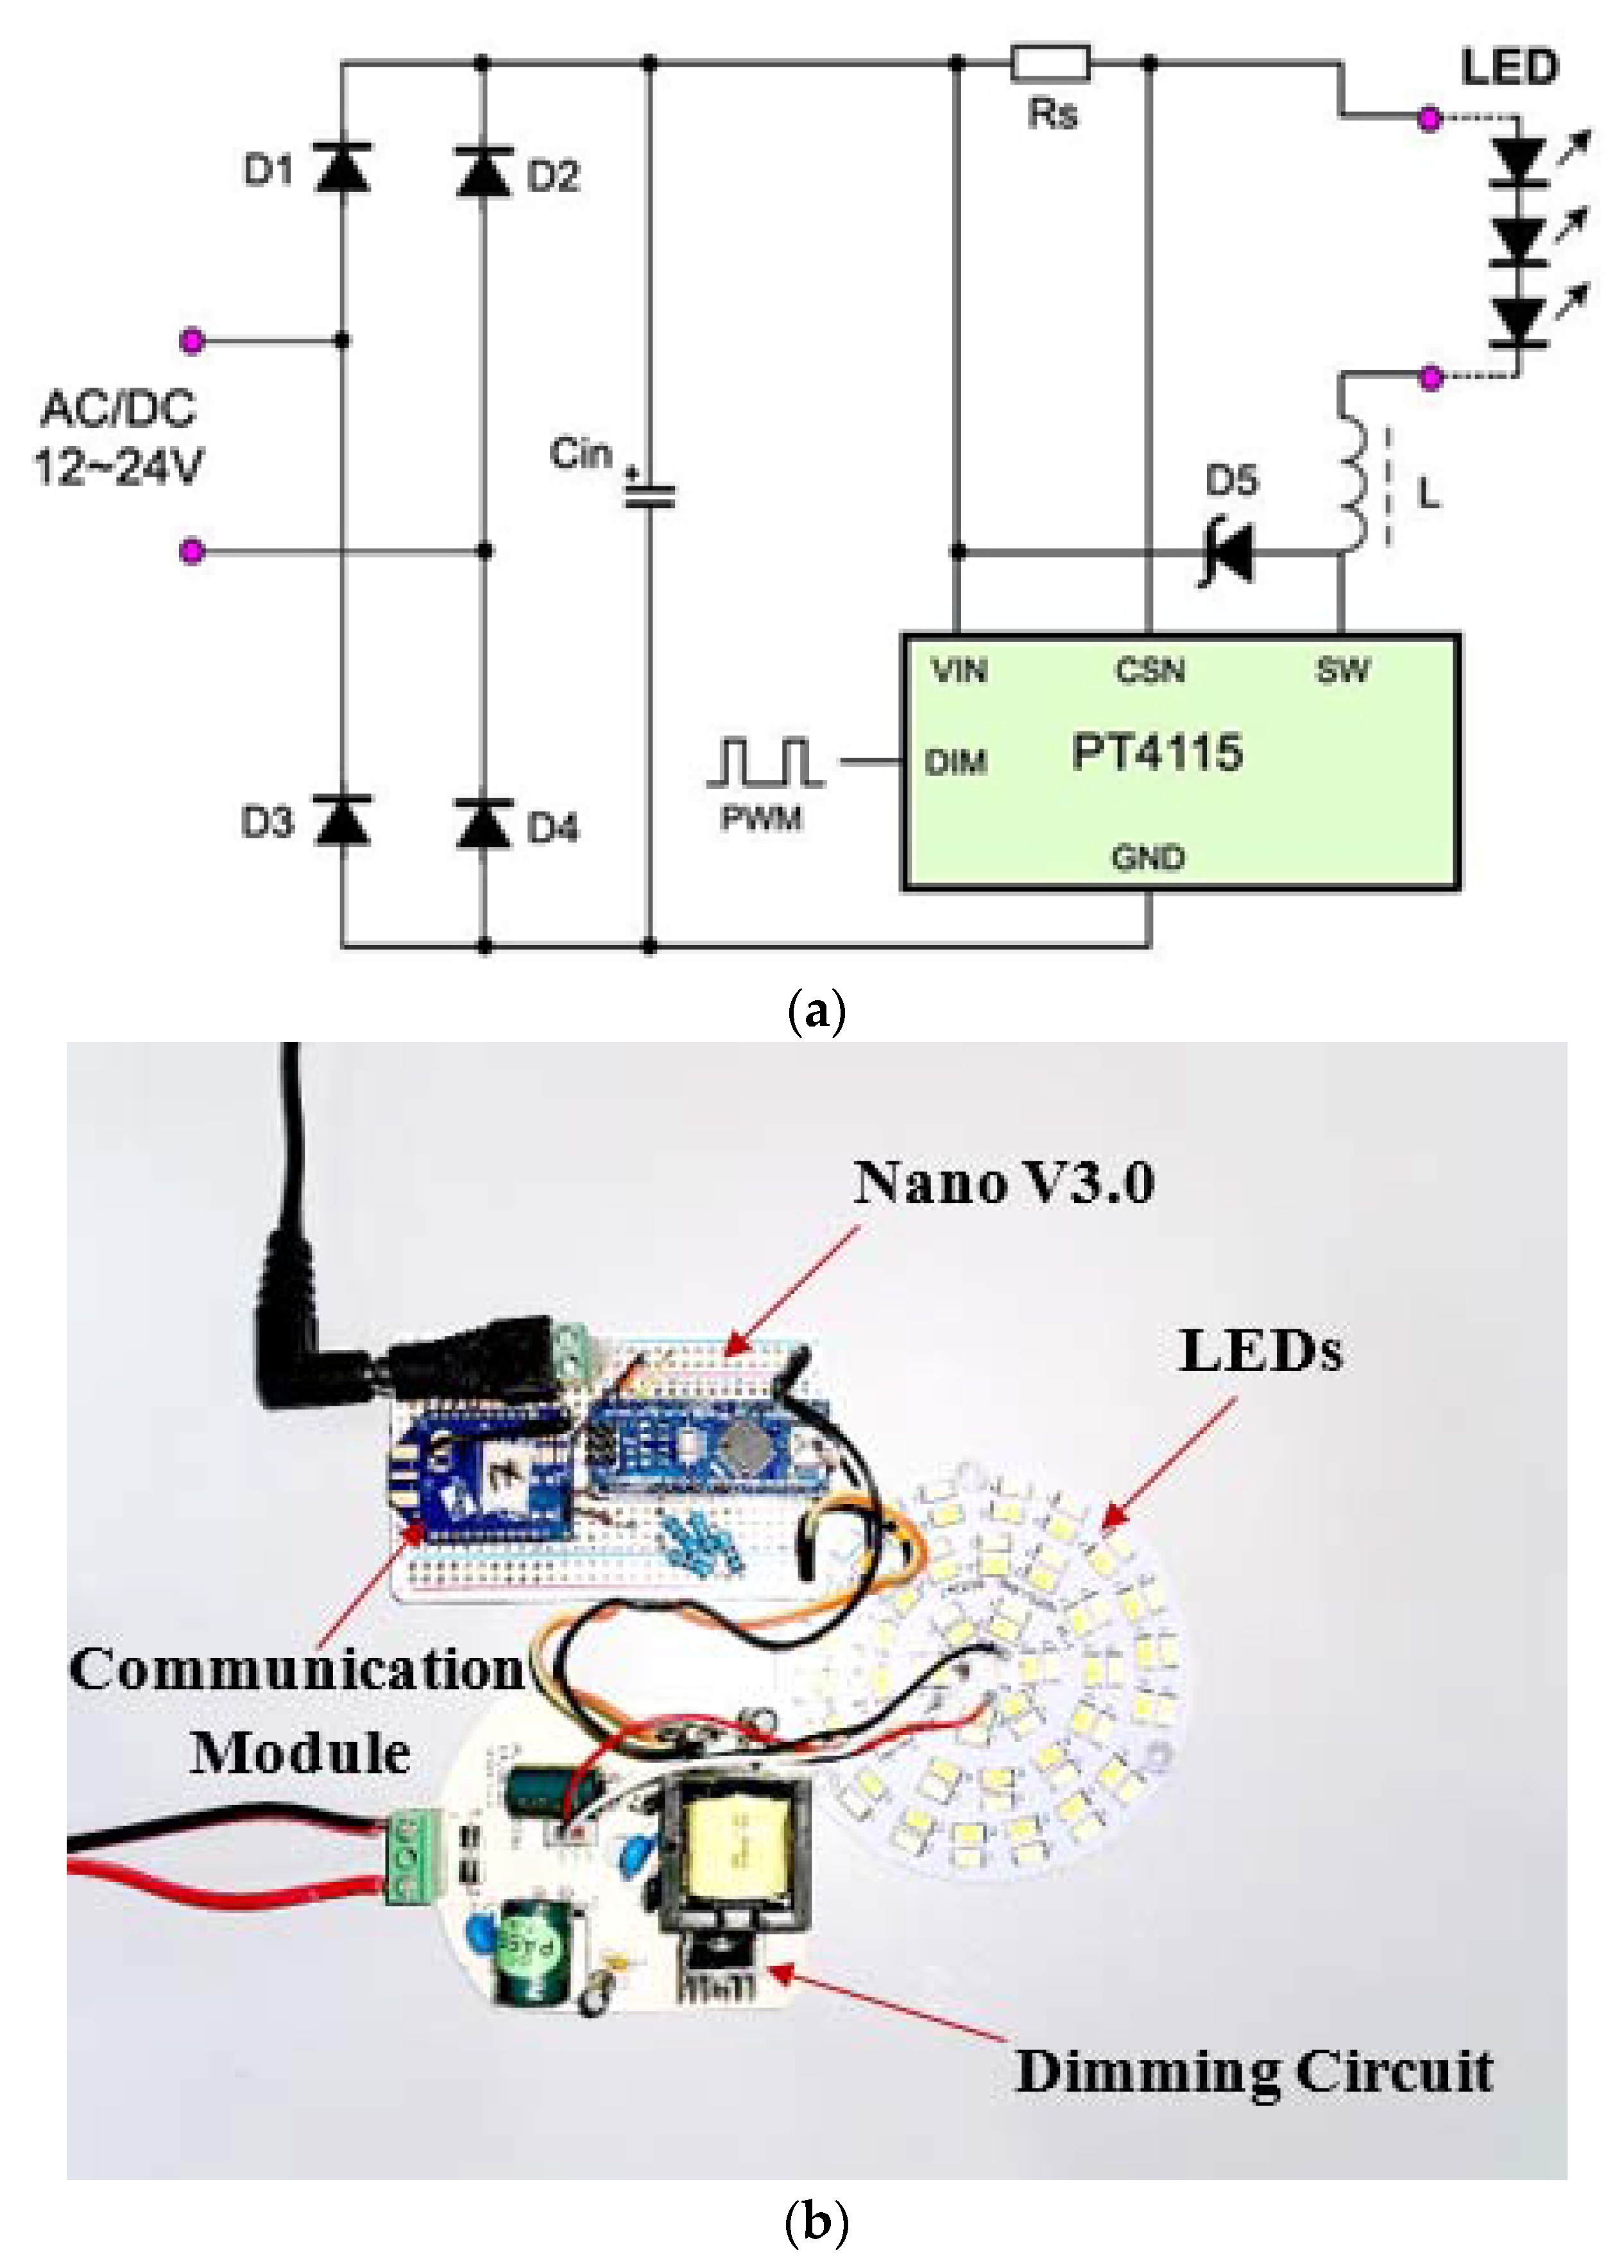
Lights are the primary electrical appliances used in residential buildings and many householders neglect turning off or diming the lights when the natural lighting is adequate or a room is unoccupied. Recently, many dimmable drivers are flooding the market, offering each solutions to control individual light emitting diode (LED) lamps. Figure 6a shows such a driver circuit with PT4115. The dimming can be performed while using variable DC voltage by adjusting a variable resistor or PWM signal, for example, from a Arduino micro controller. A logic level below 0.3 V at DIM forces PT4115 (Hotchip Technology, Baoan, Shenzhen, China, 2015) to turn off the LED and the logic level at DIM must be at least 2.5 V to turn on the full LED current. The frequency of PWM dimming ranges from 100 Hz to more than 20 kHz.
The Zigbee-connected dimmer offers options for reducing the energy consumption of LED lights by decreasing the light intensity under specific conditions. When the communication module in the dimmer circuit receives a dimming command, it passes the command to the microcontroller for processing, like in the smart socket and IR remote. The microcontroller then generates a sequence of pulses that adjusts the light intensity to the level that is indicated by the remote command. Figure 6b shows the implementation of dimming circuit.
2.2.4. Room Condition Monitoring Circuit
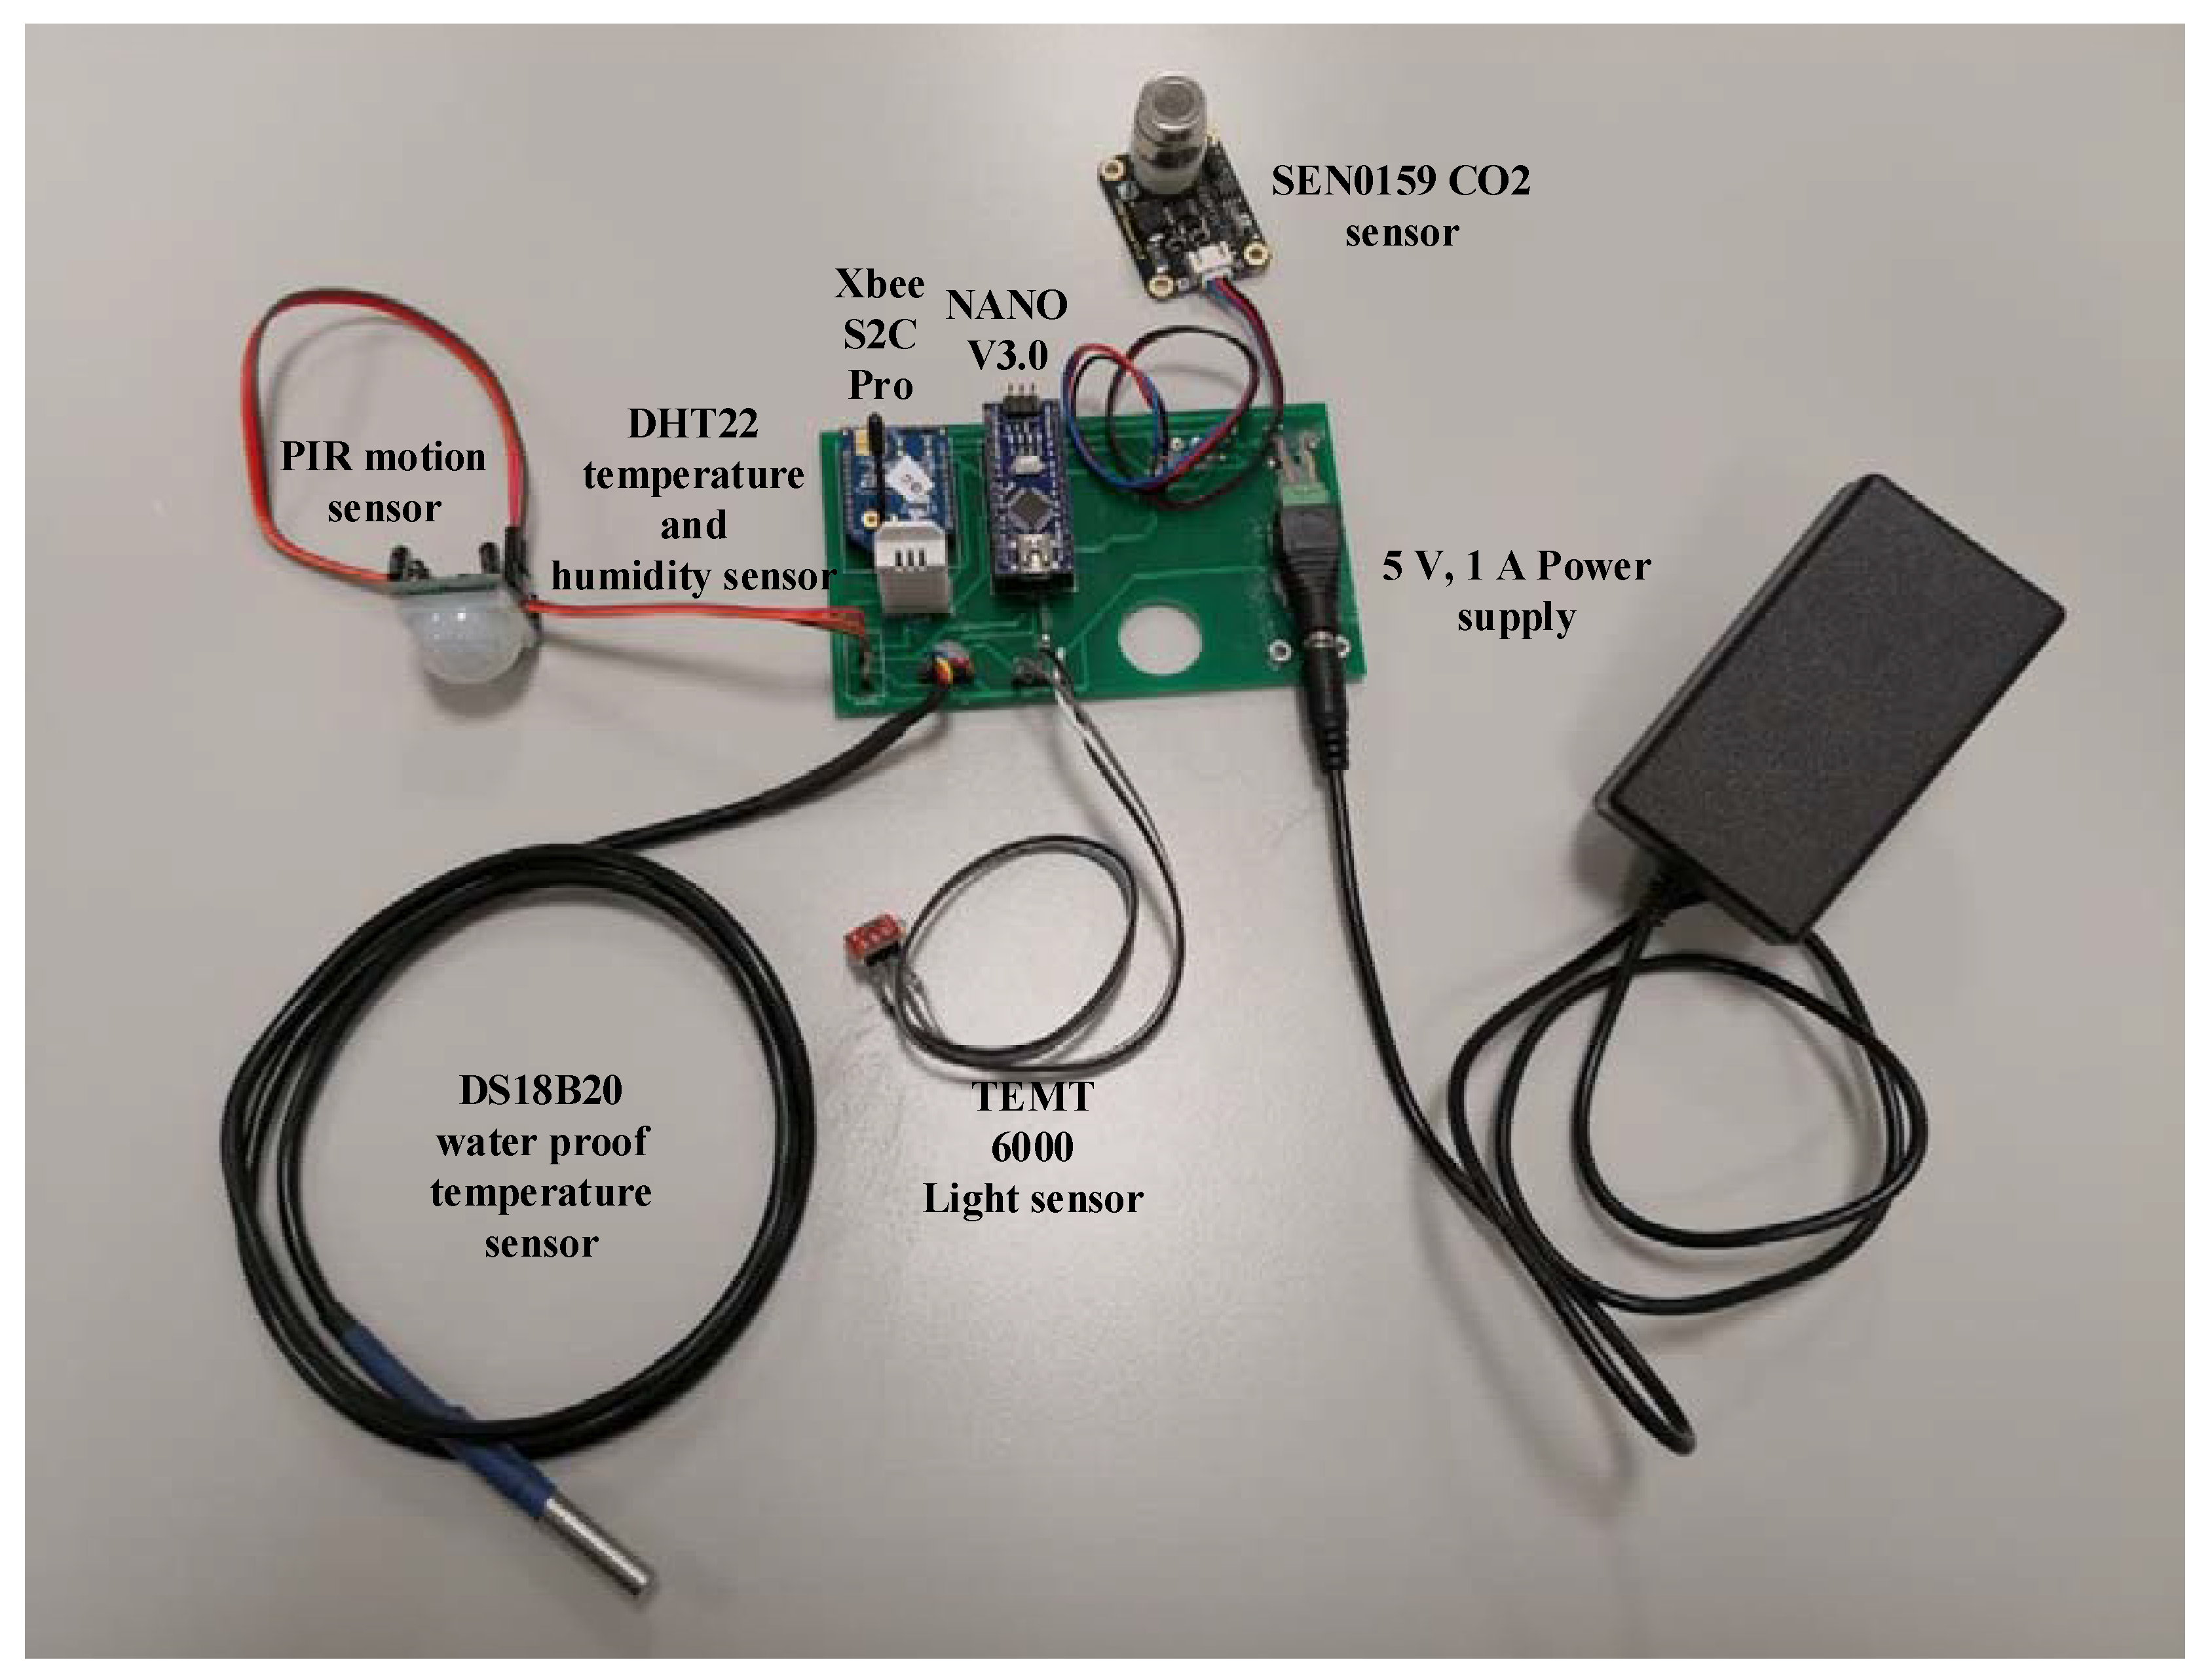
The proposed HEM system includes a circuit for monitoring and transmitting data on the ambient conditions, such as the room temperature, humidity, illuminance, and CO2 concentration. The circuit is also capable of detecting motion in the room through a motion sensor and is thus able to provide the main controller with the inputs required by the decision-making algorithm. Figure 7 shows the circuit and employed sensors.
Each sensor in Figure 7 has a specific purpose. For example, the room temperature and humidity are measured by the DHT22 (STmicroelectronics, Shanghai, China, 2000) sensing module, which updates its reading information every 2 s. When the condition monitoring circuit is used to monitor the internal temperature of a refrigerator or the water temperature in a water heater, the waterproof DS18B20 (Maxim Integrated, San Jose, CA, USA, 2005) temperature sensor is employed. All of the recorded data are initially compared with readings from commercial temperature and humidity loggers to ensure that all of the sensing modules are producing accurate and reliable readings for input to the algorithm. Further, the TEMT 6000 (Vishay Americas, Greenwich, CT, USA, 2004) light sensing module is used to continuously log the light intensity within the room because the user controls the light intensity inside the room during the HEM process. Here again, the readings are validated by comparison with the measurements of a commercial ST-1309 LUX (ATP Instrumentation, Ashby-de-la-Zouch, Leicestershire, UK, 2018) meter.
Two other sensors are used to identify the occupancy status of the room, namely, a passive infra-red (PIR) motion detection sensor and an SEN 1059 CO2 sensor (DF Robot, Pudong, Shanghai China, 2018). The information acquired by these sensors are used by the algorithm to automatically control the relevant appliances. The PIR motion detection sensor continuously scans the space in front of it within its range, and then sets its output to 1 or 0, depending on whether it detects motion or not, respectively. However, because there might be the situation in which a person is within the room, but without detectable motion, a CO2 sensing module is used for augmentation. The SEN 1059 CO2 sensor utilizes an inverse relationship between CO2 concentration and voltage [26].
After the development of all the necessary hardware for providing the main controller with the needed inputs, a rule-based HEM algorithm was developed and experiments were performed in order to verify the reliability of the proposed HEM system.
3. Experimental Setup and HEM Algorithm
This section consists of two parts. The first part describes the setup of the experimental hardware, which included four of the most commonly used household appliances, while the second part describes the utilized energy management algorithm and its interaction with the hardware.
3.1. Hardware
Four home appliances were selected for the experimental demonstration of the proposed HEM system. Table 1 details the appliances and their specifications. Each of the appliances in Table 1 was attached to a smart socket to monitor their energy consumption and continuously transmit the information to the main controller in the scheduling terminal. The temperatures of the first three appliances were also monitored by the appropriate sensing modules that were integrated with the condition monitoring circuit, as described above.
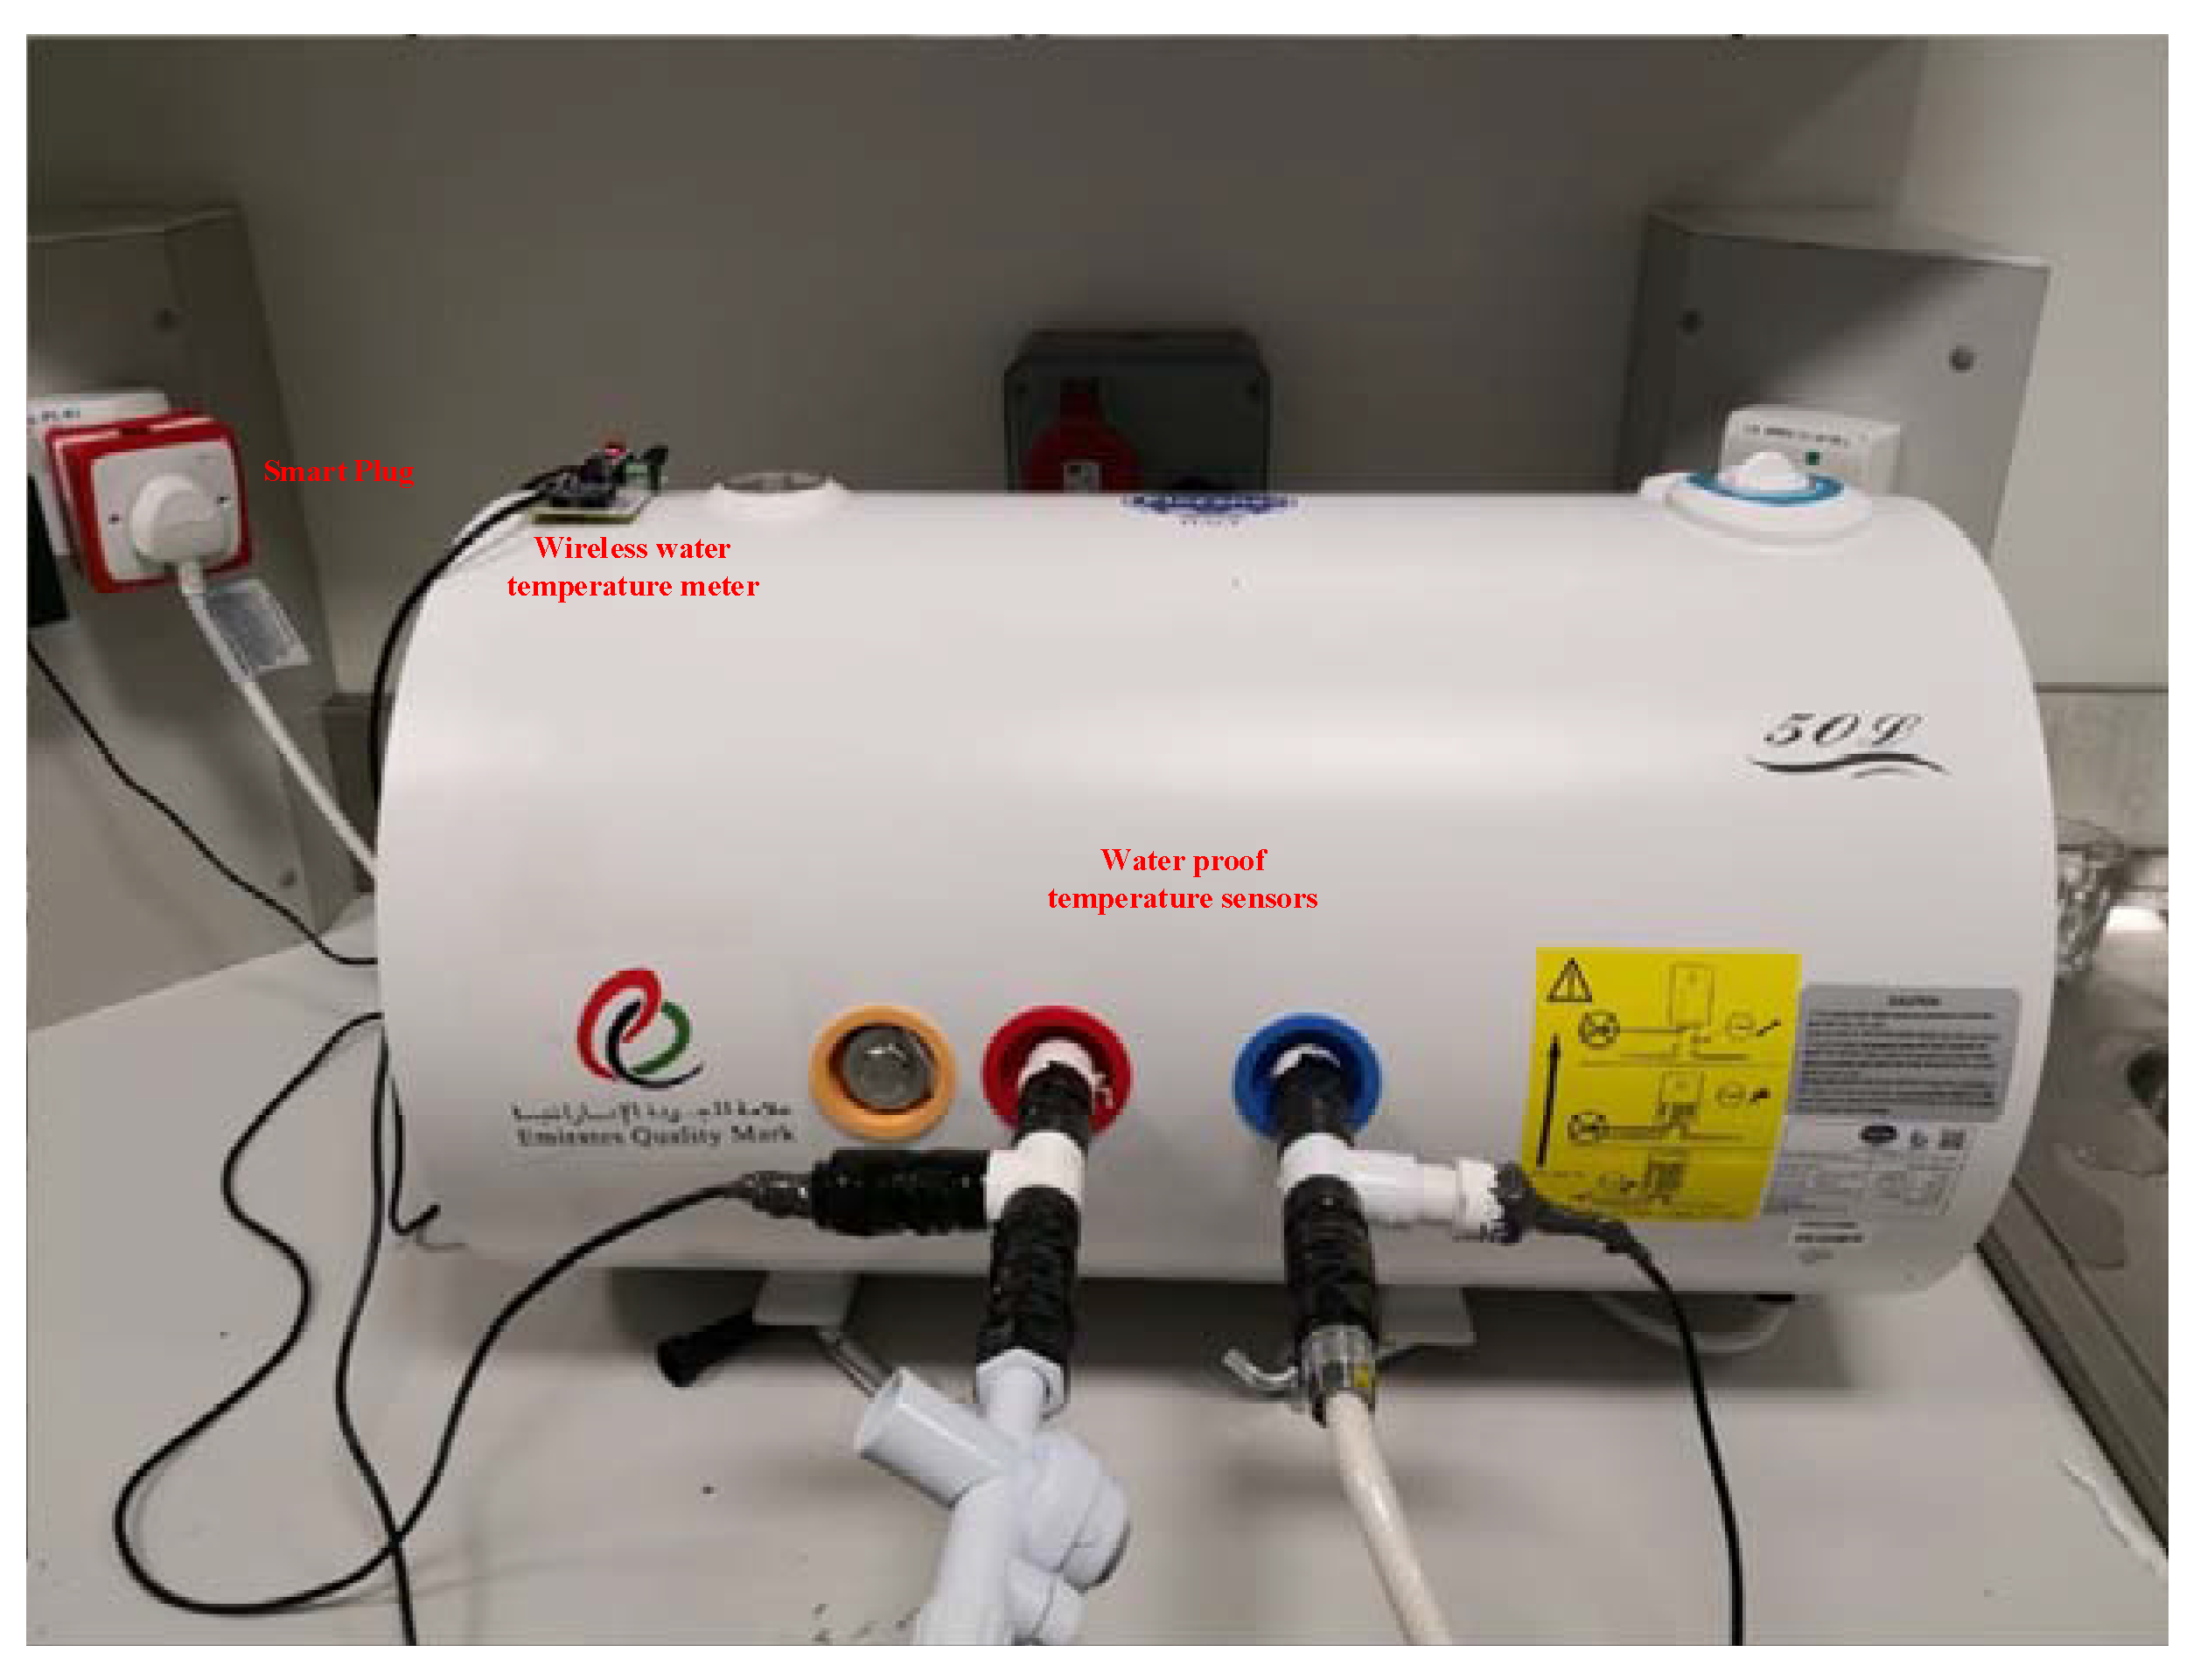
3.1.1. Heater Setup
Figure 8 shows the setup for monitoring the water heater power consumption and temperatures. The heater was attached to a smart socket and two waterproof temperature sensors were plugged into the inlet and outlet water pipes of the heater.
The inlet and outlet water temperatures were monitored by waterproof sensors, and the temperature readings were acquired and transmitted by the microcontroller every 2 s. The smart socket to which the heater was connected measured power consumption. The heater could be turned on/off through remote commands received by the smart socket.
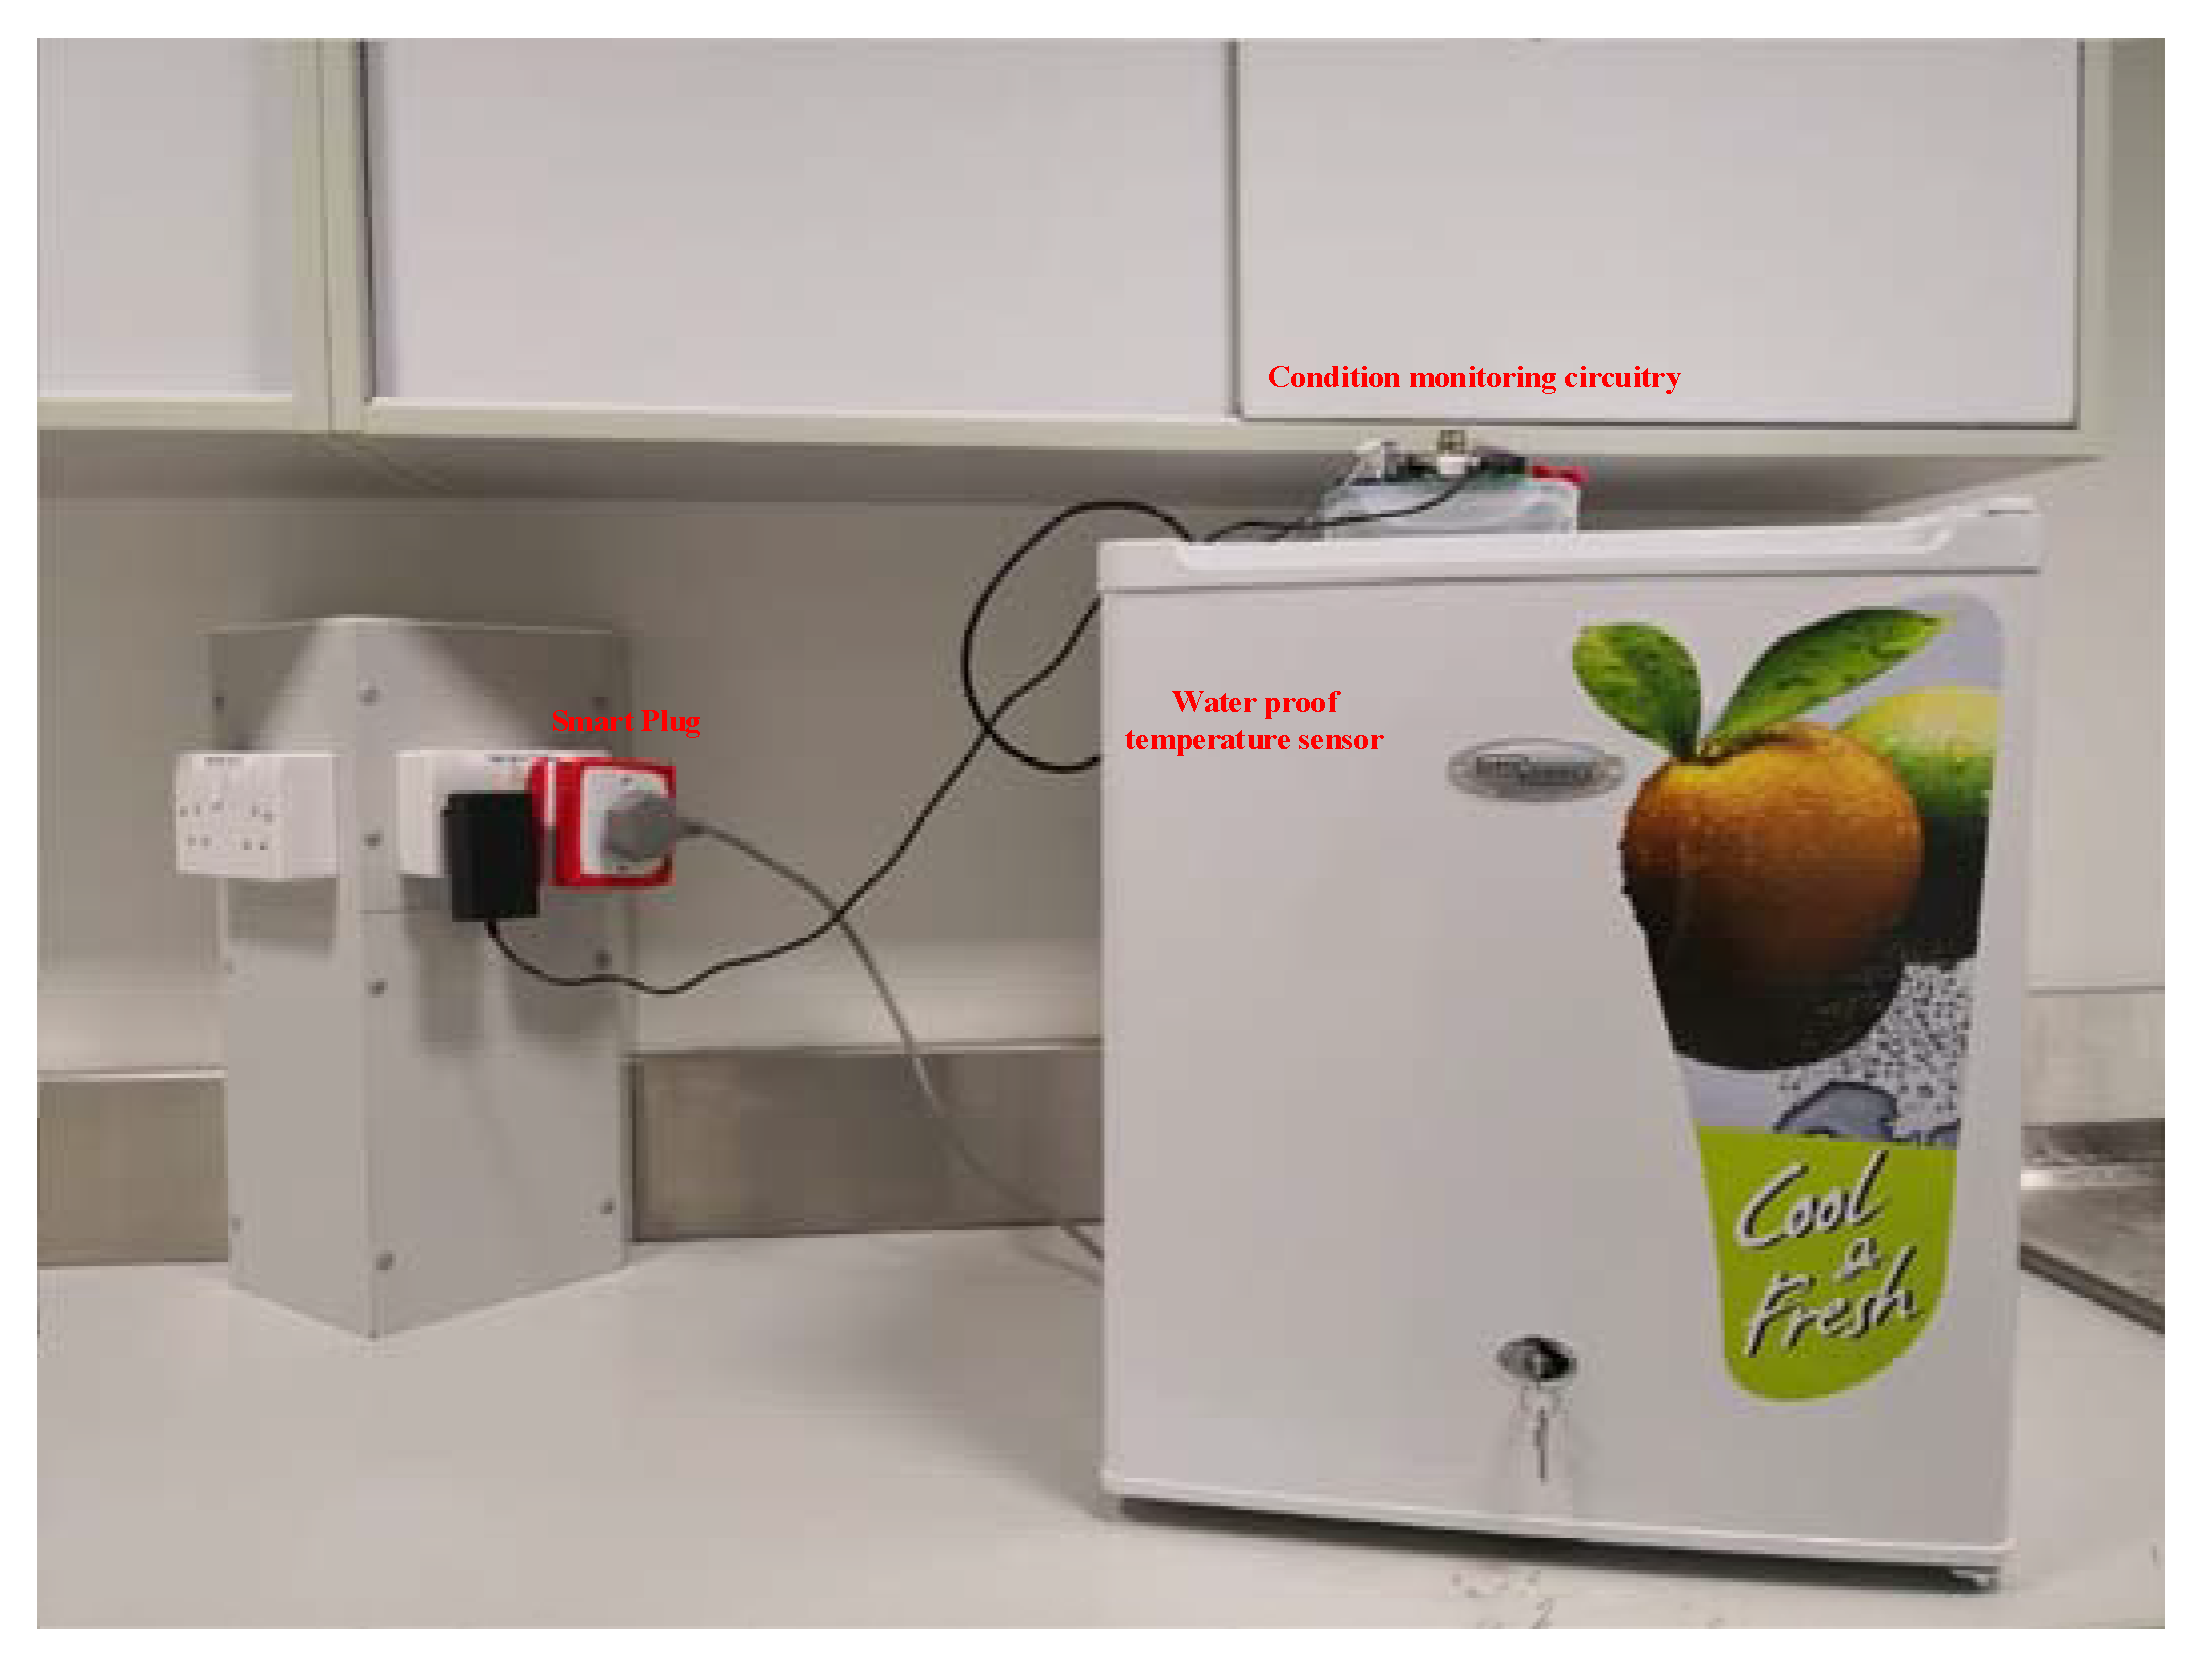
3.1.2. Refrigerator Setup
The working cycle of refrigerator or air conditioner refers to their operations based on which the refrigerant (in this case gas) heat exchange cycles change status, or cools down the medium. It starts at the compressor phase at which it pulls the warm refrigerant and increases its pressure and temperature. The refrigerant then travels to the condenser, where it goes through several fins with the use of a running fan that helps to release its heat to the outer environment, thus reducing its temperature. During this process, the refrigerant changes its state from the gaseous to a high-temperature liquid phase. The liquid is then passed to a valve that converts it into mist. This sudden drop of pressure results in a rapid cooling of the refrigerant, which is then passed to the evaporator coil located in front of a fan that circulates the chamber air, thus resulting in its cooling. Some heater are tuned on and the compressor is turned off during the deforest cycle to avoid ice formation and blocking the cool air flow in the chamber. This deforest cycles could last for 30 to 45 min. [26]. This clearly shows that the refrigerator could be used as a schedulable load if temperature is kept within the acceptable limits. In this study, the refrigerator was connected to another smart socket and a waterproof temperature sensor was placed inside it (Figure 9).
The internal temperature information of the refrigerator and its power consumption were wirelessly transmitted to the main controller by Zigbee communication modules that were built into the condition monitoring circuitry and the smart plug. The refrigerator could also be turned on/off by remote commands that actuated the relay inside the smart socket. Note that the internal temperature is continuously monitored by monitoring circuit described in Section 2.2.4.
3.1.3. AC Setup
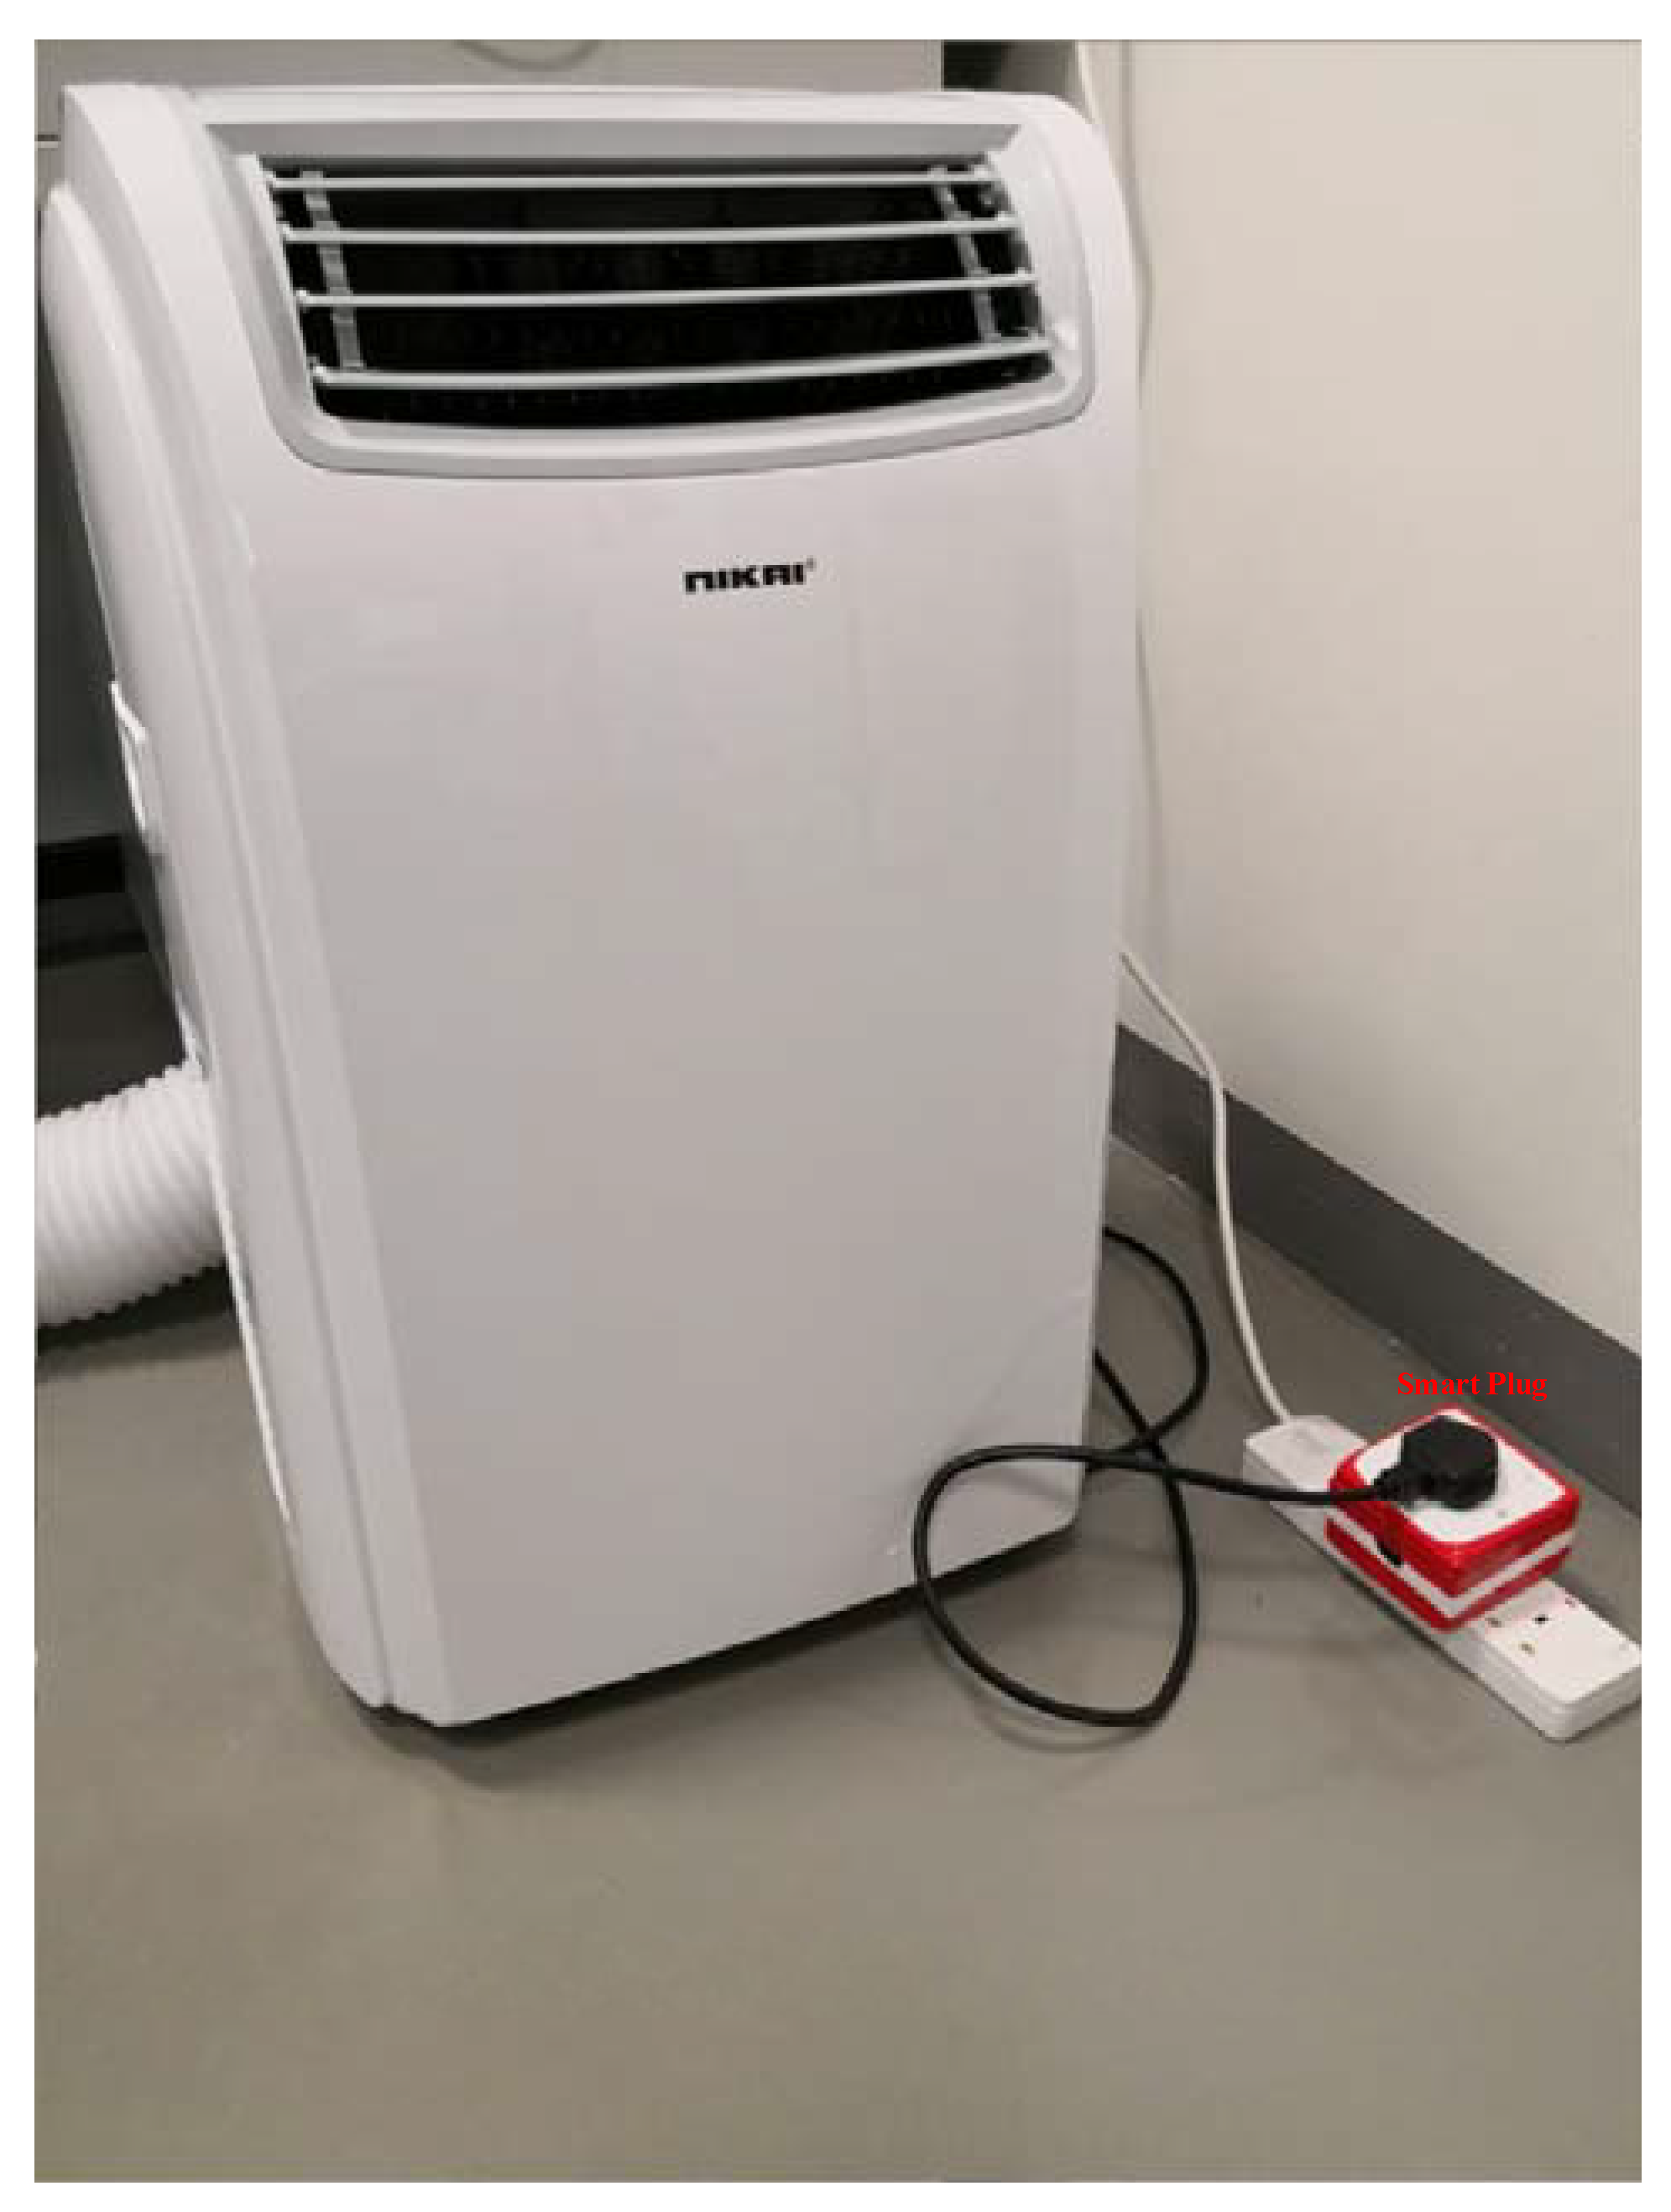
Unlike the cases of the two preceding appliances, the smart socket to which the AC was connected only monitored and transmitted the power consumption to the main controller, as shown in Figure 10. The room temperature determined the cooling performance, which was measured by a DHT22 temperature sensing module.
The AC unit was controlled through a Zigbee-connected IR remote control. All of the IR patterns that the remote controlled learned from the ordinary AC remote were stored in the memory of the mega microcontroller inside the former. The microcontroller actuated the command by releasing the corresponding IR pattern through an IR-transmitting LED bulb on the microcontroller output pin when a remote command was received by the Zigbee-connected remote control. Normally, the remote control could turn the AC unit on/off and set the AC thermostat to a specific temperature.
3.1.4. LED Light Setup
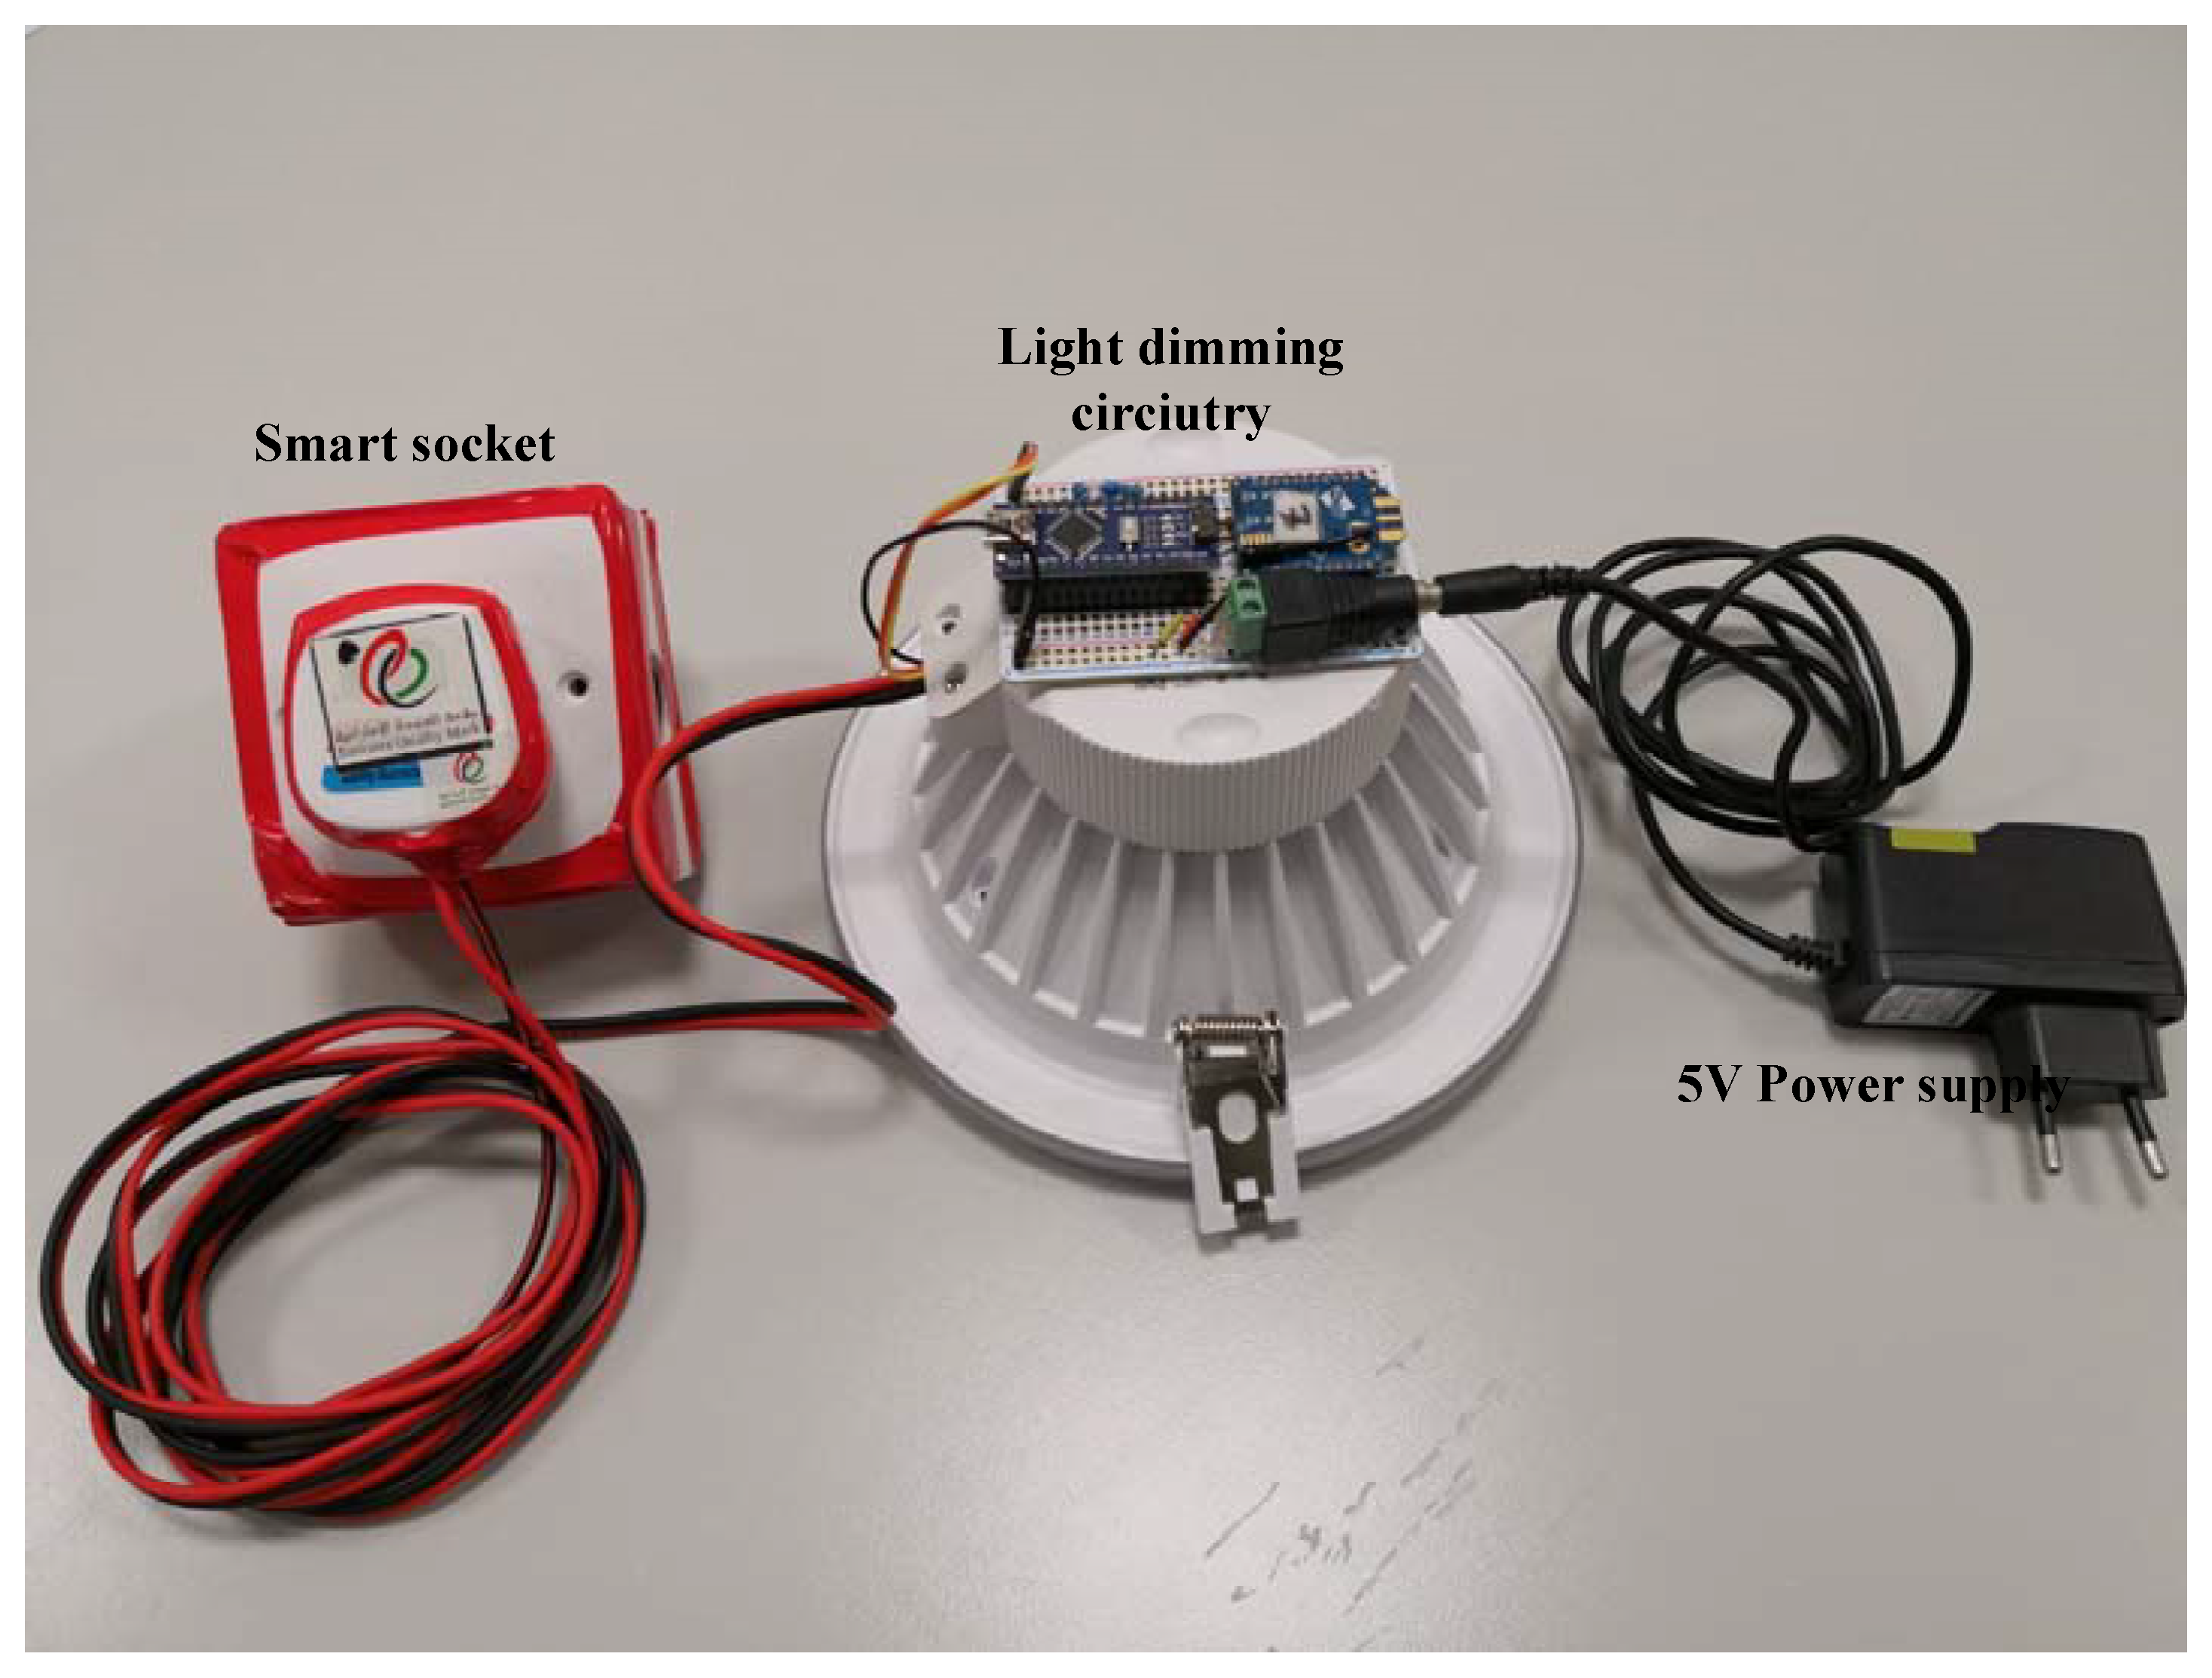
Similar to the case of the AC, power monitoring was the only function of the smart socket to which the LED light was connected. This was because the control task was assigned to the above-mentioned light dimming circuit. Figure 11 shows the connections for the LED light energy management. The control function of the dimming circuit was based on pulse width modulation (PWM). In the case of multiple LED light control, individual Zigbee based PWM control or single PWM generator with multiple dimmable LED driver circuits could be developed.
Hence, when the dimming circuit received a remote command from the central controller through the Zigbee connection, the microcontroller in the dimmer analyzed the command and then actuated it by sending a PWM pattern to the connection pin of the LED driver. The LED lightning level could be varied in steps of 25% between 0% (off) and 100% (fully on).
3.1.5. Room Occupancy
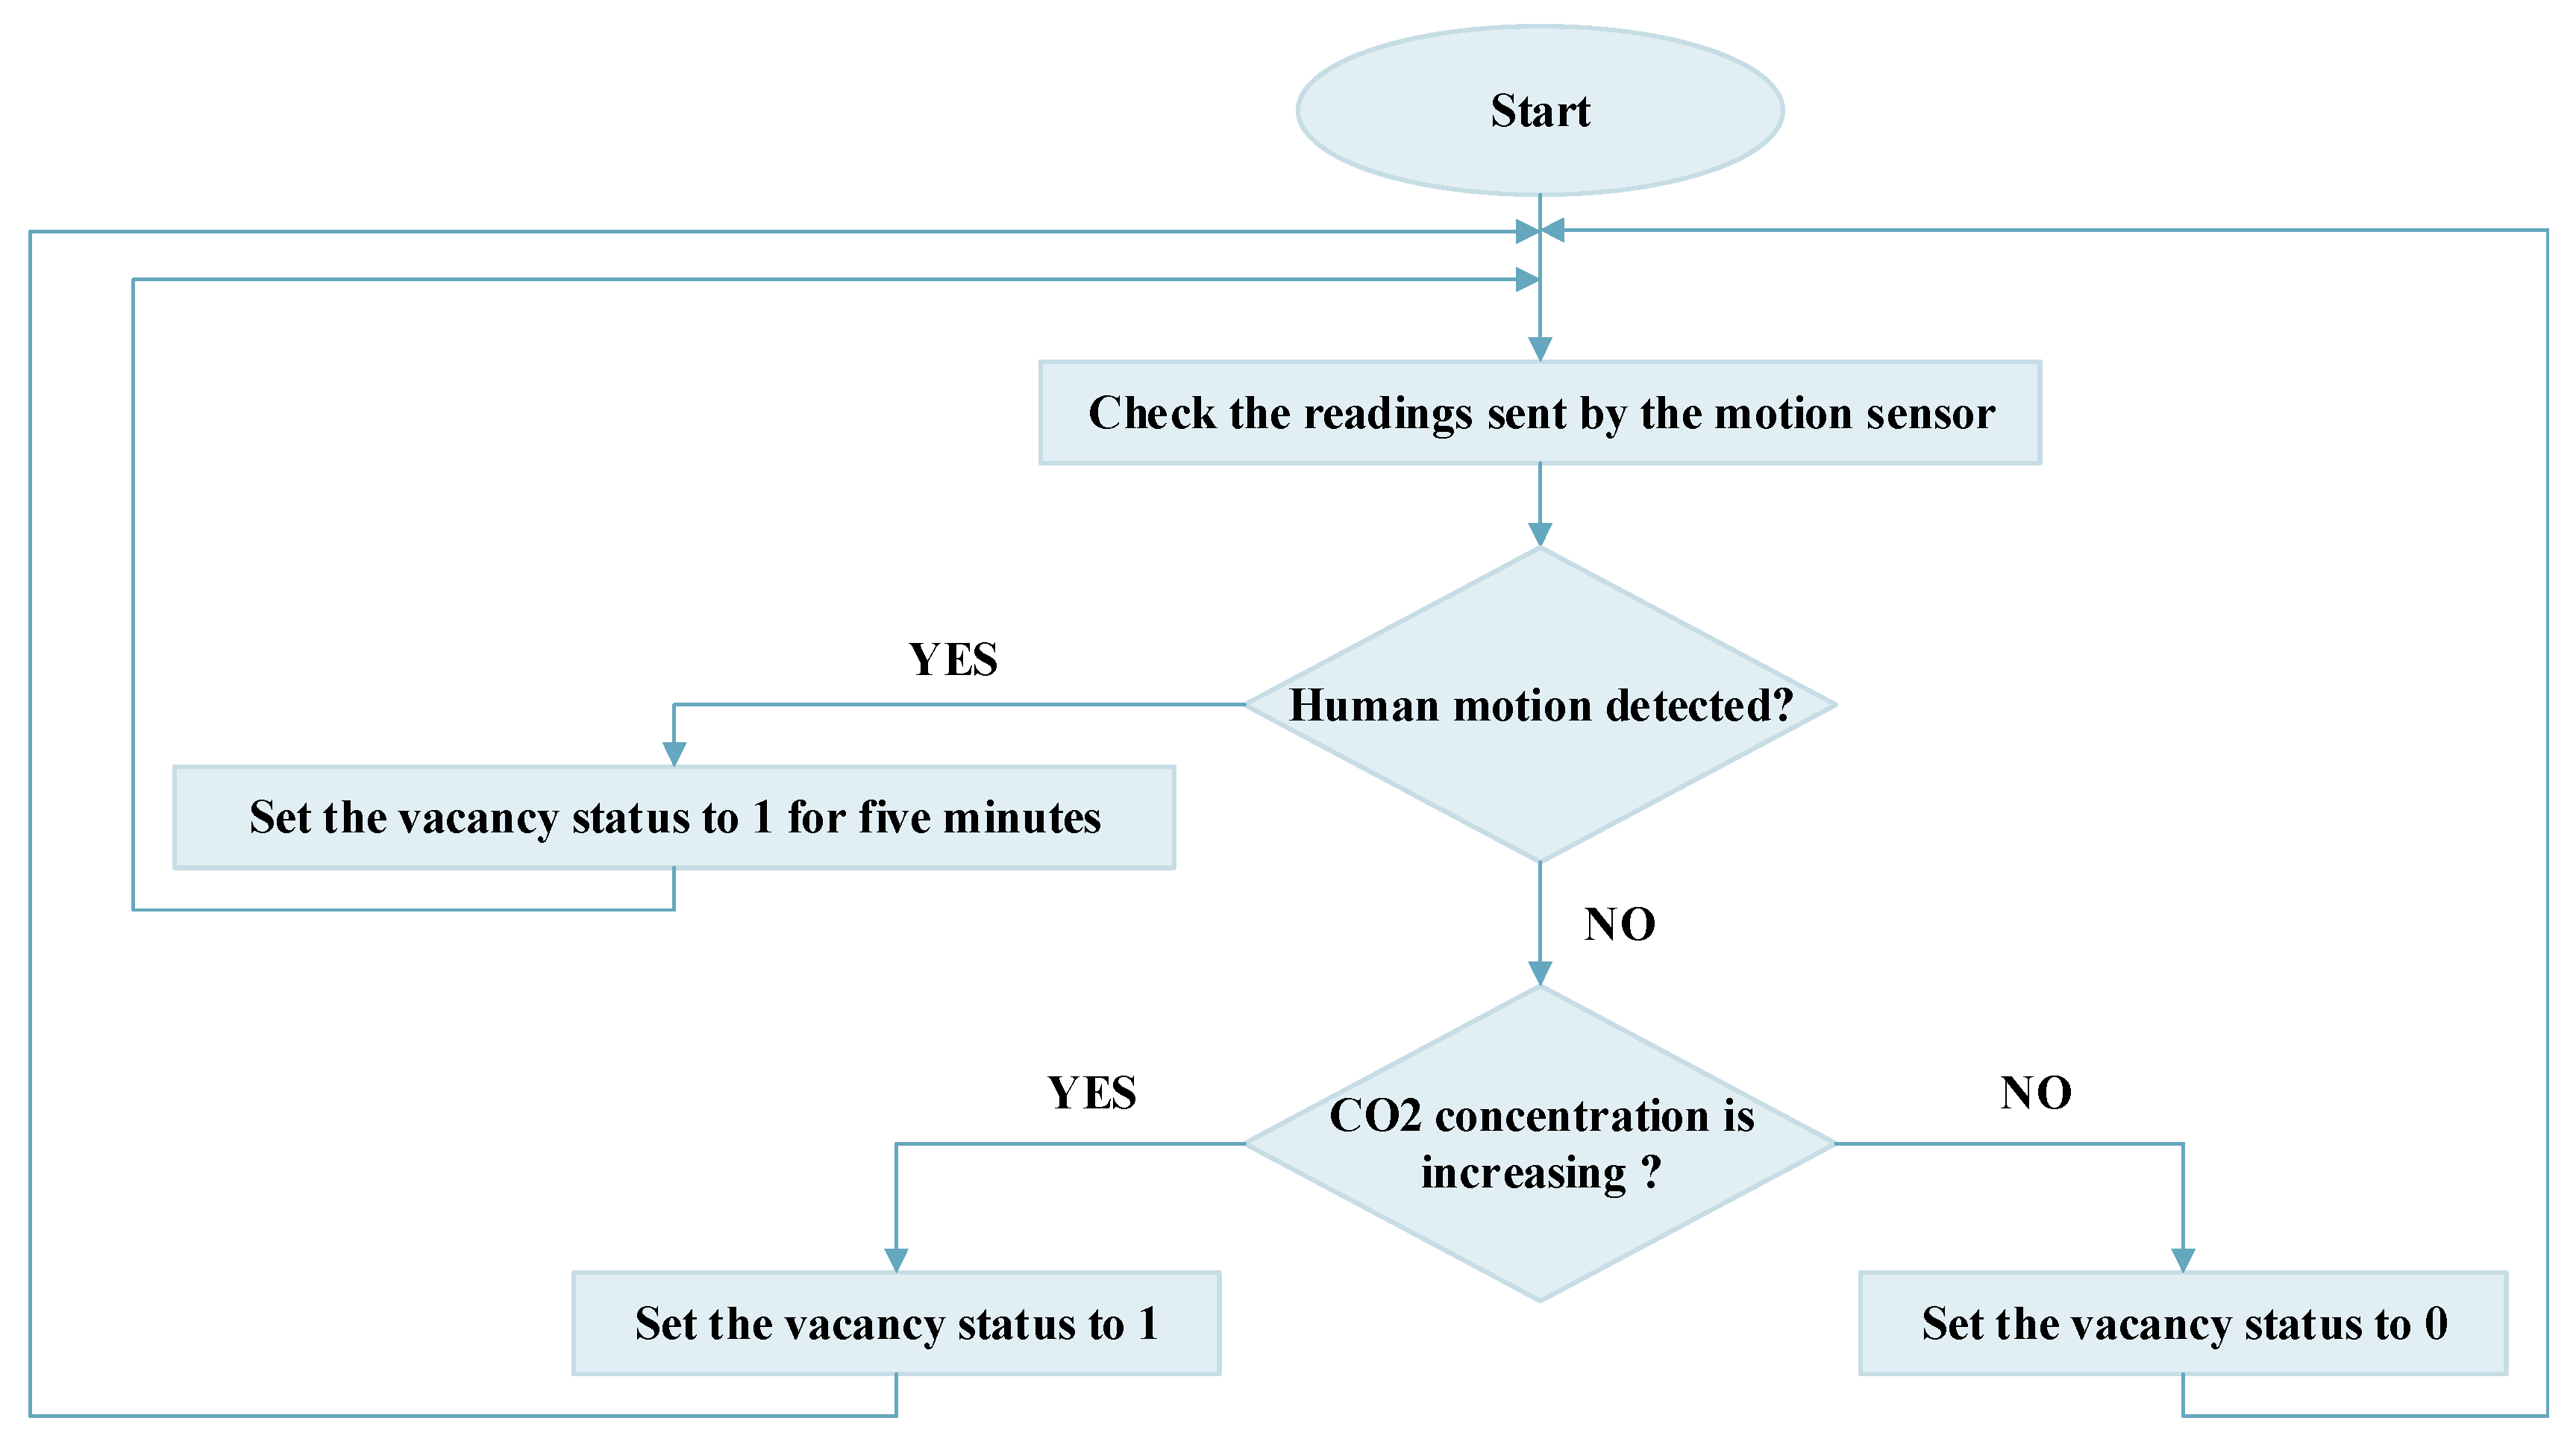
Much energy is wasted through the operation of appliances in a room while no one is inside. AC units and lights should particularly be turned off when a room is unoccupied. This is the reason for employing CO2 and motion sensors in the proposed HEM system. The use of the two sensors affords a two-fold determination of the occupancy of a room. The PIR motion sensor sends a value of 1 when motion is detected inside the room, which indicates that the appliances should be kept on for an additional 5 min. This time duration is used to address the problem that might arise from someone being in the room but without a detected motion, possibly due to an outrage of the PIR sensor trigger. During the 5-min. time gap, the CO2 sensor reads the concentration of CO2 in the room. If a continuous increase is detected, the central controller would maintain the occupancy status of 1, regardless of the motion sensor detection. Conversely, the central controller would wait for the next communication from the motion sensor if there is a decline in the CO2 concentration. If it changes to 0, a vacant room decision would be taken.
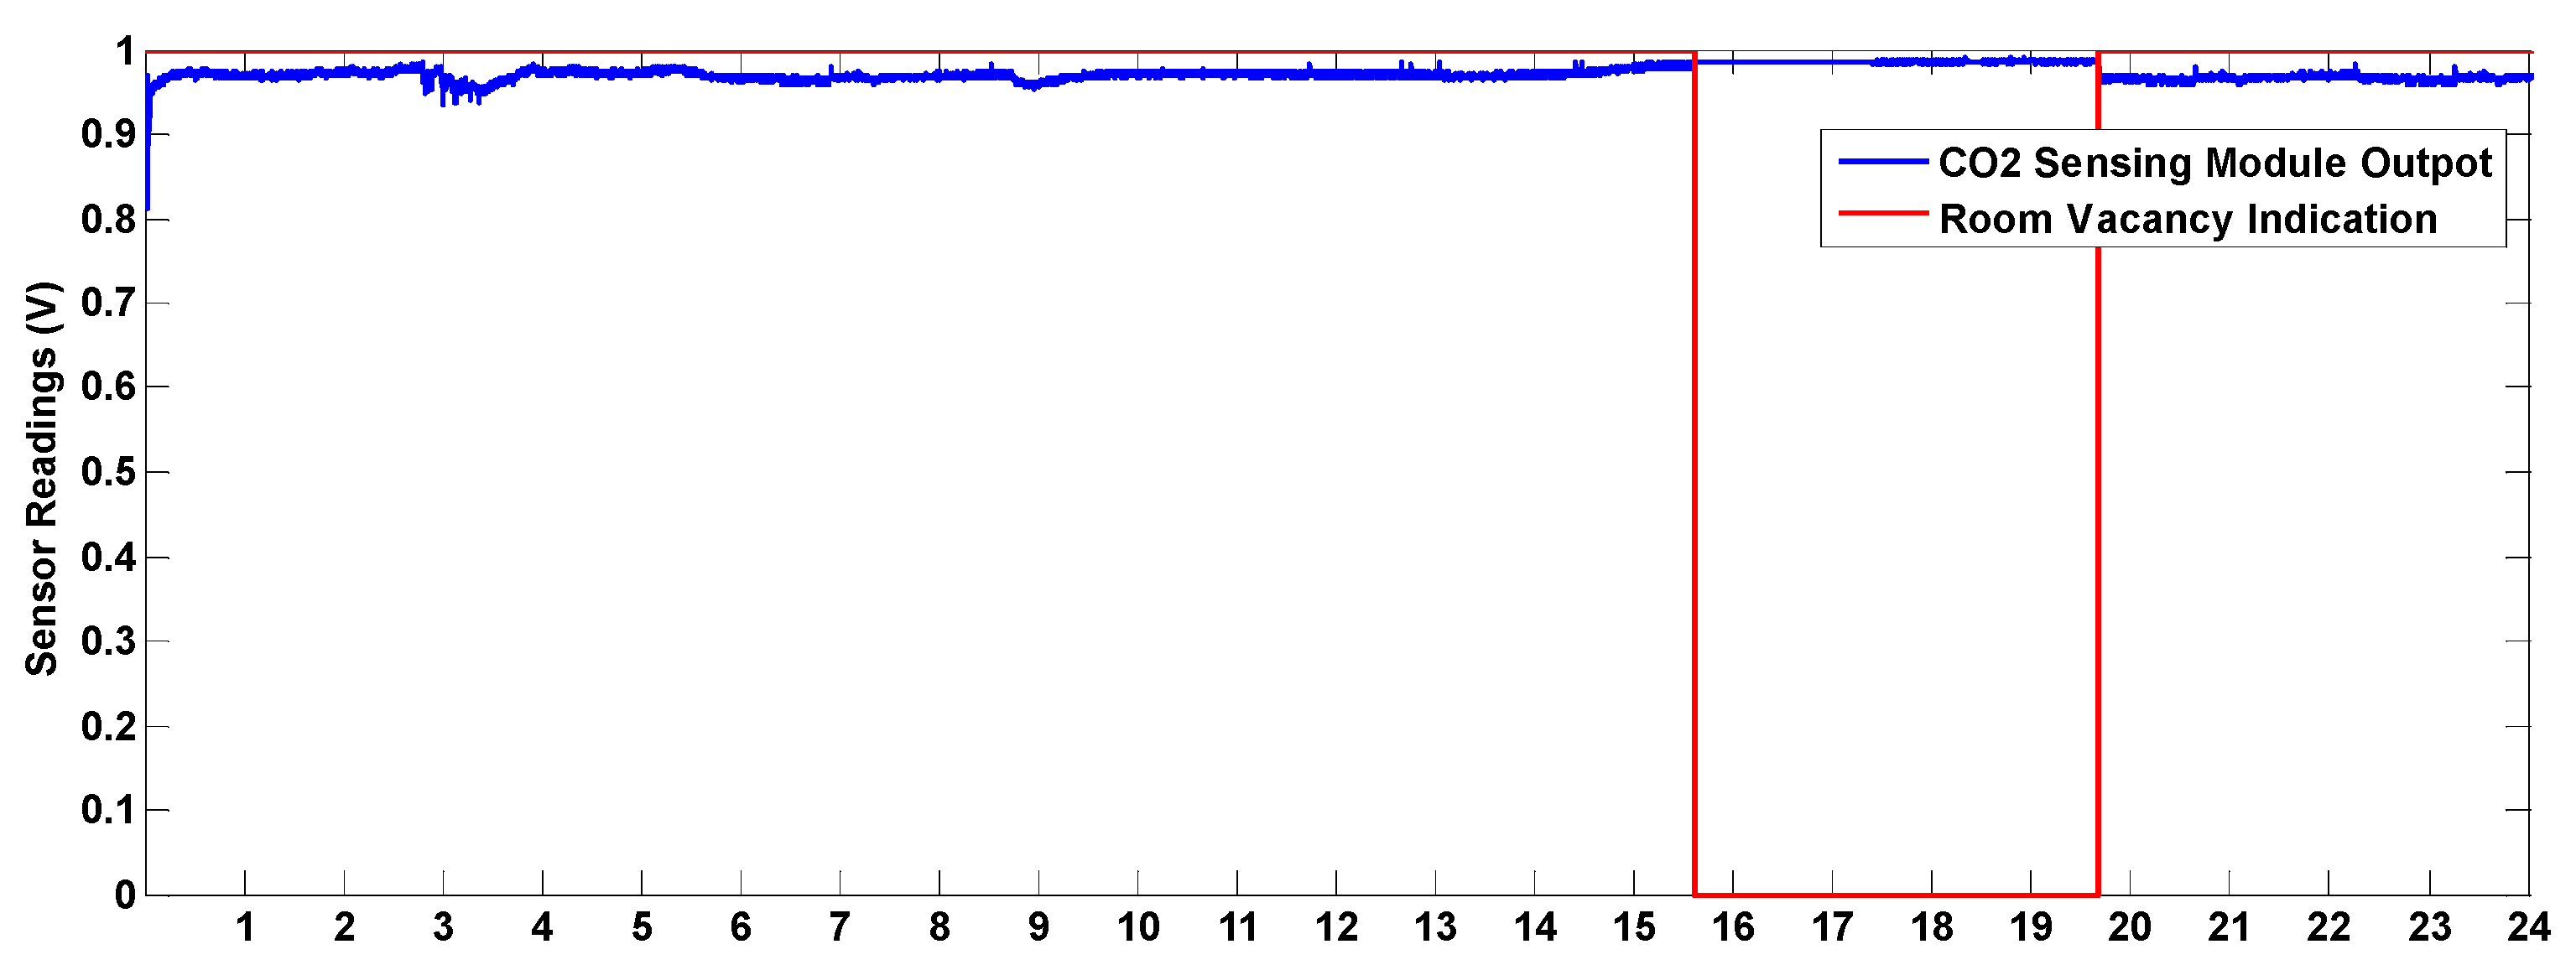
An increase in CO2 inside the room is detected by a decrease in the voltage reading of the sensor. In the present study, the CO2 sensor was placed in the experimental room and its readings were monitored during different known occupancy statuses of the room to set an appropriate voltage threshold. A reading above the threshold indicated vacancy, and vice versa. The flowchart presented in Figure 12 describes the vacancy identification process. Figure 13 shows the CO2 sensor readings during different occupancy statuses of the room over a 24-h period. When the CO2 concentration in the room settles at a certain level, it is always below the set threshold, whereas the occupancy of the room always takes it above the threshold.
3.2. Home Appliance Usage Preference Survey
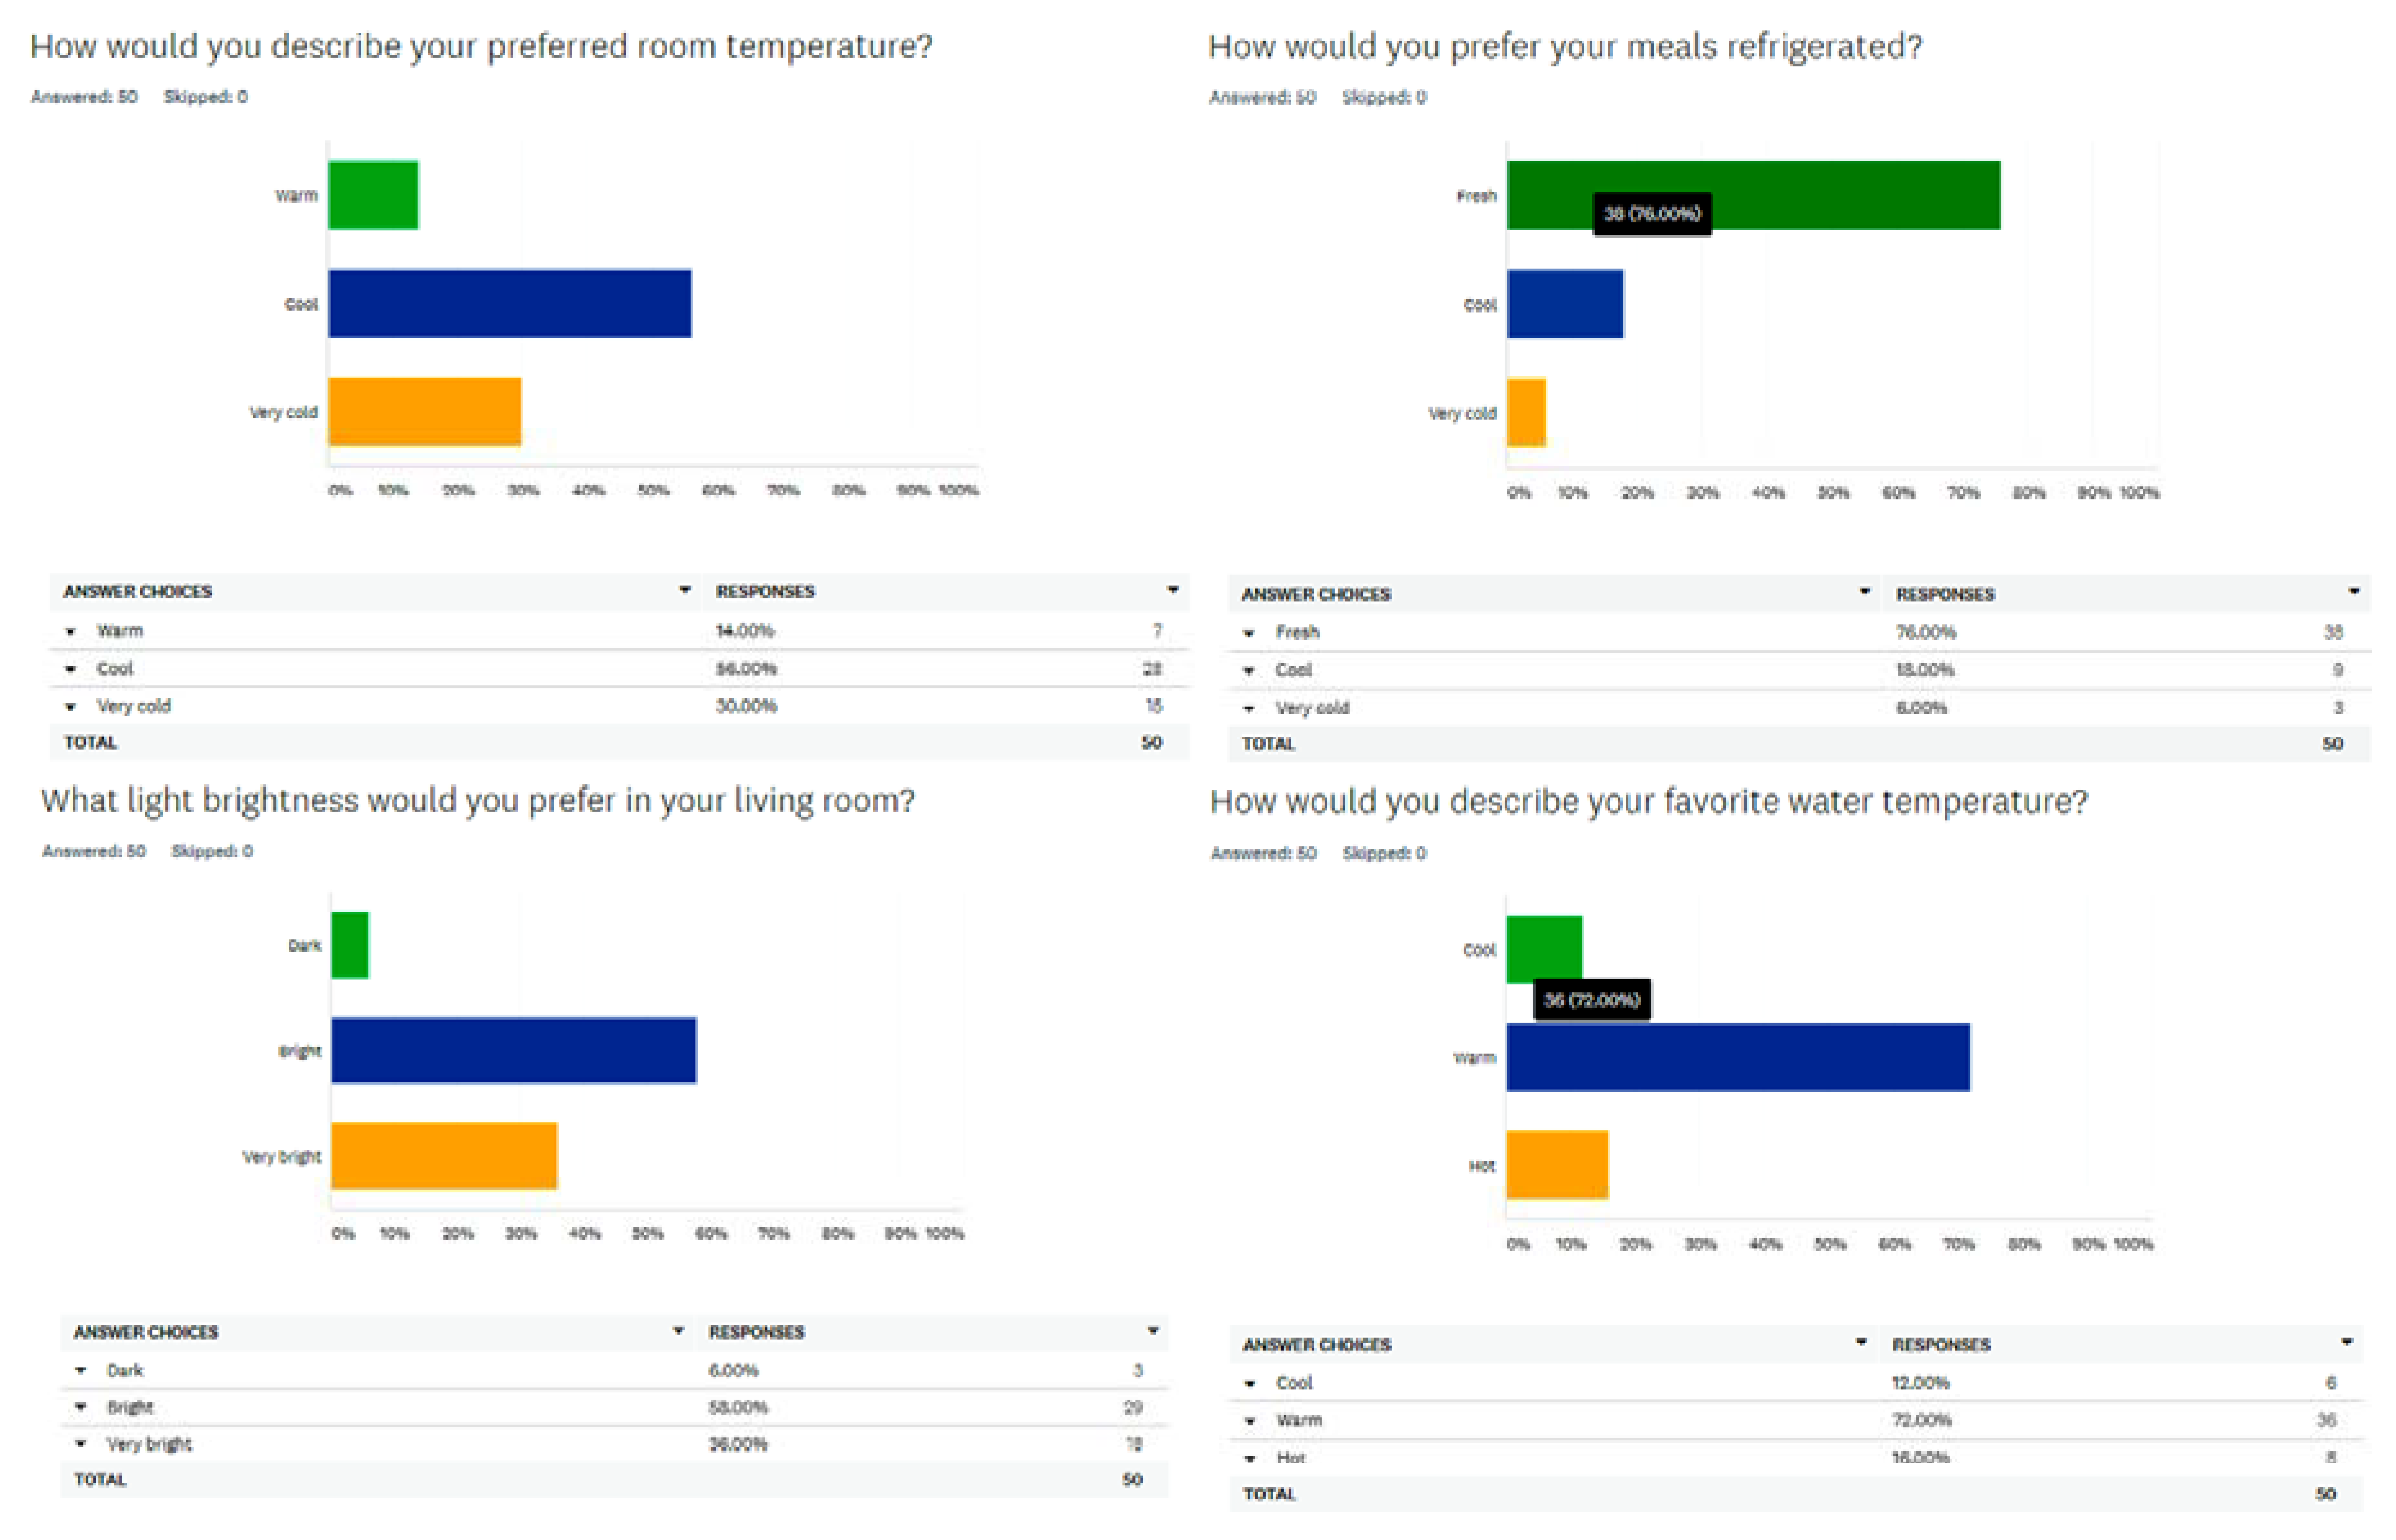
This survey aims to identify the categories of appliances that are used by the respondents, the features of household appliances, power consumption, customer behavior, and factors that can affect home electricity intake. A data collection forms were prepared on the SurveyMonkey® online platform to inquire about the different perspectives of the involved 50 participants in order achieve these objectives. The survey forms were designed with multiple choice, and Likert-type scales. The participants of the survey comprise people living in apartment building (51%), families living in landed houses (30.6%), and university students living in dormitories (18.4%) from Al Ain, UAE. The ages of the respondents ranges between 18 and 45 years. It should be noted that 96% of participants use the AC for more than 2 h per day. This could be mailing due to the hot UAE climate. Figure 14 shows some of the most important information obtained from this survey to determine the set points of the appliances and full list of questions can be seen in Appendix A.
3.3. Energy Management Algorithm
Based on the results of the survey in the previous section, Table 2 was developed to set the thresholds for the rules of the algorithm, after defining the terms in the answers and relating them with temperature and lux values [27,28]. A particular answer was chosen by the majority of the participants for each question, as can be observed from Table 2.
A rule-based algorithm was developed to manage the usage of the household appliances discussed above while using the proposed HEM system. The algorithm operates with preset user preferences and day-ahead electricity pricing signals, as well as inputs from the different circuitries of the HEM system, enabling the most convenient and energy-efficient usage of the household appliances. This information was gained from a questionnaire in the previous section that was conducted on a representative sample of customers [29].
The predominant answers from the survey were used as the starting point for formulating the appliance schedule and light dimming rules. The algorithm also utilized online information from the room condition monitoring circuitries regarding the variations of the illuminance, room temperature, water temperature, and refrigerator temperature, as well as the variation of the time-of-use (TOU) pricing, which was obtained from a prediction algorithm that was embedded in the main controller. Thus, the room condition parameters were sent wirelessly to the main controller. The utilized circuitries, as described above, enabled measurement of the illuminance (L), internal refrigerator temperature (TREF), room temperature (TRoom), water temperature (TW), and vacancy state of the room (Vs.).
The algorithm used the preset user comfort ranges for each appliance, or the immediate previous measurements, as detailed in Equation (1).
where TREF_t is the online value of the internal refrigerator temperature; TROOM_t, LUXROOM_t, and TW_t are the present room temperature, present illuminance, and present water temperature, respectively; and, min and max indicate the minimum and maximum comfort values of the parameters set by the user. Table 3 gives the minimum and maximum preset values of each parameter used in the present study, based on the survey results presented in Table 2.
The algorithm is designed to control the appliances such that the different parameters can only assume values within the respective preset ranges in Table 3. Each appliance schedule is determined by a set of factors, including the TOU, power consumption, room occupancy, and desired performance of the appliance, which are determined by the different circuitries of the system. Equations (2)–(5) express the schedules (S) for the LED light, AC, refrigerator, and water heater, respectively.
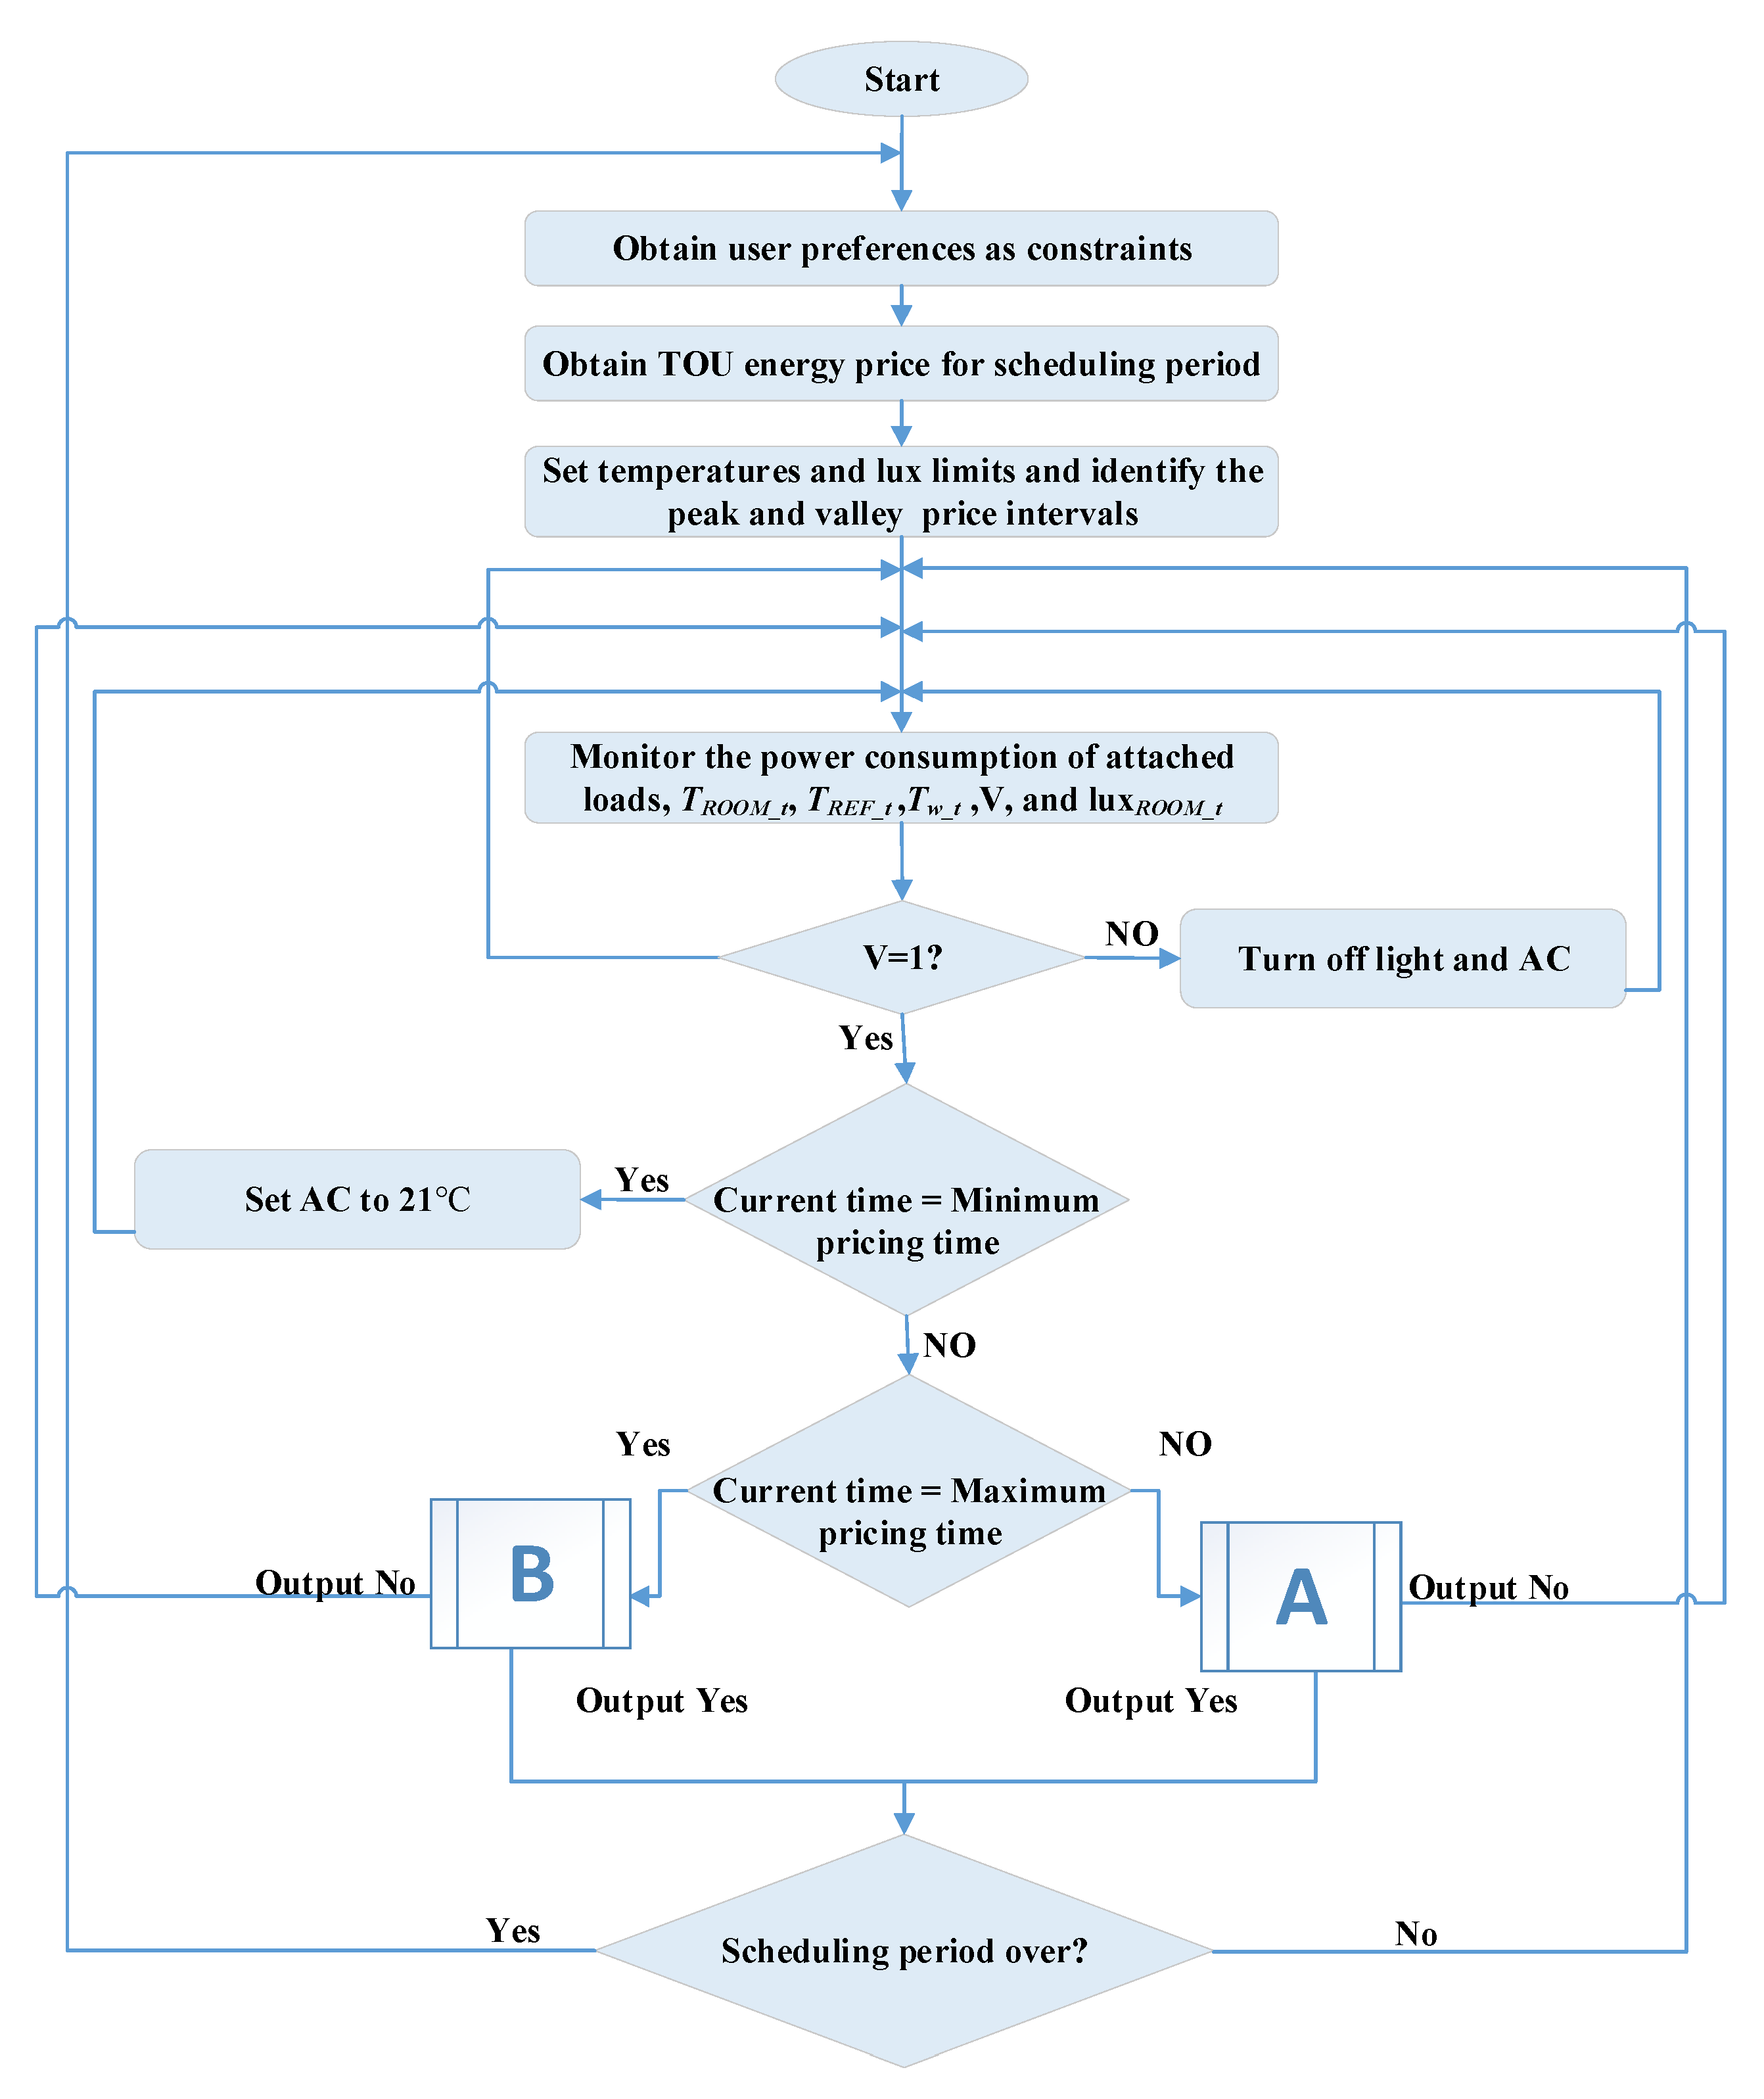
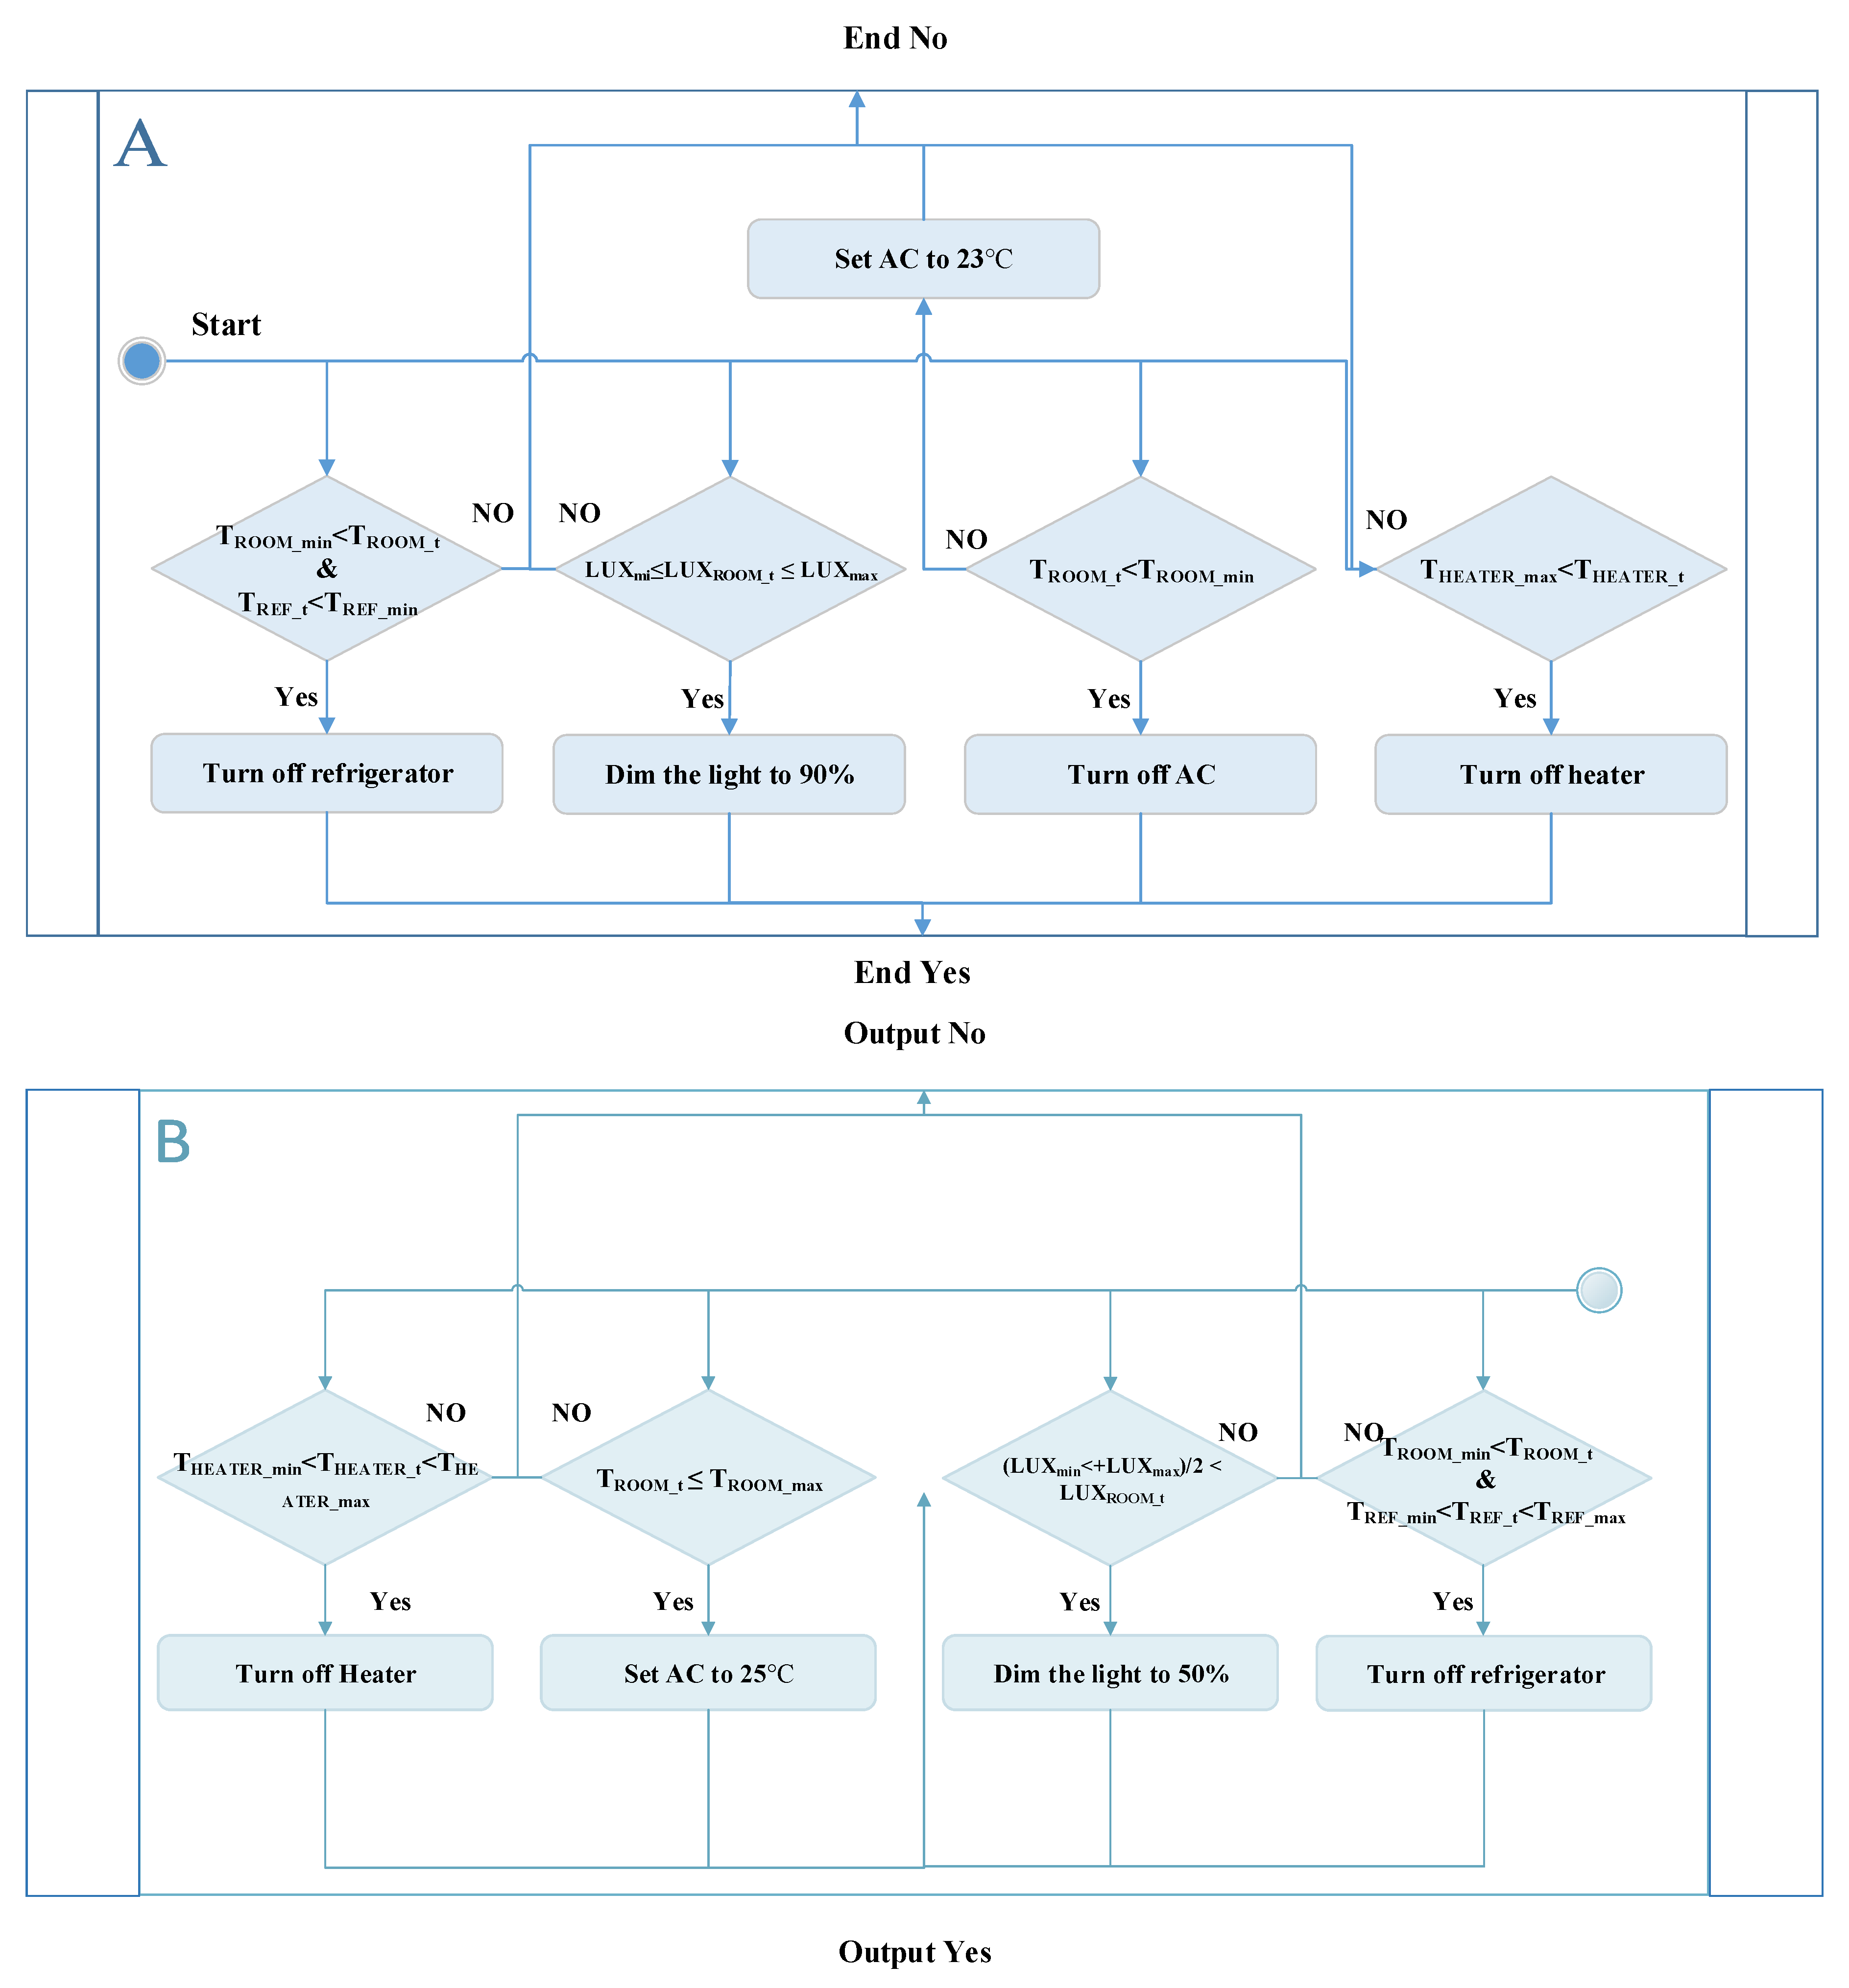
As an example of the use of the rules in the above equations, the algorithm dims the light to 50% when the room is vacant, with illuminance remaining within the comfort range during the maximum pricing hours to ensure that the energy consumption is reduced without affecting user comfort. Additionally, the AC is allowed to cool the room to the lowest allowed temperature during the minimum pricing time, and to increase the compressor off period outside the minimum pricing time. In another example regarding the use of the refrigerator equation, the refrigerator is turned off when the set minimum temperature is reached, regardless of the pricing signal. Further, the heater is turned on when the present water temperature is less than the set minimum. Equation (2) expresses other lighting levels for various conditions, while Equations (3)–(5) express other scheduling rules for the other appliances. Figure 15 shows a comprehensive flowchart of the energy management algorithm.
3.4. Experimental Methodology
Two 24-h experiments were performed to demonstrate the ability of the designed circuitries to monitor and control the electrical appliances after setting up the hardware and specifying the inputs and outputs of the energy management algorithm. The economic benefit of the HEM system was also analyzed. Firstly, the power consumptions of the appliances under normal utilization over the duration of a day were monitored and recorded. The temperature and illuminance were also recorded. The HEM system was then applied for another 24 h under exactly the same circumstances of the appliances, and similar recordings as in the previous experiment were obtained.
4. Results and Discussion
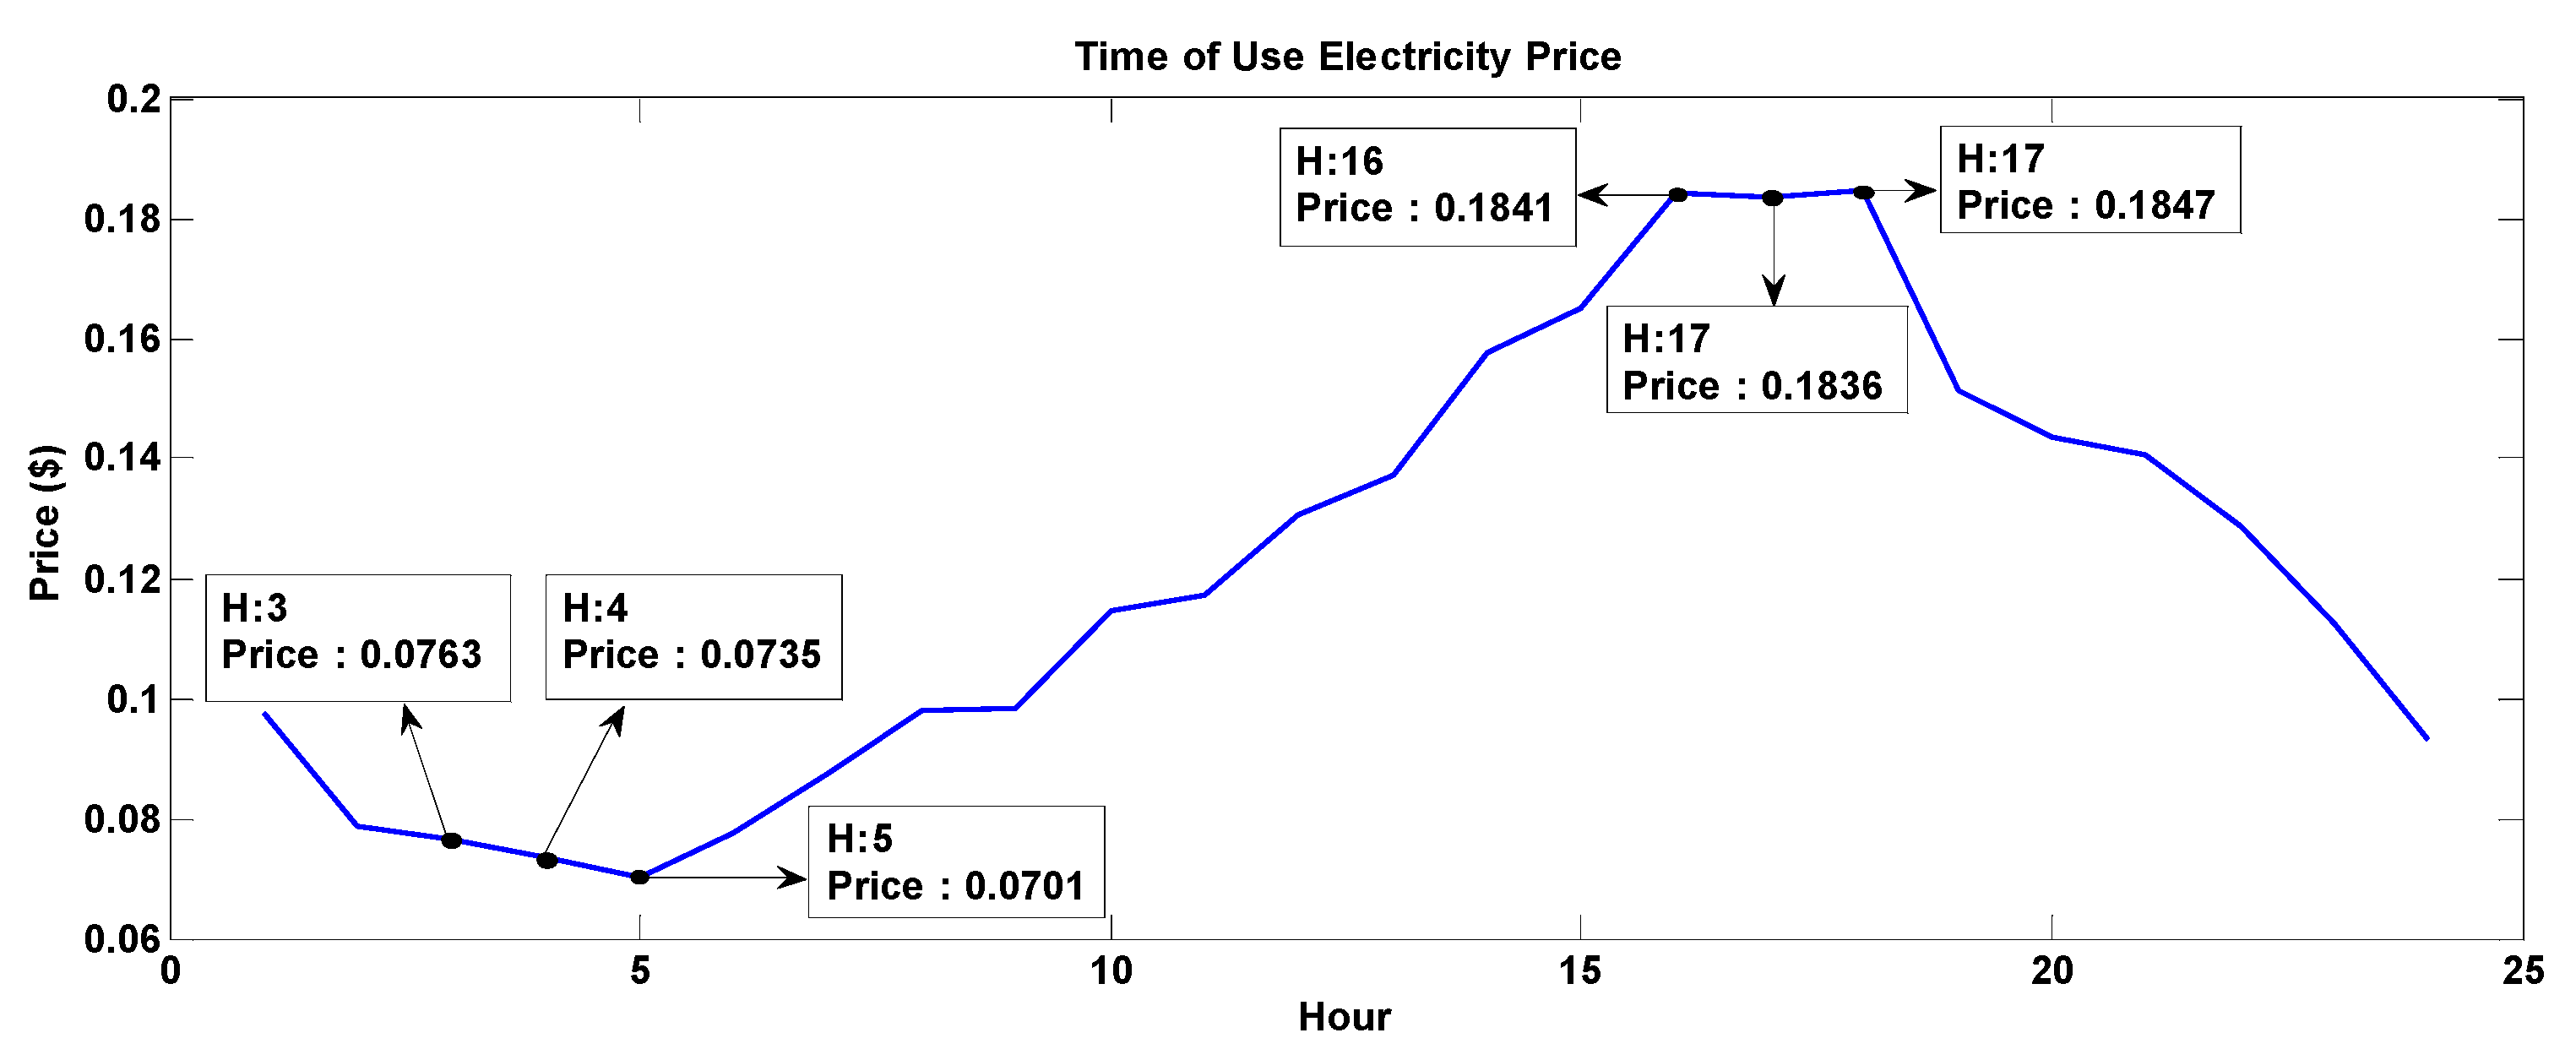
The power consumption, output, and daily energy consumption of each appliance under normal operation and when using the HEM system were compared. Figure 16 shows the electricity pricing signal during the use of the HEM system.
The duration of a day during the experiments comprised three main types of hours, namely, the minimum pricing hours (third, fourth, and fifth hours of the day), the maximum pricing hours (16th, 17th, and 18th hours), and the normal pricing hours (all other hours), as can be seen from Figure 16. The HEM algorithm was expected to manage the appliances in different ways during these three types of hours of the day.
4.1. LED Light
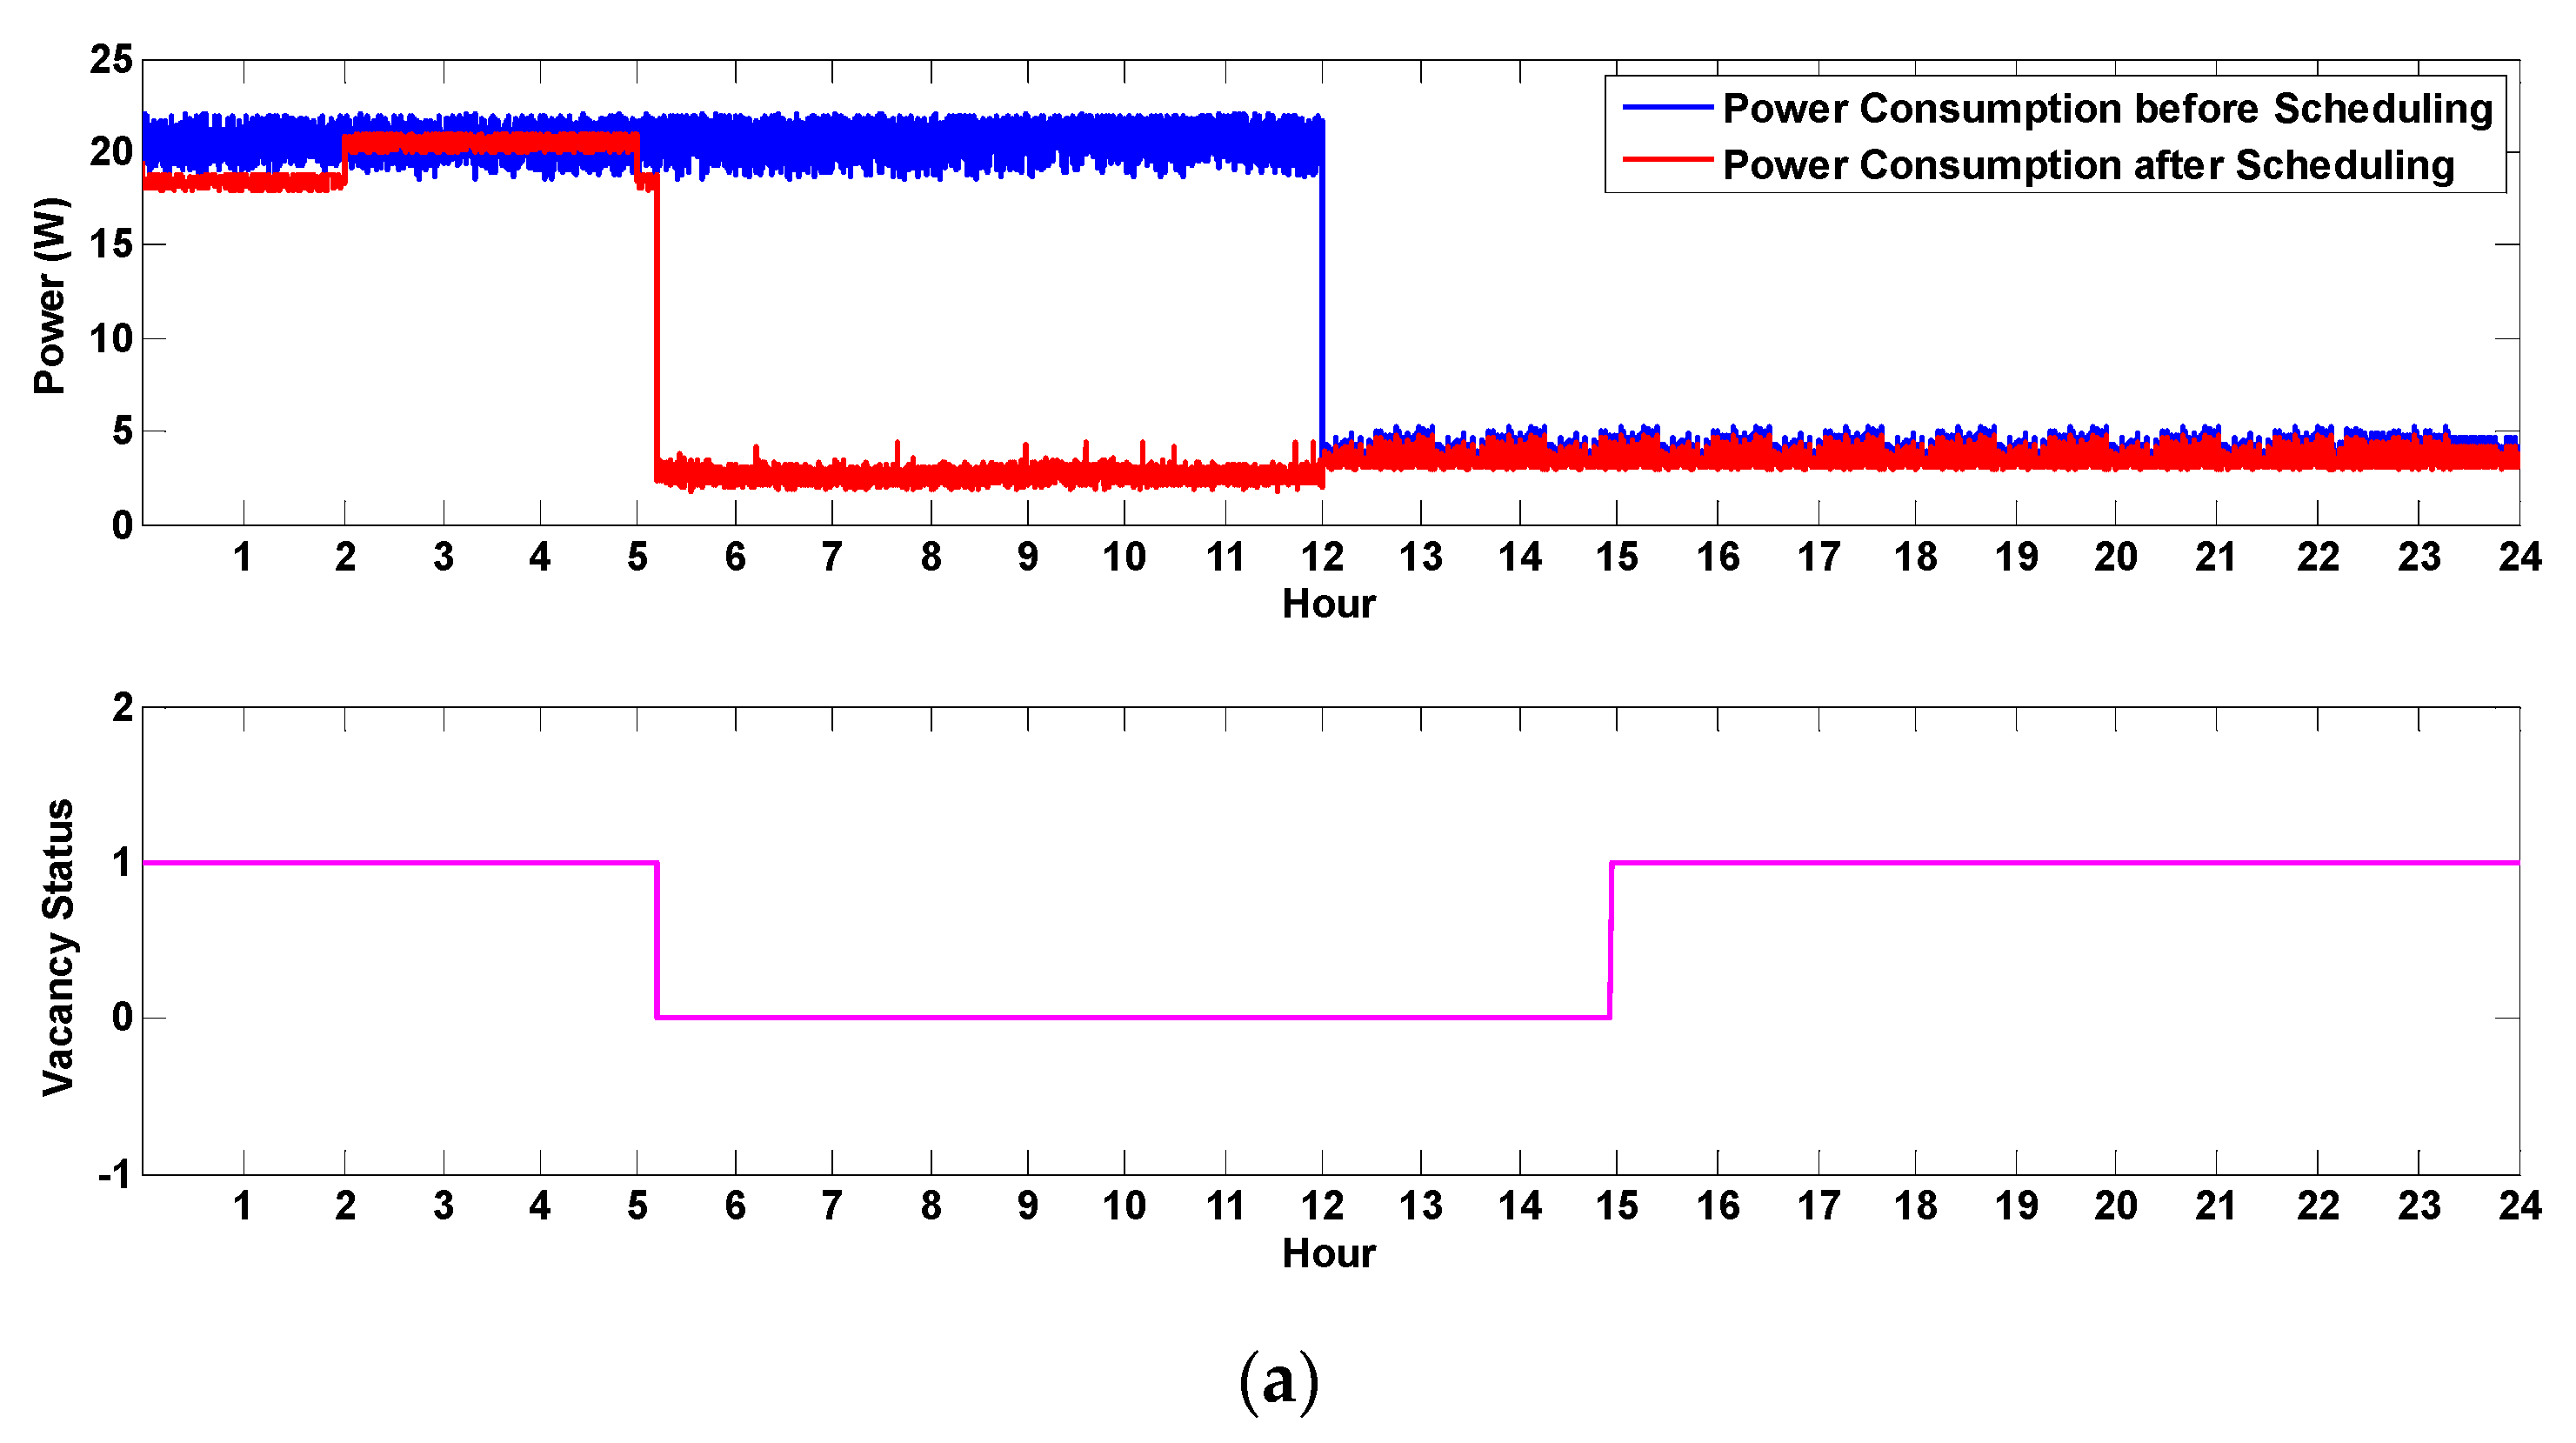
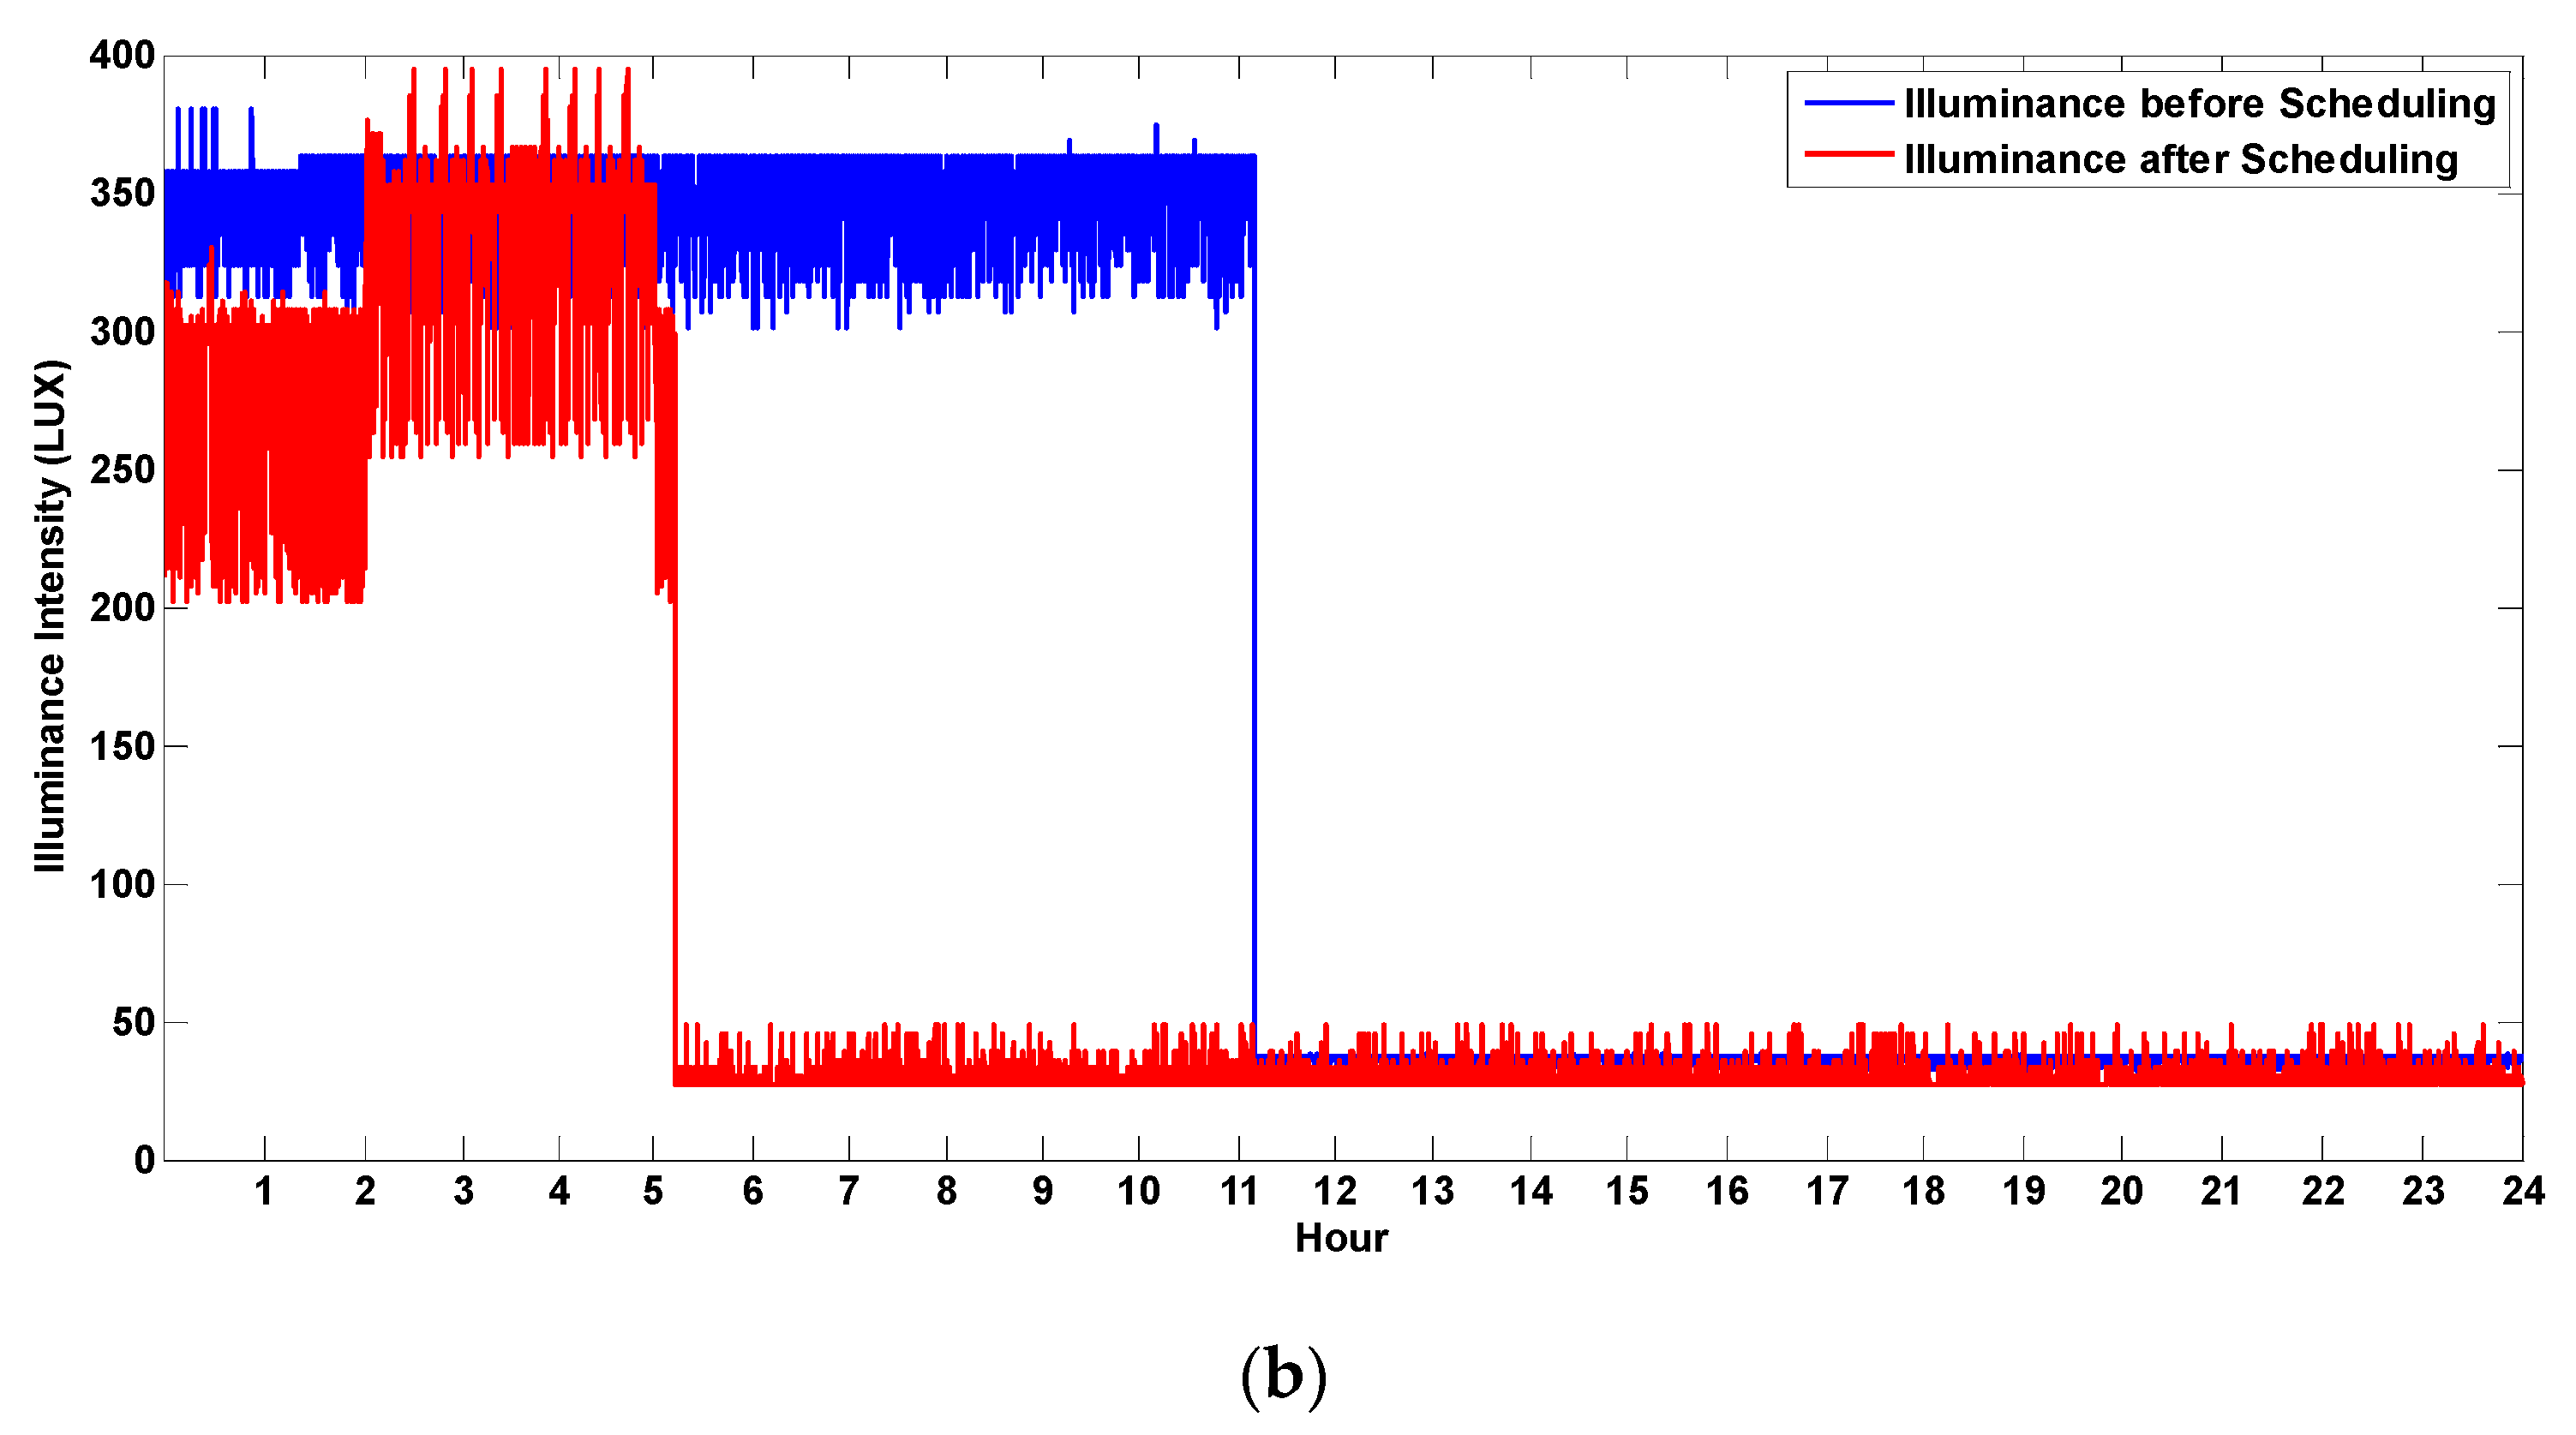
The LED light was turned on for 12 h of the day during the experiment, and then turned off for the other 12 h. However, the HEM algorithm could reduce the energy usage during the utilization period. Figure 17 compares the power consumption of the LED light without and with the use of the HEM system, as well as the corresponding illuminance variations.
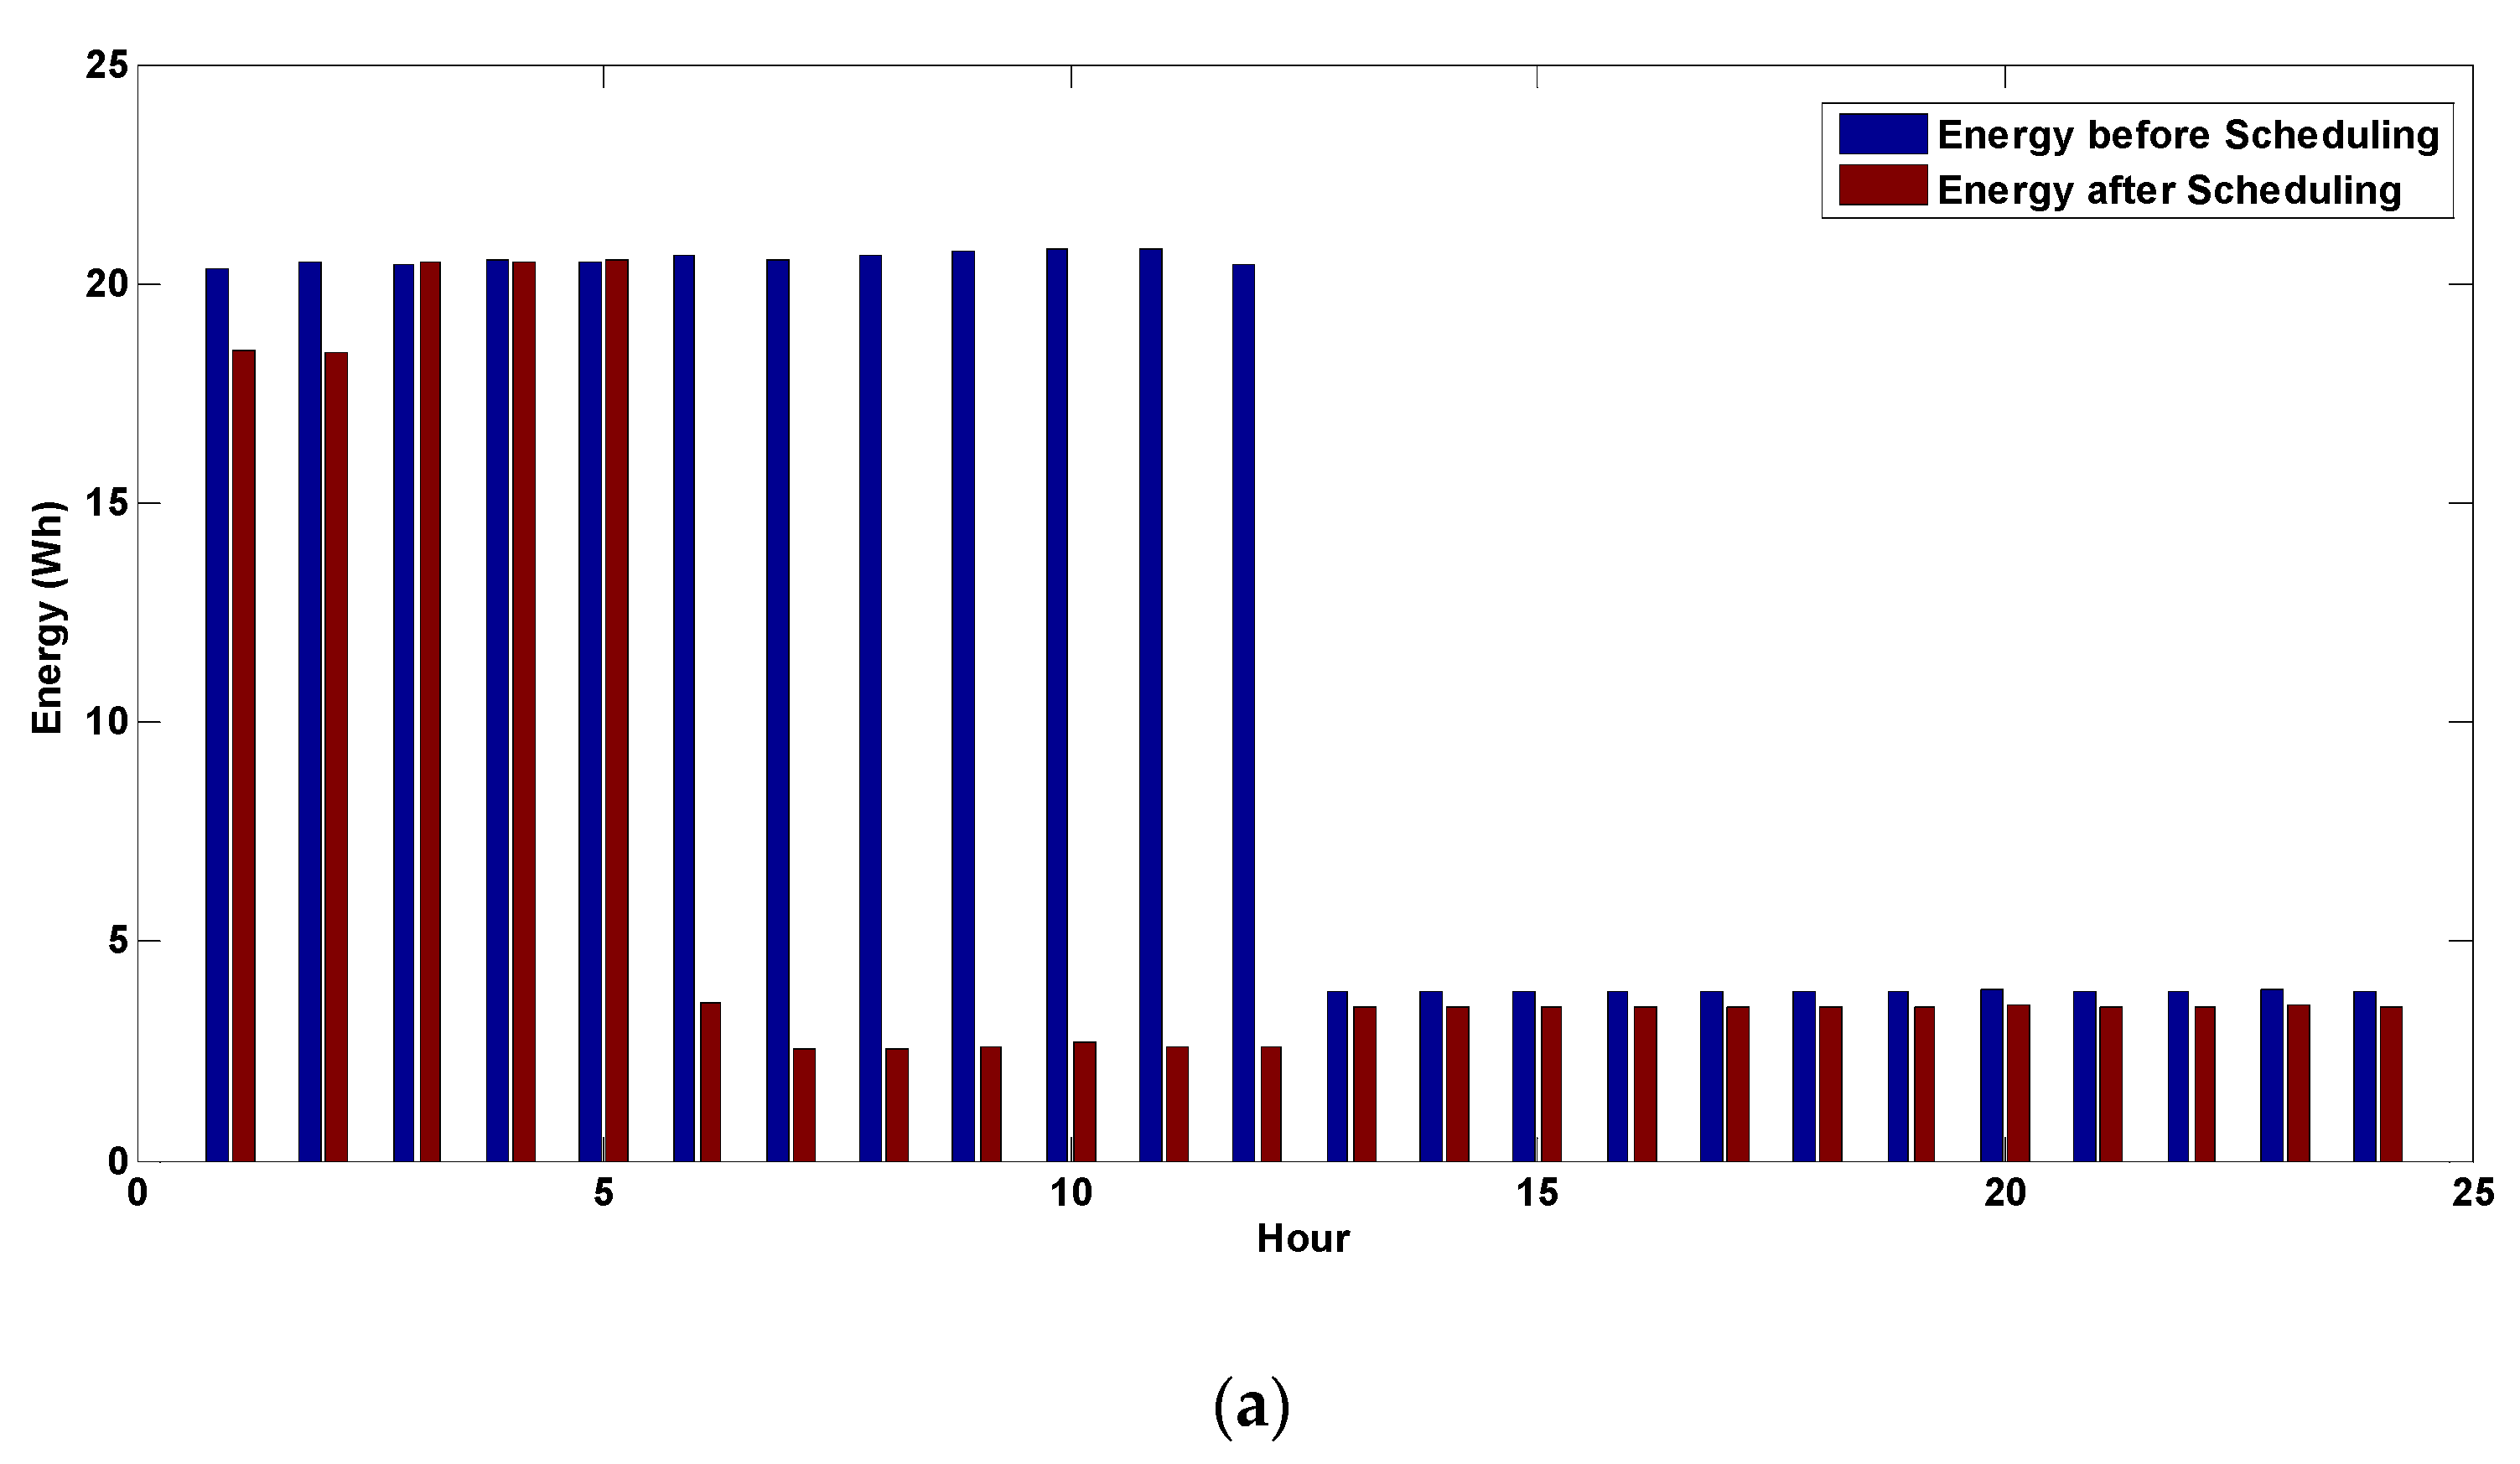
In Figure 17, the first 12 h correspond to when the LED light was turned on. The light was fully on when the HEM system was not used, while the illuminance was regulated when the system was used. The algorithm turned off the light whenever the room was vacant, as can be observed from the figure. In addition, when the room was occupied, the light was dimmed to 90% of its illuminance capacity during normal electricity pricing hours, but it operated at full capacity during minimum pricing hours. The variation of the illuminance was within the preset preferences in Table 3 during all the scheduling periods, and below the maximum constraint by 10% during non-peak periods, as can be observed from Figure 17b. However, all of the constraints were removed during minimum pricing hours. Figure 18 shows the effects of the HEM algorithm on the daily energy consumption and electricity bill.
The energy and bill savings achieved by the occupancy principle of the HEM algorithm were remarkable, although there were no savings during the minimum pricing period, because the HEM algorithm allowed for the LED light to operate at full capacity at that time. Overall, the algorithm afforded energy and bill savings of 0.133 kWh and $0.014, respectively, for the day.
4.2. AC Unit
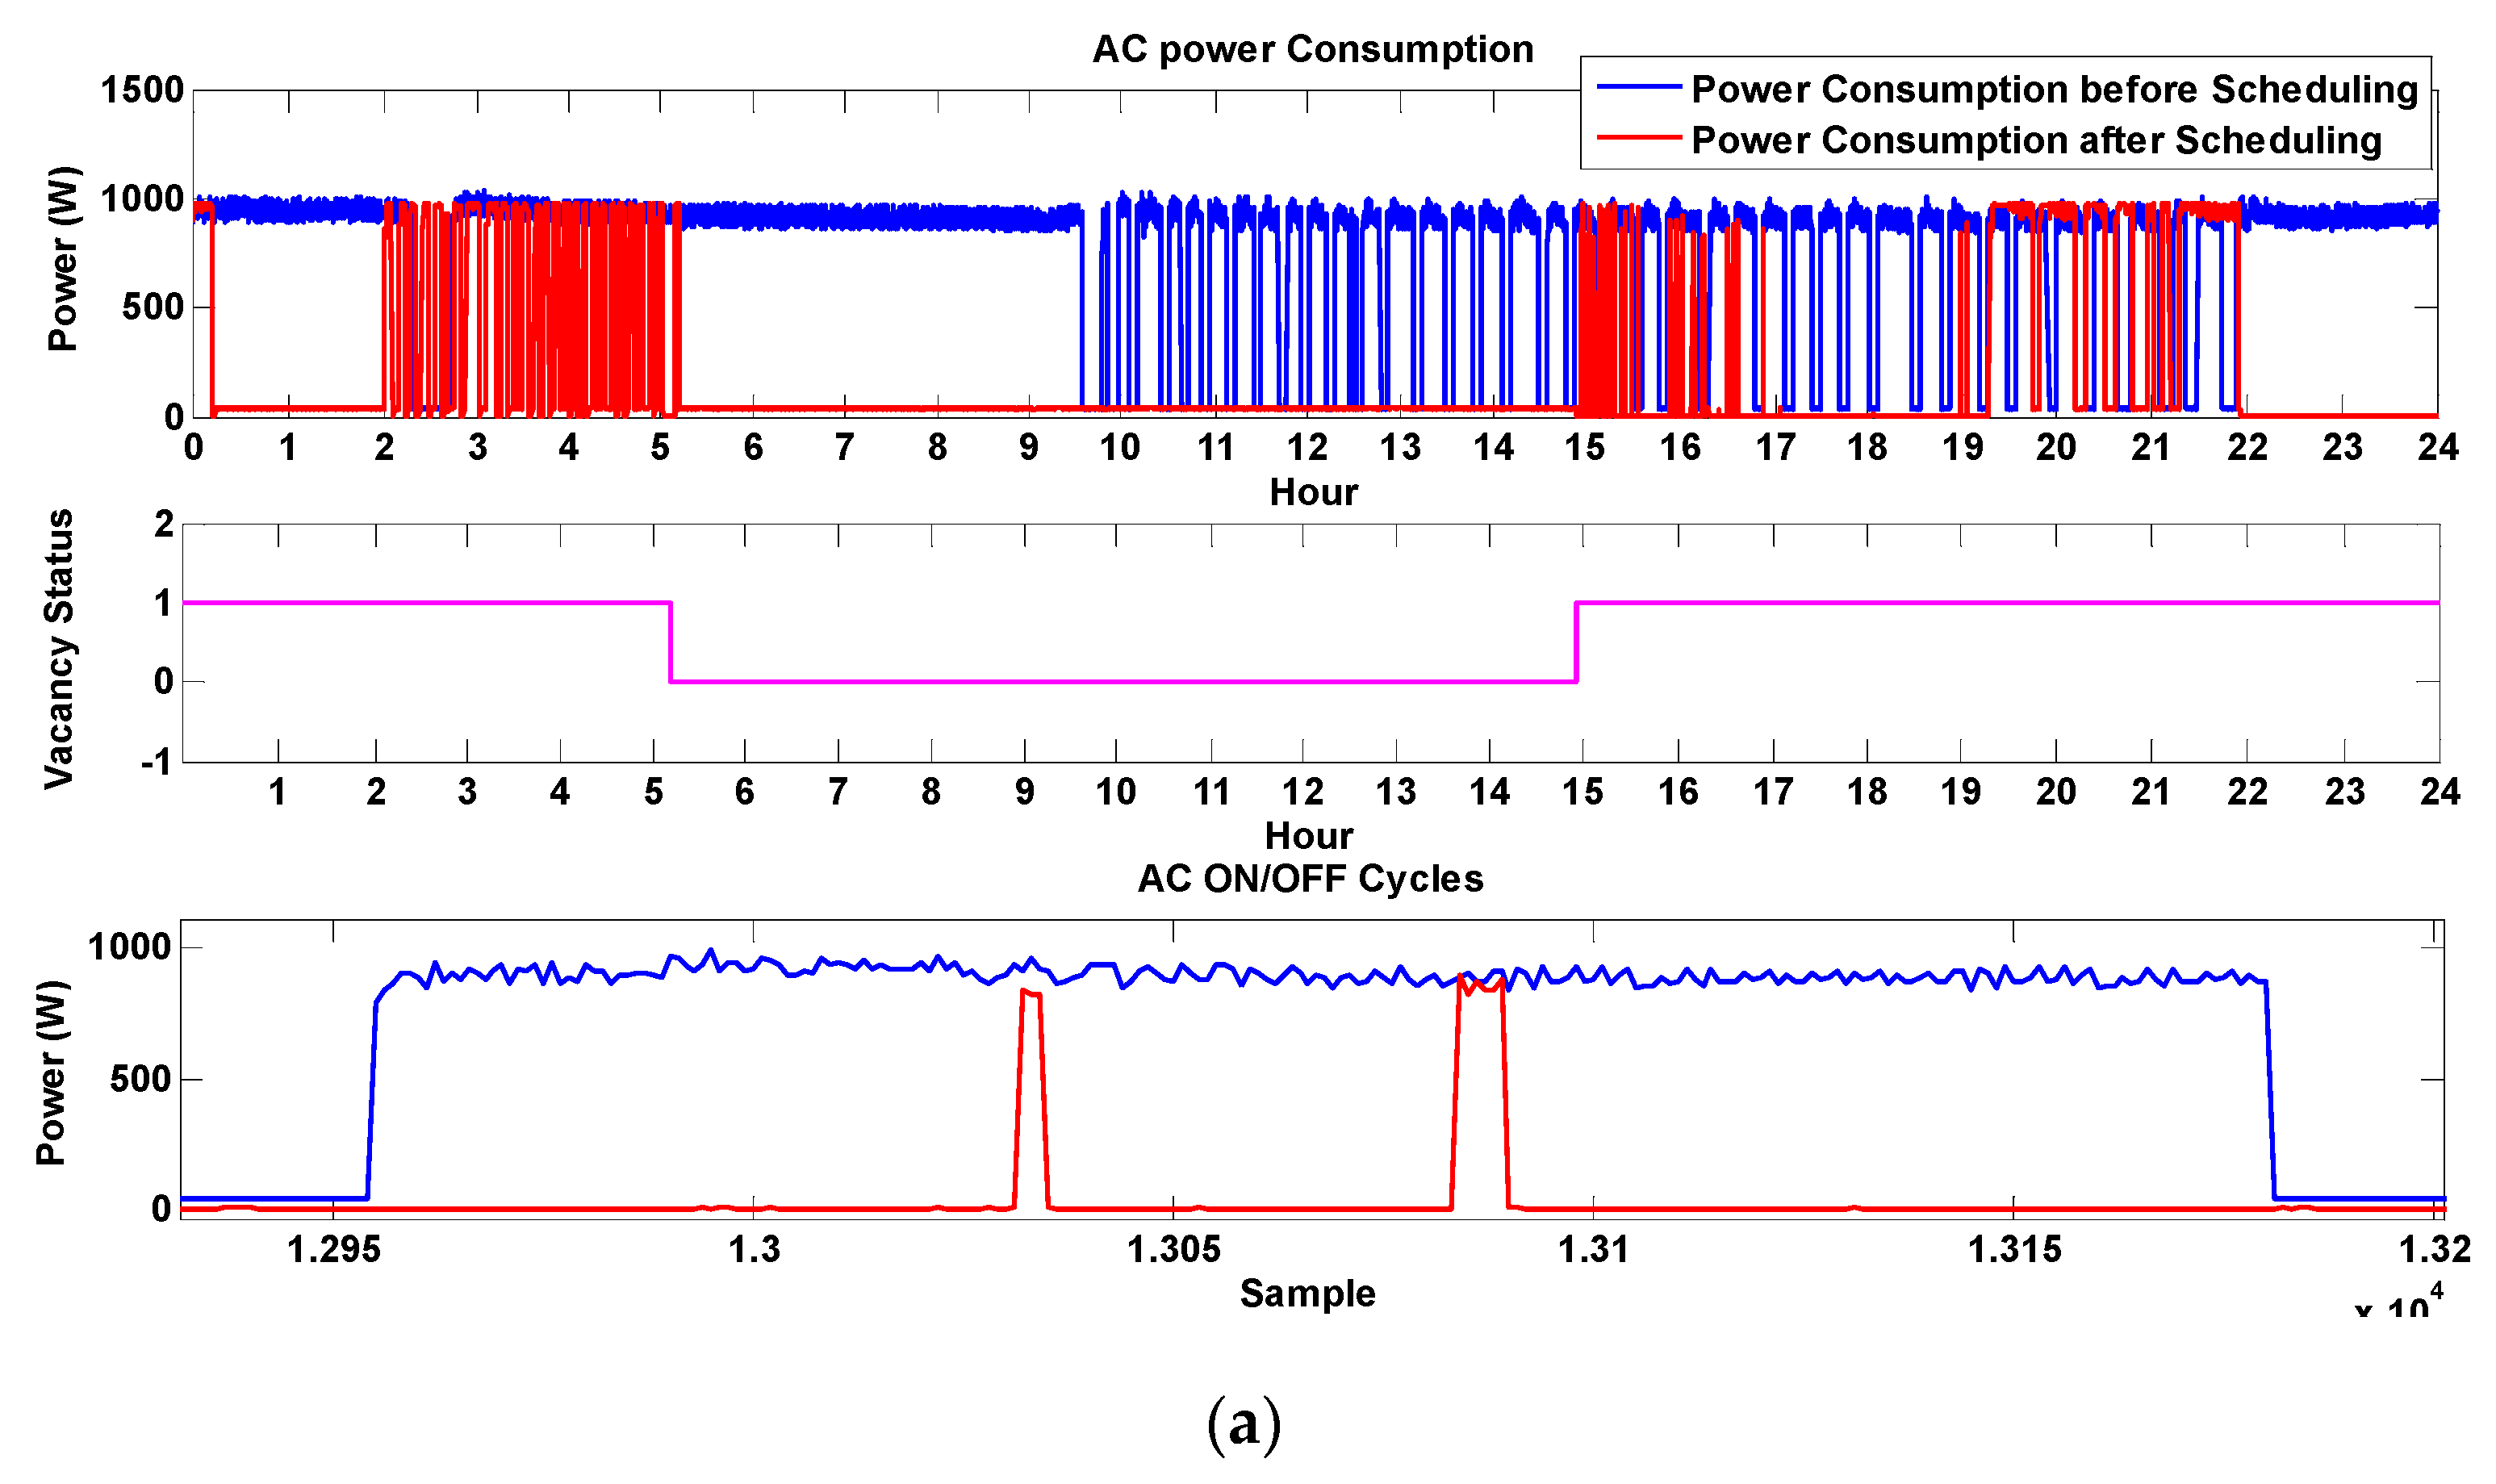
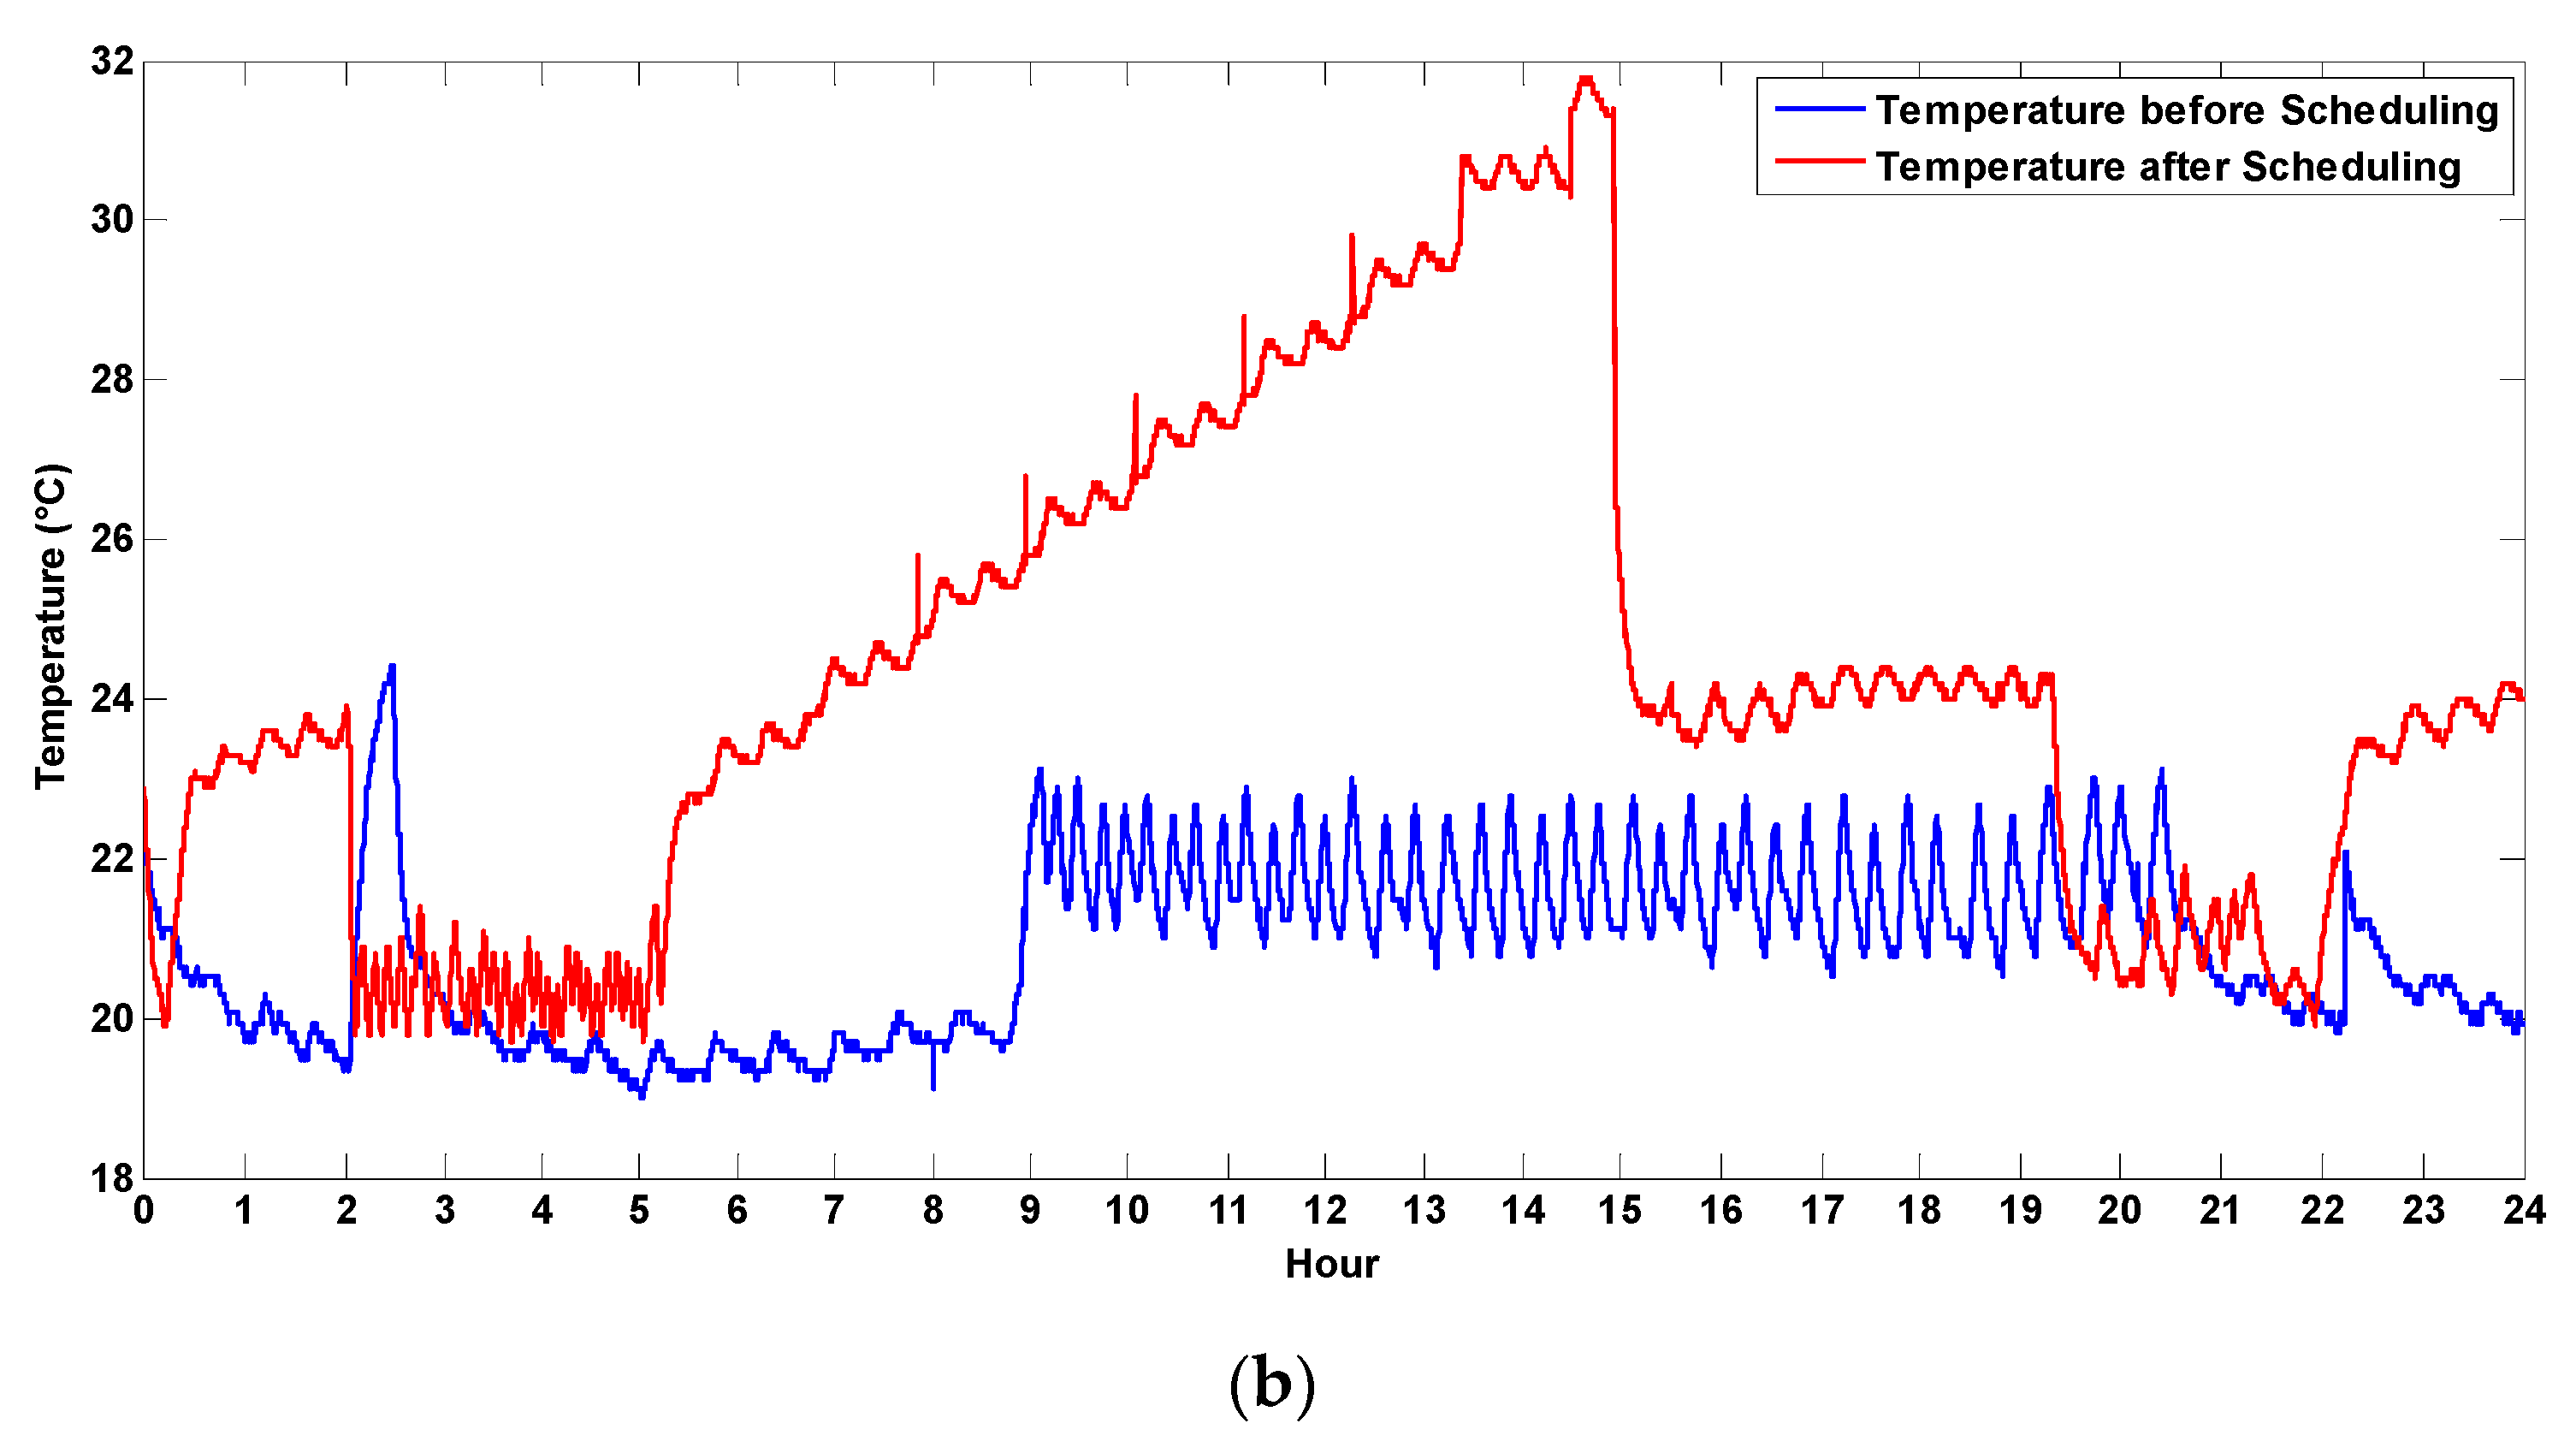
As with the LED light, the operation of the AC unit was based on the room occupancy, as well as the room temperature. Figure 19 shows the power consumptions without and with the use of the HEM system and the corresponding temperature variations. It should be noted that, before the scheduling, the use do not turn off the AC unit even during unoccupied period due to hot climate in UAE. However, the user usually control the AC unit only by just adjusting thermostat set points manually. This is clearly seen in the power consumption pattern and temperature plot represented in the blue line in Figure 19.
The AC unit was continuously operated until the set temperature was reached, and the compressor was then automatically turned off. Based on the set temperature limits, the unit subsequently alternated between the on and off status to save energy. Under normal energy pricing, the AC was continuously operated, except the consideration of the room occupancy status was manually turned off. However, the HEM algorithm did not allow for the AC to operate until the threshold temperature of the room was reached. Although the temperature threshold varies with the pricing regime (minimum, normal, or maximum pricing), the algorithm was always able to reduce the energy consumption.
During non-peak pricing hours, the AC was allowed to operate, provided that the room was occupied and the room temperature was within the preset limits. In addition, the algorithm controlled the AC to maintain the lowest possible temperature during low pricing hours, so it could be turned off during high pricing hours without affecting the user comfort. However, the AC was allowed to maintain the room temperature at the preset upper temperature during the maximum pricing hours, as can be observed from the third graph of Figure 18a. It was turned off more frequently when the room temperature was further below the preset maximum temperature. This can be observed from the noticeably different cycles of the AC compressor during the maximum pricing hours. Despite all of the applied constraints, the HEM algorithm was able to maintain the room temperature within the preset temperature range.
The room temperature during normal pricing hours was only subject to manual operation of the AC. However, this was dependent on the occupancy of the room when using the HEM system, with the temperature being allowed to rise above the maximum comfort level when the room was unoccupied. Moreover, the preset temperatures for the minimum and maximum pricing hours were the same as those for the normal hours. Figure 20 shows the energy consumption and bill trends of the AC unit.
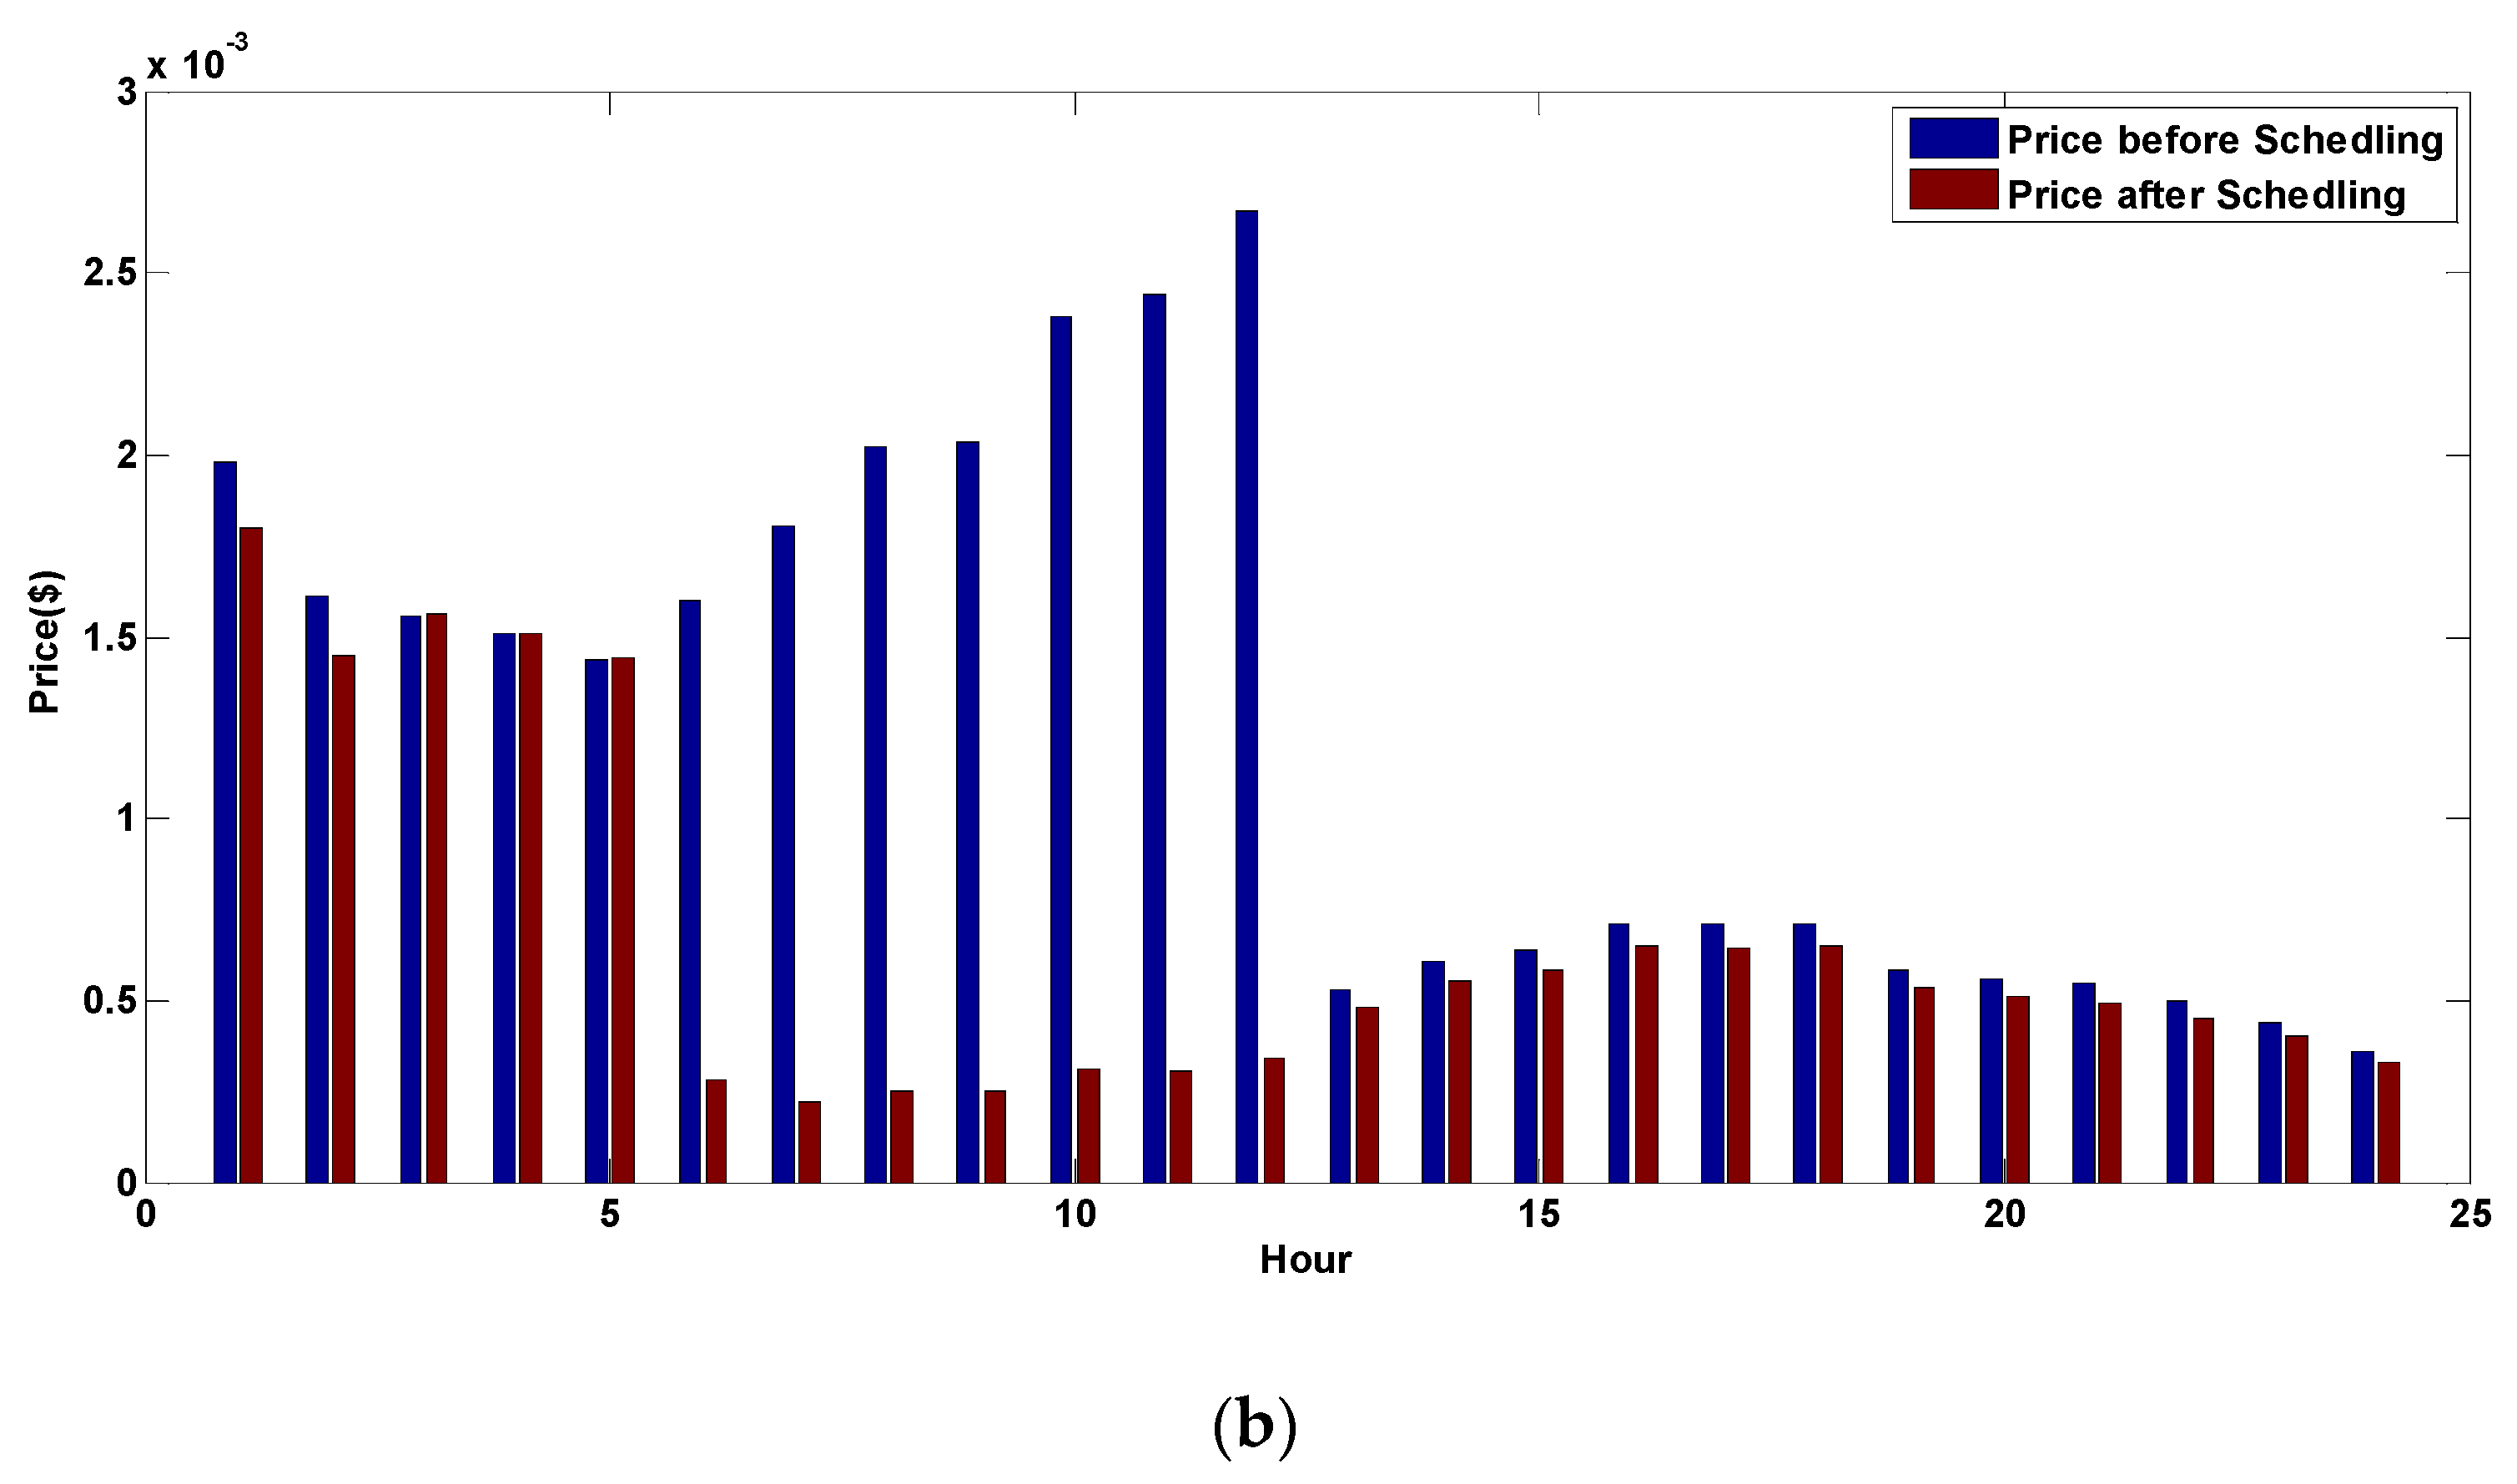
The highest amount of energy was used during the minimum pricing hours, which was because the HEM algorithm maximized the AC use at these times, and reduced it during the maximum pricing hours, as can be observed from Figure 19. Overall, the HEM system significantly reduced the daily energy consumption and bill by 13.9 kWh and $1.64, respectively.
4.3. Refrigerator
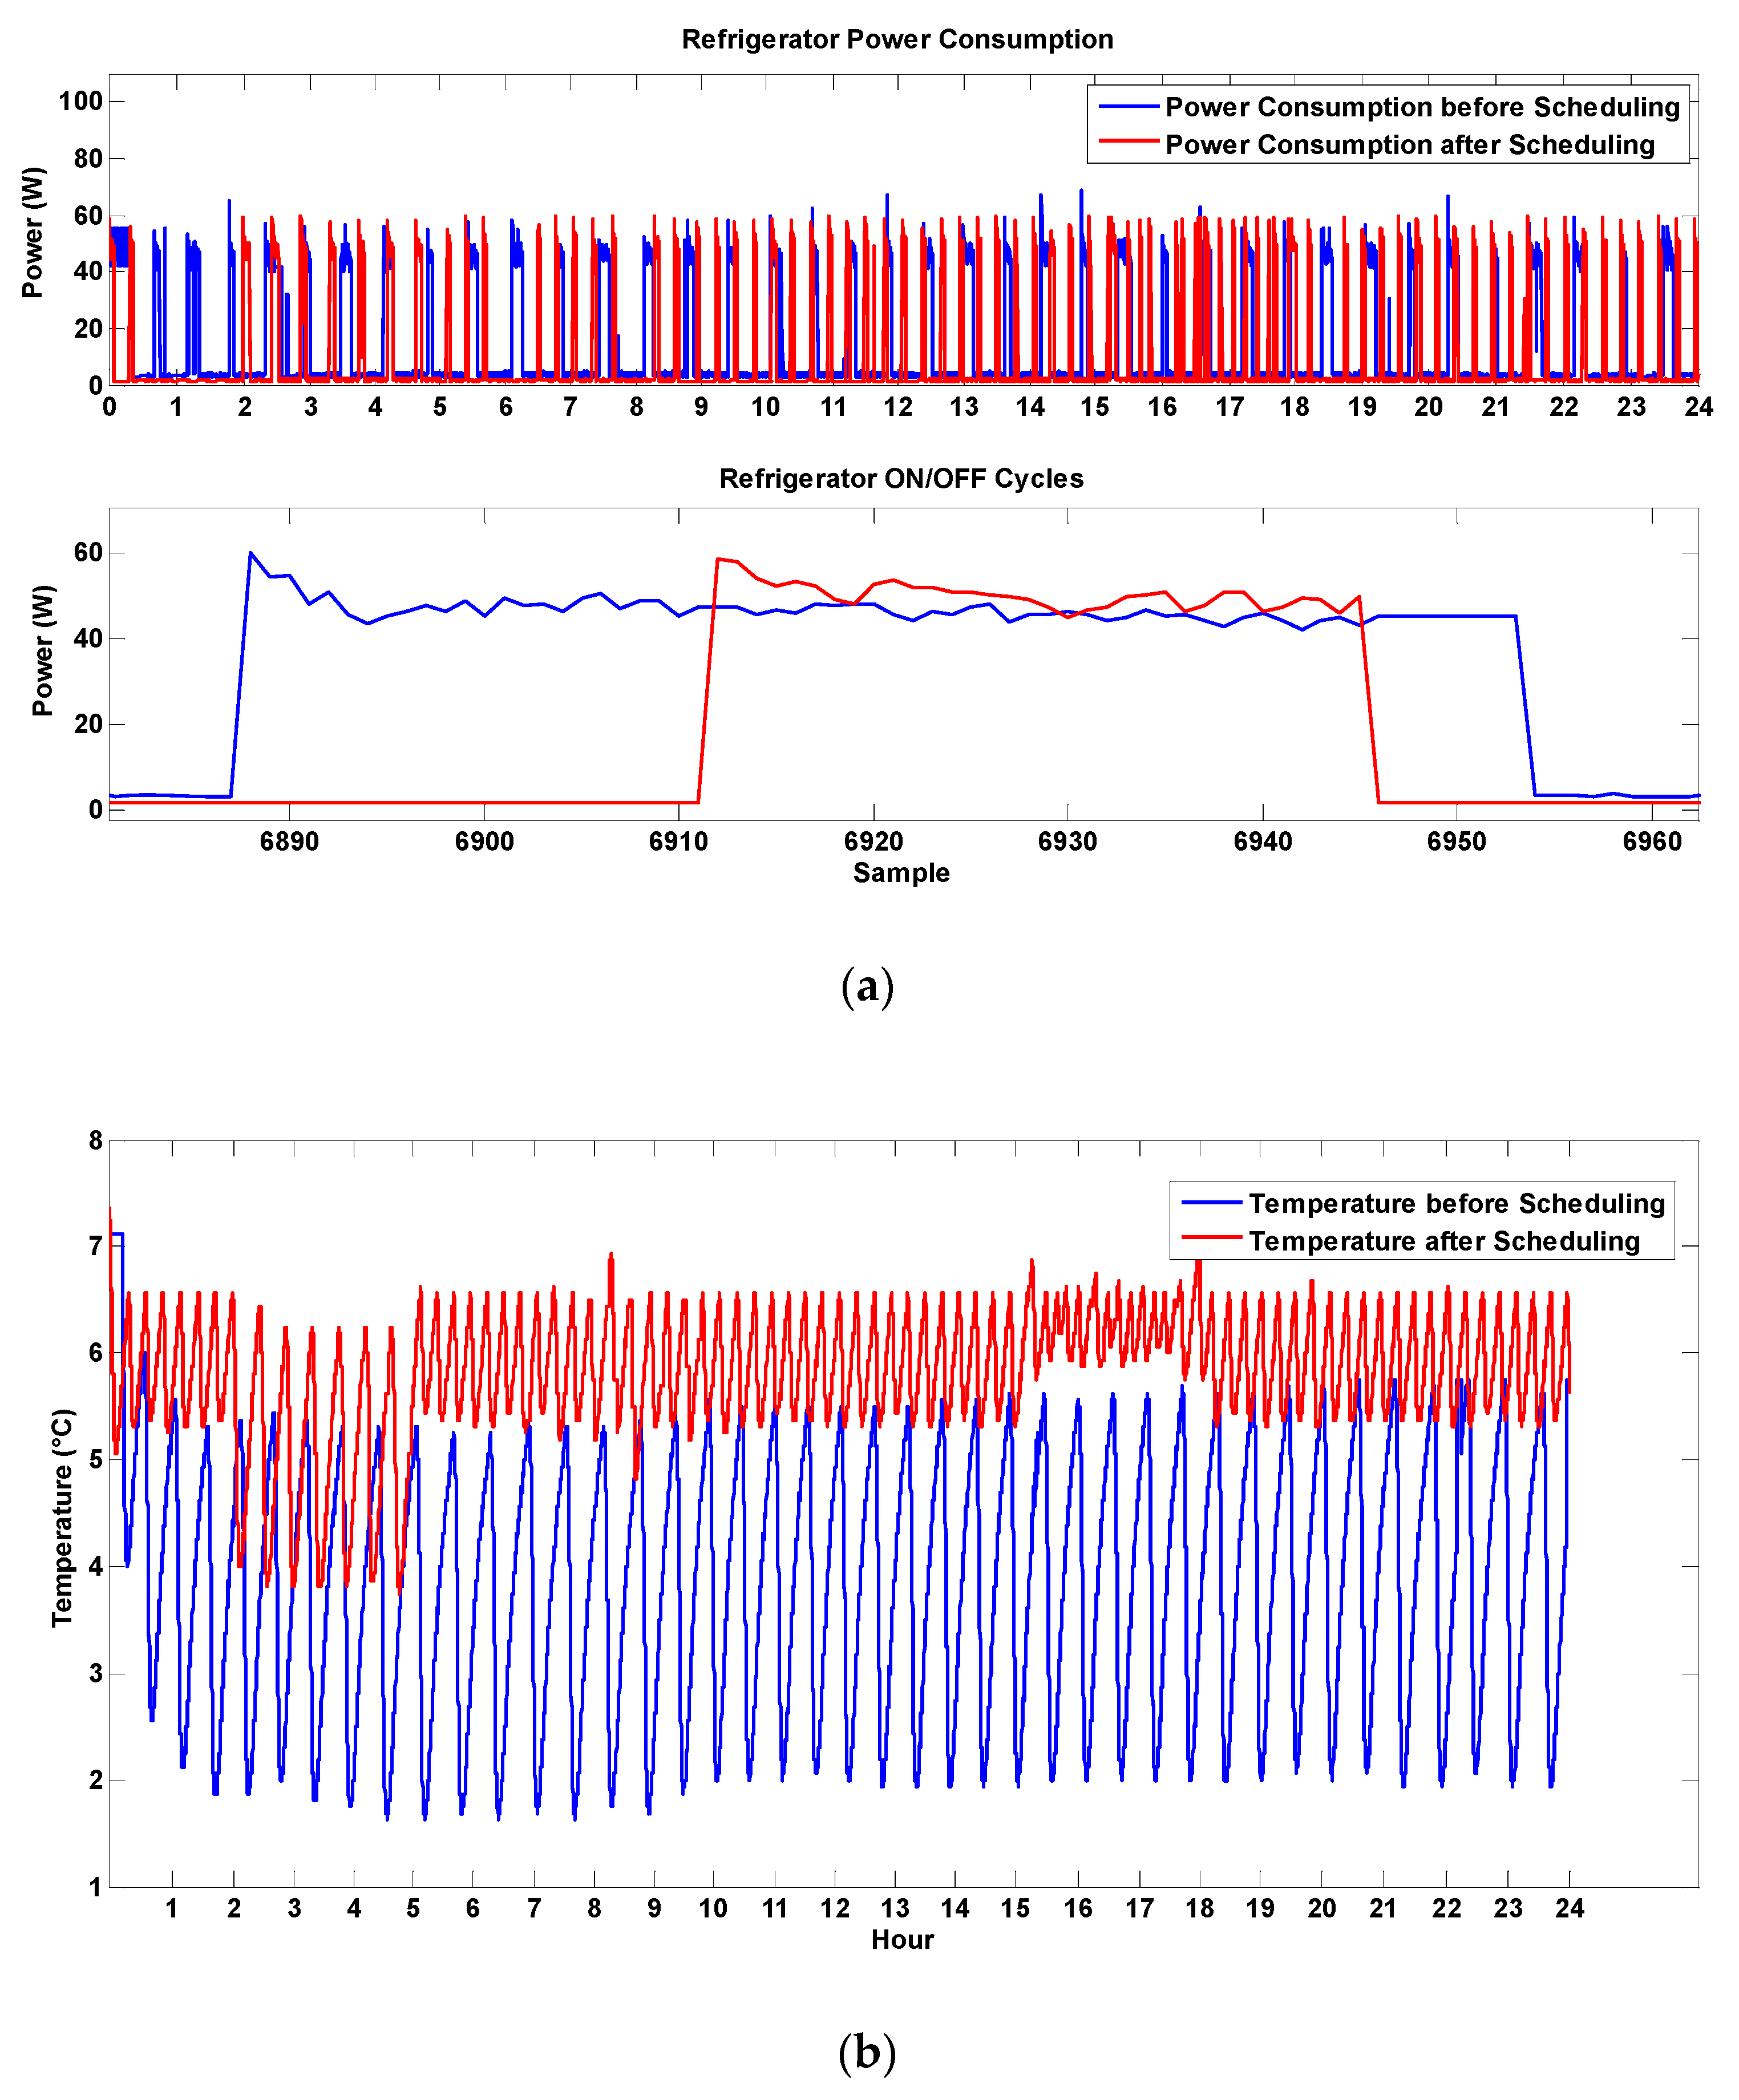
Unlike the two previous home appliances, the use of the refrigerator does not depend on the room occupancy status. Rather, the scheduling of the refrigerator was based on the internal and surrounding temperatures. Figure 21 shows the effect of the HEM system use on the power consumption of the refrigerator and the internal temperature variation of the refrigerator.
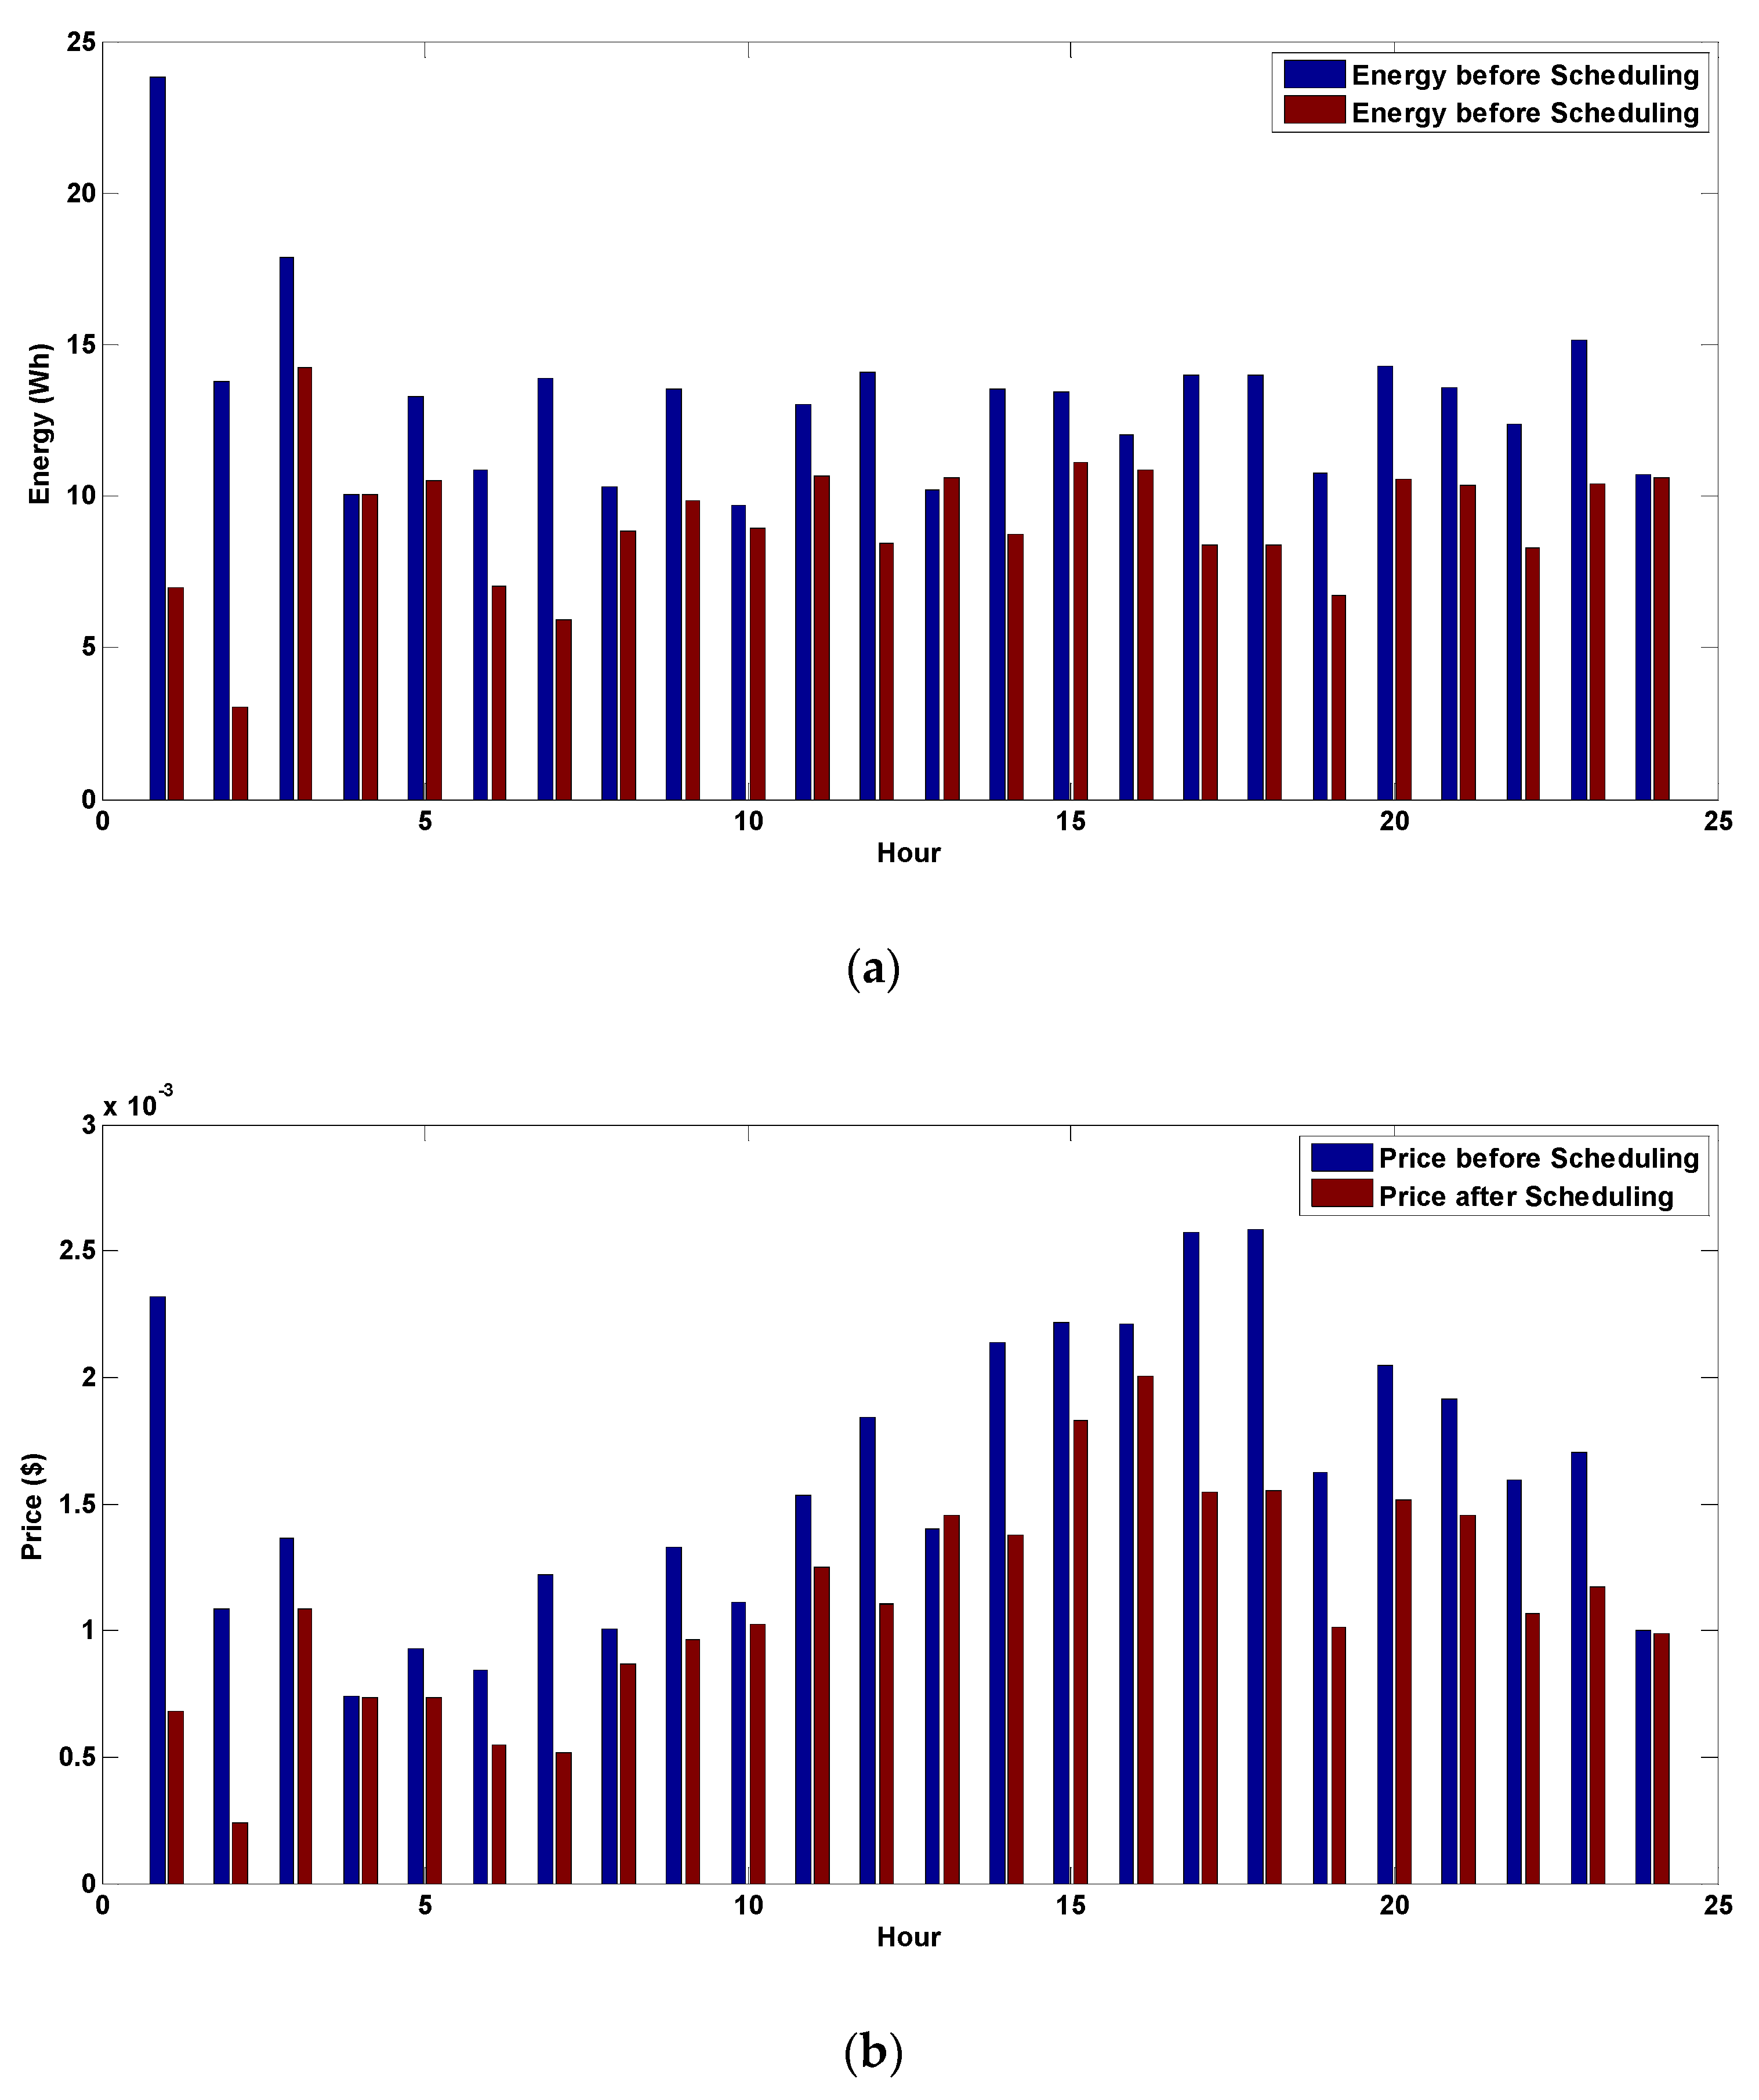
The power consumption of the refrigerator was reduced by decreasing the time during which the refrigerator was switched on. The refrigerator was turned off during normal pricing hours when the lower preset temperature limit was reached, and more often during the maximum pricing time when the internal temperature was within the preset range. This can be clearly observed from the second graph of Figure 20b, where the on cycle while using the HEM system is narrower than that when not using the system during the maximum pricing hours. However, the HEM algorithm effectively managed the internal temperature within the desired range, regardless of the reduced power consumption and on time of the refrigerator. The benefit of the HEM algorithm can be assessed by comparison of the hourly energy consumptions and bills without and with the use of the proposed system, as illustrated in Figure 22.
The system afforded reductions during non-peak pricing hours although the energy consumptions and bills during minimum pricing hours without and with the use of the HEM system are similar. The savings were particularly substantial during maximum pricing hours. Overall, the daily energy and bill savings that were achieved by the system were 0.098 kWh and $0.0116, respectively.
4.4. Water Heater
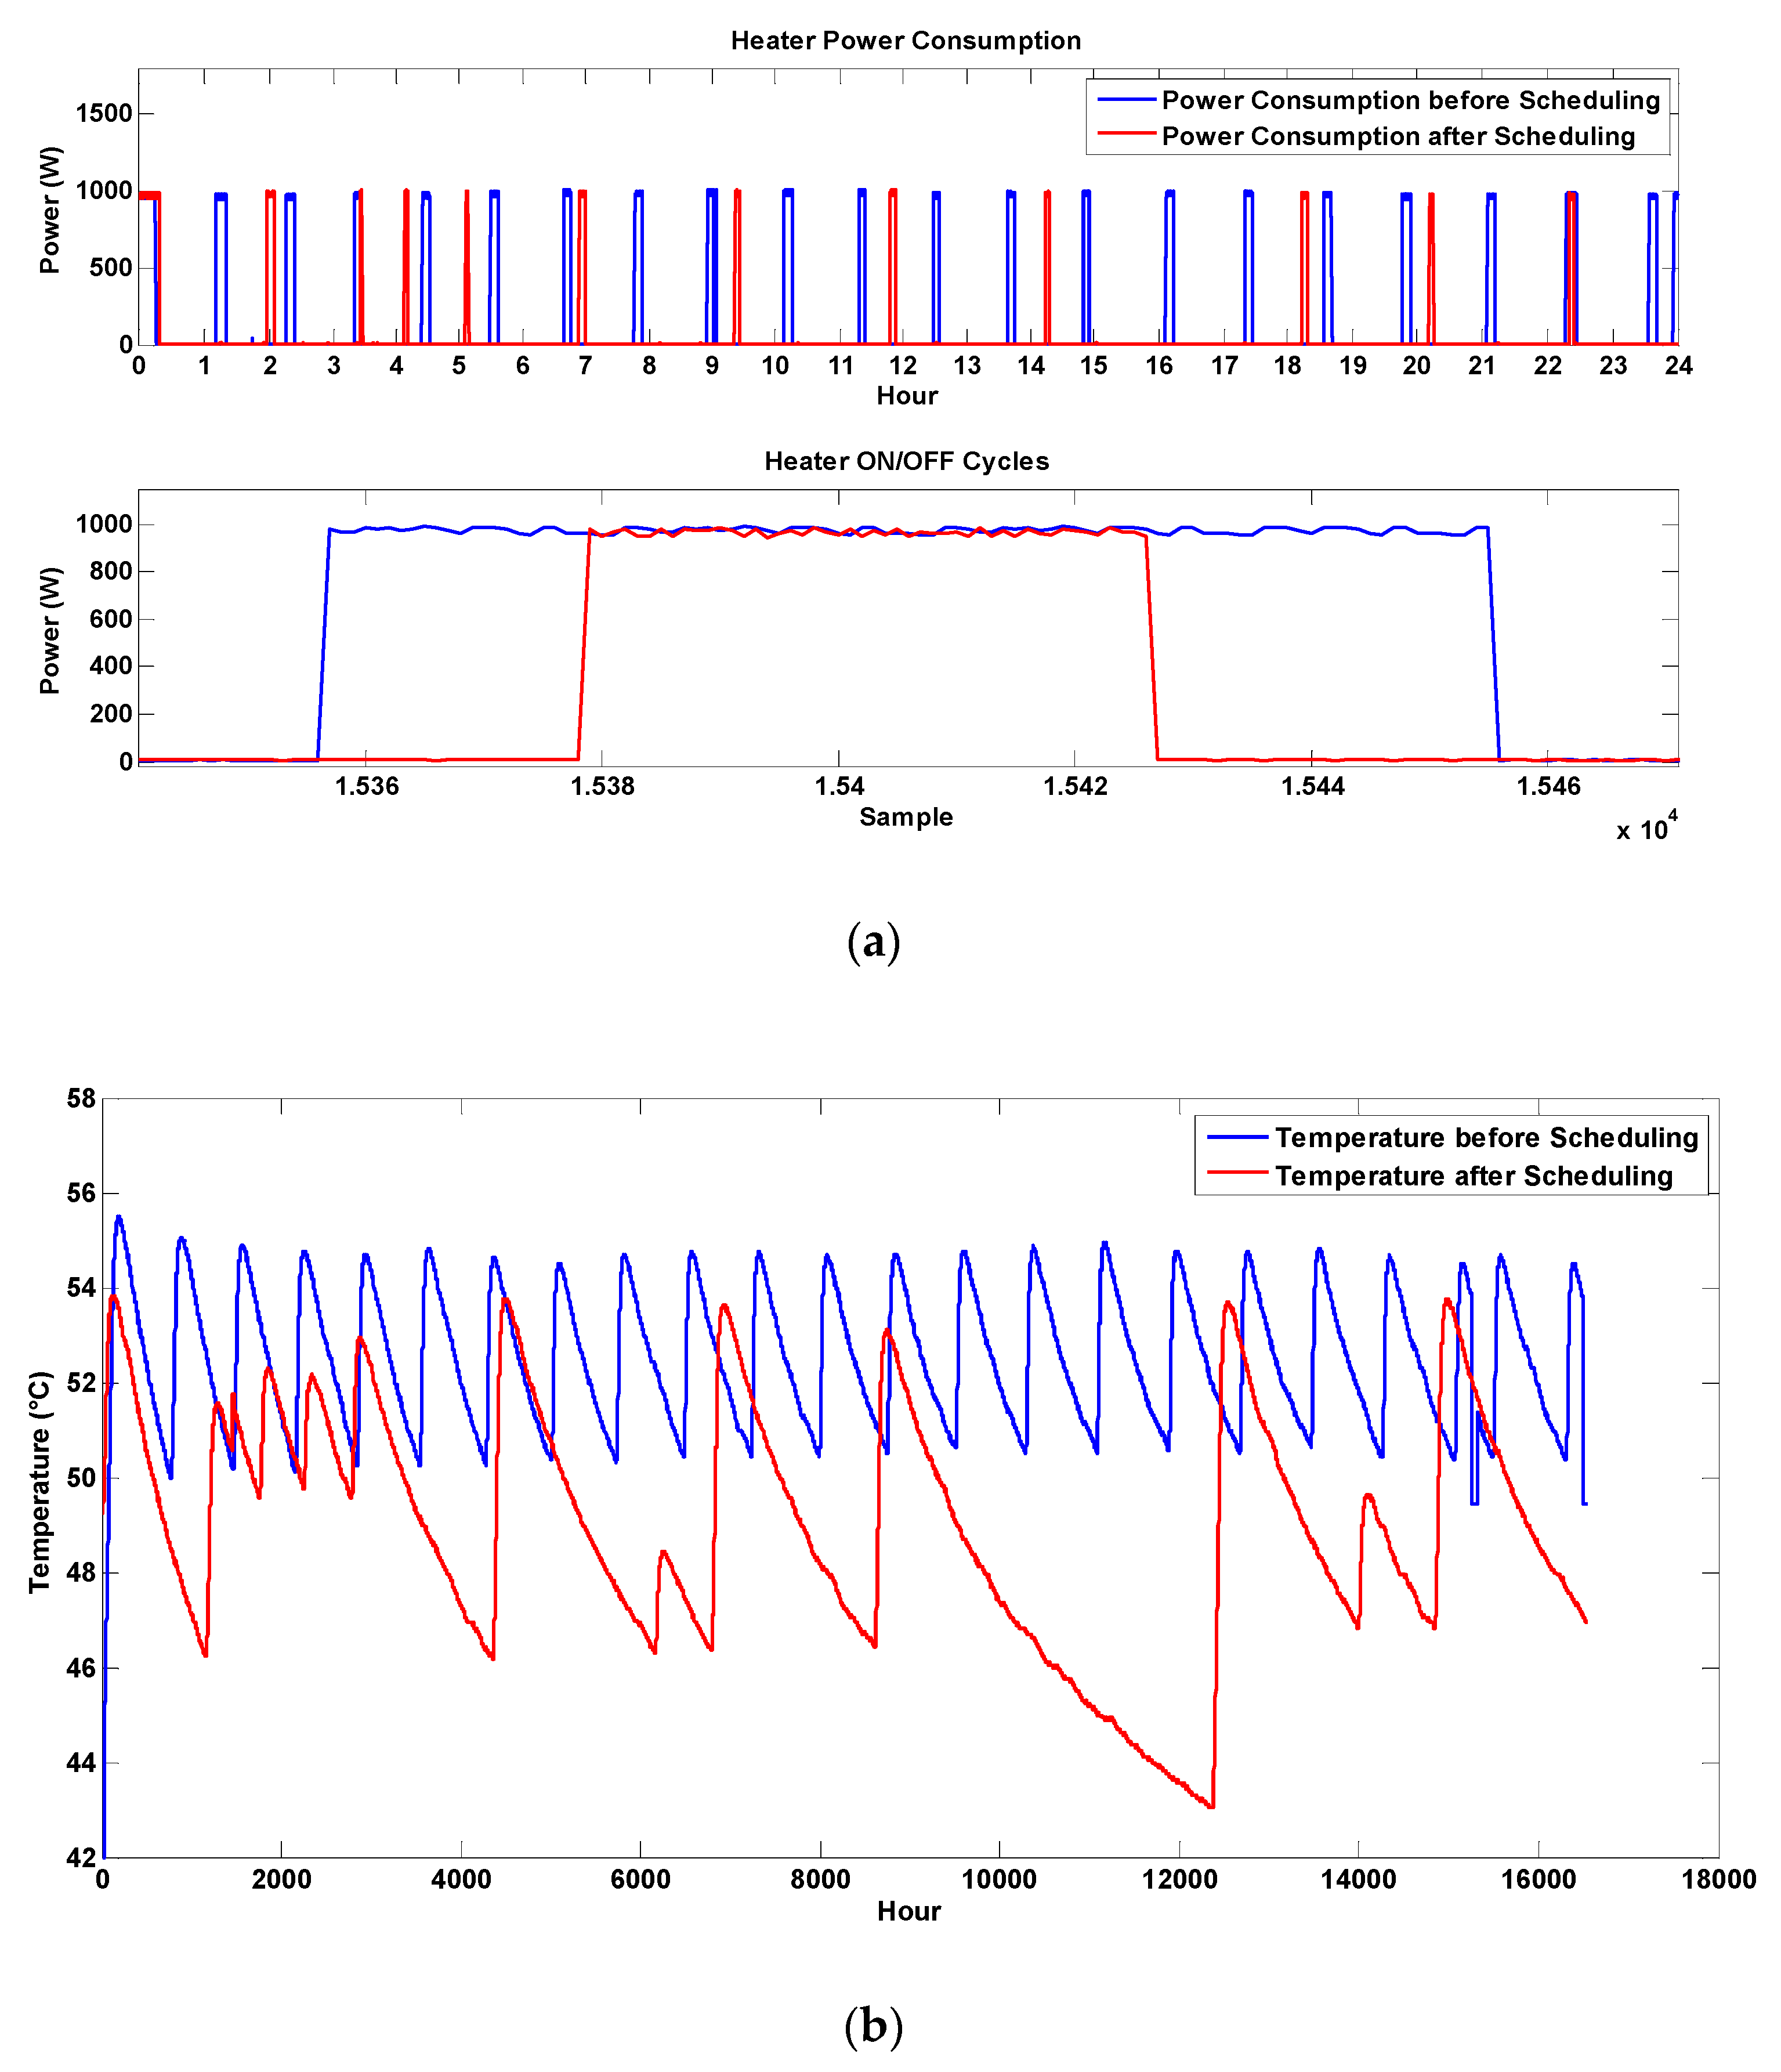
Similar to the case of the refrigerator, the operation of the water heater is not dependent on the occupancy status of the room. However, greater scheduling flexibility was possible with the water heater, because it could better preserve its internal temperature as compared with the refrigerator when considering that a water heater tank is not frequently opened. Figure 23 shows the power consumptions and temperature variations of the heated water without and with the use of the HEM system.
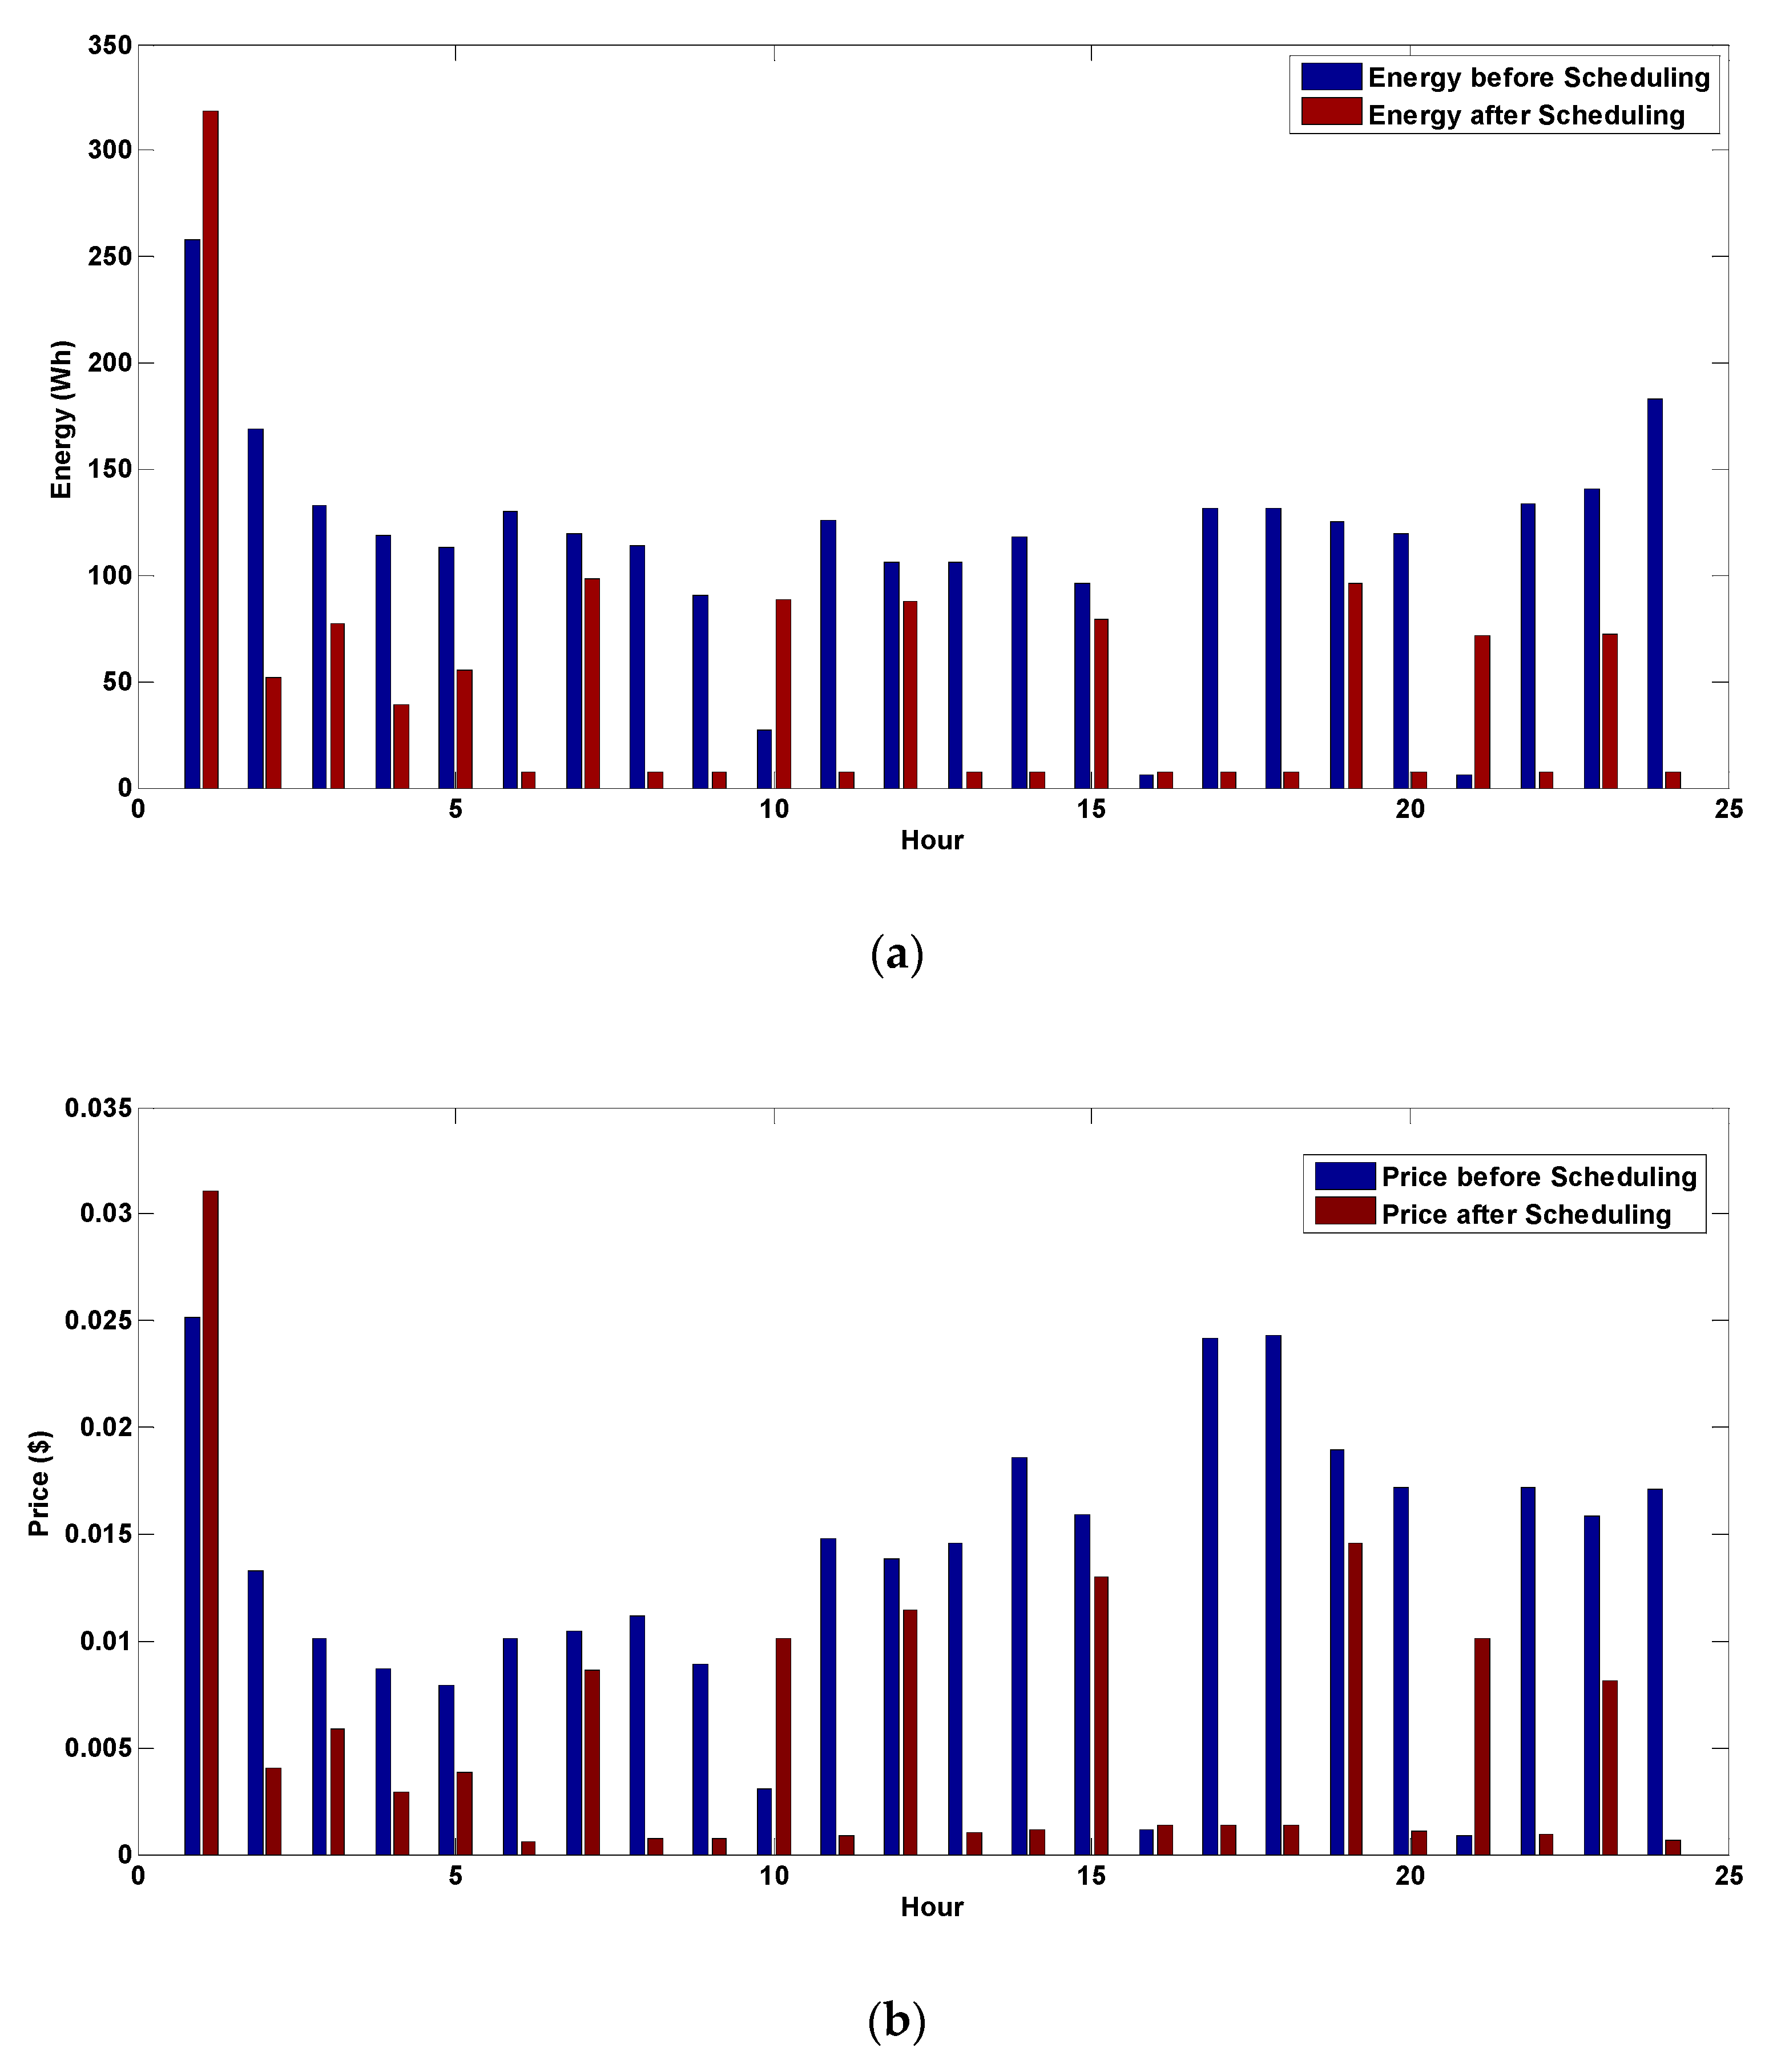
There was considerable decrease in the on cycles of the water heater when using the HEM system, because the heater could be turned off when the temperature reached the middle of the preset range. This reduced the energy consumption while maintaining the water at a comfortable temperature. Figure 24 shows the water heater energy and bill savings achieved by the HEM system.
Daily energy and bill savings of 1.577 kWh and $0.187, respectively, were achieved by applying the HEM system to the water heater, especially during the maximum pricing hours.
4.5. Total Energy Consumption Reduction
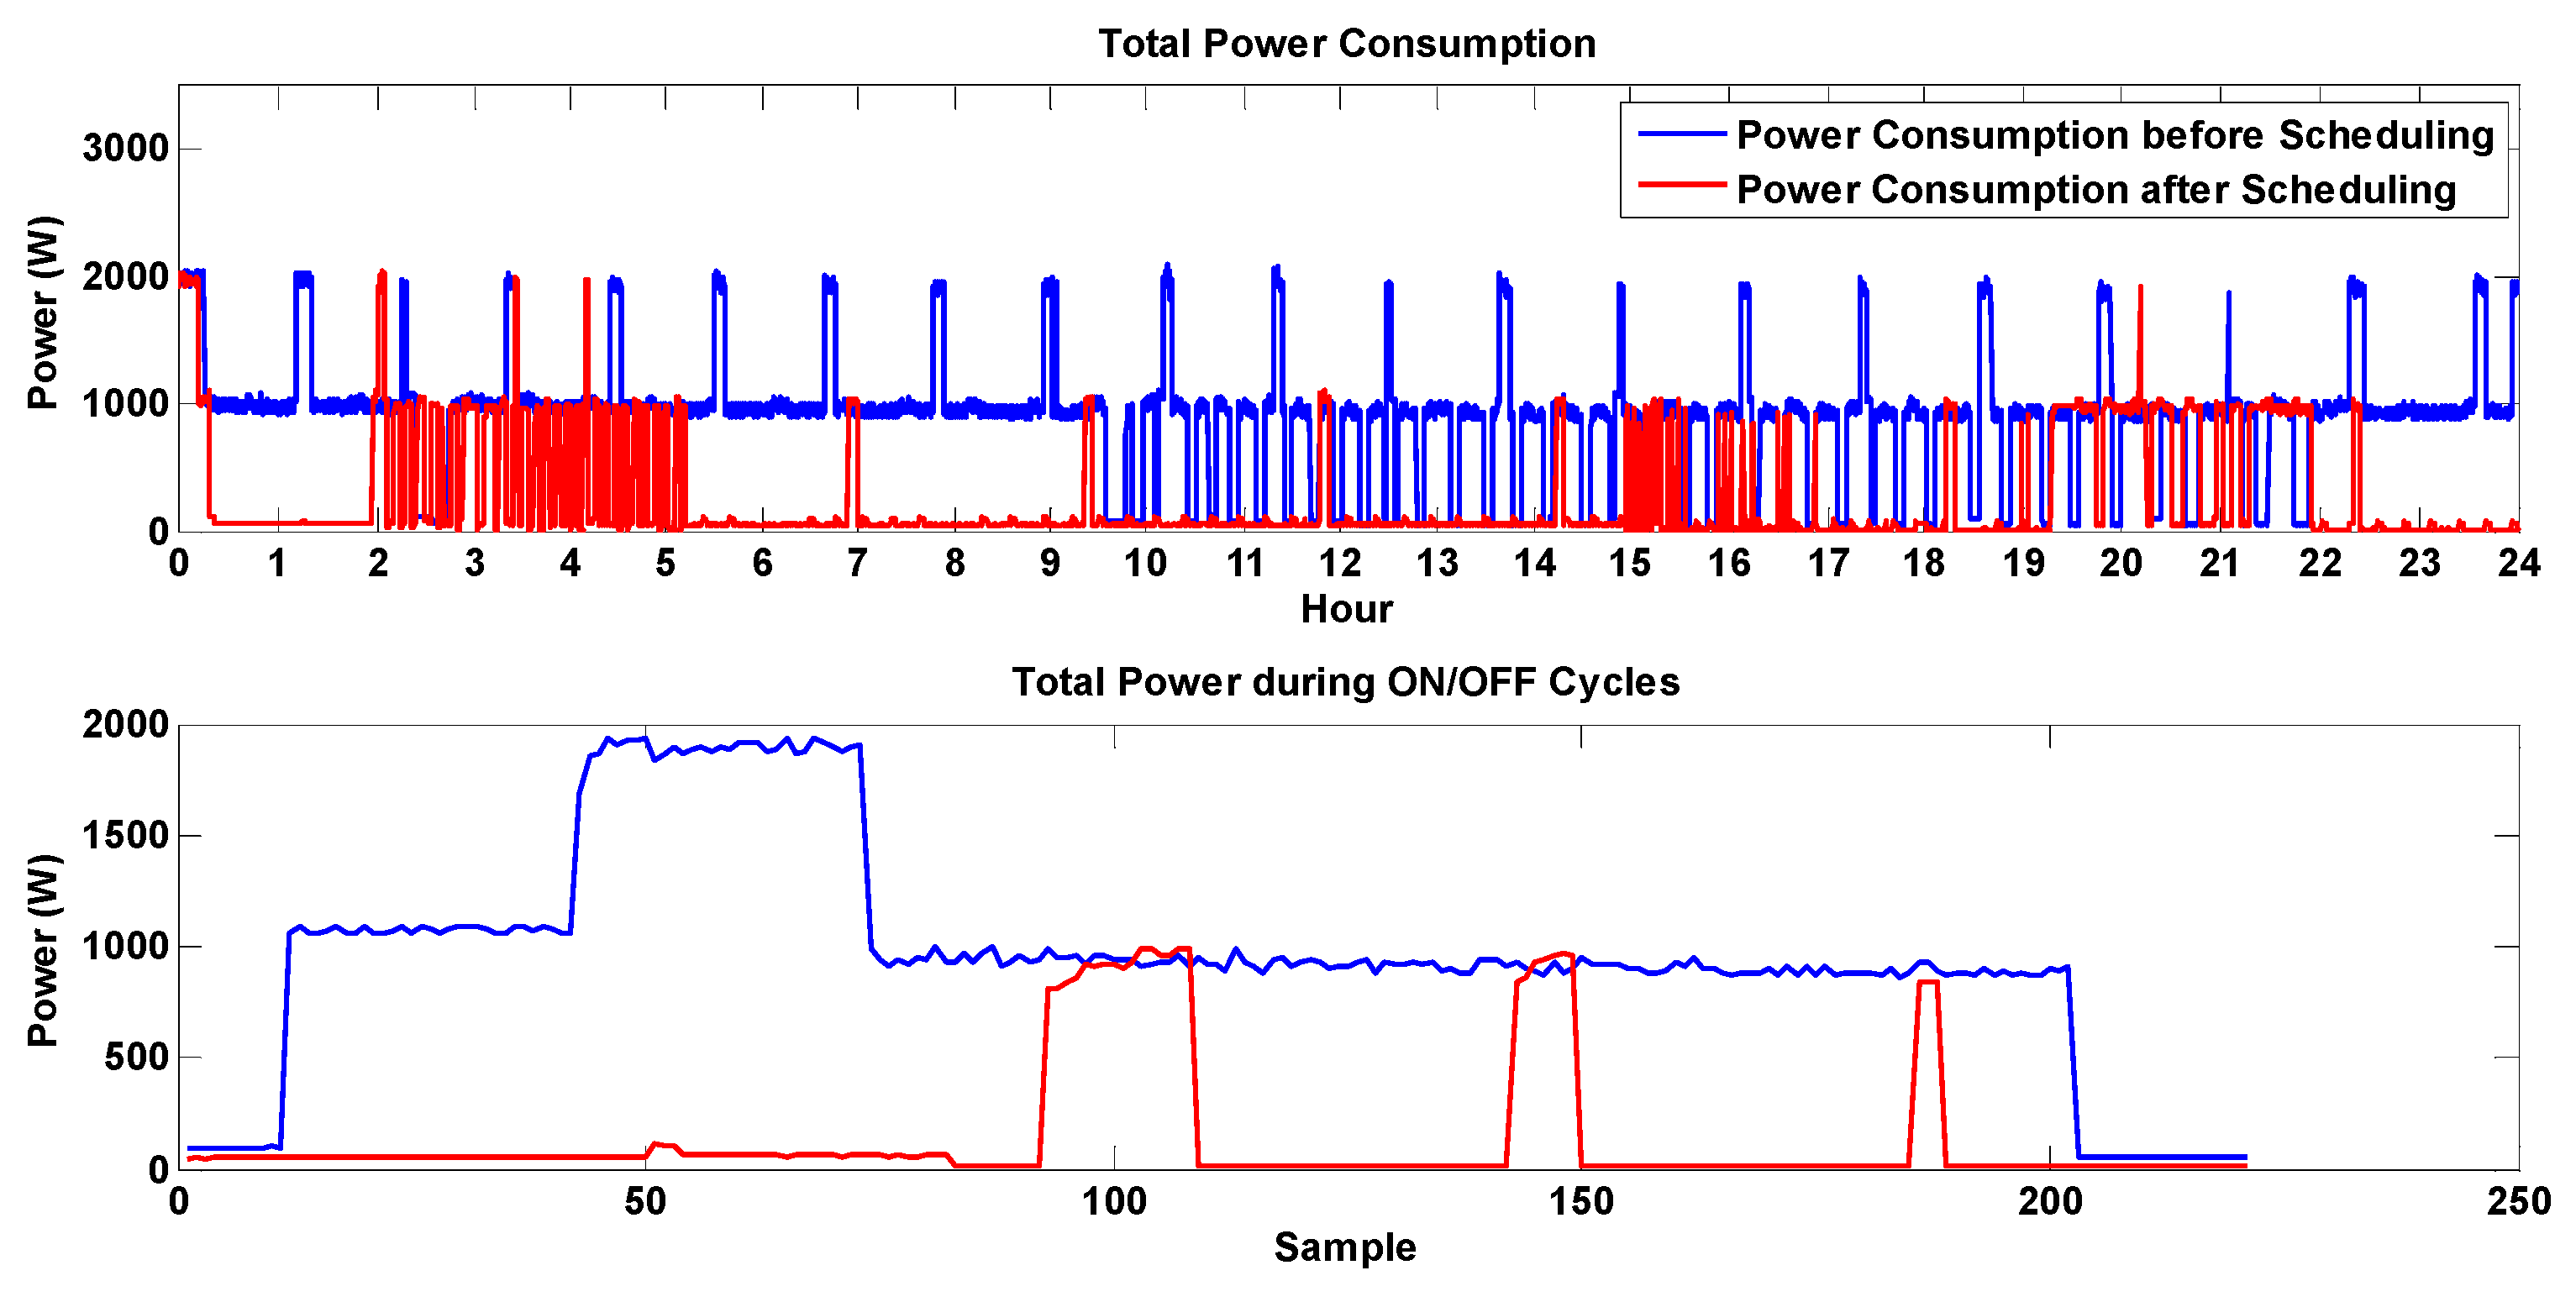
Figure 25 shows the total power consumption trends for all of the appliances without and with the use of the proposed HEM system.
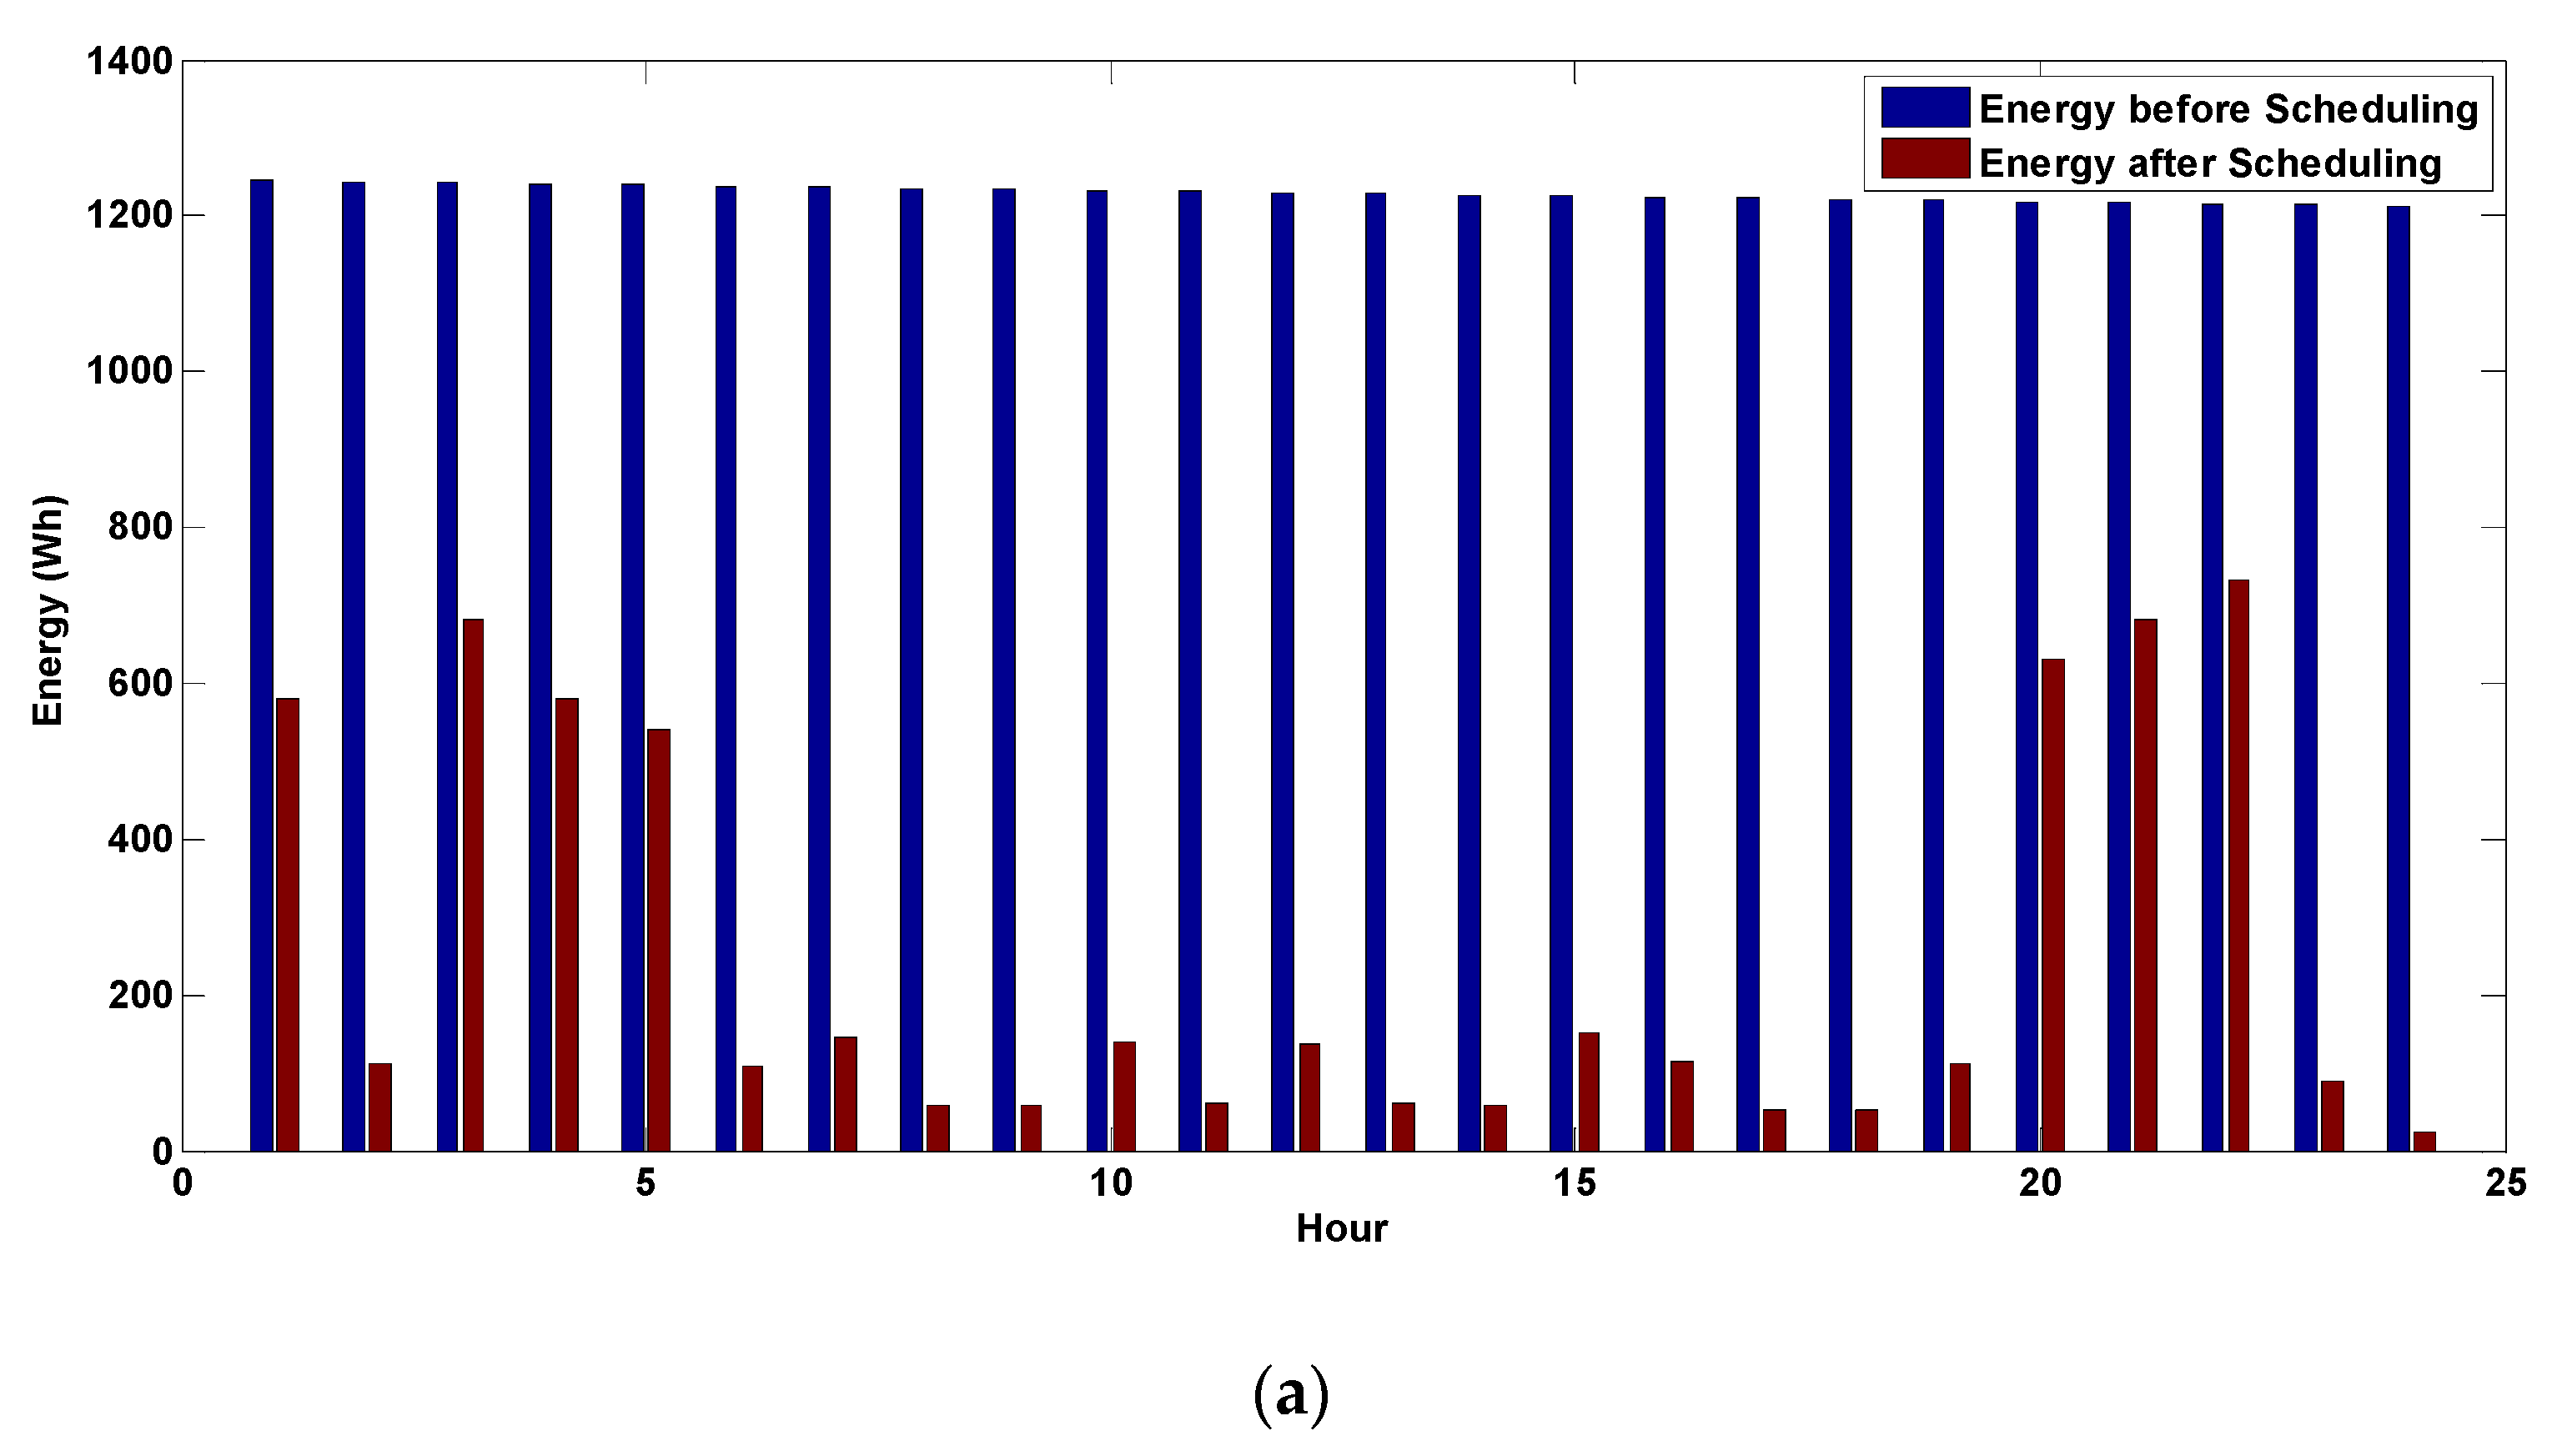
The many peaks in Figure 24 without the use of the HEM system are due to the concurrent use of all the appliances throughout the day. Most of these peaks were eliminated by the application of the HEM system, which also decreased the total on cycle time of the appliances. Ultimately, the use of the HEM system significantly reduced the total energy consumption and bill, as can be observed in Figure 26.
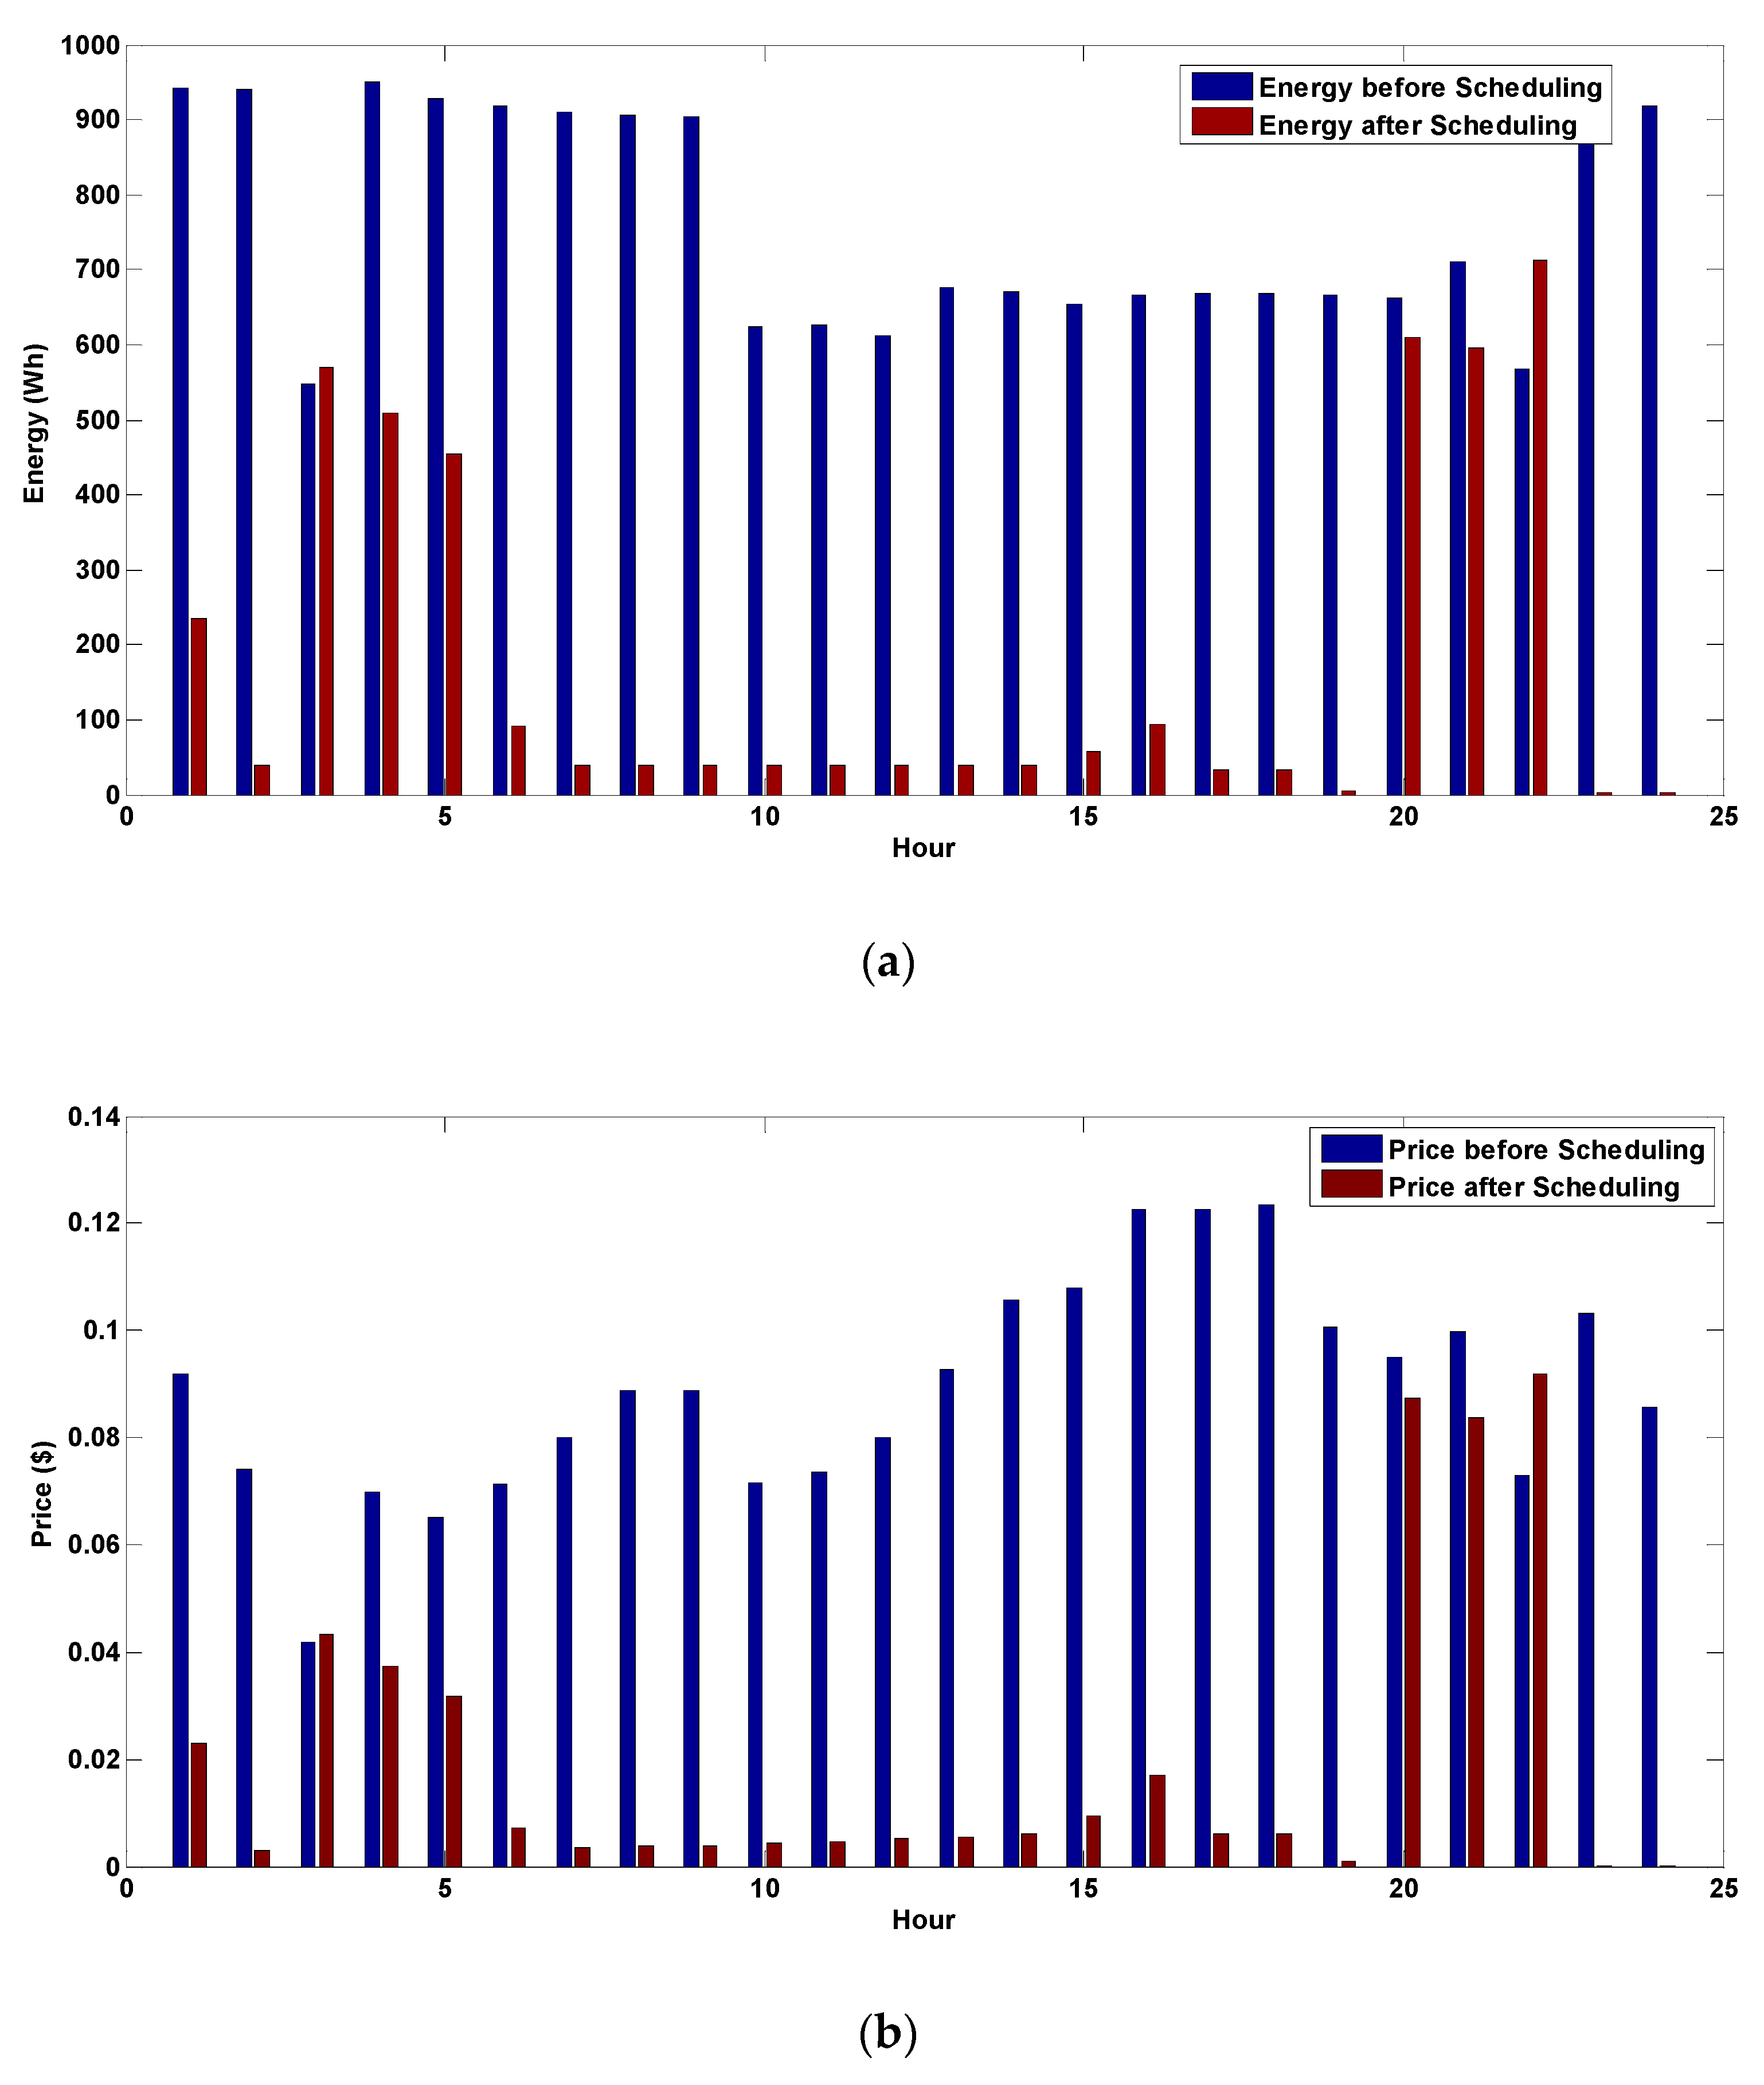
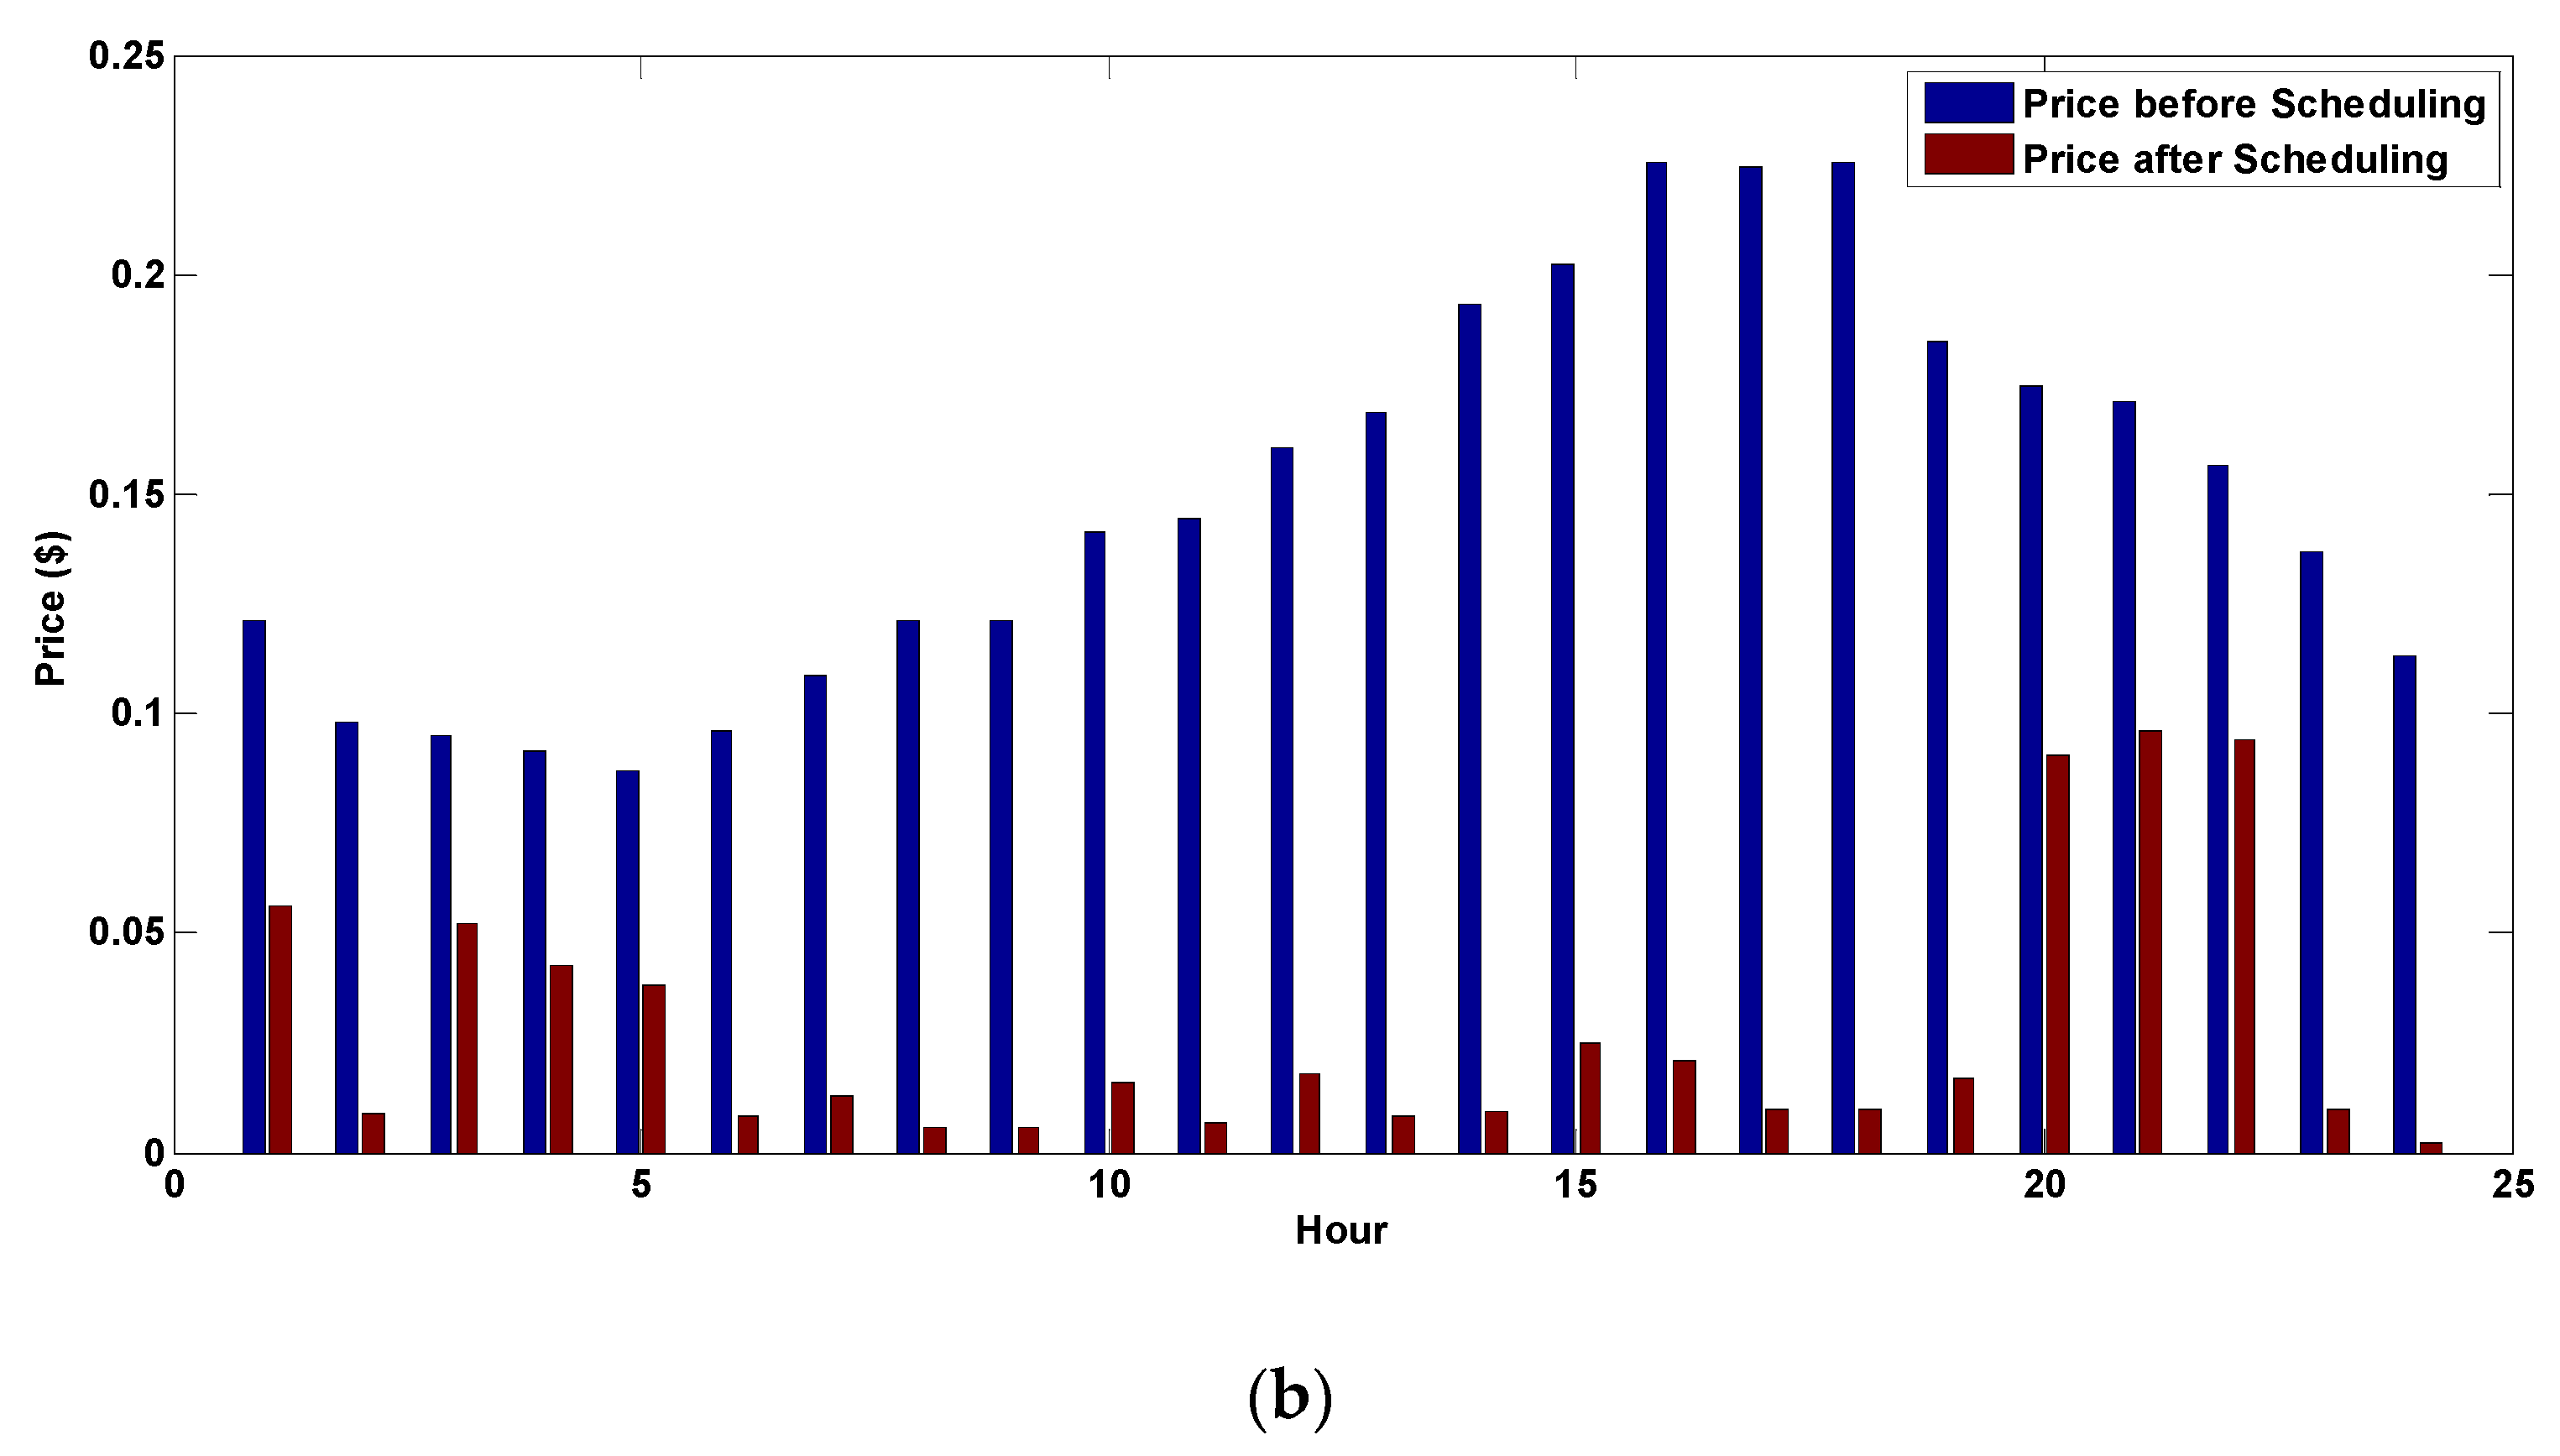
The application of the proposed HEM system alters the previous constant total energy consumption over the day, with the previous maximum consumption only retained during the minimum pricing hours, as can be observed from Figure 26. The proposed system enabled total daily energy and bill savings of 23.5 kWh and $2.898, respectively.
5. Conclusions
This paper presents a smart HEM system that consists of both hardware and software. The system utilizes various instruments for the wireless transmission of energy, temperature, and illuminance information, which the main controller uses to remotely generate and send commands to the actuating circuitries of the hardware. The commands include turn on/off, temperature control, and illuminance adjustment commands. The system software includes an effective rule-based HEM algorithm that receives real-time inputs from the various system circuitries for the control of the appliances in such a way that reduces their power consumption without affecting the lifestyle of the user. The results of the experimental implementation of the proposed system confirmed its control reliability, with reductions of 23.5 kW and $2.898 being achieved in the daily energy consumption and bill, respectively. In the future work, the hardware design could be improved by adding new supporting circuitries or other functionalities, such as detecting the number of persons in the room. Furthermore, adopting fuzzy or heuristic optimization based approaches could enhance the rule based scheduling algorithm. The proposed HEM system promises to be an asset for households with high energy consumptions.
Author Contributions
Conceptualization, H.S. and E.A.-H.; Methodology, H.S., E.H.; Software, E.A.-H.; Validation, H.S., E.A.-H. and R.S.; Formal analysis, H.S., E.A.-H. and R.S.; Resources, H.S.; Writing—Original draft preparation, E.A.-H., H.S.; Writing—Review and editing, R.S.; Visualization, H.S., E.A.-H. and R.S.; Supervision, H.S.; Project administration, H.S.; Funding acquisition, H.S. and R.S. All authors have read and agreed to the published version of the manuscript.
Funding
The research was funded by the United Arab Emirates University vide fund code 31N259-UPAR (2) 2016.
Conflicts of Interest
The authors declare no conflict of interest.
Appendix A

References
- Yaghmaee, M.H.; Moghaddassian, M.; Leon-Garcia, A. Autonomous two-tier cloud-based demand side management approach with microgrid. IEEE Trans. Ind. Inform. 2017, 13, 1109–1120. [Google Scholar] [CrossRef]
- Chavali, P.; Yang, P.; Nehorai, A. A distributed algorithm of appliance scheduling for home energy management system. IEEE Trans. Smart Grid 2014, 5, 282–290. [Google Scholar] [CrossRef]
- Moon, J.W.; Kim, J. ANN-based thermal control models for residential buildings. Build. Environ. 2010, 45, 1612–1625. [Google Scholar] [CrossRef]
- Cui, B.; Fan, C.; Munk, J.; Mao, N.; Xiao, F.; Dong, J.; Kuruganti, T. A hybrid building thermal modeling approach for predicting temperatures in typical, detached, two-story houses. Appl. Energy 2019, 236, 101–116. [Google Scholar] [CrossRef]
- Zhang, D.; Li, S.; Sun, M.; O’Neill, Z. An optimal and learning-based demand response and home energy management system. IEEE Trans. Smart Grid 2016, 7, 1790–1801. [Google Scholar] [CrossRef]
- Althaher, S.; Mancarella, P.; Mutale, J. Automated demand response from home energy management system under dynamic pricing and power and comfort constraints. IEEE Trans. Smart Grid 2015, 6, 1874–1883. [Google Scholar] [CrossRef]
- Agamah, S.U.; Ekonomou, L. A Heuristic combinatorial optimization algorithm for load-leveling and peak demand reduction using energy storage systems. Electr. Power Compon. Syst. 2017, 45, 2093–2103. [Google Scholar] [CrossRef]
- Adika, C.O.; Wang, L. Autonomous appliance scheduling for household energy management. IEEE Trans. Smart Grid 2014, 5, 673–682. [Google Scholar] [CrossRef]
- Arun, S.L.; Selvan, M.P. Intelligent residential energy management system for dynamic demand response in smart buildings. IEEE Syst. J. 2018, 12, 1329–1340. [Google Scholar] [CrossRef]
- Tsui, K.M.; Chan, S.C. Demand response optimization for smart home scheduling under real-time pricing. IEEE Trans. Smart Grid 2012, 3, 1812–1821. [Google Scholar] [CrossRef]
- Shirazi, E.; Jadid, S. Optimal residential appliance scheduling under dynamic pricing scheme via HEMDAS. Energy Build. 2015, 93, 40–49. [Google Scholar] [CrossRef]
- Anvari-Moghaddam, A.; Monsef, H.; Rahimi-Kian, A. Optimal smart home energy management considering energy saving and a comfortable lifestyle. IEEE Trans. Smart Grid 2015, 6, 324–332. [Google Scholar] [CrossRef]
- Wen, Z.; O’Neill, D.; Maei, H. Optimal demand response using device-based reinforcement learning. IEEE Trans. Smart Grid 2015, 6, 2312–2324. [Google Scholar] [CrossRef] [Green Version]
- Shareef, H.; Ahmed, M.S.; Mohamed, A.; Al Hassan, E. Review on home energy management system considering demand responses, smart technologies, and intelligent controllers. IEEE Access 2018, 6, 24498–24509. [Google Scholar] [CrossRef]
- Li, W.; Yuen, C.; Hassan, N.U.; Tushar, W.; Wen, C.; Wood, K.L.; Hu, K.; Liu, X. Demand response management for residential smart grid: From theory to practice. IEEE Access 2015, 3, 2431–2440. [Google Scholar] [CrossRef]
- Al-Hassan, E.; Shareef, H.; Islam, M.M.; Wahyudie, A.; Abdrabou, A.A. Improved smart power socket for monitoring and controlling electrical home appliances. IEEE Access 2018, 5, 49292–49305. [Google Scholar] [CrossRef]
- Ahmed, M.S.; Mohamed, A.; Khatib, T.; Shareef, H.; Homod, R.Z.; Abd Ali, J. Real time optimal schedule controller for home energy management system using new binary backtracking search algorithm. Energy Build. 2017, 138, 215–277. [Google Scholar] [CrossRef]
- Paterakis, N.G.; Erdinc, O.; Bakirtzis, A.G.; Catalao, J.P.S. Optimal household appliances scheduling under day-ahead pricing and load-shaping demand response strategies. IEEE Trans. Ind. Inform. 2015, 11, 1509–1519. [Google Scholar] [CrossRef]
- Han, J.; Choi, C.; Park, W.; Lee, I.; Kim, S. Smart home energy management system including renewable energy based on ZigBee and PLC. IEEE Trans. Consum. Electron. 2014, 60, 198–202. [Google Scholar] [CrossRef]
- GE Brillion™ Connected Appliances. General Electric. Available online: http://www.geappliances.com/ge/connected-appliances/ (accessed on 20 January 2020).
- Honda Smart Home US. Honda. Available online: http://www.hondasmarthome.com/tagged/hems (accessed on 20 January 2020).
- Sumsung Smart Home Support. Sumsung. Available online: https://www.samsung.com/us/support/smart-home/ (accessed on 18 January 2020).
- Fibaro Smart Home. Fibaro. Available online: https://www.fibaro.com/en/ (accessed on 20 January 2020).
- Open Access Same-Time Information System. New York Independent System Operator. Available online: http://mis.nyiso.com/public/P-7Alist.htm (accessed on 2 January 2020).
- DFRobot. Available online: https://wiki.dfrobot.com/CO2_Sensor_SKU_SEN0159 (accessed on 2 January 2020).
- Martin Almenta, M.; Morrow, D.J.; Best, R.J.; Fox, B.; Foley, A.M. Domestic fridge-freezer load aggregation to support ancillary services. Renew. Energy 2016, 87, 954–964. [Google Scholar] [CrossRef] [Green Version]
- GMP Online Training. Available online: https://www.gmp-compliance.org/gmp-news/ambient-room-temperature-cold-what-is-what (accessed on 25 April 2020).
- Rea, M. The IESNA Lighting Handbook: Reference & Application, 9th ed.; Illuminating Engineering Society of North America: New York, NY, USA, 2000. [Google Scholar]
- Nistor, M.; Antunes, C.H. Integrated Management of Energy Resources in Residential Buildings—A Markovian Approach. IEEE Trans. Smart Grid 2018, 9, 240–251. [Google Scholar] [CrossRef]
Figure 1.
System configuration.

Figure 2.
Graphical user interface of the proposed energy management system.

Figure 3.
Smart plug/socket: components and prototype.

Figure 4.
Zigbee-connected infra-red (IR) learner remote control.

Figure 5.
Operation of the IR remote control.

Figure 6.
LED light dimming circuit: (a) Schematic and (b) Circuit connections.

Figure 7.
Room condition monitoring circuit.

Figure 8.
Experimental setup of the water heater.

Figure 9.
Experimental setup of the refrigerator.

Figure 10.
Experimental setup of the air conditioner (AC).

Figure 11.
Experimental setup of the LED light.

Figure 12.
Room vacancy identification process.

Figure 13.
CO2 sensor reading with respect to room occupancy status over 24 h.

Figure 14.
Results of survey questions related to thresholds.

Figure 15.
Complete flowchart of the energy management algorithm.


Figure 16.
Electricity pricing signals during the use of the home energy management (HEM) system.

Figure 17.
(a) Power consumptions of the LED light, room occupancy status and (b) illuminance variations without and with the use of the HEM system.
Figure 17.
(a) Power consumptions of the LED light, room occupancy status and (b) illuminance variations without and with the use of the HEM system.


Figure 18.
(a) Energy consumptions and (b) bills incurred by the LED light without and with the use of the HEM system.
Figure 18.
(a) Energy consumptions and (b) bills incurred by the LED light without and with the use of the HEM system.


Figure 19.
(a) Power consumptions of the AC, room occupancy statuses, on/off cycles of the AC and (b) room temperature variations without and with the use of the HEM system.
Figure 19.
(a) Power consumptions of the AC, room occupancy statuses, on/off cycles of the AC and (b) room temperature variations without and with the use of the HEM system.


Figure 20.
(a) Energy consumptions and (b) bills incurred by the AC unit without and with the use of the HEM system.
Figure 20.
(a) Energy consumptions and (b) bills incurred by the AC unit without and with the use of the HEM system.

Figure 21.
(a) Power consumptions and (b) internal temperatures of the refrigerator without and with the use of the HEM system.
Figure 21.
(a) Power consumptions and (b) internal temperatures of the refrigerator without and with the use of the HEM system.

Figure 22.
(a) Energy consumptions and (b) bills incurred by the refrigerator without and with the use of the HEM system.
Figure 22.
(a) Energy consumptions and (b) bills incurred by the refrigerator without and with the use of the HEM system.

Figure 23.
(a) Power consumptions and (b) heated water temperatures without and with the use of the HEM system.
Figure 23.
(a) Power consumptions and (b) heated water temperatures without and with the use of the HEM system.

Figure 24.
(a) Energy consumptions and (b) bills incurred by the water heater without and with the use of the HEM system.
Figure 24.
(a) Energy consumptions and (b) bills incurred by the water heater without and with the use of the HEM system.

Figure 25.
Total power consumptions of all the appliances without and with the use of the HEM system.
Figure 25.
Total power consumptions of all the appliances without and with the use of the HEM system.

Figure 26.
Total (a) energy consumptions and (b) bills without and with the use of the HEM system.


Table 1.
Appliance details and specifications.
| Appliance | Model | Power Rating (W) |
|---|---|---|
| Refrigerator | Super General 035H | 90 |
| Air conditioner | NIKAI NPAC12512A4 | 1200 |
| Water heater | Florence FWH-50-15A | 1500 |
| LED | V-tac-22w | 22 |
Table 2.
Household appliance user preference survey.
| Question | Choice 1 | Choice 2 | Choice 3 |
|---|---|---|---|
| How would you describe your preferred room temperature? | Warm | Cool | Very cold |
| (25–30 °C) | (20–25 °C) | (17–20 °C) | |
| 7 users | 28 users | 15 users | |
| How would you prefer your groceries meals and drinks refrigerated? | Fresh | Cool | Very cold |
| (5–7 °C) | (3–5 °C) | (1–3 °C) | |
| 38 users | 9 users | 3 users | |
| How would you describe your favorite water temperature for bathing? | Cool | Warm | Hot |
| (25–35 °C) | (35–40 °C) | (>40 °C) | |
| 6 users | 36 users | 8 users | |
| What light brightness would you prefer in your living room? | Dark | Bright | Very Bright |
| (<200 lux) | (200–350 lux) | (>350 lux) | |
| 3 users | 29 users | 18 users |
Table 3.
User comfort limits.
| Parameter | Minimum Value | Maximum Value |
|---|---|---|
| Refrigerator temperature (°C) | 5 | 7 |
| Room temperature (°C) | 20 | 25 |
| Illuminance (lux) | 200 | 400 |
| Water temperature (°C) | 38 | 42 |
© 2020 by the authors. Licensee MDPI, Basel, Switzerland. This article is an open access article distributed under the terms and conditions of the Creative Commons Attribution (CC BY) license (http://creativecommons.org/licenses/by/4.0/).
Share and Cite
MDPI and ACS Style
Shareef, H.; Al-Hassan, E.; Sirjani, R. Wireless Home Energy Management System with Smart Rule-Based Controller. Appl. Sci. 2020, 10, 4533. https://0-doi-org.brum.beds.ac.uk/10.3390/app10134533
AMA Style
Shareef H, Al-Hassan E, Sirjani R. Wireless Home Energy Management System with Smart Rule-Based Controller. Applied Sciences. 2020; 10(13):4533. https://0-doi-org.brum.beds.ac.uk/10.3390/app10134533
Chicago/Turabian StyleShareef, Hussain, Eslam Al-Hassan, and Reza Sirjani. 2020. "Wireless Home Energy Management System with Smart Rule-Based Controller" Applied Sciences 10, no. 13: 4533. https://0-doi-org.brum.beds.ac.uk/10.3390/app10134533
Note that from the first issue of 2016, this journal uses article numbers instead of page numbers. See further details here.