Impact of Polycyclic Aromatic Hydrocarbons (PAHs) from an Asphalt Mix Plant in a Suburban Residential Area


1
Department of Environmental Engineering, Mokpo National University, Muan 58554, Korea
2
Department of Atmospheric & Environmental Sciences, Gangneung-Wonju National University, Gangneung 25457, Korea
3
Innovative Meteorological Research Department, National Institute of Meteorological Sciences, Jeju 63568, Korea
*
Author to whom correspondence should be addressed.
Appl. Sci. 2020, 10(13), 4632; https://0-doi-org.brum.beds.ac.uk/10.3390/app10134632
Submission received: 25 May 2020
/
Revised: 30 June 2020
/
Accepted: 30 June 2020
/
Published: 4 July 2020
(This article belongs to the Special Issue Air Pollution II)
Abstract
:Polycyclic aromatic hydrocarbons (PAHs), an important class of hazardous airborne pollutants, are mutagenic and carcinogenic substances known to be released during the paving of asphalt. In this study, PAHs emitted from an asphalt mix plant were analyzed to investigate the effects on a suburban residential area. Black carbon, organic carbon, elemental carbon, and PAHs in fine particulate matter (PM2.5) were analyzed in a village near the asphalt mix plant. The results of wind direction analysis revealed that the village was meteorologically affected by emissions from the asphalt mix plant. PAHs in PM2.5 ranged from 0.51 to 60.73 ng/m3, with an average of 11.54 ng/m3. Seasonal PAHs were highest in winter, followed in order by spring, autumn, and summer. The diagnostic ratios between PAHs indicate that the source of PAHs could be incomplete combustion of petrogenic origin. The maximum black carbon concentration in the intensive periods reaches up to 14.17 μg/m3 during mix plant operation periods. Seasonal ∑BaPTEF values based on Toxic Equivalence Factor were: winter (2.284 ng/m3), spring (0.575 ng/m3), autumn (0.550 ng/m3), and summer (0.176 ng/m3). The values are about 6.5 times higher than the concentration in another background area and more than three times higher than those in the capital city, Seoul, in the Republic of Korea. In conclusion, primary emissions from the point source can be considered the major contributor to pollution in the residential area.
1. Introduction
Air pollutants are generally known to be harmful to humans and the environment. According to a recent study on long-term exposure to fine particulate matter (PM2.5), each 10 μg/m3 increase in the concentration of PM2.5 in the atmosphere increases total deaths by 4%, cardiovascular deaths by 6%, and cancer deaths by 8% [1]. Therefore, organic species in PM2.5, one class of air pollutants, have also been classified as separate carcinogens [2]. In addition, some of the components of particulate matter are toxic chemicals [3]. Recently, the International Agency for Research on Cancer (IARC) classified the mix of substances found in outdoor air as a carcinogenic substance in ‘Group 1’ [4]. Among the various organic compounds that make up PM2.5, polycyclic aromatic hydrocarbons (PAHs) are considered to be representative toxic chemicals because they have many combustion sources and they include compounds which pose health risks, such as benzo(a)pyrene [4].
PAHs are organic pollutants that are widely distributed in the environment due to natural occurrences such as volcanic eruptions and wildfires and are also artificially generated through incomplete combustion of fuels such as gasoline, diesel, and coal [5,6,7,8]. In the atmosphere, PAHs exist in gaseous and particulate forms and can be transported over long distances, thus affecting soil, vegetation, and humans [9,10,11]. As PAHs are thermally and chemically stable, PAHs transported over long distances can be utilized as a markers of PM origin [7,12]. PAHs are substances that have potential cytotoxic, mutagenic, and carcinogenic effects; they also cause direct and indirect damage to deoxyribonucleic acid (DNA) [13]. The United States Environmental Protection Agency (US-EPA) and IARC have defined seven carcinogenic PAHs compounds (benzo[a]pyrene, chrysene, benzo[b]fluoranthene, benzo[k]fluoranthene, benz[a]anthracene, dibenz[a,h]anthracene, and indeno [1,2,3-cd]pyrene) as possible carcinogens [14,15,16,17]. This indicates that PAHs are harmful to humans, and monitoring of PAHs in areas of high population density and around the sources of their emission (mostly industrial sources like asphalt plants) is therefore necessary.
Asphalt mix factories are one of the main emission sources of PAHs because of the heavy oil combustion process they use. At the final stage of manufacturing asphalt, high density smoke with steam and solid particles including PAHs can be emitted even when a control system (which should be directed to PM2.5 since the coarse PM is probably captured by dust collectors) is used [18]. In general, the manufacturing temperature of asphalt is known to be 135 °C or higher and requires a high temperature of 260 °C or higher depending on the characteristics of the raw material for manufacturing asphalt [19,20]. It is known that the type and amount of the material to be discharged varies according to the asphalt manufacturing temperature, and generally, the higher the manufacturing temperature, the more various materials are released [21]. As a result of previous studies, it is known that some materials (fluoranthene, benzo[b]fluoranthene, benzo[a]pyrene, etc.) are discharged only at 160 °C or more in relation to the asphalt manufacturing temperature [21]. Exposure to compounds in asphalt emissions is known to reduce lung function and increase lung cancer incidence [22,23]. In addition, PAHs in asphalt emissions are known to be absorbed by the human body through not only the respiratory system but also the skin [24,25]. As these hazards of asphalt emissions have been identified, the IARC has classified emissions from occupational exposure and road pavement as possible human carcinogens (IARC Group 2B) [26].
Asphalt production was about 1.6 trillion tons in 2007 and is currently estimated at about 87 million tons. Since about 85% of the asphalt produced is used as a binder in pavements, human access to asphalt is common [20,21]. Therefore, a method for reducing the amount of various harmful substances emitted from asphalt has been developed. As a representative technique, there is a method based on changing the asphalt manufacturing temperature: (i) cold mix asphalt (CMA) manufactured at a temperature lower than 60 °C; (ii) half-warm mix asphalt (HWMA) manufactured at less than 100 °C, normally at 70–95 °C; (iii) warm mix asphalt (WMA) manufactured at temperatures of 110–140 °C [27]. Another technique is to mix various materials in the production of asphalt. Typical mixtures include styrene butadiene styrene, activated carbon, layered double hydroxides, and various polymers [28]. Despite the fact that these new technologies are more environmentally friendly than conventional asphalt, there are not many examples of field applications to date because the new products are somewhat less effective than conventional asphalt. Most of the current studies related to asphalt have aimed to evaluate human exposure and hazardous emissions during the road paving process. Meanwhile, research on the environmental impact of asphalt manufacturing facilities such as asphalt mix plants is insufficient. Since PAHs deposited on PM can be transported over long distances, it is important to assess the hazards of asphalt mix plants, which emit PAHs in greater amounts than are emitted from road pavement.
The purpose of this study is to investigate the impact of pollutant emissions from an asphalt mix plant in a suburban residential area based on PAH concentrations. PAHs were analyzed using gas chromatography/mass spectrometry (GC/MS). In addition, the point source of PAHs was determined by analyzing the characteristics of black carbon (BC), organic carbon (OC), elemental carbon (EC), and PAH concentrations. In addition, toxic equivalency factors (TEF) were evaluated based on PAH concentrations.
2. Materials and Methods
2.1. Sampling and Chemical Analysis
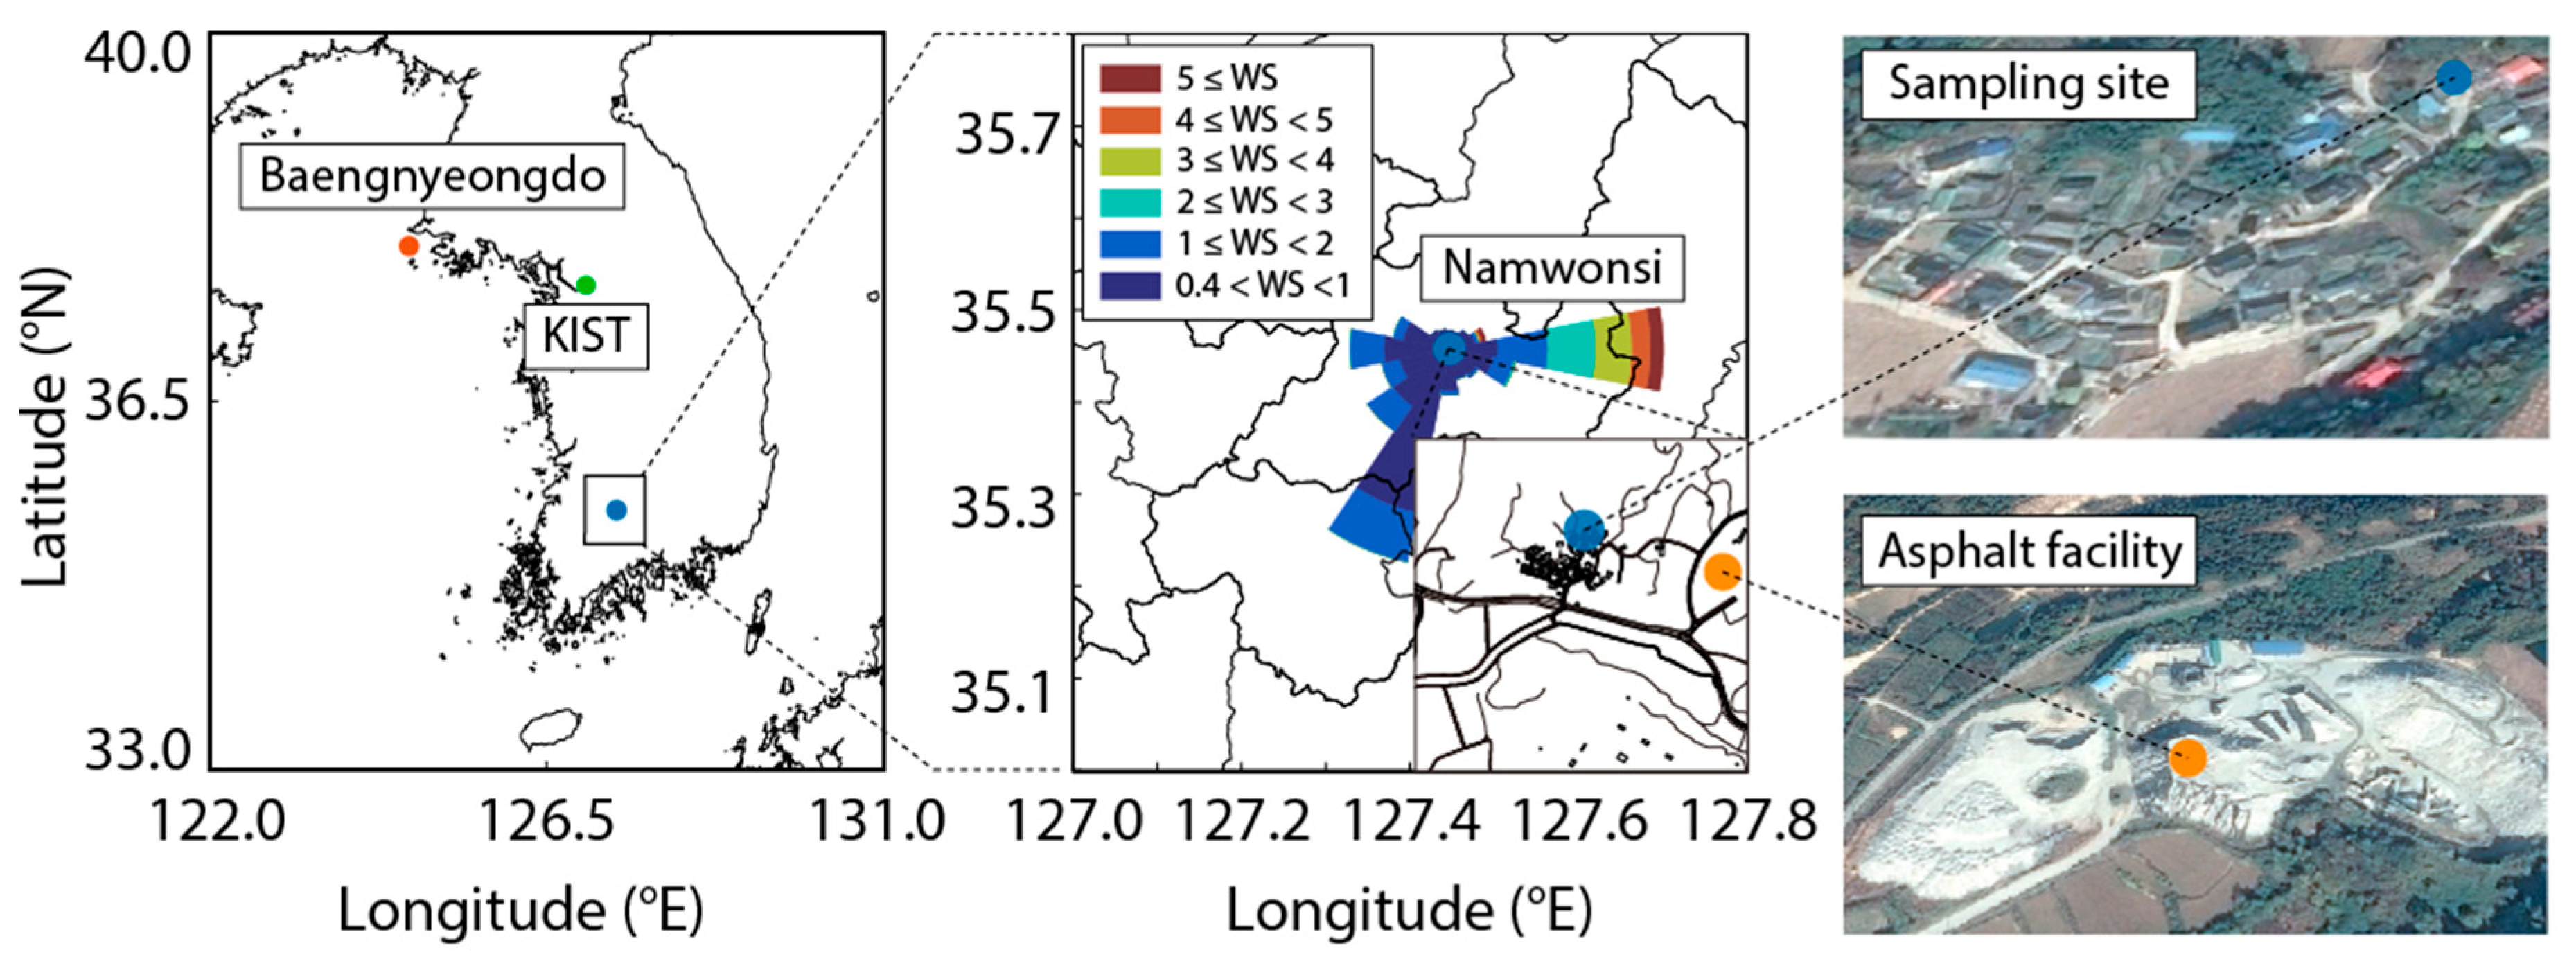
The study area is a typical suburban residential area located in the Republic of Korea. The village (35.457° N, 127.464° E) has a population of about 50 people, and there is an asphalt mix plant (35.457° N, 127.469° E, elevation 223 m, area of 35,000 m2) located about 300 m away from the residential area (Figure 1). Two integrated samplers, a low volume sampler with a flow rate of 16.7 L/min (URG-2000-30EHS/filter pack; URG-2000-30FG, Chapel Hill, NC, USA) and a high volume sampler (1013 L/min: Thermo Fisher Scientific, Waltham, MA, USA), were deployed for sample collection during the measurement period [29,30]. The nearby asphalt mix plant was established in 1995, and after the first lung cancer patient in the area was diagnosed in 1999, the National Center for Disease Control (NCDC) announced that 14 of the 50 residents of the village had been diagnosed with cancer [31,32]. Therefore, the incidence rate of cancer patients in this village is substantially higher than the national average. To identify pollutant transport into the village, a sampling site located in the center of the village, which is east of the asphalt mix plant, was selected. In total, 61 PAH samples (24 h integrated samples, every six days) were collected from December 2014 through to December 2015.
To compare the PAH concentrations in the suburban residential area with those of other locations in the Republic of Korea, samples were simultaneously collected at two control sites (the Korea Institute of Science and Technology (KIST) and Baengnyeong Island (BI)) from April through to July, 2016. KIST is located in Seoul, Republic of Korea, 7 km from the city center (37.603° N, 127.047° E); it is 400 m from the highway and is influenced by traffic but is not influenced by any major industrial sources. The samples were collected from the rooftop of a two-story building. In total, 21 24 h integrated PM2.5 samples were collected using a high-volume sampler. At the same times, samples were collected from a measurement station on BI in the Yellow Sea (37.967° N, 124.630° E). The northernmost and westernmost part of South Korea, BI is located 740 km east of Beijing and 211 km west of Seoul. The measurement station was established by the National Institute of Environmental Research (NIER) as a core background site of the National Monitoring Network to track dust and pollution plumes transported from China. In previous studies conducted at this site, increased concentrations of sulfate and organic aerosols were found and attributed to the influence of pollution plumes transported from eastern China and the Korean Peninsula [3,7]. All samples were shipped and stored frozen until analysis.
2.2. Chemical Analysis
The samples of OC, EC, and PAHs, including filter samples, field blanks, and trip blanks, were analyzed using GC/MS at Mokpo National University (MNU). OC and EC have been identified in previous studies as important indicators of PM sources, as their carbon content accounts for a large fraction of PM2.5. The carbon component plays a major role in determining the characteristics of a PM source as well as the primary and secondary sources. The OC and EC analysis in this study used thermal-optical transmittance according to a protocol published by the National Institute of Occupational Safety and Health (NIOSH 5040). Briefly, the sample is first heated to 870 °C with He gas. In the second stage, it is heated to 870 °C in the presence of O2. In the third and final step, OC and EC are quantified using an internal standard (5% CH4 in He) for each sample. In the assay process, 2 μg·C/μL sucrose (monosaccharide, C12H22O11) was used as an external reference for testing and calibration of the equipment and quantification. The OC and EC classification of the NIOSH 5040 protocol is determined to be the point at which the transmittance of the laser returns to its initial transmittance after the gradual decrease that occurs when it passes through the filter. BC was monitored using a Multi-Angle Absorption Photometer (MAAP) (Model 5012, Thermo Fisher Scientific Inc., Waltham, MA, USA).
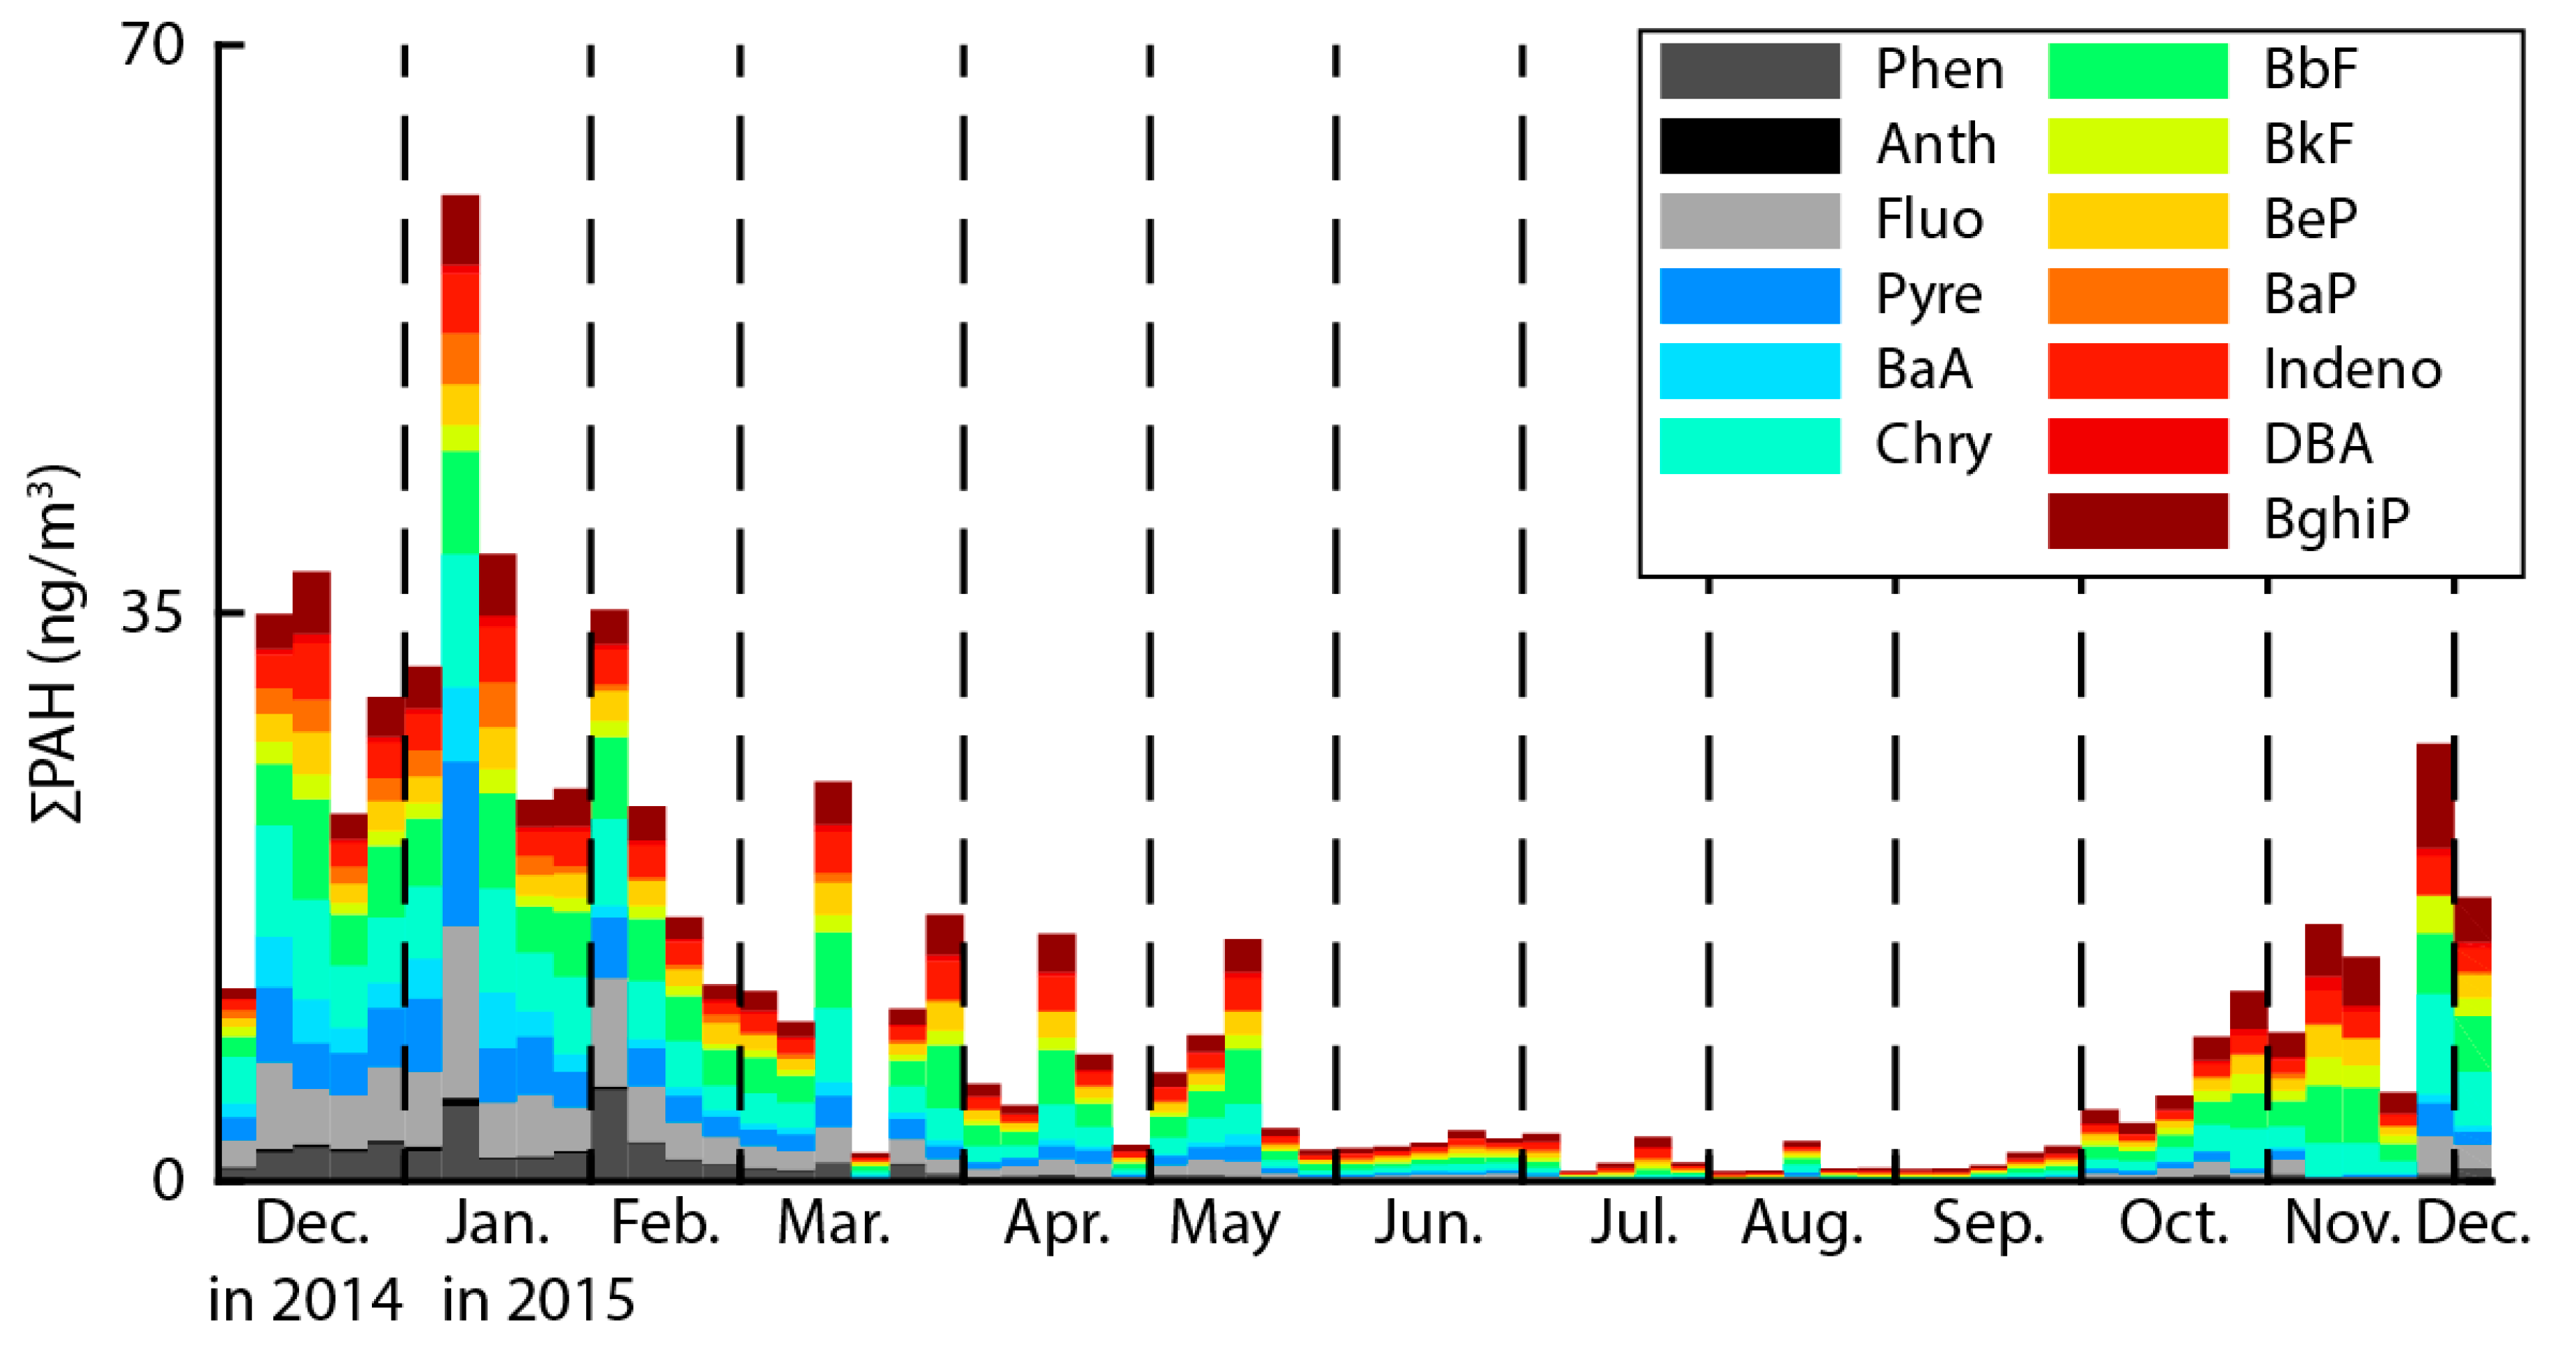
For GC/MS analysis, 8 × 10 inch2 quartz filters were collected using high-volume samplers. In total, 13 PAH compounds (i.e., phenanthrene(Phen), anthracene(Anth), fluoranthene(Fluo), pyrene(Pyre), benzo[a]anthracane(BaA), chrysene(Chry), benzo[b]fluoranthene(BbF), benzo[k]fluoranthene(BkF), benzo[e]pyrene(BeP), benzo[a]pyrene(BaP), indeno123cdpyrene(Indeno), dibenz[a,h]anthracane(DBA), and benzo[g,h,i]perylene(BghiP)) were speciated. Each filter was extracted individually by four rounds of 30 min sonication in dichloromethane (DCM). Samples were then spiked with 500 μL of 5 ppm internal standard (pyrene-d10 and benz(a)anthracene-d12) and were analyzed in batches, which included laboratory blanks spiked with matrix standards [33,34]. The final volume for each sample was adjusted to 500 μL. Each extracted aliquot was analyzed using gas chromatography electron impact mass spectrometry (GC-EI-MS). The analytical recovery was 100 ± 5%. Field blank tests were performed without collected aerosols to determine noise and contamination, and duplication analysis was performed using at least 10% of total samples for quality assurance and control.
3. Results & Discussion
3.1. PAHs in PM2.5
The one-second prevailing meteorological conditions, including wind speed, wind direction, temperature, and pressure, were determined using a professional weather station (PCE Instruments Ltd., Southampton, UK) to understand the source directions. Wind direction analysis showed that the sampling site had wind blowing from the east, indicating that the village was affected by emissions from the asphalt mix plant (Figure 1). The wind speed from December 2004 to December 2005 ranged from 0.0 m/sec to 8.0 m/s, with an annual average wind speed of 0.61 ± 0.95 m/s. Wind direction histograms (wind rose) for the observation period were prepared, which were overlaid in the study area. The main wind directions were identified as easterly winds. This indicates that the wind blew predominantly from the source location.
Table 1 shows the concentrations of various PAHs measured in the study area, capital city (KIST), and a Korean background location (BI) during the study period. We analyzed 13 species of PAHs to confirm the effects from the sources [35]. The concentration of ∑PAHs in the study area was 11.65 ng/m3, which was about eight times higher than that at the background location and about five times higher than that in the capital city, which has the major emission sources of vehicles and heating. This suggests that there are facilities in the research area that emit high concentrations of PAHs. The concentration of each of the measured PAHs were, in decreasing order, Chry, BbF, Fluo, BghiP, Phen, etc.; it was confirmed that these five substances with the highest concentrations accounted for 60% of the total PAHs.
The PAHs contained in the PM2.5 were analyzed and are represented as time series concentrations in Figure 2. The results show that the ∑PAHs contained in PM2.5 ranged from a minimum of 0.51 ng/m3 to a maximum of 60.73 ng/m3, with an average of 11.54 ng/m3. Seasonal ∑PAHs were highest in winter (December–January), followed in order by spring (March–May), autumn (September–November), and summer (June–August). The higher concentrations of ∑PAHs in winter, autumn, and spring compared to summer may be due to meteorological conditions in the point source area.
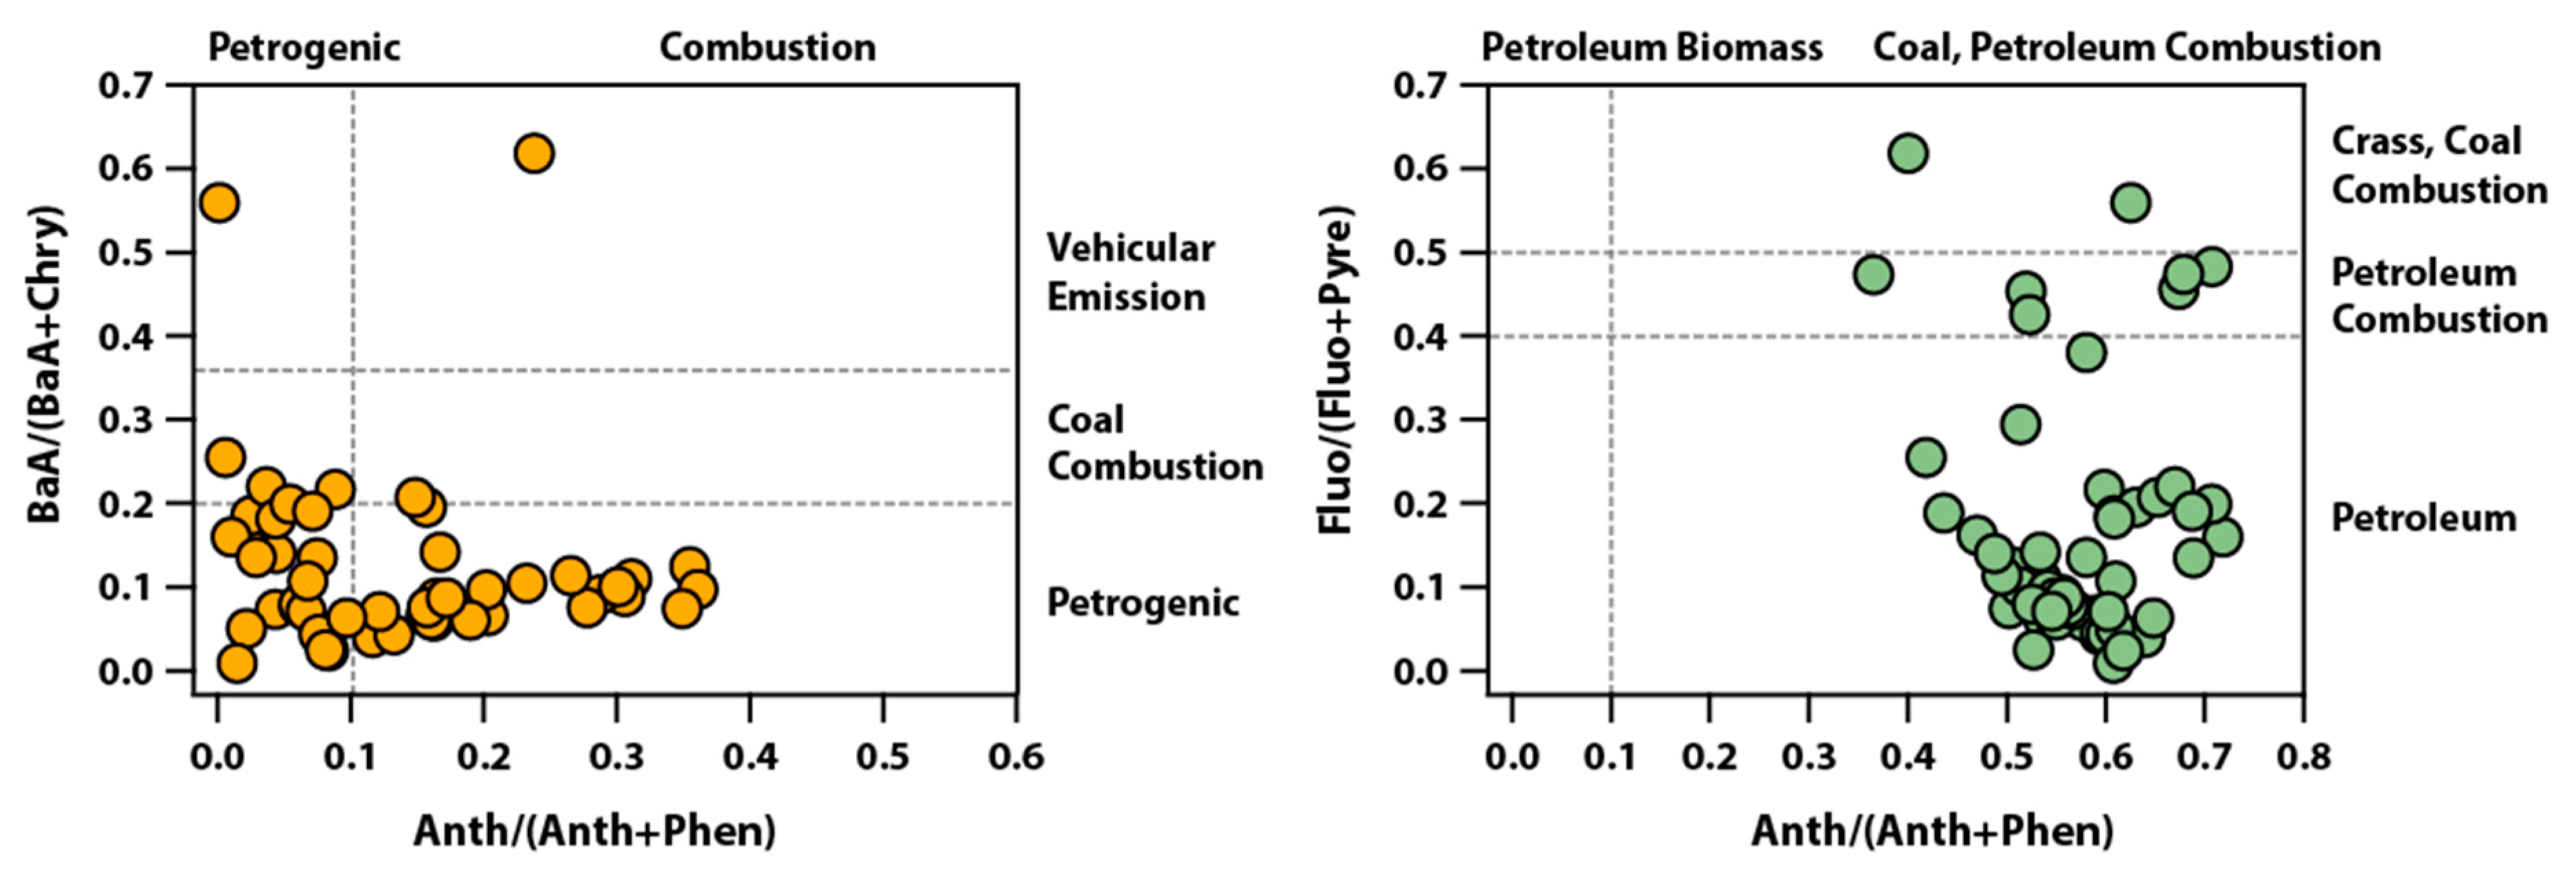
To identify emission sources of PAHs, diagnostic ratios for source analysis were performed. The diagnostic ratio method is widely used in the determination of PAH pollution sources, of which Anth/(Anth+Phen), Fluo/(Fluo+Pyre), BaA/(BaA+Chry), and Indeno/(Indeno+BghiP) are the most commonly used [36,37,38]. According to the summary analyses of previous studies; a BaA/(BaA+Chry) ratio of <0.2 indicates a petrogenic source, >0.35 indicates a vehicular emission, and a ratio between the two represents coal combustion [39]. An Anth/(Anth+Phen) ratio of <0.1 usually indicates a petrogenic source, whereas >0.1 indicates a source of combustion [40]. A Fluo/(Fluo+Pyre) ratio of <0.4 indicates a petrogenic source, >0.5 indicates a grass, wood, coal combustion, and a ratio between the two represents fossil fuel combustion [41]. Figure 3 shows the results of diagnostic ratios for source analysis for Anth/(Anth+Phen) vs. BaA/(BaA+Chry) and Anth/(Anth+Phen) vs. Fluo/(Fluo+Pyre). (BaA)/(BaA+Chr) ranged less than 0.2, and Anth/(Anth+Phen) ranged from 0.0 to 0.4. This indicates that the emission of PAHs in the study area is the condensation of complete and incomplete combustion of petrogenic sources [42]. (Fluo)/(Fluo+Pyre) was between 0.01 and 0.62, but most ratios were less than 0.4 during the study period. This indicates that the source of PAHs was fossil fuels from coal and petroleum [43]. These results show that the asphalt plant, the only petroleum raw material processing plant in the study area, dominates the PAHs concentration.
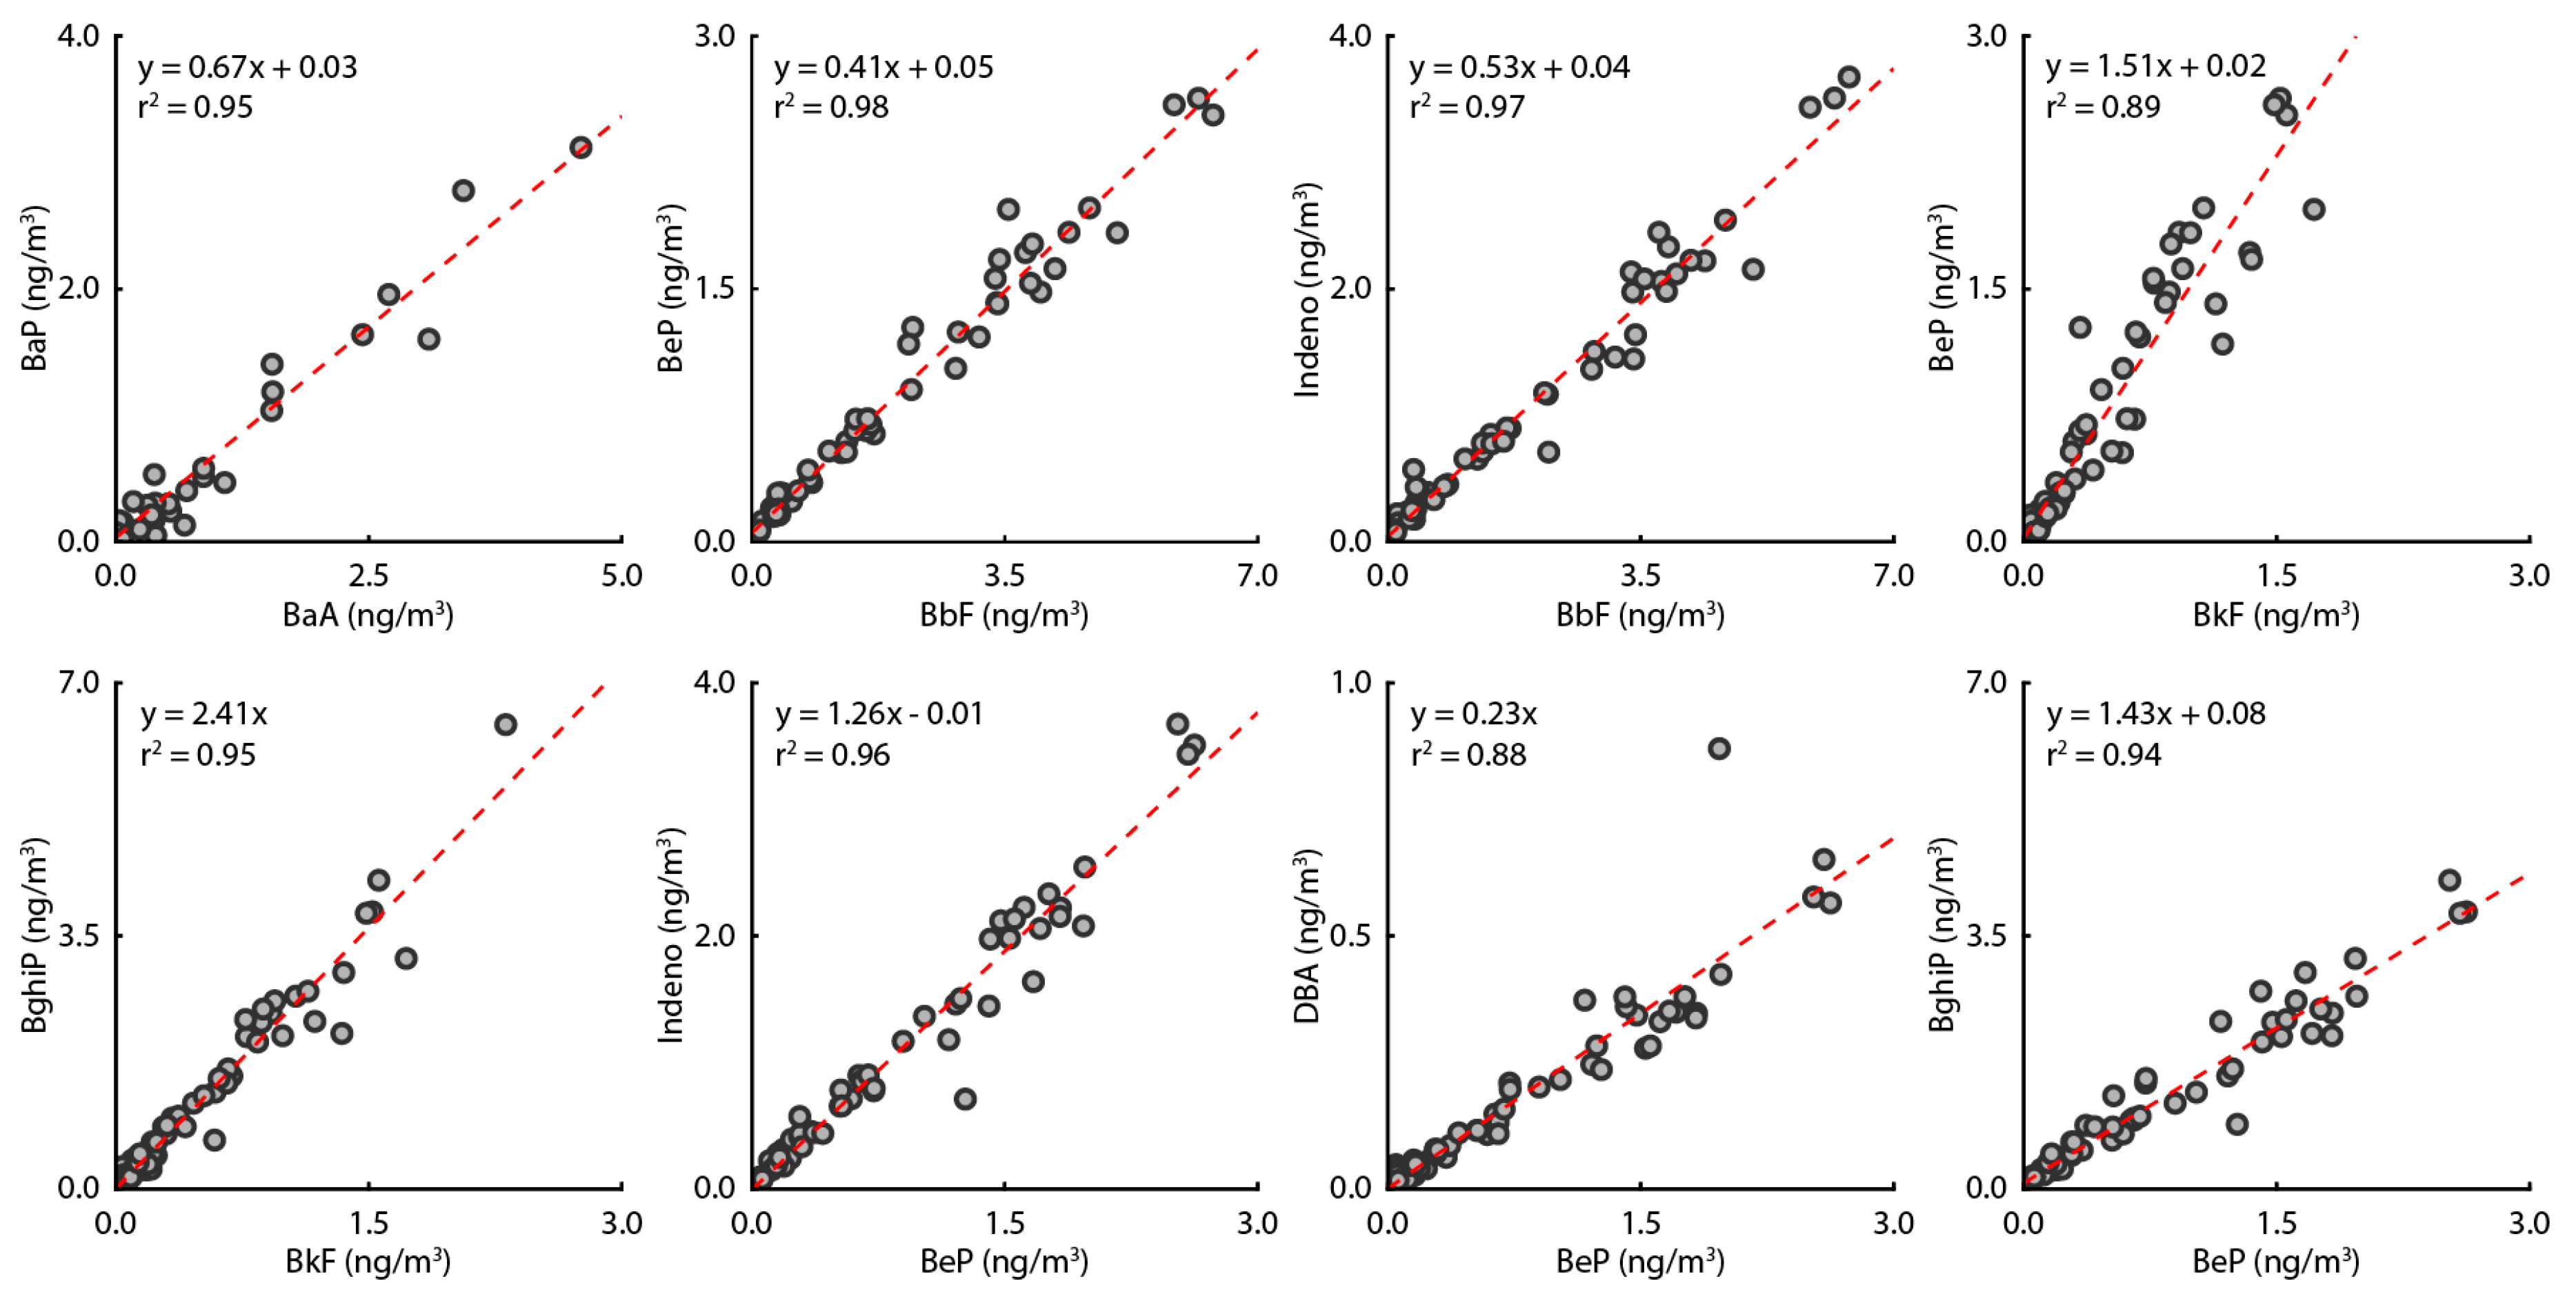
The ratio of PAHs emitted from asphalt in this study was compared with the results of previous studies. In previous studies, the ratio of Fluo/Pyre discharged from asphalt was about 1.17 and the ratio of Fluo/BeF was about 0.52 [44,45]. In contrast, in this study, the ratio of Fluo/pyre was 1.22 and the ratio of Fluo/BeF was 0.72. These ratios are similar to those found in previous studies. The characteristics of PAHs generated by the raw materials used to make asphalt and the manufacturing process are different [46,47]. However, comparing the results of this study with the results of previous studies indicates that the PAHs measured in this study were generated by asphalt. An itemized correlation analysis of the analyzed PAHs is shown in Figure 4. The correlations (r2) for BaA vs. BaP; BbF vs. BeP, Indeno, BeP, and BghiP; and BeP vs. Indeno, DbA, and BghiP were greater than 0.88 in all cases. This indicates that the emission source of the PAHs contained in PM2.5 is the same source. In addition, changes in the PM2.5 concentration did not have a significant effect on the ratio of PAH components, indicating that the concentrations of PM2.5 and PAHs were proportional to each other. Based on the OC, EC, and BC measurement results, we confirmed that the emission source for PM2.5 was the asphalt mix plant and that the concentrations of PM2.5 emitted and PAHs were proportional to each other. In conclusion, PAHs in the study area are attributable to emissions from the asphalt mix plant.
3.2. Intensive Sampling
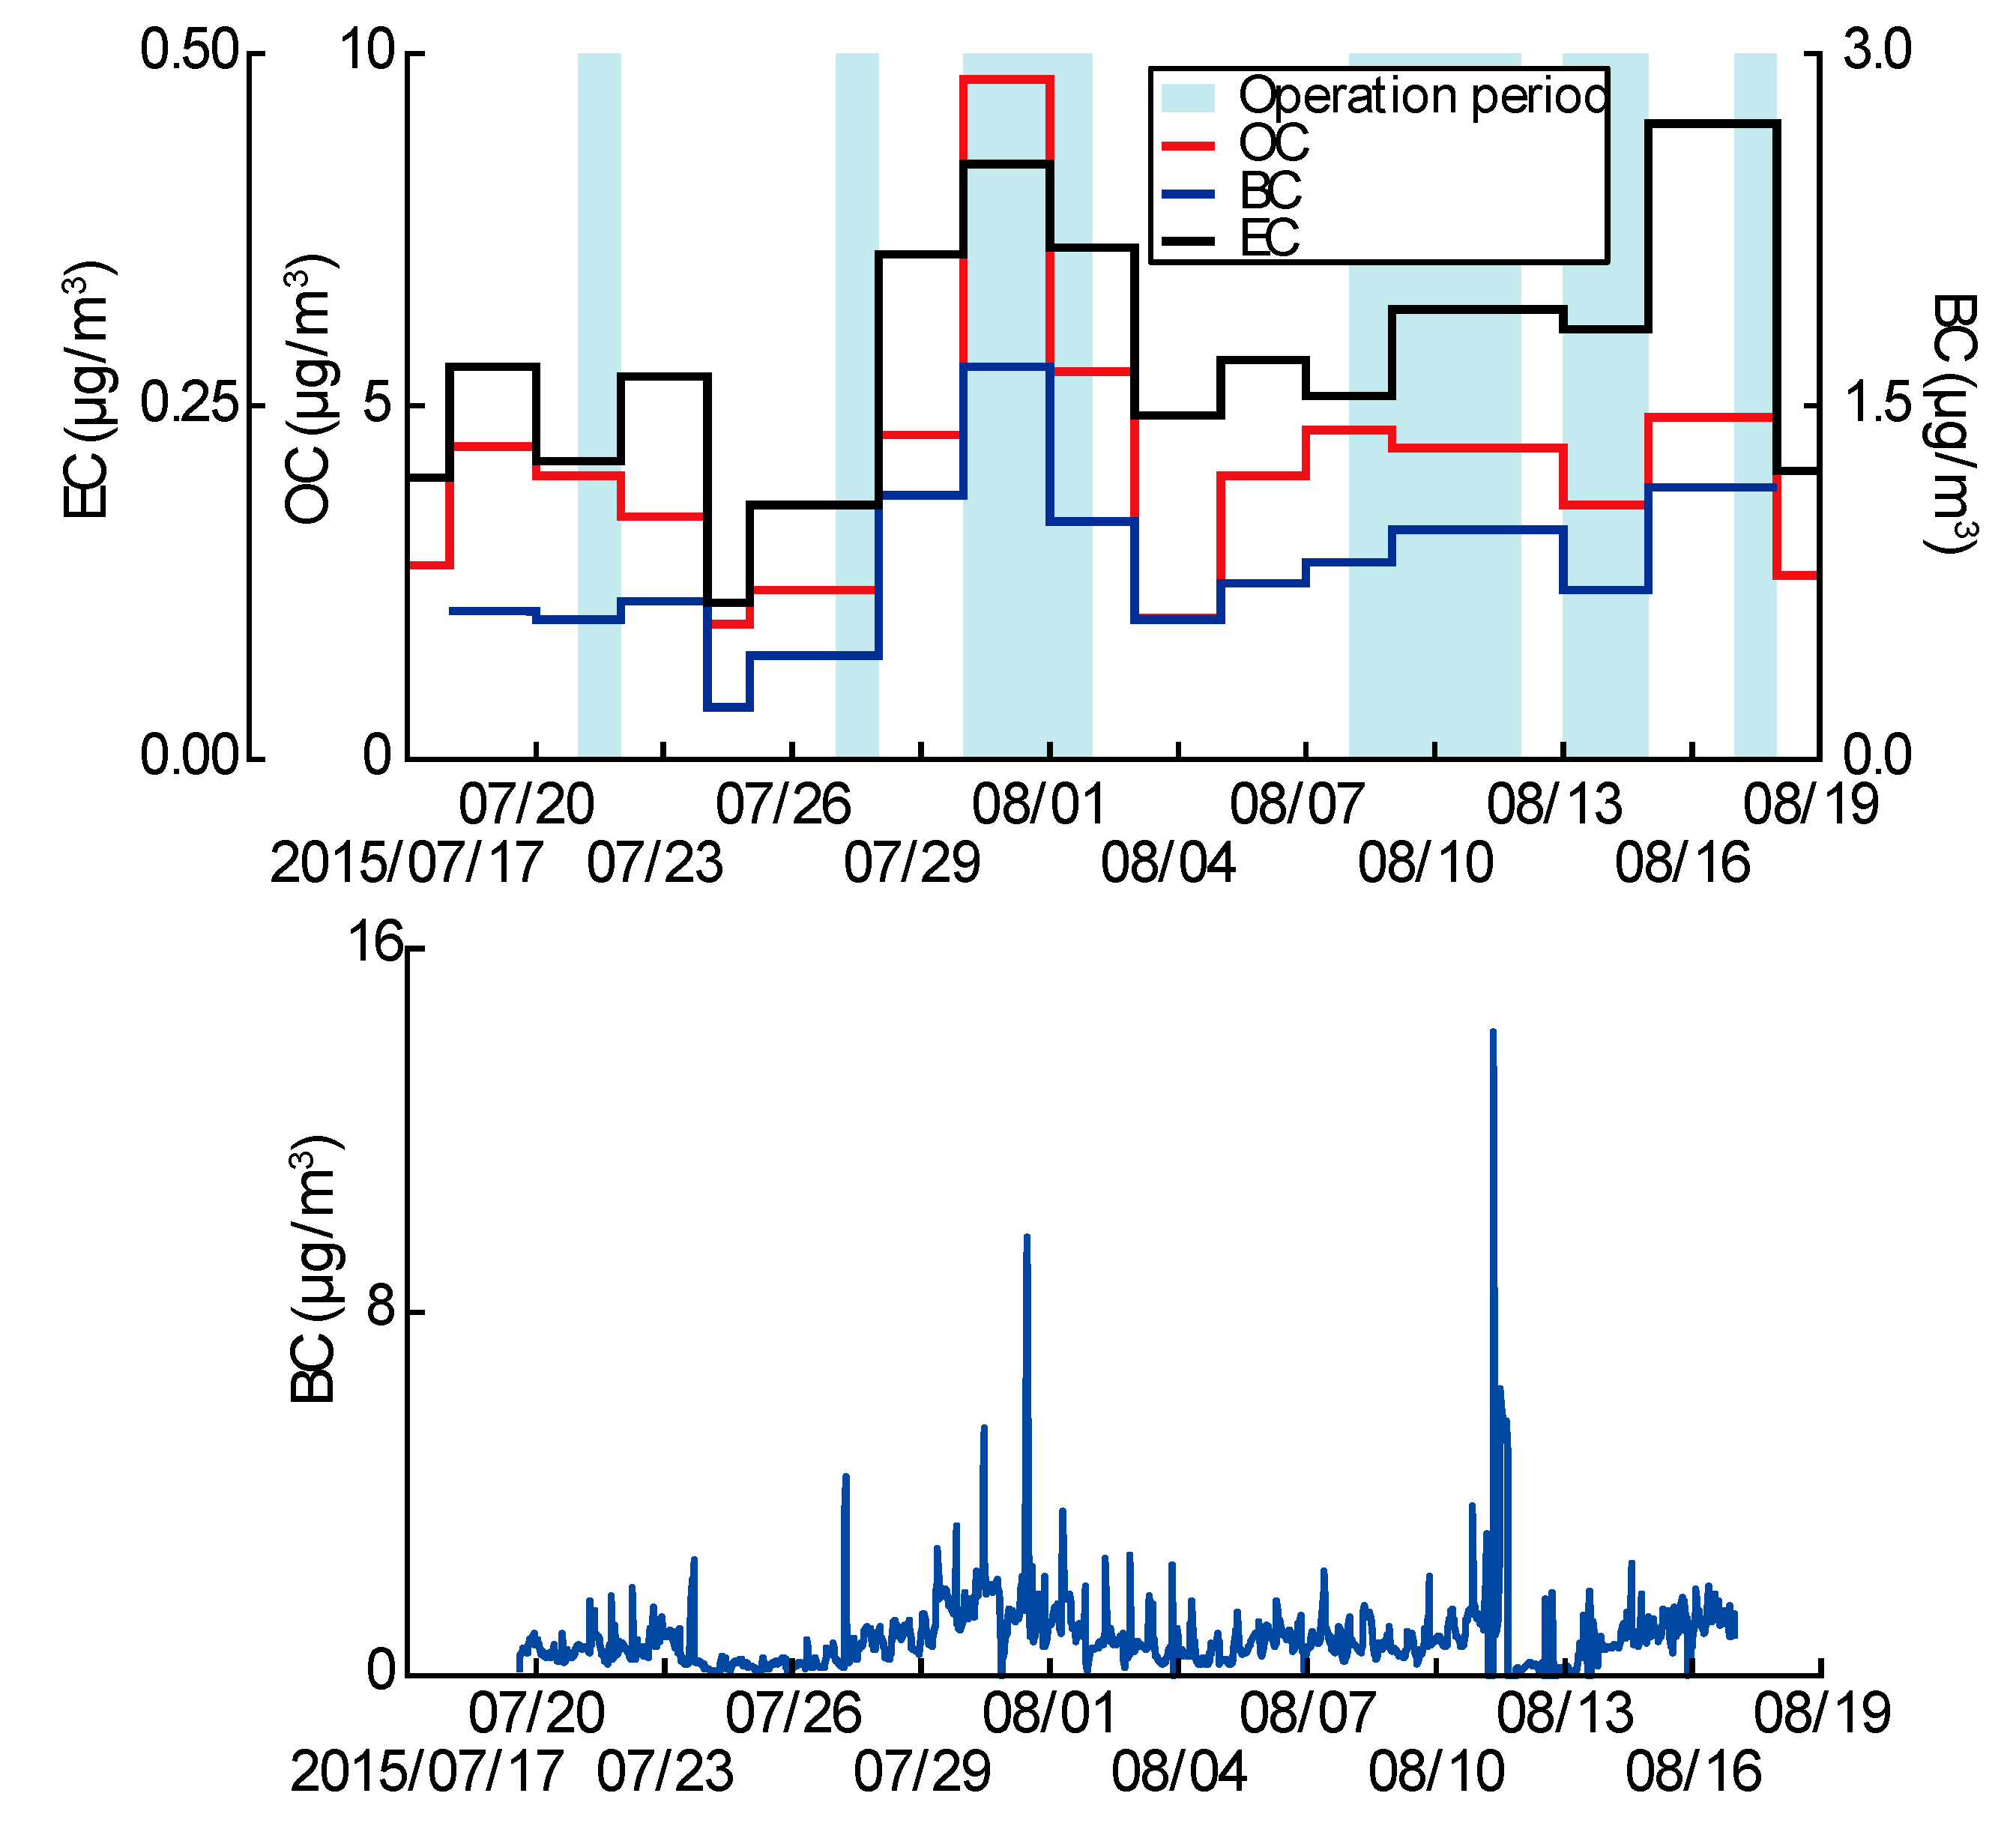
The temporal concentrations using 24 h integrated PAH samples every six days, BC (one-minute resolution), EC (72 h integrated), and OC (72 h integrated) were analyzed to characterize the PM2.5 collected from the study area. BC is emitted from a variety of combustion processes, mainly incomplete combustion [48,49,50]. On the other hand, OC is classified as primary organic carbon (POC) or secondary organic carbon (SOC) formed by photochemical reactions, depending on the formation process [51,52]. Estimations of primary and secondary particles based on the proportions of OC, EC, and BC contained in PM2.5 have been conducted in various studies [26,53]. The overall averaged BC in the intensive periods was 0.84 μg/m3. It is interesting that the maximum BC concentration reached 14.17 μg/m3 on 11 August when the asphalt mix plant was running.
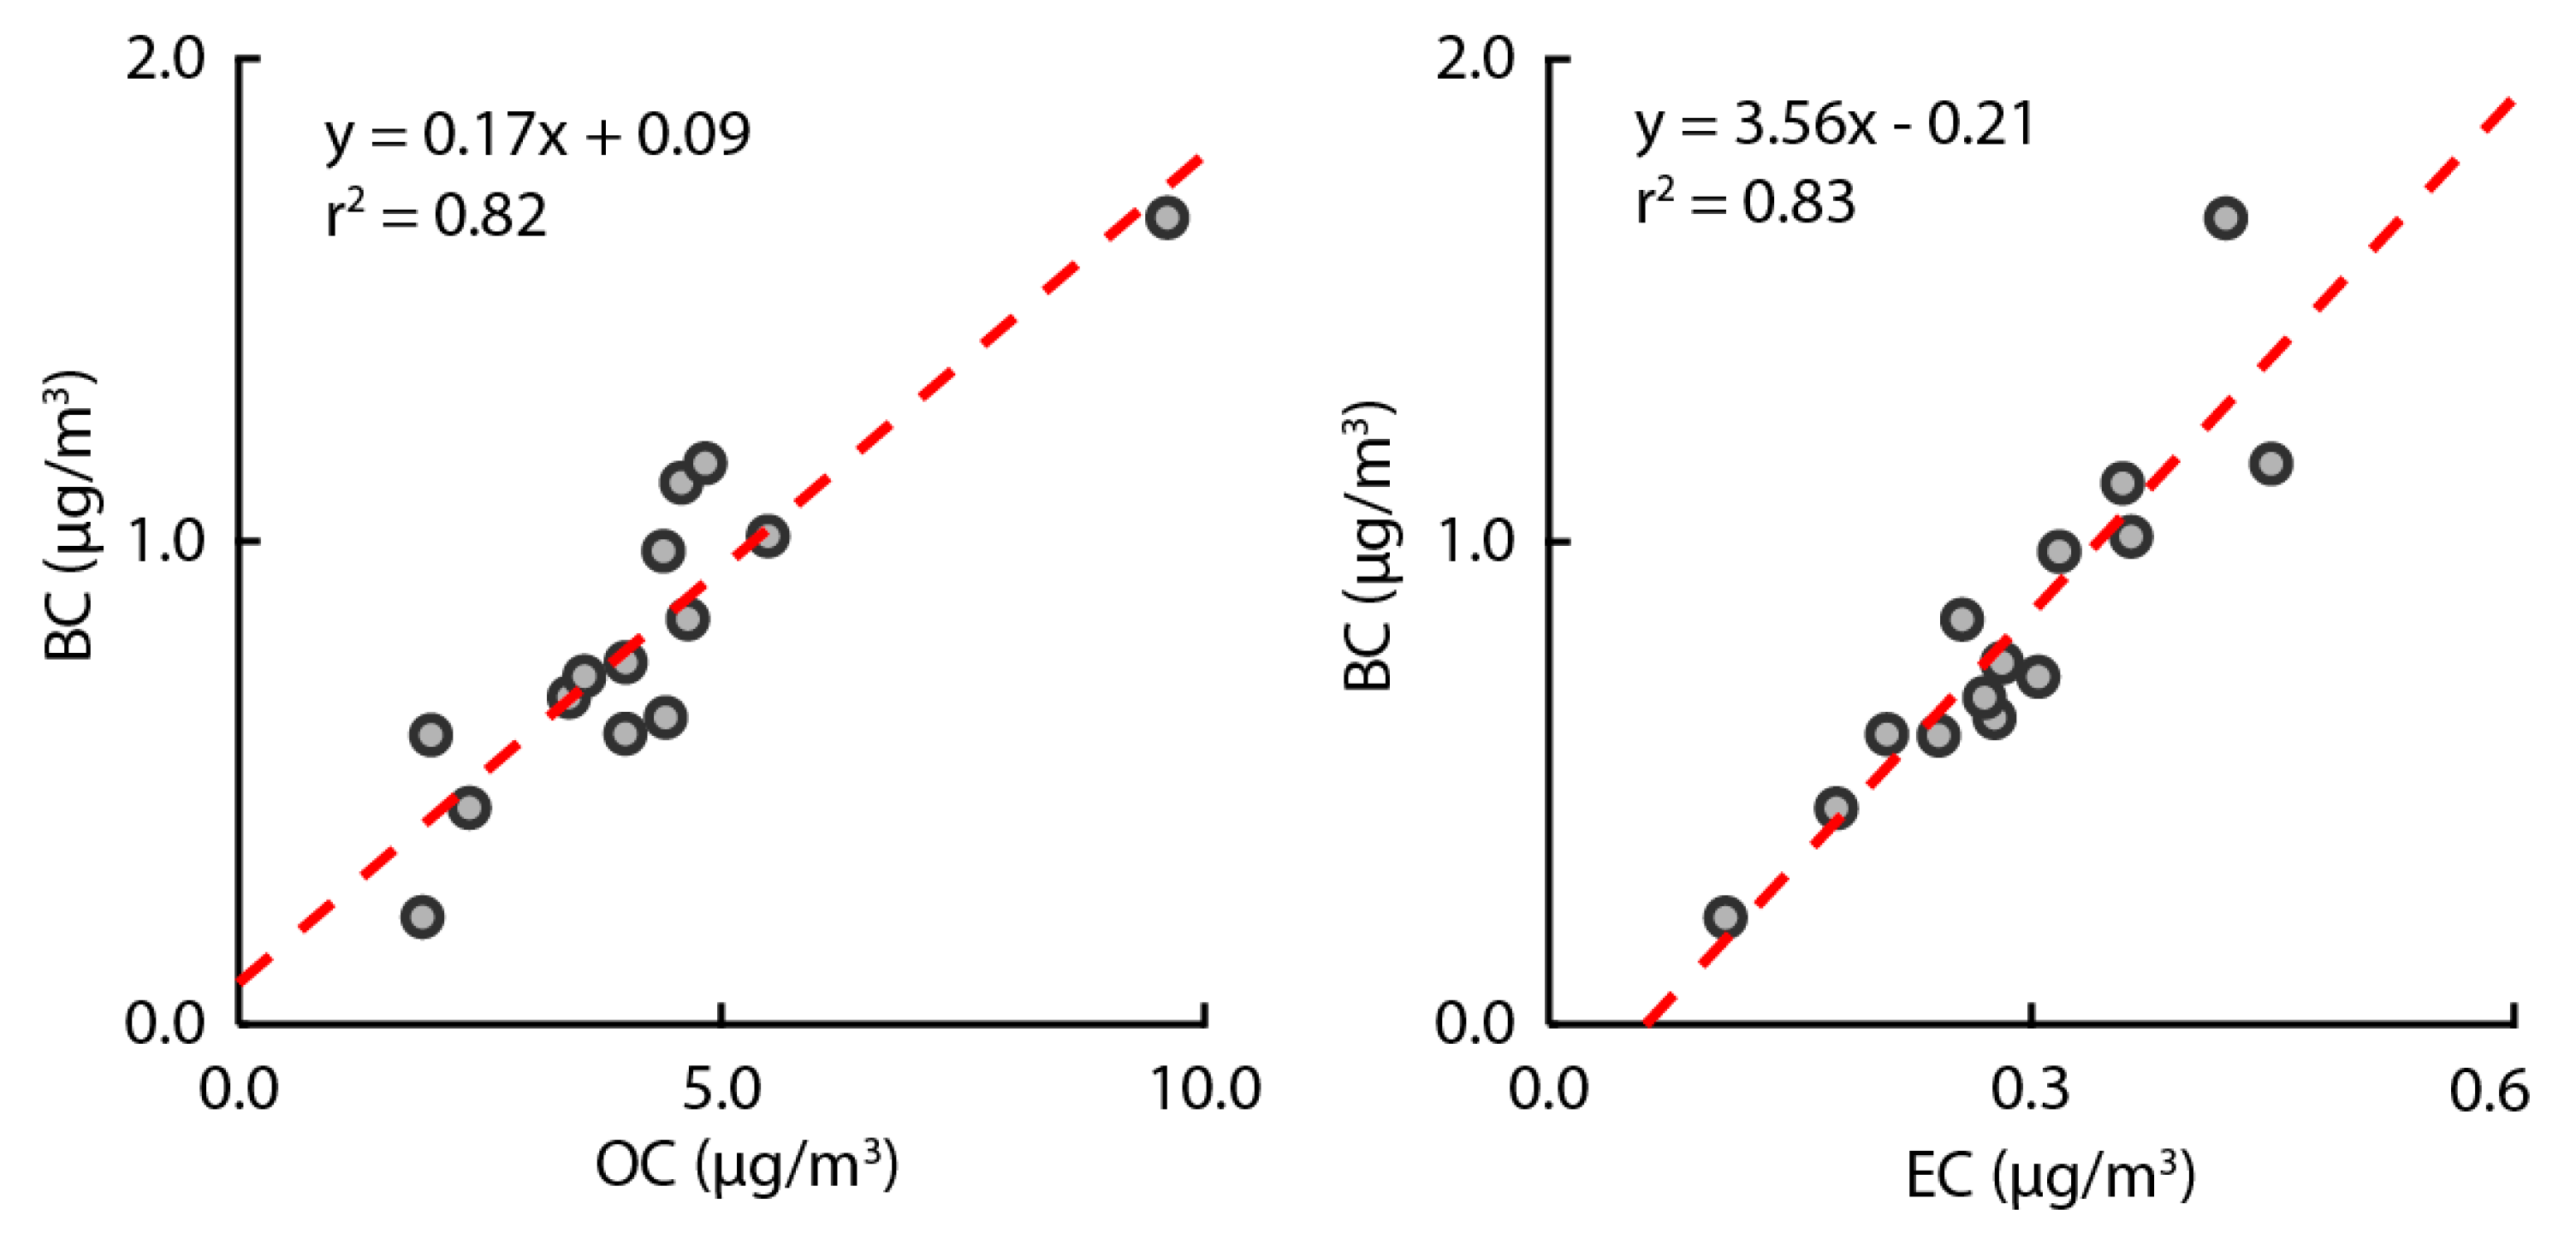
The correlation between OC and EC was evaluated based on the BC concentration (Figure 5). OC showed a correlation of at least 0.82 with BC concentration. These results indicate that PM2.5 in the study area is composed of the primary particles generated by combustion. The overall linear regression between the EC and BC concentrations in the study area showed a slope of 3.56 and an r2 of 0.83. Previous studies reported that the relationship between EC and BC depends on the emission source and atmospheric conditions [54]. In addition, the relationship between EC and BC can depend on the presence of atmospheric compounds related to time-related source differences [55]. Therefore, the relationship between EC and BC is sensitive to the source of carbonaceous aerosols. Thus, the study area appears to be affected by emissions from the asphalt mix plant. Time series concentrations of OC, EC, and BC were measured to confirm the effect of the asphalt mix plant on PM2.5, and the time series concentrations were compared based on the operational period of the asphalt mix plant (Figure 6). As shown in Figure 6, OC, EC, and BC increased when the asphalt mix plant was operational. The BC-based OC and EC correlations, along with the increases in BC, OC, and EC during the operational period, prove that the primary particles produced by the asphalt mix plant account for PM2.5 in the study area.
3.3. Toxic Equivalence Factor (TEF)
TEF was calculated to assess the risk presented by PAHs during the entire sampling periods in the study area. Toxic compounds with the same mechanisms of action can generally be expressed in relation to members of the most toxic group; this is known as the toxic equivalence factor (TEF) [4]. The TEF of PAHs was proposed by Nisbet and LaGoy in 1992 and is calculated based on the most toxic of the PAHs, BaP [56]. In this study, following the methods of previous studies, biological PAH levels were corrected for biological activity by multiplying the concentration of each PAH in the air by the TEF (the value expressed as BaPTEF) [57]. The TEFs used in this study are as follows: 1 for BaP and DBA; 0.1 for BaA, BbF, and BkF; and 0.01 for Chry.
The results of this and previous studies calculated using the TEF are shown in Table 2 [58,59,60,61]. The average ∑BaPTEF concentration was 0.8765 ng/m3, which was similar to or lower than the target values of the European Commission Air Quality Standard (1 ng/m3) and the French Atmospheric Quality Standards and Criteria (0.9 ng/m3). However, the maximum concentration of ∑BaPTEF was 5.0280 ng/m3 during the study period, and about 28% of the time, the values exceeded 1 ng/m3. Seasonal ∑BaPTEF concentrations were as follows: winter (2.284 ng/m3), spring (0.575 ng/ m3), autumn (0.550 ng/m3), and summer (0.176 ng/m3).
The ∑BaPTEF concentrations in the study area were compared with those in the Korean capital and the background location. As shown in Table 2, ∑BaPTEF in the study area was about 6.5 times higher than the background concentration of 0.1317 ng/m3 and more than three times higher than that in the capital city (0.2863 ng/m3). This clearly shows that there are sources of pollutants that emit PAHs in the study area.
The ∑BaPTEF concentrations found in the study area were compared to those of major cities (Table 2). ∑BaPTEF concentrations in the study area were lower than those in Riyadh, Saudi Arabia and Wuhan, China, but higher than those in Minnesota, USA and Taichung, Taiwan. Riyadh, Saudi Arabia is known for its high PAHs due to the presence of heavy traffic as well as refineries and power plants near the city [59]. Wuhan, China is the largest city in central China and is known to produce a large number of airborne pollutants, such as a high concentration of fine dust [58]. ∑BaPTEF in Minnesota, USA, shown in Table 2, is concentrated around roadsides in urban areas, and ∑BaPTEF in Taichung consists of PAHs concentrated in areas around coal-fired power plants [60,61].
4. Conclusions
The purpose of this study is to measure the harmfulness of an asphalt mix plant based on PAH concentration. The study area is a village near an asphalt mix plant where inhabitants showed about a 25% cancer rate after the asphalt mix plant was established. PAHs in PM2.5 ranged from 0.51 to 60.73 ng/m3, with an average of 11.54 ng/m3. The diagnostic ratios between PAHs indicate that the major source of PAHs could be incomplete combustion of petrogenic origin. Seasonal ∑BaPTEF in winter is 2.284 ng/m3 followed by lower spring and autumn values. The TEF value is about 6.5 times higher than the concentration in the BI background area and more than three times higher than in the capital city, Seoul, in the Republic of Korea. In conclusion, the primary emissions source for the rural village could well be the asphalt mix plant. It is necessary to investigate methodologies of reducing the PAHs emitted from asphalt mix plants. Continuing research on asphalt mix plants is necessary.
Author Contributions
M.S. contributed experimental measurements, data analysis and manuscript preparation. K.L. and S.-H.O. contributed meteorological data analyses and manuscript preparation. M.-S.B. contributed to experimental planning and data analysis. All authors have read and agreed to the published version of the manuscript.
Funding
This research was funded by Rural Development Administration, National Institute of Agricultural Sciences (Grant Number PJ01490002). We greatly appreciated using the Convergence Research Laboratory (established by the MNU Innovation Support Project in 2019) to conduct this research.
Conflicts of Interest
The authors declare no conflict of interest.
References
- Pope, C.A., III; Burnett, R.T.; Thun, M.J.; Calle, E.E.; Krewski, D.; Ito, K.; Thurston, G.D. Lung Cancer, Cardiopulmonary Mortality, and Long-term Exposure to Fine Particulate Air Pollution. JAMA 2002, 287, 1132–1141. [Google Scholar] [CrossRef] [Green Version]
- IARC/WHO, World Health Organization. International Agency for Reserch on Cancer IARC: Outdoor air Pollution a Leading Environmental Cause of Cancer Deaths. 2013. Available online: https://www.iarc.fr/news-events/iarc-outdoor-air-pollution-a-leading-environmental-cause-of-cancer-deaths/ (accessed on 17 October 2013).
- He, J.; Fan, S.; Meng, Q.; Sun, Y.; Zhang, J.; Zu, F. Polycyclic aromatic hydrocarbons (PAHs) associated with fine particulate matters in Nanjing, China: Distributions, sources and meteorological influences. Atmos. Environ. 2014, 89, 207–215. [Google Scholar] [CrossRef]
- Sosa, B.S.; Porta, A.; Colman Lerner, J.E.; Banda Noriega, R.; Massolo, L. Human health risk due to variations in PM10-PM2.5 and associated PAHs levels. Atmos. Environ. 2017, 160, 27–35. [Google Scholar] [CrossRef]
- Zhang, Y.; Tao, S. Global atmospheric emission inventory of polycyclic aromatic hydrocarbons (PAHs) for 2004. Atmos. Environ. 2009, 43, 812–819. [Google Scholar] [CrossRef]
- Kamal, A.; Cincinelli, A.; Martellini, T.; Malik, R.N. A review of PAH exposure from the combustion of biomass fuel and their less surveyed effect on the blood parameters. Environ. Sci. Pollut. Res. 2015, 22, 4076–4098. [Google Scholar] [CrossRef] [PubMed]
- Wang, D.-G.; Yang, M.; Jia, H.-L.; Zhou, L.; Li, Y.-F. Polycyclic Aromatic Hydrocarbons in Urban Street Dust and Surface Soil: Comparisons of Concentration, Profile, and Source. Arch. Environ. Contam. Toxicol. 2009, 56, 173–180. [Google Scholar] [CrossRef] [PubMed]
- Kong, S.; Lu, B.; Ji, Y.; Bai, Z.; Xu, Y.; Liu, Y.; Jiang, H. Distribution and sources of polycyclic aromatic hydrocarbons in size-differentiated re-suspended dust on building surfaces in an oilfield city, China. Atmos. Environ. 2012, 55, 7–16. [Google Scholar] [CrossRef]
- Netto, A.D.P.; Krauss, T.M.; Cunha, I.F.; Rego, E.C.P. PAHs in SD:Polycyclic aromatic hydrocarbons levels in street dust in the central area of Niterói City, RJ, Brazil. Water Air Soil Pollut. 2006, 176, 57–67. [Google Scholar] [CrossRef]
- Pandey, S.K.; Kim, K.-H.; Brown, R.J.C. A review of techniques for the determination of polycyclic aromatic hydrocarbons in air. TrAC Trends Anal. Chem. 2011, 30, 1716–1739. [Google Scholar] [CrossRef]
- Kim, K.-H.; Jahan, S.A.; Kabir, E.; Brown, R.J.C. A review of airborne polycyclic aromatic hydrocarbons (PAHs) and their human health effects. Environ. Int. 2013, 60, 71–80. [Google Scholar] [CrossRef]
- Ockenden, W.A.; Breivik, K.; Meijer, S.N.; Steinnes, E.; Sweetman, A.J.; Jones, K.C. The global re-cycling of persistent organic pollutants is strongly retarded by soils. Environ. Pollut. 2003, 121, 75–80. [Google Scholar] [CrossRef]
- Li, G.; Lang, Y.; Yang, W.; Peng, P.; Wang, X. Source contributions of PAHs and toxicity in reed wetland soils of Liaohe estuary using a CMB–TEQ method. Sci. Total Environ. 2014, 490, 199–204. [Google Scholar] [CrossRef] [PubMed]
- US-EPA, Office of Environmental Information. Emergency Planning and Community Right-to-know Act-section 313: Guidance for Reporting Toxic Chemicals: Polycyclic Aromatic Compounds Category. 2001. Available online: https://www.epa.gov/toxics-release-inventory-tri-program/guidance-polycyclic-aromatic-compounds-category (accessed on 1 August 2001).
- IARC. Monographs on the evaluation of carcinogenic risks to humans, Some Non-heterocyclic Polycyclic Aromatic Hydrocarbons and Some Related Exposures. 2010. Available online: http://monographs.iarc.fr/ENG/Classification/ClassificationsGroupOrder.pdf (accessed on 1 August 2010).
- Callén, M.S.; López, J.M.; Iturmendi, A.; Mastral, A.M. Nature and sources of particle associated polycyclic aromatic hydrocarbons (PAH) in the atmospheric environment of an urban area. Environ. Pollut. 2013, 183, 166–174. [Google Scholar] [CrossRef] [PubMed] [Green Version]
- Yin, H.; Xu, L. Comparative study of PM10/PM2.5-bound PAHs in downtown Beijing, China: Concentrations, sources, and health risks. J. Clean. Prod. 2018, 177, 674–683. [Google Scholar] [CrossRef]
- Lauby-Secretan, B.; Baan, R.; Grosse, Y.; Ghissassi, F.E.; Bouvard, V.; Benbrahim-Tallaa, L.; Guha, N.; Galichet, L.; Straif, K. Bitumens and bitumen emissions, and some heterocyclic polycyclic aromatic hydrocarbons. Lancet Oncol. 2011, 12, 1190–1191. [Google Scholar] [CrossRef]
- Read, J.; Whiteoak, D.; Hunter, R.N. The Shell Bitumen Handbook; Thomas Telford Ltd.: London, UK, 2003; Available online: https://books.google.co.kr/books?hl=ko&lr=&id=bA1tIkRJL8kC&oi=fnd&pg=PA1&ots=pdVeGjBUWW&sig=Zbi2e5cNDmiqlQyRyVemjDpwIjY&redir_esc=y#v=onepage&q&f=false (accessed on 4 September 2003).
- Mo, S.; Wang, Y.; Xiong, F.; Ai, C.; Wang, D.; Tan, G.Y.A. Changes of asphalt fumes in hot-mix asphalt pavement recycling. J. Clean. Prod. 2020, 258, 120586. [Google Scholar] [CrossRef]
- Mo, S.; Wang, Y.; Xiong, F.; Ai, C. Effects of asphalt source and mixing temperature on the generated asphalt fumes. J. Hazard. Mater. 2019, 371, 342–351. [Google Scholar] [CrossRef]
- Randem, B.G.; Langård, S.; Dale, I.; Kongerud, J.; Martinsen, J.I.; Andersen, A. Cancer incidence among male Norwegian asphalt workers. Am. J. Ind. Med. 2003, 43, 88–95. [Google Scholar] [CrossRef]
- Kauppinen, T.; Heikkilä, P.; Partanen, T.; Virtanen, S.V.; Pukkala, E.; Ylöstalo, P.; Burstyn, I.; Ferro, G.; Boffetta, P. Mortality and cancer incidence of workers in Finnish road paving companies. Am. J. Ind. Med. 2003, 43, 49–57. [Google Scholar] [CrossRef]
- McClean, M.D.; Rinehart, R.D.; Ngo, L.; Eisen, E.A.; Kelsey, K.T.; Herrick, R.F. Inhalation and Dermal Exposure among Asphalt Paving Workers. Ann. Occup. Hyg. 2004, 48, 663–671. [Google Scholar] [CrossRef]
- Sobus, J.R.; McClean, M.D.; Herrick, R.F.; Waidyanatha, S.; Nylander-French, L.A.; Kupper, L.L.; Rappaport, S.M. Comparing Urinary Biomarkers of Airborne and Dermal Exposure to Polycyclic Aromatic Compounds in Asphalt-Exposed Workers. Ann. Occup. Hyg. 2009, 53, 561–571. [Google Scholar] [CrossRef] [PubMed] [Green Version]
- IARC International Agency for Research on Cancer: Occupational Exposures to Bitumens and Their Emissions. 2016. Available online: https://www.iarc.fr/en/mediaentre/iarcnews/pdf/IARC_Bitumen_Eng.pdf (accessed on 21 December 2016).
- Rubio, M.d.C.; Moreno, F.; Martínez-Echevarría, M.J.; Martínez, G.; Vázquez, J.M. Comparative analysis of emissions from the manufacture and use of hot and half-warm mix asphalt. J. Clean. Prod. 2013, 41, 1–6. [Google Scholar] [CrossRef]
- Cui, P.Q.; Wu, S.P.; Xiao, Y.; Zhang, H.H. Experimental study on the reduction of fumes emissions in asphalt by different additives. Mater. Res. Innov. 2015, 19, S1-158–S1-161. [Google Scholar] [CrossRef]
- Bae, M.-S.; Lee, T.; Schauer, J.J.; Park, G.; Son, Y.-B.; Kim, K.-H.; Cho, S.-S.; Park, S.S.; Park, K.; Shon, Z.-H. Chemical Characteristics of Size-Resolved Aerosols in Coastal Areas during KORUS-AQ Campaign; Comparison of Ion Neutralization Model. Asia-Pac. J. Atmos. Sci. 2019, 55, 387–399. [Google Scholar] [CrossRef]
- Bae, M.-S.; Schwab, J.J.; Park, D.-J.; Shon, Z.-H.; Kim, K.-H. Carbonaceous aerosol in ambient air: Parallel measurements between water cyclone and carbon analyzer. Particuology 2019, 44, 153–158. [Google Scholar] [CrossRef]
- Park, I.K. Another ‘Cancer Village’ Anger! “14 People with Cancer Only in 50 Residents”, Hankyoreh Newspaper, 2019-11-29. Available online: http://www.hani.co.kr/arti/area/honam/918960.html#csidxe6aa9364041d26a909150e80a768281 (accessed on 29 November 2019).
- Kim, J.E. One-Fifth of the Population in 15 Years Has Cancer… Namwon Naegi Village Mystery, Choun Newspaper, 2016-10-21. Available online: http://news.chosun.com/site/data/html_dir/2016/10/21/2016102100246.html (accessed on 21 October 2016).
- Song, M.; Park, C.; Choi, W.; Park, M.; Lee, K.; Park, K.; Park, S.; Bae, M.-S. Organic Molecular Marker from Regional Biomass Burning—Direct Application to Source Apportionment Model. Appl. Sci. 2020, 10, 4449. [Google Scholar] [CrossRef]
- Bae, M.-S.; Skiles, M.J.; Lai, A.M.; Olson, M.R.; de Foy, B.; Schauer, J.J. Assessment of forest fire impacts on carbonaceous aerosols using complementary molecular marker receptor models at two urban locations in California’s San Joaquin Valley. Environ. Pollut. 2019, 246, 274–283. [Google Scholar] [CrossRef] [PubMed]
- Hussar, E.; Richards, S.; Lin, Z.-Q.; Dixon, R.P.; Johnson, K.A. Human Health Risk Assessment of 16 Priority Polycyclic Aromatic Hydrocarbons in Soils of Chattanooga, Tennessee, USA. Water Air Soil Pollut. 2012, 223, 5535–5548. [Google Scholar] [CrossRef]
- Liu, W.; Ma, L.; Abuduwaili, J.; Li, Y. Distribution, source analysis, and ecological risk assessment of polycyclic aromatic hydrocarbons in the typical topsoil of the Issyk-Kul Lake Basin. Environ. Monit. Assess. 2017, 189, 398. [Google Scholar] [CrossRef]
- Tobiszewski, M.; Namieśnik, J. PAH diagnostic ratios for the identification of pollution emission sources. Environ. Pollut. 2012, 162, 110–119. [Google Scholar] [CrossRef]
- Yunker, M.B.; Macdonald, R.W.; Vingarzan, R.; Mitchell, R.H.; Goyette, D.; Sylvestre, S. PAHs in the Fraser River basin: A critical appraisal of PAH ratios as indicators of PAH source and composition. Org. Geochem. 2002, 33, 489–515. [Google Scholar] [CrossRef]
- Akyüz, M.; Çabuk, H. Gas–particle partitioning and seasonal variation of polycyclic aromatic hydrocarbons in the atmosphere of Zonguldak, Turkey. Sci. Total Environ. 2010, 408, 5550–5558. [Google Scholar] [CrossRef] [PubMed]
- Pies, C.; Hoffmann, B.; Petrowsky, J.; Yang, Y.; Ternes, T.A.; Hofmann, T. Characterization and source identification of polycyclic aromatic hydrocarbons (PAHs) in river bank soils. Chemosphere 2008, 72, 1594–1601. [Google Scholar] [CrossRef] [PubMed]
- De La Torre-Roche, R.J.; Lee, W.-Y.; Campos-Díaz, S.I. Soil-borne polycyclic aromatic hydrocarbons in El Paso, Texas: Analysis of a potential problem in the United States/Mexico border region. J. Hazard. Mater. 2009, 163, 946–958. [Google Scholar] [CrossRef] [PubMed] [Green Version]
- Wang, Z.; Fan, A.; Tang, W.; Zhang, H.; Zhang, S. Spatial Distributions, Sources and Risks of Polycyclic Aromatic Hydrocarbons in Sediments from Ziya River System, Northern China. Bull. Environ. Contam. Toxicol. 2020. [Google Scholar] [CrossRef] [PubMed]
- Tang, W.; Shan, B.; Zhang, H.; Zhu, X.; Li, S. Heavy metal speciation, risk, and bioavailability in the sediments of rivers with different pollution sources and intensity. Environ. Sci. Pollut. Res. 2016, 23, 23630–23637. [Google Scholar] [CrossRef]
- Pinheiro, L.S.; Fernandes, P.R.N.; Cavalcante, R.M.; Nascimento, R.F.; Soares, J.B.; Soares, S.A.; Freire, J.A.K. Polycyclic aromatic hydrocarbons from asphalt binder: Extraction and characterization. J. Braz. Chem. Soc. 2009, 20, 222–228. [Google Scholar] [CrossRef] [Green Version]
- Ilechukwu Ifenna and Leo, C. Osuji., Characterisation of polycyclic aromatic hydrocarbons (PAHs) in road paving asphalt. Eur. Cheical Bull. 2013, 2, 188–190. [Google Scholar] [CrossRef]
- Gibson, N.; Stewart, R.; Rankin, E. Air quality assessment of benzo(a)pyrene from asphalt plant operation. J. Environ. Monit. 2012, 14, 233–240. [Google Scholar] [CrossRef]
- Väänänen, V.; Elovaara, E.; Nykyri, E.; Santonen, T.; Heikkilä, P. Road pavers’ occupational exposure to asphalt containing waste plastic and tall oil pitch. J. Environ. Monit. 2006, 8, 89–99. [Google Scholar] [CrossRef]
- Li, Y.; Henze, D.K.; Jack, D.; Henderson, B.H.; Kinney, P.L. Assessing public health burden associated with exposure to ambient black carbon in the United States. Sci. Total Environ. 2016, 539, 515–525. [Google Scholar] [CrossRef] [Green Version]
- Chow, J.C.; Watson, J.G.; Lowenthal, D.H.; Chen, L.-W.A.; Motallebi, N. Black and Organic Carbon Emission Inventories: Review and Application to California. J. Air Waste Manag. Assoc. 2010, 60, 497–507. [Google Scholar] [CrossRef] [PubMed]
- Sandrini, S.; Fuzzi, S.; Piazzalunga, A.; Prati, P.; Bonasoni, P.; Cavalli, F.; Bove, M.C.; Calvello, M.; Cappelletti, D.; Colombi, C.; et al. Spatial and seasonal variability of carbonaceous aerosol across Italy. Atmos. Environ. 2014, 99, 587–598. [Google Scholar] [CrossRef]
- Gentner, D.R.; Isaacman, G.; Worton, D.R.; Chan, A.W.H.; Dallmann, T.R.; Davis, L.; Liu, S.; Day, D.A.; Russell, L.M.; Wilson, K.R.; et al. Elucidating secondary organic aerosol from diesel and gasoline vehicles through detailed characterization of organic carbon emissions. Proc. Natl. Acad. Sci. USA 2012, 109, 18318. [Google Scholar] [CrossRef] [PubMed] [Green Version]
- Turpin, B.J.; Huntzicker, J.J. Identification of secondary organic aerosol episodes and quantitation of primary and secondary organic aerosol concentrations during SCAQS. Atmos. Environ. 1995, 29, 3527–3544. [Google Scholar] [CrossRef]
- Liu, B.; Bi, X.; Feng, Y.; Dai, Q.; Xiao, Z.; Li, L.; Wu, J.; Yuan, J.; Zhang, Y. Fine carbonaceous aerosol characteristics at a megacity during the Chinese Spring Festival as given by OC/EC online measurements. Atmos. Res. 2016, 181, 20–28. [Google Scholar] [CrossRef]
- Jeong, C.-H.; Hopke, P.K.; Kim, E.; Lee, D.-W. The comparison between thermal-optical transmittance elemental carbon and Aethalometer black carbon measured at multiple monitoring sites. Atmos. Environ. 2004, 38, 5193–5204. [Google Scholar] [CrossRef]
- Bae, M.-S.; Schauer, J.J.; Lee, T.; Jeong, J.-H.; Kim, Y.-K.; Ro, C.-U.; Song, S.-K.; Shon, Z.-H. Relationship between reactive oxygen species and water-soluble organic compounds: Time-resolved benzene carboxylic acids measurement in the coastal area during the KORUS-AQ campaign. Environ. Pollut. 2017, 231, 1–12. [Google Scholar] [CrossRef]
- Nisbet, I.C.T.; LaGoy, P.K. Toxic equivalency factors (TEFs) for polycyclic aromatic hydrocarbons (PAHs). Regul. Toxicol. Pharmacol. 1992, 16, 290–300. [Google Scholar] [CrossRef]
- Lodovici, M.; Venturini, M.; Marini, E.; Grechi, D.; Dolara, P. Polycyclic aromatic hydrocarbons air levels in Florence, Italy, and their correlation with other air pollutants. Chemosphere 2003, 50, 377–382. [Google Scholar] [CrossRef]
- Zhang, Y.; Zheng, H.; Zhang, L.; Zhang, Z.; Xing, X.; Qi, S. Fine particle-bound polycyclic aromatic hydrocarbons (PAHs) at an urban site of Wuhan, central China: Characteristics, potential sources and cancer risks apportionment. Environ. Pollut. 2019, 246, 319–327. [Google Scholar] [CrossRef]
- Bian, Q.; Alharbi, B.; Collett, J.; Kreidenweis, S.; Pasha, M.J. Measurements and source apportionment of particle-associated polycyclic aromatic hydrocarbons in ambient air in Riyadh, Saudi Arabia. Atmos. Environ. 2016, 137, 186–198. [Google Scholar] [CrossRef]
- Pratt, G.C.; Herbrandson, C.; Krause, M.J.; Schmitt, C.; Lippert, C.J.; McMahon, C.R.; Ellickson, K.M. Measurements of gas and particle polycyclic aromatic hydrocarbons (PAHs) in air at urban, rural and near-roadway sites. Atmos. Environ. 2018, 179, 268–278. [Google Scholar] [CrossRef]
- Zhu, J.; Hsu, C.-Y.; Chou, W.-C.; Chen, M.-J.; Chen, J.-L.; Yang, T.-T.; Wu, Y.-S.; Chen, Y.-C. PM2.5- and PM10-bound polycyclic aromatic hydrocarbons (PAHs) in the residential area near coal-fired power and steelmaking plants of Taichung City, Taiwan: In vitro-based health risk and source identification. Sci. Total Environ. 2019, 670, 439–447. [Google Scholar] [CrossRef] [PubMed]
Figure 1.
Characteristics of wind direction and wind velocity at the locations and sampling sites used in the study.
Figure 1.
Characteristics of wind direction and wind velocity at the locations and sampling sites used in the study.

Figure 2.
Time series concentrations of PAHs in PM2.5 at the sampling site.

Figure 3.
PAH cross-plots for the ratio of Anth/(Anth/Phen) vs. BaA/(BaA+Chry) and Anth/(Anth+Phen) vs. Fluo/(Fluo+Pyre).
Figure 3.
PAH cross-plots for the ratio of Anth/(Anth/Phen) vs. BaA/(BaA+Chry) and Anth/(Anth+Phen) vs. Fluo/(Fluo+Pyre).

Figure 4.
Scatter plots between PAHs.

Figure 5.
Ratios of BC, EC, and OC according to the analysis of PM2.5.

Figure 6.
Time series concentrations of OC, EC, and BC and the operational period of the asphalt mix plant.
Figure 6.
Time series concentrations of OC, EC, and BC and the operational period of the asphalt mix plant.


Table 1.
PAH concentrations in the study area and major cities in Korea.
| Unit: ng/m3 | Suburban Residential Area | BI (Background) | Seoul (Capital) | ||
|---|---|---|---|---|---|
| Overall Average | Standard Deviation | Maximum | Overall Mean | Overall Mean | |
| Phenanthrene(Phen) | 0.67 | 1.05 | 5.64 | 0.02 | 0.02 |
| Anthracene(Anth) | 0.06 | 0.08 | 0.50 | 0.00 | 0.03 |
| Fluoranthene(Fluo) | 1.33 | 1.91 | 10.59 | 0.11 | 0.18 |
| Pyrene(Pyre) | 1.09 | 1.68 | 10.13 | 0.03 | 0.10 |
| Benzo[a]anthracane(BaA) | 0.60 | 0.98 | 4.60 | 0.04 | 0.09 |
| Chrysene(Chry) | 1.85 | 2.02 | 8.16 | 0.27 | 0.43 |
| Benzo[b]fluoranthene(BbF) | 1.84 | 1.77 | 6.39 | 0.21 | 0.33 |
| Benzo[k]fluoranthene(BkF) | 0.54 | 0.51 | 2.31 | 0.14 | 0.20 |
| Benzo[e]pyrene(BeP) | 0.79 | 0.73 | 2.63 | 0.14 | 0.22 |
| Benzo[a]pyrene(BaP) | 0.37 | 0.64 | 3.11 | 0.08 | 0.13 |
| Indeno123cdpyrene(Indeno) | 1.02 | 0.95 | 3.67 | 0.16 | 0.31 |
| Dibenz[a,h]anthracane(DBA) | 0.19 | 0.18 | 0.87 | 0.01 | 0.09 |
| Benzo[g,h,i]perylene(BghiP) | 1.30 | 1.26 | 6.42 | 0.21 | 0.39 |
| ∑ | 11.65 | 1.42 | 2.52 | ||
Table 2.
Comparison of BaPTEF toxicity in the study area and in previous studies.
| Sampling Site | BaA | Chry | BbF | BkF | BaP | DBA | ∑ | |
|---|---|---|---|---|---|---|---|---|
| This study | Suburban Residential Area | 0.060 | 0.0185 | 0.184 | 0.054 | 0.37 | 0.19 | 0.8765 |
| BI (background) | 0.004 | 0.0027 | 0.021 | 0.014 | 0.08 | 0.01 | 0.1317 | |
| Seoul (Capital) | 0.009 | 0.0043 | 0.033 | 0.020 | 0.13 | 0.09 | 0.2863 | |
| Previous study | China, Wuhan | 0.149 | 0.0308 | 0.486 | 0.140 | 1.91 | 0.22 | 2.9358 |
| Saudi Arabia, Riyadh | 0.005 | 0.0005 | 0.097 | 0.068 | 3.19 | 0.00 | 3.3605 | |
| USA, Minnesota | 0.011 | 0.0019 | 0.016 | 0.007 | 0.08 | 0.20 | 0.3159 | |
| Taiwan, Taichung | 0.014 | 0.0020 | 0.005 | 0.026 | 0.24 | 0.066 | 0.353 | |
© 2020 by the authors. Licensee MDPI, Basel, Switzerland. This article is an open access article distributed under the terms and conditions of the Creative Commons Attribution (CC BY) license (http://creativecommons.org/licenses/by/4.0/).
Share and Cite
MDPI and ACS Style
Song, M.; Lee, K.; Oh, S.-H.; Bae, M.-S. Impact of Polycyclic Aromatic Hydrocarbons (PAHs) from an Asphalt Mix Plant in a Suburban Residential Area. Appl. Sci. 2020, 10, 4632. https://0-doi-org.brum.beds.ac.uk/10.3390/app10134632
AMA Style
Song M, Lee K, Oh S-H, Bae M-S. Impact of Polycyclic Aromatic Hydrocarbons (PAHs) from an Asphalt Mix Plant in a Suburban Residential Area. Applied Sciences. 2020; 10(13):4632. https://0-doi-org.brum.beds.ac.uk/10.3390/app10134632
Chicago/Turabian StyleSong, Myoungki, Kwonho Lee, Sea-Ho Oh, and Min-Suk Bae. 2020. "Impact of Polycyclic Aromatic Hydrocarbons (PAHs) from an Asphalt Mix Plant in a Suburban Residential Area" Applied Sciences 10, no. 13: 4632. https://0-doi-org.brum.beds.ac.uk/10.3390/app10134632
Note that from the first issue of 2016, this journal uses article numbers instead of page numbers. See further details here.