Article

Automated Classification of Blood Loss from Transurethral Resection of the Prostate Surgery Videos Using Deep Learning Technique

1
Institute of Biomedical Informatics, National Yang-Ming University, Taipei 11221, Taiwan
2
AI Innovation Research Center, Chang Gung University, Taoyuan 33302, Taiwan
3
Department of Mechanical Engineering, National Taiwan University, Taipei 10617, Taiwan
4
Brain Research Center, National Tsing Hua University, Hsinchu 30013, Taiwan
5
Department of Computer Science and Information Engineering, Chang Gung University, Taoyuan 33302, Taiwan
6
Division of Rheumatology, Allergy and Immunology, Chang Gung Memorial Hospital, Taoyuan 33302, Taiwan
7
Department of Computer Science and Communication Engineering, Providence University, Taichung 43301, Taiwan
8
Department of Urology, Chang Gung Memorial Hospital at linkou, Taoyuan 33302, Taiwan
9
School of Medicine, Chang Gung University, Taoyuan 33302, Taiwan
10
Graduate Institute of Clinical Medical Sciences, College of Medicine, Chang Gung University, Taoyuan 33302, Taiwan
11
Department of Computer Science and Information Engineering, Providence University, Taichung 43301, Taiwan
*
Authors to whom correspondence should be addressed.
Submission received: 23 June 2020 / Revised: 13 July 2020 / Accepted: 15 July 2020 / Published: 17 July 2020
(This article belongs to the Special Issue Computer-aided Biomedical Imaging 2020: Advances and Prospects)

Abstract

:
Transurethral resection of the prostate (TURP) is a surgical removal of obstructing prostate tissue. The total bleeding area is used to determine the performance of the TURP surgery. Although the traditional method for the detection of bleeding areas provides accurate results, it cannot detect them in time for surgery diagnosis. Moreover, it is easily disturbed to judge bleeding areas for experienced physicians because a red light pattern arising from the surgical cutting loop often appears on the images. Recently, the automatic computer-aided technique and artificial intelligence deep learning are broadly used in medical image recognition, which can effectively extract the desired features to reduce the burden of physicians and increase the accuracy of diagnosis. In this study, we integrated two state-of-the-art deep learning techniques for recognizing and extracting the red light areas arising from the cutting loop in the TURP surgery. First, the ResNet-50 model was used to recognize the red light pattern appearing in the chipped frames of the surgery videos. Then, the proposed Res-Unet model was used to segment the areas with the red light pattern and remove these areas. Finally, the hue, saturation, and value color space were used to classify the four levels of the blood loss under the circumstances of non-red light pattern images. The experiments have shown that the proposed Res-Unet model achieves higher accuracy than other segmentation algorithms in classifying the images with the red and non-red lights, and is able to extract the red light patterns and effectively remove them in the TURP surgery images. The proposed approaches presented here are capable of obtaining the level classifications of blood loss, which are helpful for physicians in diagnosis.

1. Introduction

The prostate is a special male reproductive organ that functions to produce and store seminal fluid, which provides nutrition for the sperm. Most older men have verified that their prostate gland will constantly grow bigger in size, which is known as benign prostatic hyperplasia (BPH) [1]. The quality of life of patients with BPH may be adversely affected. An enlarged prostate will lead to the blockage of the bladder outlet and prostatic channel. This condition may cause some urination issues. If patients consistently ignore these problems, they may experience urinary retention, bladder stones, recurrent urinary infections, and eventually obstructive kidney damage [2]. Those with obstructive prostate symptoms can optionally select the transurethral resection of the prostate (TURP) as treatment. TURP is an appropriate surgical treatment of BPH [3]. An effective surgical treatment can prevent the necessity for indwelling or intermittent catheterization in the future [4,5]. TURP is a general surgery that utilizes a transurethral operation to remove obstructing prostate tissue, which can facilitate improved voiding function [6]. To expand the prostatic channel, urologists use a high-frequency electrical current via a cutting loop to shave away extra prostate tissue. Bleeding during the TURP surgery is inevitable. The present method in estimating the blood loss during surgery uses the bladder driven by a handheld pump to evacuate the extra prostate tissue for laboratory analysis. All the blood loss could be accurately measured by the photometry of blood concentrations because of the dispersing of blood loss throughout the hemolysis irrigating fluid [7,8]. The estimated blood loss is commonly used to evaluate the surgical performance. Although the photometry of blood concentrations provides highly accurate results, the high-quality trials of procedures involve an extended period of testing time. As an additional approach, urologists estimate the amount of bleeding according to their experience and what they see in surgical procedures. They may consider whether or not to continue the surgery if severe blood loss occurs. It is significant to immediately provide feedback about the exact amount of bleeding. BPH-related investigations mainly focus on the discussion of calculating the prostate volume by ultrasound images [9,10], comparing the differences between TURP and transurethral laser treatment [11,12], and detecting and classifying prostate cancer [13]. However, detecting the blood volume is rarely discussed. Thus, this study aims to calculate the blood volume of the extra prostate tissue based on the TURP surgery, which provides an accurate estimation of blood loss.
Computer-aided detection (CAD) plays a significant role in analyzing medical imaging that provides a useful tool for doctors to evaluate and immediately make decisions [14]. A resectoscope video of the CAD system has gained wide attention in the field of the detection of polyps [15], bleeding [16], tumors [17], and colon cancer [18], in which CAD is becoming a popular analysis tool. The main purpose of the CAD system is to search abnormalities in patients’ bodies. It is a technique that involves numerous elements such as computer vision, medical image processing, and artificial intelligence. However, a resectoscope video usually contains approximately 5000 images, which makes it difficult for medical clinicians to examine and diagnose. It also takes them more than 2 h to analyze. Although the CAD approach is a useful tool to help clinicians in making a diagnosis, there is currently no standard for the interpretation and classification of a resectoscope image.
Recently, the popular deep convolutional neural network models such as AlexNet [19], GoogleNet [20], VGGNet [21], Fully Convolutional Network (FCN) [22], ResidualNet [23], DenseNet [24], and U-Net [25] have gained state-of-the-art performance enhancement on computer vision tasks such as classification, segmentation, and object detection. In the segmentation method, the tested image is basically segmented into several regions with similar features. The objectives of segmentation in a medical image are usually to analyze an anatomical structure, locate the texture region of interest, and measure the tissue volume [26]. Several researchers applied deep learning-based segmentation to extract the medical images of the prostate [27], lung [28], skin cancer [28], brain [29], and pancreas [30]. F. Milletari et al. proposed the Convolutional Neural Network (CNN) model in predicting 3D image segmentation for the whole prostate volume [27]. M. Z. Alom et al. [28] used the RU-Net and R2U-Net models, which take advantage of the U-Net, Residual Network, and RCNN model features, and successfully tested them for the segmentation of the blood vessel in retinal images, skin cancer, and lung lesion. Mohammad et al. [29] presented a fully connected CNN model in a brain tumor segmentation. H. R. Roth et al. [30] applied the ConvNet model for pancreas segmentation, and the results showed that the superpixels can be classified into the pancreas and non-pancreas types. Image semantic segmentation methods have been used in the precision agriculture. F. P. Jorge et al. [31] utilized a deep convolutional network with an encoder-decoder in fig plant segmentation, which classified each pixel as a crop or non-crop of the raw images, and the experimental results showed a mean accuracy of 93.85%. M. Andres et al. [32] designed the network architecture of combining the Segnet and Enet to separate sugar beet plants, weeds, and background images. Presently, deep learning-based classification and segmentation have proven to be superior in decision making applied to the understanding of some certain medical images by a professional. As for the deep learning-based classification task, the main purpose is to automatically divide medical images into different groups, which is beneficial for doctors to provide effective diagnosis. The deep learning models are widely applied in medical area studies, including tumor classification [33] and breast cancer detection [34]. H. Mohsen et al. [33] utilized a deep neural network classifier, discrete wavelet transform, and principal component analysis to classify 66 brain MRIs into four tumor types. C. R. Angel et al. [34] used the ConvNet classifier to detect different types of invasive breast cancer for the whole slide digitized pathology images. In view of the aforementioned studies, the classification and segmentation approaches can effectively assist resectoscope image detection. In [35], Wang et al. proposed a multi-network model which used the pre-trained ResNet-50 model to extract features and trained an E-SVM model to classify the breast cancer images into benign, in situ carcinomas, invasive carcinomas, and normal. Y. Zhou et al. [36] proposed the residual neural networks with DST-ResNet and EDST-ResNet to automatically detect and grade the cataract. S. Guo et al. [37] proposed a multi-channel ResNet framework, which combined multiple ResNets models, to classify four types of skin diseases. According to the above literatures, the ResNet50 model has been applied in medical image classification applications successfully.
As bleeding is the most common phenomenon in the TURP surgery, this investigation mainly focuses on bleeding detection. For the overview of the literature research [38], the color spaces of RGB and hue, saturation, and value (HSV) are the main approaches used to detect the bleeding region. In an RGB image, each pixel was valued by three 8-bit numbers corresponding to the red, green, and blue planes. The bleeding image was represented by the pixel characteristics of the red color component in the RGB color space. In [39], researchers used the variation of pixel intensities in the RGB color planes to detect the bleeding image. The statistical parameters of mean, mode, maximum, minimum, skewness, median, variance, and kurtosis were used to extract the bleeding characteristics of the R and G intensity planes [40]. S. Sonu et al. [41] proposed an algorithm of extracting color features from the first-order histogram of the RGB planes. Because the characteristic color of blood belongs to the red plane, the RGB color-based method is widely applied in bleeding detection. However, the RGB method only involves the color information, not the color intensity and saturation, resulting in difficulty to individually analyze the RGB color. In the HSV color space, three components, that is, hue, saturation, and intensity, are used to separately represent the identification color, color purity, and light intensity, which solves the problem of RGB color space. Moreover, the HSV color space is more appropriate for classification and description [42]; thus, several researchers applied the HSV color space analysis method to bleeding detection. C. Dilna et al. [43] utilized the histogram analysis of the mean and variance in the HSV color space to detect the wireless capsule endoscopy bleeding images. G. Tonmoy et al. [38] used the RGB, normalized RGB, HSV, Lab, and YIQ color planes to extract the bleeding region and applied the semantic segmentation approach to detect the bleeding zone in capsule endoscopy images. The result has shown that the HSV color space achieved the higher performance in extracting the bleeding features. Another reason why several researchers used the HSV color space is because of the high saturation value of bleeding images. Given the previous discussion, this study applied the HSV approach to detect the bleeding of the extra prostate tissue. However, a red light, which has the same color as blood, arising from the cutting loop tool would greatly affect the detection in processing bleeding images. It was difficult to distinguish the bleeding color from the red light color of the cutting loop. Thus, the ResNet-50 model was used to classify red light and non-red light images of the cutting loop. Furthermore, the HSV color plane was used to detect and calculate the bleeding areas in the TURP surgery. This paper is organized as follows: Section 2 introduces the methods of bleeding volume detection. Section 3 discusses the detailed experimental results with a comparison of the three classical segmentation algorithms, U-Net, Autoencoder and Segnet models. Section 4 concludes this article.

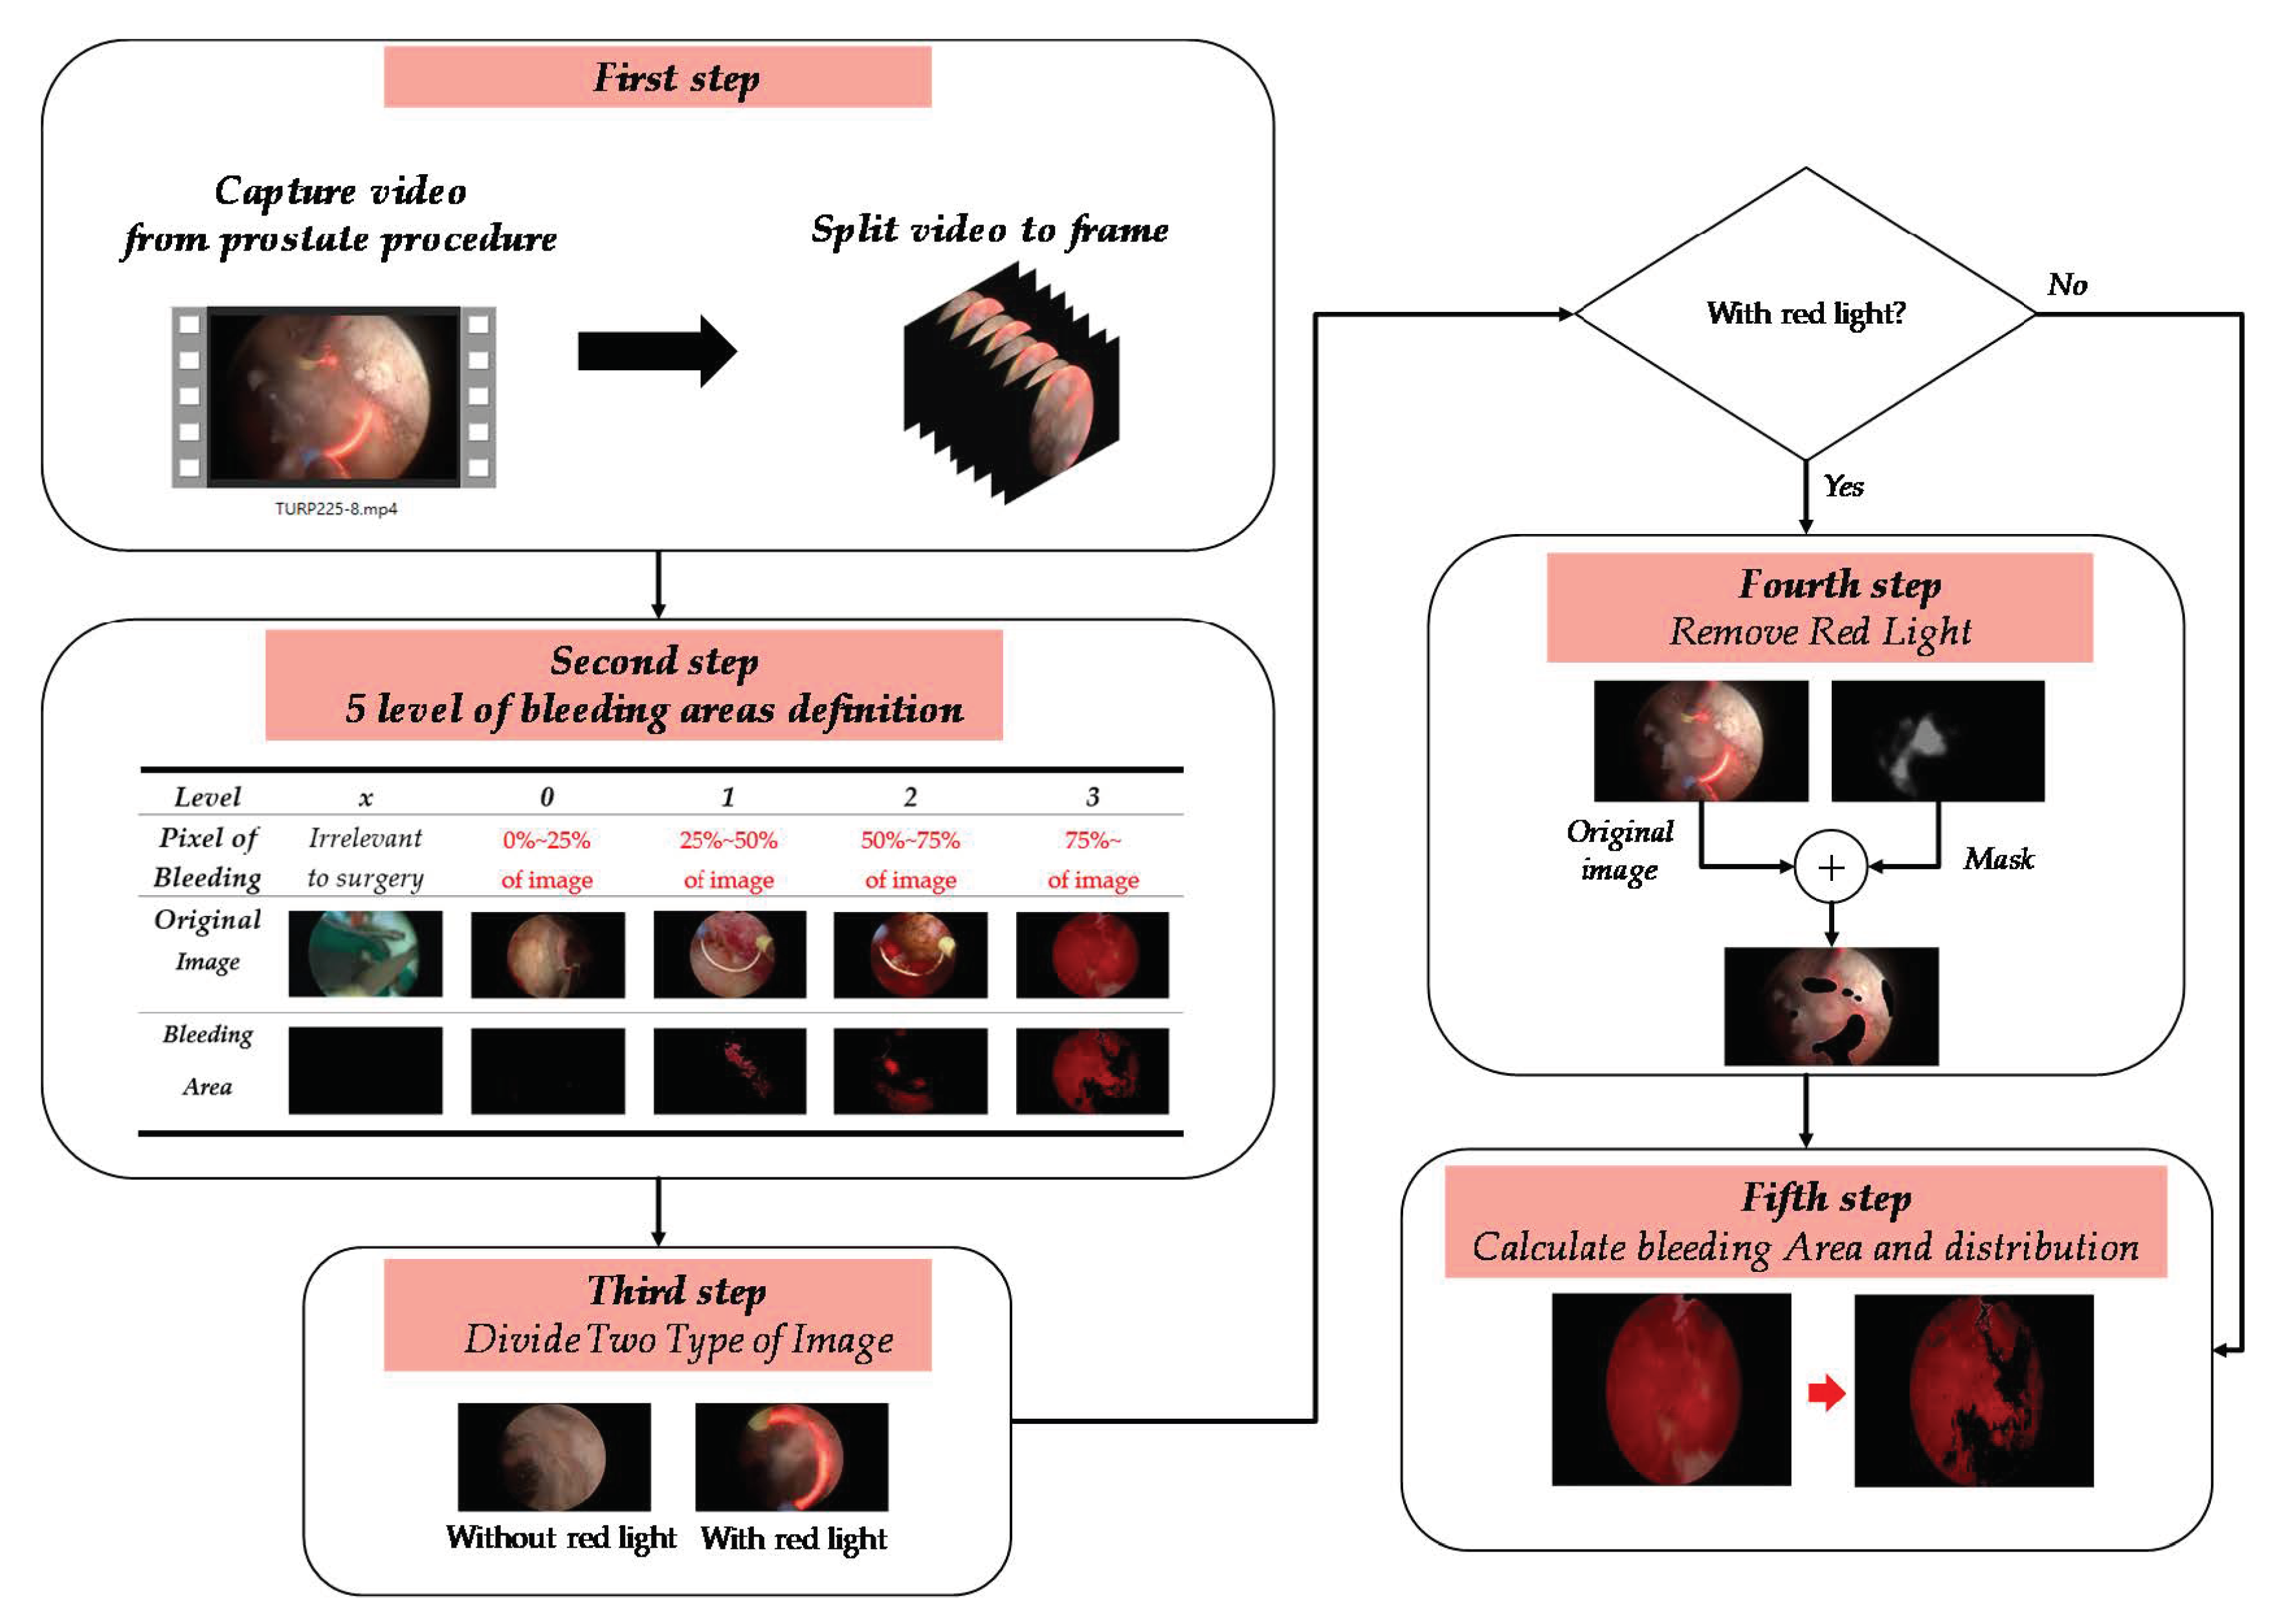
2. Materials and Methods

Automatic image analysis provides a helpful tool to support the clinician and speed up the detection process. Thus, an automatic computer-aided technique has been increasingly used to reduce the burden on physicians. In this study, we utilized the deep learning techniques, instead of the traditional method, to automatically classify bleeding regions. The proposed flowchart is shown in Figure 1. The prepared work included five stages. In the first stage, the captured color videos from the TURP surgery were split into 26,025 frames for analysis. In the second stage, the indicator of the four levels of bleeding areas was defined by a pixel area ratio for the classification of blood loss. It is complex for experienced physicians to determine the color space between blood and red light. Therefore, this study integrated two deep learning models to automatically solve this problem. In the third stage, because it required a detection time to filter the red light image pattern, we utilized the ResNet-50 model to recognize the red light pattern appearing in the framed images of surgery. In the fourth stage, the extraction and removal of the areas with the red light pattern were implemented using the U-Net model. In the fifth stage, the HSV color space was used to effectively detect the bleeding area.

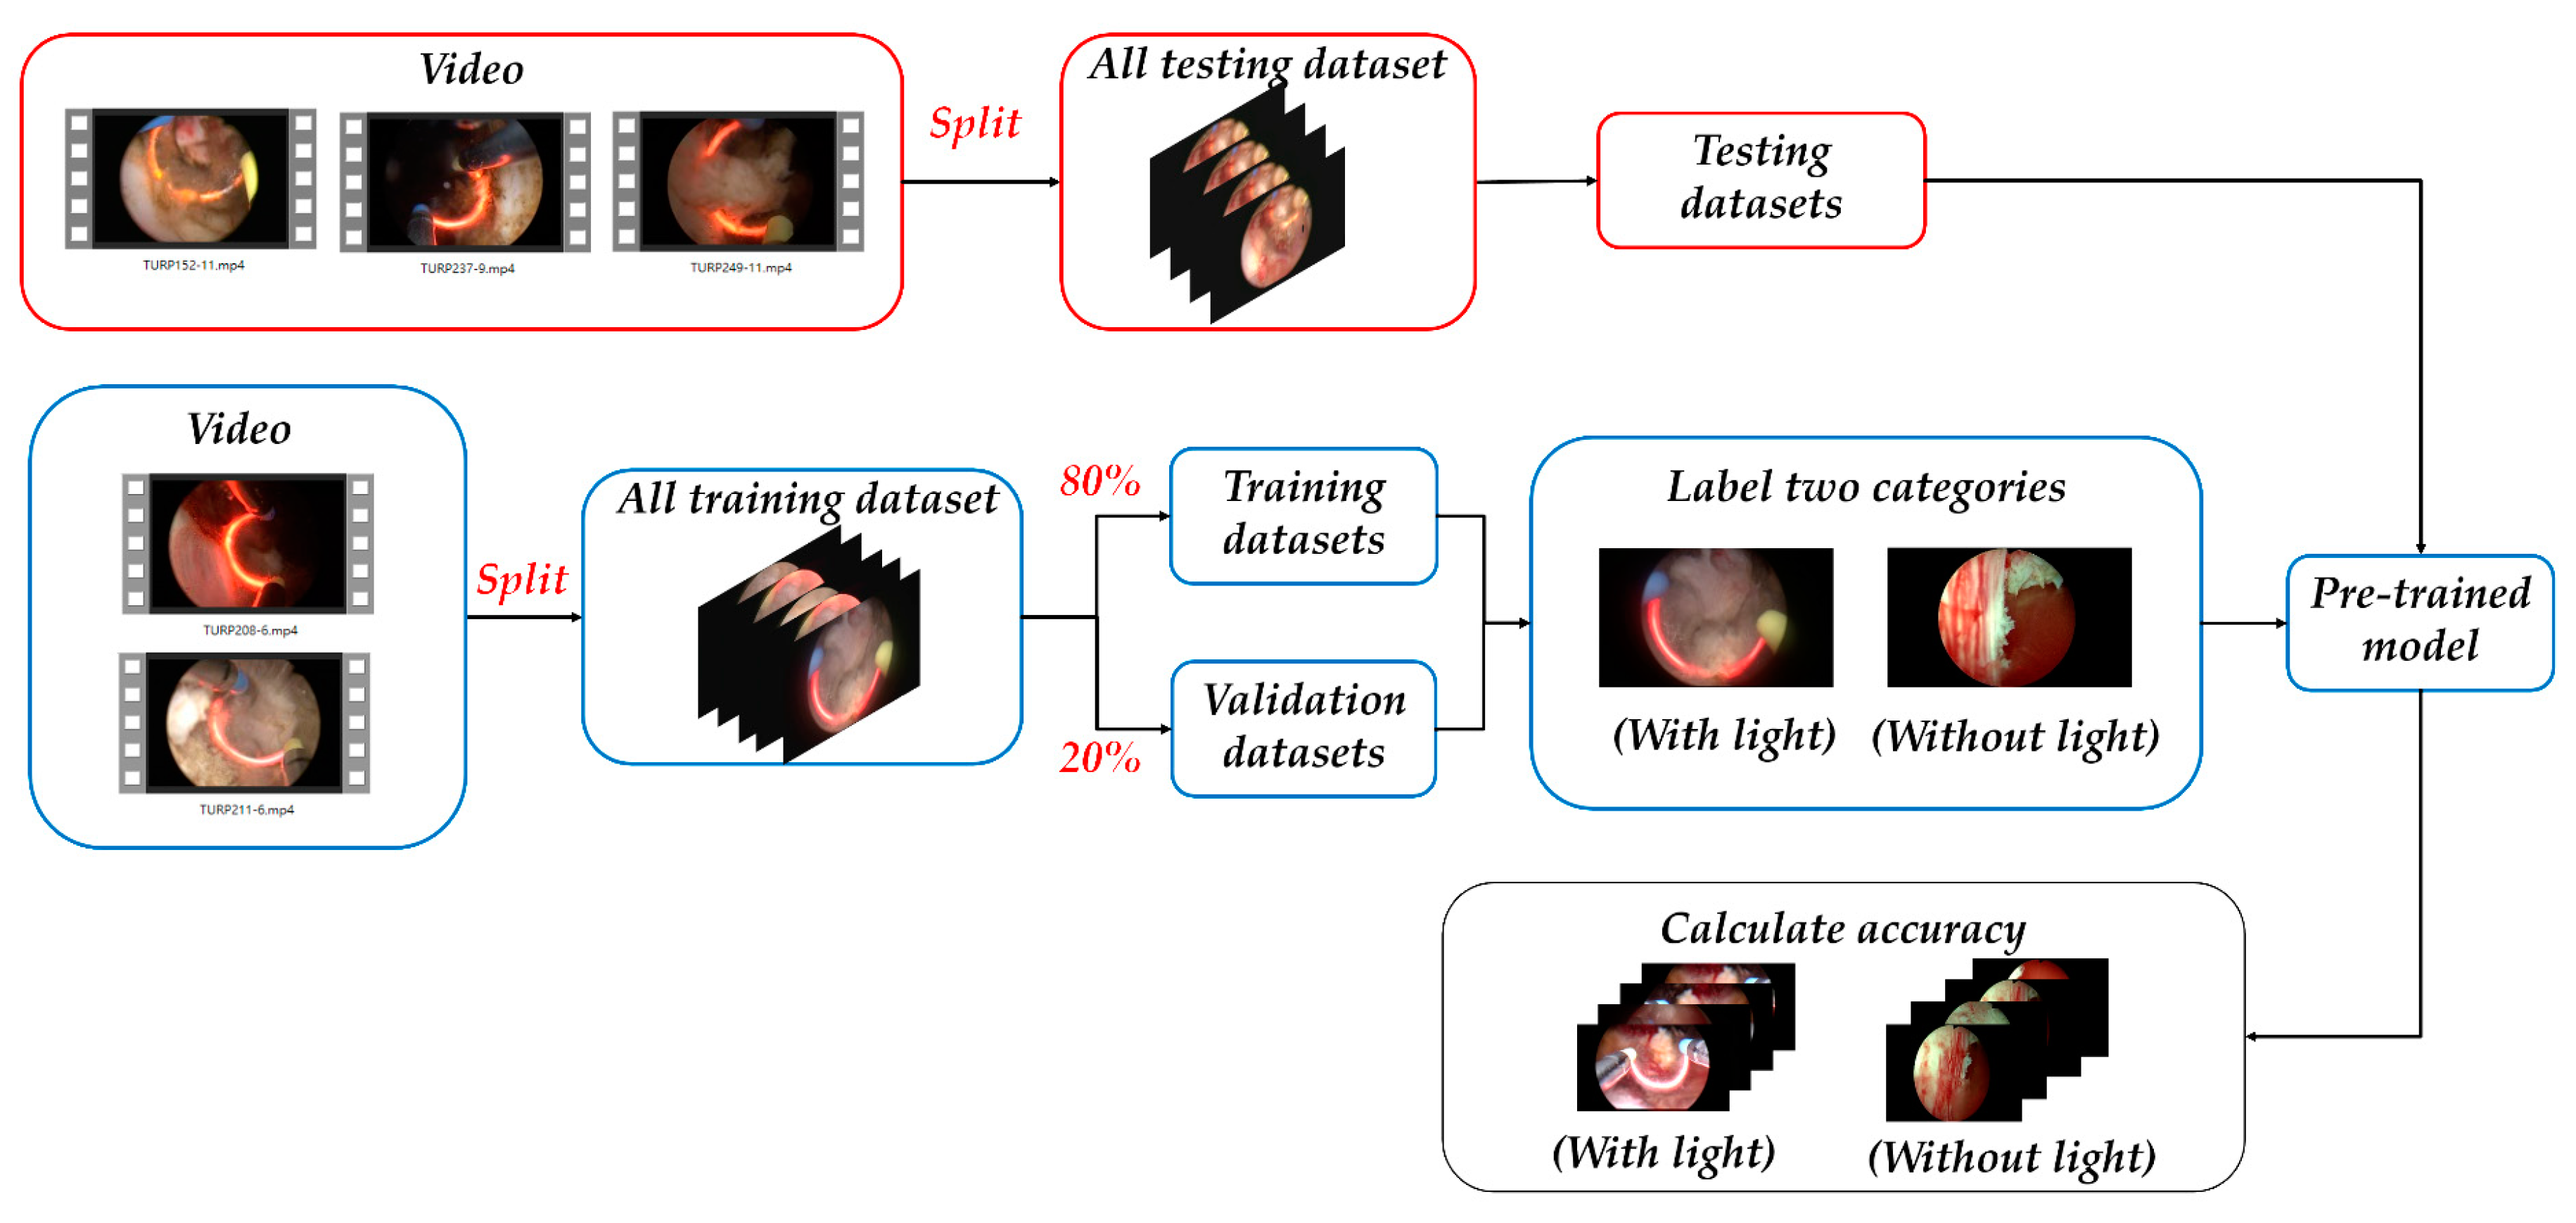
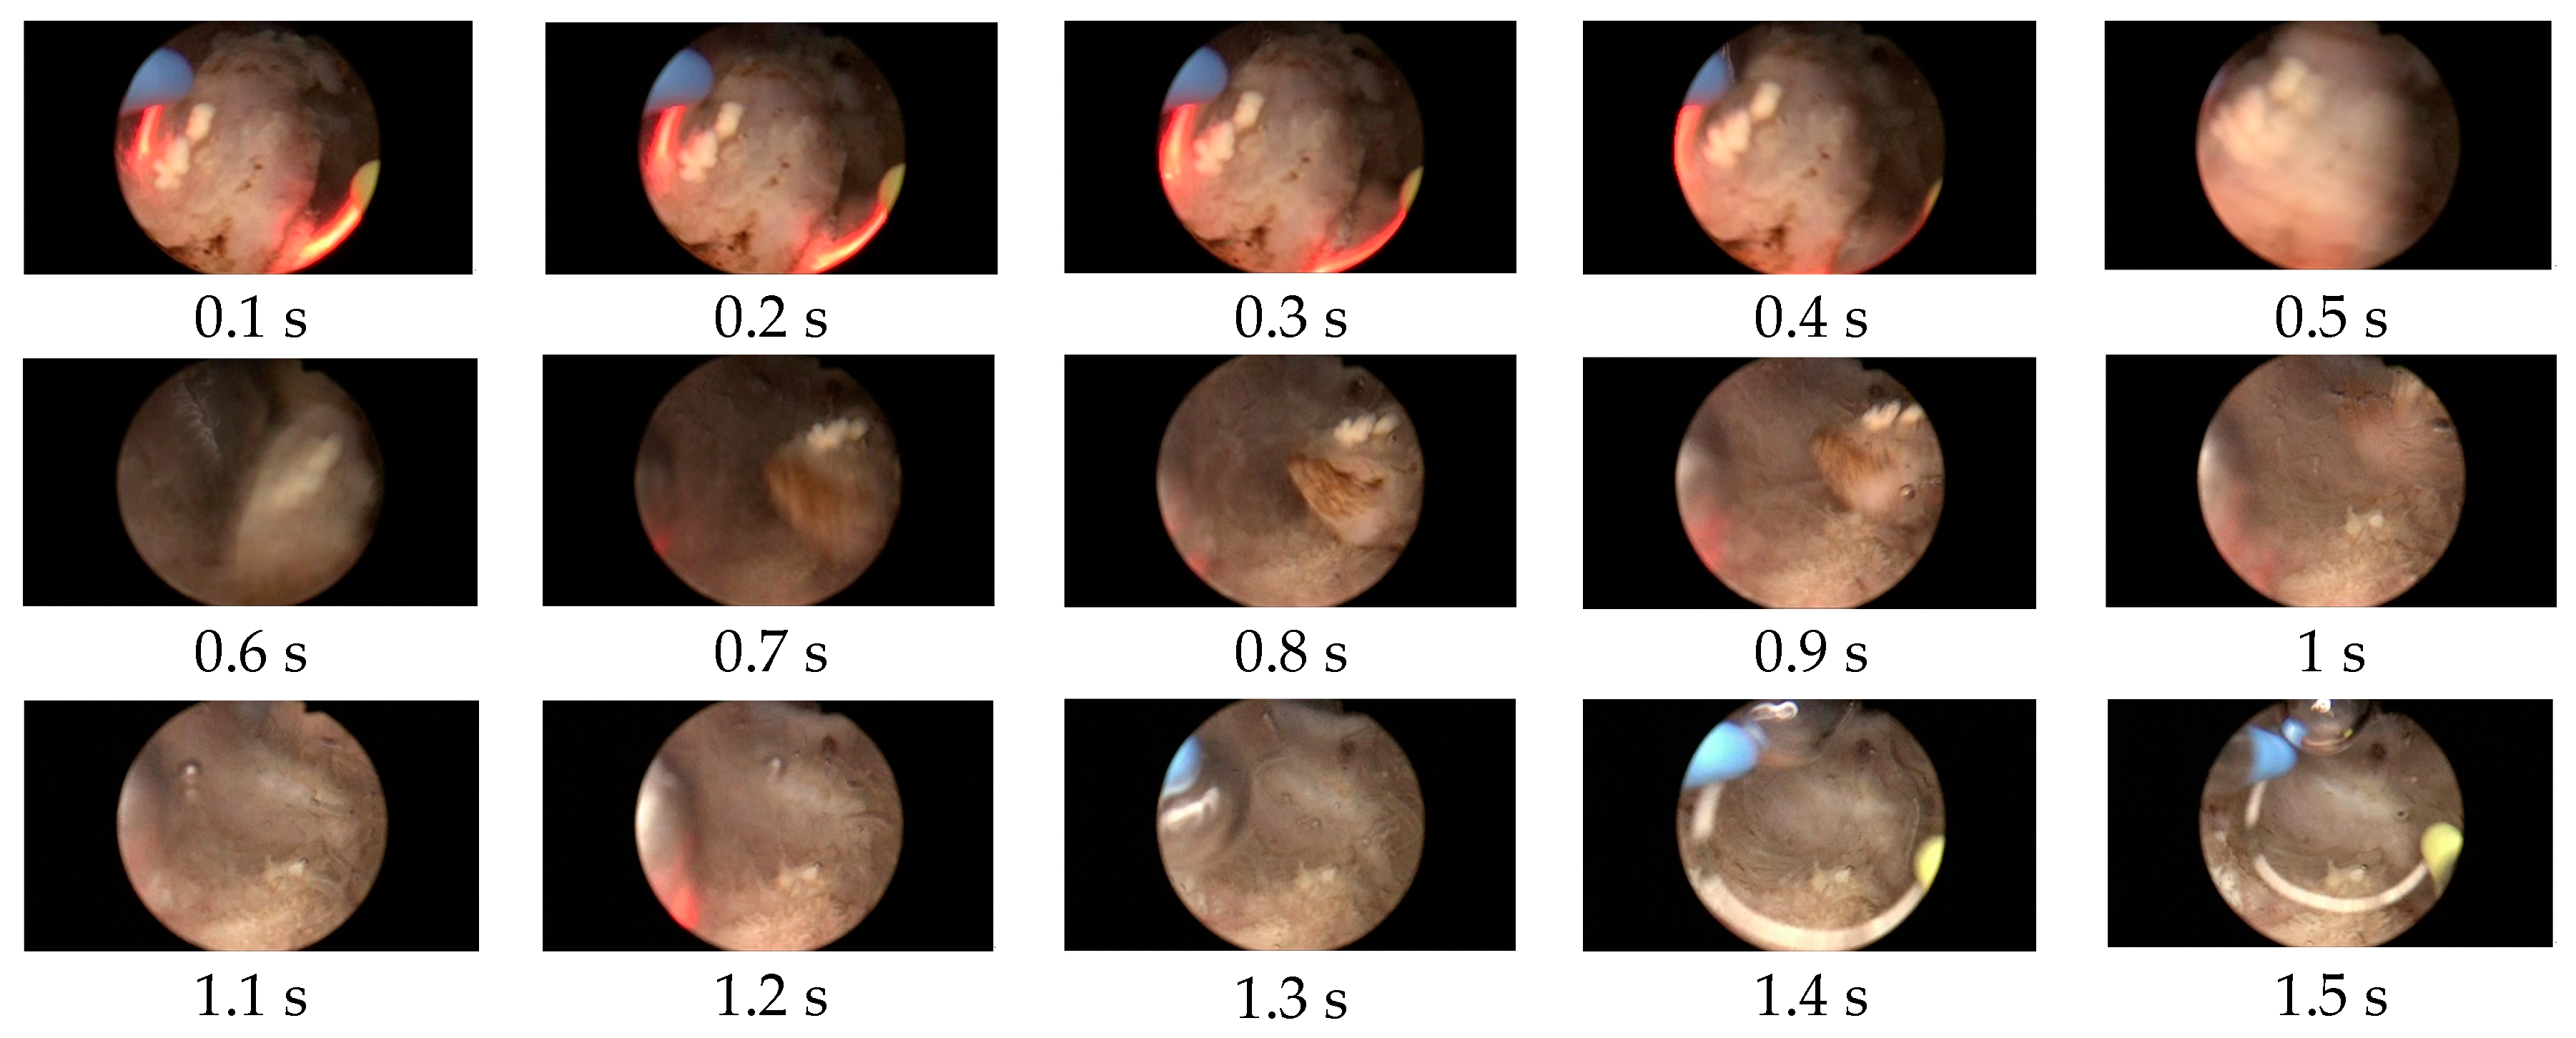
2.1. Detection of the Appearance of the Red Light Images Using the ResNet-50 Model

This study utilized the ResNet-50 model [23] to recognize the red light pattern appearing in the framed images of surgery. Figure 2 shows the red and non-red light images appearing in the TURP surgery. It should recognize the red color region of the blood and red light emitted from the cutting loop for diagnosis. This study classified the image with the red and non-red lights in advance, using the ResNet-50 model for further analysis and then removed it. The CNN architectures of the deep learning classification models including ResNet-50, AlexNet, and GoogleNet are popular and widely used in medical images because of their excellent performance in extracting features [44]. In the present study, we chose the pretrained ResNet-50 model that is based on the convolution neural network as the feature extractor for our network model. The overall descriptions of the classification steps are shown in Figure 3. First, we labeled the prostate surgery images into two categories: images with the red and non-red lights. The training dataset included 10,410 images extracted from the surgical clips for the training process and was divided into the training and validation sets using 80–20 split to classify the images with the red and non-red lights. To evaluate the trained model, 5000 images extracted from the surgical clips that were not included in the training dataset were used to test the classification performance of the ResNet-50 model. The network structures are listed in Table 1. The ResNet-50 model was composed of four blocks and one fully connector. The hyperparameters of the ResNet-50 model were set as 50 epochs, 0.00001 learning rate, cross entropy of loss function, and Adam optimizer.

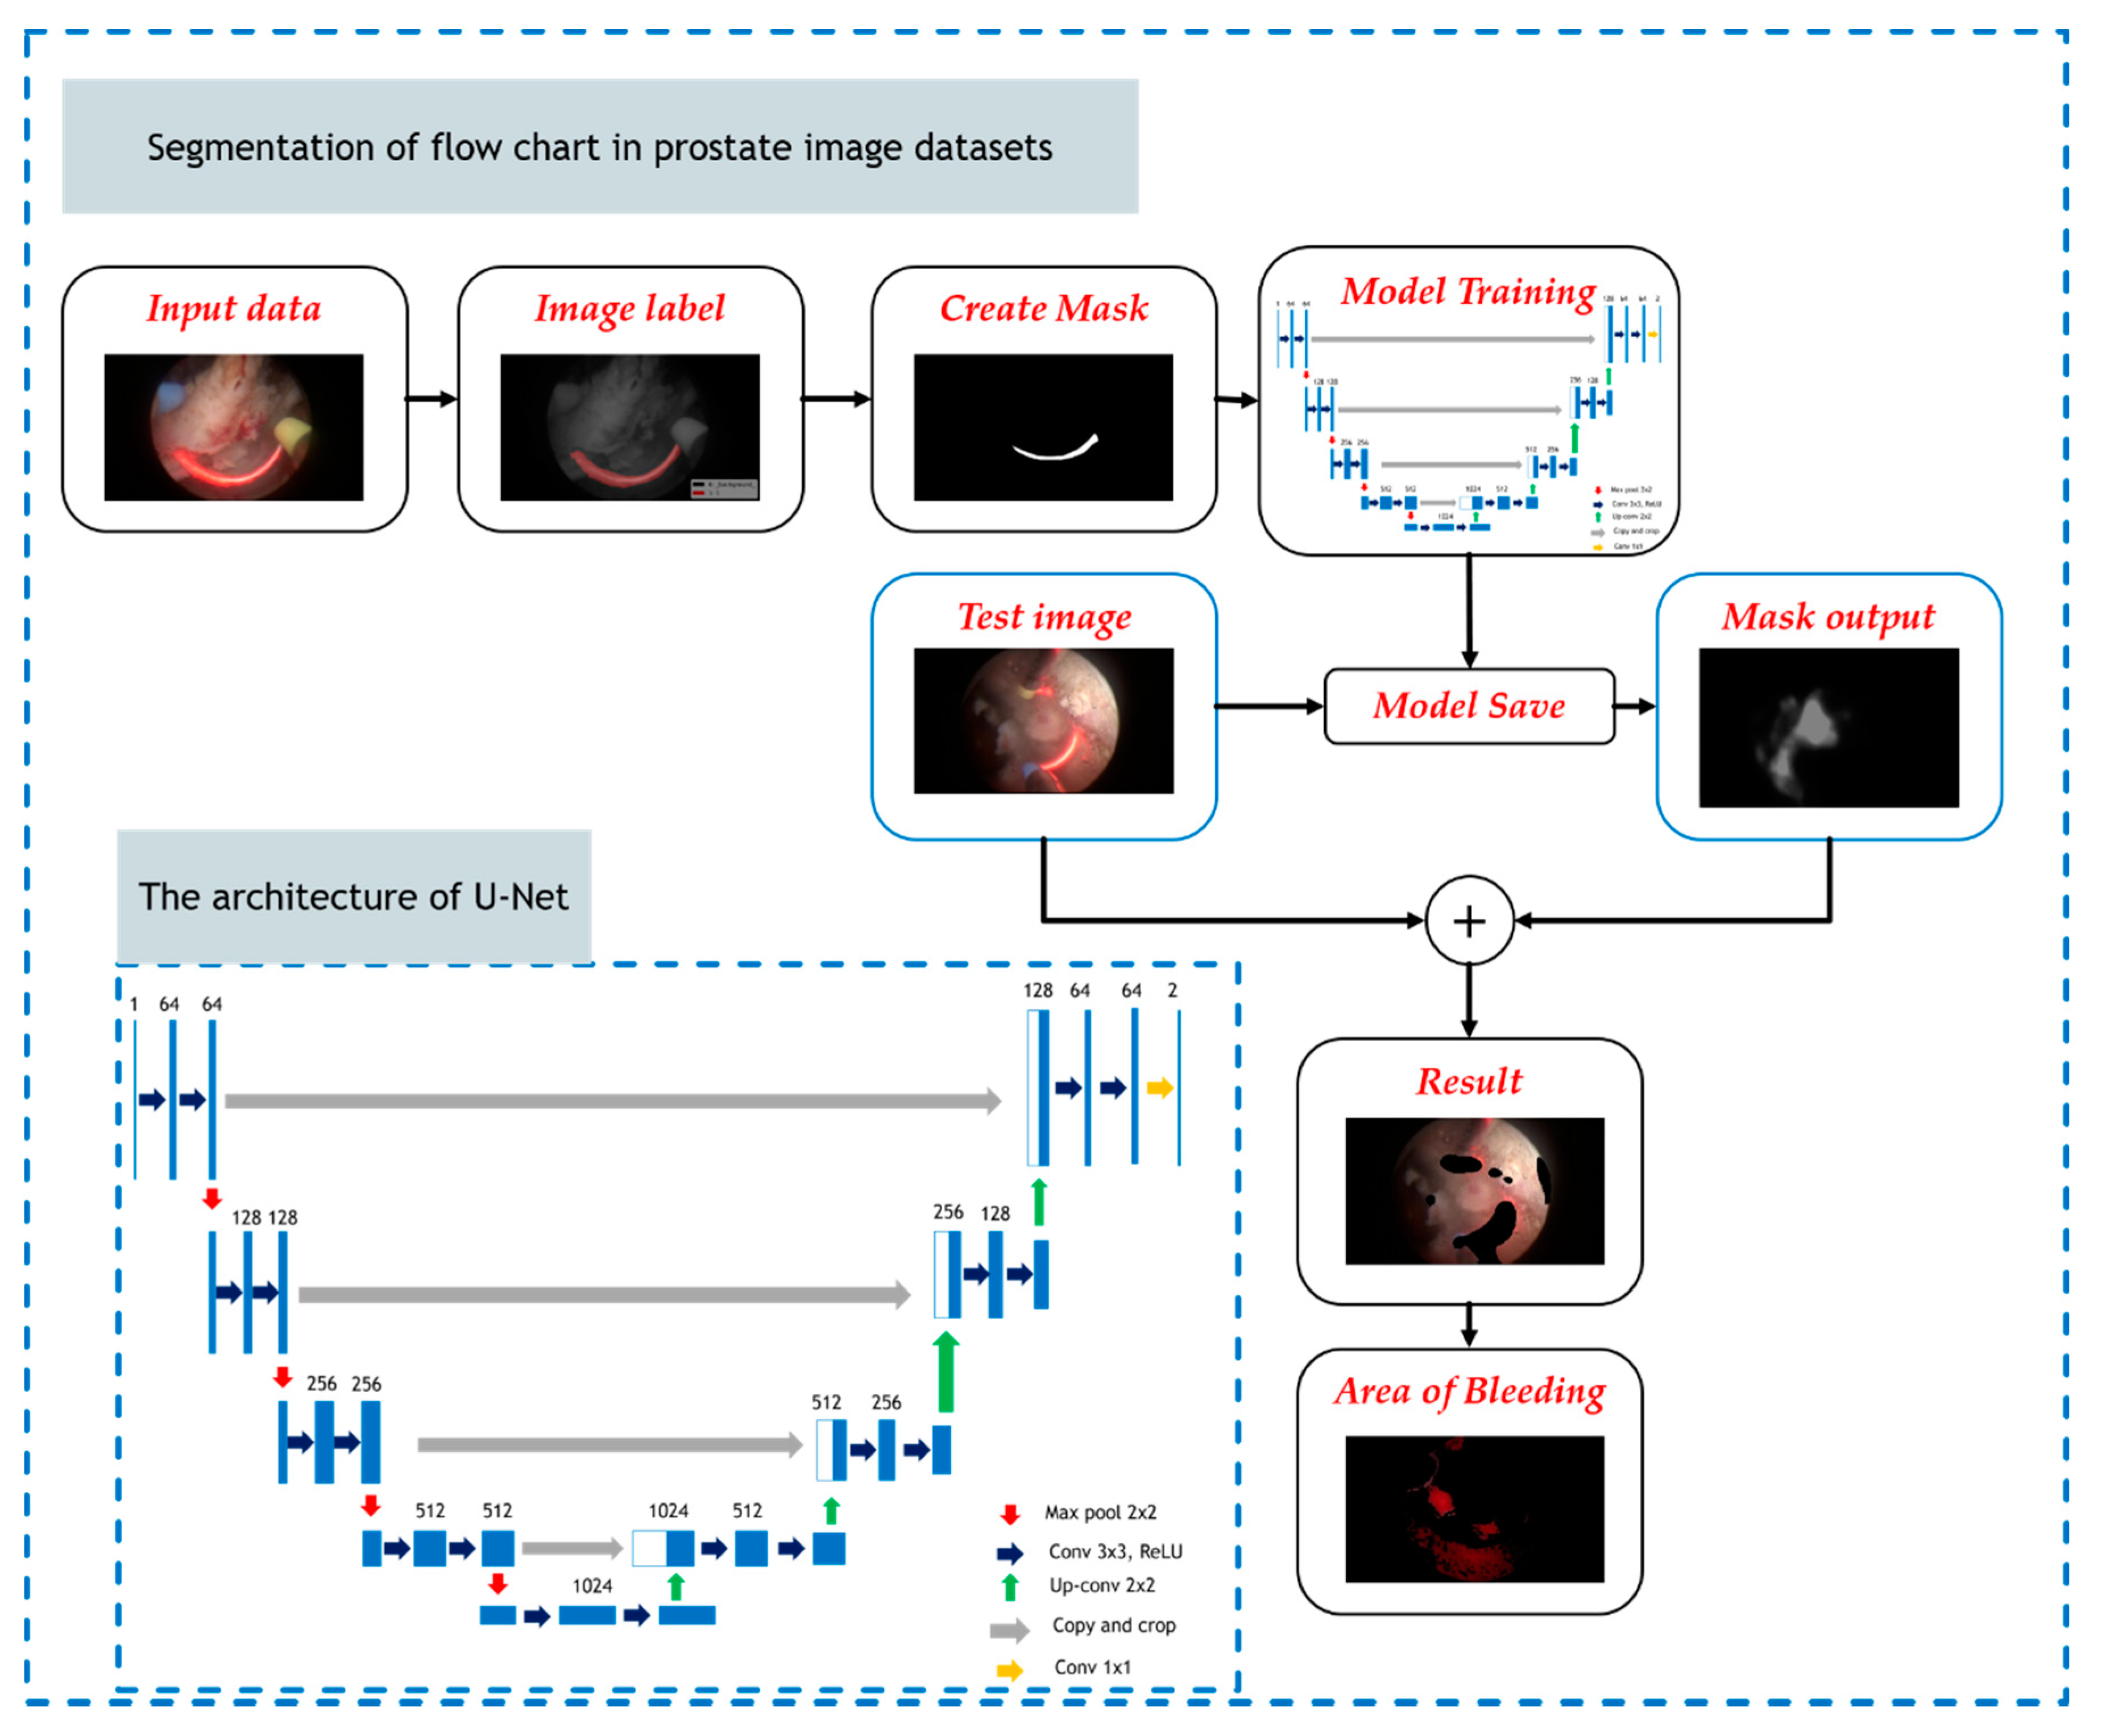
2.2. Extract Features of the Red Light Using the U-Net Model

The TURP surgery is composed of the bleeding areas and the cutting loop tool with the red light, leading to the complex problem of texture image analysis. Figure 4(a1–a3) shows the schematic diagram of the original images with the bleeding areas and red light pattern. The red light pattern could not completely disappear from the bleeding background by directly using the convectional HSV color space analysis method. As illustrated in Figure 4(b1–b3), the extracted red color region still preserved the red light pattern marked by blue dashed circle lines. It was necessary to prevent this problem to increase the accuracy of blood loss estimation. The deep learning architecture of U-Net, with its superior performance of segmentation without large datasets, becomes the most widely used application in medical image analysis [45]. This study used the U-Net deep learning model with the segmentation capability to filter the red light pattern emitted from the cutting loop tool. In this study, we only used approximately 80 images as the trained datasets. The overall processes of the segmentation flowchart and the architecture of the U-Net model are shown in Figure 5. The segmentation method proposed by the U-Net model consisted of two stages: training and testing. In the training stage, the segmentation network prepared labeled images as input images, and outputs were the corresponding probability map. The structures of U-Net were composed of the sigmoid function and the loss function of binary cross entropy. The loss errors were calculated and minimized for optimization based on these outputs of the segmentation network and optimized after 10 epochs in the training stage. To predict the masking of unseen examples, this study combined the tested and predicted masking images to obtain the non-red light images.

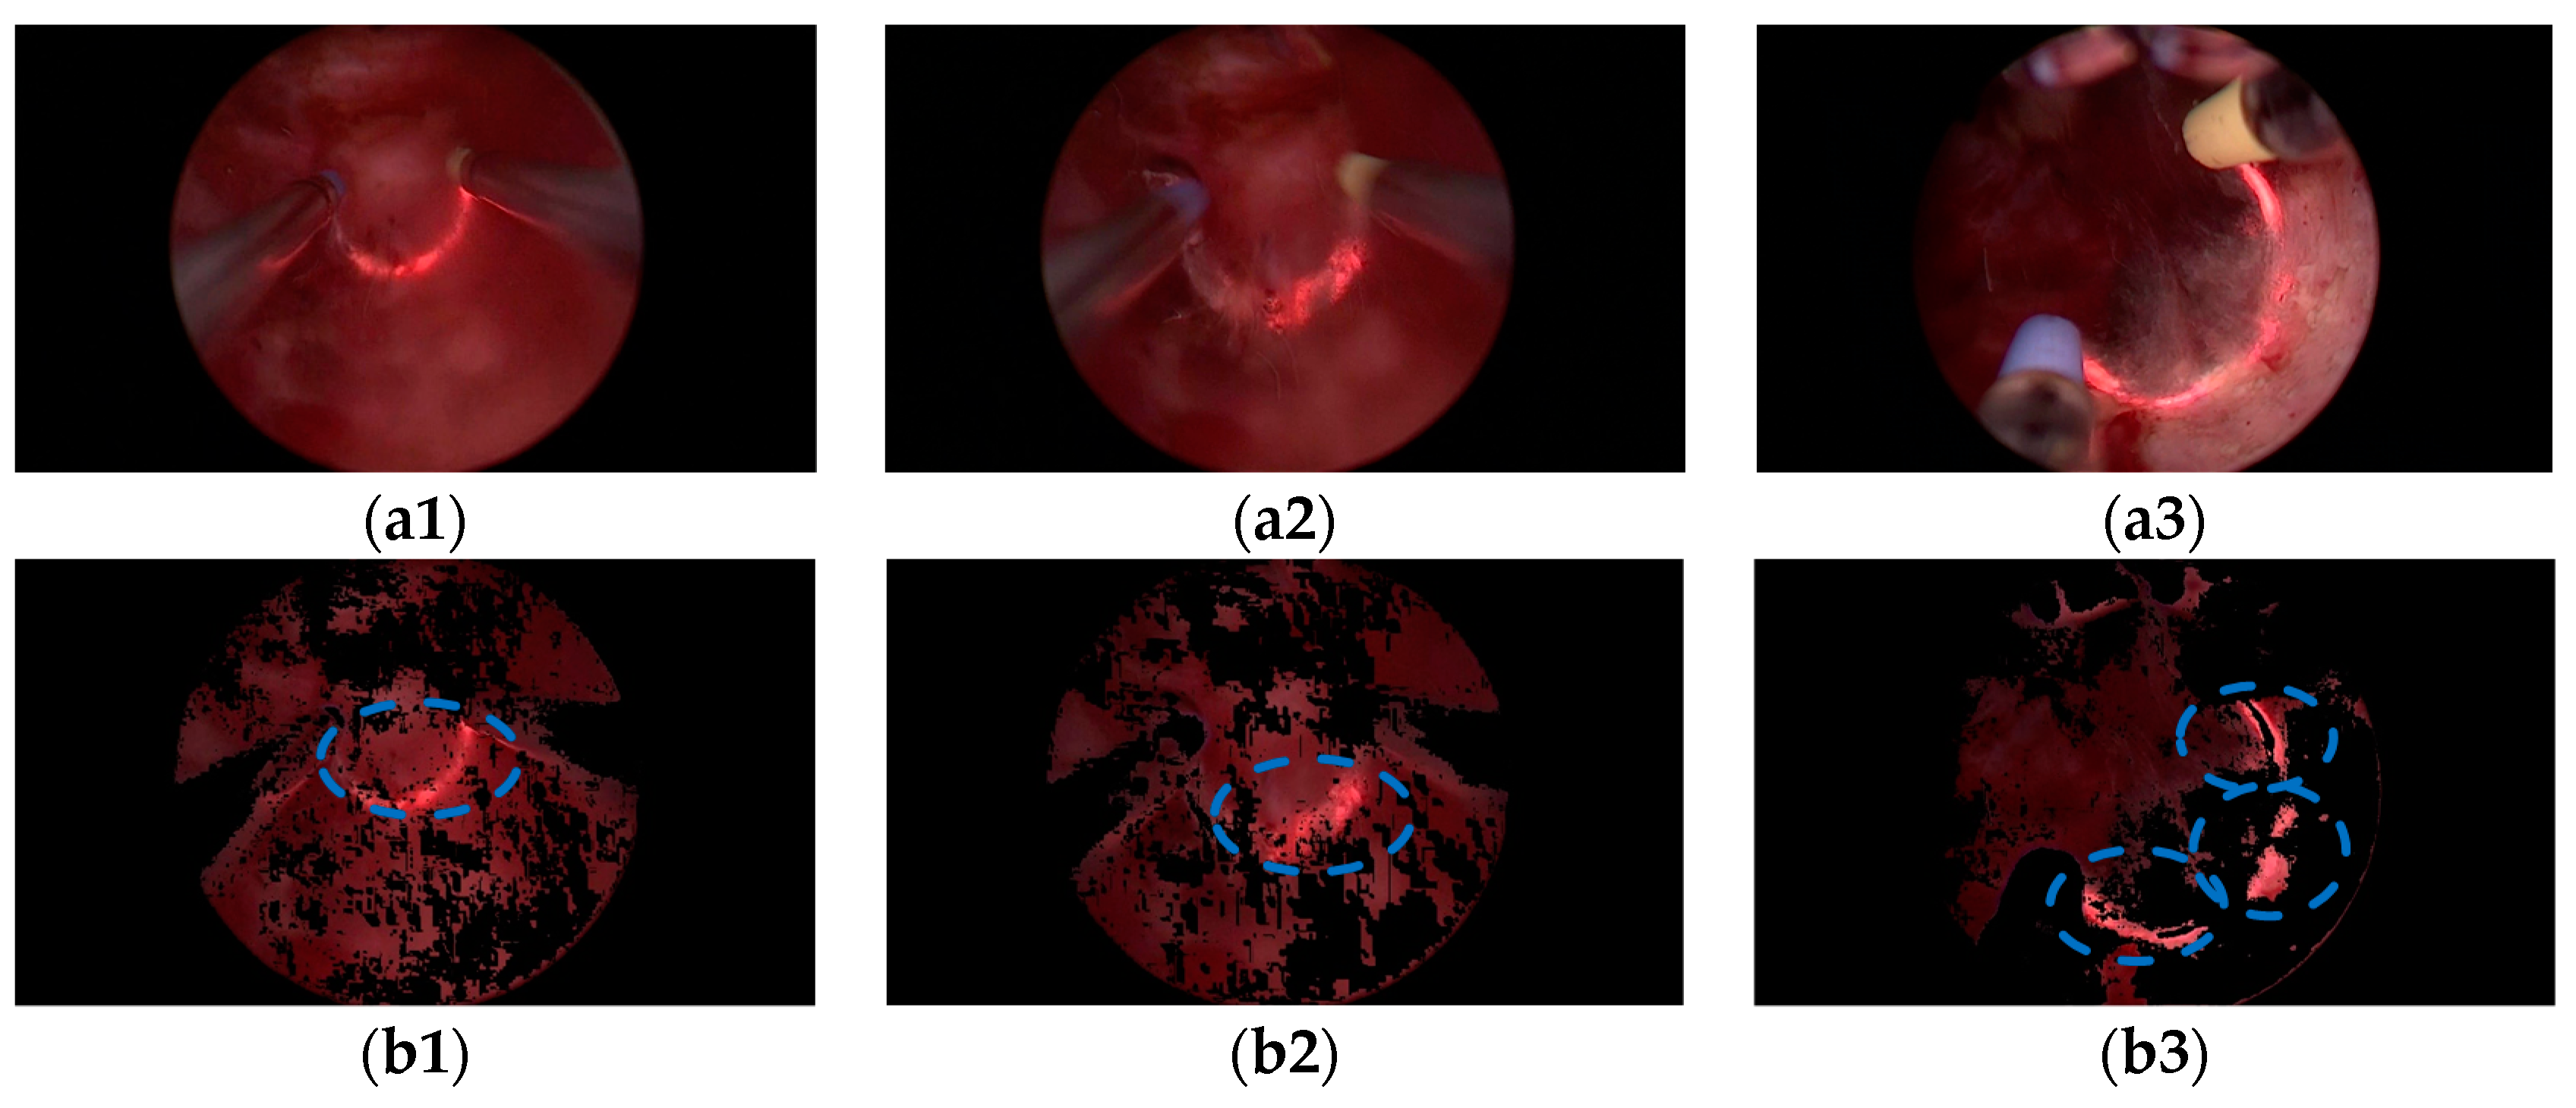
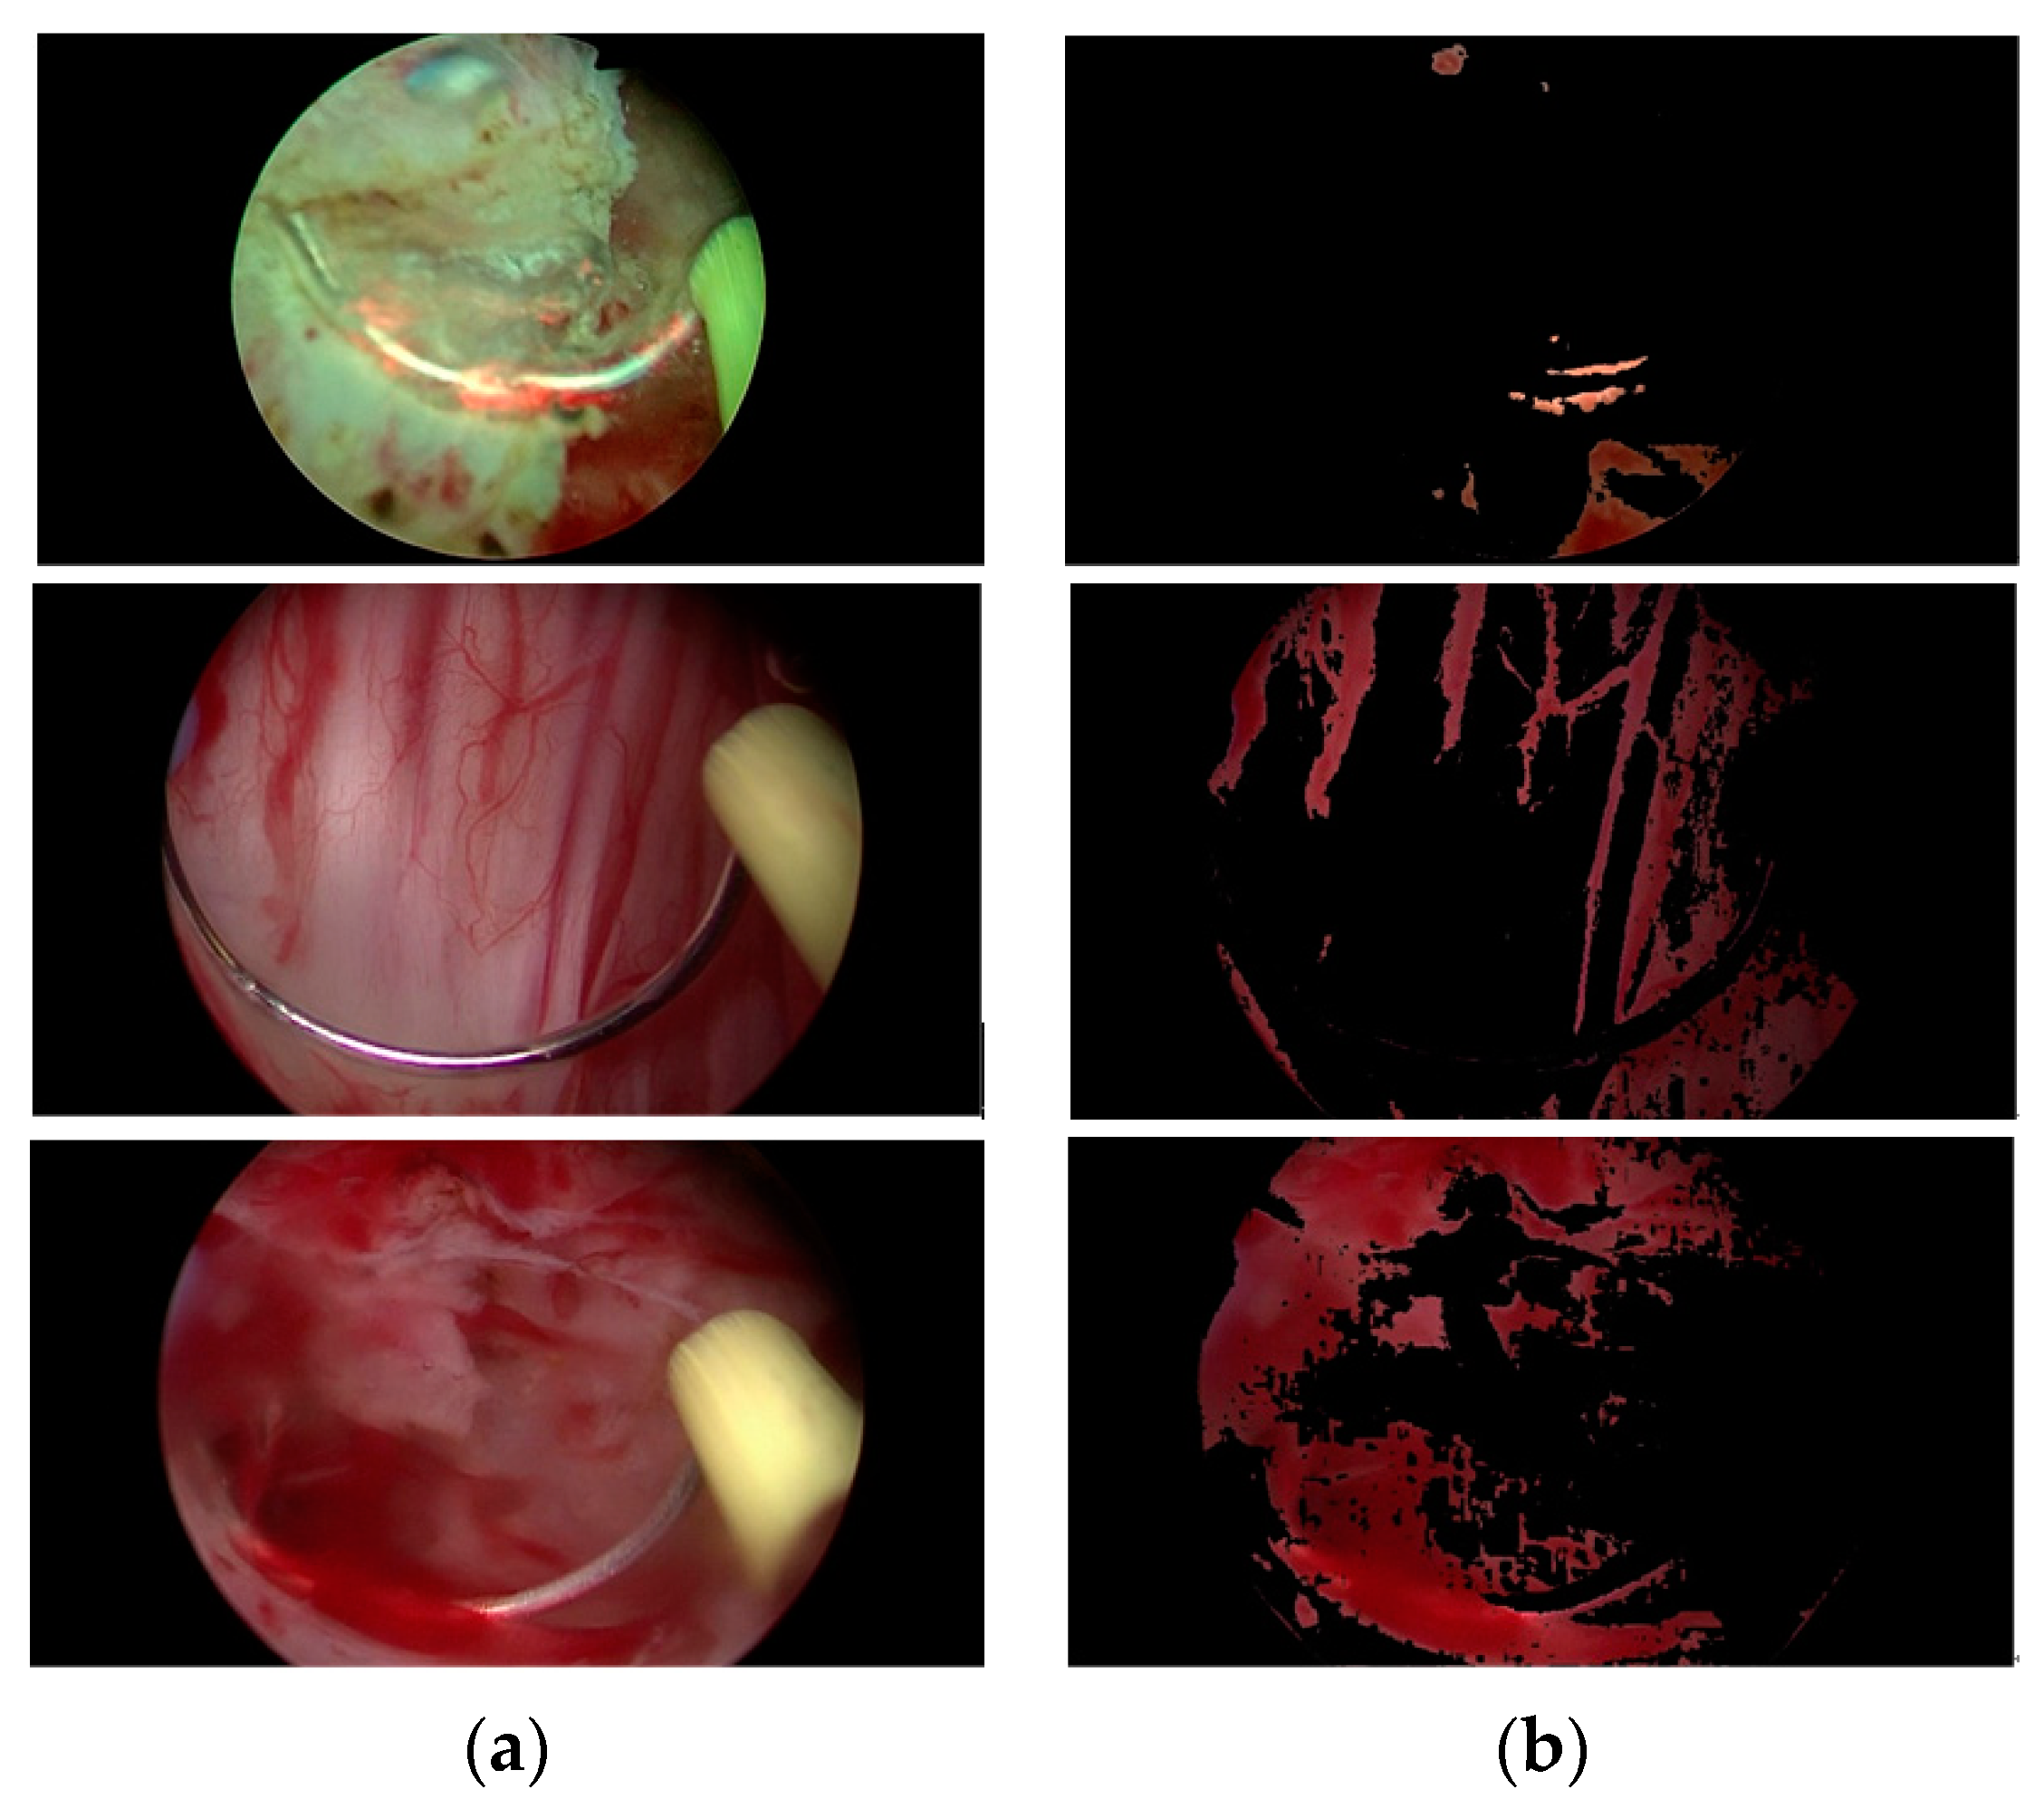
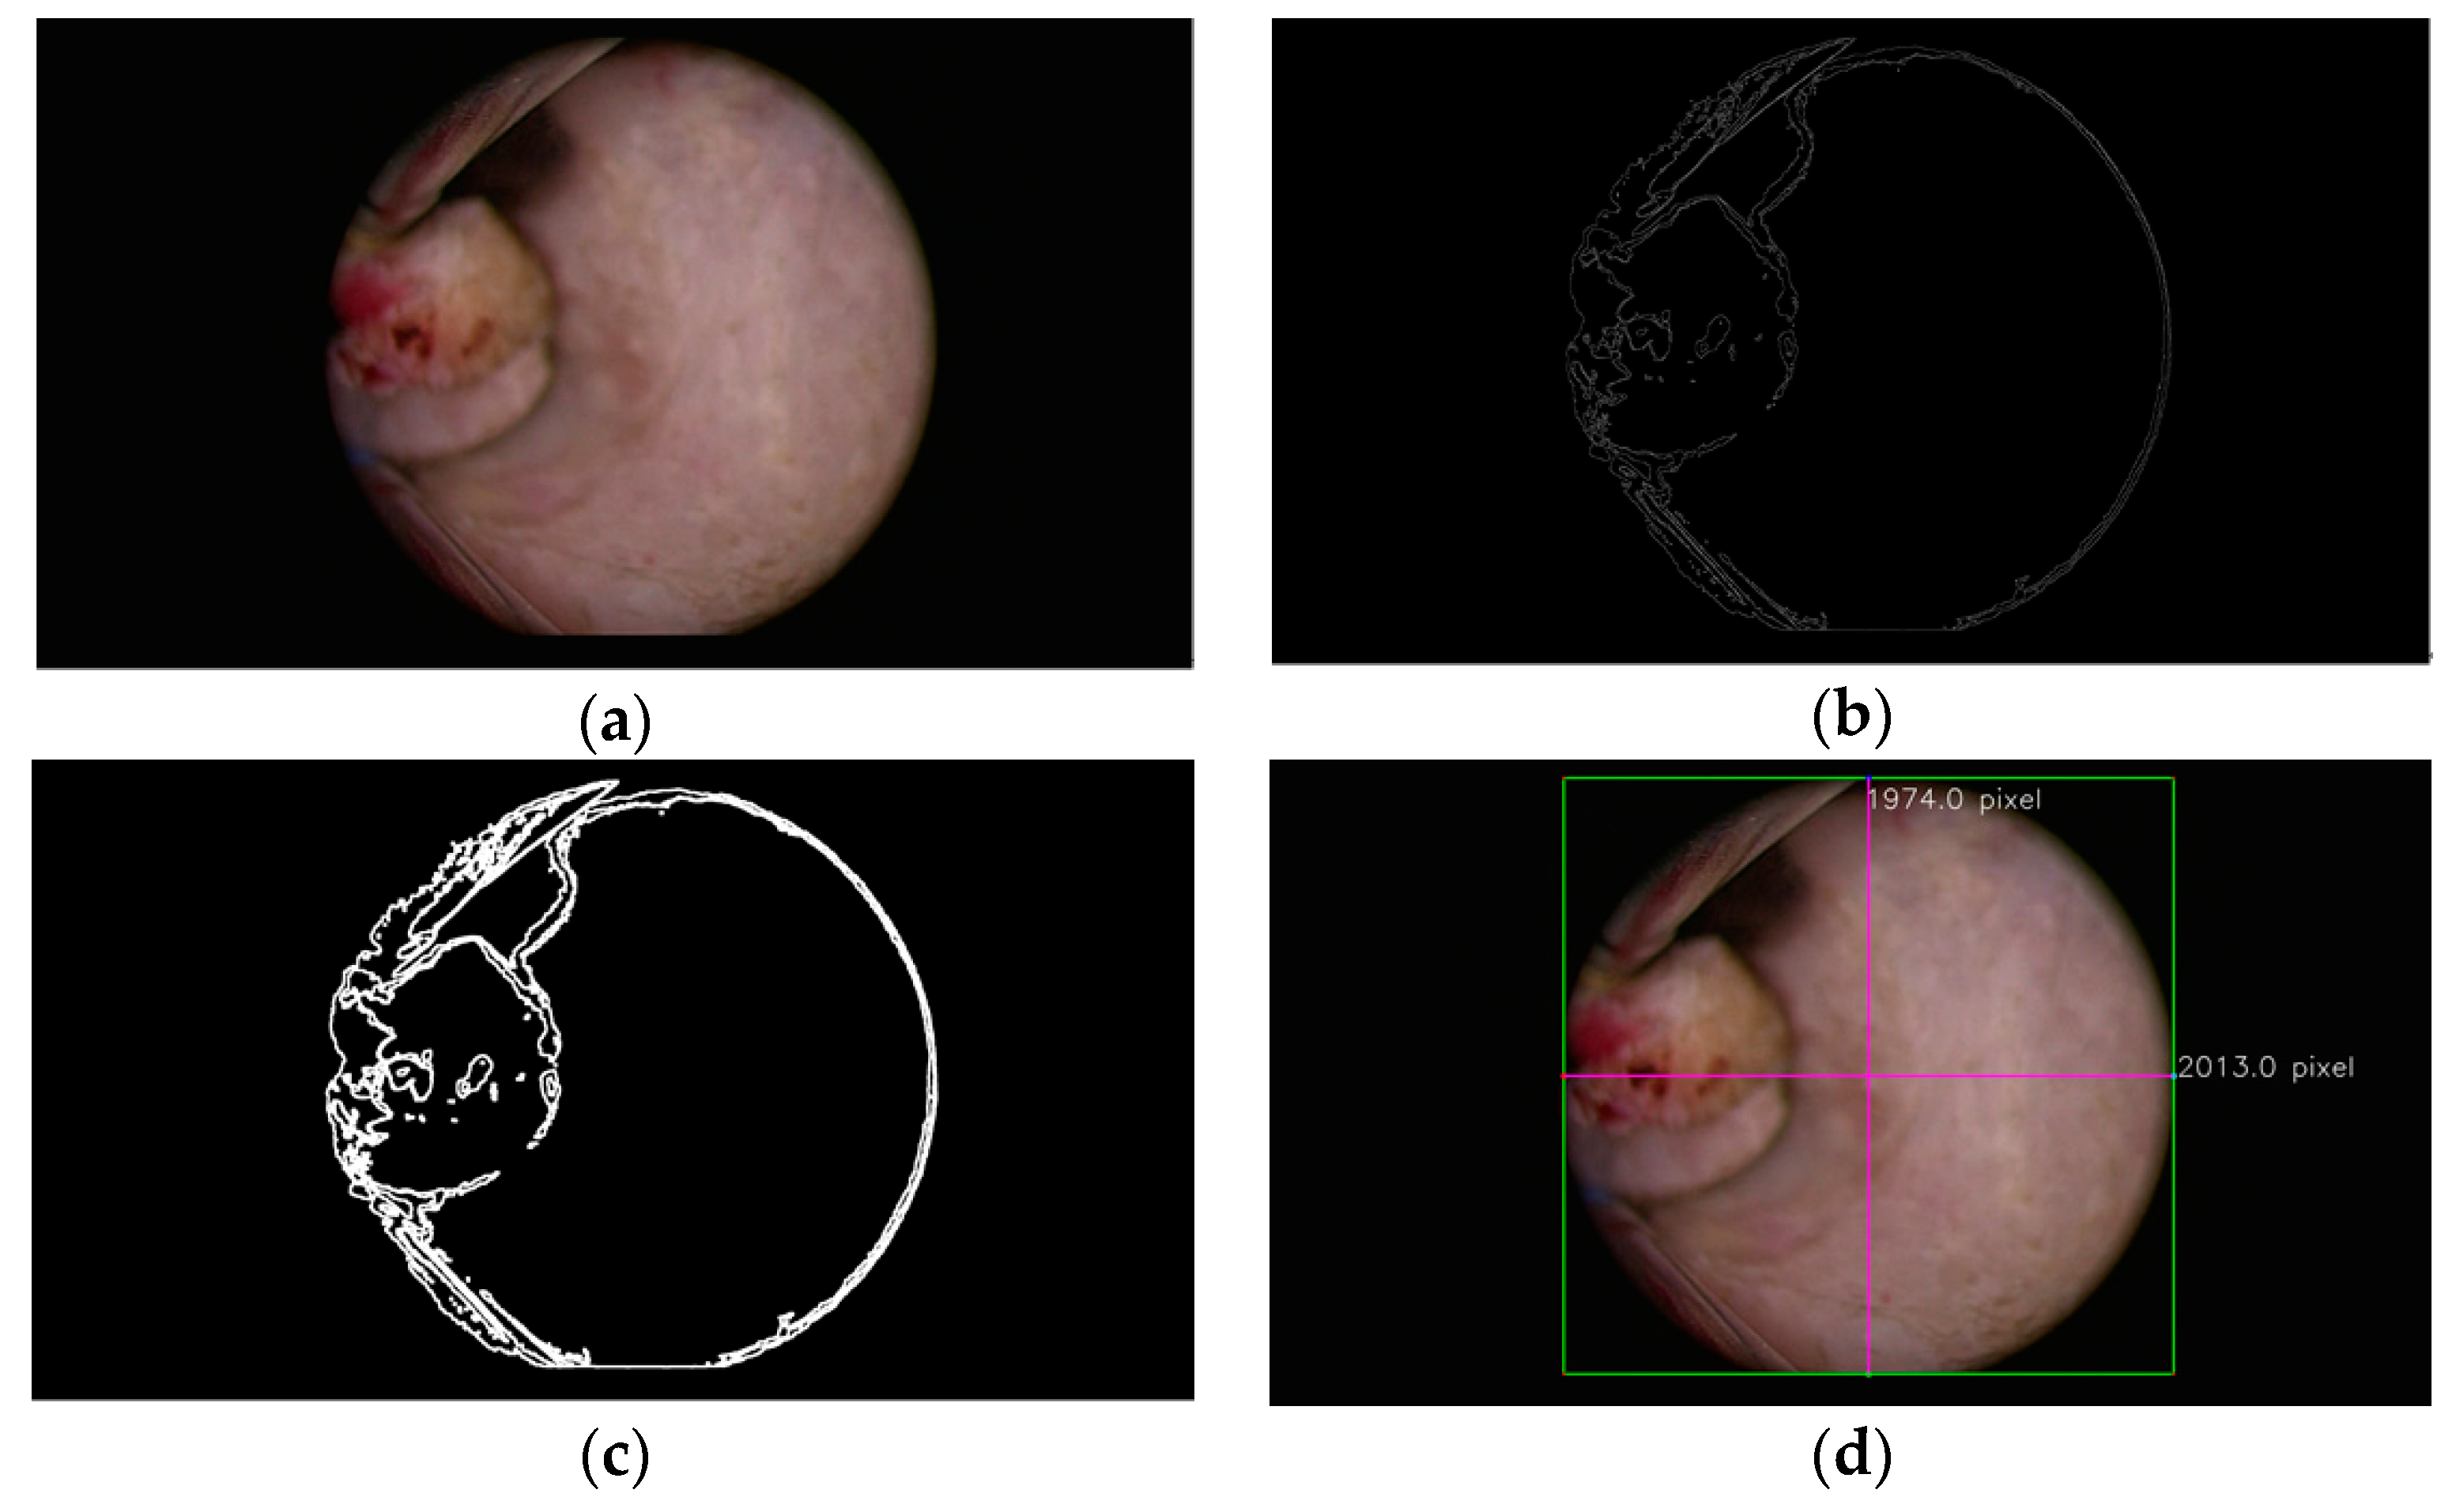
2.3. Level Classification of the Bleeding Regions Using the HSV Color Space Analysis Method

After obtaining the framed images of the TURP surgery without red light distributions, we calculated and classified the bleeding areas to determine the blood loss. Here, the RGB color space was converted to the HSV color space to further detect non-bleeding areas. The example of the bleeding areas is shown in Figure 6. In the original images shown in Figure 6a,b, the bleeding areas were obviously obtained by the HSV color space analysis method. Hence, this method provides the accurate and immediate solution to obtain the bleeding areas [46]. The level of the bleeding areas is considered as the performance indication in surgical diagnosis. To do this, Figure 7 demonstrates the calculation process for prostate occupation as the following successive steps: edge detection image processing, morphology image processing, and bounding box of object for short radius a and long radius b. The ellipse prostate area defined in Equation (1) was calculated by determining the bleeding area ratio (BAR) for the performance indication of the blood loss in prostate surgery.
Area = π a b
where a and b are the short and long radii of the ellipse prostate area. The four levels of the BAR were defined as 0%–25%, 25%–50%, 50%–75%, and 75%–100%, which corresponded to the original image/bleeding area image, respectively, as shown in Table 2. Based on the aforementioned definition, this study calculated the ratio of the four levels of blood loss datasets. In our experiment datasets, the ratios of the bleeding images (i.e., less than 25%, 25%–50%, 50%–75%, and 75%–100%) corresponded to 80%, 7%, 5%, and 8% of the total images, respectively.

3. Experiments and Results

In this section, the classification and segmentation of the deep learning models proposed in this study are described and investigated in detail. These models were trained in the Graphics Processing Unit (GPU) embedded with NVIDIA GeForce GTX 1050 Ti for computational acceleration. The deep learning framework Keras was used together with TensorFlow, a machine learning backend library.

3.1. Preparation of Prostate Image Datasets for the ResNet-50 Classification Model

The prostate surgery image datasets were collected at Chang Gung Memorial Hospital using a resectoscope [12], and the pixel resolution data were 3840 × 2160 images used for analyses. The total number of datasets was 26,025 images that recorded the prostate surgery. The dataset ratios of the TURP surgery are listed in Table 3. We split the 1 min surgery into 1735 frames, and each framed image had a 3840 × 2160 pixel resolution. This study utilized 10,410 images of surgical clips for the ResNet-50 model training and validation. The remaining 15,615 frames were used as actual testing datasets. Figure 8 shows the frames captured from a video of the prostate surgery in every 0.1 s. Since the total number of framed images with the red light was less than that with the non-red light, the features of training framed images with the red light were insufficient to constitute a balanced program for training in classification. To achieve a better performance in the training stage, the training datasets were augmented by a geometrical transformation method, for example, flip, rotation, and shift [47]. The details will be described in the following sections.

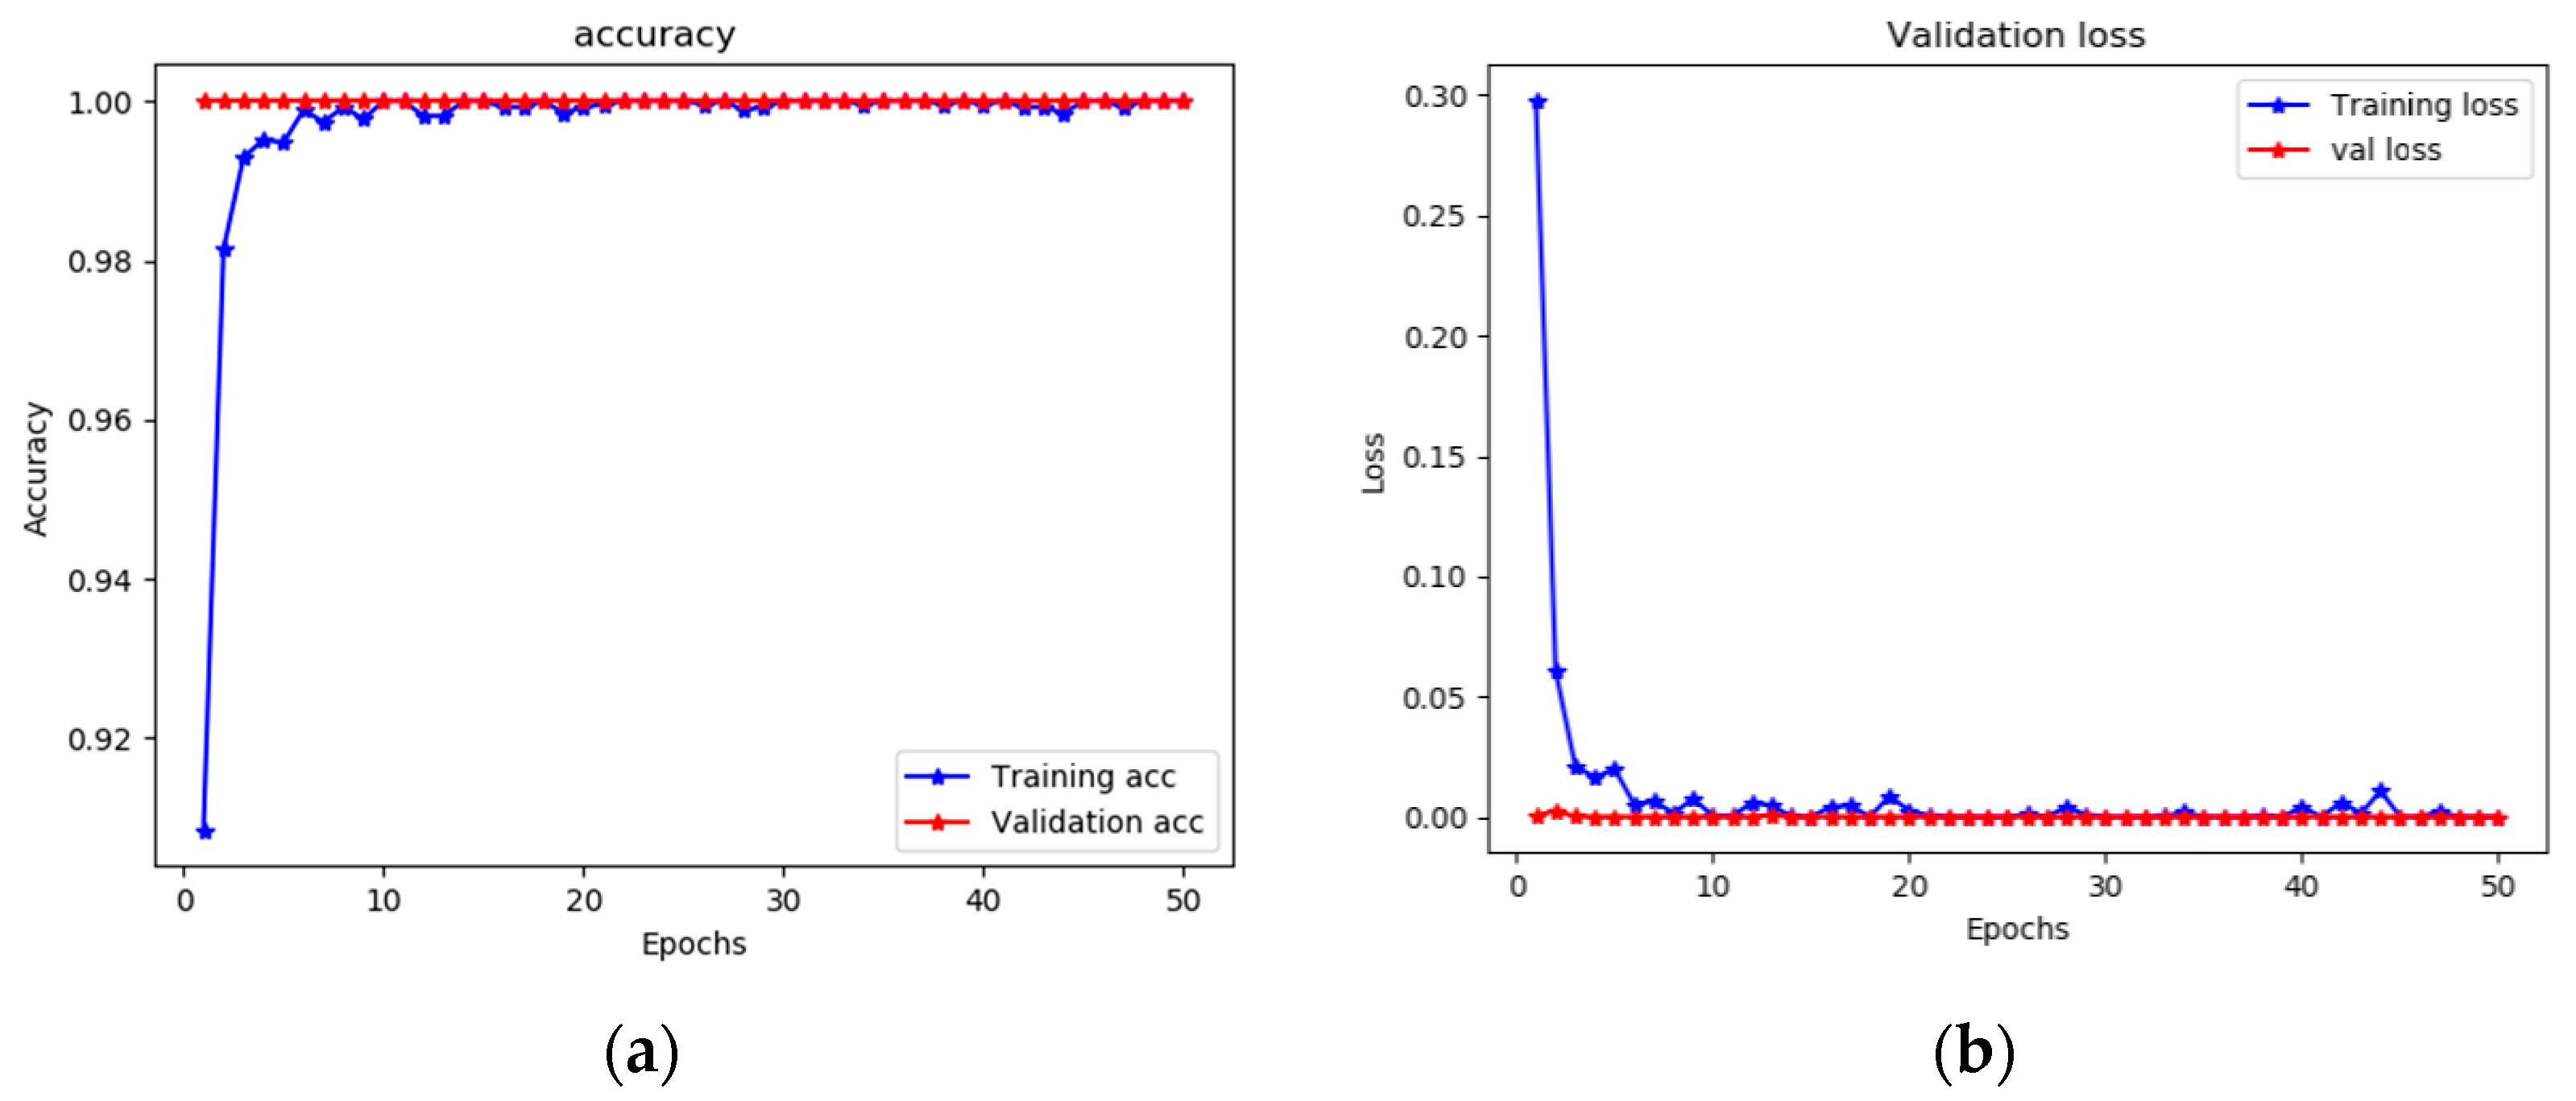
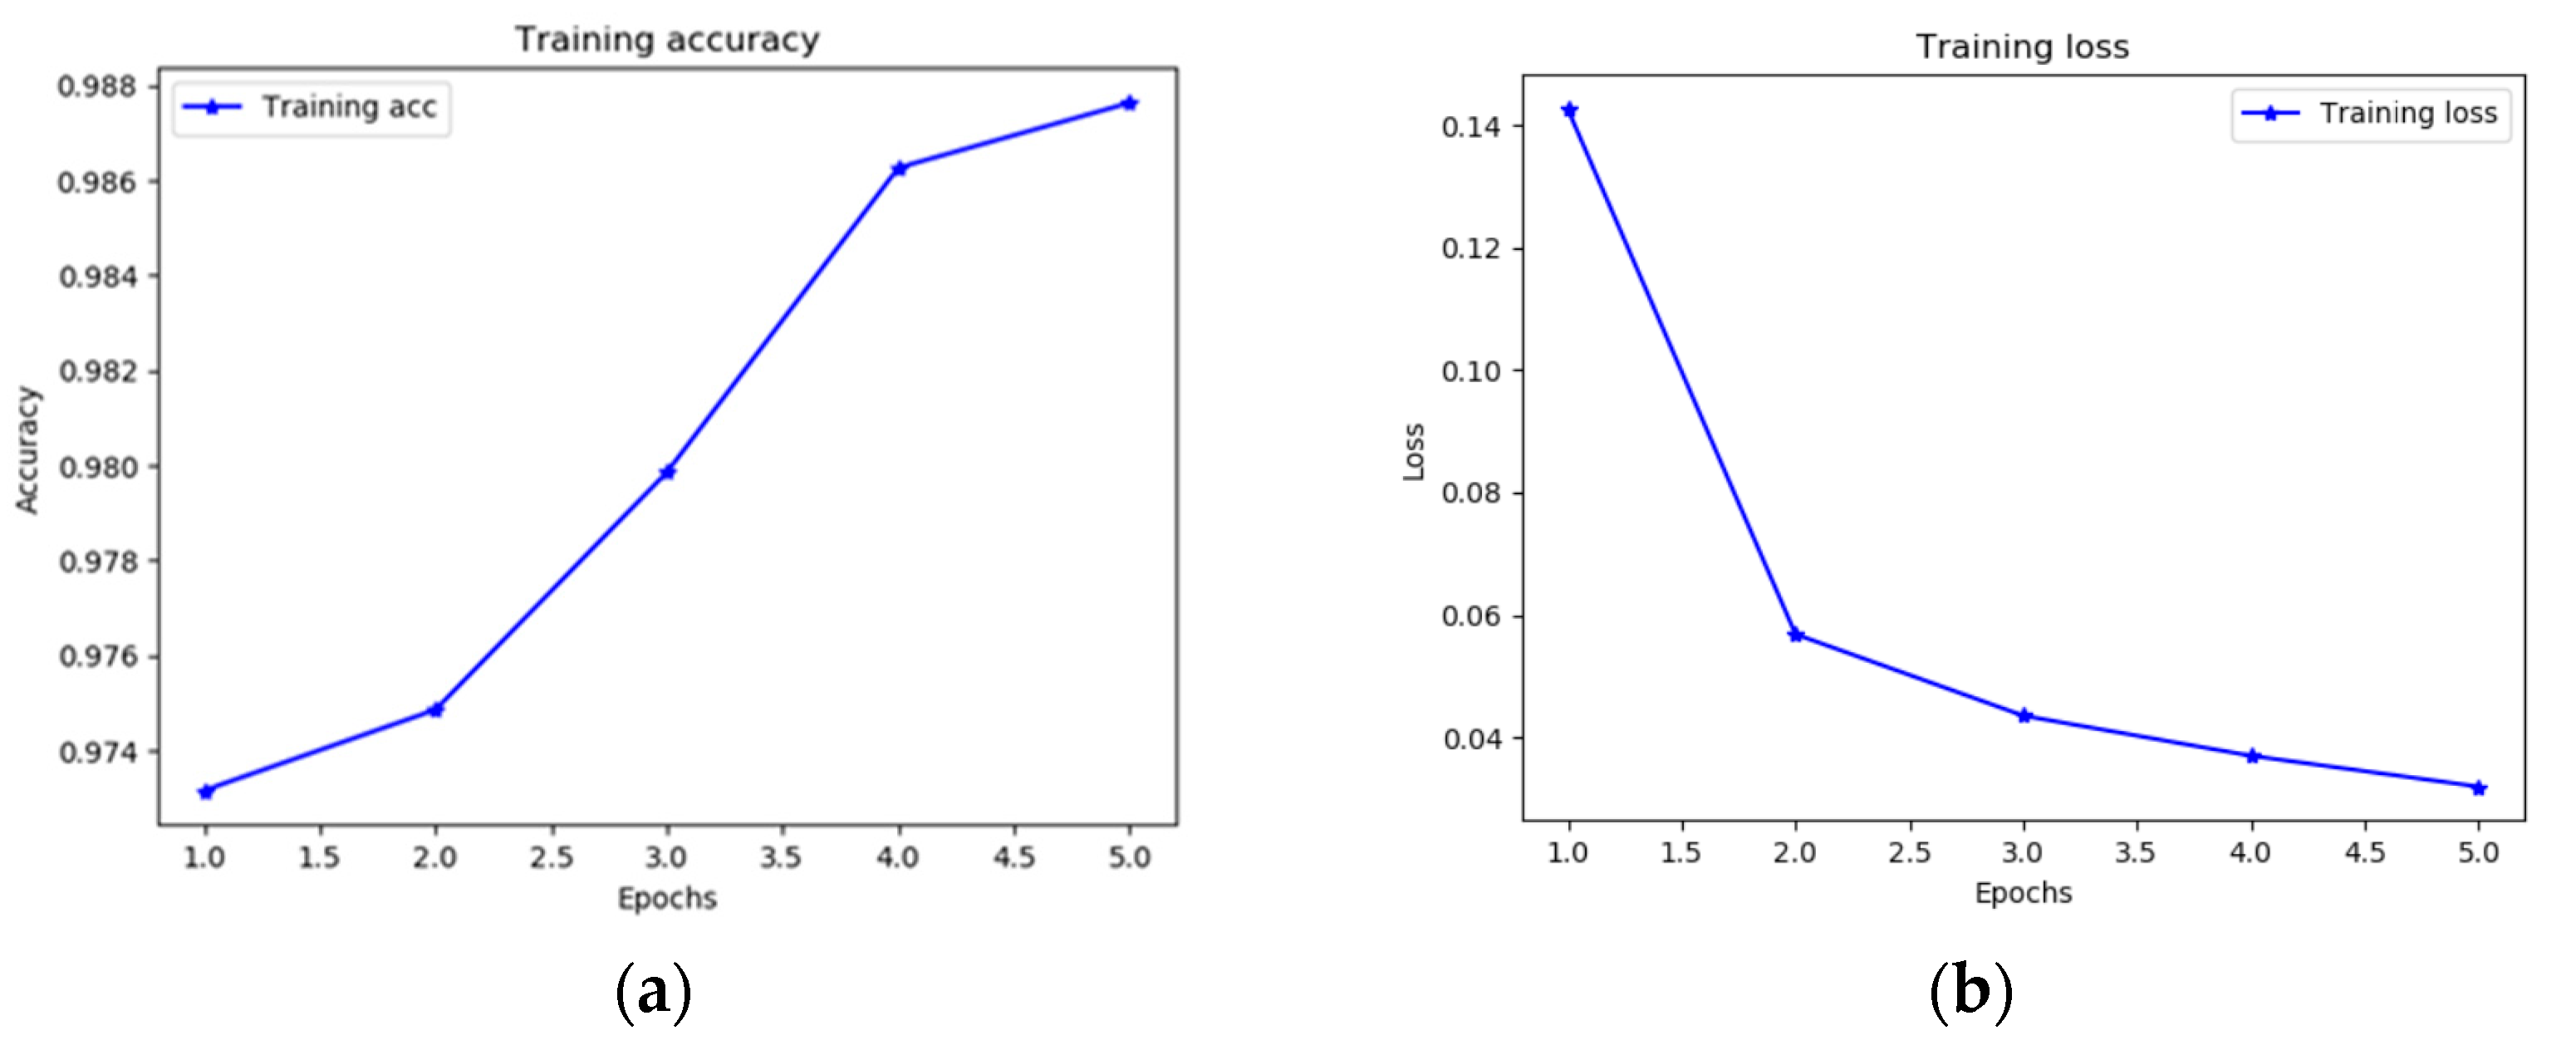
3.2. Performance of the ResNet-50 Classification Model

We utilized 10,410 TURP surgery images as training/validation datasets, and the others were used for testing datasets. However, the TURP surgery datasets were difficult to access, and a serious imbalance issue within the datasets in this research could lead to undesirable results. Such an issue could mean that the number of framed images with the red light is inadequate for the training. To solve this problem, a technique of data augmentation could be implemented; thus, we used flip, rotation, and shift to augment the red light images. The respective numbers of the images with the red and non-red lights were prepared to be approximately 3000 for the training. As shown in Table 4, our experimental results are evaluated by the indexes of accuracy, specificity, and sensitivity. Accuracy is the global corrective percentage of classification identification, specificity is the corrective proportion of the image identified without the red light, and sensitivity indicates the corrective proportion of the image identified with the red light. They are defined in Equations (2)–(4), and the definition of the classification metrics is shown in Table 4. Moreover, the following are the definitions of TP, TN, FN, and FP: TP is the number of correctly classified images with the red light, TN is the number of correctly classified images with the non-red light, FN is the number of falsely classified images with the red light, and FP is the number of falsely classified images with the non-red light [48,49]. To validate the performance of the training process, two indicators of training accuracy and loss function are used to evaluate the results of the self-predicted data. The results of the training accuracy and loss function for the ResNet-50 model are both convergent to the best of the fit line, which are shown in Figure 9.
Accuracy = T P + T N T P + T N + F P + F N
Specificity = T N F P + T N
Sensitivity = T P T P + F N
To evaluate the effectiveness of the ResNet-50 model, this study used a confusion matrix to show the classification performance of the prostate images with the red and non-red lights. The confusion matrix for testing the TURP surgery datasets is shown in Table 5. The classification accuracy, sensitivity, and specificity from the confusion matrix result achieved 97%, 98%, and 94%, respectively, for testing datasets for high accuracy, corrective robustness, and global correctness, as shown in Table 6.
To realize the false classification circumstances, the images of FN and FP in the case of testing the TURP surgery datasets listed in Table 5 were picked for investigation. Figure 10(a1,a2) illustrates the FN images, which reveal that the large dark color blood region is misjudged for the red light pattern. Figure 10(b1,b2) presents the FP images, which reveal that the small red light area is ignored or mistaken for the non-red light image.

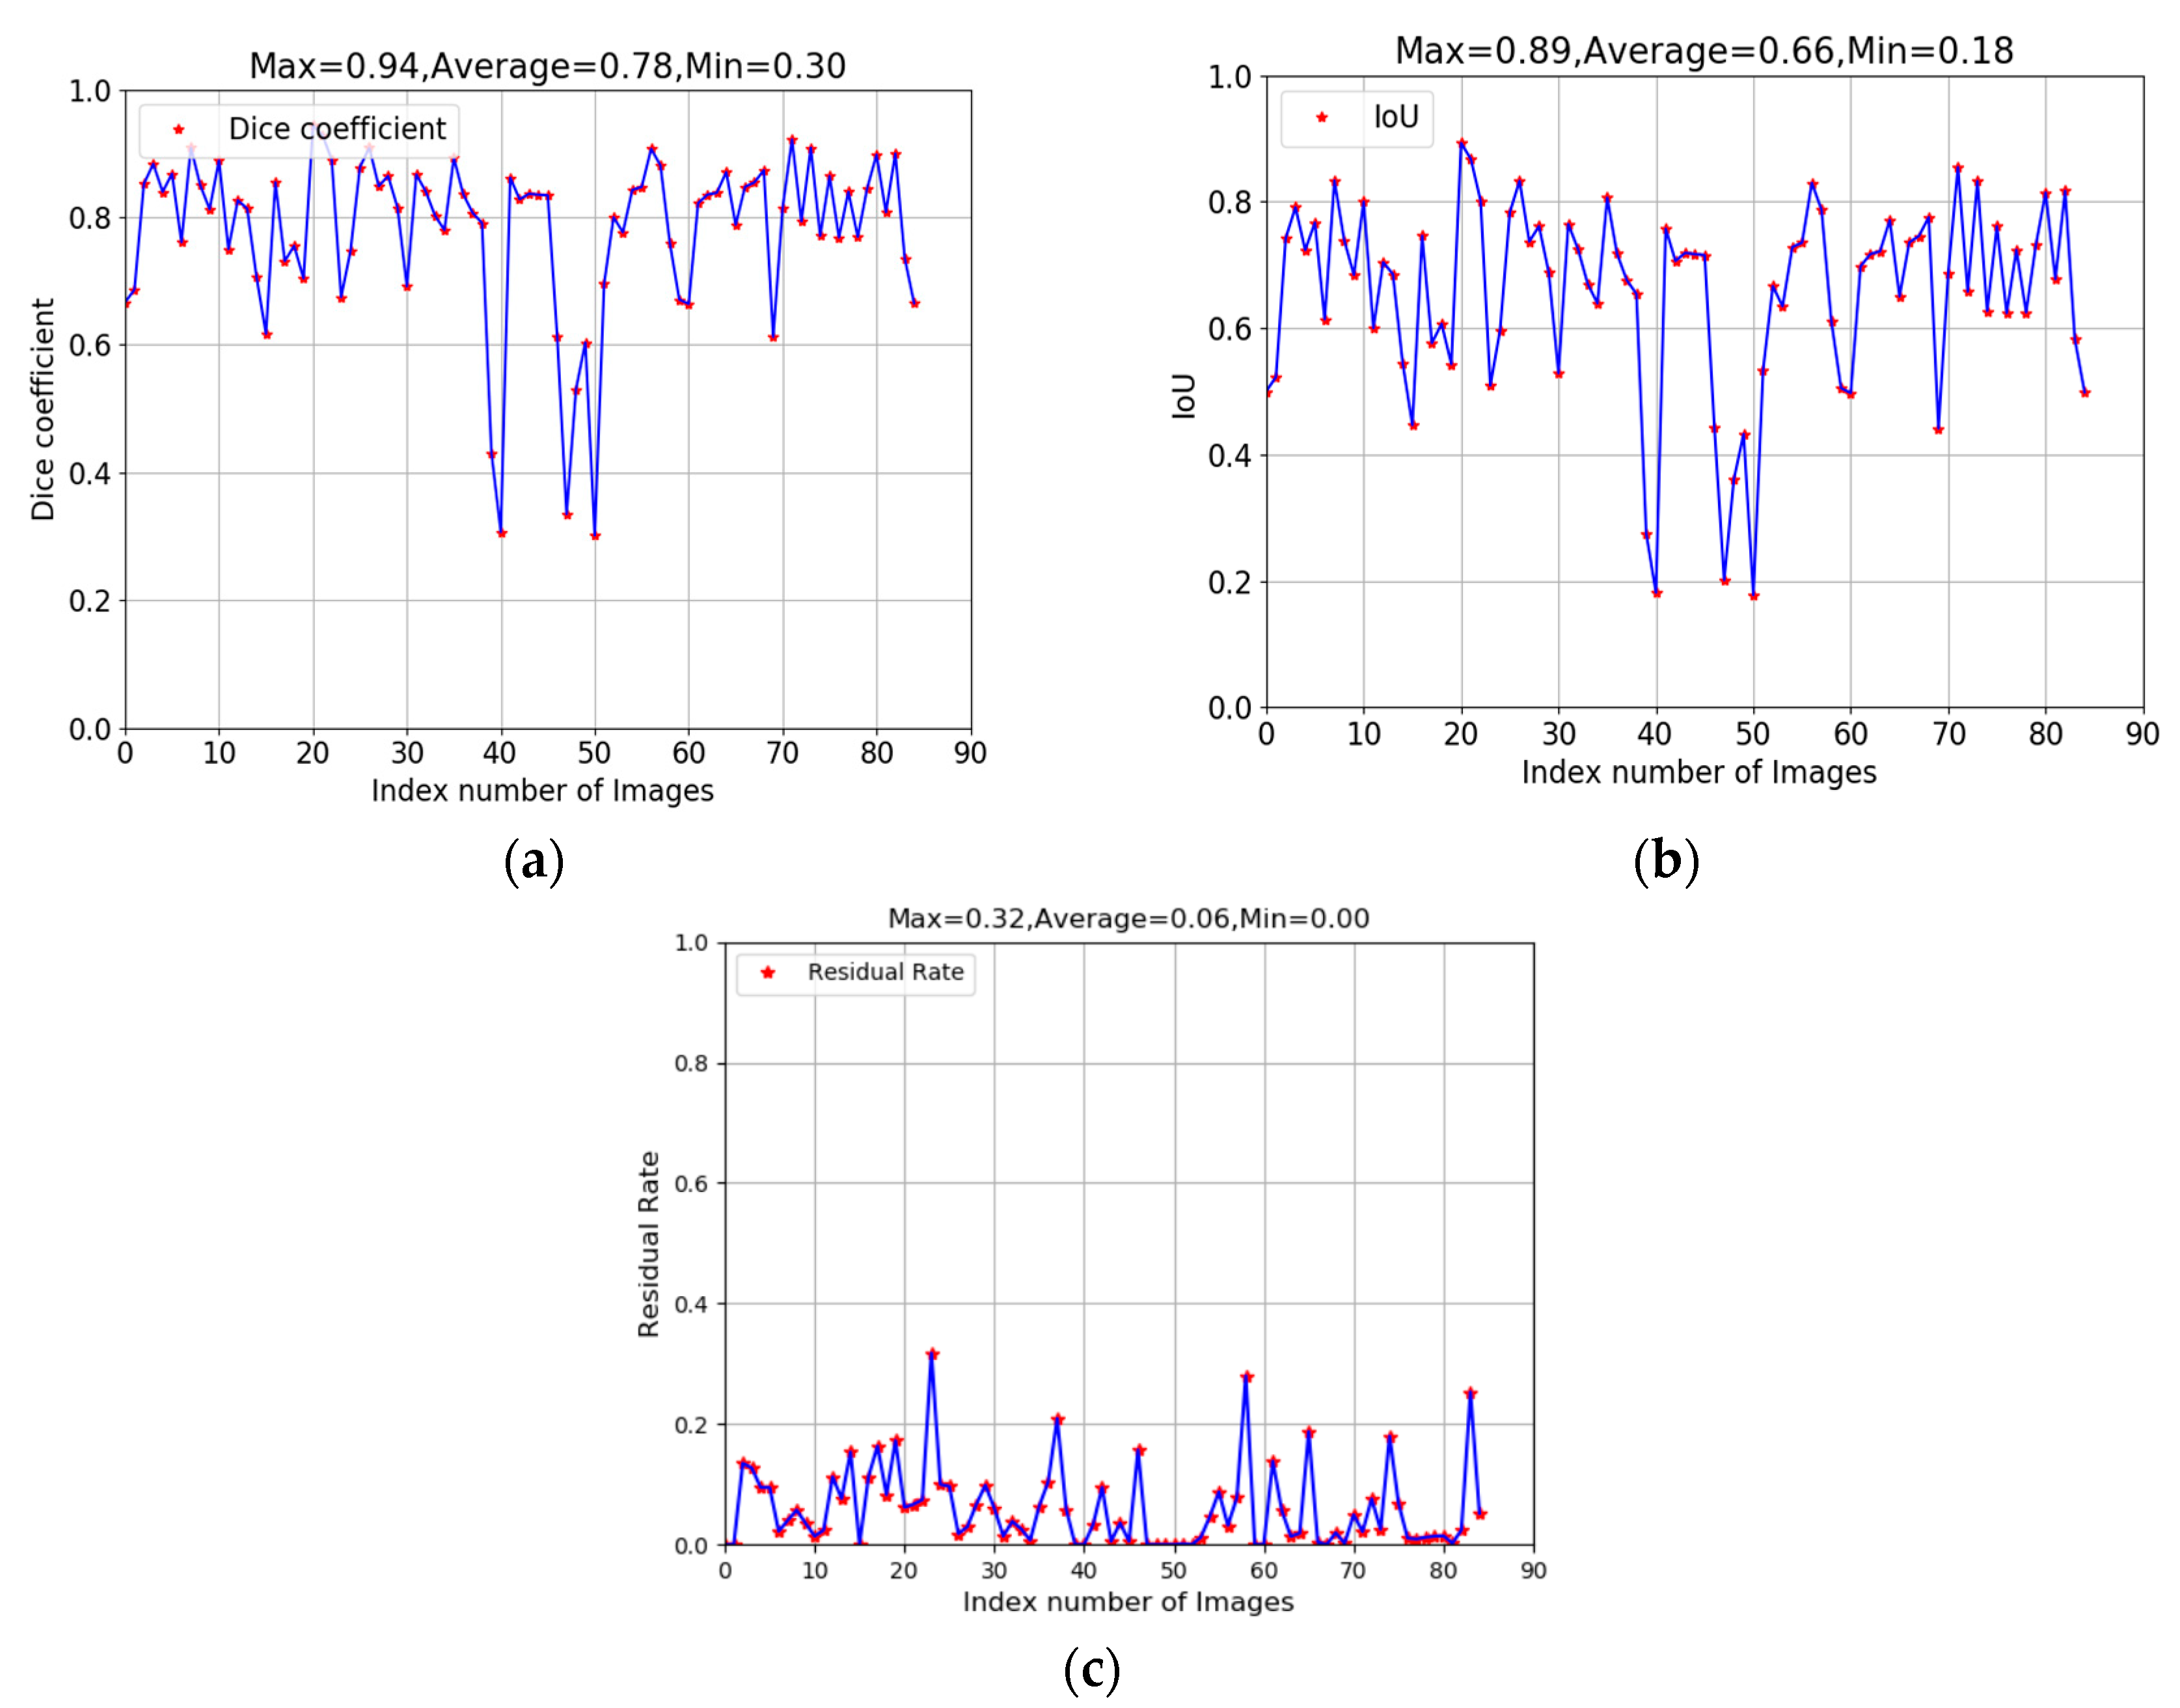
3.3. Performance of U-Net Segmentation and HSV Color Space Extraction

We selected approximately 80 images containing the red light from the 6 min TURP surgery as the training datasets. During the network training, the parameters were set as follows: the batch size was set to 5 epochs, the number of steps per epoch was 200, the learning rate was 0.0001, and the loss function selected binary cross entropy. To quantitatively evaluate the presented model, the intersection over union (IOU) and dice coefficient (DC) were used as the performance metrics [50]. The IOU and DC are the most commonly used metrics in semantic segmentation. The segmentation results were compared with the ground truth (GT). Their definitions are provided in (5) and (6).
IOU = P r e d i c t     G T P r e d i c t     G T
Dice   Coefficient = 2 | P r e d i c t     G T | | P r e d i c t | + | G T |
IOU is an essential method to quantify the overlap percentage of the GT and prediction output. It measures the number of common pixels between the target and prediction image. The validation samples are used to verify the performance of the U-Net segmentation model. Table 7 shows the performance of training for the U-Net segmentation model. The images with the red, green, and yellow color areas represent the GT, prediction area, and overlap between the prediction and GT, respectively. We found that the prediction images almost enclosed the GT and obtained a 0.66 average IOU score, as indicated in Figure 11b. In addition, the results of GT and the prediction images in Table 7 revealed that the prediction area almost covered the GT area. This means that the GT area of the red light, by labeling, is almost segmented to be extracted. To quantitatively evaluate the effectiveness of extracting the GT area of the red light, the proposed residual coefficient is defined in Equation (7).
Residual   coefficient = 1 P r e d i c t     G T G T
We obtained an average residual rate of 0.06, as indicated in Figure 11c, which could be capable of filtering the red light area emitted from the cutting loop using the U-Net model. Moreover, DC is another common metric used to measure the similarity of two samples—in this case, the average DC was 0.78, as indicated in Figure 11a. The performance testing of the U-Net model, integrated with the HSV color space method on the bleeding area detection, was conducted here. The experimental results in Table 8 demonstrate the performance of segmenting the red light image using the U-Net model. The overview of the images in Table 8 (1)–(10) presented better segmentation performance, that is, the red light pattern was almost extracting even near the boundary of the prostate image. Furthermore, the training performance of the U-Net model was evaluated using the loss function and training accuracy. The results are shown in Figure 12, which are both convergent to the best of fit line.
Finally, the comparison of the bleeding area detection using the HSV color space under the conditions, with and without using U-Net, was investigated. The experimental results in Table 9 show that the extraction effects of the HSV color space analysis method are apparently influenced by the occurrence of the red color. The red light in the bleeding area could not be completely removed by directly using the HSV color space analysis method. These results will lead to a decrease in the classification accuracy of blood loss. Therefore, using the U-Net model to filter the red light pattern could increase the accuracy of the bleeding area prediction in the TURP surgery. After the total area of the prostate and bleeding was calculated, the four levels of classification described earlier were determined to evaluate the performance of the TURP surgery in diagnosis.
The proposed Res-Unet algorithm, which integrated the Resnet-50 and U-Net models, was used to perform the segmentation of the misjudgment of prostate surgery images. To evaluate the performance of the proposed algorithm, it is compared with two efficient algorithms, Autoencoder and Segnet. The comparison of the mean residual coefficient scores are shown in Table 10. The result shows that the mean residual coefficient of Res-Unet, Autoencoder and Segnet models are 0.28, 0.63, 0.70, respectively. Res-Unet achieves the best mean residual coefficient, which illustrates the red light pattern as almost being filtered from the cutting loop. Meanwhile, Res-Unet can significantly remove the misjudgment area and is superior than the other two models. Part of the testing results by these segmentation models is shown in Table 11. Furthermore, the experiments reveal that the Res-Unet model can concatenate the details of feature maps from a low to high level and automatically extract more semantic information, which achieves an acceptable performance on image segmentation.

4. Conclusions

It is significant to provide the immediate evaluation of the bleeding area for clinicians in the TURP surgery. Therefore, this study utilized the deep learning techniques to perform the recognition tasks. It was difficult to determine the color space precisely because the images were composed of the red light and bleeding areas. Thus, in this study, we proposed the Res-Unet model, which integrated the ResNet-50 and U-Net models to filter the confusing areas. However, acquiring the TURP surgery datasets was crucial, so the augmentation approach was used. The augmentation of the red light images with flip, rotation, and shift approaches can improve the accuracy of the ResNet-50 model, and the classification results could be more convincing. According to the aforementioned experimental results, the ResNet-50 model can achieve high accuracy, corrective robustness, and global correctness. Furthermore, the results reveal that the model has the superior ability in classifying two categories of images and can immediately detect the non-light images. To remove the interference of the red light pattern in the bleeding area, the image semantic segmentation is used in the proposed algorithm. Three segmentation models are compared to explore the effect of segmentation. The proposed model, Res-Unet, achieves the best prediction mean residual coefficient score by removing the misjudgment area unlike other algorithms. Since the U-Net model obtains the high performance of extracting and filtering the red light features, it could increase the accuracy of the bleeding area by the HSV color space analysis method. Moreover, the experiment results verified that the proposed approach could reduce the false positive rate of the bleeding area and achieves significant performance of recognition in surgery images. This study presented an effective recognition approach to calculate the bleeding area of the TURP surgery, and it could provide clinicians with a useful assessment of surgical performance in diagnosis.

Author Contributions

J.-W.C. wrote the paper, implemented the algorithms and performed the experiments; W.-J.L. wrote the paper, implemented the algorithms and performed the experiments; C.-L.H. conceived, designed the algorithms and experiments, and revised the paper; C.-P.H. provided resources, performed the experiments and verified the videos of bleeding; H.-T.Y. revised the paper. C.-Y.L. designed the algorithm and revised paper. Others verified the experimental results. All authors have read and agree to the published version of the manuscript.

Funding

This research is supported by the Ministry of Science and Technology under the grants MOST 108-2221-E-182-031-MY3, MOST 108-2218-E-126-003 and MOST 108-2221-E-010-013-MY3.

Conflicts of Interest

The authors declare no conflict of interest.

References

  1. Available online: https://www.health.harvard.edu/mens-health/the-growing-problem-of-an-enlarged-prostate-gland (accessed on 4 March 2020).
  2. Gravas, S.; Cornu, J.; Drake, M.; Gacci, M.; Gratzke, C.; Herrmann, T.; Mamoulakis, C.; Rieken, M.; Speakman, M.; Tikkinen, K.J.E.G. Management of Non-Neurogenic Male LUTS; EAU: Arnhem, The Netherlands, 2017. [Google Scholar]
  3. Wasson, J.H.; Reda, D.J.; Bruskewitz, R.C.; Elinson, J.; Keller, A.M.; Henderson, W.G. A comparison of transurethral surgery with watchful waiting for moderate symptoms of benign prostatic hyperplasia. The veterans affairs cooperative study group on transurethral resection of the prostate. N. Engl. J. Med. 1995, 332, 75–79. [Google Scholar] [CrossRef]
  4. Ghalayini, I.F.; Al-Ghazo, M.A.; Pickard, R.S. A prospective randomized trial comparing transurethral prostatic resection and clean intermittent self-catheterization in men with chronic urinary retention. BJU Int. 2005, 96, 93–97. [Google Scholar] [CrossRef] [PubMed]
  5. Gujral, S.; Abrams, P.; Donovan, J.L.; Neal, D.E.; Brookes, S.T.; Chacko, K.N.; Wright, M.J.; Timoney, A.G.; Peters, T.J. A prospective randomized trial comparing transurethral resection of the prostate and laser therapy in men with chronic urinary retention: The CLasP study. J. Urol. 2000, 164, 59–64. [Google Scholar] [CrossRef]
  6. Chughtai, B.; Te, A.E. Non-laser transurethral resection of the prostate. In Minimally Invasive Urology; Springer: Berlin/Heidelberg, Germany, 2015; pp. 195–203. [Google Scholar]
  7. Jansen, H.; Berseus, O.; Johansson, J.E. A simple photometric method for determination of blood loss during transurethral surgery. Scand. J. Urol. Nephrol. 1978, 12, 1–5. [Google Scholar]
  8. Fagerström, T.; Nyman, C.R.; Hahn, R.G. Bipolar transurethral resection of the prostate causes less bleeding than the monopolar technique: A single-centre randomized trial of 202 patients. BJU Int. 2010, 105, 1560–1564. [Google Scholar] [CrossRef]
  9. Aarnink, R.G.; Huynen, A.L.; Giesen, R.J.; de la Rosette, J.J.; Debruyne, F.M.; Wijkstra, H. Automated prostate volume determination with ultrasonographic imaging. J. Urol. 1995, 153, 1549–1554. [Google Scholar] [CrossRef] [Green Version]
  10. Crivianu-Gaita, D.; Miclea, F.; Gaspar, A.; Margineatu, D.; Holban, S. 3D reconstruction of prostate from ultrasound images. Int. J. Med. Inform. 1997, 45, 43–51. [Google Scholar] [CrossRef]
  11. Jiang, H.; Zhou, Y. Safety and efficacy of thulium laser prostatectomy versus transurethral resection of prostate for treatment of benign prostate hyperplasia: A meta-analysis. Low Urin. Tract Symptoms 2016, 8, 165–170. [Google Scholar] [CrossRef]
  12. Skinner, T.A.A.; Leslie, R.J.; Steele, S.S.; Nickel, J.C. Randomized, controlled trial of laser vs. bipolar plasma vaporization treatment of benign prostatic hyperplasia. Can. Urol. Assoc. J. 2017, 11, 194–198. [Google Scholar] [CrossRef] [Green Version]
  13. Sung, Y.S.; Kwon, H.J.; Park, B.W.; Cho, G.; Lee, C.K.; Cho, K.S.; Kim, J.K. Prostate cancer detection on dynamic contrast-enhanced MRI: Computer-aided diagnosis versus single perfusion parameter maps. AJR Am. J. Roentgenol. 2011, 197, 1122–1129. [Google Scholar] [CrossRef] [Green Version]
  14. Doi, K. Computer-aided diagnosis in medical imaging: Historical review, current status and future potential. Comput. Med. Imaging Graph 2007, 31, 198–211. [Google Scholar] [CrossRef] [PubMed] [Green Version]
  15. De Piérola, L.B.F. Transanal resection of complicated rectal polyps using the urological resectoscope. Kirurgia 2005, 235, 2. [Google Scholar]
  16. Chang, Y.; Tsai, E.M.; Long, C.Y.; Lee, C.L.; Kay, N. Resectoscopic treatment combined with sonohysterographic evaluation of women with postmenstrual bleeding as a result of previous cesarean delivery scar defects. Am. J. Obstet. Gynecol. 2009, 200, 370–371. [Google Scholar] [CrossRef] [PubMed]
  17. Pantuck, A.J.; Baniel, J.; Kirkali, Z.; Klatte, T.; Zomorodian, N.; Yossepowitch, O.; Belldegrun, A.S. A novel resectoscope for transurethral resection of bladder tumors and the prostate. J. Urol. 2007, 178, 2331–2336. [Google Scholar] [CrossRef] [PubMed]
  18. Vaccaro, J.; Strand, J.; Kiesling, J.V.; Belville, W. Use of resectoscope for colon cancer. Urol. Clin. N. Am. 1990, 17, 63–66. [Google Scholar]
  19. Yap, M.H.; Pons, G.; Martí, J.; Ganau, S.; Sentís, M.; Zwiggelaar, R.; Davison, A.K.; Martí, R. Automated breast ultrasound lesions detection using convolutional neural networks. IEEE J. Biomed. Health Inform. 2017, 22, 1218–1226. [Google Scholar] [CrossRef] [Green Version]
  20. Liu, S.; Chen, W.; Dong, X. Automatic classification of chinese herbal based on deep learning method. In Proceedings of the 2018 14th International Conference on Natural Computation, Fuzzy Systems and Knowledge Discovery (ICNC-FSKD), Huangshan, China, 28–30 July 2018; pp. 235–238. [Google Scholar]
  21. Dai, Y.; Tang, Z.; Wang, Y. Data driven intelligent diagnostics for Parkinson’s disease. IEEE Access 2019, 7, 106941–106950. [Google Scholar] [CrossRef]
  22. Huang, Y.J.; Dou, Q.; Wang, Z.X.; Liu, L.Z.; Wang, L.S.; Chen, H.; Heng, P.A.; Xu, R.H. HL-FCN: Hybrid loss guided FCN for colorectal cancer segmentation. In Proceedings of the 2018 IEEE 15th International Symposium on Biomedical Imaging (ISBI 2018), Omni, Shoreham Hotel, Washington, DC, USA, 4–7 April 2018; pp. 195–198. [Google Scholar]
  23. Xie, Y.; Xia, Y.; Zhang, J.; Song, Y.; Feng, D.; Fulham, M.; Cai, W. Knowledge-based collaborative deep learning for benign-malignant lung nodule classification on chest CT. IEEE Trans. Med. Imaging 2018, 38, 991–1004. [Google Scholar] [CrossRef]
  24. Zhang, R.; Zhao, L.; Lou, W.; Abrigo, J.M.; Mok, V.C.; Chu, W.C.; Wang, D.; Shi, L. Automatic segmentation of acute ischemic stroke from DWI using 3-D fully convolutional DenseNets. IEEE Trans. Med. Imaging 2018, 37, 2149–2160. [Google Scholar] [CrossRef]
  25. Zeng, Z.; Xie, W.; Zhang, Y.; Lu, Y. RIC-Unet: An improved neural network based on Unet for nuclei segmentation in histology images. IEEE Access 2019, 7, 21420–21428. [Google Scholar] [CrossRef]
  26. Sharma, N.; Aggarwal, L.M. Automated medical image segmentation techniques. J. Med. Phys. Assoc. Med. Phys. India 2010, 35, 3. [Google Scholar] [CrossRef] [PubMed]
  27. Milletari, F.; Navab, N.; Ahmadi, S.A. V-net: Fully convolutional neural networks for volumetric medical image segmentation. In Proceedings of the 2016 Fourth International Conference on 3D Vision (3DV), Stanford University, Califonia, CA, USA, 25–28 October 2016; pp. 565–571. [Google Scholar]
  28. Alom, M.Z.; Hasan, M.; Yakopcic, C.; Taha, T.M.; Asari, V.K. Recurrent residual convolutional neural network based on u-net (r2u-net) for medical image segmentation. arXiv 2018, arXiv:1802.06955. [Google Scholar]
  29. Havaei, M.; Davy, A.; Warde-Farley, D.; Biard, A.; Courville, A.; Bengio, Y.; Pal, C.; Jodoin, P.M.; Larochelle, H. Brain tumor segmentation with Deep Neural Networks. Med. Image Anal. 2017, 35, 18–31. [Google Scholar] [CrossRef] [PubMed] [Green Version]
  30. Roth, H.R.; Farag, A.; Lu, L.; Turkbey, E.B.; Summers, R.M. Deep convolutional networks for pancreas segmentation in CT imaging. In Proceedings of the Medical Imaging 2015: Image Processing, Orlando, Florida, FL, USA, 24–26 February 2015; p. 94131G. [Google Scholar]
  31. Jorge, F.P.; Juan, T.O.; Edgar, R.R.; Salvador, C.; Porfirio, J.L.; Jorge, H.V.; Juan, M.R.M. Fig plant segmentation from aerial images using a deep convolutional encoder-decoder network. Remote Sens. 2019, 11, 1157. [Google Scholar] [CrossRef] [Green Version]
  32. Mulham, F.; Ali, Y.; Domenico, D.B.; Alberto, P.; Daniele, N. Crop and Weeds Classification for Precision Agriculture using Context-Independent Pixel-Wise Segmentation. In Proceedings of the 2019 3th IEEE International Conference on Robotic Computing (IRC), Naples, Italy, 25–27 February 2019; pp. 146–152. [Google Scholar]
  33. Mohsen, H.; El-Dahshan, E.S.A.; El-Horbaty, E.S.M.; Salem, A.B.M. Classification using deep learning neural networks for brain tumors. Future Comput. Inform. J. 2018, 3, 68–71. [Google Scholar] [CrossRef]
  34. Cruz-Roa, A.; Gilmore, H.; Basavanhally, A.; Feldman, M.; Ganesan, S.; Shih, N.N.C.; Tomaszewski, J.; Gonzalez, F.A.; Madabhushi, A. Accurate and reproducible invasive breast cancer detection in whole-slide images: A Deep Learning approach for quantifying tumor extent. Sci. Rep. 2017, 7, 46450. [Google Scholar] [CrossRef] [Green Version]
  35. Wang, Y.; Lei, B.; Ahmed, E.; Tan, E.L.; Wang, W.; Huang, F.; Gong, X.; Wang, T. Breast cancer image classification via multi-network features and dual-network orthogonal low-rank learning. IEEE Access 2020, 8, 27779–27792. [Google Scholar] [CrossRef]
  36. Zhou, Y.; Li, G.; Li, H. Automatic cataract classification using deep neural network with discrete state transition. IEEE Trans. Med. Imaging 2020, 39, 436–446. [Google Scholar] [CrossRef]
  37. Guo, S.; Yang, Z. Multi-Channel-ResNet: An integration framework towards skin lesion analysis. Inform. Med. Unlocked 2018, 12, 67–74. [Google Scholar] [CrossRef]
  38. Ghosh, T.; Li, L.; Chakareski, J. Effective deep learning for semantic segmentation based bleeding zone detection in capsule endoscopy images. In Proceedings of the 2018 25th IEEE International Conference on Image Processing (ICIP), Athens, Greece, 7–10 October 2018; pp. 3034–3038. [Google Scholar]
  39. Ghosh, T.; Fattah, S.A.; Wahid, K.A. Automatic bleeding detection in wireless capsule endoscopy based on RGB pixel intensity ratio. In Proceedings of the 2014 International Conference on Electrical Engineering and Information & Communication Technology, Dhaka, Bangladesh, 10–12 April 2014; pp. 1–4. [Google Scholar]
  40. Ghosh, T.; Bashar, S.K.; Alam, M.S.; Wahid, K.; Fattah, S.A. A statistical feature based novel method to detect bleeding in wireless capsule endoscopy images. In Proceedings of the 2014 International Conference on Informatics, Electronics & Vision (ICIEV), Dhaka, Bangladesh, 23–24 May 2014; pp. 1–4. [Google Scholar]
  41. Sainju, S.; Bui, F.M.; Wahid, K. Bleeding detection in wireless capsule endoscopy based on color features from histogram probability. In Proceedings of the 2013 26th IEEE Canadian Conference on Electrical and Computer Engineering (CCECE), Regina, SK, Canada, 5–8 May 2013; pp. 1–4. [Google Scholar]
  42. Gonzalez, R.C.; Woods, R.E. Digital Image Processing, 3rd ed.; Pearson Prentice Hall: Upper Saddle River, NJ, USA, 2008. [Google Scholar]
  43. Dilna, C.; Gopi, V.P. A novel method for bleeding detection in Wireless Capsule Endoscopic images. In Proceedings of the 2015 International Conference on Computing and Network Communications (CoCoNet), Trivandrum, Kerala, India, 16–19 December 2015; pp. 854–858. [Google Scholar]
  44. Ou, X.; Yan, P.; Zhang, Y.; Tu, B.; Zhang, G.; Wu, J.; Li, W. Moving object detection method via ResNet-18 with encoder–decoder structure in complex scenes. IEEE Access 2019, 7, 108152–108160. [Google Scholar] [CrossRef]
  45. Ding, Y.; Chen, F.; Zhao, Y.; Wu, Z.; Zhang, C.; Wu, D. A stacked multi-connection simple reducing net for brain tumor segmentation. IEEE Access 2019, 7, 104011–104024. [Google Scholar] [CrossRef]
  46. Yuan, Y.; Li, B.; Meng, M.Q.-H. Bleeding frame and region detection in the wireless capsule endoscopy video. IEEE J. Biomed. Health Inform. 2015, 20, 624–630. [Google Scholar] [CrossRef] [PubMed]
  47. He, J.Y.; Wu, X.; Jiang, Y.G.; Peng, Q.; Jain, R. Hookworm detection in wireless capsule endoscopy images with deep learning. IEEE Trans. Image Process. 2018, 27, 2379–2392. [Google Scholar] [CrossRef] [PubMed]
  48. Qummar, S.; Khan, F.G.; Shah, S.; Khan, A.; Shamshirband, S.; Rehman, Z.U.; Khan, I.A.; Jadoon, W. A Deep learning ensemble approach for diabetic retinopathy detection. IEEE Access 2019, 7, 150530–150539. [Google Scholar] [CrossRef]
  49. Lin, H.; Hu, Y.; Chen, S.; Yao, J.; Zhang, L. Fine-grained classification of cervical cells using morphological and appearance based convolutional neural networks. IEEE Access 2019, 7, 71541–71549. [Google Scholar] [CrossRef]
  50. Girish, G.; Thakur, B.; Chowdhury, S.R.; Kothari, A.R.; Rajan, J. Segmentation of intra-retinal cysts from optical coherence tomography images using a fully convolutional neural network model. IEEE J. Biomed. Health Inform. 2018, 23, 296–304. [Google Scholar] [CrossRef]
Figure 1. The flowchart of the present work.
Applsci 10 04908 g001
Figure 2. Two types of images: (a) the image with the red light and (b) that without the red light.
Applsci 10 04908 g002
Figure 3. The flowchart of the ResNet-50 model.
Applsci 10 04908 g003
Figure 4. (a1a3) Original images that consist of the blood and red light. (b1b3) Image processing results using the hue, saturation, and value (HSV) color space analysis method.
Applsci 10 04908 g004
Figure 5. The flowchart of the U-Net deep learning model.
Applsci 10 04908 g005
Figure 6. The example of the bleeding areas by the HSV color space. (a) Original image samples with the red and non-red lights. (b) The detection of the bleeding areas.
Applsci 10 04908 g006
Figure 7. Calculation process of prostate occupation. (a) Original image. (b) Edge detection image processing. (c) Morphology image processing. (d) The calculation of the short and long radii.
Applsci 10 04908 g007
Figure 8. The examples of frames shown per 0.1 s in a video of the prostate surgery (e.g., the meaning of 0.1 s represents the surgery clips at 0.1 s).
Applsci 10 04908 g008
Figure 9. ResNet-50 model training results. (a) The accuracy of self-predicted data. (b) The loss function of self-predicted data.
Applsci 10 04908 g009
Figure 10. The images of false classification in the confusion matrix of Table 4. (a1,a2) Examples of FN images. (b1,b2) Examples of FP images.
Applsci 10 04908 g010
Figure 11. Illustration of the training performance of the model. (a) Dice of coefficient. (b) Intersection over union (IOU). (c) Residual coefficient.
Applsci 10 04908 g011
Figure 12. U-Net model training results. (a) The accuracy of self-predicted data. (b) The loss function of self-predicted data.
Applsci 10 04908 g012
Table 1. The structures of the ResNet-50 model.
Layer NameOutput SizeStructure
Conv1112 × 1127 × 7, 64, stride 2
Conv2_x56 × 56 [ 1 × 1 ,   64 3 × 3 ,   64 1 × 1 ,   256 ] × 3
Con3_x28 × 28 [ 1 × 1 ,   128 3 × 3 ,   128 1 × 1 ,   512 ] × 4
Conv4_x14 × 14 [ 1 × 1 ,   256 3 × 3 ,   256 1 × 1 ,   1024 ] × 6
Conv5_x7 × 7 [ 1 × 1 ,   512 3 × 3 ,   512 1 × 1 ,   2048 ] × 3
1 × 1Average pooling, Fully Connected, Softmax
Table 2. Example of the four levels of the bleeding area ratio (BAR).
Level1234
Pixel of Bleeding0%~25%
of BAR
25%~50%
of BAR
50%~75%
of BAR
75%~100%
of BAR
Original Image Applsci 10 04908 i001 Applsci 10 04908 i002 Applsci 10 04908 i003 Applsci 10 04908 i004
Bleeding Areas Applsci 10 04908 i005 Applsci 10 04908 i006 Applsci 10 04908 i007 Applsci 10 04908 i008
Table 3. The dataset ratio of the transurethral resection of the prostate (TURP) surgery.
Training/Validation10,410 images
Testing15,615 images
Table 4. Definition of classification metrics.
Actual Class Label
Prediction
Class
Label
YesNo
YesTPFP
NoFNTN
SensitivitySpecificity
TP, number of correctly classified images with the red light; TN, number of correctly classified images with the non-red light; FN, number of falsely classified images with the red light; FP, number of falsely classified image.
Table 5. Confusion matrix of testing TURP surgery datasets.
PREDICTED CLASS LABEL
ACTUAL
CLASS
LABEL
With Red LightWithout Red Light
With Red Light1899251
Without Red Light10013,373
Table 6. Results of classification.
DatasetAccuracy (%)Sensitivity (%)Specificity (%)
Testing
TURP surgery datasets
979894
Table 7. Training performance of the U-Net segmentation model.
IndexTraining ImageGround Truth (GT)PredictionGT and Prediction
1 Applsci 10 04908 i009 Applsci 10 04908 i010 Applsci 10 04908 i011 Applsci 10 04908 i012
2 Applsci 10 04908 i013 Applsci 10 04908 i014 Applsci 10 04908 i015 Applsci 10 04908 i016
3 Applsci 10 04908 i017 Applsci 10 04908 i018 Applsci 10 04908 i019 Applsci 10 04908 i020
4 Applsci 10 04908 i021 Applsci 10 04908 i022 Applsci 10 04908 i023 Applsci 10 04908 i024
Table 8. Performance of segmenting the red light image using U-Net model.
IndexTesting ImagesExtraction AreaSegmentation
1 Applsci 10 04908 i025 Applsci 10 04908 i026 Applsci 10 04908 i027
2 Applsci 10 04908 i028 Applsci 10 04908 i029 Applsci 10 04908 i030
3 Applsci 10 04908 i031 Applsci 10 04908 i032 Applsci 10 04908 i033
4 Applsci 10 04908 i034 Applsci 10 04908 i035 Applsci 10 04908 i036
5 Applsci 10 04908 i037 Applsci 10 04908 i038 Applsci 10 04908 i039
6 Applsci 10 04908 i040 Applsci 10 04908 i041 Applsci 10 04908 i042
7 Applsci 10 04908 i043 Applsci 10 04908 i044 Applsci 10 04908 i045
8 Applsci 10 04908 i046 Applsci 10 04908 i047 Applsci 10 04908 i048
9 Applsci 10 04908 i049 Applsci 10 04908 i050 Applsci 10 04908 i051
10 Applsci 10 04908 i052 Applsci 10 04908 i053 Applsci 10 04908 i054
Table 9. The performance of bleeding area extraction using the HSV color space.
IndexTesting ImageBleeding Area without
Using U-Net Model
Bleeding Area with
Using U-Net Model
1 Applsci 10 04908 i055 Applsci 10 04908 i056 Applsci 10 04908 i057
2 Applsci 10 04908 i058 Applsci 10 04908 i059 Applsci 10 04908 i060
3 Applsci 10 04908 i061 Applsci 10 04908 i062 Applsci 10 04908 i063
4 Applsci 10 04908 i064 Applsci 10 04908 i065 Applsci 10 04908 i066
5 Applsci 10 04908 i067 Applsci 10 04908 i068 Applsci 10 04908 i069
6 Applsci 10 04908 i070 Applsci 10 04908 i071 Applsci 10 04908 i072
7 Applsci 10 04908 i073 Applsci 10 04908 i074 Applsci 10 04908 i075
8 Applsci 10 04908 i076 Applsci 10 04908 i077 Applsci 10 04908 i078
9 Applsci 10 04908 i079 Applsci 10 04908 i080 Applsci 10 04908 i081
10 Applsci 10 04908 i082 Applsci 10 04908 i083 Applsci 10 04908 i084
Table 10. The comparison of the mean residual coefficient score with different models.
ModelMean Residual Coefficient
(EPOCH = 50 LR = 0.00001)
Res-Unet model0.28
Autoencoder model [31]0.63
Segnet model [32]0.70
Table 11. The comparison of removing the misjudgment area.
IndexTesting ImageRes-Unet ModelAutoencoder ModelSegnet Model
1 Applsci 10 04908 i085 Applsci 10 04908 i086 Applsci 10 04908 i087 Applsci 10 04908 i088
2 Applsci 10 04908 i089 Applsci 10 04908 i090 Applsci 10 04908 i091 Applsci 10 04908 i092
3 Applsci 10 04908 i093 Applsci 10 04908 i094 Applsci 10 04908 i095 Applsci 10 04908 i096
4 Applsci 10 04908 i097 Applsci 10 04908 i098 Applsci 10 04908 i099 Applsci 10 04908 i100

