Identifying Groundwater Fluoride Source in a Weathered Basement Aquifer in Central Malawi: Human Health and Policy Implications

 ,
, 

Abstract
:
1. Introduction
- Use of borehole water quality surveys to assess groundwater fluoride occurrence;
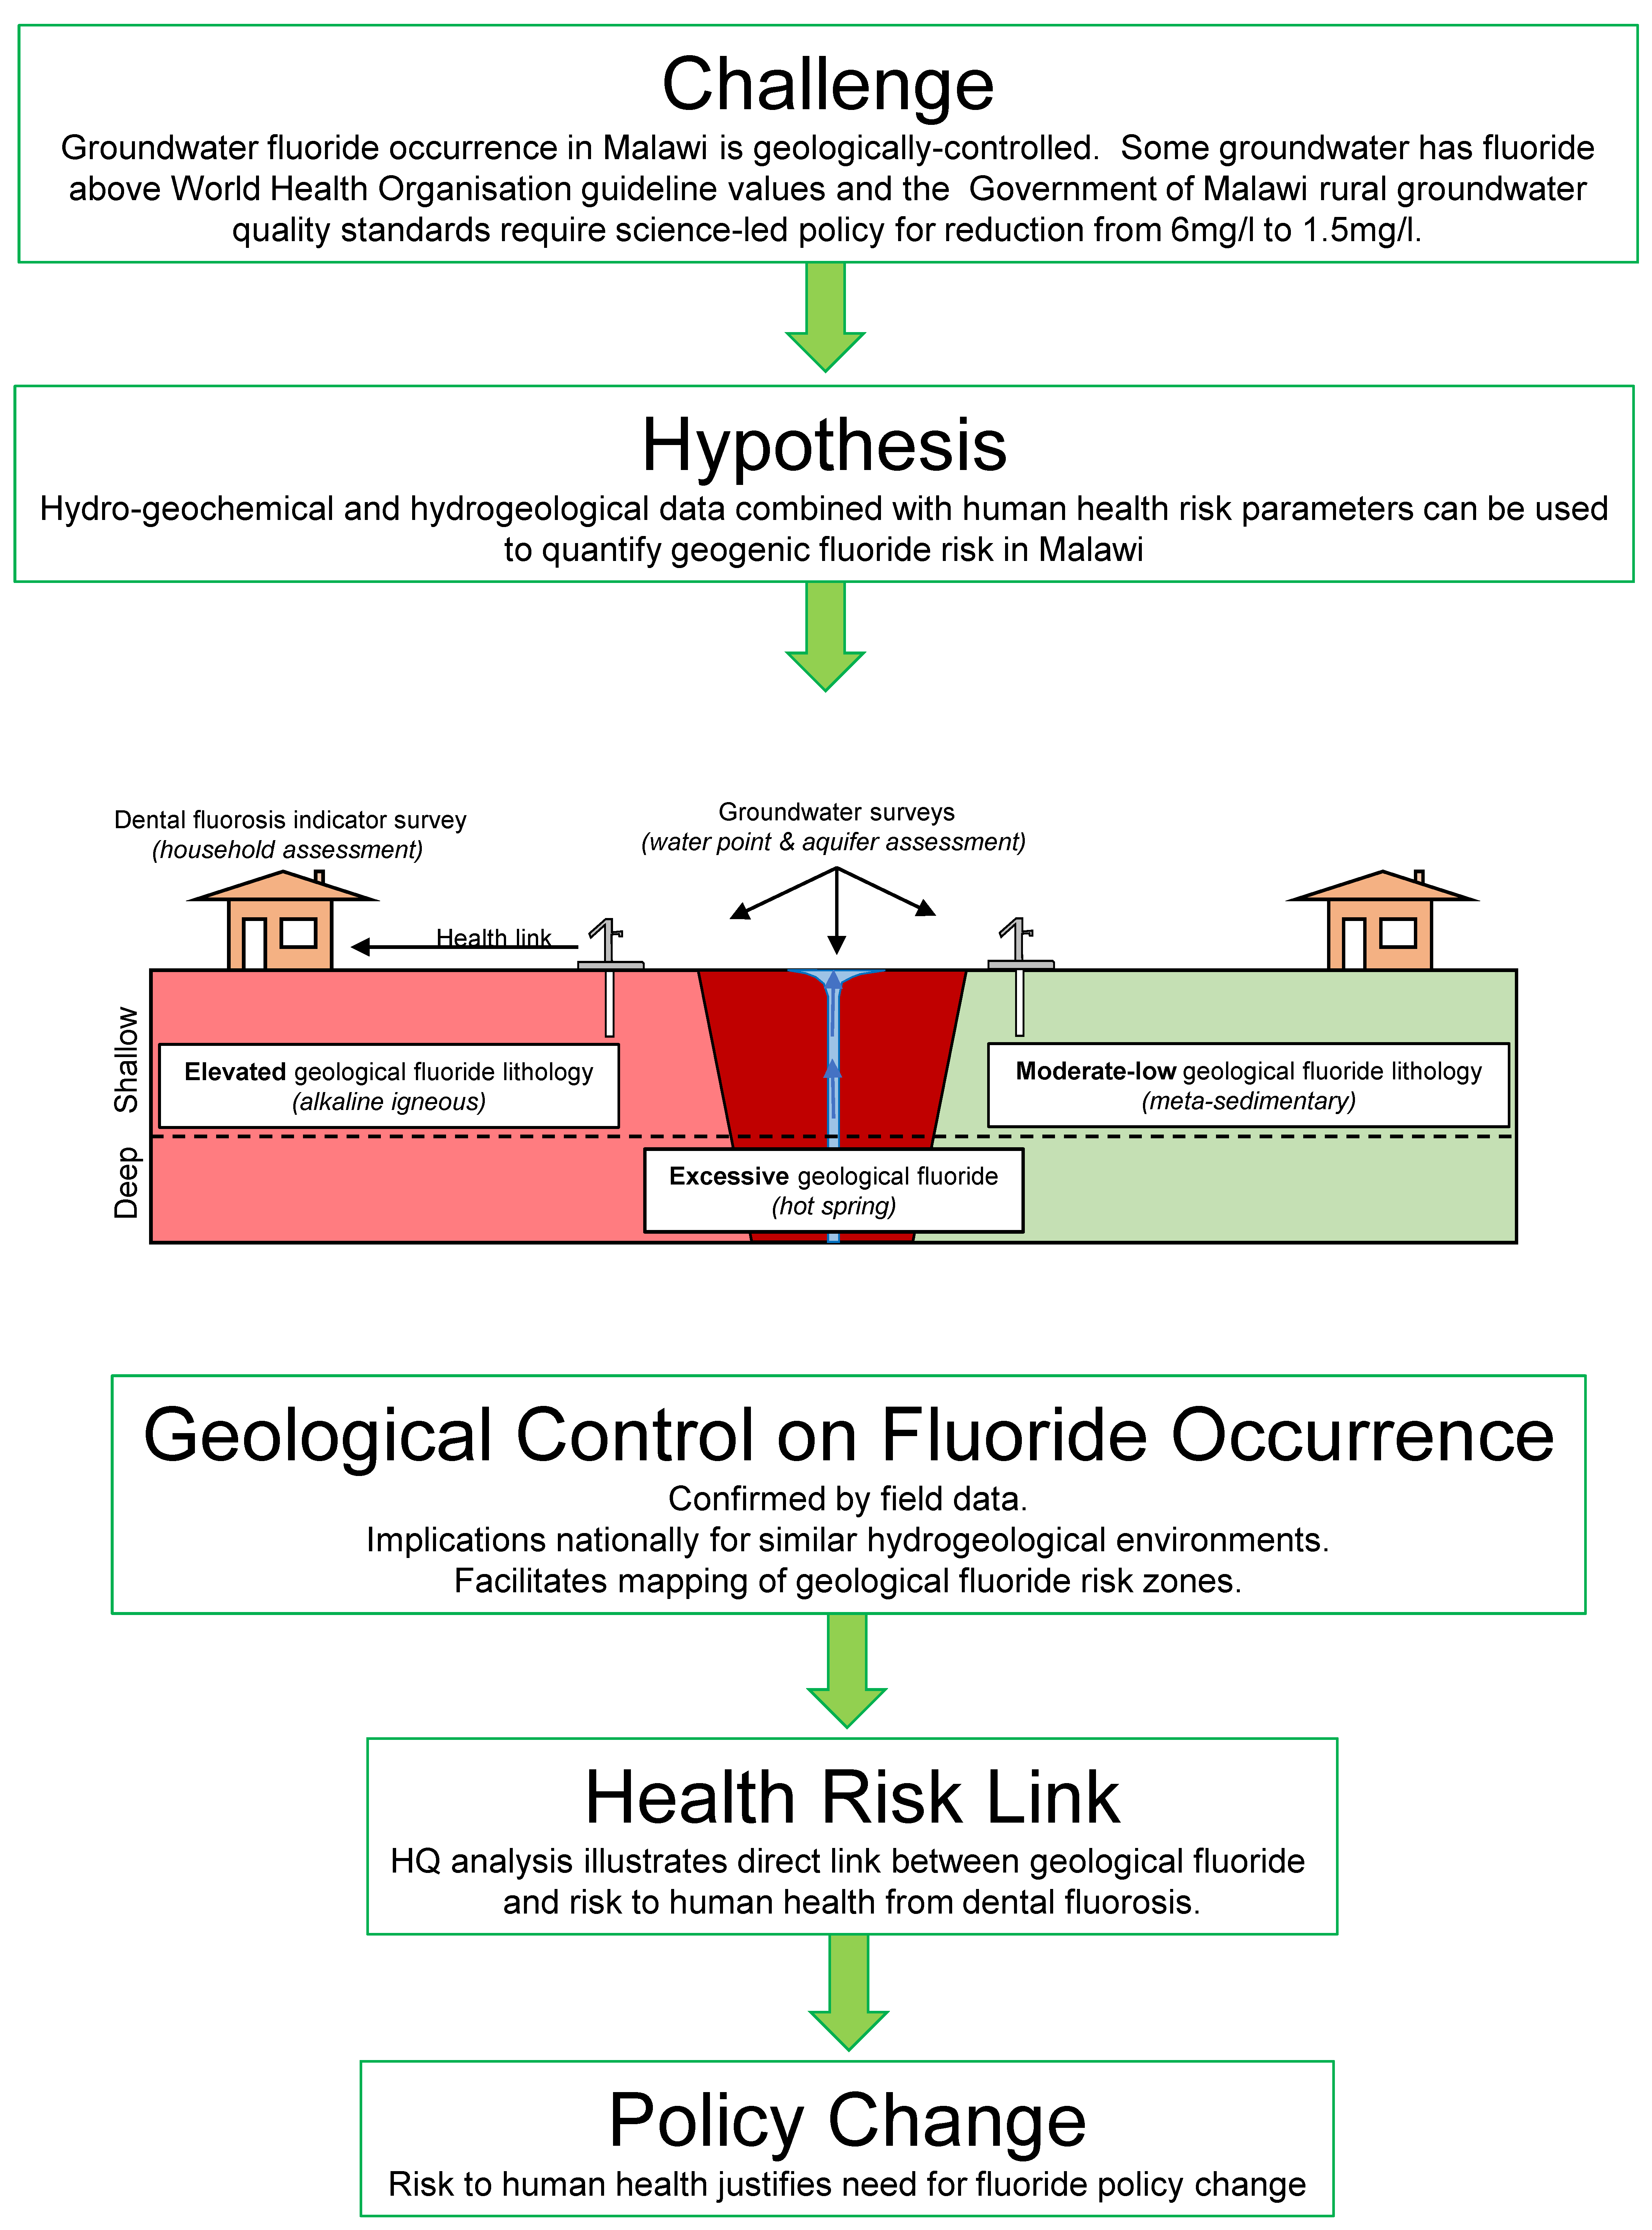
- Assessment of the hypothesised geological control on observed groundwater fluoride;
- Use of Government of Malawi survey results to assess health risks via proxy dental fluorosis indicators;
- Integrating these lines of evidence to investigate linkages between groundwater fluoride and health and develop risk factors for water points.
2. Study Area
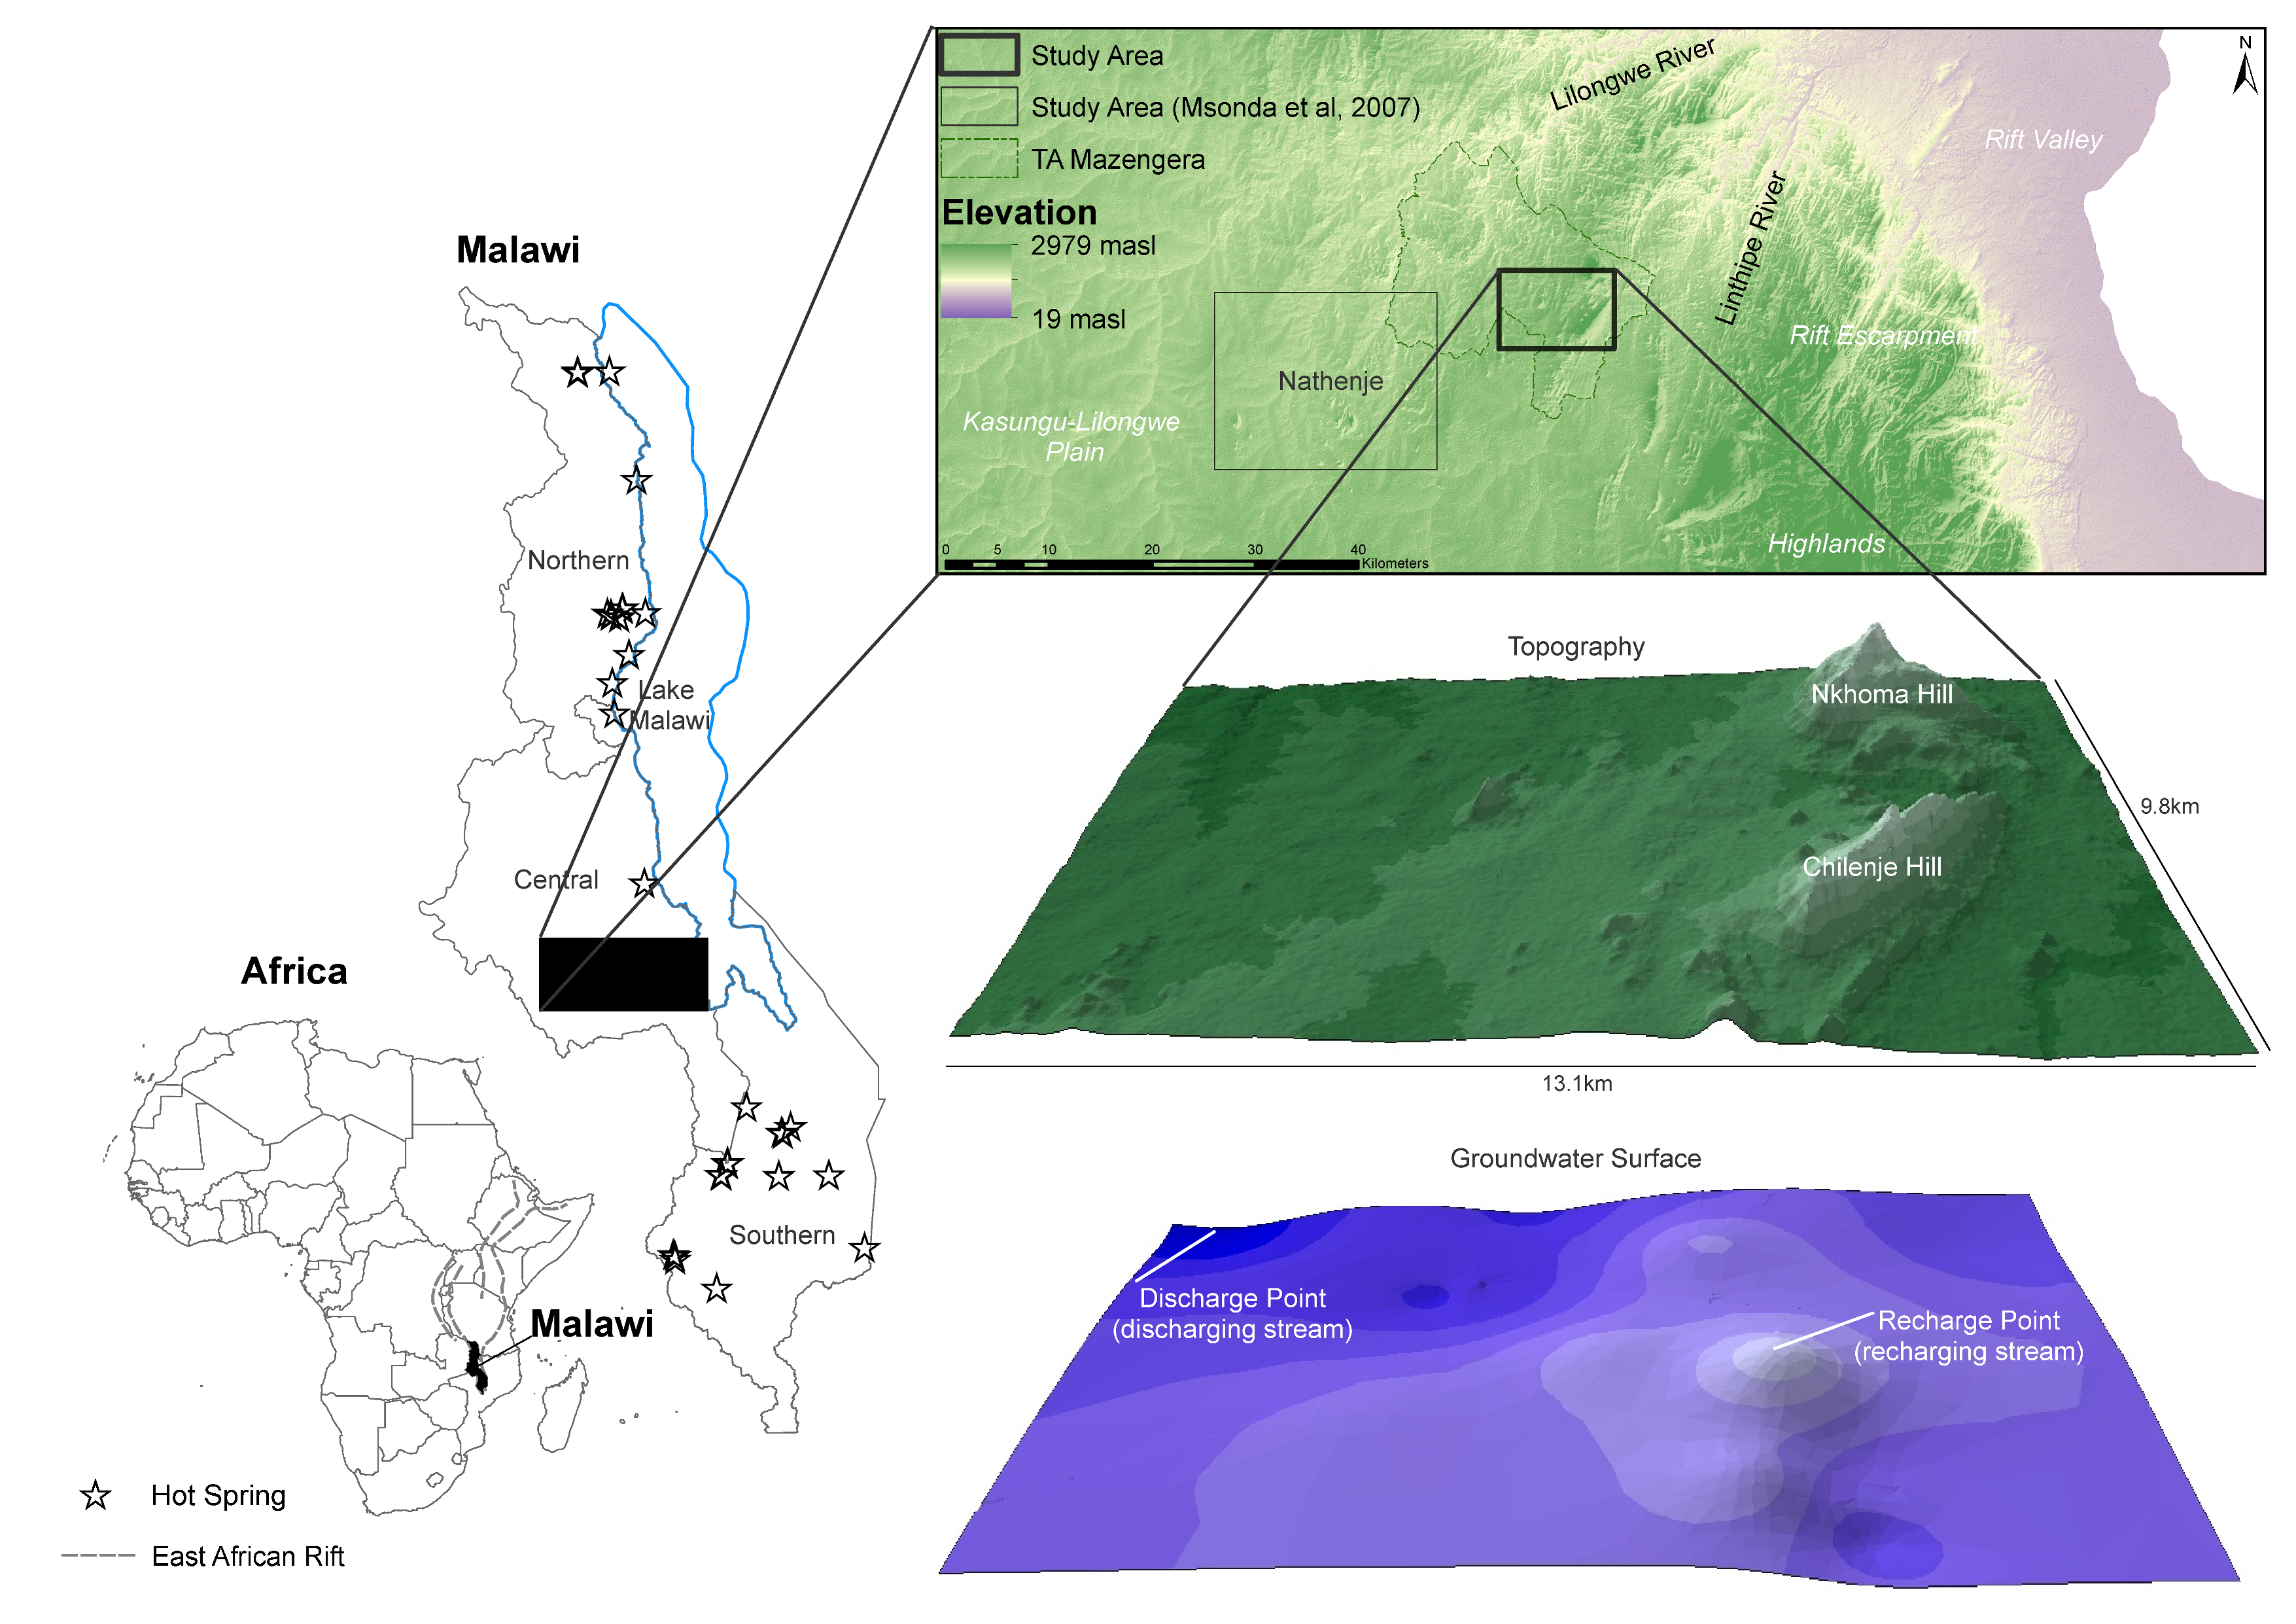
2.1. Setting
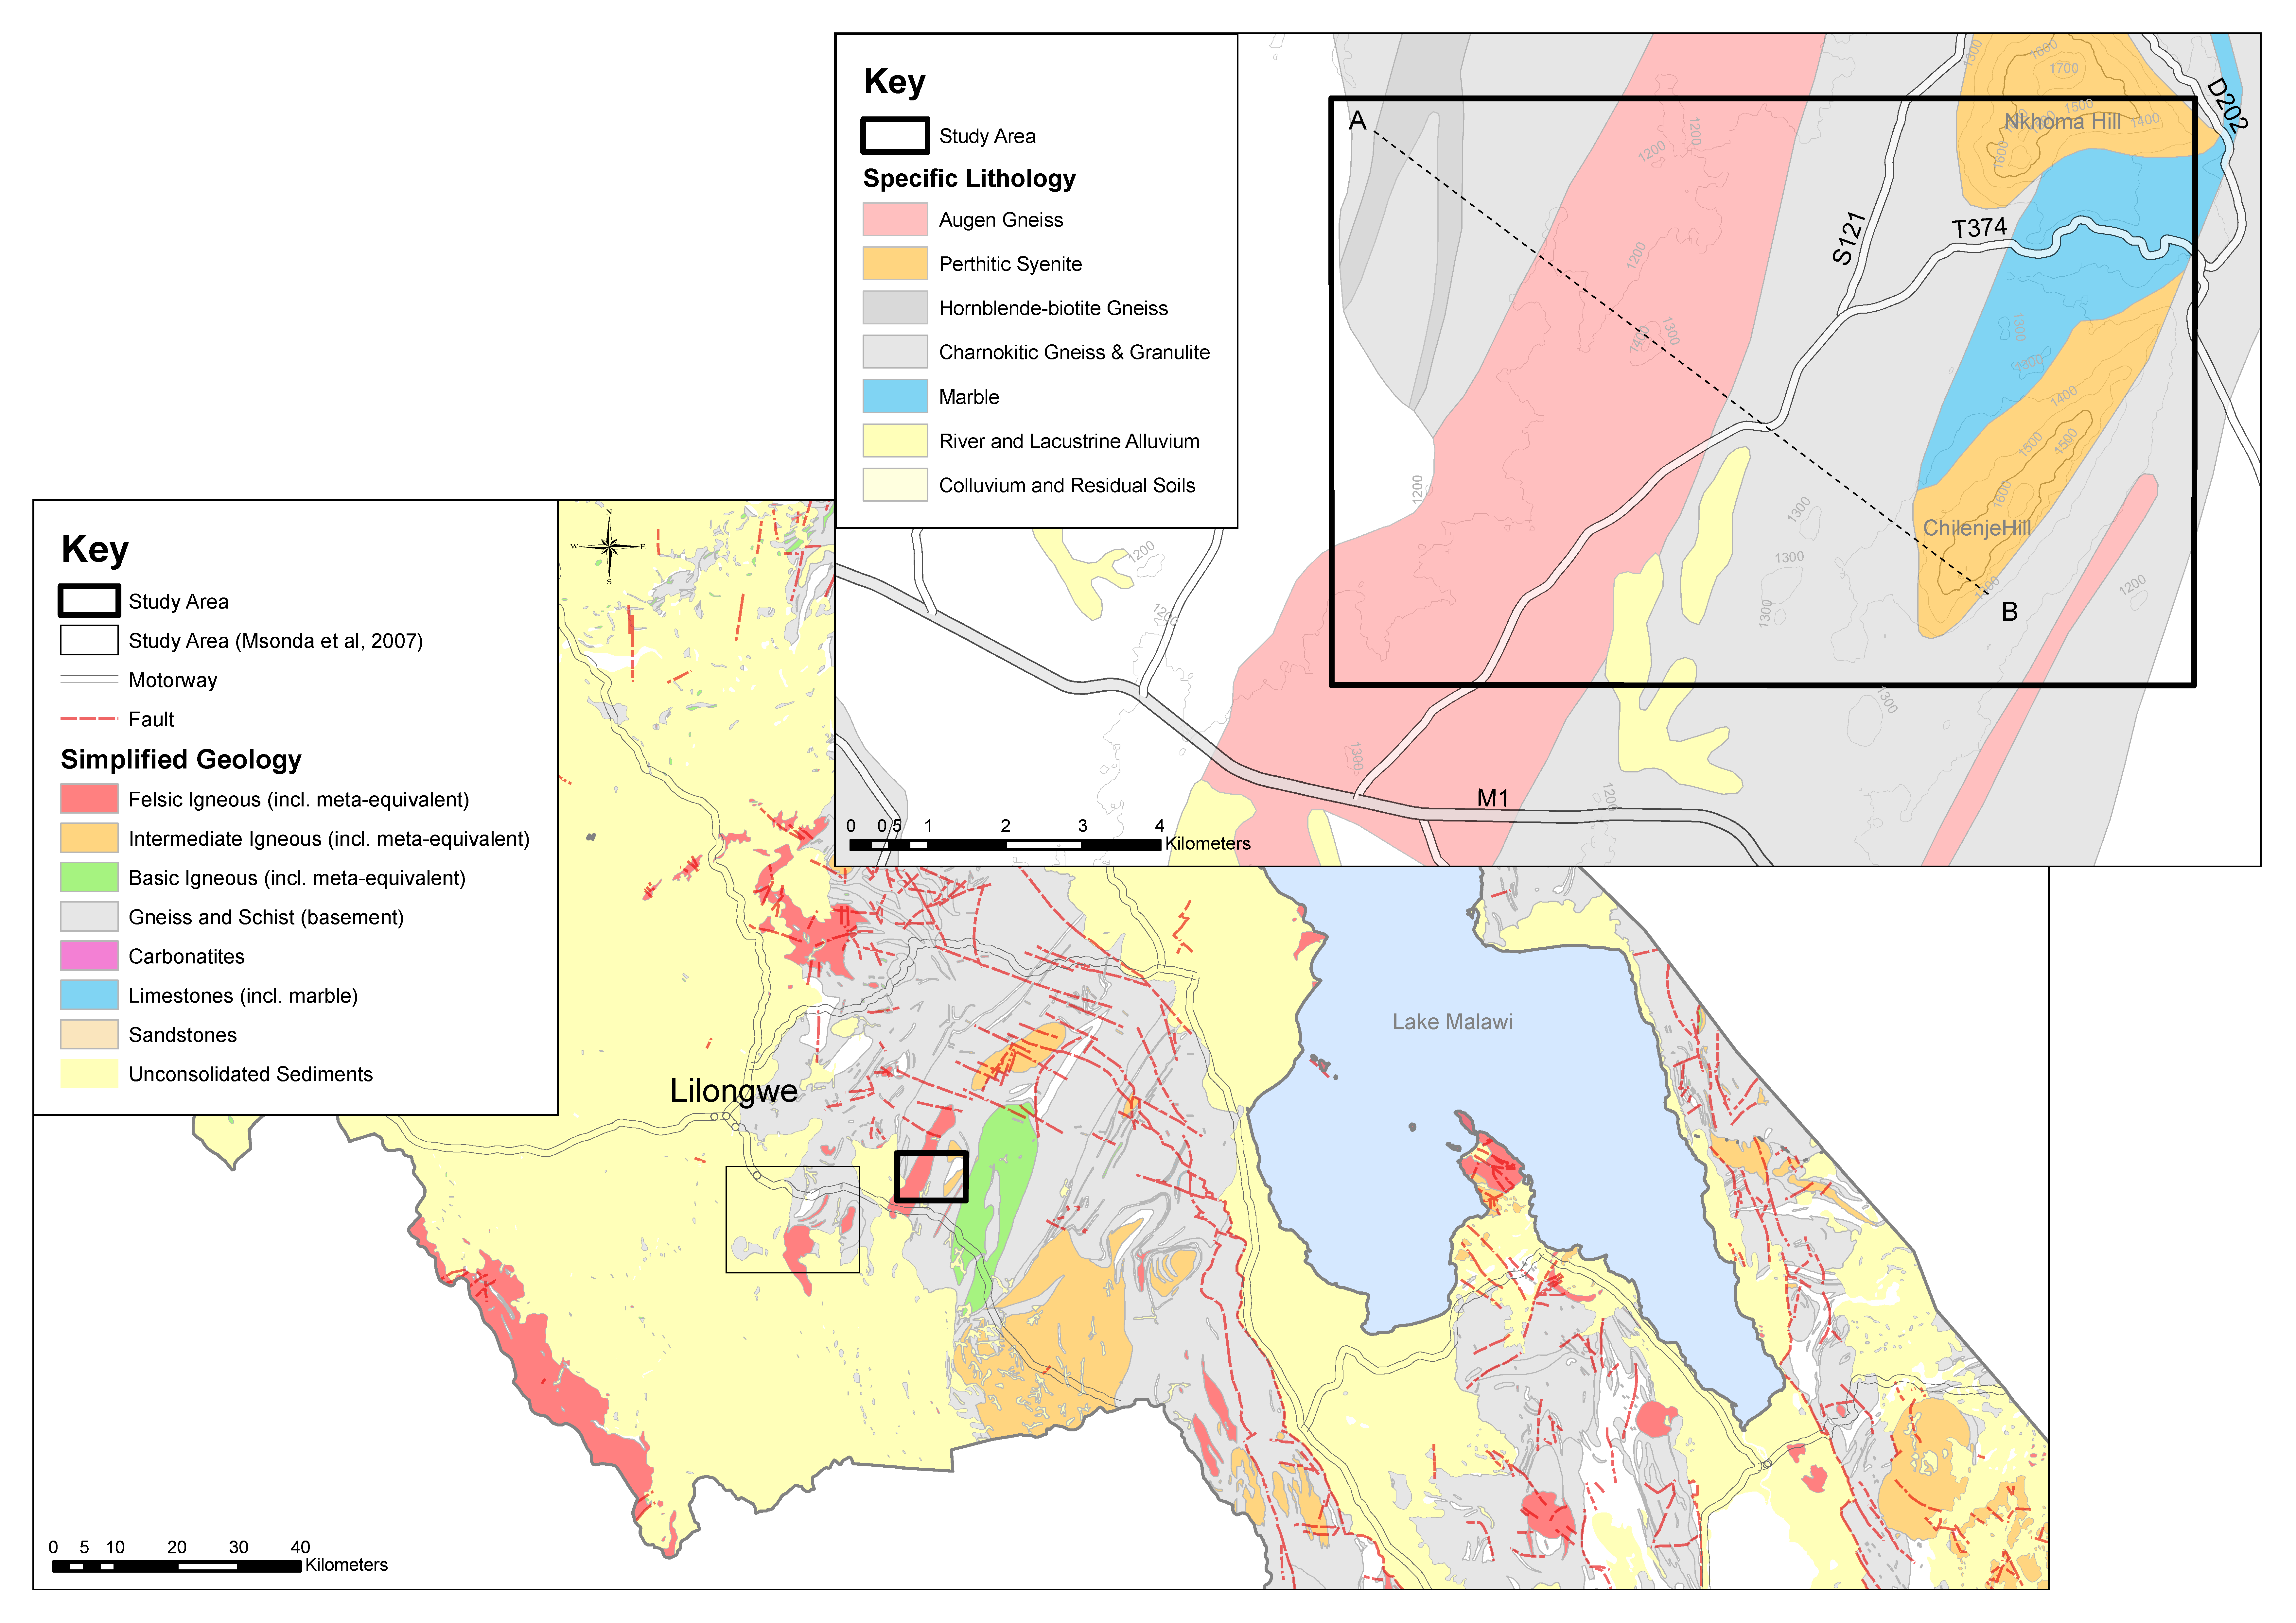
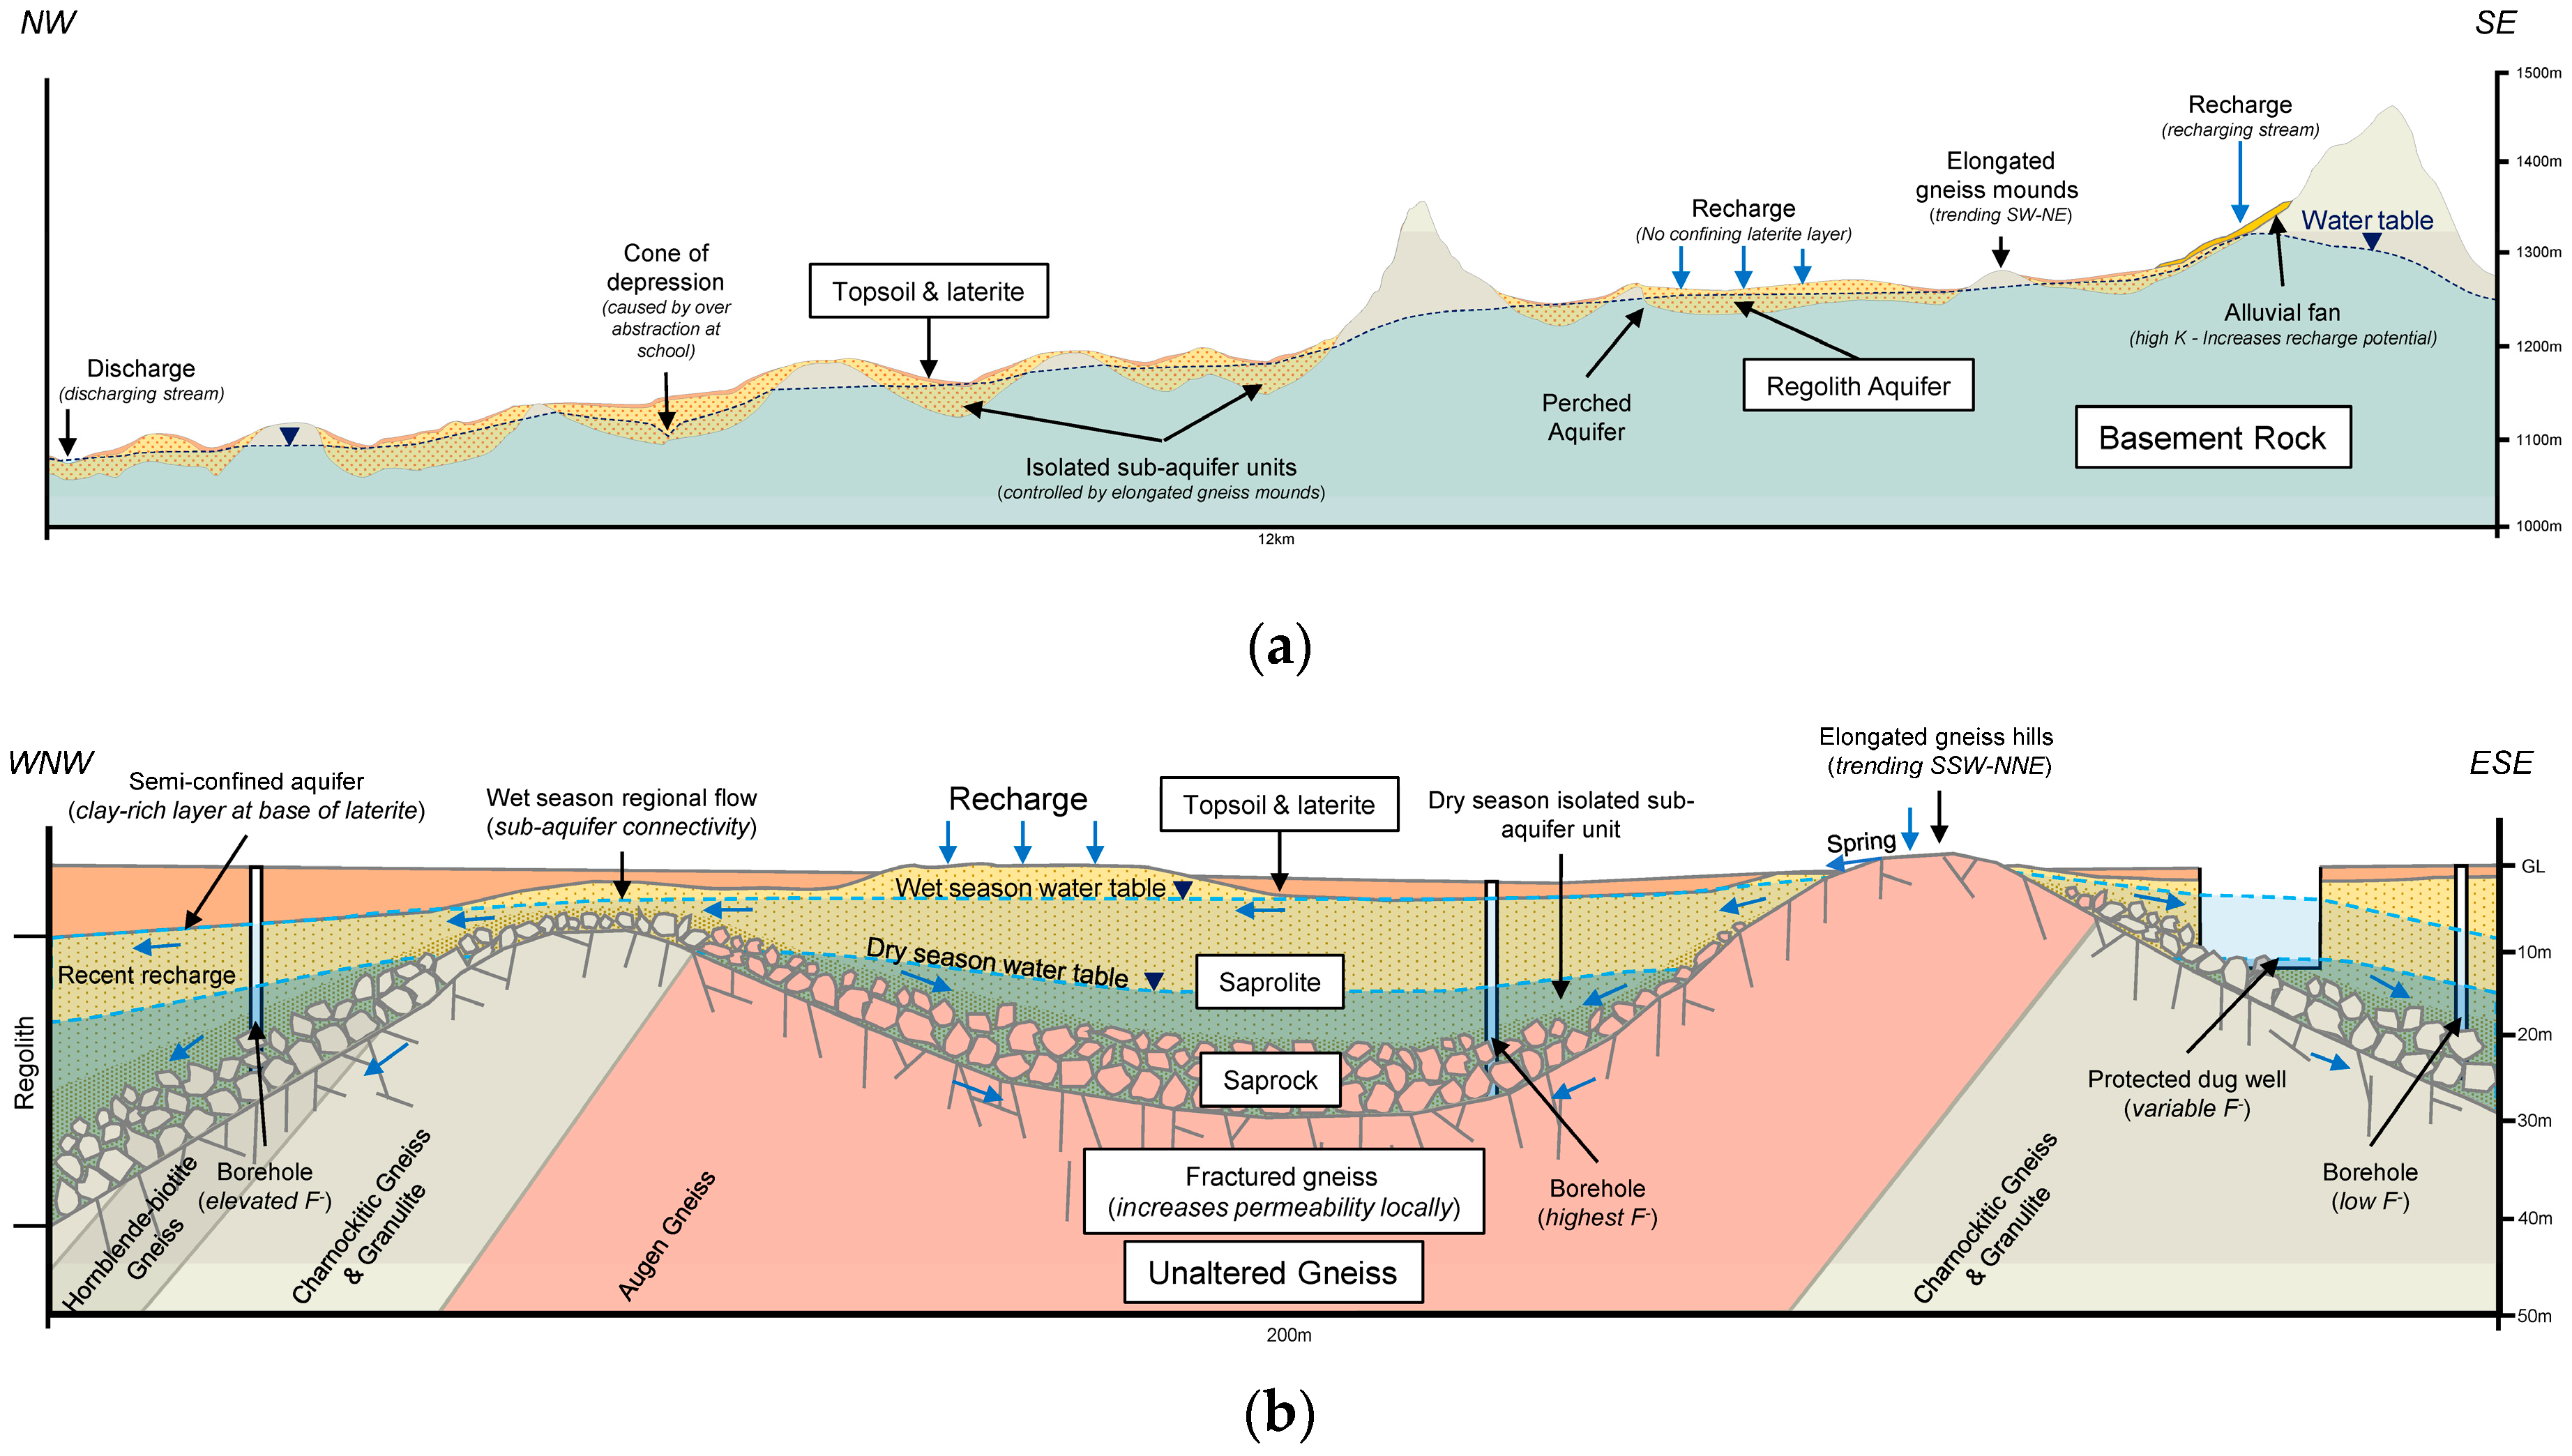
2.2. Geology and Hydrogeology
3. Materials and Methods
3.1. Groundwater Survey
3.2. Survey Data
3.3. Risk Evaluation
3.3.1. Mapping Risk
3.3.2. Human Health Risk Assessment
4. Results
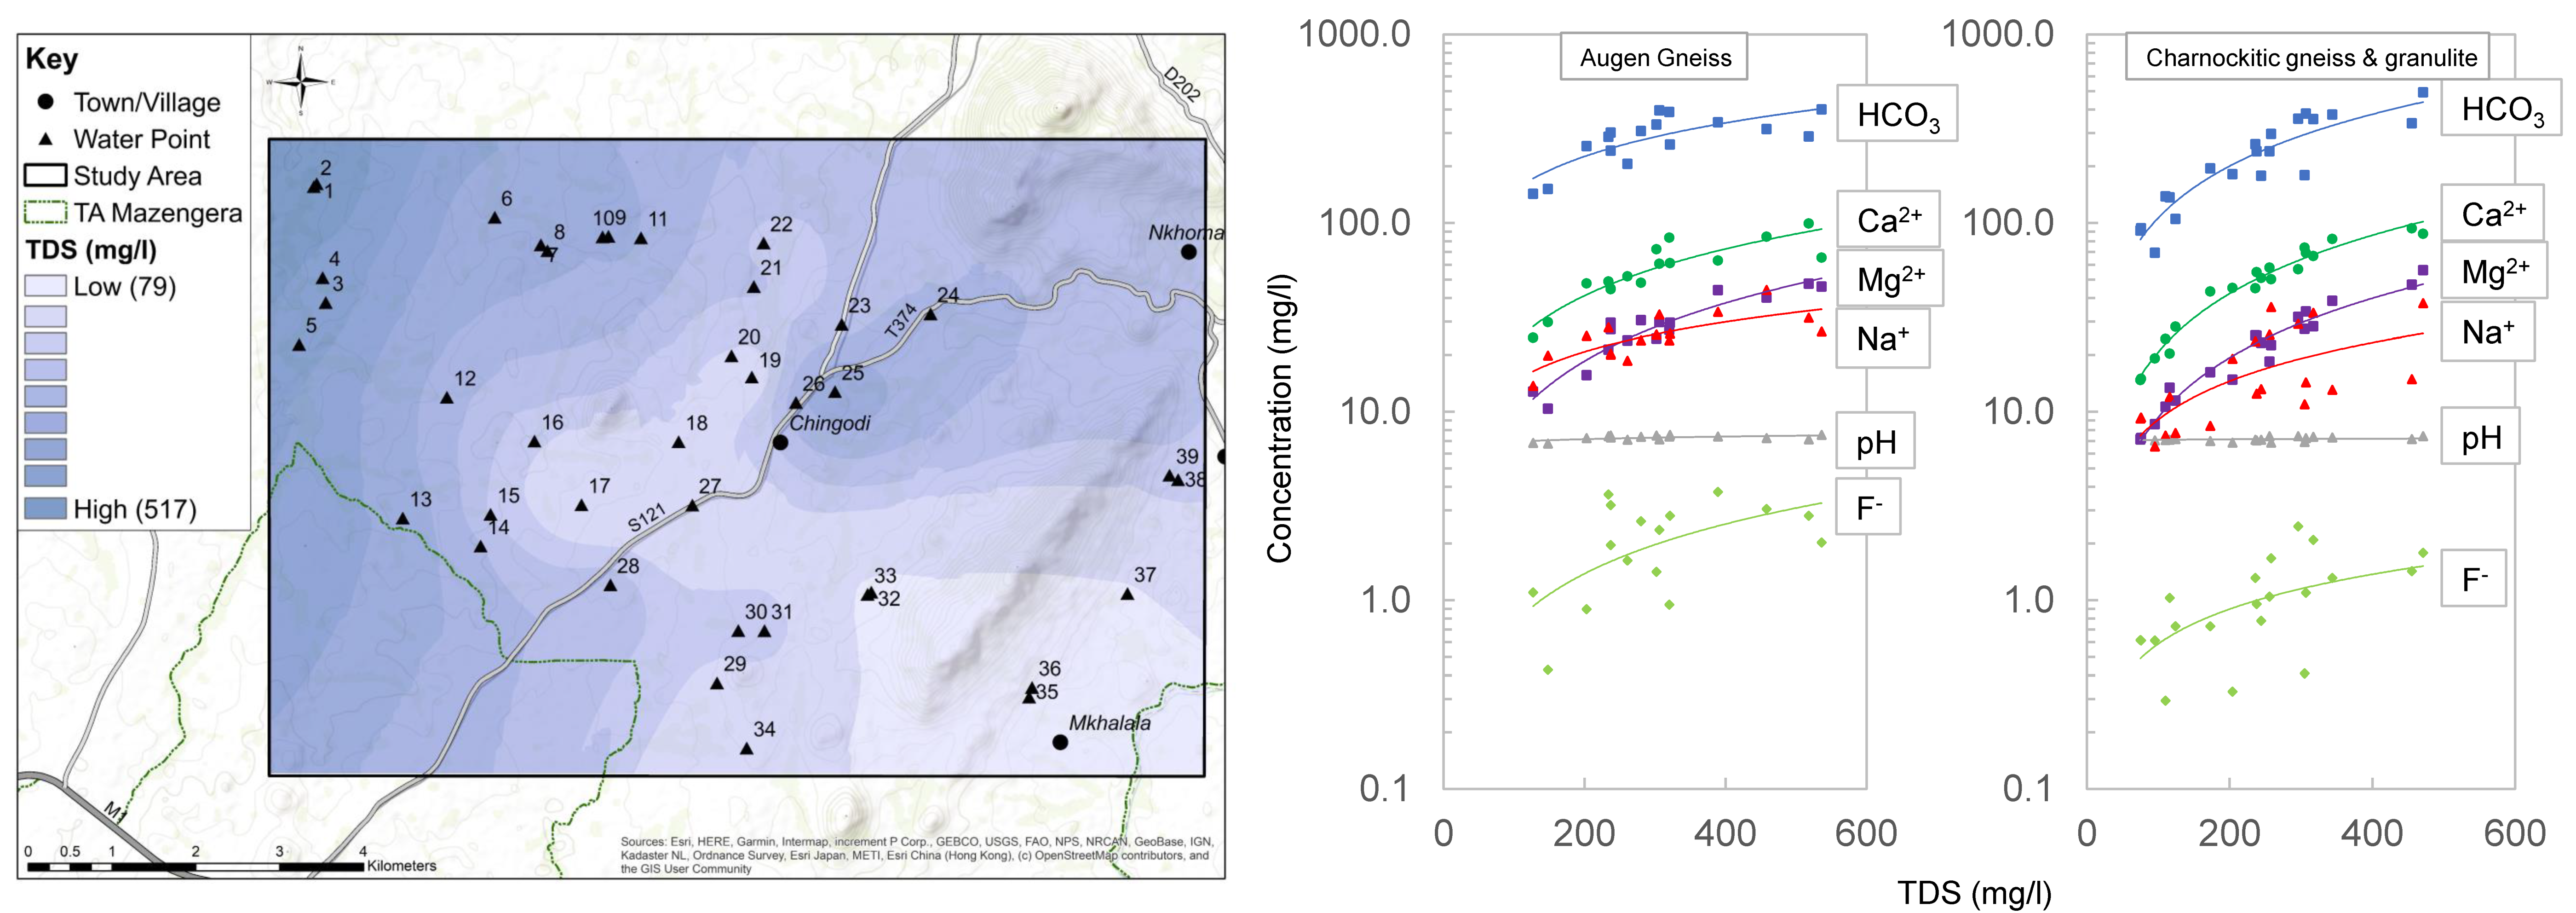
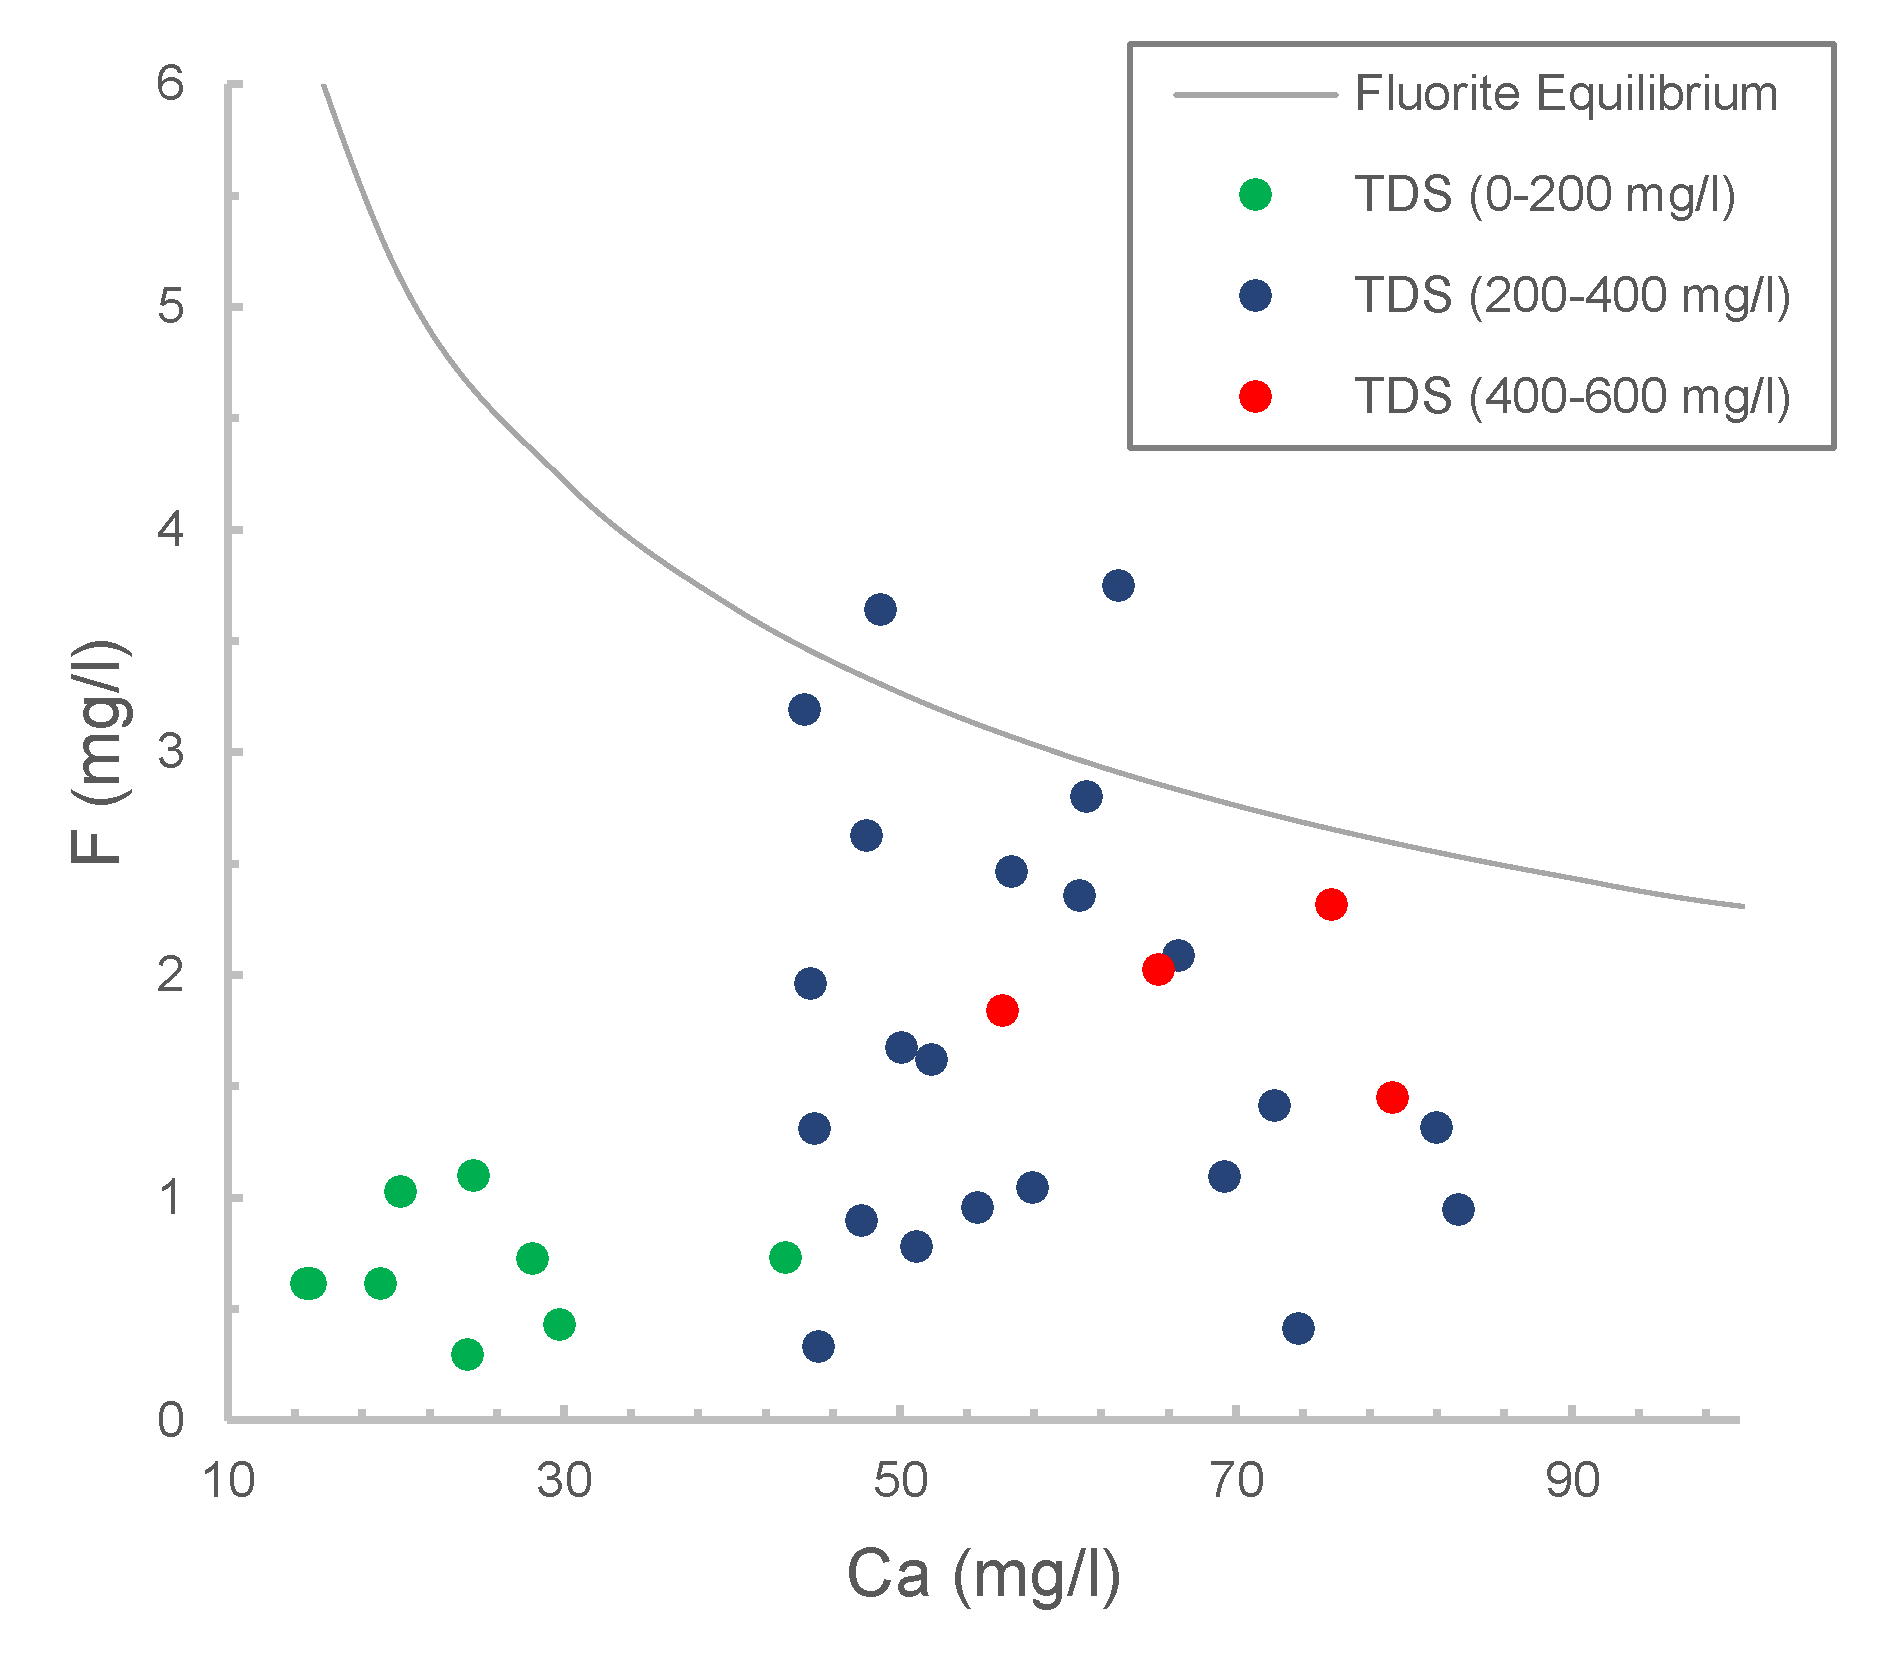
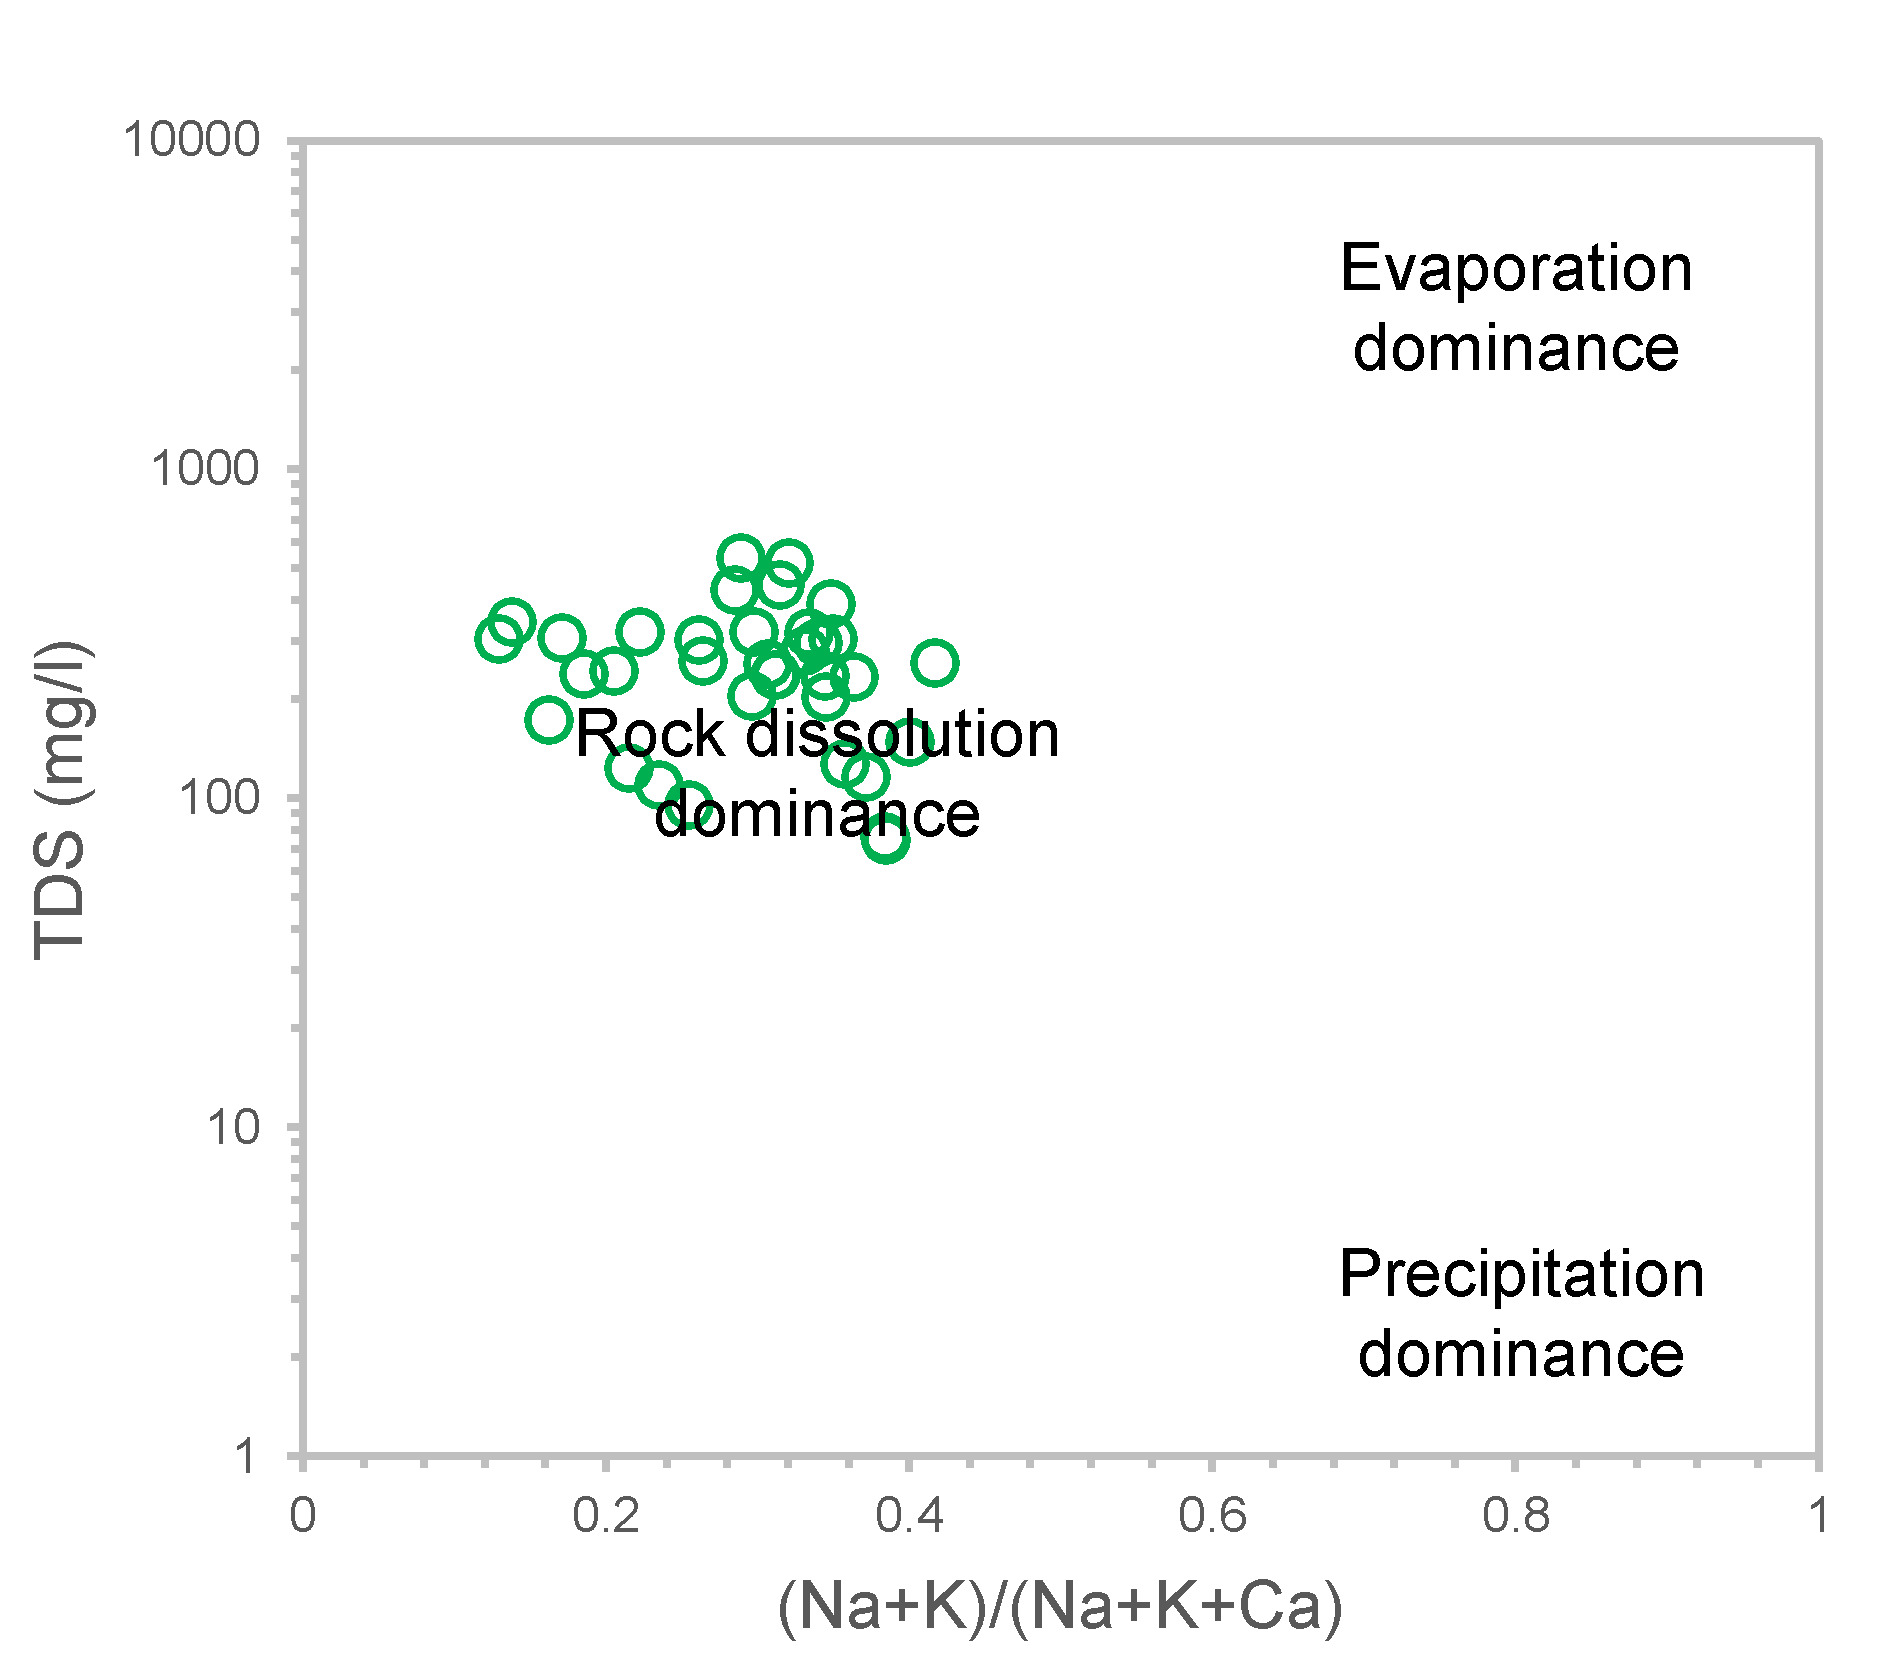
4.1. Hydrochemical Observations
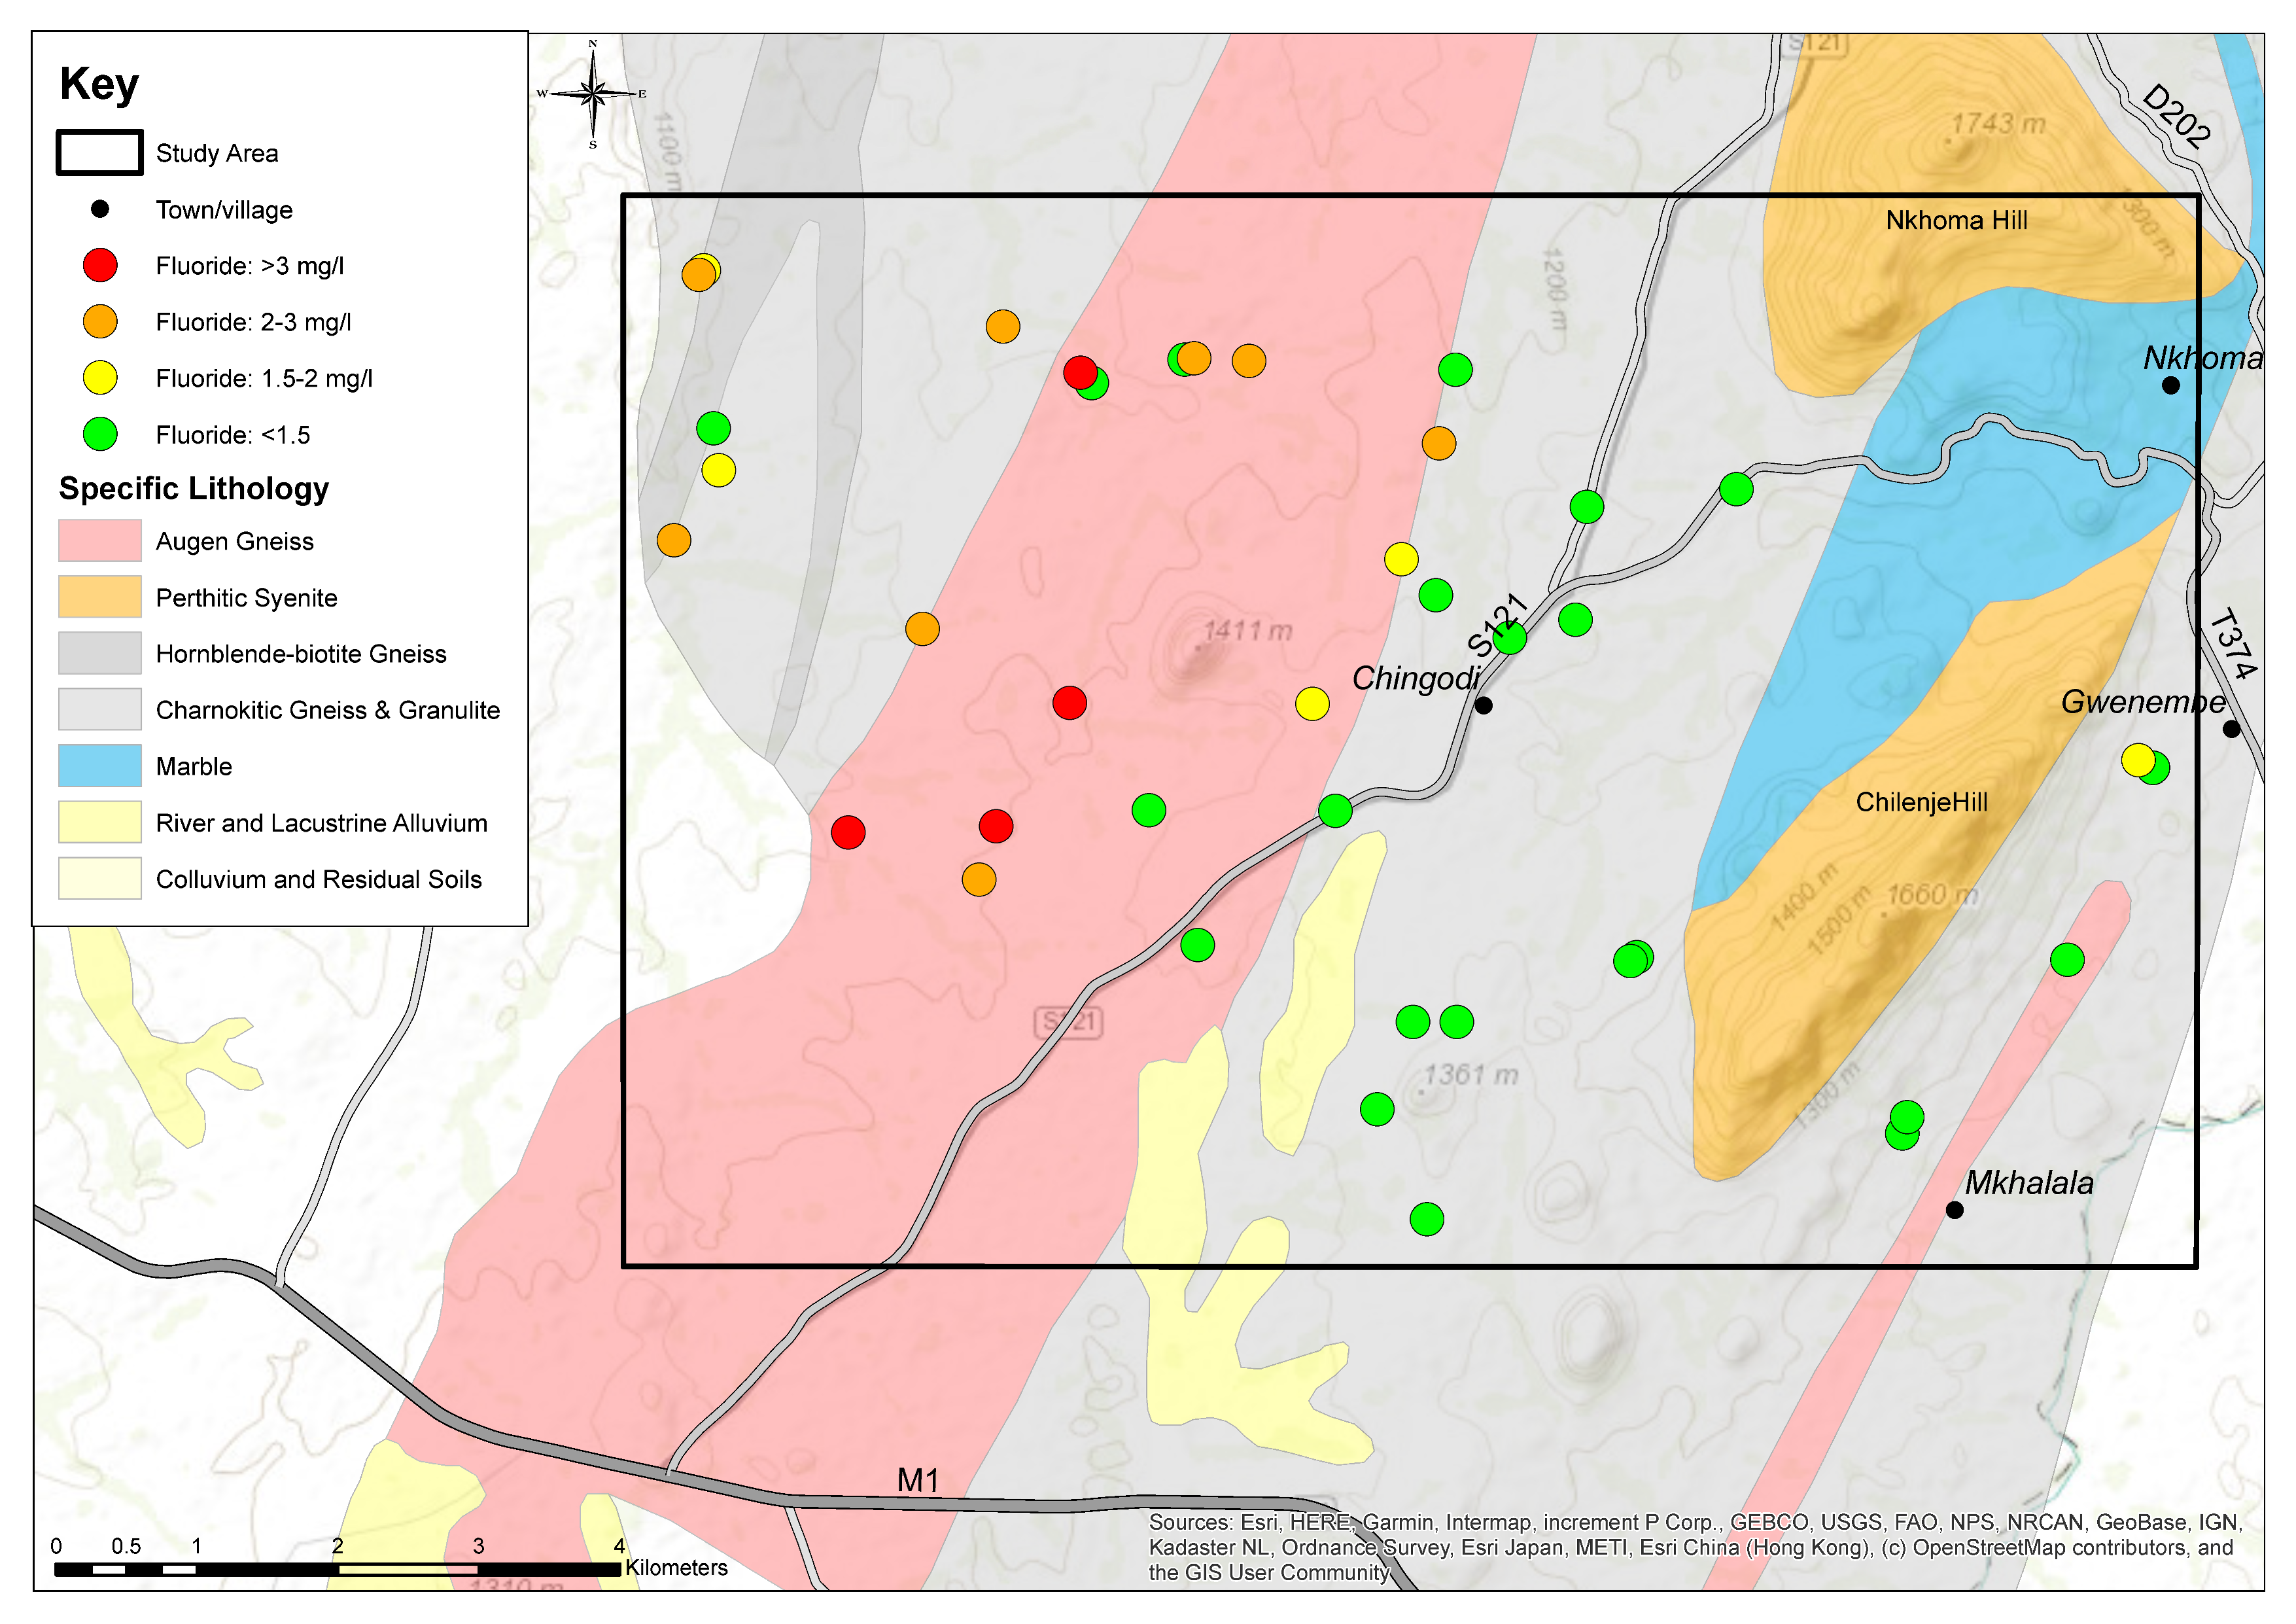
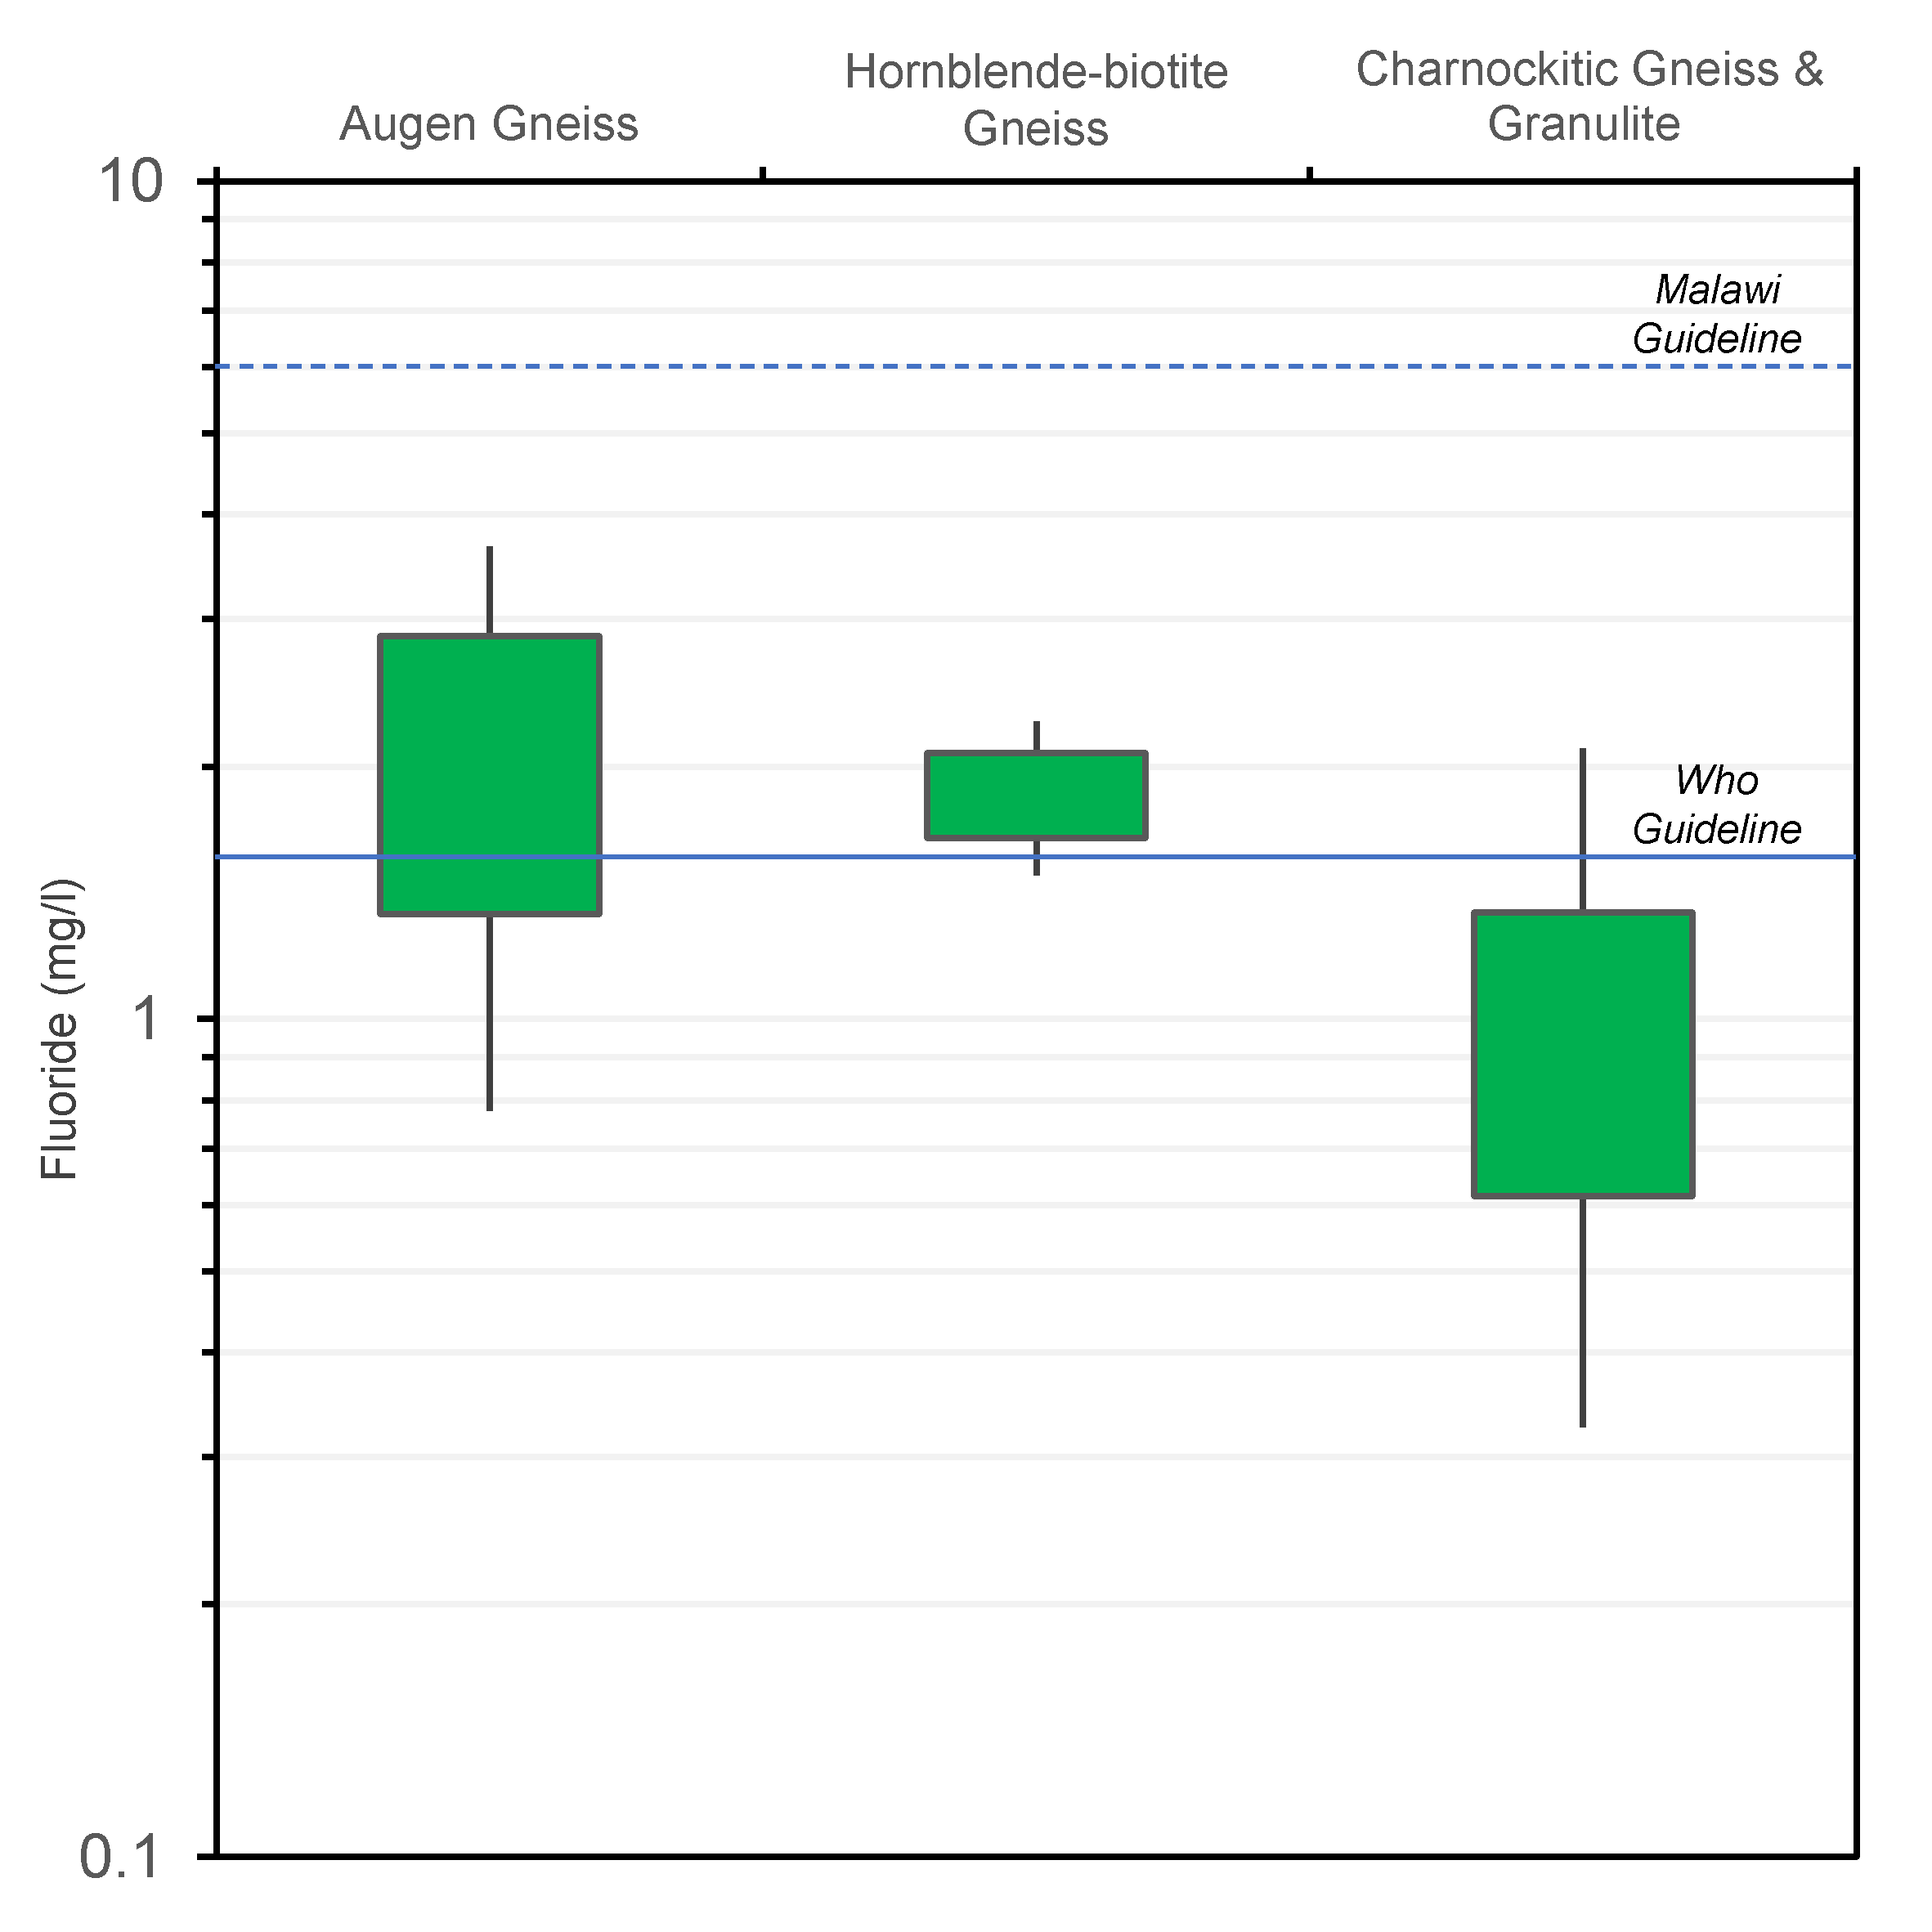
4.2. Geological Controls on Fluoride Occurrence
4.3. Dental Fluorosis Indicators
4.4. Risk Evaluation
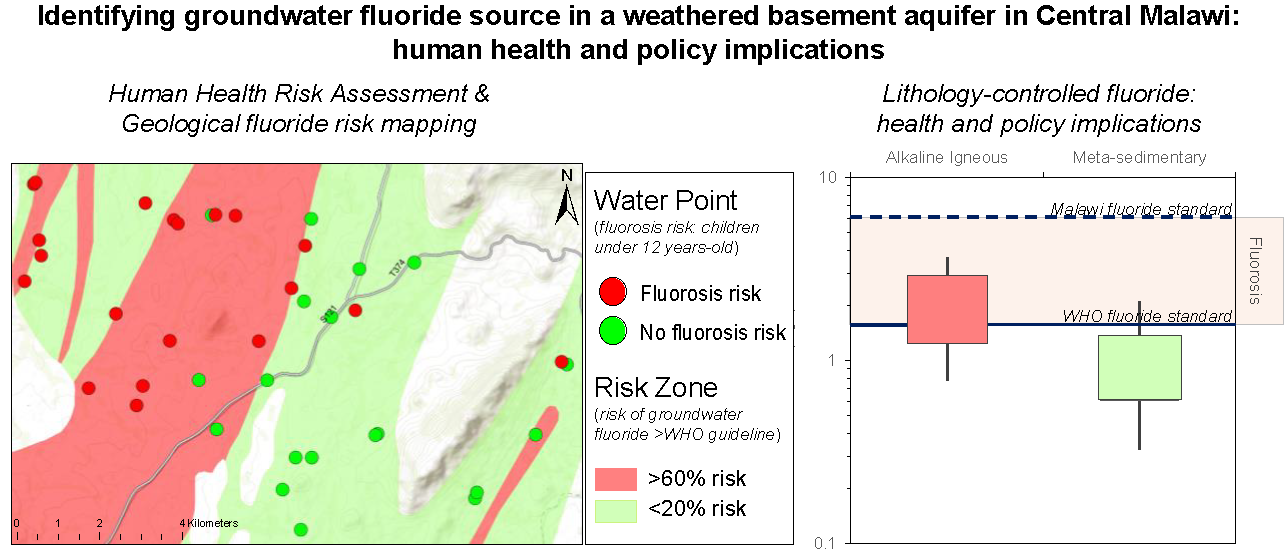
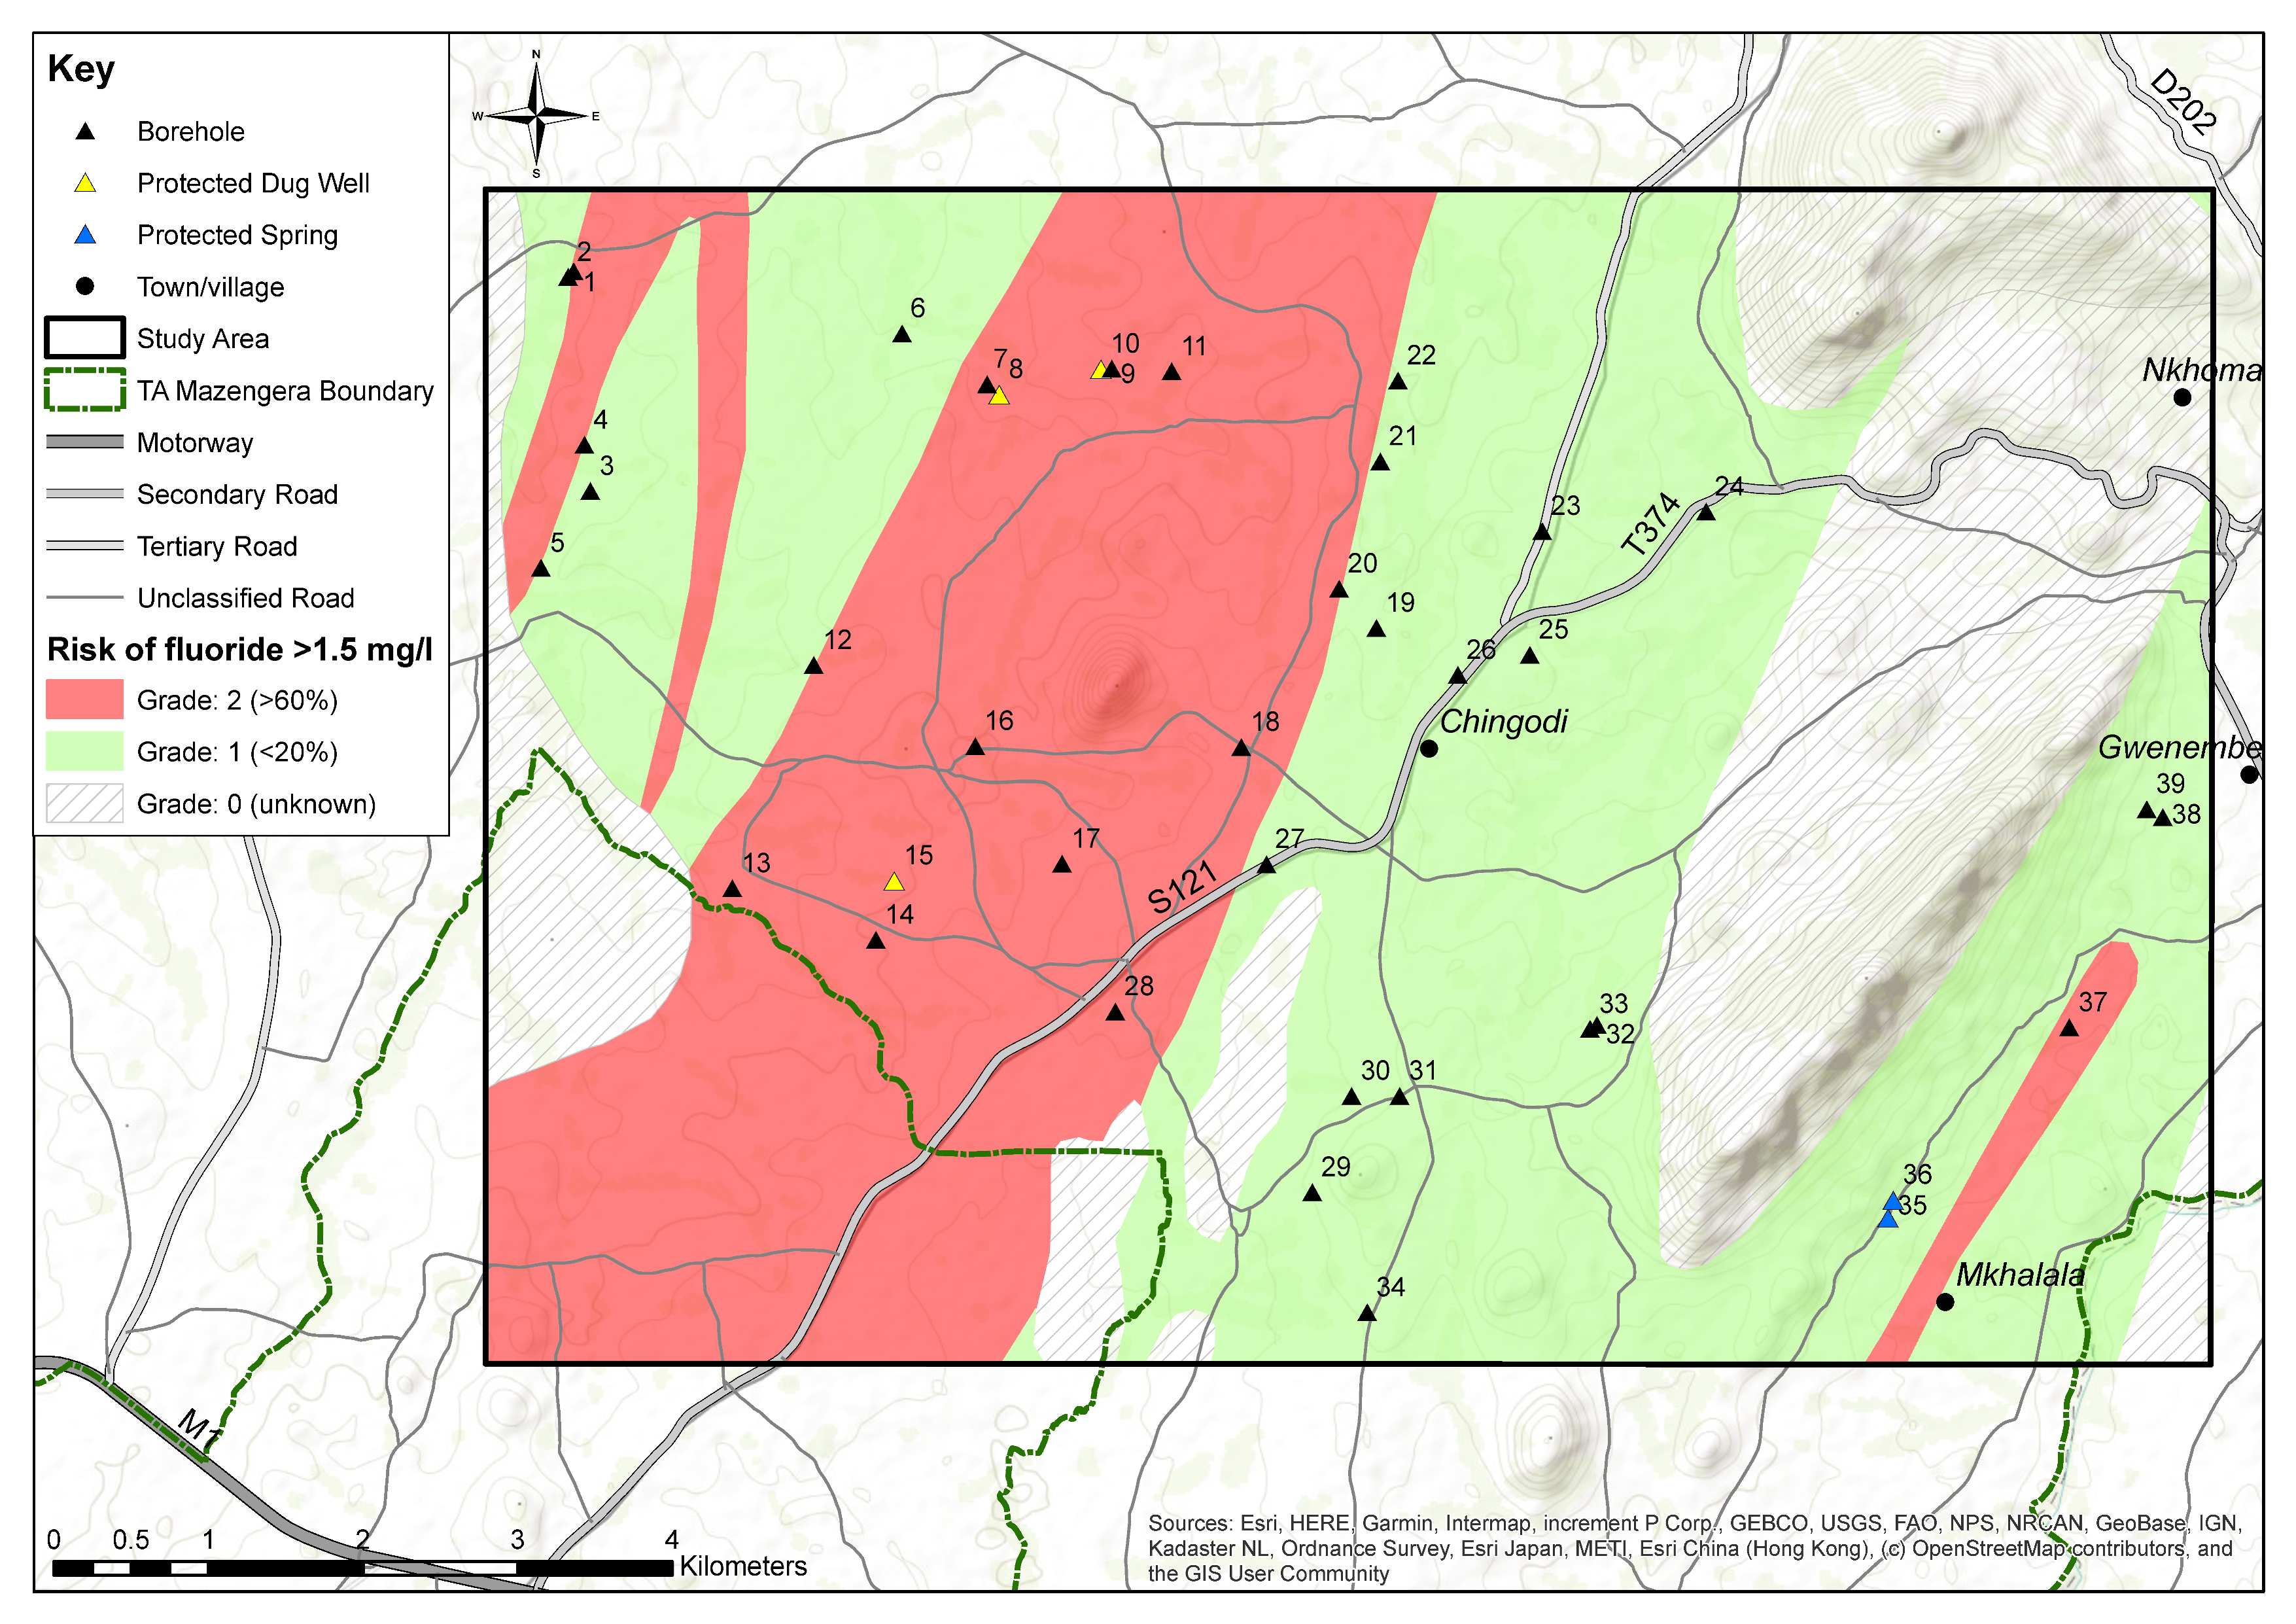
4.4.1. Risk Map
4.4.2. Human Health Risk Assessment
5. Discussion
5.1. Geological Fluoride
5.2. Human Health Risk
6. Policy and Management Implications with Recommendations
- High-level policy change and SDG targets are required for national assessment. Simply changing the fluoride standard from 6 mg/L to 1.5 mg/L is unrealistic and expensive. We propose an incremental decrease in the fluoride standard over time. The 1st stage would be a reduction to 4 mg/L by 2024, instigating an assessment of “excessive fluoride” (hot springs) and “elevated geological fluoride” water points, removing the risk of skeletal fluorosis. Stage 2 would be a reduction to 2 mg/L by 2028, instigating an assessment of “moderate-low geological fluoride” water points and removing the worst of dental fluorosis risk. The final stage would be a reduction to 1.5 mg/L by 2030, bringing their standard in line with the WHO and removing the remaining risk of dental fluorosis from all water points. An evaluation of individual water points in each stage will identify those most harmful and replacement water supplies must be acquired, highlighting the need for incremental change.
- National geological fluoride risk maps should be developed for Malawi. Statistical analyses of fluoride–lithology relationships where fluoride data exist may be translated into risk maps (similar to Figure 9). For areas where fluoride data do not exist, preliminary risk estimates to be later proven may be extrapolated from existing fluoride–lithology data, justified by literature and applied to similar lithologies on a national scale. Risk maps would ultimately be controlled by a synergy of compositional geology and (fluoride) hydrochemistry in non-rift valley zones, and structural geology, compositional geology, hydrothermal processes, and hydrochemistry in rift valley zones. More complex risk models require extensive data sets which Malawi does not currently possess, therefore, mapping geological risk (i.e., fluoride sources) may be the most achievable method of tackling fluoride occurrence at a national scale. National mapping would allow the Government of Malawi and non-governmental organisations (NGOs) active in the water sector in Malawi to integrate fluoride contamination risk into their groundwater resource development strategies.
- Hazard quotient (HQ) values should be shared locally with water point users. It may prove a simple but effective way to inform local people about the potential dangers of each water point and allow them to make informed decisions about water consumption on their own. Decommissioning water points based on elevated fluoride is an expensive venture as a replacement water supply must be provided. In a country with water scarcity problems and low-income, this is a considerable investment planning issue. Revision of rural water quality standards that allow ‘yes/no’ information on water quality at the water point and information on the negative health effects of fluoride ingestion may prove much more realistic across the country.
- A wider study of varied lithologies should be sampled in the same manner for hydrochemistry to determine their fluoride–lithology relationships. Both perthitic syenite and limestone (marble in this case) lithologies have been linked to high fluoride and are present in the study area but do not currently have corresponding hydrochemical data. National coverage of lithology types is required.
- Collaboration with dental studies in Malawi would be beneficial to corroborating occurrences of fluoride with definitive and documented incidences of dental fluorosis. This will be achieved by working together at the planning stage to ensure both disciplines are conducting their respective research in the same geographical areas. Sharing of data afterwards and working together on cross-discipline publications would ensure the impact of the research to a wider audience of both scientists and policy makers.
- An investigation into piped water supply networks should be undertaken. Piped groundwater from reticulated wells (high-yielding boreholes) drilled to support a network of pipes, powered by solar panels, to numerous kiosks where users can collect groundwater from the same source should be evaluated for fluoride. If a reticulated well is drilled into augen gneiss where fluoride potential concentrations are high, a larger number of people across a wider area will be at risk. The MoIWD or local government (or NGOs) should test for fluoride at kiosks and if found, water cycling with nearby, low fluoride water points should be advised in the first instance. If such methods are not possible at kiosks, those kiosks should be decommissioned, and replacement water supplies installed. If elevated fluoride is found in numerous kiosks fed from the same well, decommissioning of the full system and replacement of the water supply is advised. Future plans for similar piped supplies should incorporate some level of fluoride risk assessment as described by this study. Simply avoiding target (high geological fluoride risk) lithologies may be enough and should be implemented.
Supplementary Materials
Author Contributions
Funding
Acknowledgments
Conflicts of Interest
Ethical Statement
References
- WHO and UNICEF. Progress on Drinking Water, Sanitation and Hygiene: 2017 Update and SDG Baselines; World Health Organization (WHO) and the United Nations Children’s Fund (UNICEF): Geneva, Switzerland; New York, NY, USA, 2017; License: CC BY-NC-SA 3.0 IGO. [Google Scholar]
- Ozsvath, D.L. Fluoride concentrations in a crystalline bedrock aquifer Marathon County, Wisconsin. Environ. Geol. 2006, 50, 132–138. [Google Scholar] [CrossRef]
- Edmunds, W.M.; Smedley, P.L. Fluoride in Natural Waters. In Essentials of Medical Geology Revised Edition; Alloway, B., Centeno, J., Finkelman, R., Fuge, R., Lindh, U., Smedley, P., Selinus, O., Eds.; Springer: Dordrecht, The Netherlands, 2013; pp. 311–350. [Google Scholar]
- World Health Organization (WHO). Guidelines for Drinking-Water Quality: Fourth Edition Incorporating the First Addendum; World Health Organization: Geneva, Switzerland, 2017; Licence: CC BY-NC-SA 3.0 IGO. [Google Scholar]
- Kalin, R.M.; Mwanamvekha, J.; Coulson, A.B.; Robertson, D.J.C.; Rivett, M.O. Stranded Assets as a Key Concept to Guide Investment Strategies for Sustainable Development Goal 6. Water 2019, 11, 702. [Google Scholar] [CrossRef] [Green Version]
- Upton, K.; Ó Dochartaigh, B.; Chunga, B.; Bellwood-Howard, I. Africa groundwater atlas: Hydrogeology of Malawi. Br. Geol. Surv. 2018. Available online: http://earthwise.bgs.ac.uk/index.php/Hydrogeology_of_Malawi#:~:text=Malawi%20is%20one%20of%20the,settled%20around%20the%2010th%20century (accessed on 1 February 2020).
- Addison, M.J.; Rivett, M.O.; Robinson, H.; Fraser, A.; Miller, A.V.M.; Phiri, P.; Mleta, P.; Kalin, R.M. Fluoride occurrence in the lower East African Rift System, Southern Malawi. Sci. Total Environ. 2020, 712, 136260. [Google Scholar] [CrossRef] [PubMed]
- Ghiglieri, G.; Pittalis, D.; Cerri, G.; Oggiano, G. Hydrogeology and hydrogeochemistry of an alkaline volcanic area: The NE Mt. Meru slope (East African Rift—Northern Tanzania). Hydrol. Earth Syst. Sci. 2012, 16, 529–541. [Google Scholar] [CrossRef] [Green Version]
- Nair, K.R.; Manji, F.; Gitonga, J.N. The occurrence and distribution of fluoride in groundwaters of Kenya. Chall. Afr. Hydrol. Water Resour. 1984, 61, 503–512. [Google Scholar]
- Olaka, L.A.; Wilke, F.D.H.; Olago, D.O.; Mulch, A.; Musolff, A. Groundwater fluoride enrichment in an active rift setting: Central Kenya. Sci. Total Environ. 2016, 545, 641–653. [Google Scholar] [CrossRef] [PubMed]
- Tekle-Haimanot, R.; Melaku, Z.; Kloos, H.; Reimann, C.; Fantaye, W.; Zerihun, L.; Bjorvatn, K. The geographic distribution of fluoride in surface and groundwater in Ethiopia with an emphasis on the rift valley. Sci. Total Environ. 2006, 367, 182–190. [Google Scholar] [CrossRef] [PubMed]
- Msonda, K.W.M. A Study of Groundwater Quality, Defluoridation and Impact of Dental Fluorosis in Children in Nathenje, Lilongwe, Malawi. Master’s Thesis, University of Malawi, Zomba, Malawi, 2003. [Google Scholar]
- Msonda, K.W.M.; Masamba, W.R.L.; Fabiano, E. A study of groundwater fluoride occurrence in Nathenje, Lilongwe, Malawi. Phys. Chem. Earth 2007, 32, 1178–1184. [Google Scholar] [CrossRef]
- Sajidu, S.M.; Masumbu, F.F.F.; Fabiano, E.; Ngongondo, C. Drinking water quality and identification of fluoritic areas in Machinga, Malawi. Malawi J. Sci. Technol. 2007, 8, 42–56. [Google Scholar]
- Young, S.M.; Pitawala, A.; Ishiga, H. Factors controlling fluoride contents of groundwater in north-central and northwestern Sri Lanka. Environ. Earth Sci. 2011, 63, 1333–1342. [Google Scholar] [CrossRef]
- Nordstrom, D.K.; Jenne, E.A. Fluorite solubility equilibria in selected geothermal waters. Geochim. Cosmochim. 1977, 41, 175–188. [Google Scholar] [CrossRef]
- Abdelgawad, A.M.; Watanabe, K.; Takeuchi, S.; Mizuno, T. The origin of fluoride-rich groundwater in Mizunami area, Japan—Mineralogy and geochemistry implications. Eng. Geol. 2009, 108, 76–85. [Google Scholar] [CrossRef]
- Naseem, S.; Rafique, T.; Bashir, E.; Bhanger, M.I.; Laghari, A.; Usmani, T.H. Lithological influences on occurrence of high fluoride groundwater in Nagar Parkar area, Thar Desert, Pakistan. Chemosphere 2010, 78, 1313–1321. [Google Scholar] [CrossRef] [PubMed]
- Berger, T.; Mathurin, F.A.; Drake, H.; Astrom, M.E. Fluoride abundance and controls in fresh groundwater in Quaternary deposits and bedrock fractures in an area with fluoride-rich granitoid rocks. Sci. Total Environ. 2016, 569, 948–960. [Google Scholar] [CrossRef]
- Bennett, A.J.; Barratt, R.S. Some observations on atmospheric fluoride concentrations in Stoke-on-Trent. R. Soc. Health J. 1980, 100, 86–89. [Google Scholar] [CrossRef]
- Rivett, M.O.; Ellis, P.A.; Mackay, R. Urban groundwater baseflow influence upon inorganic river-water quality: The River Tame headwaters catchment in the City of Birmingham, UK. J. Hydrol. 2011, 400, 206–222. [Google Scholar] [CrossRef]
- Colombani, N.; Di Guiseppe, D.; Kebede, S.; Mastrocicco, M. Assessment of the anthropogenic fluoride export in Addis Ababa urban environment (Ethiopia). J. Geochem. Explor. 2018, 190, 390–399. [Google Scholar] [CrossRef]
- Malawi Bureau of Standards (MBS). Drinking Water—Specification; Malawi Standards Board: Blantyre, Malawi, 2005; ICS 13.030.40 MS 214:2005.
- Carter, G.S.; Bennett, J.D. The Geology and Mineral Resources of Malawi, 2nd ed.; Bulletin No. 6; Government Print: Zomba, Malawi, 1973.
- Banda, L.C.; Rivett, M.O.; Kalin, R.M.; Zavison, A.S.K.; Phiri, P.; Kelly, L.; Chavula, G.; Kapachika, C.C.; Nkhata, M.; Kamtukule, S.; et al. Water–Isotope Capacity Building and Demonstration in a Developing World Context: Isotopic Baseline and Conceptualization of a Lake Malawi Catchment. Water 2019, 11, 2600. [Google Scholar] [CrossRef] [Green Version]
- Climate-data.org. Available online: https://en.climate-data.org/search/?q=nathenje (accessed on 19 June 2020).
- Malawi Government. Malawi Government. Malawi hydrogeological atlas, 2018. In Ministry of Irrigation and Water Development, Malawi; Government Publication: Lilongwe, Malawi, 2018. [Google Scholar]
- Bath, A.H. Hydrochemistry in Groundwater Development: Report on an Advisory Visit to Malawi. British Geological Survey; Report No. WD/05/80/20; British Geological Survey: London, UK, 1980; pp. 29–40. [Google Scholar]
- Kirkpatrick, I.M. The Thermal Springs of Malawi. XXIII Int. Geol. Congr. 1969, 19, 111–120. [Google Scholar]
- Mkandawire, P.; Chivanga, C. Hydrogeological Reconnaissance Map: Dedza, 1st ed.; Department of Surveys; Malawi Government: Blantyre, Malawi, 1987.
- Thatcher, E.C. The Geology of the Dedza Area; Geological Survey Department; Bulletin 29; Government Printer: Lilongwe, Malawi, 1969.
- Leborgne, R. True 2-D Resistivity Imaging from Vertical Electrical Soundings: Application to Groundwater Investigations in Malawi. Master’s Thesis, University of Strathclyde, Glasgow, Scotland, 2019. [Google Scholar]
- Storey, I. Determination of Transmissivities through Pumping Tests and their Impact on Water Management, TA Mazengera, Malawi. Master’s Thesis, University of Strathclyde, Glasgow, Scotland, 2019. [Google Scholar]
- Chilton, P.J.; Smith-Carington, A.K. Characteristics of the weathered basement aquifer in Malawi in relation to rural water supplies. Chall. Afr. Hydrol. Water Resour. 1984, 144, 57–72. [Google Scholar]
- Firempong, C.K.; Nsiah, K.; Awunyo-Vitor, D.; Dongsogo, J. Soluble fluoride levels in drinking water—A major risk factor of dental fluorosis among children in Bongo Community of Ghana. Ghana Med J. 2013, 41, 16–23. [Google Scholar]
- Adimalla, N.; Rajitha, S. Spatial distribution and seasonal variation in fluoride enrichment in groundwater and its associated human health risk assessment in Telangana State, South India. Hum. Ecol. Risk Assess. 2018, 24, 2119–2132. [Google Scholar]
- United States Environment Protection Agency (USEPA): Human Health Risk Assessment. Available online: https://www.epa.gov/risk/human-health-risk-assessment (accessed on 20 December 2019).
- Qasemi, M.; Afsharnia, M.; Zarei, A.; Farhang, M.; Allahdadi, M. Non-carcinogenic risk assessment to human health due to intake of fluoride in the groundwater in rural areas of Gonabad and Bajestan, Iran: A case study. Hum. Ecol. Risk Assess. 2018, 25, 1222–1233. [Google Scholar] [CrossRef]
- Adimalla, N.; Li, P. Occurrence, health risks, and geochemical mechanisms of fluoride and nitrate in groundwater of the rock-dominant semi-arid region, Telangana State, India. Hum. Ecol. Risk Assess. 2018, 25, 81–103. [Google Scholar] [CrossRef]
- Du, S.; Liu, Y.; Zhang, L.; Li, H.; Huan, H. Assessment of non-carcinogenic health risks due to water contamination in a loess distribution area, northeastern China. Environ. Earth Sci. 2017, 76, 761. [Google Scholar] [CrossRef]
- Yu, R.; Wang, Y.; Ciu, Z.; Xu, G.; Guan, Z.; Yu, Y.; Liu, J. Human health risk assessment of organophosphorus pesticides in maize (Zea mays L.) from Yushu, Northeast China. Hum. Ecol. Risk Assess. 2017, 24, 642–652. [Google Scholar] [CrossRef]
- Banerjee, A. Groundwater fluoride contamination: A reappraisal. Geosci. Front. 2015, 6, 277–284. [Google Scholar] [CrossRef] [Green Version]
- Sajil Kumar, P.J.; Jegathambal, P.; Nair, S.; James, E.J. Temperature and pH dependent geochemical modelling of fluoride mobilization in the groundwater of a crystalline aquifer in southern India. J. Geochem. Explor. 2015, 156, 1–9. [Google Scholar] [CrossRef]


| Risk Exposure Factors | Values for Age Groups | Unit | ||
|---|---|---|---|---|
| Adults (>19 Years Old) | Children (12 Years Old) | Children (6 Years Old) | ||
| C | (mg/L) | |||
| DI | 2 | 1.7 | 1 | (l/day) |
| F | 365 | 365 | 365 | (days/year) |
| ED | 19 | 12 | 6 | (years) |
| BW | 70 | 40 | 15 | (kg) |
| AT | 6935 | 4380 | 2190 | (days) |
| RfD | 0.06 | 0.06 | 0.06 | (mg/kg/day) |
| Question Asked | Lithology | Total | ||
|---|---|---|---|---|
| “Does anyone in your household suffer from brown-black staining of the teeth?” | Augen gneiss | Hornblende-biotite gneiss | Charnockitic gneiss and granulite | |
| Total responses | 2070 | 134 | 4600 | 6804 |
| “Yes” responses | 853 | 54 | 1022 | 1929 |
| % yes | 41% | 40% | 22% | 28% |
| Sample Number | Water Point Type | Fluoride (mg/L) | Hazard Quotient (HQ) | ||
|---|---|---|---|---|---|
| Adults (>19 years old) | Children (12 years old) | Children (6 years old) | |||
| 1 | Borehole | 1.84 | 0.86 | 1.28 | 2.00 |
| 2 | Borehole | 2.02 | 0.95 | 1.42 | 2.22 |
| 3 | Borehole | 1.78 | 0.86 | 1.28 | 2.00 |
| 4 | Borehole | 1.45 | 0.67 | 0.99 | 1.56 |
| 5 | Borehole | 2.31 | 1.10 | 1.63 | 2.56 |
| 6 | Borehole | 2.08 | 1.00 | 1.49 | 2.33 |
| 7 | Borehole | 3.04 | 1.43 | 2.13 | 3.33 |
| 8 | Protected dug well | 1.41 | 0.67 | 0.99 | 1.56 |
| 9 | Borehole | 2.80 | 1.33 | 1.98 | 3.11 |
| 10 | Protected dug well | 0.89 | 0.43 | 0.64 | 1.00 |
| 11 | Borehole | 2.80 | 1.33 | 1.98 | 3.11 |
| 12 | Borehole | 2.46 | 1.19 | 1.77 | 2.78 |
| 13 | Borehole | 3.75 | 1.76 | 2.62 | 4.11 |
| 14 | Borehole | 2.36 | 1.14 | 1.70 | 2.67 |
| 15 | Protected dug well | 3.64 | 1.71 | 2.55 | 4.00 |
| 16 | Borehole | 3.19 | 1.52 | 2.27 | 3.56 |
| 17 | Borehole | 0.43 | 0.19 | 0.28 | 0.44 |
| 18 | Borehole | 1.62 | 0.76 | 1.13 | 1.78 |
| 19 | Borehole | 1.03 | 0.48 | 0.71 | 1.11 |
| 20 | Borehole | 1.96 | 0.95 | 1.42 | 2.22 |
| 21 | Borehole | 2.62 | 1.24 | 1.84 | 2.89 |
| 22 | Borehole | 1.31 | 0.62 | 0.92 | 1.44 |
| 23 | Borehole | 0.78 | 0.38 | 0.57 | 0.89 |
| 24 | Borehole | 1.09 | 0.52 | 0.78 | 1.22 |
| 25 | Borehole | 1.42 | 0.67 | 0.99 | 1.56 |
| 26 | Borehole | 1.31 | 0.62 | 0.92 | 1.44 |
| 27 | Borehole | 0.29 | 0.14 | 0.21 | 0.33 |
| 28 | Borehole | 0.95 | 0.43 | 0.64 | 1.00 |
| 29 | Borehole | 0.33 | 0.14 | 0.21 | 0.33 |
| 30 | Borehole | 0.95 | 0.48 | 0.71 | 1.11 |
| 31 | Borehole | 0.41 | 0.19 | 0.28 | 0.44 |
| 32 | Borehole | 0.61 | 0.29 | 0.43 | 0.67 |
| 33 | Borehole | 0.73 | 0.33 | 0.50 | 0.78 |
| 34 | Borehole | 0.73 | 0.33 | 0.50 | 0.78 |
| 35 | Protected spring | 0.61 | 0.29 | 0.43 | 0.67 |
| 36 | Protected spring | 0.61 | 0.29 | 0.43 | 0.67 |
| 37 | Borehole | 1.10 | 0.52 | 0.78 | 1.22 |
| 38 | Borehole | 1.05 | 0.48 | 0.71 | 1.11 |
| 39 | Borehole | 1.67 | 0.81 | 1.20 | 1.89 |
| Lithology | n | Hazard Quotient (HQ) = > 1 | ||
|---|---|---|---|---|
| Adults (>19 years old) | Children (12 years old) | Children (6 years old) | ||
| Augen gneiss | 16 | 50.00% | 68.75% | 93.75% |
| Hornblende-biotite gneiss | 3 | 33.33% | 66.66% | 100.00% |
| Charnockitic gneiss and granulite | 20 | 10.00% | 20.00% | 55.00% |
| All | 39 | 28.21% | 43.59% | 74.36% |
© 2020 by the authors. Licensee MDPI, Basel, Switzerland. This article is an open access article distributed under the terms and conditions of the Creative Commons Attribution (CC BY) license (http://creativecommons.org/licenses/by/4.0/).
Share and Cite
Addison, M.J.; Rivett, M.O.; Phiri, P.; Mleta, P.; Mblame, E.; Banda, M.; Phiri, O.; Lakudzala, W.; Kalin, R.M. Identifying Groundwater Fluoride Source in a Weathered Basement Aquifer in Central Malawi: Human Health and Policy Implications. Appl. Sci. 2020, 10, 5006. https://0-doi-org.brum.beds.ac.uk/10.3390/app10145006
Addison MJ, Rivett MO, Phiri P, Mleta P, Mblame E, Banda M, Phiri O, Lakudzala W, Kalin RM. Identifying Groundwater Fluoride Source in a Weathered Basement Aquifer in Central Malawi: Human Health and Policy Implications. Applied Sciences. 2020; 10(14):5006. https://0-doi-org.brum.beds.ac.uk/10.3390/app10145006
Chicago/Turabian StyleAddison, Marc J., Michael O. Rivett, Peaches Phiri, Prince Mleta, Emma Mblame, Modesta Banda, Oliver Phiri, Wilson Lakudzala, and Robert M. Kalin. 2020. "Identifying Groundwater Fluoride Source in a Weathered Basement Aquifer in Central Malawi: Human Health and Policy Implications" Applied Sciences 10, no. 14: 5006. https://0-doi-org.brum.beds.ac.uk/10.3390/app10145006