Article

Solutions to Increase PV Hosting Capacity and Provision of Services from Flexible Energy Resources

by
Hannu Laaksonen
1,*,
Chethan Parthasarathy
1,
Hossein Hafezi
1,
Miadreza Shafie-khah
1,
Hosna Khajeh
1 and
Nikos Hatziargyriou
2
1
School of Technology and Innovations, Flexible Energy Resources, University of Vaasa, 65100 Vaasa, Finland
2
School of Electrical and Computer Engineering, National Technical University of Athens, 10682 Athens, Greece
*
Author to whom correspondence should be addressed.
Submission received: 9 June 2020 / Revised: 21 July 2020 / Accepted: 22 July 2020 / Published: 27 July 2020

Abstract

:
Future smart grids will be more dynamic with many variabilities related to generation, inertia, and topology changes. Therefore, more flexibility in form of several active and reactive power related technical services from different distributed energy resources (DER) will be needed for local (distribution network) and whole system (transmission network) needs. However, traditional distribution network operation and control principles are limiting the Photovoltaic (PV) hosting capacity of LV networks and the DER capability to provide system-wide technical services in certain situations. New active and adaptive control principles are needed in order to overcome these limitations. This paper studies and proposes solutions for adaptive settings and management schemes to increase PV hosting capacity and improve provision of frequency support related services by flexible energy resources. The studies show that unwanted interactions between different DER units and their control functions can be avoided with the proposed adaptive control methods. Simultaneously, also better distribution network PV hosting capacity and flexibility services provision from DER units even during very low load situations can be achieved.

1. Introduction

The potential of active (P) and reactive power (Q) control of distributed energy resources (DER) connected at distribution networks (MV and LV) is expected to be utilized increasingly in the future power systems to manage different renewable energy sources (RES) variabilities related challenges. These challenges related to larger share of RES based generation [1], concern (a) power generation fluctuations and (b) higher variability in power system inertia and fault levels. Moreover, network topologies need to be adapted by active network management (ANM) functionalities including occasionally intended island operation. DER consisting of distributed generation (DG), energy storages (ESs), demand response, or electric vehicles (EVs) can provide flexibility and resiliency for local (distribution system operator, DSO) and system-wide (transmission system operator, TSO) needs. Flexibility can also enable larger scale integration of RES and EVs and minimize the system and societal costs. The effective utilization of flexibilities requires combination and coordination of different types and sizes of resources from all voltage levels (LV, MV, and HV).
Traditionally used fixed on-load-tap-changer’s (OLTC’s) setting value is rather high because it considers only the existence of customer loads. Additionally, the same OLTC setting value is typically used during the whole year. These traditional OLTC’s settings, together with fixed and uncoordinated DER units’ droop control settings limit the PV hosting capacity of distribution networks and DER ability to provide power system frequency control support during very low load situations. In order to overcome these limitations, more active and adaptive distribution network operation and control principles are needed. Flexibility services provision must be enabled by DER management schemes, regulation, market structures, and business models. DER participation requires new distribution and transmission network operation and planning principles based on active utilization of flexibilities [2].
P and Q related flexibility services by DER can be realized by various inverter local control modes or functions. Inverter control functions such as constant power factor (cosφ), fixed Q, Q(P), cosφ(P), QU, PU, and Pf, where f is frequency and U is voltage, are already required by different network connection and operation codes. QU-droop control seems to be the preferred and most effective inverter-based DG units’ voltage control method in distribution networks [3,4]. In order to increase DG hosting capacity and avoid curtailment of PV active power P, QU-droop is used as a primary voltage control method and P curtailment by PU-droop control as a secondary method. In order to achieve the best possible voltage level control in both MV and LV networks simultaneously, the control settings of distribution grid connected DER need to be coordinated with the HV/MV substation’s OLTC settings. This improves further DER hosting capacity in distribution networks and reduces network losses [5,6,7]. Different DER unit control modes, settings, and coordination with OLTC settings should be increasingly considered in the planning stage to obtain the most benefits from the coordinated operation.
Amongst the various DER, battery energy storage systems (BESSs) are expected to play an important role in future smart grids due to their fast and controllable dynamics and potential to provide multiple different flexibility services in stationary applications. In many cases the use of BESS for only one purpose, for example, for (i) improving electricity supply reliability (in case of intended islanding or microgrid operation) or for (ii) increasing distribution network/PV hosting capacity [8,9] may not be an economically viable solution. Therefore, multi-purpose use cases are normally needed for the distribution network connected BESSs. In general, DER control can be roughly divided into local, distributed, and centralized control methods [10,11,12]. The management scheme can be also a hybrid i.e., combination of centralized and distributed control features. In the literature, different BESS control schemes and sizing principles have been proposed in [13,14,15,16,17,18,19,20,21,22,23,24,25,26,27,28,29,30,31,32,33,34,35]. Different control methods have been also proposed to improve the BESS dynamic inertial response [36]. It can be noted that some of the proposals, such as [10,36], consider only the use of active power P control and do not use the reactive power Q control for local voltage control. It has been shown however that more effective voltage control can be achieved by using both P and Q control capabilities of BESS [8,32]. Due to their rapid response and dynamics, BESSs are also capable of providing system-wide (TSO level) frequency control related services. These services can be realized by an individual large-scale BESS or by aggregating multiple small-scale BESSs [37,38]. The optimization of BESS for multi-purpose use in order to provide different local (DSO) and system level (TSO) services should be also taken into account [37].
This paper studies and proposes new solutions and adaptive settings and management schemes in order to increase DER (PV) hosting capacity and the capability of distribution network connected DER to provide flexibility services, predominantly frequency support for system-wide (TSO) needs. In particular, this paper deals with problems such as (1) the coordination between DER units functions and OLTC settings, (2) interactions between different DER units and their control functions, and (3) multi-purpose use of BESS to increase their short- and long-term viability for grid integration (stationary applications). Simulations focus mainly on studying the potential DER (PV and BESS) units QU-, PU-, and Pf-control interactions in different situations. Based on the case studies results, the paper proposes frequency adaptive PU-droops and role of PU-droops implementation logic with different DER configurations. The way unwanted interactions between DER units and their control functions can be avoided is shown. In addition, novel real-time adaptive management of DER PU-and QU-droops and HV/MV substation transformer’s OLTC settings is proposed.
Section 2 of the paper presents the simulated case studies and explains the differences with previous research, the DER droop control settings, and the simulation sequence. Section 3 shows the PSCAD simulation results from the main study cases, presents simulation results by utilizing real-life frequency data, and proposes new frequency adaptive PU-droops for PVs and BESSs. In Section 4 new real-time adaptive management schemes for PU-droops, PQ-flow dependent OLTC settings, and OLTC setting dependent QU-droops are proposed. Finally, conclusions are drawn in Section 5.

2. Simulation Model and Study Cases

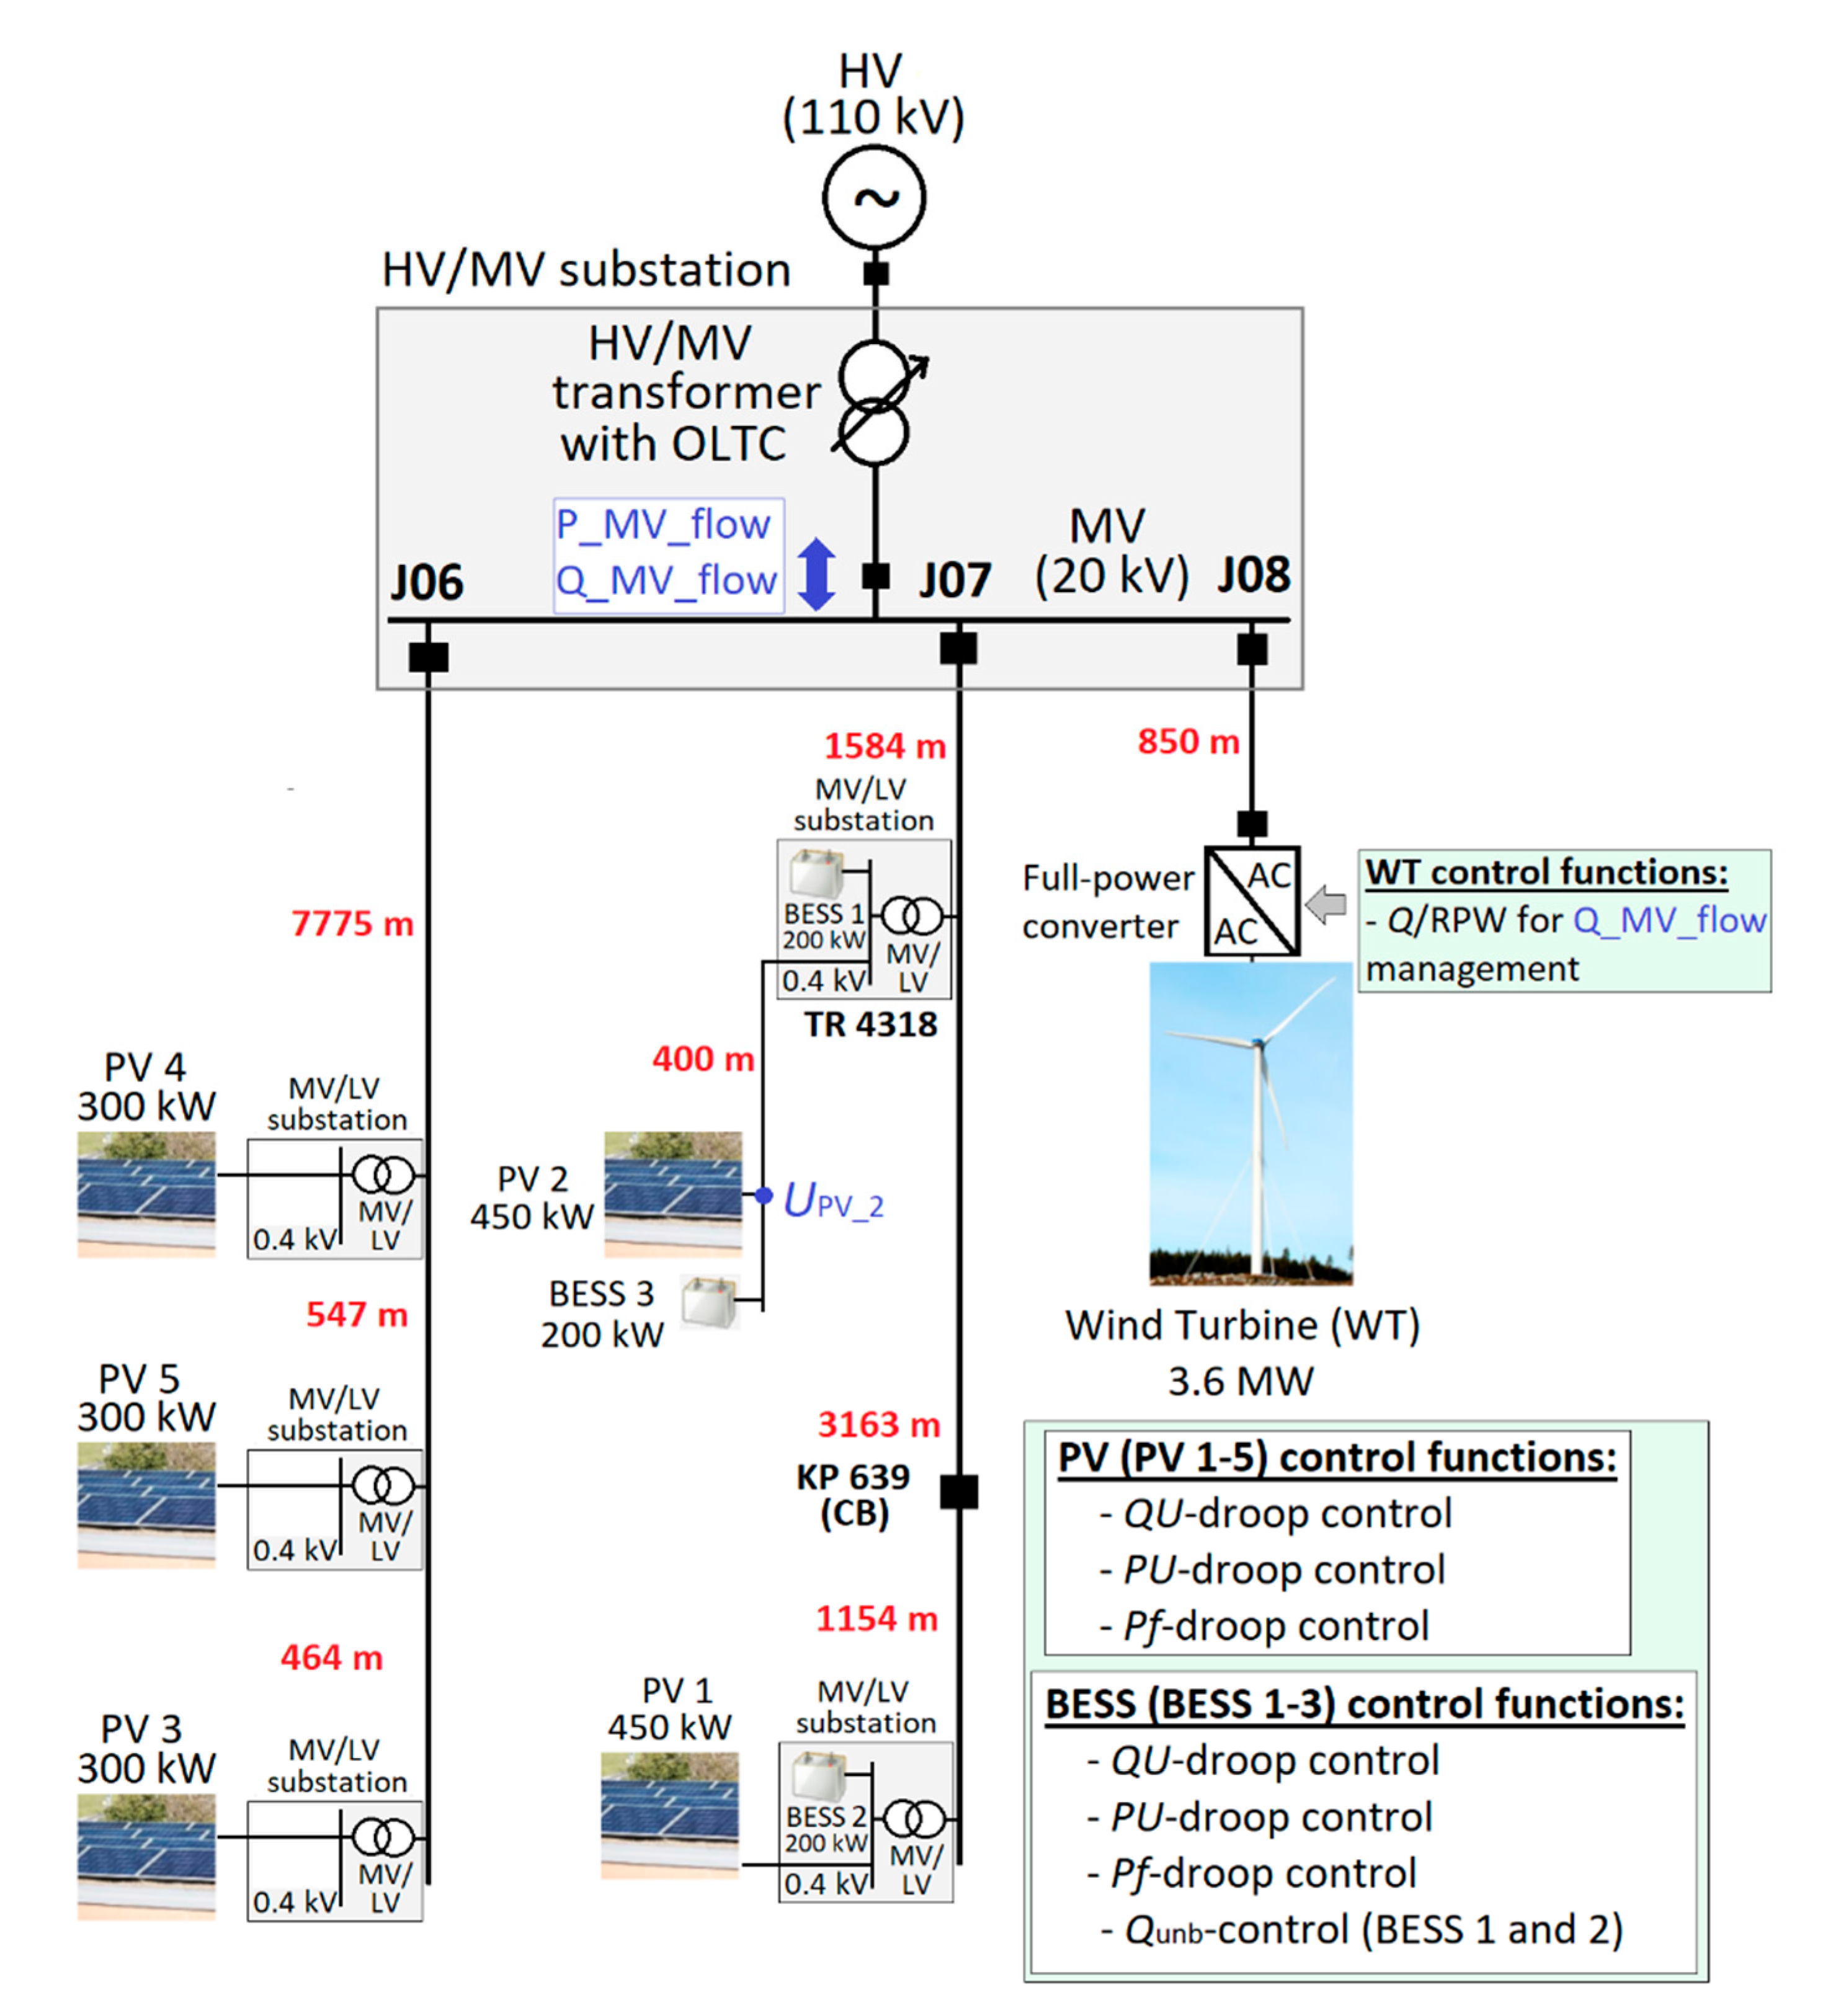
2.1. Simulated Study System

The initial choices made for this paper were based on conclusions from previous research in [39]. Paper [39] studied new multi-objective ANM scheme by simulating local smart grid pilot Sundom Smart Grid (SSG) with different future potential DER scenarios. Currently there are two DG units connected to SSG [39]. One 3.6 MW full-power-converter based wind turbine (WT) connected to MV network with own MV feeder J08 (Figure 1) and another LV network connected inverter based PV unit (33 kW) at MV/LV substation TR4318 (not included in Figure 1).
However, in the study cases of this paper also future scenarios with higher amount of PV units as well as with BESSs connected in LV network of SSG (Figure 1) are evaluated. As shown in Figure 1, in the studied future scenario there are two 450 kW PV units (PV 1 and PV 2) at MV feeder J07 and three 300 kW PV units (PV 3–5) at MV feeder J06. Respectively, three 200 kW BESS units (BESSs 1–3) were added to MV feeder J07 in different locations (Figure 1). Figure 1 also shows what type of control functions are applied in the studies of this paper for WT, PVs, and BESSs. Differences to the previous studies in [39] can be also seen in Table 1.
In this paper, the studies were undertaken by utilizing Fingrid’s (Finnish TSO) Reactive Power Window (RPW)-limits (see [39]) in scenarios with more PVs and BESSs (Figure 1) than in [39]. In the studied cases, WT alone is responsible for fulfilling the Fingrid’s RPW-limits (Figure 1). In addition, during normal operation WT close to HV/MV substation does not need to have QU- or PU-droops. This also prevents potential mutual effects between control functions, which were reported in [39]. However, if WT would be connected to network in some back-up feeding configuration (e.g., during Sundom HV/MV primary transformer maintenance), then suitable QU- and PU-droops could be used. The main focus areas of previous studies in [39] and research work in this paper are summarized in Table 1.

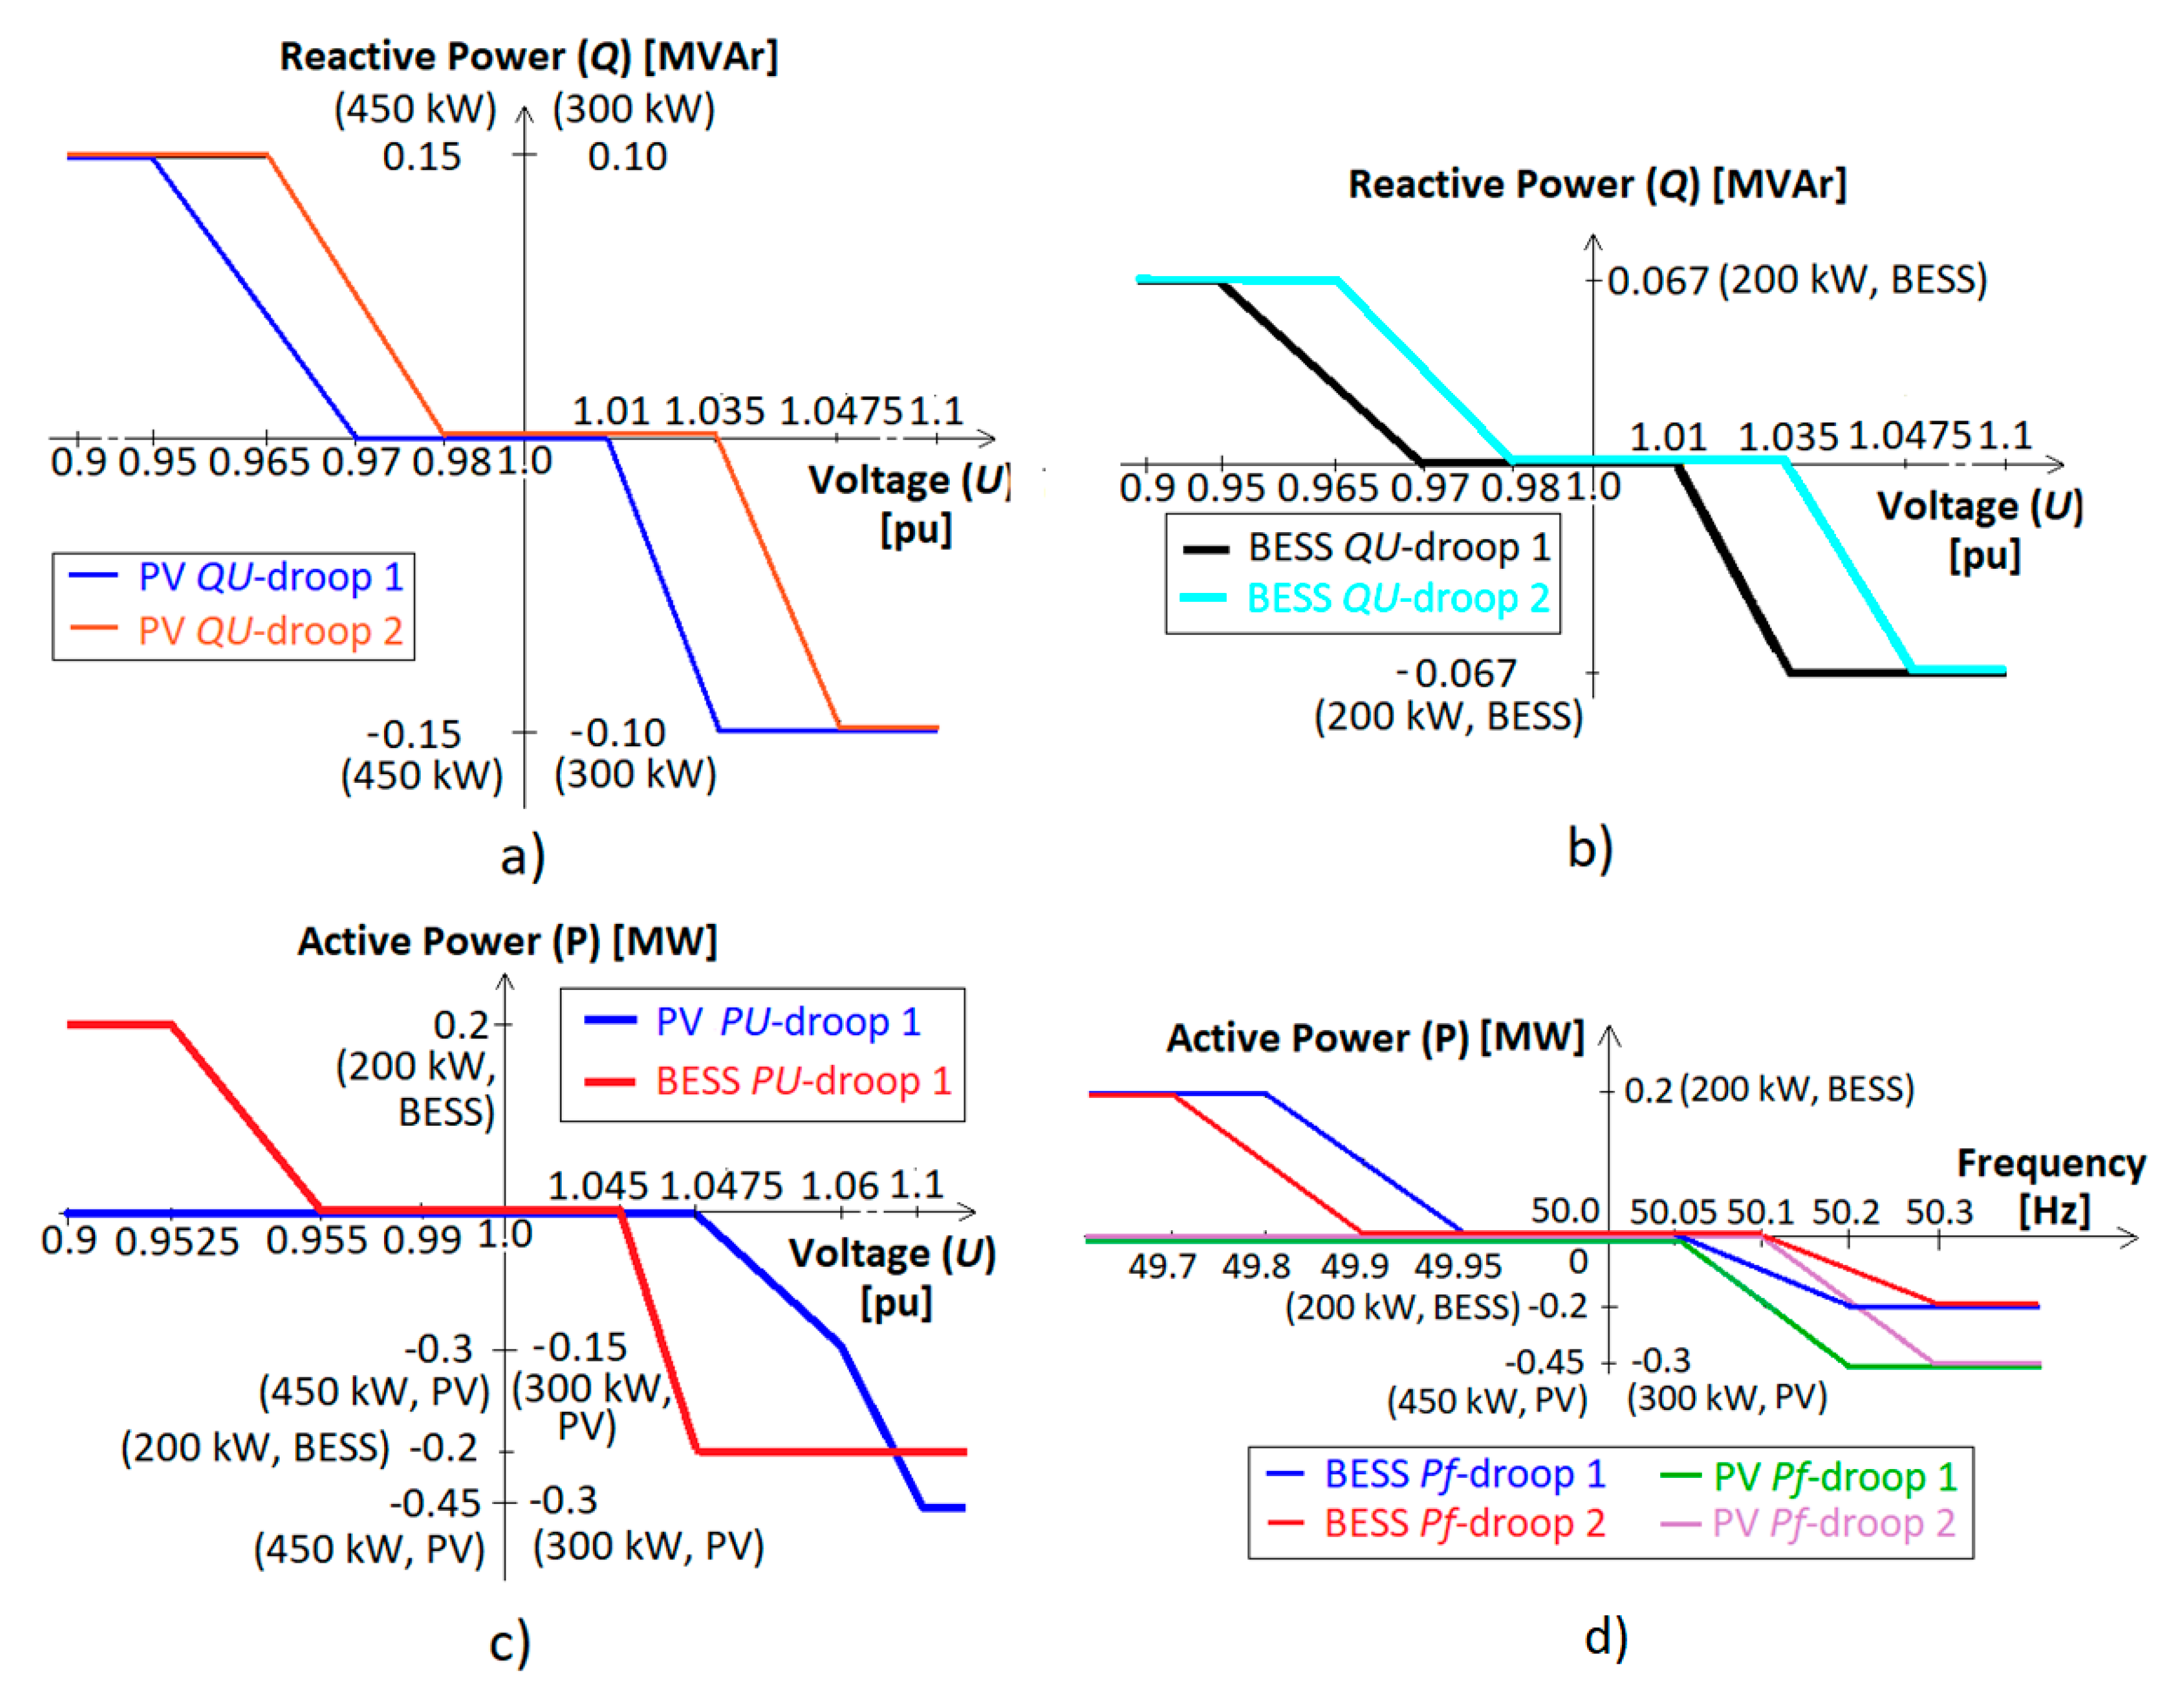
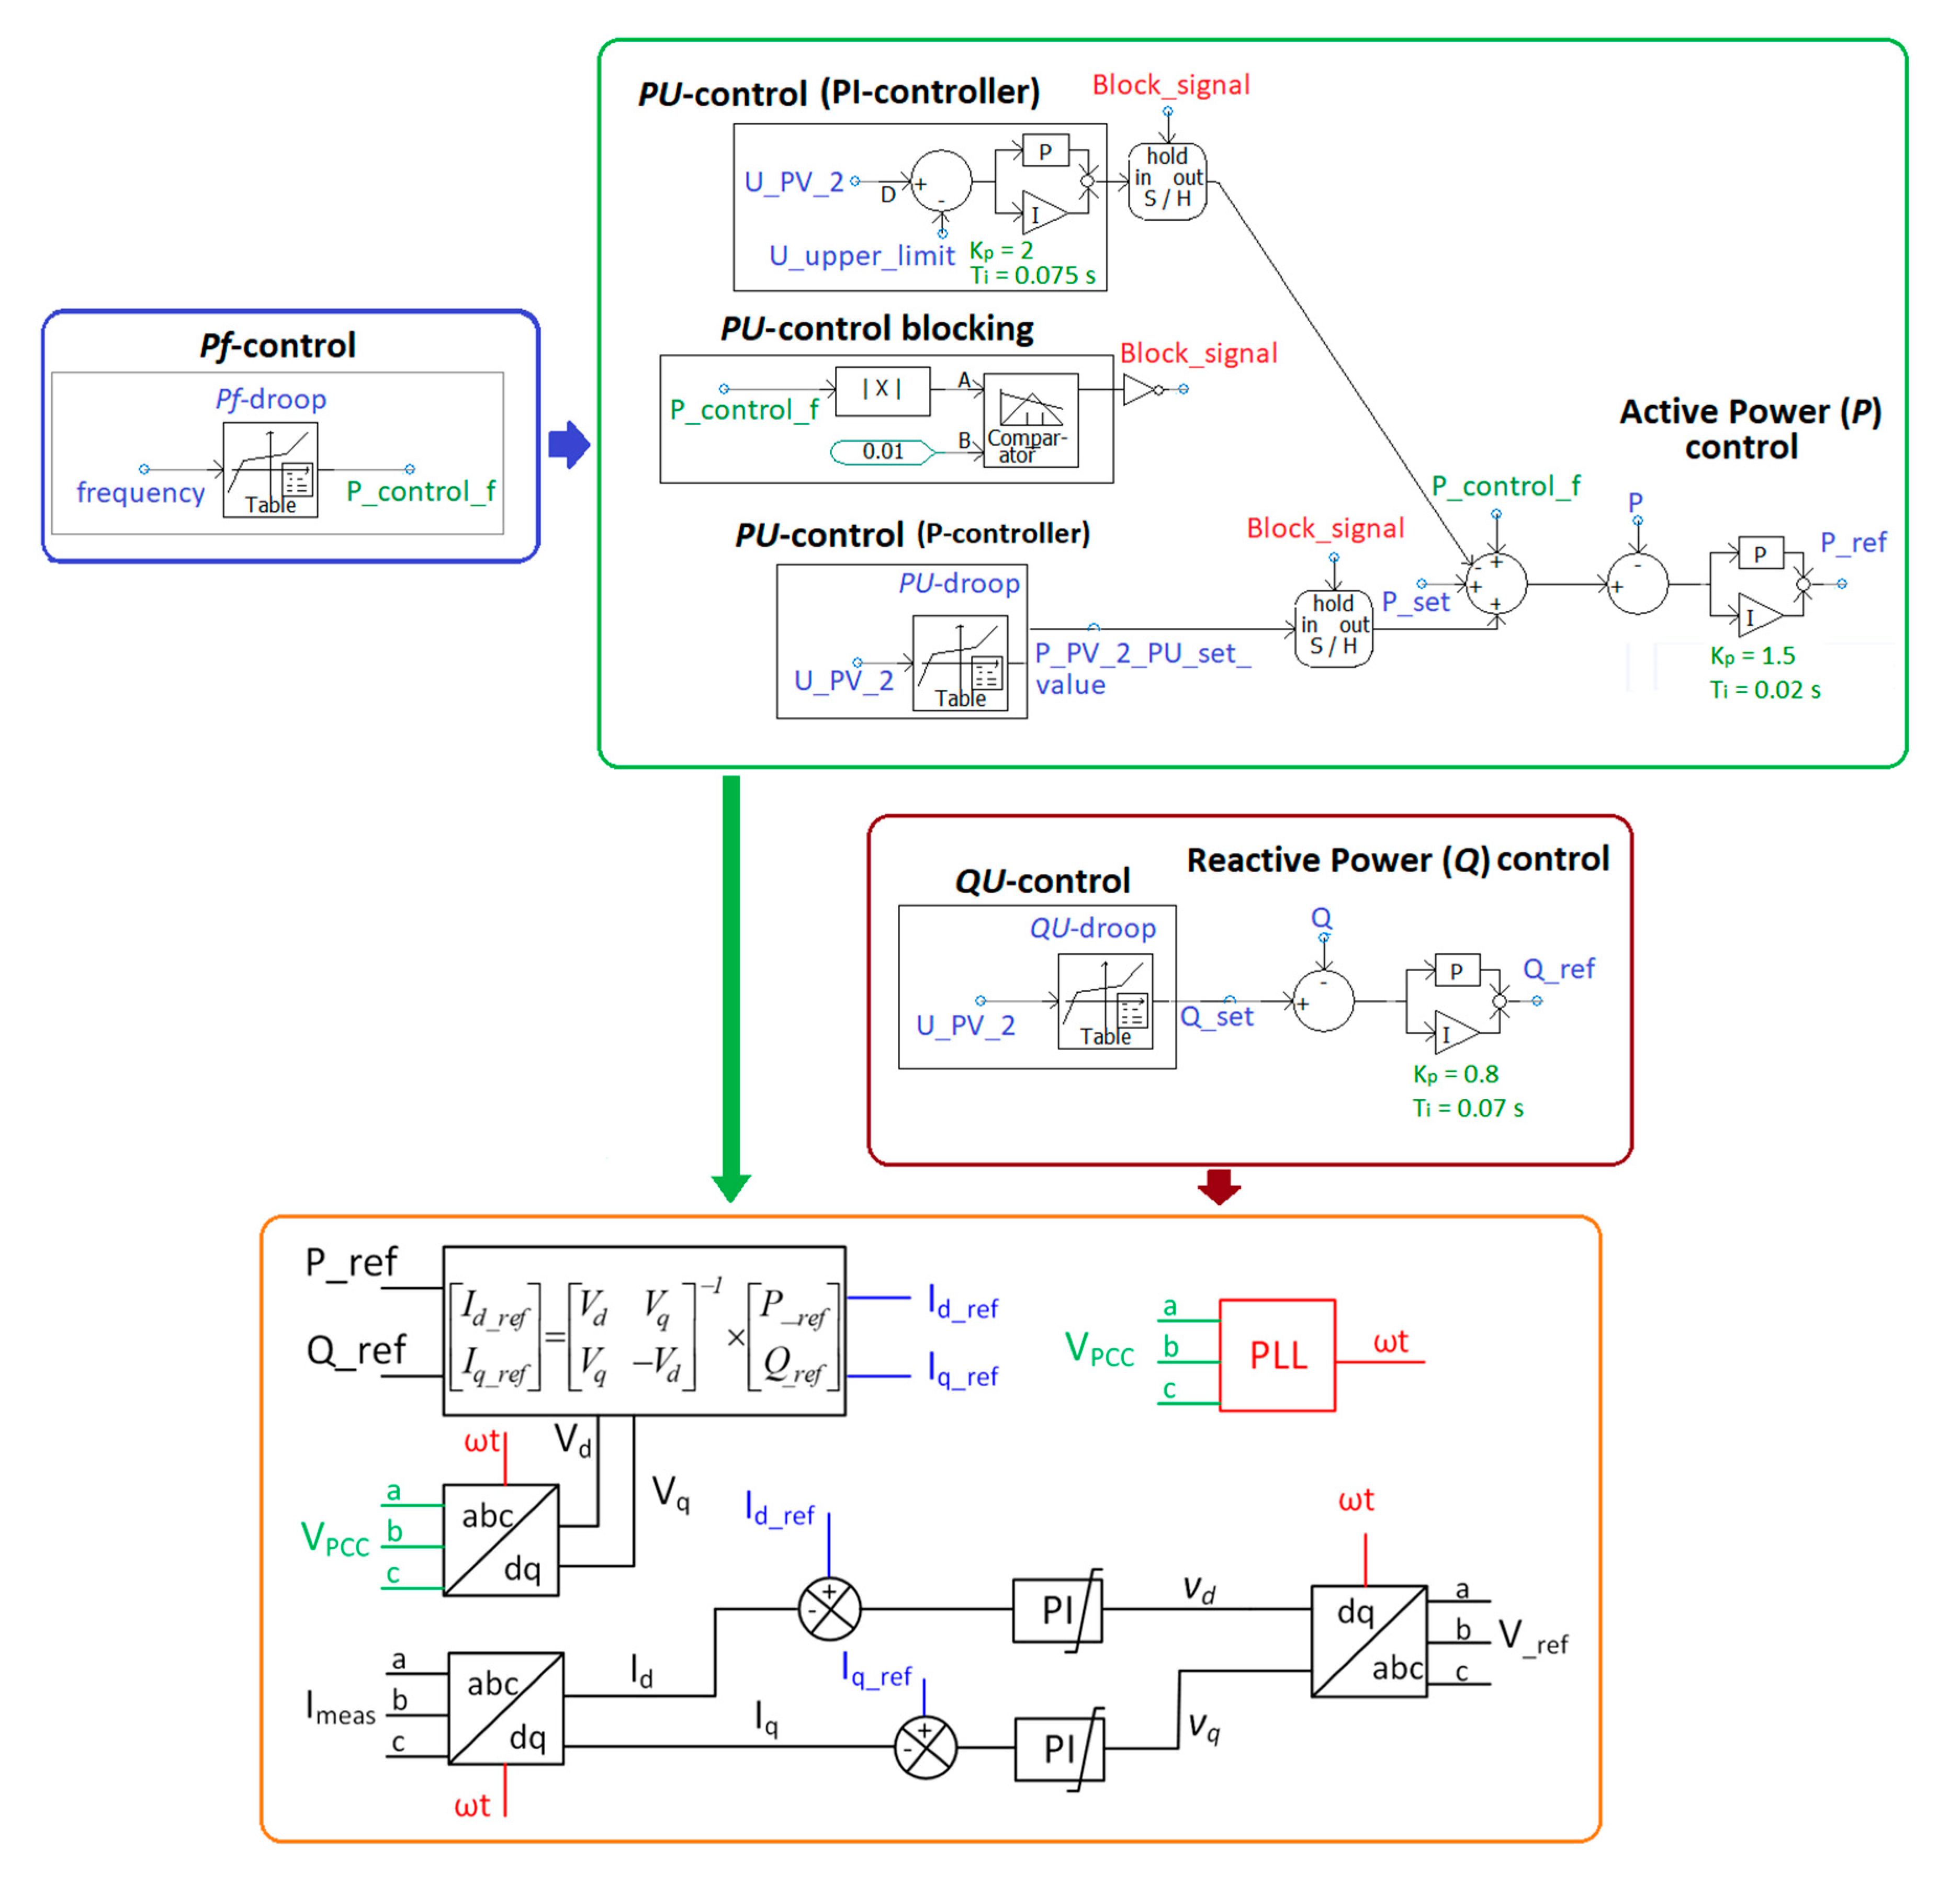
2.2. Droop Control of the DER Units

Figure 1 in Section 1 presented the type of control functions applied in the studies for WT, PVs, and BESSs. Voltage control of MV and LV distribution network is managed by HV/MV substation OLTC setting as well as by QU- and PU-droop control of PV and BESS units. In the simulations QU-droop control of the DER units is used as the primary local voltage control method and PU-droop control as the secondary method in order to avoid unnecessary P curtailment of PV units.
Increased reactive power Q production (Equation (1)) of cables during very high voltages and very low load currents can potentially lead to local overvoltage situations in the distribution network and therefore seasonal OLTC setting values could be used to improve DER hosting capacity of the network.
Q c a b l e = Q p r o d u c t i o n Q c o n s u m p t i o n = ω C U 2 3 ω L I 2 ,
where
  • ω = angular frequency,
  • C = cable capacitance,
  • U = cable voltage,
  • L = inductance/phase,
  • I = cable current.
In order to improve distribution network PV hosting capacity, the OLTC setting during very high load (winter season, total load 6548 kW, 283 kVAr) was chosen to be 20.3 kV (1.015 pu). Reactive power Q produced by cables is dependent on voltage (Equation (1)) and therefore lower OLTC setting is more suitable during summer time when cable load current I dependent reactive power consumption is also smaller. In the simulations during very-low load (summer season, total load 970 kW, -660 kVAr) the set value of OLTC was 20.0 kV (1.0 pu) with dead-zone ± 0.3 kV/0.015 pu and 7.0 s operation time delay (due to short simulation time t = 110 s). Total load includes also P losses and Q produced/consumed by cables and overhead lines.
Respectively, seasonal QU- and PU-droops should be utilized for DER units in order to improve the DER hosting capacity of the distribution network. In addition, the seasonal QU- and PU-droops should be compatible with the seasonal OLTC setting values as well as coordinated between different type of units. This means that, for example, PU-droop settings of PV and BESS units at the same connection point should be coordinated so that unnecessary active power curtailment of PV unit due to local overvoltage can be avoided by simultaneous charging of the BESS unit.
The used QU-droops, PU-droops, and Pf-droop of PV and BESS units are shown in Figure 2. It can be noted that BESSs 1 and 2 (Figure 1) have also the Qunb-control responsibility in order to enable correct operation of passive islanding detection methods [40,41,42]. In many grid codes, like in ENTSO-E NC RfG [43], the required reactive power feeding/absorbing capability of the DER units is defined to be range cos(φ) = 0.95ind/cap and that has been also used in this paper for defining the reactive power limits of the DER unit (PV and BESS) QU-droops (Figure 2a,b). The basis for dimensioning the DC/AC converter of the PV unit can be found e.g., from [44]. However, in order to reduce the needed simulation time with multiple connected DER units (PVs, BESSs, and WT), average models with controlled voltage sources are used instead of actual power-electronics switches in PSCAD models utilized in the studies of this paper.
In the simulation studies of this paper, PV and BESS units had different chosen QU-droops for winter (PV/BESS QU-droop 2, Figure 2a,b) and summer time (PV/BESS QU-droop 1, Figure 2a,b). Dead-zone of QU-droops during summer time was chosen to be smaller in order to compensate more reactive power produced by cables during very low load. In the studies, coordinated PU-droop settings of PV and BESS units were also used (Figure 2c).
In addition, PV and BESS units have Pf-droop functions (Figure 1 and Figure 2d) in order to participate in frequency control during over-/under-frequency situations. In the simulations, two different Pf-droops for PVs and BESSs with smaller and larger dead-zones were utilized (Figure 2d). The Pf-droops smaller dead-zones are used during summer time (PV/BESS Pf-droop 1, Figure 2d) when there is typically also less inertia in the power system and need for more rapid response from DER units to support the power system frequency. The used Pf-droops are also more sensitive than those required by the grid codes, because the idea is that the PV and BESS units could offer participation in frequency control as a flexibility service, for example, through a flexibility marketplace.
The implementation of PV unit’s active and reactive power droop control functions in the used PSCAD model is shown in Figure 3 (see also Figure 1 and Figure 2). From Figure 3 it can be seen how the active and reactive power controllers with respective droop functions (QU-, PU-, and Pf-droops) will create the active and reactive power references (P_ref, Q_ref) which are further processed in order to have current reference values (Id_ref, Iq_ref) for the current controller. The current controller (Figure 3) then gives the voltage reference values (V_ref) for the controlled voltage sources in the PSCAD model. In the simulations it was also found out that the mutual effects of Pf- and PU-control functions on PV 2 (Figure 1) during over-frequency support participation need additional blocking logic (PU-blocking in Figure 3) in the control system. Otherwise, the active power of PV unit PV 2 needs to be curtailed and it cannot participate in frequency control due to mutual interaction of Pf- and PU-control functionalities. In the PSCAD simulations, the control functionality of BESS units was very similar when compared to the PVs (Figure 3).

2.3. Study Cases and Simulation Sequence

Table 2 shows the study cases presented in this paper and used QU-, PU-, and Pf -droops for the PV and BESS units (Figure 2). In all cases (Table 2), over- and under-voltage limits were 1.05 and 0.95 pu and OLTC dead-zone was ± 0.3 kV/0.015 pu. In order to highlight the effect of adapting the OLTC setting during very low load situations, simulations with OLTC setting value 20.7 kV (1.035 pu) were also included in the simulation results (Table 2). Voltage limits of 0.95 and 1.05 pu were chosen as steady-state operation target limits in order to guarantee stable voltage level and high power quality in LV network. In addition, all simulation cases presented in the following were simulated with only P-controllers on PVs and BESSs for PU-control (see Table 2 and Figure 3). In Table 3, the used simulation sequence and other issues regarding study cases (Table 2) are presented.

3. Simulation Results and New Frequency Adaptive PU-Droop

In this section, the main simulation results regarding potential solutions which could increase LV distribution networks’ PV hosting capacity and provision of flexibility services from small-scale DER are presented. In Section 3.1, the focus of the simulations was in the following issues (Table 2):
  • Effect of BESSs utilization (Cases 4a–5b), two or three BESSs (with default PU-droops on BESSs).
  • Potential DER (PV and BESS) unit Pf- and PU-control interactions during future scenarios with very high PV penetration and very low load in (i) steady-state, (ii) over-frequency, and (iii) under-frequency situations to study the effect of:
    additional PU-control blocking logic (Cases 2a–4b and 5b);
    different Pf- and QU-droop settings (Cases 3a–3b).
  • Effect of remote LV voltage measurement from PV (further in LV network) connection point to BESS at closest MV/LV secondary substation in order to maximize PV production during very low loads (Case 4b).
  • Effect of adapting the OLTC setting during very low load situations (Cases 1b, 2b, 3b, and 4a–5b).
After that, Section 3.1 presents simulation results by utilizing measured 30 min real-life frequency data from SSG (Case 6). Finally, in Section 3.2. frequency adaptive PU-droops for PVs and BESSs during larger under- and over-frequency situations are proposed (Cases 7a–7b).

3.1. Simulations to Study Different Potential Solutions for Increasing LV Network PV Hosting Capacity and Provision of Flexibility Services from DER

In the following, simulation results from different very low load cases (Table 2 and Table 3) with only P-controllers for PU-control in PVs and BESSs (Figure 3) are explained in detail. At first, Table 4 presents PV 2 unit’s (Figure 1) active (PPV_2) and reactive (QPV_2) power as well as PV 2 connection point voltage (UPV_2) during over- and under-frequency events in different cases. After that, Table 5 and Table 6 show the active and reactive power of BESS 1 and 3 during over- and under-frequency events in different cases. In order to highlight the PV hosting capacity in PV 2 connection point, Figure 4 presents the active power (PPV_2) values of PV 2 during steady-state, over- and under-frequency events in different cases.
From Table 4 and Figure 4 it can be seen that the PV hosting capacity in PV 2 connection point (Figure 1) without BESSs in Cases 1a–3b during steady-state operation (t = 25.0 s) can be increased with lower (20.0 kV) OLTC setting (Cases 1b, 2b, 3b). During over-frequency event 50.07 Hz (t = 25.0 s) in Cases 1a–3b without BESSs one can see that best frequency support (frequency control participation) can be achieved in Cases 2a and 2b with utilization of PU-control blocking logic (Figure 3) and Pf-droop 1 (Figure 2) on PVs. On the other hand, during under-frequency event 49.8 Hz (t = 95.0 s) in Cases 1a–3b without BESSs it can be seen from Table 4 and Figure 4c that due to load demand response participation to frequency support by disconnecting part of the load at PV 2 connection point, also the PV 2 active power needs to be curtailed in order to avoid local over-voltages. However, this PV curtailment during under-frequency event is not feasible from system-wide perspective and reduces the effect of load demand response to frequency control. Table 4 results also show that, due to used P-controllers for PU-control in PV 2 and BESS 3 without any PI-controllers (Figure 3), small voltage limit violations at the PV 2 connection point voltage (UPV_2) can be possible.
The effect of BESS 1 and 3 (Figure 1) on the PV hosting capacity in PV 2 connection point can be seen from Cases 4a–5b (Table 4, Table 5 and Table 6, Figure 4). When comparing Cases 4a and 4b with BESS 1 during steady-state operation (t = 25.0 s) one can see that PV 2 hosting capacity can be only be increased in Case 4b in which remote LV voltage measurement from PV 2 connection point to BESS 1 (Figure 1) control is utilized through communication. In Cases 5a and 5b with BESS 3 at the PV 2 connection point however, the PV hosting capacity during steady-state operation (t = 25.0 s, Figure 4a) can be maximized by simultaneously charging BESS 3 (Table 6) in order to avoid local over-voltages. By comparing the simulation results of Cases 5a and 5b (Table 4, Table 5 and Table 6) during over-frequency event 50.25 Hz (t = 55.0 s) the effect of PU-control blocking logic of PVs and BESSs can be seen. The PU-blocking maximizes the BESS 3 participation in frequency support in Case 5b (Table 6), but simultaneously leads to local under-voltage at PV 2 connection point (Table 4). During under-frequency event 49.8 Hz (t = 95.0 s) in Cases 5a and 5b with BESS 3 it can be seen from Table 4 and Table 6 that in Case 5a without PU-blocking total active power change (PV2 + BESS 3) is ΔP5a_49.8Hz = ΔPPV 2(−87 kW) + ΔPBESS 3(68 kW) = −19 kW and in Case 5b with PU-blocking ΔP5b_49.8Hz = ΔPPV 2(−205 kW) + ΔPBESS 3(201 kW) = −4 kW. The total active power change is quite similar in Cases 5a and 5b, but it seems that in cases with PV and BESS at the same connection point, the PU-blocking (Case 5b) may lead to unnecessary large PV curtailment during under-frequency events if BESS unit participates in frequency control. This issue is further studied in Section 3.2.

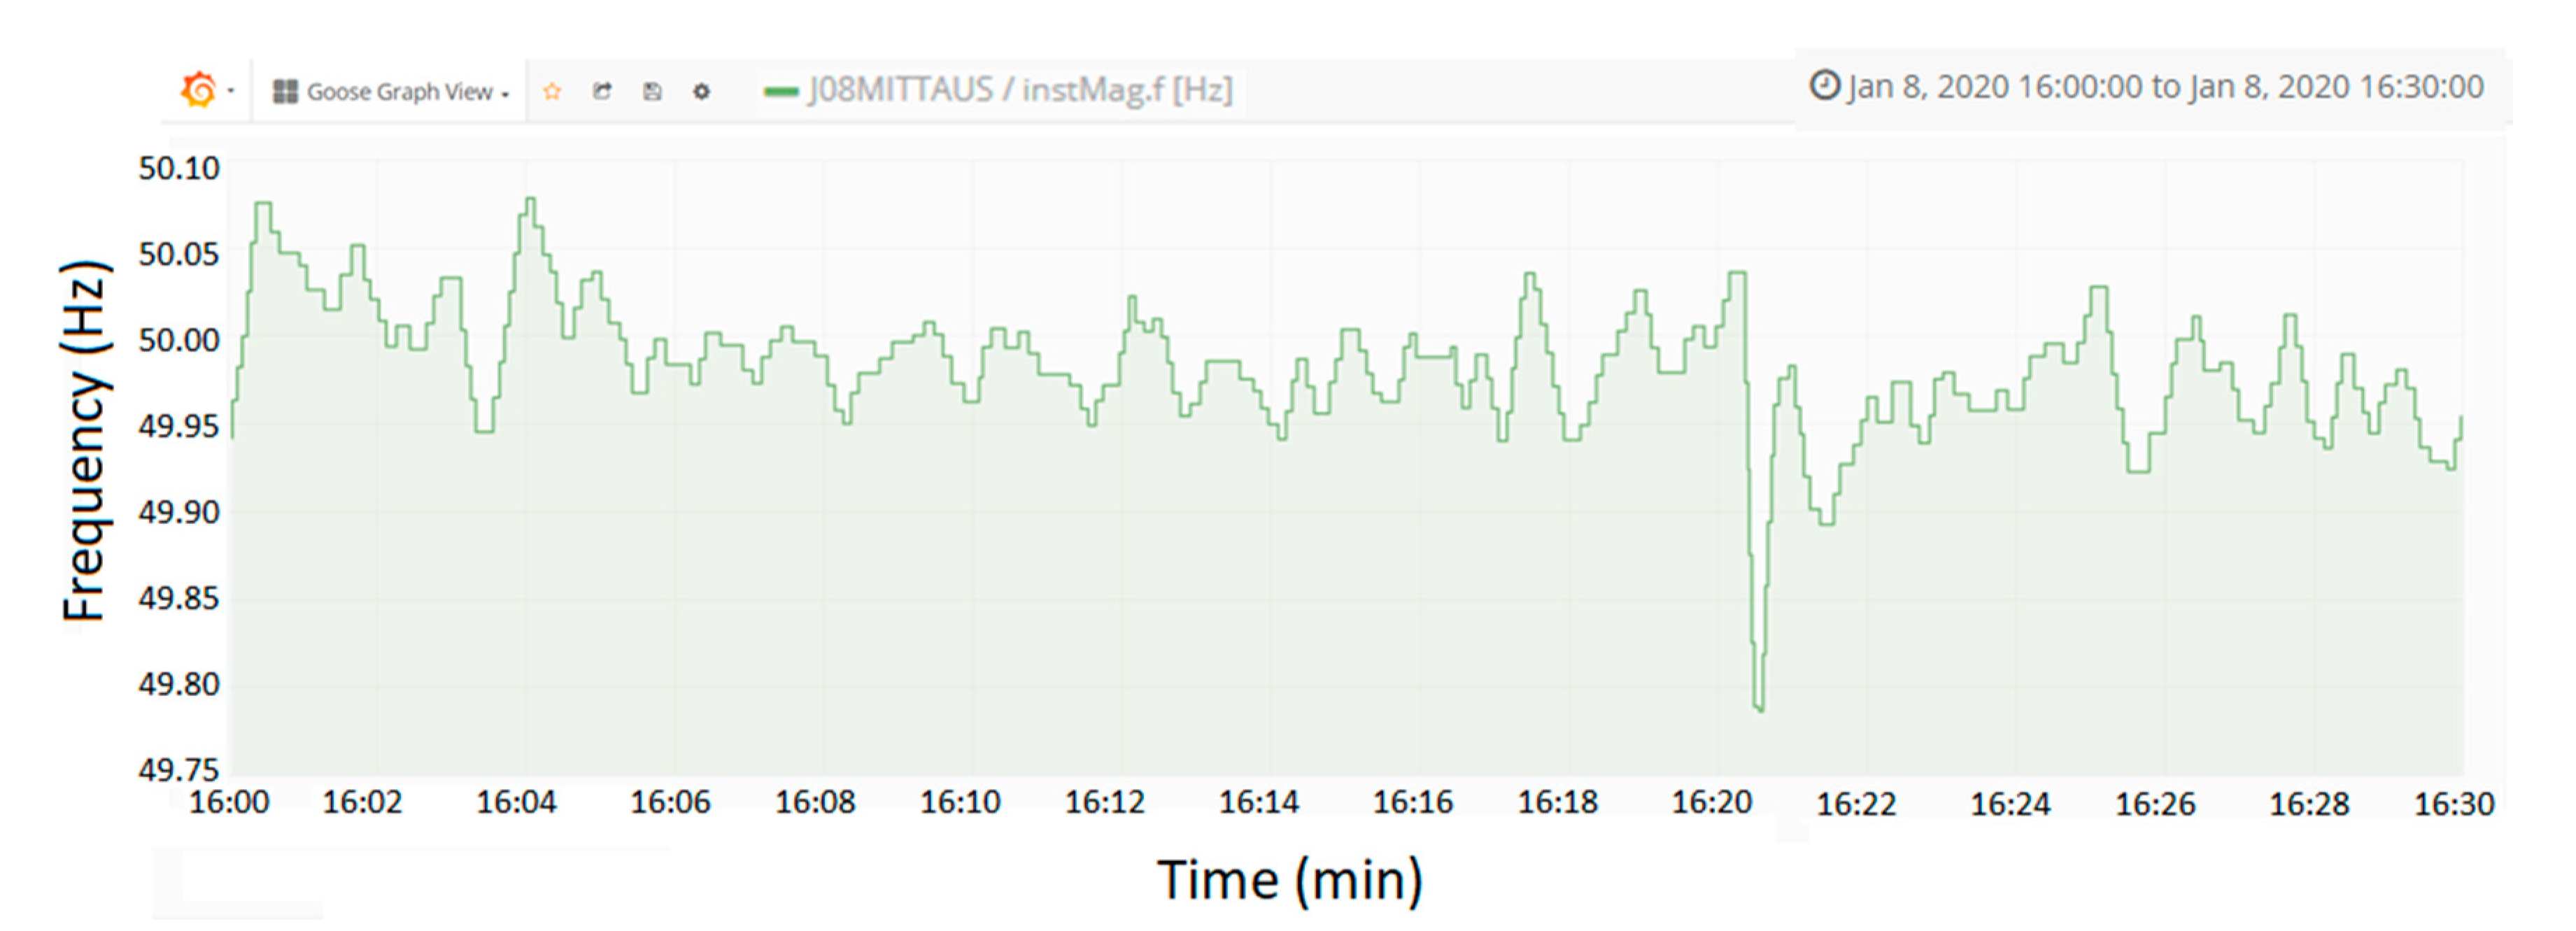
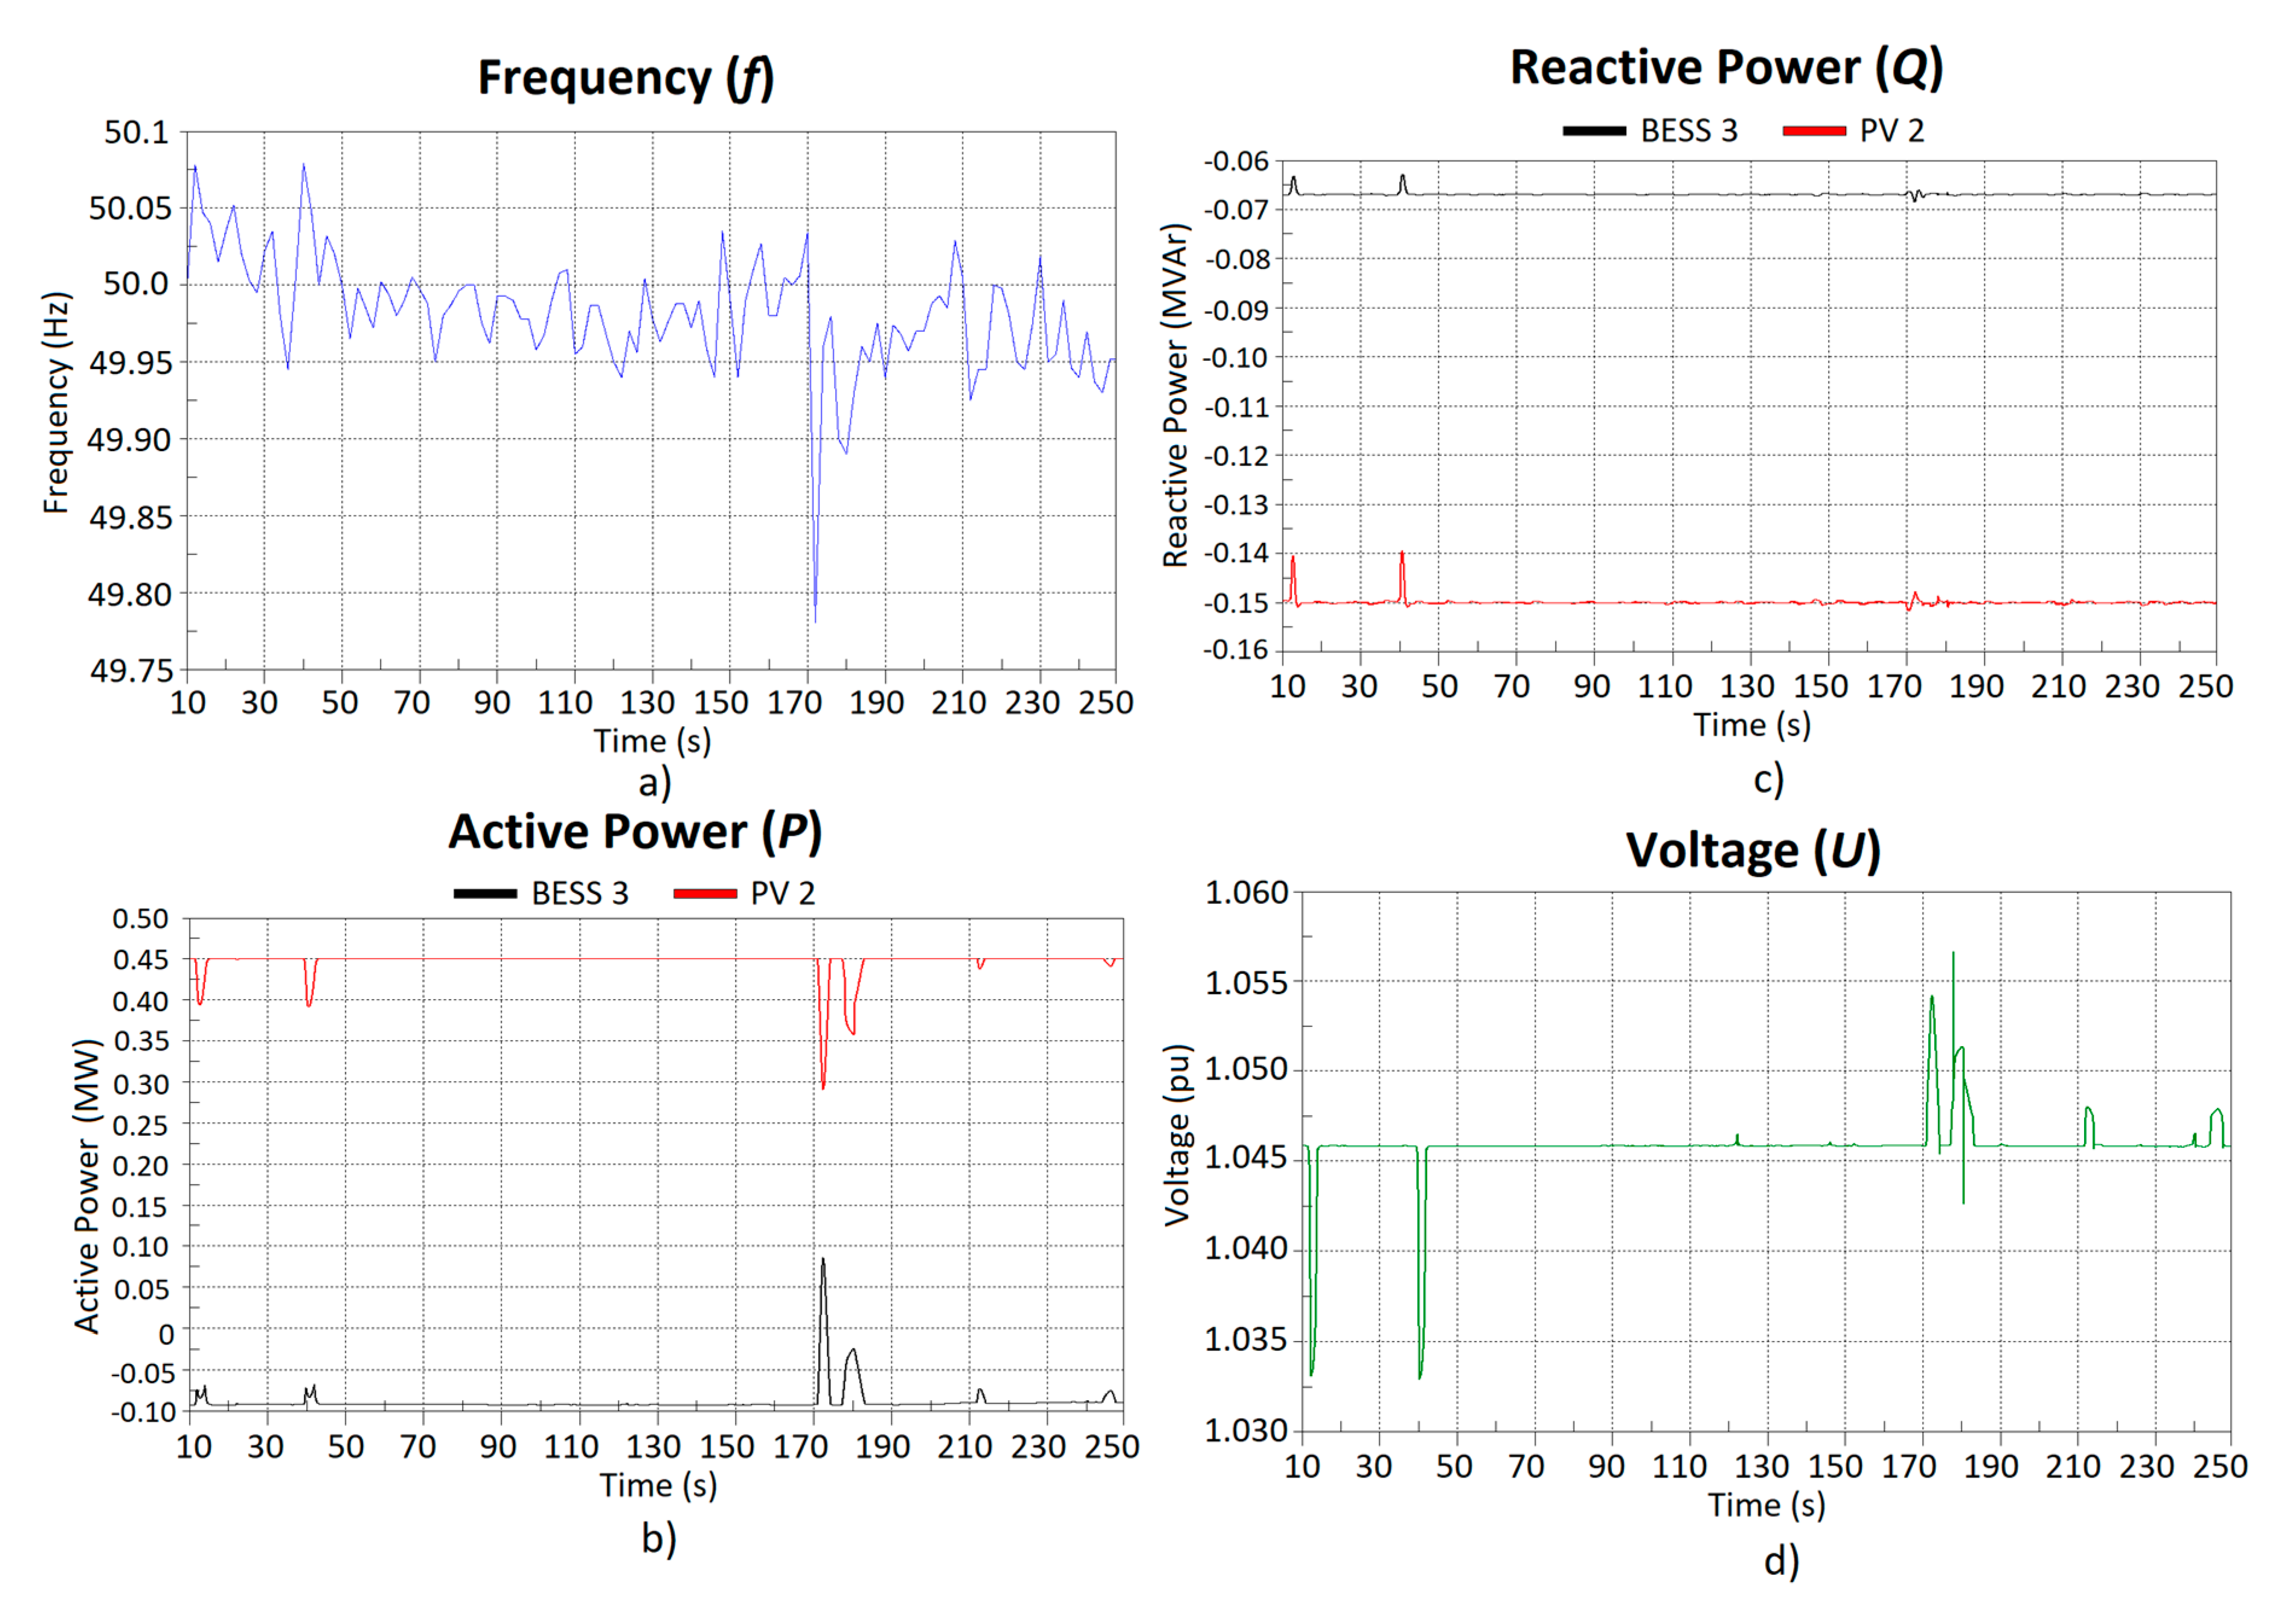
Simulations with Real-Life Measurement Data

In this Section, the aim was to study PV 2 and BESS 3 unit’s (Figure 1) active (PPV_2) and reactive (QPV_2) power as well as PV 2 connection point voltage (UPV_2) in Case 5 by utilizing measured real-life frequency data from SSG (Figure 5). Measured 30 min frequency data (Figure 5) was modified for PSCAD simulations to 240 s input data and was utilized in the new simulation Case 6 during t = 10–250 s (Figure 6a).
From simulation results of Figure 6 it can be seen how PV 2 and BESS 3 units participate in frequency control when frequency exceeds 50.05 Hz. In a similar manner, BESS 3 participates in frequency control during under-frequencies (i.e., when frequency is smaller than 49.95 Hz). In addition, during t = 178.0–180.5 s also load demand response participates in frequency support by load disconnection when under-frequency limit 49.90 Hz is exceeded. Due to local voltage rise at PV 2 connection point during under-frequency events also PV 2 active power needs to be simultaneously curtailed as shown in Figure 6.

3.2. Frequency Adaptive PU-Droops for PVs and BESSs During Larger Under- and Over-Frequency Situations

Based on the simulations results of Section 3.1. it can be concluded that
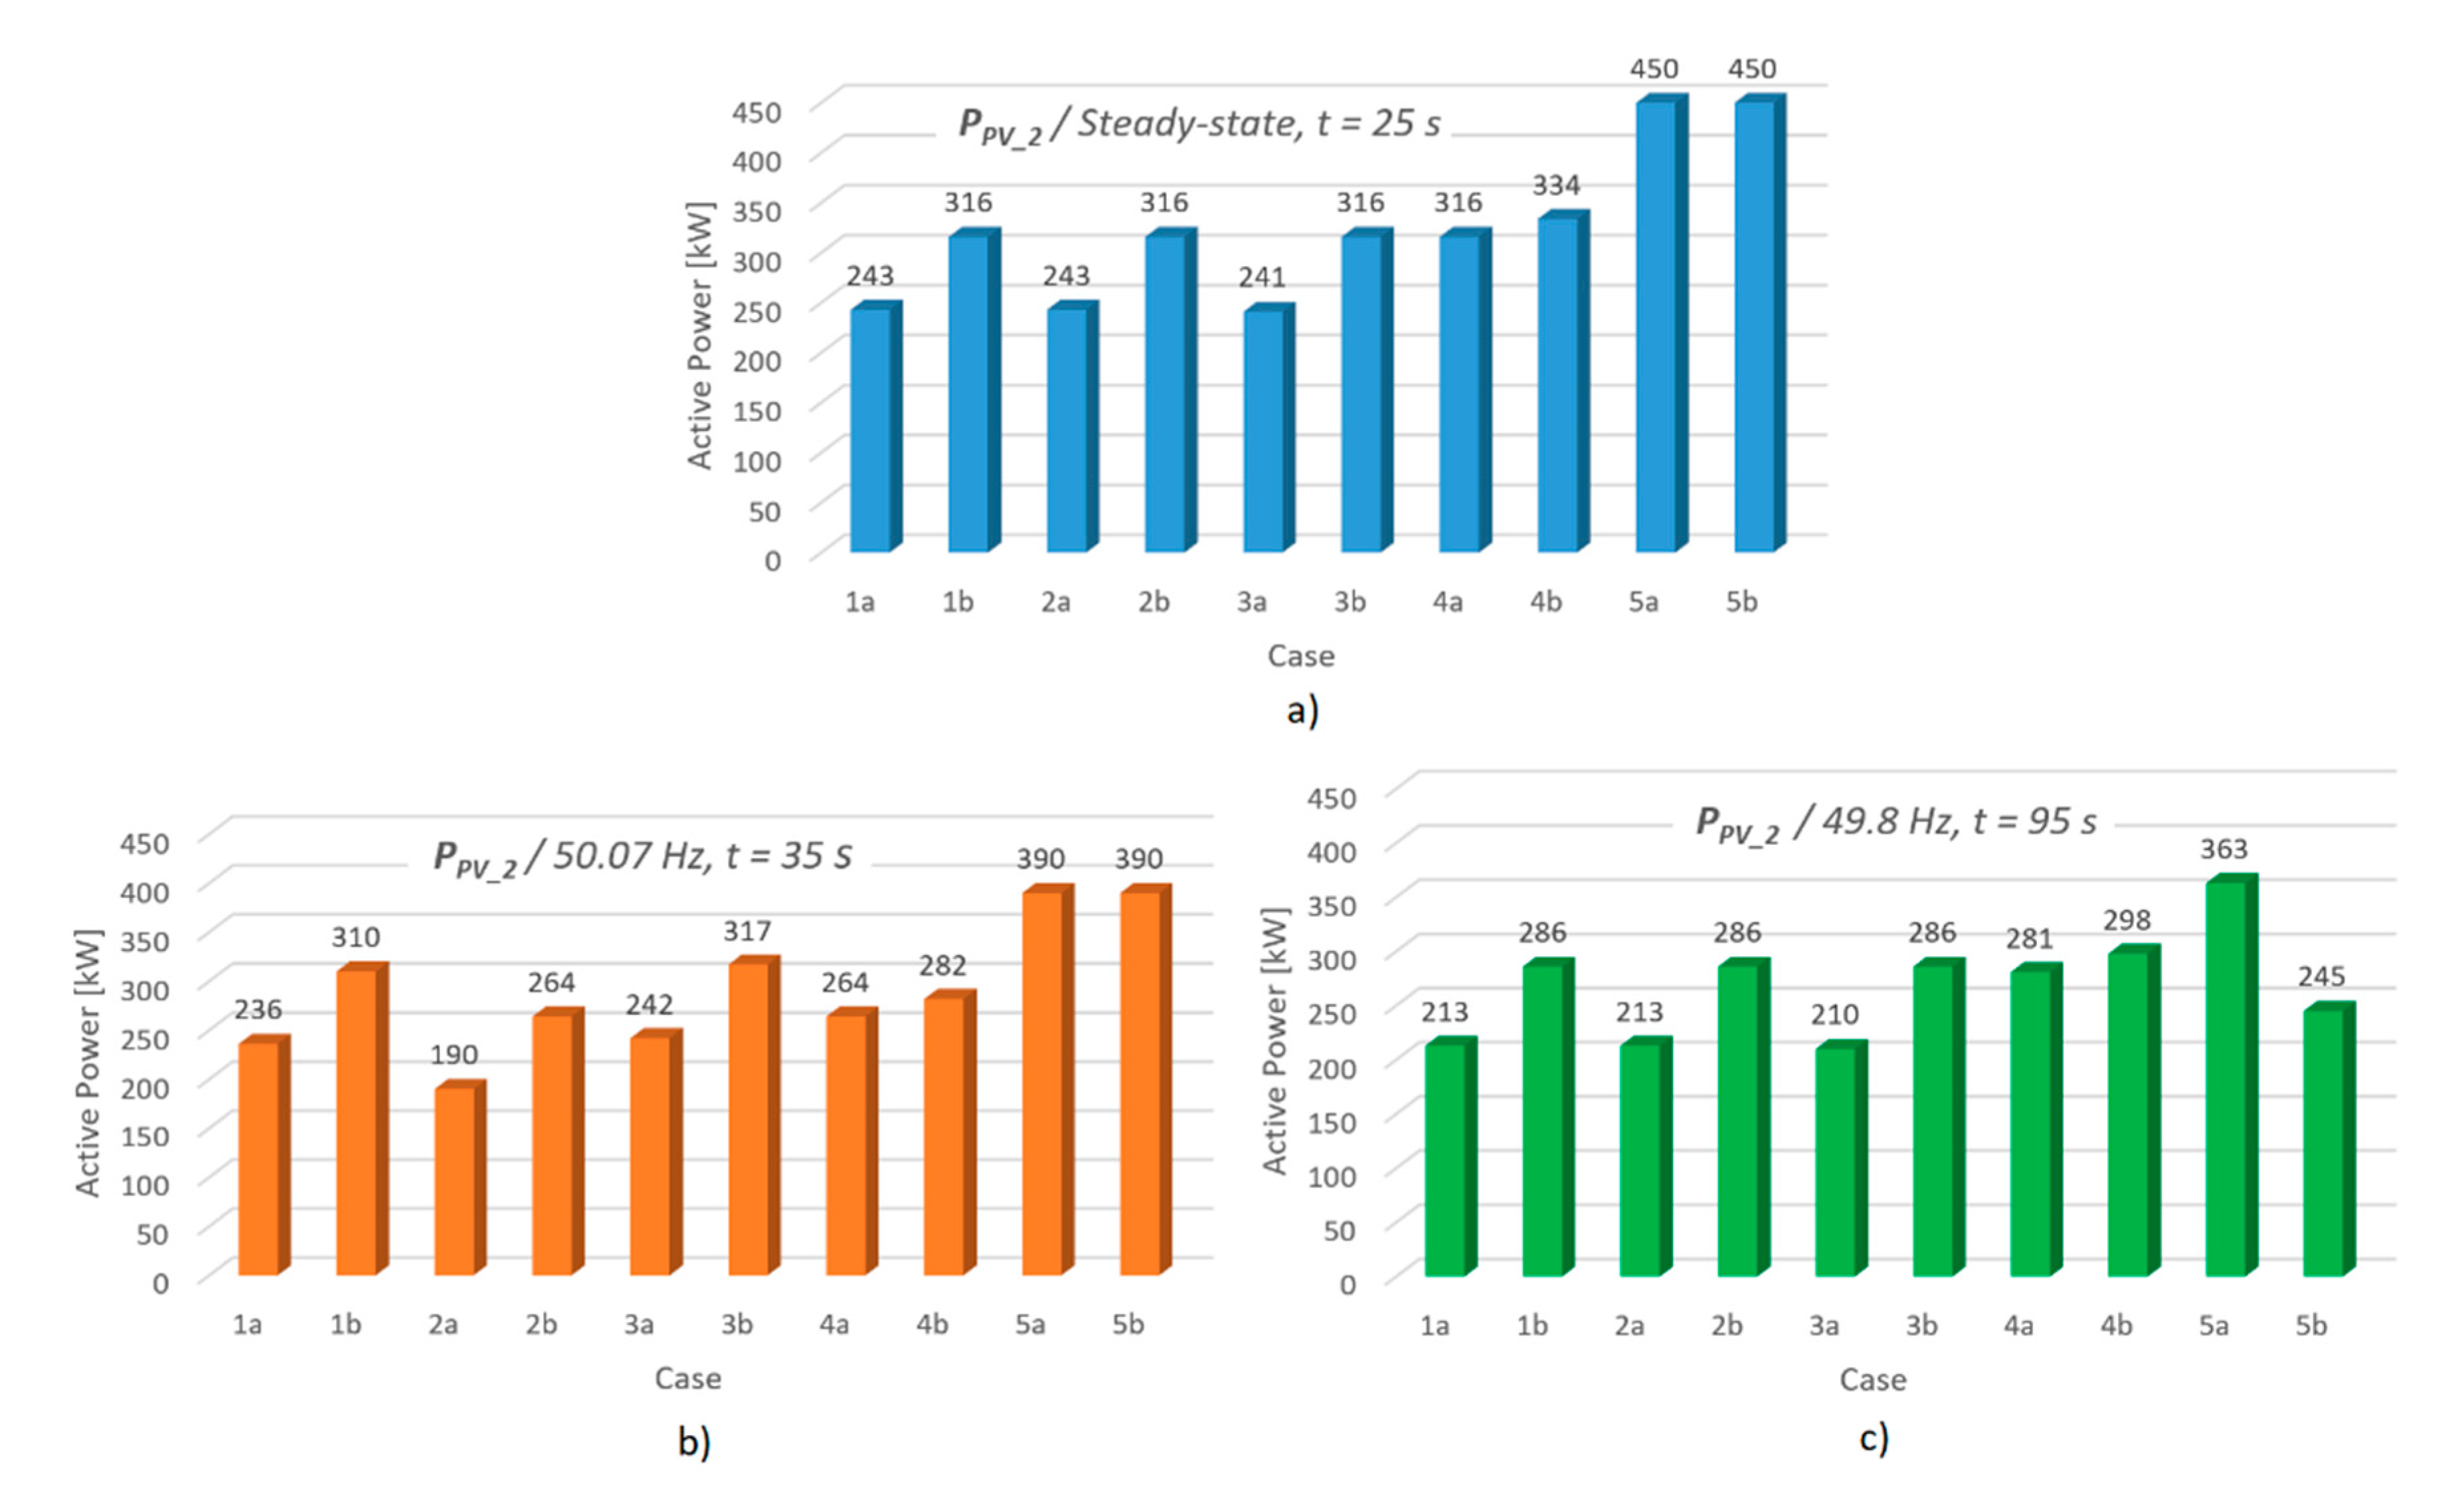
  • Use of PU-blocking is needed from system-wide perspective in order to enable feasible operation of PV 2 (without BESS 3) in Cases 2a and 2b during 50.07 Hz over-frequency situation.
  • With BESS 3 in Case 5b during 49.8 Hz under-frequency situation however, PV 2 output needs to be curtailed more with PU-blocking due to BESS 3 unit’s more rapid and extensive participation in system frequency support.
    Therefore, use of PU-blocking is not recommended from PV curtailment viewpoint when there are both PV and BESS at the same network connection point. On the other hand, simultaneous BESS frequency support with PU-blocking logic is higher.
    One potential option to avoid PV 2 curtailment could be disabling Pf-control of BESS 3 during under-frequency events. On the other hand, that is not optimal from whole-system perspective especially if frequency deviation is large and frequency support is needed.
By considering above conclusions there is a need for development of PU-droops in order to avoid the mentioned shortcomings and challenges. Therefore, in this section ‘frequency adaptive PU-droops’ are proposed. The idea, settings, and PSCAD implementation of the frequency adaptive PU-droop are presented in Figure 7. For example with PV 2 and BESS 3 the adaption of frequency adaptive PU-droops would mean that when frequency is e.g., ≥ ± 0.2–0.5 Hz and between over-voltage limits 1.05–1.15 pu or under-voltage limits 0.85–0.95 pu then active PU-droops would be changed from PU-droop 1 (Figure 2) to PU-droop 2 or 3 (Figure 7).
Standard EN 50160 [45] defines that LV network supply voltage variations under normal operation should not exceed ± 10% of nominal voltage Un (99% of the 10-min mean RMS value over one week) and none of the 10-min mean RMS values shall exceed ± 15% of Un. When comparing these frequency adaptive PU-droop settings (Figure 7) to standard EN 50160 [45] requirements regarding supply voltage variation in LV network, it can be stated that standard requirements are respected.
Frequency adaptive PU-droops should be used without PU-blocking in cases with PV + BESS at the same connection point in order to enable PV or BESS unit participation in frequency control markets as well as to maximize smaller LV network connected demand (loads) participation in frequency control.
In Table 7 and Table 8, active and reactive power of PV 2 and BESS 3 (Figure 1) as well as PV 2/BESS 3 connection point voltage (U_PV_2, Figure 1) values during larger under-frequencies (49.4 Hz) in Cases 7a and 7b are presented.
In both cases OLTC set value is 20.0 kV. Case 7a is similar to 2b and Case 7b is same as 5a (Table 2). The under-frequencies (49.4 Hz) however, are larger (Table 3) and both Cases 7a and 7b are done without PU-blocking in PV 2/BESS 3 due to their ‘frequency adaptive PU-droops’ (Figure 7).
From Table 7 and Table 8 it can be seen that during larger under-frequencies (49.4 Hz) in Case 7a with only PVs (no BESSs), the frequency adaptive PU-droop enables larger PV 2 output and power system frequency support also during simultaneous demand response at t = 95 s (see Case 7a ΔPTOTAL_75s and ΔPTOTAL_95s values in Table 9 when compared to Case 2b). Respectively, in Case 7b with PVs and BESSs during 49.4 Hz under-frequency events the combined frequency support of PV 2 and BESS 3 is increased (see Case 7b ΔPTOTAL_75s and ΔPTOTAL_95s values in Table 9 when compared to Case 5a) and their total effect due to ‘frequency adaptive PU-droops’ is much better from the whole system point of view.
Figure 8 shows the active power behavior of PV 2 and BESS as well as voltage behavior at PV 2 connection point during simulated under-frequency (49.4 Hz) events in Cases 5a, 7b (with different PU-droops, Figure 7 and Table 7 and Table 8 ). From Figure 8 and Table 7 and Table 8 it can be seen that PV 2 active power PPV_2 is much less curtailed during under-frequency events in Case 7b with PU-droop 2 than with PU-droop 3. In addition, simultaneous change and increase in BESS 3 active power PBESS_3 is smaller in Case 7b with PU-droop 3 than with PU-droop 2. These differences in PPV_2 and PBESS_3 behavior during under-frequencies are affected by different PU-droops as well as the PSCAD implementation logic presented in Figure 7b.

4. New Real-Time Adaptive Management Schemes

In the following, new real-time adaptive management schemes are proposed based on the previous studies and simulation results presented in Section 3.

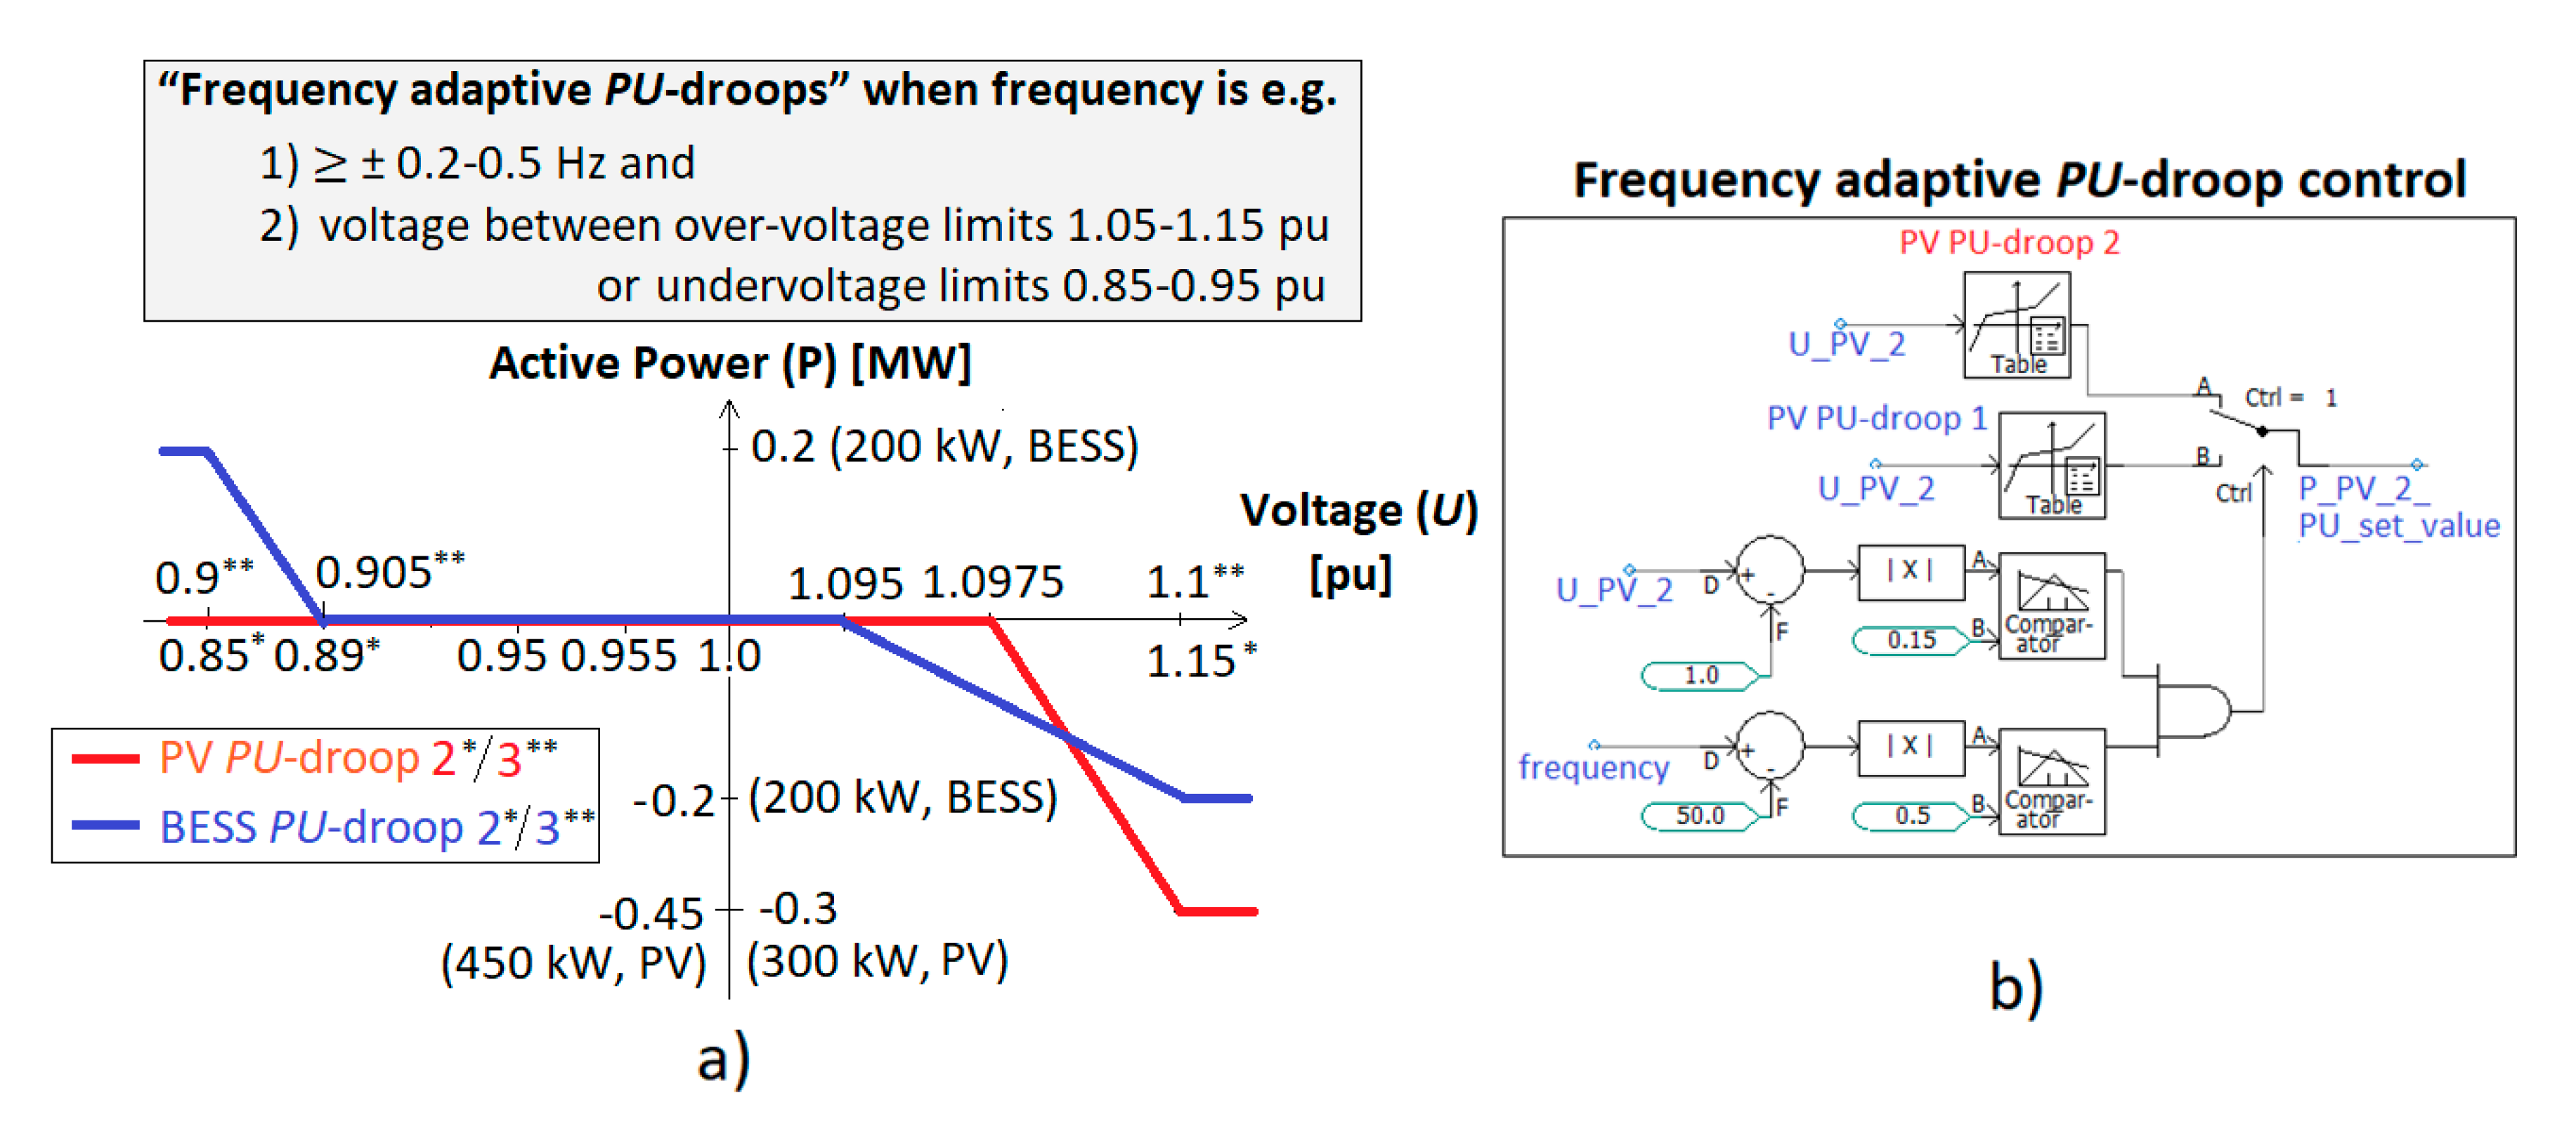
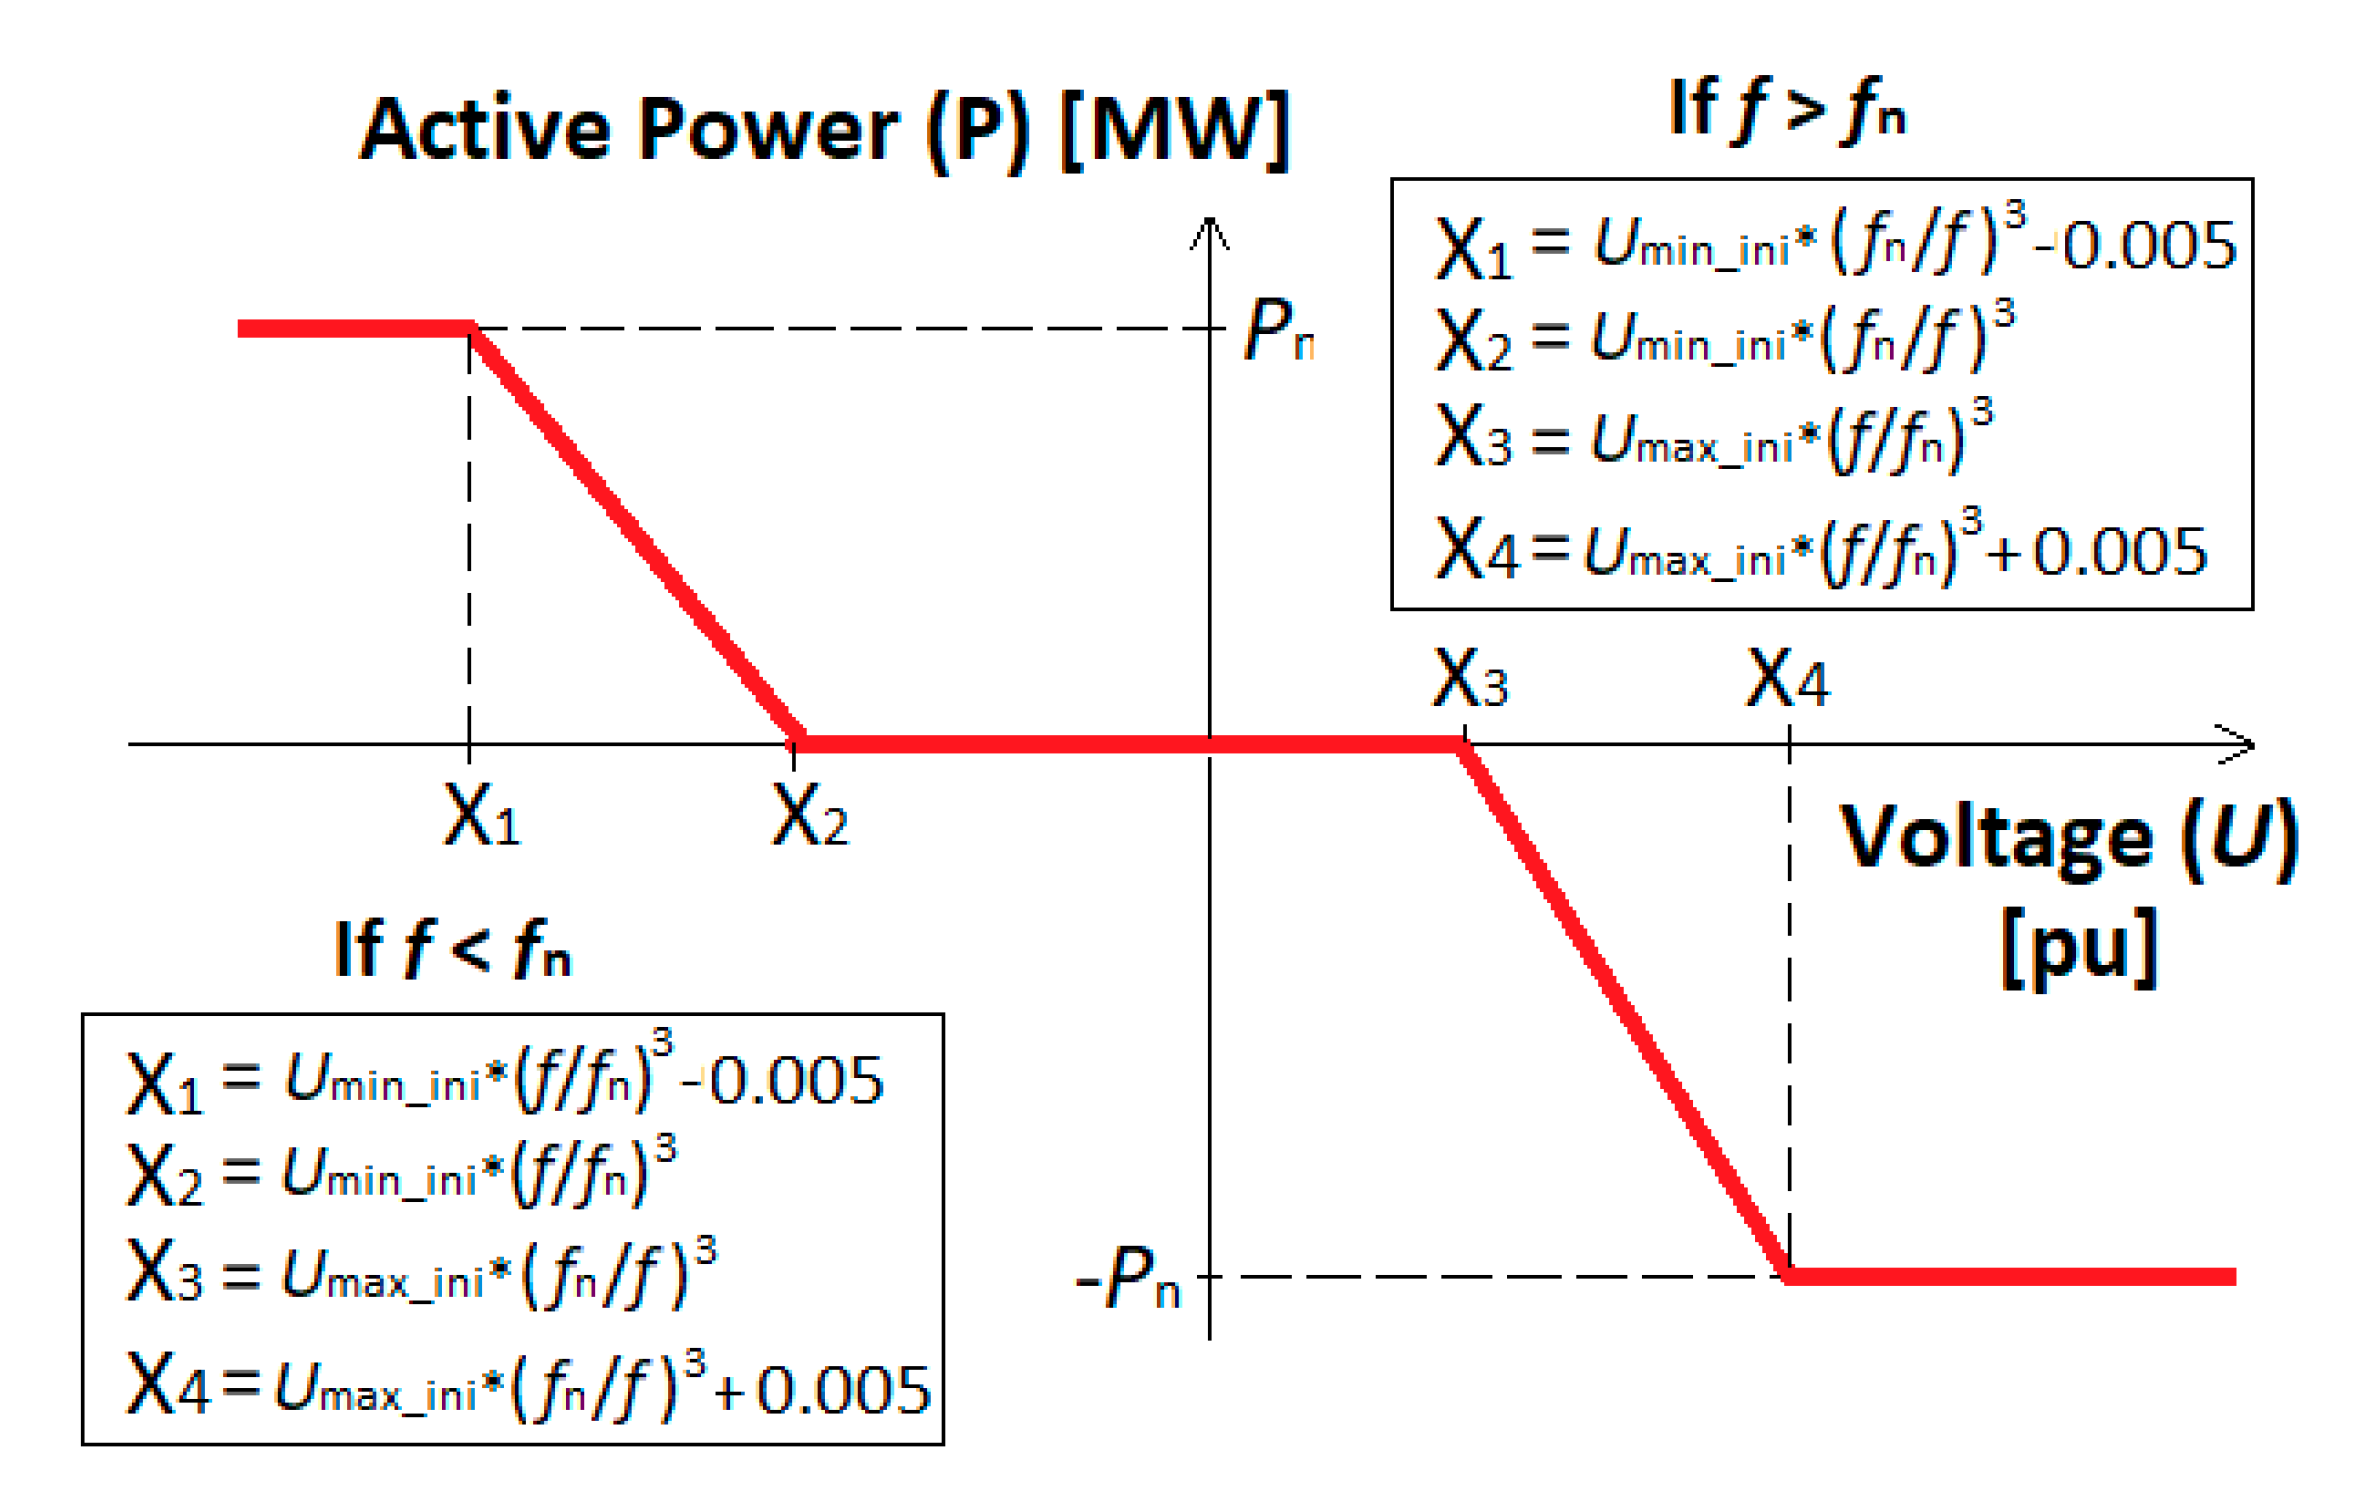
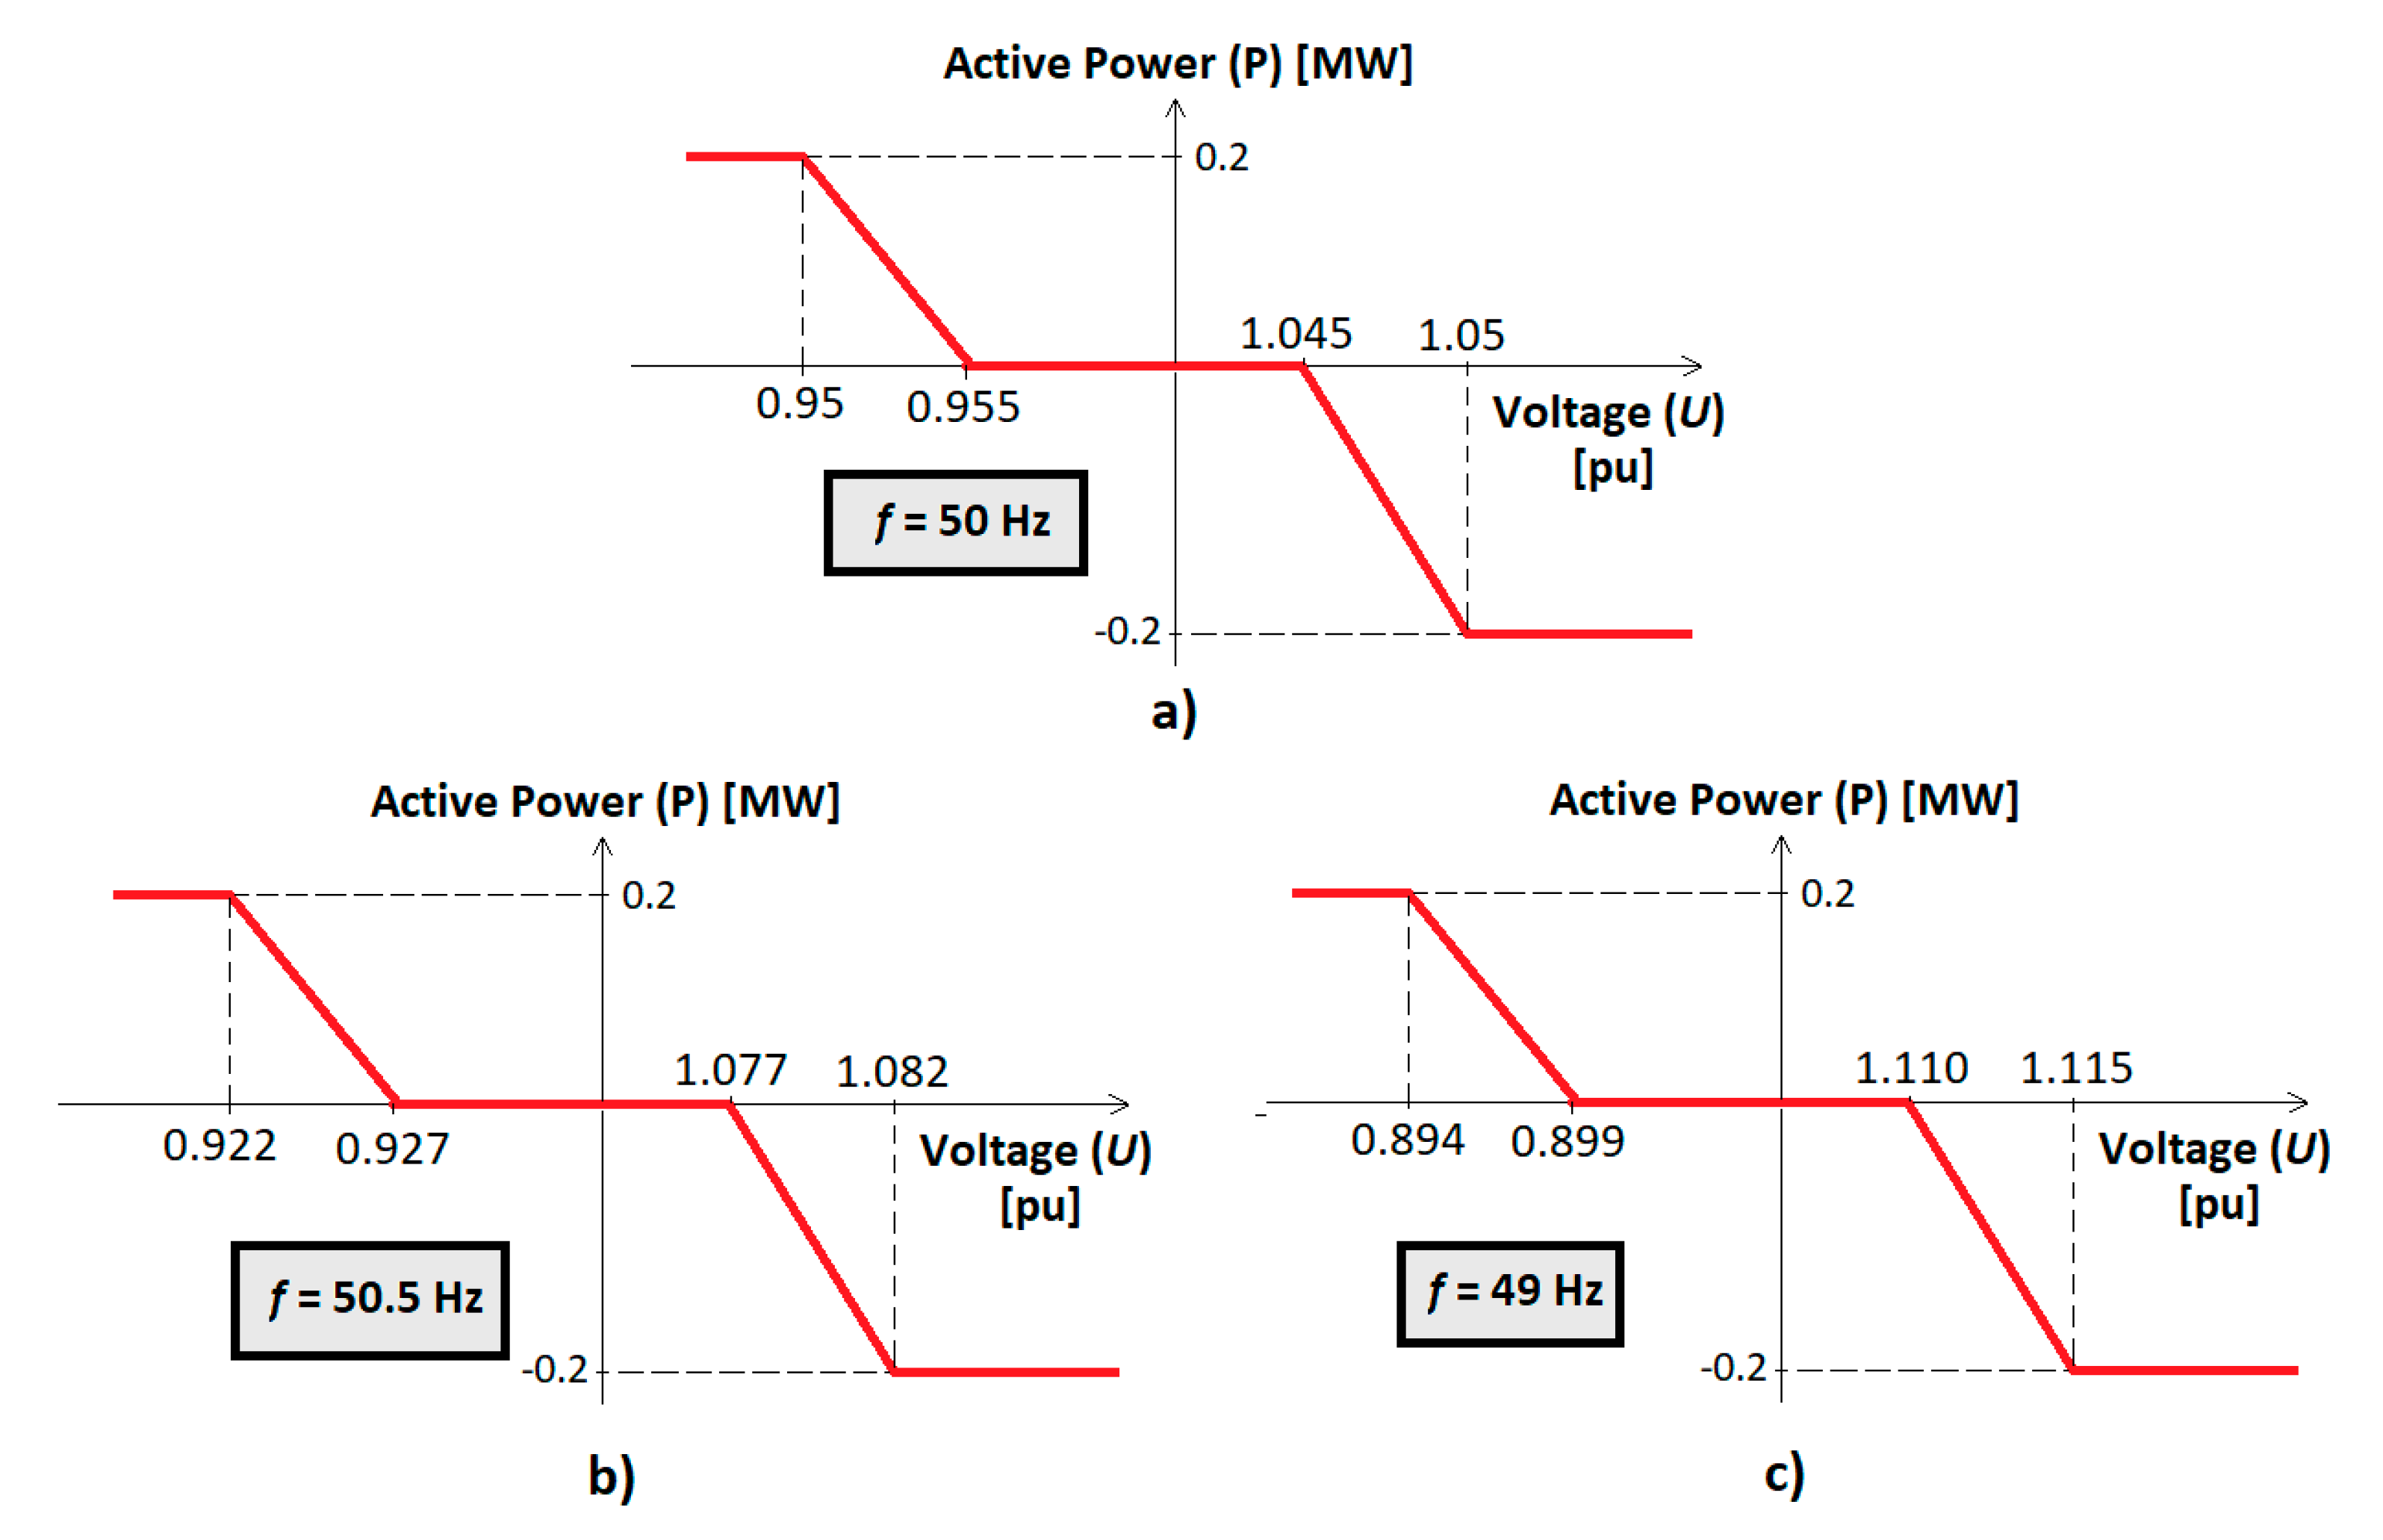
4.1. Real-Time Frequency Adaptive PU-Droop

In Section 3.2. the idea of frequency adaptive PU-droops for PVs and BESSs was presented. The implementation could be smoother without exact frequency (≥ ± 0.2-0.5 Hz) and voltage limits for the activation of the frequency adaptive functionality. Therefore, in Figure 9 new ‘real-time frequency adaptive PU-droop’ for PV and BESS units is proposed when frequency deviation is between ± 1.0 Hz from the nominal frequency fn. If frequency deviation is larger, then similar settings will be used as if the deviation would be 1.0 Hz from fn. This approach enables constant and smoother frequency adaptive response from the DER units which is also more dependent on the real-time magnitude of frequency change. It should be noted from Figure 9 that different equations will be used for calculation of the PU-droop set-points X1, X2, X3, and X4 depending on the situation (i.e., under- or over-frequency, f < fn or f > fn). In these Figure 9 equations for X1, X2, X3, and X4:
  • f = measured frequency (Hz)
  • fn = nominal frequency (Hz)
  • Umin_ini = chosen initial minimum voltage set-point value when f = fn (pu)
  • Umax_ini = chosen initial maximum voltage set-point value when f = fn (pu)
  • Pn = nominal active power (MW).
Figure 10 shows example about calculated real-time frequency adaptive PU-droop values X1, X2, X3, and X4 (Figure 9) for 200 kW BESS with different frequency values when fn = 50 Hz, Pn = 0.2 MW, Umin_ini = 0.955 pu, and Umax_ini = 1.045 pu.

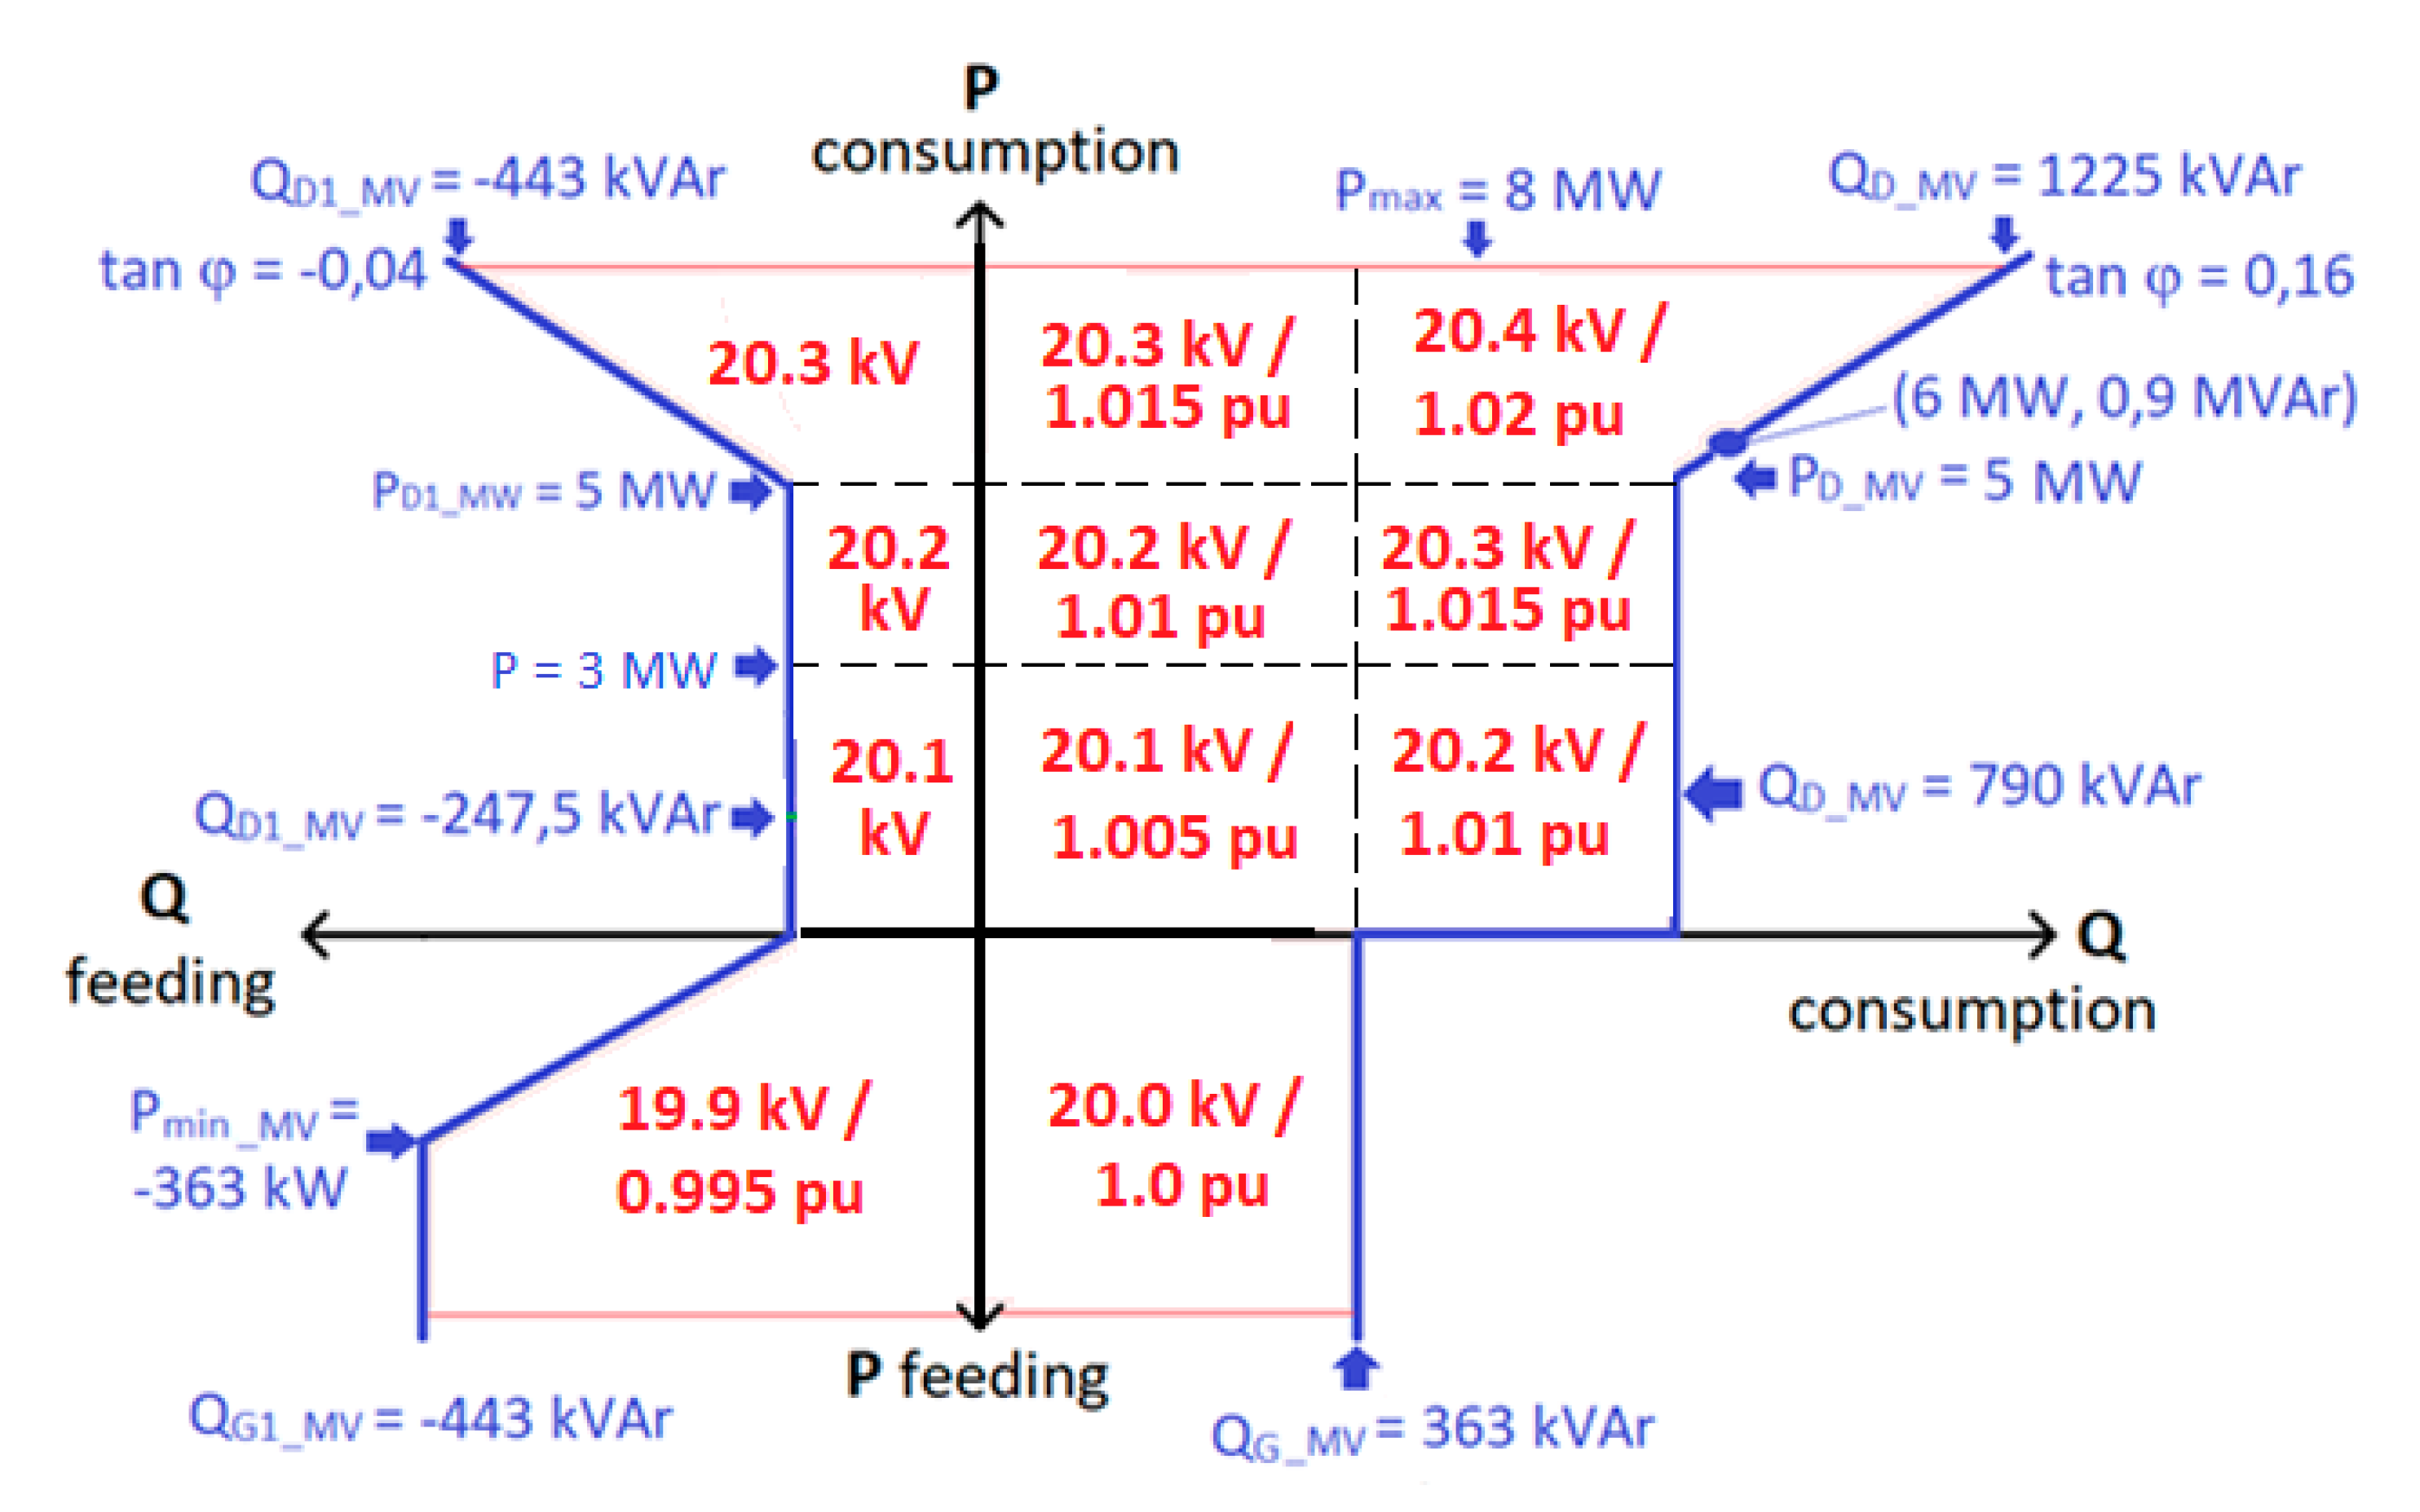
4.2. Real-Time HV/MV Substation PQ-Flow Dependent OLTC Setting Value

Instead of seasonal OLTC settings the OLTC setting value could be based on locally measured real-time active and reactive power flow levels (5 min average PHV and QHV values) between HV and MV networks at the HV/MV substation as shown in Figure 11. The example in Figure 11 is based on SSG RPW-limits [39]. This proposed new PQ-flow dependent OLTC setting value calculation could enable increased DER and PV hosting capacity in distribution networks, less reactive power produced by cables (see Equation (1), Section 2.2), and therefore decreased need for voltage control support in MV and LV networks by the flexible energy resources. In addition, simultaneously the availability of, for example, demand response, for provision of system-wide frequency support could be increased.
The proposed PQ-flow dependent OLTC setting value (Figure 11) is based on local measurements only and does not require knowledge about minimum and maximum voltages in the corresponding distribution network. Therefore, this approach could be further improved in the future with the real-time measurements based data in order to achieve even more optimized and coordinated determination of OLTC set value and compatible settings for the adaptive QU-droops of the DER units (Section 4.3).

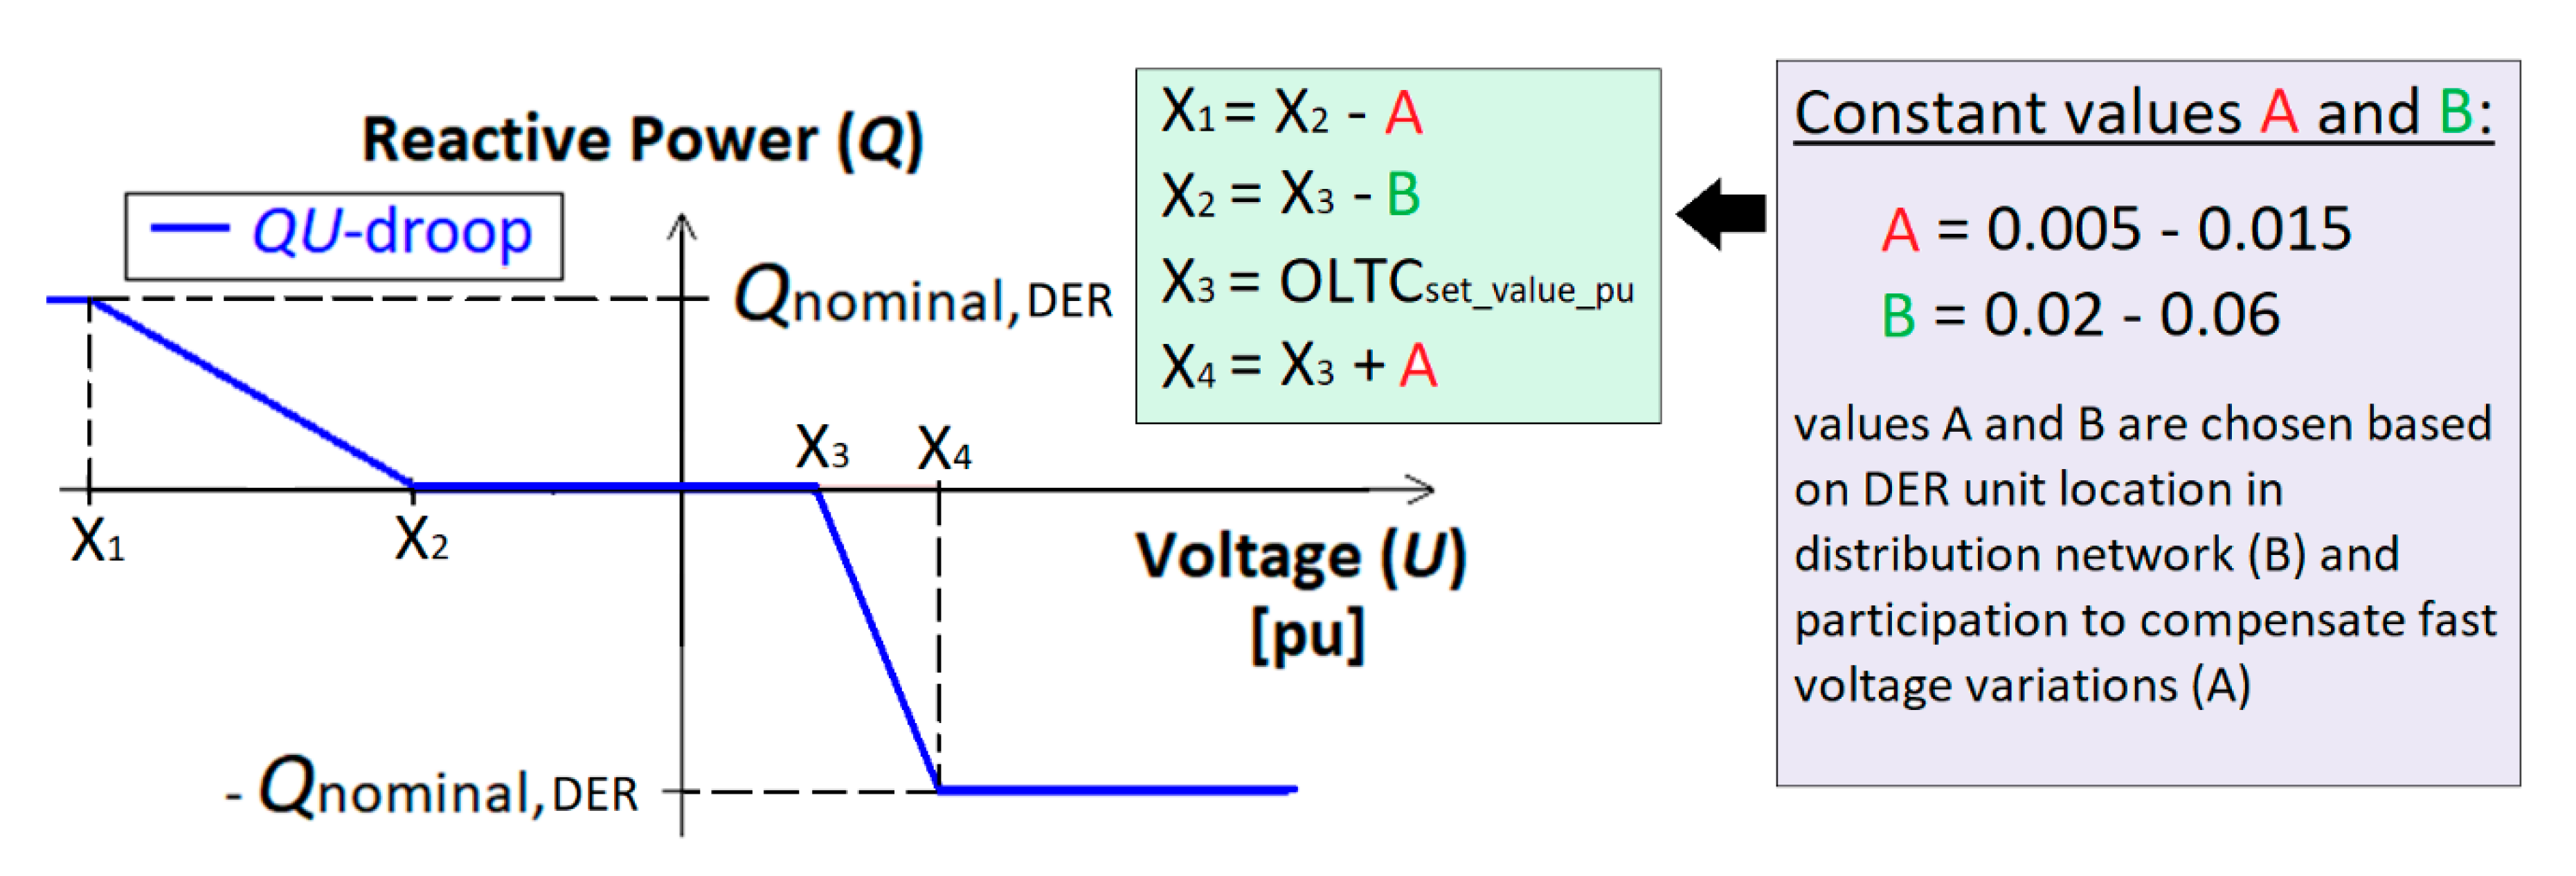
4.3. Real-Time Adaptive QU-Droop Based on OLTC Setting Value

If seasonal OLTC settings are utilized, then also QU-droop settings of DER units should be adapted accordingly when OLTC seasonal setting value is changed. This could be done, for example, based on date if also OLTC set value is changed based on the same schedule. This approach was also used as a hypothesis in the simulations presented in Section 3. If the real-time OLTC setting value (e.g., as defined in Section 4.2) however, can be communicated to the DER unit then it could be used as an input to adapt the DER unit QU-droop settings as shown in Figure 12. Regarding the QU-droop settings (Figure 12), the dead-zone size could be modified based on chosen constant B value (from 0.02 to 0.06 pu) depending on the location of the DER unit in MV or LV network. In addition, if participation of the DER unit to compensate fast voltage variations is emphasized then a smaller constant A value in Figure 12 (e.g., 0.005 pu) could be used instead of a larger one (e.g., 0.015 pu) in QU-droop settings.

5. Conclusions

In this paper solutions for increasing PV hosting capacity and distribution network connected flexible energy resources improved utilization for local (DSO) and system-wide (TSO) services were studied by PSCAD simulations during very low load situations. The focus was on the potential momentary mutual effects and simultaneous interaction between different functions. Based on the simulation results, it can be concluded that
  • PV hosting capacity in LV network can be increased with lower OLTC setting value.
  • Feasible and coordinated QU-, PU-, and Pf-droop settings (with dead-zones) of PVs and BESSs are essential in maximizing the provision of their flexibility services.
  • During an over-frequency event without BESS, the best frequency support can be achieved by using PU-control blocking logic on PVs.
  • PV hosting capacity can be increased to some extent by remote LV voltage measurement from PV connection point to MV/LV substation connected BESS.
  • With BESS at the PV connection point however, the PV hosting capacity during steady-state operation can be maximized by simultaneously charging BESS in order to avoid local over-voltages.
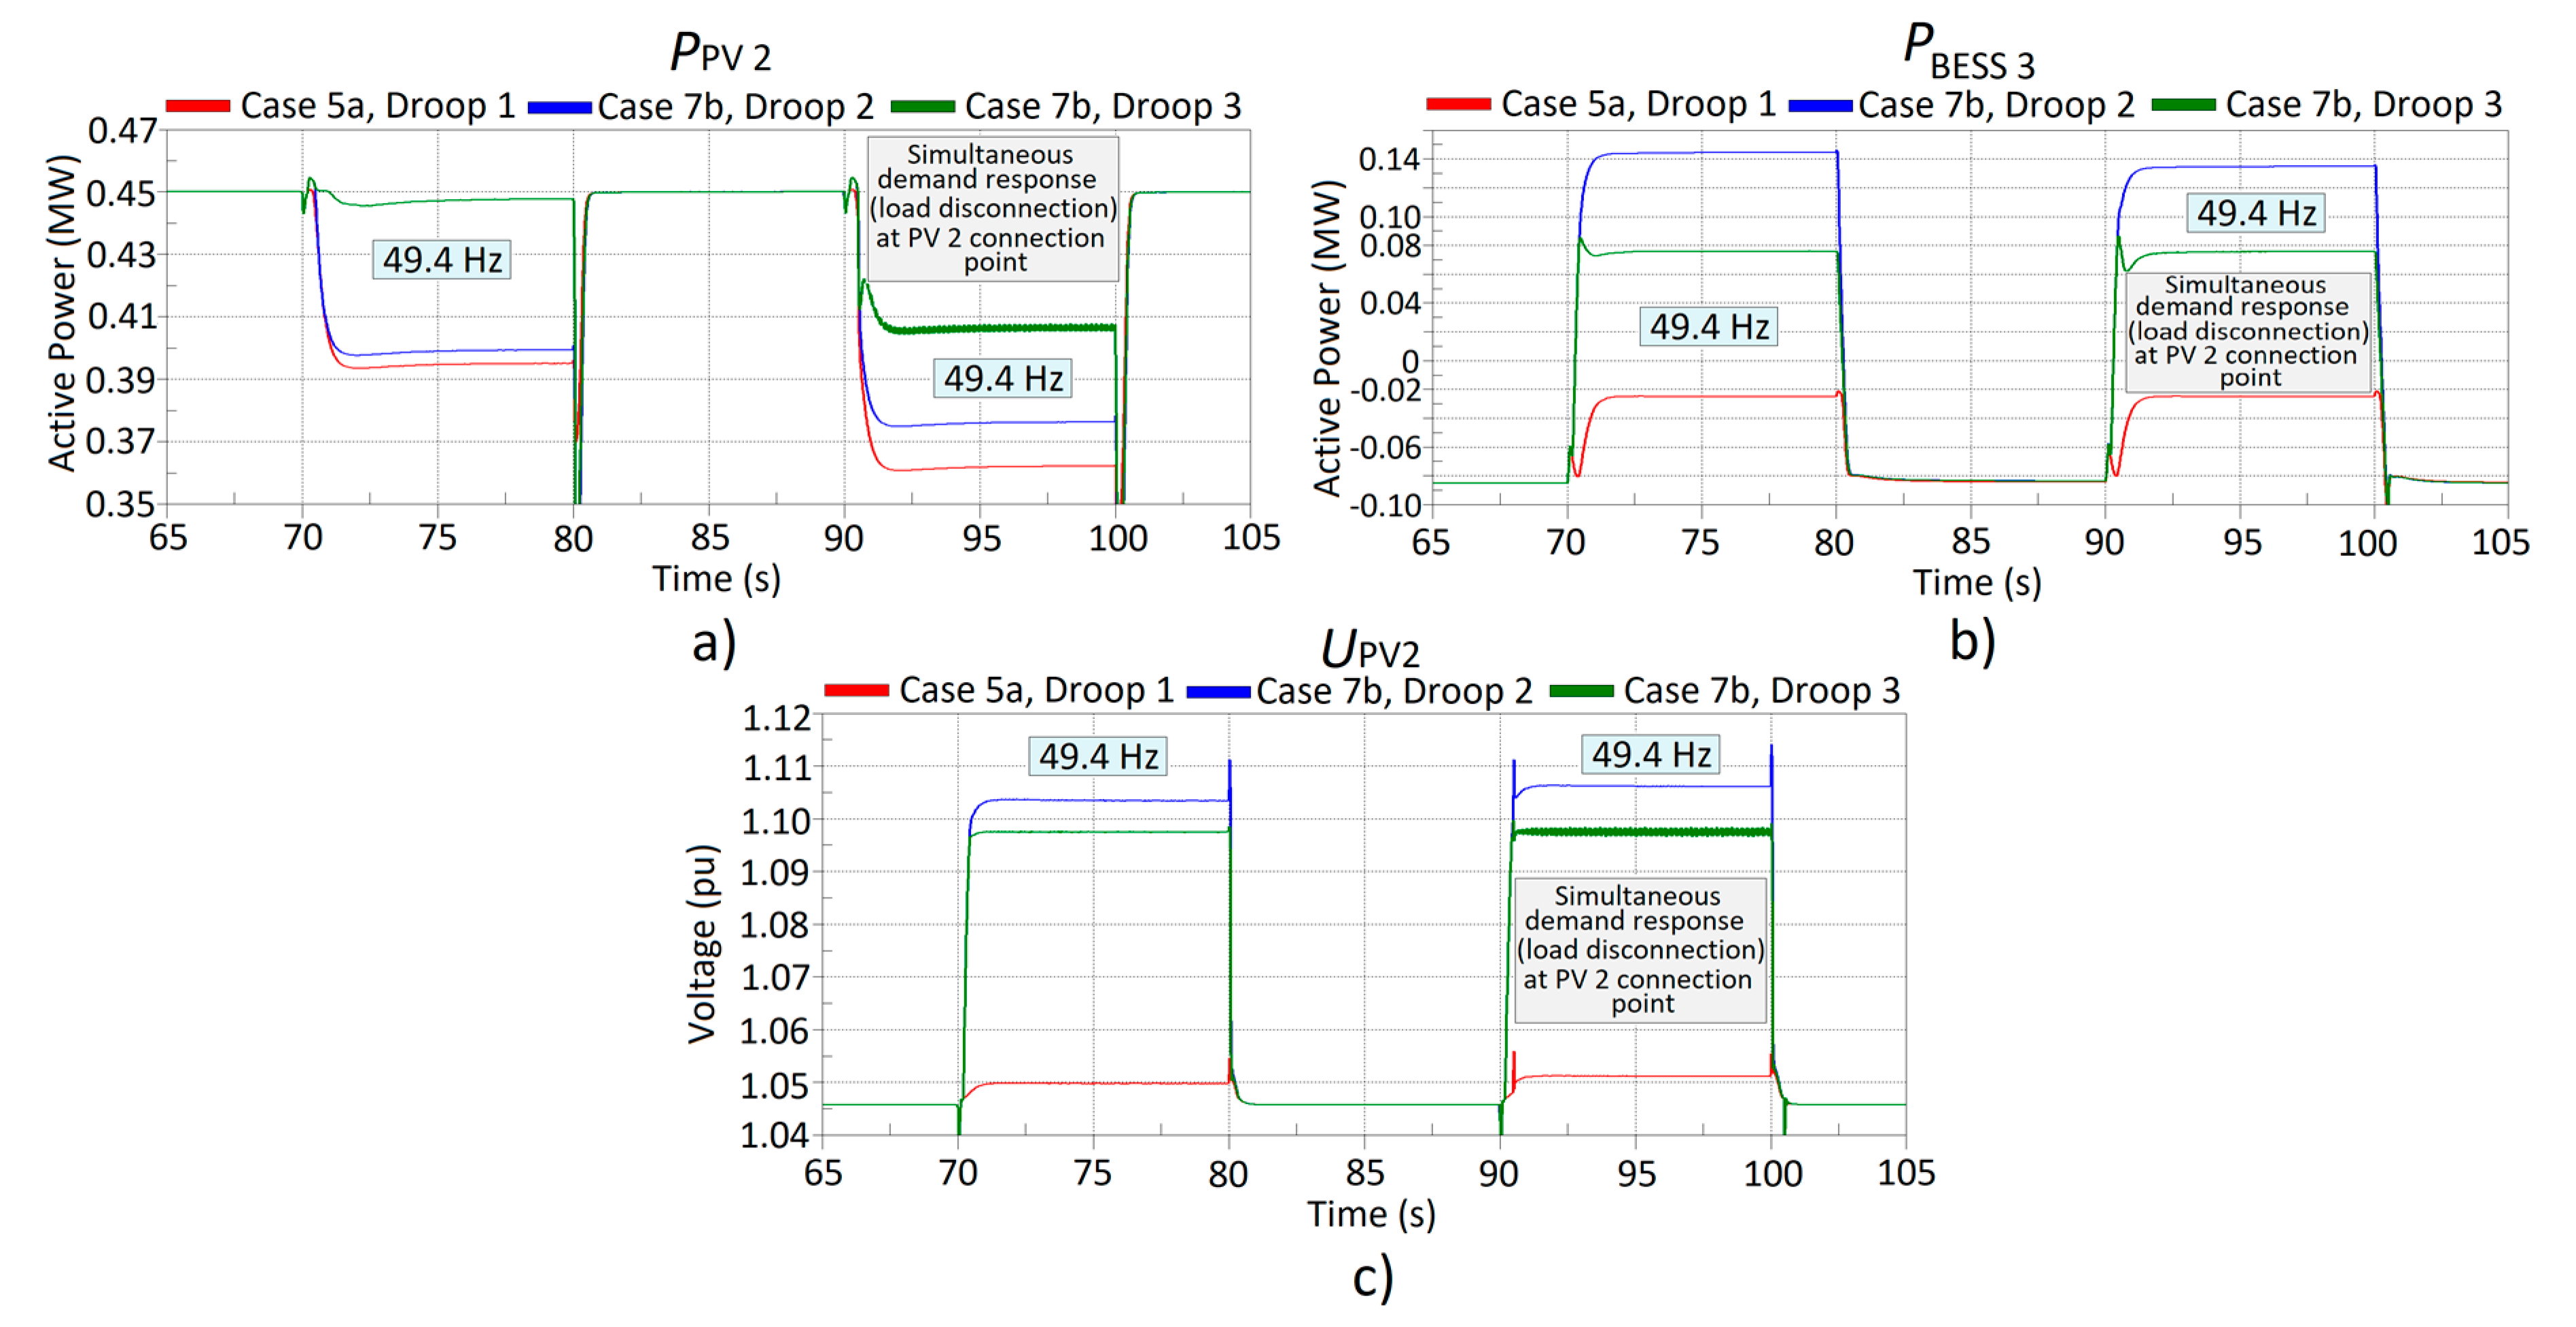
  • During larger frequency deviations frequency adaptive PU-droops can enable larger PV and BESS power system frequency support as well as maximize smaller LV network connected demand (loads) participation in frequency control.
  • Actual implementation logic (e.g., PU-blocking or change of active PU-droop with frequency adaptive PU-droops) affects the PV and BESS frequency support contribution and the extent of PV curtailment (Table 10).
In general, it can be stated that the dead-zones in BESS and PV unit QU-, PU-, and Pf-droops are required in order to enable multi-use of active (P) and/or reactive (Q) power for different purposes. In the future, new adaptive management schemes to enable maximum availability of all types and sizes of flexibilities for different local and system level services are needed. New management and DER control methods must be also compatible with other flexibility service options and platforms like flexibility markets. Therefore, in the near future flexible QU-, PU-, and Pf-droop functions for DER units are required. Flexible droop functions could also enable local operation optimization at DSO level by updating droop functions setting values and activation limits in a seasonal/monthly/weekly/daily/hourly manner. The adaptation of these droops to the changing network situations, however, should be increasingly done in the future based on the available local and/or remote measurements information. Therefore, in Section 4 new real-time adaptive management schemes for DER units’ PU-droops, HV/MV substation transformer’s OLTC setting value (dependent on the PQ-flow through the transformer), and DER units’ QU-droops (dependent on OLTC setting value) were also proposed.
It was shown by simulations that with BESS at the PV connection point the PV hosting capacity during steady-state operation and very low load situation can be maximized by simultaneously charging BESS. In reality this is only possible if State-of-Charge (SOC) of the BESS is at a suitable level. BESS’s SOC naturally has an effect on its capabilities to be used for different control purposes and the ability to provide different flexibility services. In real-life, the SOC-dependency of the BESS PU-droops would be feasible to be implemented as part of the control system in order to be able to maximize benefits to the owner of the assets/flexibility resources. Real-time SOC-level defines the actual BESS ability to provide the different flexibility services. These issues will be considered in the future research.

Author Contributions

Conceptualization, methodology, investigation, H.L.; writing—original draft preparation, H.L., C.P., H.H., M.S.-k., H.K.; writing—review and editing, C.P., H.H., M.S.-k., H.K., N.H. All authors have read and agreed to the published version of the manuscript.

Funding

This work was done as part of FLEXIMAR-project (Novel marketplace for energy flexibility) which is funded by Business Finland and Finnish companies (https://www.univaasa.fi/en/research/projects/fleximar/).

Conflicts of Interest

The authors declare no conflict of interest.

Nomenclature

ACAlternating Current
ANMActive Network Management
BESSBattery Energy Storage System
CBCircuit Breaker
DCDirect Current
DGDistributed Generation
DER Distributed Energy Resources
DSODistribution System Operator
ENTSO-EEuropean Network of Transmission System Operators for Electricity
ESEnergy Storage
EUEuropean Union
EVElectric Vehicle
HV High Voltage
J06, J07, J08MV feeders in the study case
LV Low Voltage
MV Medium Voltage
NC Network Code
OLTC On-Load Tap Changer
PSCADPower System Simulation Software
P-controllerProportional controller
PI-controllerProportional-Integral controller
PV Photovoltaic
RESRenewable Energy Sources
RfGRequirements for Generators
RMSRoot Mean Square
RPWReactive Power Window
SOCState-of-Charge
SSGSundom Smart Grid
TSOTransmission System Operator
WTWind Turbine
ω Angular frequency
C Capacitance
cosφPower factor
cosφ(P)Active Power dependent power factor
f Frequency
fn Nominal frequency (Hz)
I Current
Imeas Measured Current
IdCurrent direct (d) component
Id_refCurrent direct (d) component reference value
IqCurrent quadrature (q) component
Iq_refCurrent quadrature (q) component reference value
L Inductance
P Active Power
P_MV_flowActive Power flow between HV and MV networks
Pf or P(f)Active Power—Frequency
PU or P(U)Active Power—Voltage
ΔPBESS_3Active Power change of BESS unit 3
ΔPPV_2Active Power change of PV unit 2
ΔPTOTAL_75sTotal Active Power change during simulation at t = 75 s
ΔPTOTAL_95sTotal Active Power change during simulation at t = 95 s
PBESS_1Active Power of BESS unit 1
PBESS_3Active Power of BESS unit 3
Pn Nominal active power
PPV Active Power of PV unit
PPV_2 Active Power of PV unit 2
PWT Active Power of Wind Turbine (WT)
P_refActive Power reference value
PQActive Power—Reactive Power
Q Reactive Power
Q_MV_flowReactive Power flow between HV and MV networks
Qcable Total Reactive Power of a cable
QconsumptionReactive Power consumed by a cable
QproductionReactive Power produced by a cable
QunbReactive Power unbalance
Q(P)Reactive Power—Active Power
QU or Q(U)Reactive Power—Voltage
QBESS_1Reactive Power of BESS unit 1
QBESS_3Reactive Power of BESS unit 3
QPV_2 Reactive Power of PV unit 2
Q_refReactive Power reference value
t Time
U Voltage
UnNominal Voltage
Umin_ini Chosen initial minimum voltage set-point value
Umax_ini Chosen initial maximum voltage set-point value
UPV_2 Connection point voltage of PV unit 2
VdVoltage direct (d) component
VqVoltage quadrature (q) component
VPCCVoltage at the point of common coupling
V_refVoltage reference value

References

  1. Mohandes, B.; El Moursi, M.S.; Hatziargyriou, N.; El Khatib, S. A review of power system flexibility with high penetration of renewables. IEEE Trans. Power Syst. 2019, 34, 3140–3155. [Google Scholar] [CrossRef]
  2. Laaksonen, H.; Hovila, P. FlexZone concept to enable resilient distribution grids-possibilities in sundom smart grid. In Proceedings of the CIRED Workshop 2016, Helsinki, Finland, 14–15 June 2016. [Google Scholar]
  3. Astapov, V.; Divshali, P.H.; Söder, L. The potential of distribution grid as an alternative source for reactive power control in transmission grid. In Proceedings of the 20th European Conference on Power Electronics and Applications-EPE 2018, Riga, Latvia, 17–21 September 2018. [Google Scholar]
  4. Hafezi, H.; Laaksonen, H. Autonomous soft open point control for active distribution network voltage level management. In Proceedings of the 13th IEEE PowerTech 2019, Milan, Italy, 23–27 June 2019. [Google Scholar]
  5. Hes, S.; Kula, J.; Svec, J. Technical solutions for increasing der hosting capacity in distribution grids in the Czech Republic in terms of European project INTERFLEX. In Proceedings of the 25th International Conference on Electricity Distribution-CIRED 2019, Madrid, Spain, 3–6 June 2019. [Google Scholar]
  6. Ulasenka, A.; Del Rio Etayo, L.; Cirujano, P.; Ortiz, A.; Brandl, R.; Montoya, J. Holistic coordination of smart technologies for efficient lv operation, increasing hosting capacity and reducing grid losses. In Proceedings of the 25th International Conference on Electricity Distribution-CIRED 2019, Madrid, Spain, 3–6 June 2019. [Google Scholar]
  7. Wang, Y.; Xu, Y.; Tang, Y.; Syed, M.H.; Guillo-Sansano, E.; Burt, G.M. Decentralized-Distributed Hybrid Voltage Regulation of Power Distribution Networks Based on Power Inverters. IET Gener. Transm. Distrib. 2019, 13, 444–451. [Google Scholar] [CrossRef]
  8. Divshali, P.H.; Söder, L. Improving hosting capacity of rooftop PVS by quadratic control of an LV-Central BSS. IEEE Trans. Smart Grid 2017, 10, 919–927. [Google Scholar] [CrossRef]
  9. Parthasarathy, C.; Hafezi, H.; Laaksonen, H.; Kauhaniemi, K. Modelling and simulation of hybrid PV & BES systems as flexible resources in Smartgrids–Sundom smart grid case. In Proceedings of the 13th IEEE PowerTech 2019, Milan, Italy, 23–27 June 2019. [Google Scholar]
  10. Divshali, P.H.; Alimardani, A.; Hosseinian, S.H.; Abedi, M. Decentralized cooperative control strategy of microsources for stabilizing autonomous VSC-Based Microgrids. IEEE Trans. Power Syst. 2012, 27, 1949–1959. [Google Scholar] [CrossRef]
  11. Worthmann, K.; Kellett, C.M.; Braun, P.; Grüne, L.; Weller, S.R. Distributed and decentralized control of residential energy systems incorporating battery storage. IEEE Trans. Smart Grid 2015, 6, 1914–1923. [Google Scholar] [CrossRef] [Green Version]
  12. Nieto, A.; Efstratiadi, M.-A.; Currie, A.; Coughlan, K.; Do, S. Coordinated operation of a grid scale energy storage system with tap changer for voltage control on primary substations. In Proceedings of the 25th International Conference on Electricity Distribution-CIRED 2019, Madrid, Spain, 3–6 June 2019. [Google Scholar]
  13. Weckx, S.; D’Hulst, R.; Driesen, J. Primary and secondary frequency support by a multi-agent demand control system. IEEE Trans. Power Syst. 2015, 30, 1394–1404. [Google Scholar] [CrossRef]
  14. Mokhtari, G.; Ghosh, A.; Nourbakhsh, G.; Ledwich, G. Smart robust resource control in LV network to deal with voltage rise issue. IEEE Trans. Sustain. Energy 2013, 4, 1043–1050. [Google Scholar] [CrossRef]
  15. Lee, S.-J.; Kim, J.-H.; Kim, C.-H.; Kim, S.-K.; Kim, E.-S.; Kim, D.-U.; Mehmood, K.K.; Khan, S.U. Coordinated control algorithm for distributed battery energy storage systems for mitigating voltage and frequency deviations. IEEE Trans. Smart Grid 2016, 7, 1713–1722. [Google Scholar] [CrossRef]
  16. Miao, L.; Wen, J.; Xie, H.; Yue, C.; Lee, W.-J. Coordinated control strategy of wind turbine generator and energy storage equipment for frequency support. IEEE Trans. Ind. Appl. 2013, 51, 2732–2742. [Google Scholar] [CrossRef]
  17. Alam, M.J.E.; Muttaqi, K.M.; Sutanto, D. Mitigation of rooftop solar pv impacts and evening peak support by managing available capacity of distributed energy storage systems. IEEE Trans. Power Syst. 2013, 28, 3874–3884. [Google Scholar] [CrossRef] [Green Version]
  18. Nazariet, M.H.; Costello, Z.; Feizollahi, M.J.; Grijalva, S.; Egerstedt, M. Distributed frequency control of prosumer-based electric energy systems. IEEE Trans. Power Syst. 2014, 29, 2934–2942. [Google Scholar]
  19. Moghadam, M.R.V.; Ma, R.T.B.; Zhang, R. Distributed frequency control in smart grids via randomized demand response. IEEE Trans. Smart Grid 2014, 5, 2798–2809. [Google Scholar] [CrossRef]
  20. Xing, L.; Mishra, Y.; Tian, Y.; Ledwich, G.; Su, H.; Peng, C.; Fei, M. Dual consensus based distributed frequency control for multiple energy storage systems. IEEE Trans. Smart Grid 2019, 10, 6396–6403. [Google Scholar] [CrossRef]
  21. Yu, L.; Chu, C. Consensus-based secondary frequency and voltage droop control of virtual synchronous generators for Isolated AC Microgrids. IEEE J. Emerg. Sel. Top. Circuits Syst. 2015, 5, 443–455. [Google Scholar]
  22. Baros, S.; Llic, M.D. A Consensus approach to real-time distributed control of energy storage systems in wind farms. IEEE Trans. Smart Grid 2019, 10, 613–625. [Google Scholar] [CrossRef]
  23. Nguyen, D.H.; Khazaei, J. Multi-agent time-delayed fast consensus design for distributed battery energy storage systems. IEEE Trans. Sustain. Energy 2018, 9, 1397–1406. [Google Scholar] [CrossRef]
  24. Pilloni, A.; Pisano, A.; Usai, E. Robust finite time frequency and voltage restoration of inverter-based microgrids via sliding mode cooperative control. IEEE Trans. Ind. Electron. 2018, 65, 907–917. [Google Scholar] [CrossRef]
  25. Hu, J.; Lanzon, A. Distributed finite time consensus control for heterogeneous battery energy storage systems in droop-controlled microgrids. IEEE Trans. Smart Grid 2019, 10, 4751–4761. [Google Scholar] [CrossRef] [Green Version]
  26. Sugihara, H.; Yokoyama, K.; Saeki, O.; Tsuji, K.; Funaki, T. Economic and efficient voltage management using customer-owned energy storage systems in a distribution network with high penetration of photovoltaic systems. IEEE Trans. Power Syst. 2013, 28, 102–111. [Google Scholar] [CrossRef]
  27. Giannitrapani, A.; Paoletti, S.; Vicino, A.; Zarrilli, D. Optimal allocation of energy storage systems for voltage control in LV distribution networks. IEEE Trans. Smart Grid 2017, 8, 2859–2870. [Google Scholar] [CrossRef]
  28. Zarrilli, D.; Giannitrapani, A.; Paoletti, S.; Vicino, A. Energy storage operation for voltage control in distribution networks: A receding horizon approach. IEEE Trans. Control Syst. Technol. 2018, 26, 599–609. [Google Scholar] [CrossRef]
  29. Sami, S.S.; Cheng, M.; Wu, J.; Jenkins, N. A Virtual energy storage system for voltage control of distribution networks. CSEE J. Power Energy Syst. 2018, 4, 146–154. [Google Scholar] [CrossRef]
  30. Wang, L.; Liang, D.H.; Crossland, A.F.; Taylor, P.C.; Jones, D.; Wade, N.S. Coordination of multiple energy storage units in a low-voltage distribution network. IEEE Trans. Smart Grid 2015, 6, 2906–2918. [Google Scholar] [CrossRef] [Green Version]
  31. Wang, Y.; Tan, K.T.; Peng, X.Y.; So, P.L. Coordinated control of distributed energy-storage systems for voltage regulation in distribution networks. IEEE Trans. Power Deliv. 2016, 31, 1132–1141. [Google Scholar] [CrossRef]
  32. Jayasekara, N.; Masoum, M.A.; Wolfs, P.J. Optimal operation of distributed energy storage systems to improve distribution network load and generation hosting capability. IEEE Trans. Sustain. Energy 2016, 7, 250–261. [Google Scholar] [CrossRef]
  33. Rigas, A.; Messinis, G.; Hatziargyriou, N. Application of topology identification on optimal bess sizing in distribution systems. In Proceedings of the 8th IEEE PES Innovative Smart Grid Technologies Conference Europe-ISGT Europe 2018, Sarajevo, Bosnia and Herzegovina, 21–25 October 2018. [Google Scholar]
  34. Jahromi, A.A.; Majzoobi, A.; Khodaei, A.; Bahramirad, S.; Zhang, L.; Paaso, A.; Lelic, M.; Flinn, D. Battery Energy storage requirements for mitigating PV output fluctuations. In Proceedings of the 8th IEEE PES Innovative Smart Grid Technologies Conference Europe-ISGT Europe 2018, Sarajevo, Bosnia and Herzegovina, 21–25 October 2018. [Google Scholar]
  35. Zhang, Y.; Ren, S.; Dong, Z.Y.; Xu, Y.; Meng, K.; Zheng, Y. Optimal placement of battery energy storage in distribution networks considering conservation voltage reduction and stochastic load composition. IET Gener. Transm. Distrib. 2017, 11, 3862–3870. [Google Scholar] [CrossRef]
  36. Yue, M.; Wang, X. Grid Inertial response-based probabilistic determination of Energy Storage System Capacity under high solar penetration. IEEE Trans. Sustain. Energy 2015, 6, 1039–1049. [Google Scholar] [CrossRef]
  37. Wang, Y.; Xu, Y.; Tang, Y.; Liao, K.; Syed, M.H.; Guillo-Sansano, E.; Burt, G. Aggregated energy storage for power system frequency control: A finite-time consensus approach. IEEE Trans. Smart Grid 2019, 10, 3675–3686. [Google Scholar] [CrossRef]
  38. Vasilj, J.; Gros, S.; Jakus, D.; Sarajcev, P. Multi-market scheduling of battery storages within renewable portfolios. In Proceedings of the 8th IEEE PES Innovative Smart Grid Technologies Conference Europe-ISGT Europe 2018, Sarajevo, Bosnia and Herzegovina, 21–25 October 2018. [Google Scholar]
  39. Laaksonen, H.; Sirviö, K.; Aflecht, S.; Hovila, P. Multi-objective active network management scheme studied in sundom smart grid with MV and LV network connected DER units. In Proceedings of the 25th International Conference on Electricity Distribution-CIRED 2019, Madrid, Spain, 3–6 June 2019. [Google Scholar]
  40. Laaksonen, H.; Hovila, P.; Kauhaniemi, K.; Sirviö, K. Advanced islanding detection in grid interactive microgrids. In Proceedings of the CIRED 2018 Workshop, Ljubljana, Slovenia, 7–8 June 2018. [Google Scholar]
  41. Laaksonen, H.; Hovila, P.; Kauhaniemi, K. Combined islanding detection scheme utilizing active network management for future resilient distribution networks. In Proceedings of the IET 14th International Conference on Developments in Power System Protection-DPSP 2018, Belfast, UK, 12–15 March 2018. [Google Scholar]
  42. Laaksonen, H. Reliable islanding detection with active MV network management. In Proceedings of the CIRED 2014 Workshop, Rome, Italy, 11–12 June 2014. [Google Scholar]
  43. EU Commission. Commission Regulation (EU) 2016/631 of 14 April 2016 Establishing A Network Code on Requirements for Grid Connection of Generators. Available online: https://eur-lex.europa.eu/legal-content/EN/TXT/?uri=OJ:JOL_2016_112_R_0001#d1e8030-1-1 (accessed on 12 May 2020).
  44. Faranda, R.S.; Hafezi, H.; Leva, S.; Mussetta, M.; Ogliari, E. The optimum PV plant for a given solar DC/AC converter. Energies 2015, 8, 4853–4870. [Google Scholar] [CrossRef]
  45. Standard EN 50160. Voltage Characteristics of Electricity Supplied by Public Electricity Networks; European Committee for Electrotechnical Standardization (CENELEC): Brussels, Belgium, 2010. [Google Scholar]
Figure 1. One-line diagram of the studied SSG in future scenario with more PV and BESS units in LV network, as well as with control functions applied in WT, PVs, and BESSs.
Applsci 10 05146 g001
Figure 2. (a) QU-droop settings of PV units, (b) QU-droop settings of BESS units, (c) PU-droop settings of PV and BESS units, and (d) Pf-droop settings of BESS units which were used in the PSCAD simulations (see also Figure 1 and Figure 3).
Applsci 10 05146 g002
Figure 3. PV unit’s active and reactive power control functions like QU-, PU-, and Pf-droops implementation in PSCAD model (see also Figure 1 and Figure 2).
Applsci 10 05146 g003
Figure 4. PV 2′s active power (PPV_2) values in different cases with very low load during (a) steady-state, (b) over- and (c) under-frequency events (see also (Figure 1 and Figure 2, Table 2, Table 3, Table 4, Table 5 and Table 6)).
Applsci 10 05146 g004
Figure 5. Measured 30 min real-life frequency data from SSG (which is modified for PSCAD simulations to 240 s frequency input data between t = 10–250 s, see Figure 6a).
Applsci 10 05146 g005
Figure 6. (a) Input frequency (f) data modified from real-life SSG measurements (Figure 5), PV 2 and BESS 3 (b) active (P) and (c) reactive power (Q), as well as (d) local voltage (U) behavior at PV 2 connection point during simulated Case 6 (similar to Case 5, see also Figure 1 and Figure 2, Table 2, Table 3, Table 4, Table 5 and Table 6).
Applsci 10 05146 g006
Figure 7. ‘Frequency adaptive PU-droops’ (a) idea and settings for PVs and BESSs during larger under and over-frequency situations and (b) PSCAD implementation of the PV and BESS droops 2.
Applsci 10 05146 g007
Figure 8. (a) PV 2 active power PPV_2, (b) BESS 3 active power PBESS_3, and (c) local voltage UPV_2 behavior at PV 2 connection point during simulated under-frequency (49.4 Hz) events in Cases 5a (PU-droop 1), 7b (PU-droop 2), and 7b (PU-droop 3), see also Figure 2 and Figure 7.
Applsci 10 05146 g008
Figure 9. Real-time smooth frequency adaptive PU-droop without specific frequency and voltage limits for activation e.g., for BESS unit.
Applsci 10 05146 g009
Figure 10. Example of real-time frequency adaptive PU-droop values for 200 kW BESS with (a) f = 50 Hz, (b) f = 50.5 Hz, and (c) f = 49 Hz (fn = 50 Hz, Pn = 0.2 MW, Umin_ini = 0.955 pu, and Umax_ini = 1.045 pu, Figure 9).
Applsci 10 05146 g010
Figure 11. Real-time HV/MV substation PQ-flow dependent OLTC setting value with SSG (RPW)-limits.
Applsci 10 05146 g011
Figure 12. Real-time adaptive DER unit QU-droop based on OLTC set value and constants A and B.
Applsci 10 05146 g012
Table 1. Main focus areas of previous studies [39] and research work done in this paper.
Previous Studies [39]Research Work in the Paper
0. Initial choices (based on [39] findings)
  • No QU- and PU-droops on WT
  • Only Fingrid RPW-limits used which are fulfilled by the control of WT reactive power
1. Type of DER units
  • PV units (300 kW) and WT (3.6 MW)
  • Average models with controlled voltage sources
1. Type of DER units
  • PV units (300 and 450 kW), BESS units (200 kW) and WT (3.6 MW), see Figure 1 and Table 2
  • Average models with controlled voltage sources
2. Droops and control functions of DER units
  • Utilization of WT or PVs to fulfill RPW-limits
  • QU- and PU-droop also on WT
  • Different QU- (seasonal) and PU-droops for PVs
  • One Pf-droop for PVs
2. Droops and control functions of DER units
3. Focus on
  • Multi-objective ANM scheme
  • Different RPW-limits (Fingrid and ENTSO-E) and control of reactive power flow between HV and MV networks
  • Effect of different OLTC setting values (20.7 or 20.0 kV)
  • Mutual/conflicting requirements between WT control functions) (QU-droop 2 and Q-control to fulfill RPW-limits)
  • Very low and high load situations
3. Focus on
  • Solutions to increase PV hosting capacity in LV network as well as provision of services from LV network connected DER
  • Coordination between DER unit functions and OLTC settings
  • Multi-purpose use of BESS
  • Potential DER (PV and BESS) unit Pf- and PU-control interactions in different situations
  • New frequency adaptive PU-droops (Section 3.2)
  • Role of PU-droops implementation logic with different DER configurations
    For example, effect of PU-blocking with PVs (only) and with PVs + BESSs
  • Very low load situations
4. In addition, this paper presents new real-time adaptive management schemes (Section 4) for
DER units’ PU-droops,
HV/MV substation transformer’s OLTC setting value and DER units’ QU-droops
Table 2. Simulation study cases, very low load in all cases (see Figure 2).
CaseWTs **)PVs **)BESSs **)QU-Droop of PVs/BESSsPU-Droop of PVs/BESSsPf-Droop of PVs/BESSsPU-Blocking with PVs/BESSsOLTC Set Value (kV)/(pu)
1a1501/−1/−1/−No20.7/1.035
1b1501/−1/−1/−No20.0/1.0
2a1501/−1/−1/−Yes20.7/1.035
2b1501/−1/−1/−Yes20.0/1.0
3a1502/−1/−2/−Yes20.7/1.035
3b1502/−1/−2/−Yes20.0/1.0
4a1521/11/11/1Yes20.0/1.0
4b *)1521/11/11/1Yes20.0/1.0
5a1531/11/11/1No20.0/1.0
5b1531/11/11/1Yes20.0/1.0
WT is wind turbine, PV is photovoltaic unit, BESS is battery energy storage unit, *) remote voltage (U_PV_2) measurement from PV 2 connection point to BESS 1 control through communication, **) number of units.
Table 3. Simulation sequence actions and other issues in study cases (see Table 2 and Figure 1). Total simulation time t = 110 s.
Time (s)Initial Condition/Action
t = 0–110PV unit active power (PPV) is at nominal *) i.e., 300 or 450 kW
t = 10.5WT active power (PWT) increases from initial 0.5 to 1.5 MW *)
t = 15.0WT active power (PWT) increases from 1.5 to 2.5 MW *)
t = 19.0WT active power (PWT) increases from 2.5 to 3.6 MW *)
t = 30–40Over-frequency situation (50.07 Hz) **)
t = 50–60Over-frequency situation (50.25 Hz) **)
t = 70–80Under-frequency situation (49.9 or 49.4 Hz) **)
t = 90–100Under-frequency situation (49.8 or 49.4 Hz) **)
Part of the load participates in demand response and disconnects from the LV network
Other issuesIn all study cases of Table 2 PVs QU-droop is primary and PU-droop secondary local voltage control method
*) If voltage at PV or WT connection point is between min. and max. limits, **) Pf-control of PVs/BESSs participates in frequency control according to their Pf-droops.
Table 4. PV 2 active (PPV_2) and reactive (QPV_2) power as well as PV 2 connection point voltage (UPV_2) during over- and under-frequency events in different cases (Figure 1 and Figure 2, Table 2 and Table 3).
CaseLoad LevelPPV_2, QPV_2, UPV_2 Steady-State, t = 25 s (kW, kVAr, pu)PPV_2, QPV_2, UPV_2 50.07 Hz, t = 35 s (kW, kVAr, pu)PPV_2, QPV_2, UPV_2
50.25 Hz, t = 55 s (kW, kVAr, pu)
PPV_2, QPV_2, UPV_2 49.8 Hz, t = 95 s *) (kW, kVAr, pu)
1aLow243, −150, 1.056236, −150, 1.0540, 0, 1.006213, −150, 1.057
1bLow316, −150, 1.053310, −150, 1.0510, 0, 0.976286, −150, 1.054
2aLow243, −150, 1.056190, −150, 1.0380, 0, 1.006213, −150, 1.057
2bLow316, −150, 1.053264, −150, 1.0350, 0, 0.976286, −150, 1.054
3aLow241, −150, 1.056242, −150, 1.0560, 0, 1.006210, −150, 1.057
3bLow316, −150, 1.053317, −150, 1.0530, 10, 0.979286, −150, 1.054
4aLow316, −150, 1.053264, −150, 1.0350, 0, 0.974281, −150, 1.055
4bLow334, −150, 1.052282, −149, 1.0350, 0, 0.974298, −150, 1.054
5aLow450, −150, 1.046390, −150, 1.0390, 140, 0.950363, −150, 1.051
5bLow450, −150, 1.046390, −139, 1.0330, 150, 0.935245, −150, 1.056
*) Part of the load also at PV_2 connection point participates in demand response and disconnects from the LV network.
Table 5. BESS 1 active (PBESS_1) and reactive (QBESS_1) power during over- and under-frequency events in different cases (Figure 1 and Figure 2, Table 2 and Table 3).
CaseLoad LevelPBESS_1, QBESS_1 Steady-State, t = 25 s (kW, kVAr)PBESS_1, QBESS_1
50.07 Hz, t = 35 s (kW, kVAr)
PBESS_1, QBESS_1
50.25 Hz, t = 55 s (kW, kVAr)
PBESS_1, QBESS_1
49.8 Hz, t = 95 s (kW, kVAr)
4aLow0, 0−27, 0−200, 0200, 0
4bLow−200, −67−200, 0−200, −670, −67
5aLow0, 0−27, 0−200, 0200, 0
5bLow0, 0−27, 0−200, 0200, 0
Table 6. BESS 3 active (PBESS_3) and reactive (QBESS_3) power during over- and under-frequency events in different cases (Figure 1 and Figure 2, Table 2 and Table 3).
CaseLoad LevelPBESS_3, QBESS_3 Steady-State, t = 25 s (kW, kVAr)PBESS_3, QBESS_3
50.07 Hz, t = 35 s (kW, kVAr)
PBESS_3, QBESS_3
50.25 Hz, t = 55 s (kW, kVAr)
PBESS_3, QBESS_3
49.8 Hz, t = 95 s (kW, kVAr)
5aLow−93, −67−52, −67−165, 62−25, −67
5bLow−93, −67−84, −62−200, 67108, −67
Table 7. PV 2 active (PPV_2) and reactive (QPV_2) power as well as PV 2 connection point voltage (UPV_2) during larger under-frequencies (49.4 Hz) (Figure 1 and Figure 2, Table 2, Table 3, Table 4, Table 5 and Table 6).
CasePV
Droop
Load LevelPPV_2, QPV_2, UPV_2 Steady-State, t = 25 s (kW, kVAr, pu)PPV_2, QPV_2, UPV_2
49.4 Hz, t = 75 s (kW, kVAr, pu)
PPV_2, QPV_2, UPV_2 49.4 Hz, t = 95 s *) (kW, kVAr, pu)
2b1Low316, −150, 1.053319, −150, 1.053285, −150, 1.054
7a2Low316, −150, 1.053450, −150, 1.095426, −150, 1.100
7a3Low316, −150, 1.053450, −150, 1.095416, −150, 1.098
5a1Low450, −150, 1.046395, −150, 1.050362, −150, 1.051
7b2Low450, −150, 1.046400, −150, 1.103376, −150, 1.106
7b3Low450, −150, 1.046448, −150, 1.097406, −150, 1.098
*) Part of the load also at PV_2 connection point participates in demand response and disconnects from the LV network.
Table 8. BESS 3 active (PBESS_3) and reactive (QBESS_3) during larger under-frequencies (49.4 Hz) (Figure 1 and Figure 2, Table 2, Table 3, Table 4, Table 5 and Table 6).
CaseBESS
Droop
Load LevelPBESS_3, QBESS_3 Steady-state, t = 25 s
(kW, kVAr)
PBESS_3, QBESS_3
49.4 Hz, t = 75 s (kW, kVAr)
PBESS_3, QBESS_3
49.4 Hz, t = 95 s (kW, kVAr)
5a1Low−93, −67−25, −67−25, −67
7b2Low−93, −67144, −67135, −67
7b3Low−93, −6776, −6776, −67
Table 9. Provided frequency support by PV 2 and BESS 3 in different cases during simulated under-frequency (49.4 Hz) events (see also Table 7 and Table 8).
CaseΔPPV_2
49.4 Hz,
t = 75 s (kW)
ΔPPV_2 49.4 Hz,
t = 95 s *) (kW)
ΔPBESS_3
49.4 Hz,
t = 75 s (kW)
ΔPBESS_3
49.4 Hz,
t = 95 s *) (kW)
ΔPTOTAL_75s **) 49.4 Hz,
t = 75 s (kW)
ΔPTOTAL_95s ***)
49.4 Hz,
t = 95 s *) (kW)
2b+3−31+3−31
7a+134+110+134+110
7a+134+100+134+100
5a−55−88+68+68+13−20
7b−50−74+237+228+187+154
7b−2−44+169+169+167+125
*) Part of the load also at PV_2 connection point participates in demand response and disconnects from the LV network, **) ΔPTOTAL_75s = ΔPPV_ 2 + ΔPBESS_3 at t = 75 s, ***) ΔPTOTAL_95s = = ΔPPV_2 + ΔPBESS_3 at t = 95 s.
Table 10. Summary about effect of functionalities implementation logic during simulated very low load situations.
DER Unit(s)Without PU-BlockingWith PU-BlockingFrequency Adaptive PU-Droops (Without PU-Blocking)
PV (only)Over-frequency support can be limitedBetter over-frequency supportNo difference depending on the PU-droop settings and over-voltage limits in the logic (during under-frequencies)
PV + BESS
(at the same connection point)
During under-frequency events small PV curtailment + smaller BESS contributionDuring under-frequencies PV curtailment larger + BESS contribution largerSmaller PV curtailment + smaller BESS contribution with lower over-voltage limit on the PU-droop and implementation logic
(during under-frequencies)

