Longitudinal Study on Construction Organization’s BIM Acceptance

Department of Architecture Engineering, Kwangwoon University, Seoul 01897, Korea
*
Author to whom correspondence should be addressed.
Appl. Sci. 2020, 10(15), 5358; https://0-doi-org.brum.beds.ac.uk/10.3390/app10155358
Submission received: 12 July 2020
/
Revised: 31 July 2020
/
Accepted: 31 July 2020
/
Published: 3 August 2020
(This article belongs to the Special Issue BIM and Its Integration with Emerging Technologies)
Abstract
:The Korean domestic market is focused on the introduction of BIM (Building Information Modeling) owing to an influx of investment due to increased interest and mandatory application of BIM. However, the rate of BIM introduction is high, while BIM user proficiency is low. Against these problems, the authors proposed an acceptance model for BIM in construction organizations in 2012. As the number of BIM application cases increases and the number of BIM-trained users increases as time goes on, BIM users’ positive perception of BIM values are expected to increase, which may change the BIM acceptance mechanism. Therefore, we conducted a longitudinal study of the 2012 BIM acceptance model against 2019 data to estimate changes in factors affecting BIM acceptance attitudes as well as the mechanism of the relationships between factors over time spent using the technology. To generalize the results, the respondents were spread across construction sites. The data obtained 119 samples from a sample of experienced users of BIM. We used AMOS 21.0 for hypothesis testing of structural equation modeling (SEM), and the 2019 BIM acceptance model was compared against the 2012 acceptance model using an independent sample t-test. As a result, it was confirmed that the 2012 BIM acceptance model is still suitable for describing the BIM acceptance mechanism of the construction organization, and there was a difference between the 2012 model and the 2019 model. This seems to have changed the mechanism of BIM acceptance by being change perception of BIM users as time goes on. The results of this study can be used to establish a BIM activation strategy for each BIM acceptance stage and are expected to be applicable to establishing a BIM activation strategy for construction organizations or countries with similar BIM acceptance stage.

1. Introduction
BIM includes property information on building objects (walls, slabs, windows, doors, roofs, stairs, etc.) and not just 3D models, making it possible to build better buildings faster and at lower costs [1]. In the construction industry, interest in BIM is increasing, and it is becoming increasingly necessary. Accordingly, many application technologies that support BIM-based planning in maintenance and management are being developed globally, and governments are proposing guidance development and policies for BIM implementation. In Korea, the Public Procurement Service has published the basic BIM Application Guidelines for Facility Projects, which provides standards for BIM-related work and the use of BIM data in construction and maintenance. In 2012, the application of BIM was imposed on public construction projects worth over 500 trillion, and the same was planned for all public construction projects by 2016. In addition, MOLIT (the Ministry of Land, Infrastructure and Transport of Korea) is trying to activate BIM utilization by establishing the “2030 BIM utilization activation roadmap”.
Market Research Future (MRFR) [2] predicts that the BIM market will grow at an annual average growth rate of 14.9% from 2018 to 2023, while Zion Market Research (ZMR) [3] predicts to grow to $10.36 billion in 2022. As such, the BIM market is expected to continue to grow.
Meanwhile, according to a report that surveyed BIM utilization in 2012 [4], the implementation of BIM in Korea is currently at 58%, which means that approximately only six out of 10 workers in the Korean construction industry are using BIM. Among those who have not yet applied BIM, a total of 39% of workers are aware of BIM, and only 3% have not heard of BIM. The level of BIM application in Korea was higher than those in North America in 2009 (49%) and Western Europe in 2010 (36%) but lower than in North America in 2012 (73%). Despite the high level of BIM application in Korea, the competency of BIM users in the country, excluding engineers, is lower than those in Western Europe and North America. Furthermore, the number of current non-BIM users (10%) who had previously used BIM but stopped was higher in Korea than in Western Europe (4%) and North America (2%). In 2015, a survey on the level of BIM utilization by BIM construction organizations in Korea revealed that BIM interests and BIM necessity were sufficiently sympathetic, but hesitant to use BIM for actual work [5]. According to the research results of the BIM utilization level in 2019 [6], Korean construction companies perceived the effect of BIM technology on average, and were positive about whether it would be activated within 10 years, but the introduction plan in 10 years was still hesitant, and utilization was low.
Despite the passage of time, the level of BIM utilization remained largely unchanged. As this is attributable to the introduction of BIM at a stage when factors that hindered its use were left unresolved. Although the implementation rate increased in the short term, there were limits to the achievement of expected effects. As a result, it was often judged that the use of BIM could not be continued because of low credibility. Thus, BIM adoption and use remains a central concern of BIM research and practices in Korea.
Existing studies on BIM acceptance include studies comparing the relationship between BIM acceptance and factors affecting BIM acceptance by countries, organizational culture, organizational size, and organization sector (design, contractor, CMr, owner etc.) as well as studies for deriving factors affecting BIM acceptance. However, studies on changes in users’ attitudes over time are lacking because many studies have investigated users’ attitudes only at specific time points and using a cross-sectional approach.
Therefore, this study tests the 2012 BIM acceptance model against the 2019 data and investigates the changes in factors affecting BIM acceptance attitudes as well as mechanisms in the relationships among factors over time spent using the technology. Longitudinal research has two primary objectives: (1) to determine how a specific individual, group, or organizational variable changes over time and (2) to understand and predict causality between specific variables, that is, to set the direction and strength of the causal relations [7,8,9,10]. To achieve the objective, the structure of research was organized as follows. Firstly, through the literature review, we presented the necessity of grasping the change in attitude toward BIM acceptance by time change (Section 2). Secondly, data is collected using a questionnaire which can measure BIM acceptance and the degree of readiness for the factors affecting BIM acceptance, presented in the previous study [11]. The data used to test the research model were obtained from a sample of experienced BIM users (contractors, architects, and engineers) in Korean construction organizations (Section 3). Thirdly, the 2019 BIM acceptance model was validated through empirical tests. Using AMOS 21.0, SEM was employed for hypothesis testing, and the research model was validated by classifying a measurement model and a structural model according to the study by Anderson and Gerbing [12] (Section 4). Fourthly, 2012 and 2019 BIM acceptance models were compared using an independent sample t-test. SPSS 21.0 was used as an analysis tool for the independent sample t-test. Penultimately, the SEM results of the 2019 and 2012 BIM acceptance models were compared (Section 5). Finally, the theoretical and managerial implications and directions for future research are discussed (Section 6).
In this study, by examining changes in the BIM acceptance mechanism by time variables, it is possible to support industry and government to establish policies tailored to the time of acceptance. It is applicable to the establishment of a BIM activation strategy in other country, as well as construction organizations with similar timing to Korean construction organizations.
2. Literature Review
The barriers to BIM utilization have been recognized as follows [4,13,14,15,16]. There are (1) lack of confidence in BIM utilization because the effects of BIM utilization are not clearly verified, (2) the vague burden of users on the use of new information technology, (3) lack of manpower to utilize BIM, (4) lack of education and training for BIM utilization, as well as support for training programs, (5) lack of awareness of the necessity of collaboration by construction project participants regarding modeling or model utilization, or unclear definition of roles and responsibilities among construction project participants for modeling or data input, and (6) lack of BIM model-linked process in the lifecycle stage, and established legal system. As previously described, the barriers were mostly related to psychological or organization-related factors of users, as well as environmental factors for BIM utilization, rather than technological factors. In other words, these barriers are the factors that should be considered for smooth technology utilization.
The following previous studies have been conducted on the psychological and environmental factors of users on technology utilization. Meuter at al. [17] and Lin and Hsieh [18,19] have maintained that technology development is beneficial to users while technology also increases frustration and anxiety, and thus, acceptance of technologies differs, depending on knowledge of users, control over technology, and the disposition of users to accept new technologies. Furthermore, Parasuraman [20] emphasized the importance of user disposition in the acceptance of technology by revealing that the positive attitudes and convictions of users regarding technology are related to users’ readiness for using new technologies, and developing the technology readiness index (TRI) to assess the disposition of people who intend to use technology. The utilization of BIM in the construction industry can have many advantages in terms of information management through the use of BIM, while the introduction of new technologies can induce both frustration and anxiety to users. In this regard, an organization needs to be prepared.
In particular, the technology acceptance model (TAM) [21] has served as a basis for research to address the behavioral intentions and usage of IT. Previous research favored investigating the antecedent variables that could explain the core TAM variables and extending TAM to enhance the ability to better understand the acceptance and usage of existing and new IT. The factors contributing to the acceptance of IT are likely to vary with technology, target users, and context [22,23,24,25,26].
Previous studies on TAM-based BIM acceptance are as follows. Lee et al. [11] proposed a BIM acceptance model by using SEM, and thereby verified that the acceptance on the organization level in addition to the acceptance of individuals as BIM users, should be considered for complete acceptance of BIM. Chung and Chin [5] derived factors affecting CMr’s acceptance of BIM and presented a direction for establishing a strategy to utilize BIM from a CM perspective. Hong and Hammad [27] proposed a BIM adoption model for Australia’s small and medium construction organizations (SMOs) in Australia and compared and analyzed differences in the levels of understanding regarding BIM, as well as attitudes between BIM and non-BIM users. Juan et al. [28] proposed a predictive model that can be used by decision-makers considering an introduction of BIM as a model for evaluating BIM acceptance and readiness of architects in Taiwan. Lee and Yu [29] compared South Korea’s BIM acceptance model and the BIM acceptance model in the U.S. where the BIM was introduced earlier than South Korea and actively utilized. The results have revealed that the U.S. had higher levels of acceptance, utilization, and satisfaction than those in South Korea. The results further confirmed that the difference between the BIM acceptance mechanism between South Korea and the U.S. arose from the differences in the organizational culture between U.S. companies and South Korean ones. According to Lee [16], an introduction of BIM inevitably induced organizational changes, such as improved work process. Although the organizational change is invisible in the organization, the organization will be influenced by the commonly accepted organizational culture. In this regard, Lee verified the moderating effect with respect to the effects of factors influencing BIM acceptance on BIM acceptance. However, studies on changes in users’ attitudes over time are lacking because many studies have investigated users’ attitudes only at specific time points and using a cross-sectional approach.
However, the attitude of technology acceptance may change as the experience of using technology increases. It is important to understand the determinants of this construct and how their influence changes over time with increasing experience using a technology.
Venkatesh and Davis [30] measured at three points (pre implementation, one-month post implementation, and three-month post implementation). As a result, the model was strongly supported at all three points of measurement, and the hypothesis validation result showed a difference among three points. Paul et al. [31] conducted a longitudinal study on examining technology acceptance by schoolteachers. The model was longitudinally tested using responses from more than 130 teachers attending an intensive 4-week training program on Microsoft PowerPoint. The main change in SEM between pre- and post-training is “Subjective Norm”; this had a direct effect on the intention to use before training, but there was only an indirect effect through usefulness after training. Elena et al. [32] identified a distinction between individuals’ pre-adoption and post-adoption beliefs and attitudes regarding the use of Windows. Potential adopter intention to adopt is solely determined by normative pressures. Whereas pre-adoption attitude is based on perceptions of usefulness, ease-of-use, result demonstrability, visibility, and trial-ability, post-adoption attitude is only based on usefulness and perceptions of image enhancements. Lee [33] measured changes in attitudes toward the use of Internet services used in classes for college students taking classes related to new media during one semester. It was analyzed that social interaction caused a change in attitudes toward the use of technology by members of a group.
The user’s attitude toward BIM is also expected to change over time as well. As the use cases and markets increase, it is expected that the construction organization’s understanding of the BIM benefits and the necessity of the BIM will increase, and thus support for the BIM utilization at the construction organization level will increase. That is, as the scope of acceptance in an organization changes over time, the changes of an individual’s belief in the technology and the changes of the relationships between factors affecting these beliefs also are expected [34]. As such, it is necessary to grasp the significant factors according to the time of acceptance, so it is possible to establish a support strategy for effective and efficient BIM acceptance.
3. Research Model
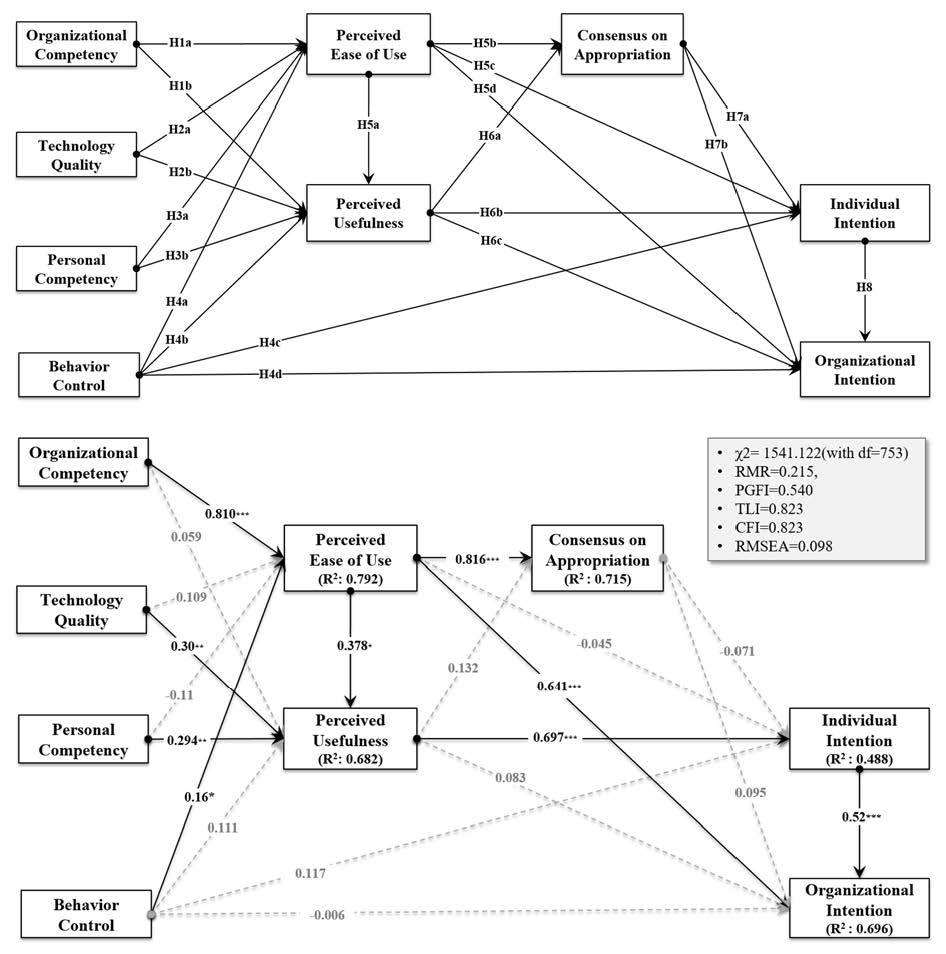
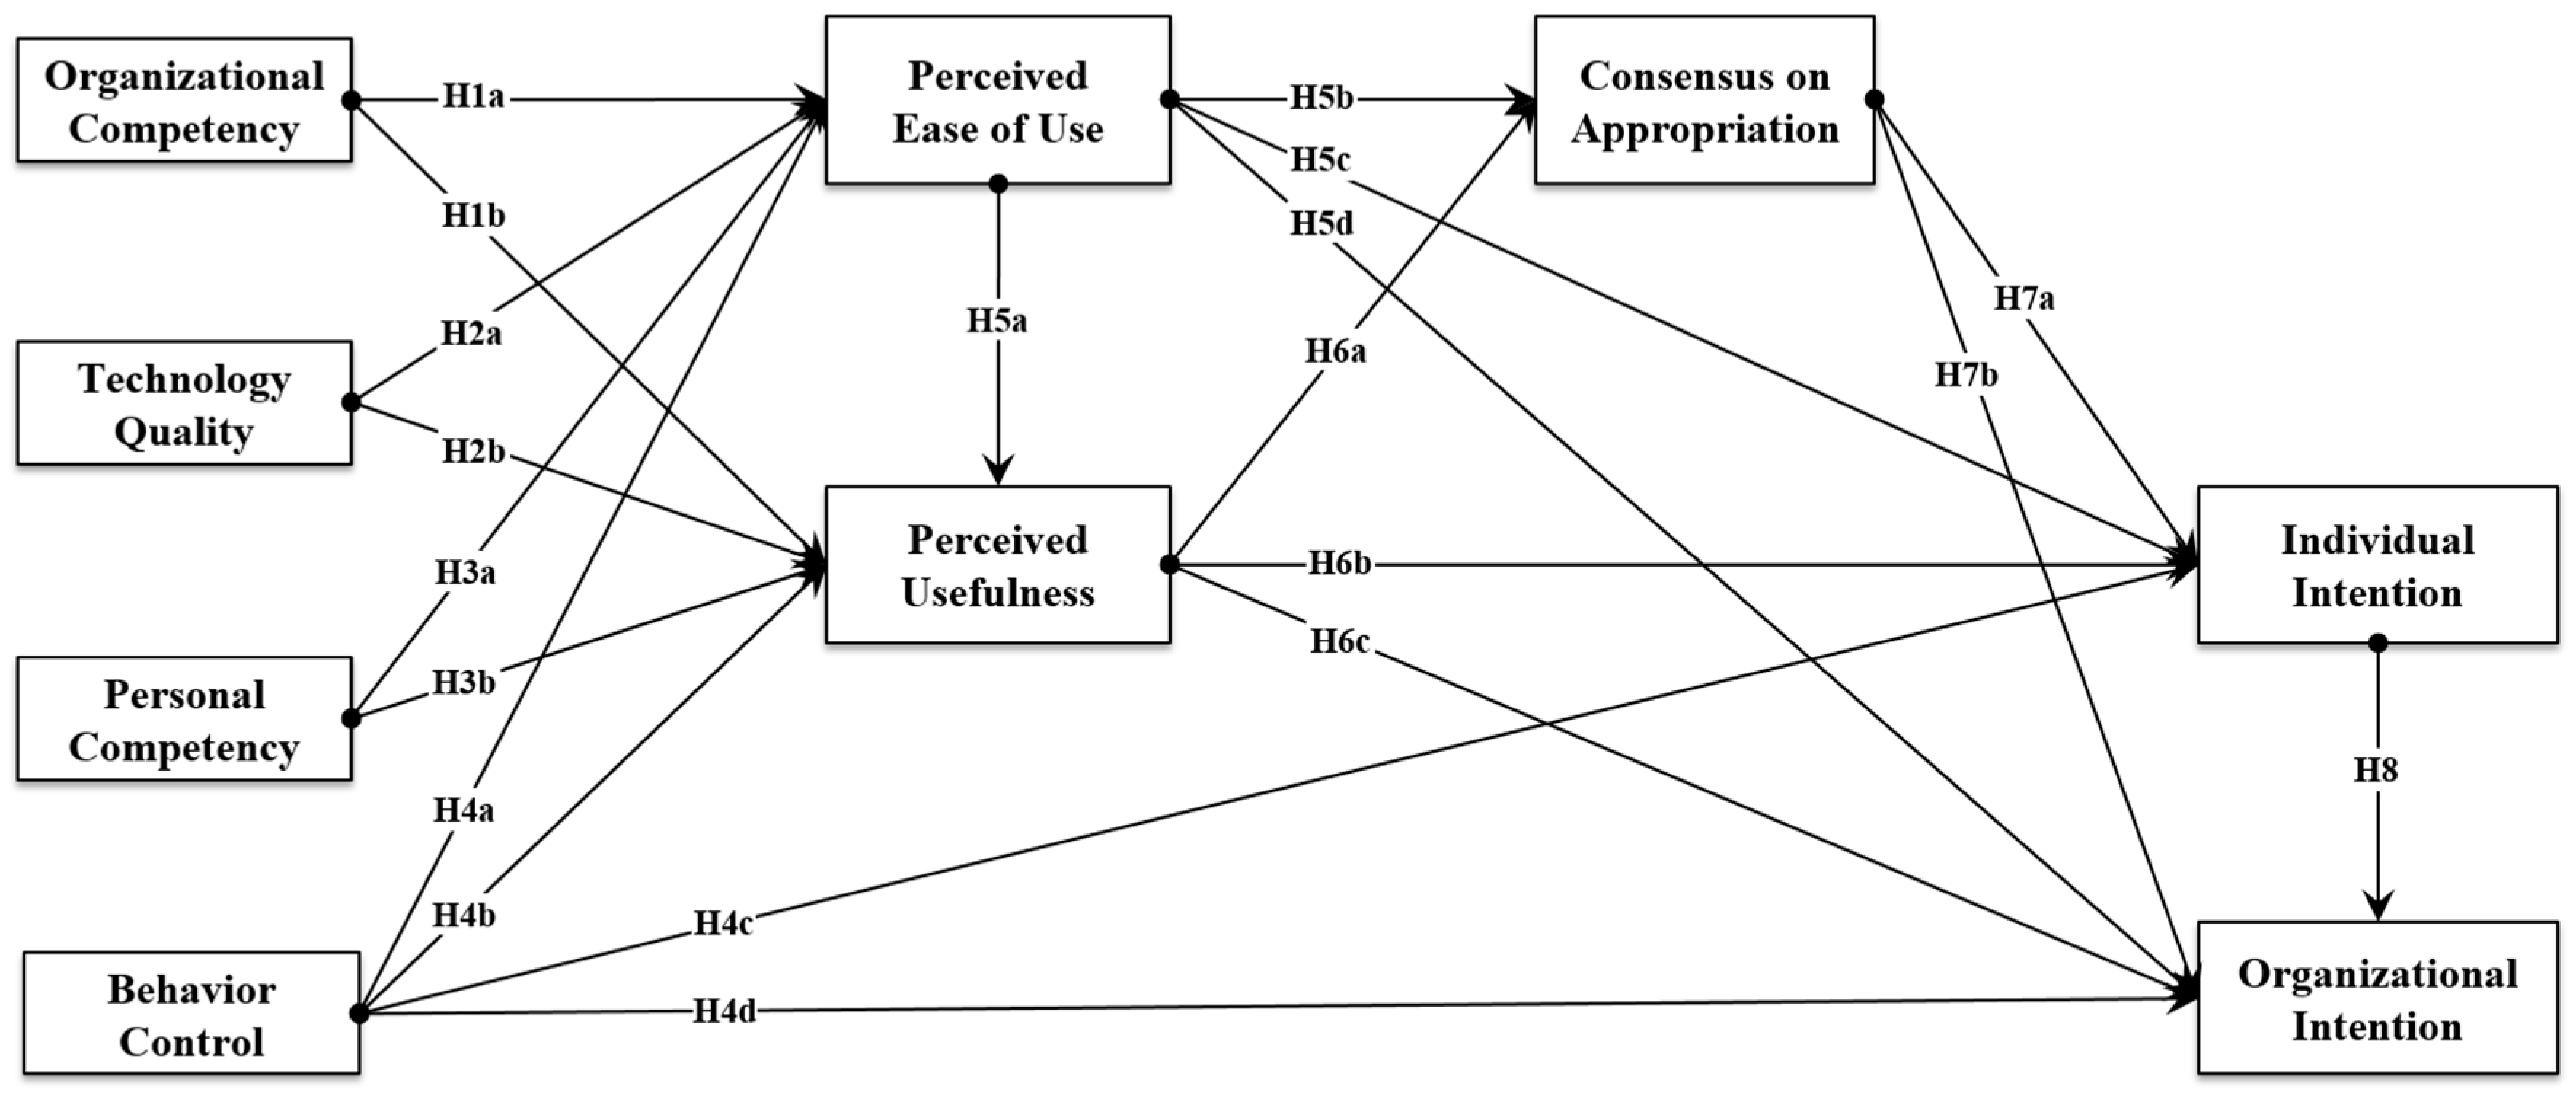
We used a BIM acceptance model that was defined in our previous study [11]. The research model is composed of nine latent constructs and 42 observed indicators which are assessment items of latent constructs. The definitions of each construct are shown in Table 1. The hypotheses were established based on the previously proposed research model (Figure 1).
- -
- External variables (OC, TQ, BC and BC) will positively affect Internal variables (PEU and PU): H1a, H1b, H2a, H2b, H3a, H3b, H4a, and H4b
- -
- BC will positively affect intent to accept BIM (IIA and OIA): H4c, and H4d
- -
- PEU will positively affect PU: H5a
- -
- Internal variables (PEU and PU) will positively affect COA: H5b, and H6a
- -
- Internal variables (PEU and PU) will positively affect intent to accept BIM (IIA and OIA): H5c, H5d, H6b, H6c
- -
- COA will positively affect intent to accept BIM (IIA and OIA): H7a, and H7b
- -
- Individual intent to accept BIM will positively affect Organizational intent to accept BIM: H8
We collected data from a sample of experienced BIM users to validate the 2019 BIM acceptance model based on empirically tested and to compare the 2019 and 2012 BIM acceptance models. The surveys were conducted between 22 March and 29 April 2019, and a total of 109 completed responses were received. The sectors to which the survey respondents belonged were design (44, 40.4%), CM (31, 28.4%), contractor (14, 13.8%), and engineer (19, 17.4%). The respondents had about 11.4 years of experience in the construction industry and 3.4 years of experience using BIM. Each response was measured on a 7-point Likert scale ranging from “strongly disagree” to “strongly agree”.
4. The Validation of 2019 BIM Acceptance Model
4.1. The Validation Results for the Measurement Model
Firstly, to assess the research model’s overall goodness of fit, the model-fit measures and their respective acceptance level shown in Table 2 were used. The acceptance levels used were as suggested by previous research [35,36,37,38]. As a result of comparing the acceptance level with the model-fit indices of the proposed model (Table 2), most of the model-fit indicators were found to meet the acceptance level. RMR, TLI, and CFI were lower than the acceptance level but were close to the acceptance level. Therefore, it could be judged that the measurement model fit well with the collected data.
Secondly, convergent validity is a concept to validate that there is a high correlation between measurements if the same concept is measured, and can be confirmed by analyzing the relationship between latent constructs and observed indicators, which are assessment items of latent constructs [11]. Convergent validity is evaluated by examining the factor loading, composite reliability (CR) of measures, and average variance extracted (AVE) by measures from the results of the confirmatory factor analysis (CFA). The recommended acceptance criteria suggested in previous studies should be factor loading of 0.5 or higher [36], CR value of 0.6 or higher [39], and AVE of 0.5 or higher [36]. The results of the CFA are shown in Table 3. As a result, the AVE values of TQ and BC did not meet the criteria.
Thirdly, discriminant validity is a concept for validating that there is a low correlation between measurements when measuring different concepts and can be confirmed by analyzing the relationships between constructs. discriminant validity is evaluated by comparing the shared variances between factors (r2) and the AVE from the individual factors. In addition, it can be interpreted that there is discriminant validity when the AVE value is greater than the r2 value [40]. As a result of the discriminant validity test of the measurement model (see Table 4), discriminant validity of OC-PEU, OC-COA, OC-OIA, PEU-COA, and PEU-OIA were not satisfied.
Examining the convergent validity and discriminant validity, several factors did not satisfy the criteria. However, the results of exploratory factor analysis (EFA) was significant and verified by professionals. In addition, as a result of conducting multi-collinearity diagnosis between the independent variables (see Table 5), it was confirmed that most of them met the acceptance level (condition index ≤ 30, tolerance < 0.1, Various Inflation Factor (VIF) ≤ 10) [41]. Therefore, the proposed measurement model could be considered to have convergent validity and discriminant validity.
4.2. The Validation Results for the Structural Model
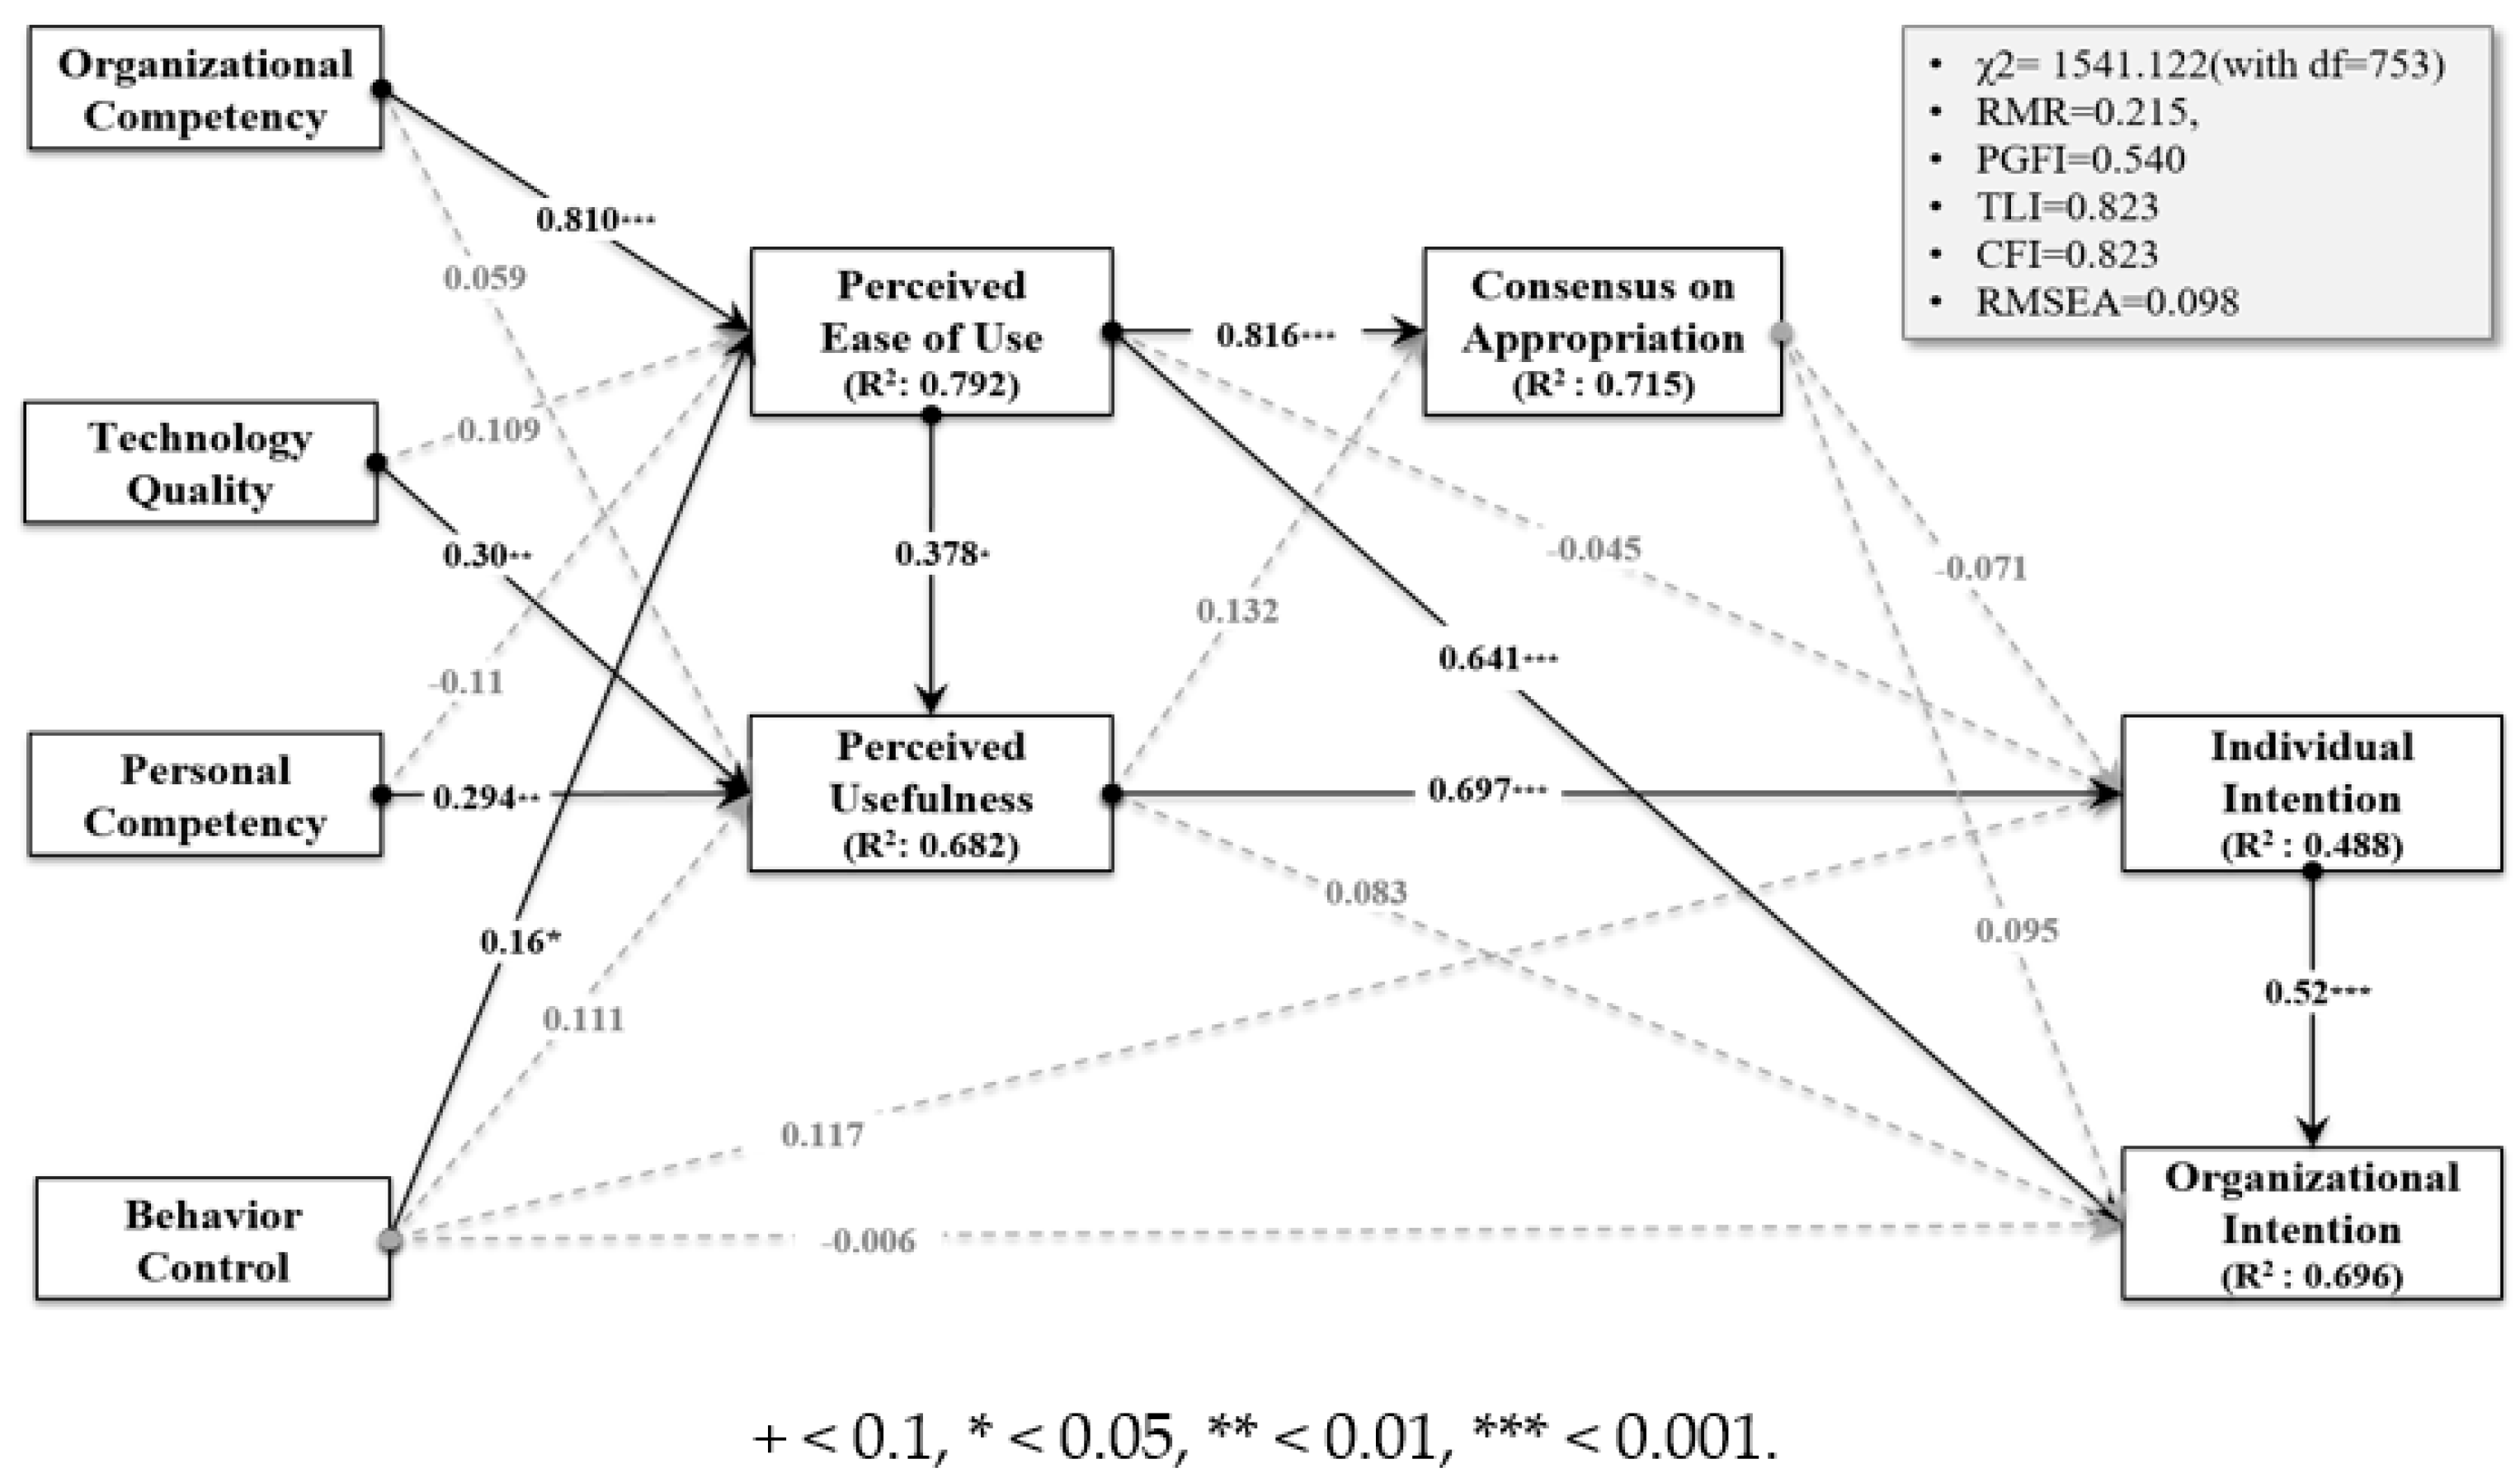
The structural model, like the measurement model, compared acceptance levels of model-fit indices. As shown in Table 2, all fit indices satisfied or approached the acceptance level. These results indicate that the proposed model is suitable. Figure 2 shows the standardized path coefficients, their significance for the structural model, and the squared correlations (R2) for endogenous constructs.
Table 1. a (γ = 0.810) and H4a (γ = 0.16) are supported. This implies that increased OC and BC is associated with increased PEU. On the other hand, the influence of TQ and PC had a notable impact on PU. thus, H2b (γ = 0.30) and H3b (γ = 0.294) is supported. That is, while organizational support facilitates technology use, users perceive technology as useful only once technological outcomes demonstrate good quality and users are psychologically ready to accept the technology. Furthermore, the hypothesis H5a (β = 0.378), H5b (β = 0.816), and H5d (β = 0.641) are supported. This implies that PEU appears to be a significant determinant of PU, COA, and OIA. PU had a significant effect on the IIA; thus, the hypothesis H6a (β = 0.697) is supported. However, PEU only showed an indirect influence on IIA through PU. Therefore, the PU in relation to BIM utilization for individual tasks or cooperation capacity must be high to increase individual intent to accept BIM. To promote the individual acceptance of BIM, individuals must perceive that their tasks and cooperative work can be done without difficulty when using BIM. On the other hand, COA did not have an impact on IIA and OIA. It can be seen that some agreement has been reached on the use of BIM as well as the use of BIM. Finally, increased IIA was associated with increased OIA; therefore, the hypothesis H8 (β = 0.52) is supported.
H1a and H4a can explain about 79.2% of the variance in PEU. H2b, H3b, and H5a together can explain about 68.2% of the variance in PU. H5b explains 71.5% of the variance in COA; H6b explains about 44.8% of the variance in IIA; and H6c and H8 together explains about 69.6% of the variance in OIA. the intention of individuals and organizations to accept BIM accounts for more than 50% of the variance. From these results, it can be seen that in the BIM acceptance model for 2019, both personal acceptance and organizational acceptance were significant.
Viewed from a broader perspective, BIM makes it possible to operate an integrated information management system by syncing and sharing information for the entire lifetime of a project, thus helping build a collaborative system in various fields and communication among companies. To utilize BIM to a high degree, not only should individuals use the BIM tools at work, but members of the organization should also share information via BIM. Thus, BIM acceptance requires internal changes, such as embracing BIM utilization at the individual and organizational levels, and external changes such as work environment or process improvements in the organization to enable BIM utilization. According to various organization-related research studies utilizing proof-based analysis, such changes are affected by organizational culture, especially in how the atmosphere is understood. The argument is that the aspects promoting or suppressing changes within an organization are based on the organization’s cultural characteristics. BIM acceptance requires organizational changes, and these changes will interact with the latent organizational culture, which will then either promote or suppress BIM acceptance.
The total effects between the constructs are shown in Table 6.
5. Comparisons of BIM Acceptance between 2012 and 2019
Using an independent sample t-test, the differences in key factors affecting the acceptance of BIM and intent to accept BIM between 2012 and 2019 were validated. The hypotheses were as follows:
- -
- Key factors affecting the acceptance of BIM in 2019 are greater than those in 2012.
- -
- Intent to accept BIM in 2019 was higher than that in 2012.
In testing the difference between key factors affecting the 2012 and 2019 intent to accept BIM, and since the t-value resulted in a significant p-value that was less than the set alpha of 0.05 (p < 0.05, which puts the obtained t in the tail), the null hypothesis was rejected in support of the alternate hypothesis (Table 7).
A meaningful difference was observed in all hypotheses; the environment for using BIM, the perceptions of users, and the level of support were higher in 2019 than 2012. Moreover, BIM users showed higher individual and organizational intentions to use BIM in 2019 than in 2012. Using t-tests, we also verified that the differences were significant. Consequently, the mechanism for achieving BIM acceptance will differ over time.
The comparison results of the mechanisms implemented in 2012 versus 2019 are shown in Table 8. The results of 2012 in Table 8 are the results of hypothesis validation for only Korean construction organizations based on the 2012 BIM acceptance model in the previous study [29]. On the other hand, the 2019 result is the hypothesis validation result of this study (Figure 2).
We confirmed that the key factors affecting the acceptance of BIM were significantly influential factors in both 2012 and 2019. This means that the key factors affecting the acceptance of BIM may be generalized. Furthermore, it was confirmed that the mechanism for achieving BIM acceptance in 2012 differed from the mechanism in 2019. The significant differences between 2012 and 2019 were as follows.
First, OC and BC have the most significant and largest impact on PEU. This indicates that when performing individual tasks or cooperative work, PEU of BIM is higher when the organization is more flexible and active in accepting new technology. BC had no direct effect on the intent to accept BIM; however, it did have an indirect influence through PEU. As such, mandatory use policies in an organization have a positive effect on the intent to accept BIM only when users perceive BIM as a useful tool to facilitate work performance once the use of BIM has reached a certain level. This is in contrast with the initial stages of BIM use when mandatory use policies affect the intent to use BIM because users are yet unaware of the ease of use or usefulness of BIM.
Secondly, top-level management support, a sub-factor indicating organizational competency regarding the extent of the provision of hardware, software, and training, was a significant evaluation factor in the 2012 model; however, it was not a significant factor in 2019. This may be a result of construction companies’ improved awareness of BIM effects and usages as well as the establishment of a physical environment for the use of BIM. In this organizational context of consensus about technology acceptance and the establishment of necessary resources, the continued use of the technology hinges on the ease of use. For example, in the 2012 model, PEU was a significant factor affecting BIM acceptance for both collaborative and individual work; however, in 2019, PEU was no longer a significant factor affecting individual work. This may be a result of users having come to recognize BIM as a tool that supports collaboration more than individual work. Meanwhile, usability had an indirect effect on BIM acceptance through utility in 2020, while usability of BIM became an important factor in enhancing BIM acceptance through a direct effect in 2019. Even the BC has an indirect effect on BIM acceptance through usability. For this reason, any system for vitalizing BIM utilization should also be designed to support the usability of the members in the construction organization to enhance the intention of BIM acceptance on the organizational level, rather than the mandatory system of BIM utilization in construction organizations. It is easier for users to adopt BIM when organizational policies, such as mandatory use or incentivization, are in place. This reinforces the importance of an organizational, rather than individual, push toward BIM adoption. However, Lee and Yu [29] showed that usability has a greater effect than utility in the U.S. BIM acceptance model. If the environment where BIM can be smoothly used is established on the national and organizational levels, enhance productivity of individuals or in collaboration, rather than usability, would be more prioritized.
Thirdly, in the 2012 model, the results of the relationship hypothesis test on PU, PEU, and OIA showed have an indirect relationship through COA. On the other hand, in the 2019 model, PEU had a direct effect on both OIA, and as it did in the 2012 model, PU had an indirect effect on OIA through IIA but not on COA. Also, neither IIA nor OIA was affected by COA. In other words, COA no longer had a significant influence on the intent to accept BIM. This may be a result of a consensus having been reached by construction companies regarding the application of BIM and the tasks for application since 2012.
As the number of BIM application cases in business increased over time, so did the awareness of managers in construction organizations and the construction industry regarding BIM-applicable tasks and application methods. Furthermore, as positive awareness increased, the consensus on BIM utilization methods in construction organizations has become insignificant in decision making. Lee and Yu [29] can also confirm this finding from the result that the COA had no effect on BIM acceptance based on the verification of the BIM acceptance model in the U.S. where the BIM was introduced earlier than South Korea, and actively utilized.
According to the technology acceptance cycle model (Innovator-Early Adaptor- Early Majority- Late Majority-Laggards) [42], classifies technology acceptance stage and defines each characteristic of stage, despite the dependency on the size of the construction organization, South Korean construction organizations are considered to exhibit the characteristics of Late Majority or Early Majority, and the proportion of Early Majority rather than Late Majority seems increasing in the construction organizations compared to 2012. The characteristics of BIM consumption types defined by the acceptance stages of new technologies and BIM vitalization strategies based on analysis of this research are summarized as follows.
“Early Majority” is characterized by emphasizing economic aspects when introducing technology. Therefore, in order to increase the willingness to introduce technology, it is necessary to continuously recognize that the value obtained through the use of BIM is higher than the cost of introducing BIM through verification of technology. In addition, it is necessary to create an environment that can minimize the cost risks of companies through technology verification through pilot projects, support of specialty supply, and improvement of various laws and institution that act as regulations.
“Late Majority” has the characteristic of accepting a new technology only when the new technology becomes popular and the use of the existing technology is no longer difficult to be replaced with a new technology. Therefore, it is necessary to raise awareness of technology through various educations and to shift the awareness that technology will positively improve corporate productivity.
6. Conclusions
The degree of users’ beliefs about regarding BIM technology may change throughout their training period; as users gain practical experience using the technology, irrespective of whether they accept the technology, BIM requires specialized training over an extended period of time. User acceptance of BIM technology may also change over time as the scope of acceptance in the organization changes because organizational and individual intents to accept BIM have significant implications. Therefore, based on the 2012 BIM acceptance model, we validated the mechanisms affecting of the relationships between among factors affecting the intent to accept BIM in 2019, and investigated the changes between the 2012 and 2019 models. The findings of the study and their interpretations are summarized as follows.
Firstly, the intention of individuals and organizations to accept BIM accounts for more than 50% of the variance. This means that the BIM acceptance assessment factors in the proposed model are suitable for clarifying the level of BIM acceptance. Although the relationships among constructs have changed, there are strong connections among the nine constructs supporting the hypothesized relationships. External variables, such as openness to BIM’s introduction of organization and individual, suitability of BIM tools, quality of information collected using BIM tools, and policies to motivate BIM’s introduction, positively affect usefulness and easiness of BIM usage. They also have a positive impact on individual intention of BIM acceptance and consensus within an organization regarding the tasks and methods of applying BIM. However, consensus on appropriation no longer affects intention of BIM acceptance. To achieve both individual and organizational intention of BIM acceptance, efforts to improve usefulness and easiness of BIM using are required.
Secondly, we confirmed that the 2012 BIM acceptance model was still valid in 2019 and determined the difference in factors affecting BIM acceptance by time differences. The significant differences between 2012 and 2019 were as follows.
- -
- The relationship between “behavior control” and “the intent to accept BIM acceptance”.
- -
- The relationship between “perceived ease of use” and “the intent to accept BIM”.
- -
- The relationship between “consensus on appropriation” and “the intent to accept BIM”.
Thirdly, the academic significance of this study is to investigate changes in time, and the practical significance is to be able to support the establishment of a customized BIM acceptance strategy by identifying factors affecting meaningful BIM acceptance by acceptance period. The BIM Acceptance Model can be used to evaluate the readiness of individuals and organizations to accept BIM and can be used to develop effective and efficient BIM acceptance strategy for individuals or organizations according to period of using BIM. In addition, the analysis results have shown that the mechanism for BIM acceptance has changed as the awareness and recognition of BIM changes according to the acceptance stages. Thus, the results would be applicable in establishing a BIM vitalization strategy in other countries with similar BIM acceptance times in Korea.
Fourthly, the previous studies related to BIM acceptance conducted BIM acceptance model proposals by participants, organization size, and organizational culture type and comparison of BIM acceptance mechanisms between countries, and in this study, the BIM acceptance mechanism by time variables was compared and analyzed. Therefore, future research will be required to categorize characteristics types of the BIM-accepting organization by comprehensive and multifaceted analysis on variables, such as country, organizational culture, time, organizational size, and organizational sector etc., which affect the relationship between BIM acceptance affecting factors and BIM acceptance and derive the BIM activation strategy for each type. As the customized BIM activation strategy can be established, it is possible to improve not only BIM utilization, but also productivity improvement through BIM utilization. Other future research topic should be as follows: improvement of the R2 values and the continual development of the research model by adding various factors; investigating the hidden meanings of non-significant hypotheses and identifying sub-factors comprising the hypotheses and relationships between the sub-factors; and converting non-adopters into adopters and perceptions related to BIM between adopters and non-adopters.
Author Contributions
Conceptualization, S.L. and J.Y.; methodology, S.L.; software, S.L.; validation, S.L. and J.Y.; formal analysis, S.L.; investigation, S.L.; resources, J.Y.; data curation, J.Y.; writing—original draft preparation, S.L.; writing—review and editing, J.Y.; visualization, S.L.; supervision, J.Y.; project administration, J.Y.; funding acquisition, J.Y.; All authors have read and agreed to the published version of the manuscript.
Funding
This research is funded by a grant (20AUDP-B127891-04) from the Architecture & Urban Development Research Program funded by Ministry of Land, Infrastructure and Transport of Korean government. And, the research is funded by the Research Grant of Kwangwoon University in 2019.
Conflicts of Interest
The authors declare no conflict of interest.
References
- Kim, Y.U. Intelligent digital architecture tools and BIM paradigm. J. Archit. Inst. Korea 2004, 48, 56–59. [Google Scholar]
- Market Research Future. Global Building Information Modelling Market Research Report—By Product (BIM Software, Training services, Project Management), Project Lifecycle (Pre-Construction, Construction, and Operation), End-User (Architects), and by Industry—Forecast till 2023. Available online: https://www.marketresearchfuture.com/reports/building-information-modelling-market-2044 (accessed on 30 July 2020).
- Zion Market Research, Building Information Modeling (BIM) Market by Solution (Software & Services), by End-Users (Architects, Contractors, Engineers and Others) for Industrial, Commercial, Infrastructure, Residential and Institutional: Global Industry Perspective, Comprehensive Analysis and Forecast, 2016–2022. Available online: https://www.zionmarketresearch.com/report/building-information-modeling-market (accessed on 30 July 2020).
- The Business Value of BIM for Infrastructure; SmartMarket Report; McGrawHill Construction: New York, NY, USA, 2012.
- Chung, Y.C.; Chin, S.Y. Factor Affecting the BIM Acceptance of Construction Managers. Korean J. Constr. Eng. Manag. 2015, 16, 11–23. [Google Scholar] [CrossRef] [Green Version]
- Lee, K.P.; Choi, S.Y.; Son, T.H.; Choi, S.I. The Current Status and Activation Direction of Smart Technology for Construction Companies in Korea; Construction & Economy Research Institute of Korea: Seoul, Korea, 2019. [Google Scholar]
- Bergh, D.D. Watch the time carefully: The use and misuse of time effects in management research. J. Manag. 1993, 19, 683–705. [Google Scholar] [CrossRef]
- Chan, D. Data analysis and modeling longitudinal processes. Group Organ. Manag. 2003, 28, 341–365. [Google Scholar] [CrossRef]
- Kimberly, J.R. Issues in the design of longitudinal organizational research. Social. Methods Res. 1976, 4, 321–347. [Google Scholar] [CrossRef]
- Menard, S. Longitudinal Research (Quantitative Application in the Social Sciences); SAGE Publications Inc.: Los Angeles, CA, USA, 1991; ISBN 978-0761922094. [Google Scholar]
- Lee, S.K.; Yu, J.H.; Jeong, D. BIM acceptance model in construction organizations. J. Manag. Eng. 2015, 31, 13. [Google Scholar] [CrossRef]
- Anderson, J.C.; Gerbing, D.W. Structural equation modeling in practice: A review and recommended two-step approach. Psychol. Bull. 1988, 103, 411–423. [Google Scholar] [CrossRef]
- Choi, H.S. An Analysis about Factors affecting Inactiveness of BIM (Building Information Modeling) Introduction in the Construction Industry. Master’s Thesis, HanYang University, Seoul, Korea, 2010. [Google Scholar]
- Park, J.W.; Kim, S.C.; Lee, S.S.; Song, H.Y. Suggesting Solutions when Applying Building Information Modeling (BIM) to the Korean Construction Industry through Case Studies. J. Korea Inst. Build. Constr. 2009, 9, 93–102. [Google Scholar] [CrossRef]
- Building Information Modeling (BIM): Transforming Design and Construction to Achieve Greater Industry Productivity; SmartMarket Report; McGrawHill Construction: New York, NY, USA, 2008.
- Lee, S.K. BIM Acceptance Readiness Evaluation Model considering Organizational Culture. Ph.D. Thesis, KwangWoon University, Seoul, Korea, 2014. [Google Scholar]
- Meuter, M.L.; Ostrom, A.L.; Bitner, M.J.; Roundtree, R. The Influence of Technology Anxiety on Consumer Use and Experiences with Self Service Technologies. J. Bus. Res. 2005, 56, 899–906. [Google Scholar] [CrossRef]
- Lin, J.C.; Hsieh, P. The role of technology readiness in customer’s perception and adoption of self-service technologies. Int. J. Serv. Ind. Manag. 2006, 17, 497–517. [Google Scholar] [CrossRef]
- Lin, J.C.; Hsieh, P. The influence of technology readiness on satisfaction and behavioral intentions toward self-service technologies. Comput. Hum. Behav. 2007, 23, 1597–1615. [Google Scholar] [CrossRef]
- Parasuraman, A. Technology Readiness Index (TRI): A Multiple-Item Scale to Measure Readiness to Embrace New Technologies. J. Serv. Res. 2000, 2, 307–320. [Google Scholar] [CrossRef]
- Davis, F.D.; Bagozzi, R.; Warshaw, P.R. User acceptance of computer technology: A comparison of two theoretical models. Manag. Sci. 1989, 35, 982–1003. [Google Scholar] [CrossRef] [Green Version]
- Rice, R.E.; Aydin, C. Attitude toward new organizational technology: Network proximity as a mechanism for social information processing. Adm. Sci. Q. 1991, 36, 219–244. [Google Scholar] [CrossRef]
- Chau, P.Y.K.; Hu, P.J.H. Investigating healthcare professionals’ decisions to accept telemedicine technology: An empirical test of competing theories. Inf. Manag. 2008, 39, 297–311. [Google Scholar] [CrossRef]
- Hong, W.U.; Thong, J.Y.L.; Wong, W.M.; Tam, K.Y. Determinants of user acceptance of digital libraries-An empirical examination of individual differences and systems characteristics. J. Manag. Inf. Syst. 2001, 18, 97–124. [Google Scholar] [CrossRef]
- Taylor, S.; Todd, P.A. Understanding information technology usage: A test of competing models. Inf. Syst. Res. 1995, 6, 144–176. [Google Scholar] [CrossRef]
- Moon, J.W.; Kim, Y.G. Extending the TAM for a World Wide Web context. Inf. Manag. 2001, 38, 217–230. [Google Scholar] [CrossRef]
- Hong, Y.; Hammad, A.W.A. BIM adoption model for small and medium construction organizations in Australia. Eng. Constr. Archit. Manag. 2019, 26, 154–183. [Google Scholar] [CrossRef]
- Juan, Y.K.; Lai, W.Y.; Shih, S.G. Building Information Modeling Acceptance and Readiness Assessment in Taiwanese Architectural Firms. J. Civ. Eng. Manag. 2017, 23, 356–367. [Google Scholar] [CrossRef] [Green Version]
- Lee, S.K.; Yu, J.H. Comparative Study of BIM Acceptance between Korea and the United States. J. Constr. Eng. Manag. 2015, 142, 9. [Google Scholar] [CrossRef]
- Venkatesh, V.; Davis, F.D. A Theoretical Extension of the Technology Acceptance Model: Four Longitudinal Field Studies. Manag. Sci. 2000, 46, 186–204. [Google Scholar] [CrossRef] [Green Version]
- Paul, J.H.H.; Theodore, H.K.; Will, W.M. Examining technology acceptance by school teachers: A longitudinal study. Inf. Manag. 2003, 41, 227–241. [Google Scholar] [CrossRef]
- Elena, K.; Detmar, W.S.; Norman, L.C. Information Technology Adoption across Time: A Cross-Sectional Comparison of Pre-Adoption and Post-Adoption Beliefs. MIS Q. 1999, 23, 183–213. [Google Scholar] [CrossRef]
- Lee, J.S. A Longitudinal Study Examining Factors Meeting Changes of Attitudes towards Technology Use: Focusing on Individuals’ Subjective Judgements and Social Influence of Technology Use. Korean J. Commun. Stud. 2006, 50, 388–414. [Google Scholar]
- Lee, W.K. A longitudinal analysis of intrinsic motivation’s effects on the acceptance of programming language. Inf. Syst. Rev. 2010, 2, 159–175. [Google Scholar] [CrossRef]
- Baumgartner, H.; Homburg, C. Application of structural equation modeling in marketing and consumer research: A review. Int. J. Res. Mark. 1996, 13, 139–161. [Google Scholar] [CrossRef] [Green Version]
- Hair, J.F.; Ronald, L.; Tatham, R.E.A.; William, B. Multivariate Data Analysis, 7th ed.; Prentice-Hall International: Upper Saddle River, NJ, USA, 2010; ISBN 978-0138132637. [Google Scholar]
- Jiang, J.J.; Klein, G.; Chen, H.G.; Lin, L. Reducing user-related risks during and prior to system development. Int. J. Proj. Manag. 2002, 20, 507–515. [Google Scholar] [CrossRef]
- Wang, Y.S.; Liao, Y.W. Assessing e-Government systems success: A validation of the DeLone and McLean model of information systems success. Gov. Inf. Q. 2008, 25, 717–733. [Google Scholar] [CrossRef]
- Fornell, C.; Larcker, D.F. Evaluating Structural Equation Models with Unobservable Variables and Measurement Error. J. Mark. Res. 1981, 18, 39–50. [Google Scholar] [CrossRef]
- Barclay, D.; Thompson, R.; Higgins, C. The partial least squares (PLS) approach to causal modeling: Personal computer adoption and use and illustration. Technol. Stud. 1995, 2, 285–309. [Google Scholar]
- Nunnally, J.C.; Bernstein, I.H. Psychometric Theory; McGraw-Hill: New York, NY, USA, 1994; ISBN 978-1462524778. [Google Scholar]
- Rogers, E. Diffusion of Innovations, 5th ed.; The Free Press, A division of Simon & Schuster, Inc.: New York, NY, USA, 2003; ISBN 978-0-7432-2209-9. [Google Scholar]
Figure 1.
Research model.

Figure 2.
Results of hypothesis testing.


Table 1.
The definition of constructs in the BIM acceptance model.
| Constructs | Description |
|---|---|
| Organizational Competency (OC) | The openness to the introduction of new information technology such as the organization’s BIM, and the degree of providing resources (Hardware, Software), education, and incentives for the use of BIM. |
| Technology Quality (TQ) | The suitability of BIM tools for personal work or collaboration and the quality of information collected using BIM tools. |
| Personal Competency (PC) | The openness to the introduction of new IT by individuals and the willingness to apply BIM to work. |
| Behavior Control (BC) | Organizational and national policies to motivate organizational members to use BIM. |
| Perceived Ease of Use (PEU) | The recognition that collaboration between organization members using BIM is not difficult. |
| Perceived Usefulness (PU) | The recognition that BIM utilization is useful to improve the individual work capabilities of employees and collaboration productivity. |
| Consensus on Appropriation (COA) | The consensus among members of the organization regarding the tasks and methods of applying BIM determined by the organization. |
| Individual intention of BIM acceptance (IIA) | The willingness to use BIM for work and the willingness to recommend it to others. |
| Organizational intention of BIM acceptance (OIA) | Not only encouraging the use of BIM in the organization, but also the willingness to recommend it to other organizations in a collaborative relationship, and furthermore, the willingness to participate in the development of BIM application technologies. |
Table 2.
Fit indices for BIM Acceptance model 2019.
| Model Fit Indices | Recommended Value | Measurement Model | Structural Model |
|---|---|---|---|
| x2/df (the ratio of X2 to degree of freedom) | ≤3.0 | 2.001 | 2.047 |
| RMR (root mean square residual) | ≤0.1 | 0.202 | 0.215 |
| PGFI (Parsimonious Goodness of Fit Index) | ≥0.5 | 0.540 | 0.540 |
| TLI (Tucker-Lewis Index) | ≥0.9 | 0.816 | 0.823 |
| CFI (Comparative Fit Index) | ≥0.9 | 0.833 | 0.823 |
| RMSEA (Root Mean Square Error of Approximation) | ≤0.1 | 0.096 | 0.098 |
Table 3.
Results of the confirmatory factor analysis (CFA).
| Latent Constructs | Observed Indicators | Factor Loading | t-Value | CR | AVE |
|---|---|---|---|---|---|
| OC | OC1 | 0.864 | - | 0.863 | 0.512 |
| OC2 | 0.852 | 11.83 | |||
| OC3 | 0.800 | 10.56 | |||
| OC4 | 0.847 | 11.68 | |||
| OC5 | 0.832 | 11.31 | |||
| OC6 | 0.851 | 11.79 | |||
| TQ | TQ1 | 0.752 | - | 0.858 | 0.480* |
| TQ2 | 0.703 | 7.31 | |||
| TQ3 | 0.716 | 7.46 | |||
| TQ4 | 0.823 | 8.69 | |||
| TQ5 | 0.753 | 7.89 | |||
| TQ6 | 0.844 | 8.94 | |||
| TQ7 | 0.602 | 6.18 | |||
| PC | PC1 | 0.844 | - | 0.933 | 0.701 |
| PC2 | 0.762 | 9.54 | |||
| PC3 | 0.878 | 12.05 | |||
| PC4 | 0.905 | 12.76 | |||
| PC5 | 0.888 | 12.32 | |||
| PC6 | 0.936 | 13.60 | |||
| BC | BC1 | 0.893 | - | 0.699* | 0.310* |
| BC2 | 0.690 | 8.52 | |||
| BC3 | 0.940 | 14.10 | |||
| BC4 | 0.573 | 6.57 | |||
| BC5 | 0.572 | 6.56 | |||
| PEU | PEU1 | 0.874 | - | 0.820 | 0.604 |
| PEU2 | 0.921 | 14.10 | |||
| PEU3 | 0.842 | 11.75 | |||
| COA | COA1 | 0.940 | - | 0.900 | 0.818 |
| COA2 | 0.963 | 18.71 | |||
| PU | PU1 | 0.853 | - | 0.834 | 0.503 |
| PU2 | 0.776 | 9.63 | |||
| PU3 | 0.857 | 11.28 | |||
| PU5 | 0.756 | 9.26 | |||
| PU6 | 0.752 | 9.18 | |||
| IIA | IIA1 | 0.917 | - | 0.892 | 0.734 |
| IIA2 | 0.917 | 14.89 | |||
| IIA3 | 0.832 | 12.19 | |||
| OIA | OIA1 | 0.874 | - | 0.882 | 0.651 |
| OIA2 | 0.922 | 14.41 | |||
| OIA3 | 0.940 | 15.07 | |||
| OIA4 | 0.904 | 13.80 |
-: t value for these parameters were not available because they were fixed for scaling purpose. *: Not satisfied with the criteria.
Table 4.
Results of discriminant validity test.
| Constructs | r2 | AVE | ||
|---|---|---|---|---|
| OC | TQ | 0.100 | 0.152 | 0.480 |
| PC | 0.269 | 0.701 | ||
| BC | 0.245 | 0.310 | ||
| PEU | 0.719 | 0.604 | ||
| COA | 0.654 | 0.503 | ||
| PU | 0.420 | 0.818 | ||
| IIA | 0.375 | 0.734 | ||
| OIA | 0.584 | 0.651 | ||
| TQ | PC | 0.070 | 0.480 | 0.701 |
| BC | 0.033 | 0.310 | ||
| PEU | 0.110 | 0.604 | ||
| COA | 0.077 | 0.503 | ||
| PU | 0.226 | 0.818 | ||
| IIA | 0.061 | 0.734 | ||
| OIA | 0.094 | 0.651 | ||
| PC | BC | 0.040 | 0.933 | 0.310 |
| PEU | 0.134 | 0.604 | ||
| COA | 0.203 | 0.503 | ||
| PU | 0.237 | 0.818 | ||
| IIA | 0.466 | 0.734 | ||
| OIA | 0.221 | 0.651 | ||
| BC | PEU | 0.312 | 0.699 | 0.604 |
| COA | 0.220 | 0.503 | ||
| PU | 0.229 | 0.818 | ||
| IIA | 0.181 | 0.734 | ||
| OIA | 0.227 | 0.651 | ||
| PEU | COA | 0.679 | 0.820 | 0.818 |
| PU | 0.500 | 0.503 | ||
| IIA | 0.229 | 0.734 | ||
| OIA | 0.567 | 0.651 | ||
| PU | PU | 0.408 | 0.900 | 0.818 |
| IIA | 0.441 | 0.734 | ||
| OIA | 0.367 | 0.651 | ||
| COA | IIA | 0.188 | 0.834 | 0.734 |
| OIA | 0.454 | 0.651 | ||
| IIA | OIA | 0.425 | 0.892 | 0.651 |
Table 5.
Results of multi-collinearity diagnosis.
| Variables | Condition Index | Tolerance | VIF |
|---|---|---|---|
| OC | 9.779 | 0.267 | 3.738 |
| TQ | 15.249 | 0.769 | 1.300 |
| PC | 16.605 | 0.519 | 1.925 |
| BC | 19.839 | 0.509 | 1.966 |
| PEU | 21.776 | 0.273 | 3.669 |
| PU | 24.616 | 0.403 | 2.482 |
| COA | 27.475 | 0.315 | 3.171 |
| IIA | 32.249 | 0.404 | 2.476 |
Table 6.
The total effects between constructs.
| PEU | PU | COA | IIA | OIA | |
|---|---|---|---|---|---|
| OC | 0.82 (DE: 0.82, InDE: 0) | 0.37 (DE: 0.00, InDE: 0.37) | 0.67 (DE: 0, InDE: 0.67) | 0.22 (DE: 0, InDE: 0.22) | 0.58 (DE: 0, InDE: 0.58) |
| TQ | 0.07 (DE: 0.07, InDE: 0) | 0.26 (DE: 0.23, InDE: 0.03) | 0.08 (DE: 0, InDE: 0.08) | 0.16 (DE: 0, InDE: 0.16) | 0.08 (DE: 0, InDE: 0.08) |
| PC | −0.08 (DE: −0.08, InDE: 0) | 0.23 (DE: 0.27, InDE: −0.04) | −0.04 (DE: 0, InDE: −0.04) | 0.15 (DE: 0, InDE: 0.15) | −0.02 (DE: 0, InDE: −0.02) |
| BC | 0.16 (DE: 0.16, InDE: 0) | 0.20 (DE: 0.13, InDE: 0.07) | 0.14 (DE: 0, InDE: 0.14) | 0.26 (DE: 0.13, InDE: 0.13) | 0.18 (DE: −0.01, InDE: 0.19) |
| PEU | - | 0.46 (DE: 0.46, InDE: 0.00) | 0.82 (DE: 0.77, InDE: 0.05) | 0.27 (DE: 0.04, InDE: 0.23) | 0.71 (DE: 0.58, InDE: 0.13) |
| PU | - | - | 0.10 (DE: 0.10, InDE: 0) | 0.64 (DE: 0.65, InDE: −0.01) | 0.14 (DE: −0.13, InDE: 0.28) |
| COA | - | - | - | −0.09 (DE: −0.09, InDE: 0) | 0.06 (DE: 0.09, InDE: −0.03) |
| IIA | - | - | - | - | 0.42 (DE: 0.42, InDE: 0) |
| OIA | - | - | - | - | - |
Table 7.
T-test results of BIM Acceptance between 2012 and 2019.
| Constructs | Levene’s Test for Equality of Variances | t-test for Equality of Means | ||||
|---|---|---|---|---|---|---|
| t | Mean Difference (Std. Error Difference) | 95% Confidence Interval of the Difference | ||||
| F | p | Lower | Upper | |||
| OC | 0.173 | 0.678 | 2.960** | 0.510 (0.172) | 0.171 | 0.850 |
| TQ | 1.308 | 0.254 | 2.109** | 0.285 (0.135) | 0.019 | 0.552 |
| PC | 1.528 | 0.218 | 6.266*** | 0.895 (0.143) | 0.613 | 1.176 |
| BC | 0.440 | 0.508 | 3.768*** | 0.604 (0.160) | 0.288 | 0.920 |
| PEU | 10.121 | 0.002 | 3.796*** | 0.644 (0.170) | 0.310 | 0.979 |
| PU | 2.009 | 0.158 | 5.243*** | 0.726 (0.138) | 0.453 | 0.999 |
| COA | 14.005 | 0.000 | 4.611*** | 0.784 (0.170) | 0.449 | 1.120 |
| IIA | 0.152 | 0.697 | 5.464*** | 0.864 (0.158) | 0.552 | 1.175 |
| OIA | 0.303 | 0.583 | 4.686*** | 0.886 (0.189) | 0.514 | 1.259 |
***p < 0.001, **p < 0.05.
Table 8.
Comparison between BIM acceptance Model (2012) and BIM acceptance Model (2019).
| Hypotheses | 2012 [29] | 2019 | |||
|---|---|---|---|---|---|
| Independent Variable | Dependent Variable | Path Coefficients | R2 | Path Coefficients | R2 |
| OC | PEU | 0.414* | 36.3% | 0.810*** | 79.2% |
| TQ | 0.145 | 0.109 | |||
| PC | 0.096 | −0.110 | |||
| BC | 0.115 | 0.160* | |||
| OC | PU | 0.095 | 59.4% | 0.059 | 68.2% |
| TQ | 0.294** | 0.300** | |||
| PC | 0.324** | 0.294** | |||
| BC | −0.034 | 0.111 | |||
| PEU | 0.342* | 0.378* | |||
| PEU | COA | 0.472*** | 60.2% | 0.816*** | 71.5% |
| PU | 0.396** | 0.132 | |||
| BC | IIA | 0.059 | 61.6% | 0.117 | 48.8% |
| PEU | 0.112 | -0.045 | |||
| PU | 0.793*** | 0.697*** | |||
| COA | −0.152 | −0.071 | |||
| BC | OIA | 0.325*** | 68.6% | -0.006 | 69.6% |
| PEU | -0.050 | 0.641*** | |||
| PU | -0.213 | 0.083 | |||
| COA | 0.480*** | 0.095 | |||
| IIA | 0.518*** | 0.520*** | |||
* < 0.05, ** < 0.01, *** < 0.001.
© 2020 by the authors. Licensee MDPI, Basel, Switzerland. This article is an open access article distributed under the terms and conditions of the Creative Commons Attribution (CC BY) license (http://creativecommons.org/licenses/by/4.0/).
Share and Cite
MDPI and ACS Style
Lee, S.; Yu, J. Longitudinal Study on Construction Organization’s BIM Acceptance. Appl. Sci. 2020, 10, 5358. https://0-doi-org.brum.beds.ac.uk/10.3390/app10155358
AMA Style
Lee S, Yu J. Longitudinal Study on Construction Organization’s BIM Acceptance. Applied Sciences. 2020; 10(15):5358. https://0-doi-org.brum.beds.ac.uk/10.3390/app10155358
Chicago/Turabian StyleLee, Seulki, and Jungho Yu. 2020. "Longitudinal Study on Construction Organization’s BIM Acceptance" Applied Sciences 10, no. 15: 5358. https://0-doi-org.brum.beds.ac.uk/10.3390/app10155358
Note that from the first issue of 2016, this journal uses article numbers instead of page numbers. See further details here.