Urban Mobility Data Analysis for Public Transportation Systems: A Case Study in Montevideo, Uruguay


1
Facultad de Ingeniería, Universidad de la República, Montevideo 11300, Uruguay
2
Escuela Superior de Ingeniería, Universidad de Cádiz, Puerto Real, 11519 Cádiz, Spain
*
Authors to whom correspondence should be addressed.
†
These authors contributed equally to this work.
Appl. Sci. 2020, 10(16), 5400; https://0-doi-org.brum.beds.ac.uk/10.3390/app10165400
Submission received: 25 June 2020
/
Revised: 19 July 2020
/
Accepted: 29 July 2020
/
Published: 5 August 2020
(This article belongs to the Special Issue CITIES: Energetic Efficiency, Sustainability; Infrastructures, Energy and the Environment; Mobility and IoT; Governance and Citizenship)
Abstract
:Transportation systems play a major role in modern urban contexts, where citizens are expected to travel in order to engage in social and economic activities. Modern transportation systems incorporate technologies that generate huge volumes of data, which can be processed to extract valuable mobility information. This article describes a proposal for studying public transportation systems following an urban data analysis approach. A thorough analysis of the transportation system in Montevideo, Uruguay, and its usage is outlined, combining several sources of urban data. Furthermore, origin-destination matrices, which describe mobility patterns in the city, are generated using ticket sales data. The computed results are validated with a recent mobility survey. Finally, a visualization web application is presented, which allows conveying mobility information in an intuitive way.
1. Introduction
Mobility of citizens is a critical issue emerging from the urbanization process. The geographical organization of urban scenarios demands citizens to travel for engaging in social and economic activities. Public transportation systems are the cornerstone of urban mobility, as they represent the most efficient, sustainable, and socially fair mode of transportation [1]. Understanding the synergy between citizens and public transportation is a key factor to improve mobility in a city.
Modern smart cities use technology in order to improve urban services [2]. Related to smart cities are Intelligent Transportation Systems (ITS), using technology to improve mobility. ITS collect large volumes of urban data [3] that allow understanding the mobility of citizens. For this purpose, urban data analysis arises as a valuable tool to derive information from raw urban data sources.
Understanding the dynamics of mobility is crucial to improve transportation systems. Mobility is described through origin-destination (OD) matrices that indicate the number of passengers traveling between relevant locations. Traditionally, OD matrices are generated based on surveys or manual passenger counts. However, these methods are very expensive to be carried out regularly, so they offer a partial and outdated view of mobility patterns in a city [4]. ITS incorporate technology to locate vehicles and pay for tickets in public transportation. As a by-product these technologies generate valuable data that can be processed to estimate OD matrices.
This manuscript extends our previous conference article “Urban data analysis for the public transportation system of Montevideo, Uruguay” [5], presented at the II Ibero-American Congress on Smart Cities. The new scientific contributions in this article include a characterization of the public transportation system in Montevideo and its users derived from ITS data, extending the previous work by focusing on characterizing the mobility patterns of citizens. In addition, a destination estimation algorithm is proposed and applied to ticket sales data to generate OD matrices that describe mobility in the city. The computed results are compared against the findings of a recent mobility household survey. Finally, a visualization tool is also presented which allows presenting the computed OD matrices to stakeholders in an intuitive fashion.
The article is structured as follows. Section 2 presents the methodology for urban data analysis and reviews related works. Section 3 describes the studied scenario and results from the data analysis to describe the use of the system. The estimation of OD matrices is presented in Section 4, along with a comparison against the mobility survey and a description of the visualization tool. Finally, Section 5 presents the conclusions and the main lines of future work.
2. Methodology and Related Works
This section outlines the urban data analysis methodology applied to characterize mobility using ITS data as well as the main related works on the topic. The methodology used to analyze ITS data is presented in Section 2.1 and a review of related works is outlined in Section 2.2.
2.1. Methodology
This subsection presents the methodology applied for the analysis of ITS data.
2.1.1. Urban Data Analysis
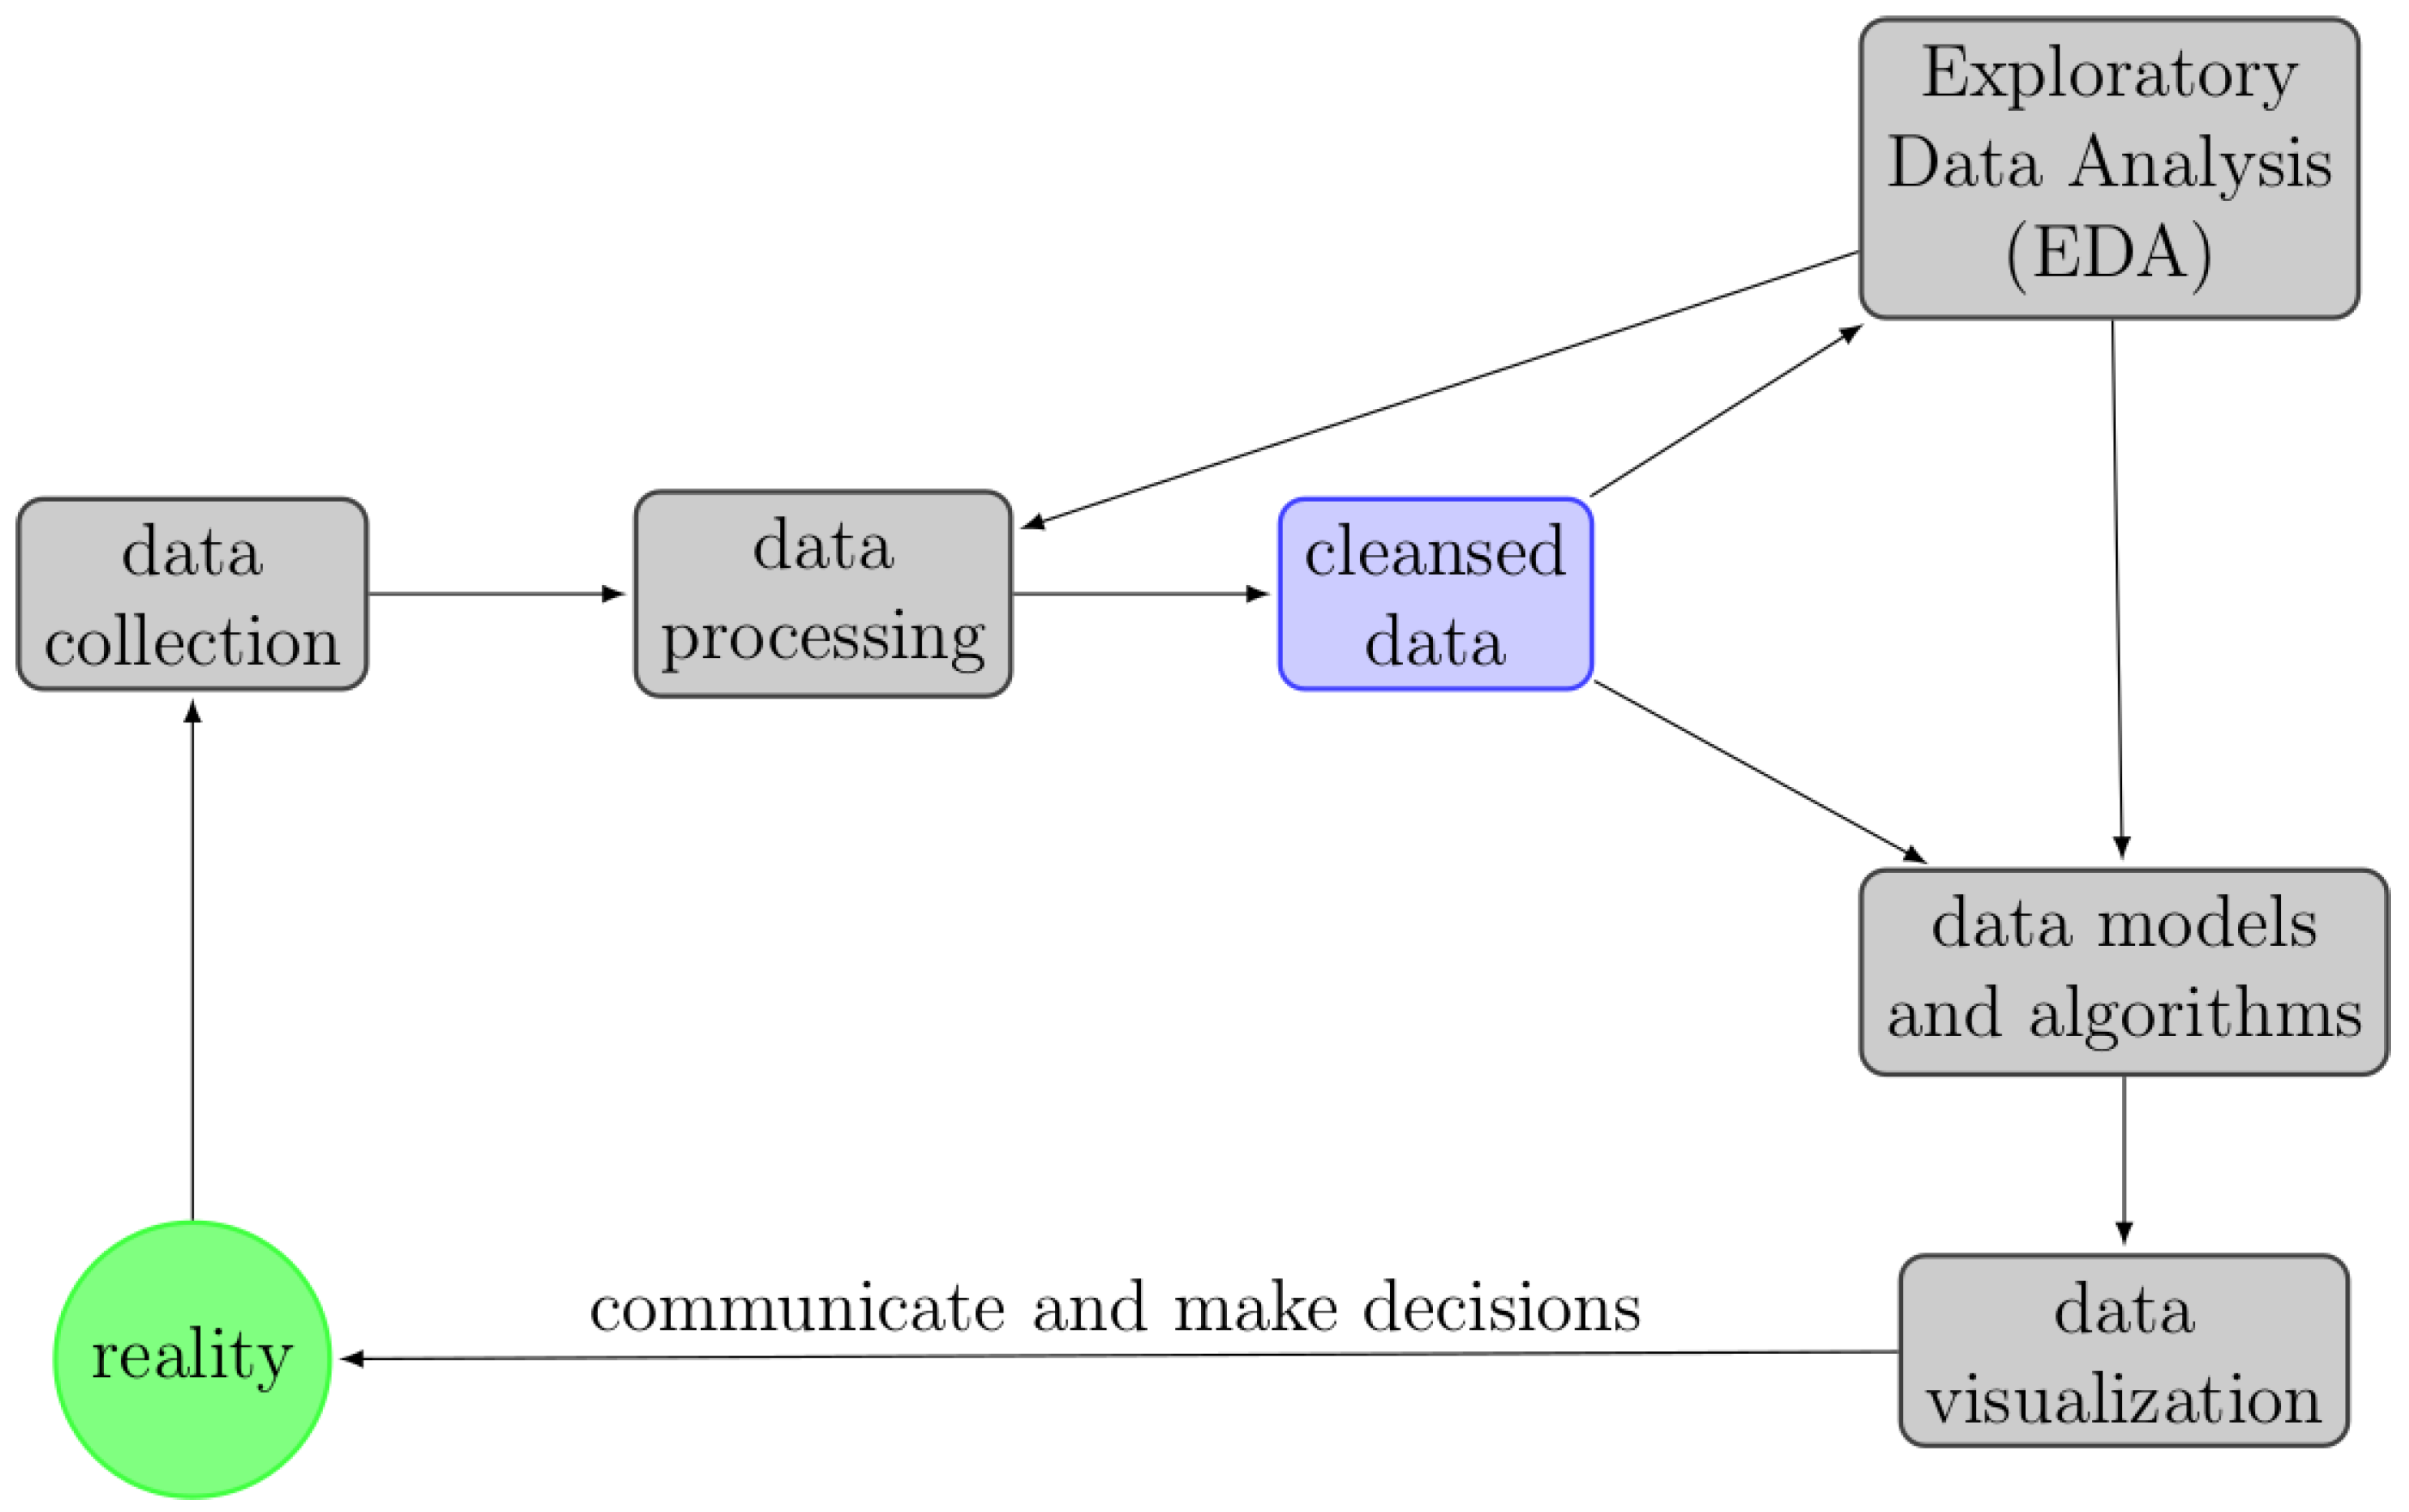
Data analysis is the process of collecting and processing raw data to extract meaningful information to provide supporting evidence to help decision-making. Alternative workflow proposals exist to describe the data analysis process. This work applies a workflow proposed by Schutt and O’Neil [6] (Figure 1).
The data analysis process starts and ends in the current reality. In urban contexts, this implies collecting raw data from a given city and, in the end, communicating findings to authorities and citizens. To this end, the data analysis process is comprised of several phases. Initially, raw data must be processed, including placing data into tables, inspecting datasets, and cleansing data to detect corrupt or inaccurate records. After that, Exploratory Data Analysis (EDA) [7] is performed. EDA aims at describing what data can tell, beyond a formal modeling and hypothesis testing phase. Urban data tends to come from a variety of diverse and dynamic sources (e.g., sensors, mobile phones, social media), thus EDA becomes mandatory for urban data analysis to detect inaccuracies. After EDA, statistical models and algorithms (e.g., inferential statistics, machine learning) are applied to identify relationships among the data. Finally, results are communicated, usually through visualization techniques.
EDA makes an intensive use of data visualization with the goal of efficiently displaying measured quantities through graphics. Traditionally, data visualization techniques were mainly dominated by charts and diagrams comprised of numerical data. However, areas such as urban data analysis, which demand combining quantitative and qualitative data, require more advanced means of visualizing results for effective communication. Since urban data usually has a prevalence of geographic components, urban data visualization combines classic statistical graphics with Geographic Information Systems (GIS).
2.1.2. Origin-Destination (OD) Matrices
Mobility is usually described using OD matrices, which indicate the number of trips between relevant locations in a city [8]. Each trip can have multiple legs, if a passenger makes intermediate stops and transfers between vehicles to get to their final destination. Thus, when building OD matrices, the destination of a trip is considered as the final destination of the sequence of legs, where a passenger is assumed to go to perform an activity. Different divisions can be used to analyze mobility at a finer (e.g., specific locations, bus stops) or coarser grain (e.g., municipalities, neighborhoods). OD matrices can be built for specific periods of time to characterize mobility in different days (e.g., working days vs. weekends) or times of the day (e.g., peak vs. non-peak hours).
Traditionally, OD matrices are generated using information from mobility surveys. Unless performed regularly, surveys offer a partial and outdated view of mobility patterns. Additionally, in large cities, where mobility analysis requires detailed zonification and time disaggregation, surveys demand very large sample sizes to compute results with statistical significance. As a consequence, surveys are usually a very expensive mean to characterize urban mobility. Thus, there is a growing interest in using data analysis to estimate OD matrices from available sources of urban data.
Automatic Fare Collection (AFC) systems automate ticketing of a public transportation network. Most AFC systems are comprised of fare media, read/write devices for these media, networks for communication, and back-office systems. Contactless smart cards are the de facto fare media in AFC systems. Pelletier et al. [9] provided a thorough review on the use of smart cards in public transportation systems. Different alternatives to estimate OD matrices using AFC data are reviewed next. The trip-chaining method used in this work is described in Section 4.
2.2. Related Works
A variety of sources have been used to estimate OD matrices in transportation systems. Li et al. [10] identified three models for destination estimation: (i) the probability model, which computes the alighting probability based on the traveled distance and the number of passengers on board, but without identifying pairs (board–alight) corresponding to the same passenger; (ii) the deep learning model, which requires boarding and alighting data for training, being more suitable to railway/subway systems where passengers are required to validate their cards both to enter and exit stations; and (iii) the trip chaining model. The most relevant works based on the trip chaining method, i.e., the one applied in this article, are reviewed next.
The trip chaining model [11] infers destinations by looking at the history of trips of each cardholder. Two hypotheses are considered: the origin of a new trip is the destination of the previous one, and at the end of the day, users return to the origin of their first trip of the day. The proposed model was applied to the subway system of New York, where nearly 80% of riders use smart cards. The computed OD matrix was validated using station exit counts at different times of the day and using peak load passenger volume data and a trip assignment model. The authors estimated that 90% of destinations can be accurately inferred for a 78% share of the total number of subway users.
Trépanier et al. [12] proposed using the trip chaining model for estimating the destination of passengers boarding buses with smart cards, following a database programming approach. Trips for which chaining is not possible were compared with all other trips of the month for the same user to find similar trips with known destination. The experimental evaluation used real datasets from Gatineau, Quebec. The proposed approach allowed estimating the destination of 66% of the trips. However, the real estimation accuracy could not be assessed due to the lack of a second source of data (e.g., surveys) for comparison.
Wang et al. [13] applied the trip chaining method to infer bus passenger origin-destination from smart card transactions from London, UK. Results were compared against the passenger intercept survey performed every five to seven years for each bus route and includes the number of people boarding and alighting at each bus stop. The analysis showed that destinations could be estimated for nearly 57% of all trips. When compared to the survey, the difference on the estimated destinations were below 4% on the worst case.
Munizaga and Palma [14] estimated OD matrices in the multimodal transportation system of Santiago, Chile, where passengers can use their smart cards to pay for tickets at metros, buses, and bus stations. The proposed approach was evaluated using smart card datasets corresponding to two different weeks, with over 35 million transactions each. The destination and time of alighting was estimated for over 80% of the transactions. Later [15], the authors validated the main assumptions of the model by comparing the estimated OD matrices with data from surveys and personal interviews to passengers. The authors concluded that the proposed model was highly reliable, accurately estimating 84.2% of the inferred destinations.
Alsger et al. [16] analyzed one week of smart card data (628,479 transactions) from bus, train, and ferry networks of South East Queensland, Australia. The dataset contained both origin and destination records, since passengers are required to validate their smart cards when boarding and alighting. Therefore, the authors were able to study different variants of the trip chaining method and compare the resulting OD matrices against the real data from AFC records. Results showed that for nearly 88% of the passengers the last destination of the day was within a walkable distance of their first origin, thus validating one of the key assumptions of the trip chaining model.
The analysis of related works allows identifying several proposals for using ITS data analysis to understand and improve urban mobility. This article expands the original trip chaining method by also considering transfers between bus lines. Thus, the OD matrix estimation considers trips that may include several bus trips involving transfers as well as walks between bus stops to do those transfers.
This article proposes applying existing knowledge about urban data analysis and OD matrix generation to understand mobility using ITS data. As a case study, data from the ITS in Montevideo, Uruguay, is analyzed in Section 3 and an OD matrix estimation procedure is outlined in Section 4. There are no previous works using ITS data to understand and improve urban mobility in Montevideo. Therefore, the research contributes with a novel proposal to assess transportation systems and understand mobility patterns, and applies it to real data from the ITS in Montevideo, Uruguay.
3. Characterizing Public Transportation System
This section presents the urban data analysis process aimed at characterizing public transportation systems using ITS data. An overview of the case study is presented in Section 3.1. Then, Section 3.2 presents the urban data analysis process and its results are discussed in Section 3.3. Finally, Section 3.4 presents two practical use cases to show the advantages of using data analysis for authorities and transport planners.
3.1. Overview of the Case Study
This section presents an overview of the case study: the public transportation system of Montevideo, Uruguay.
3.1.1. Montevideo, Uruguay
Montevideo extends to an area of only 530 km and is comprised of eight municipalities and 1063 census tracts, which are defined by the National Institute of Statistics [17]. Census tracts are the administrative division used in census and surveys performed by the state and, consequently, most socioeconomic indicators available are aggregated using this zonification.
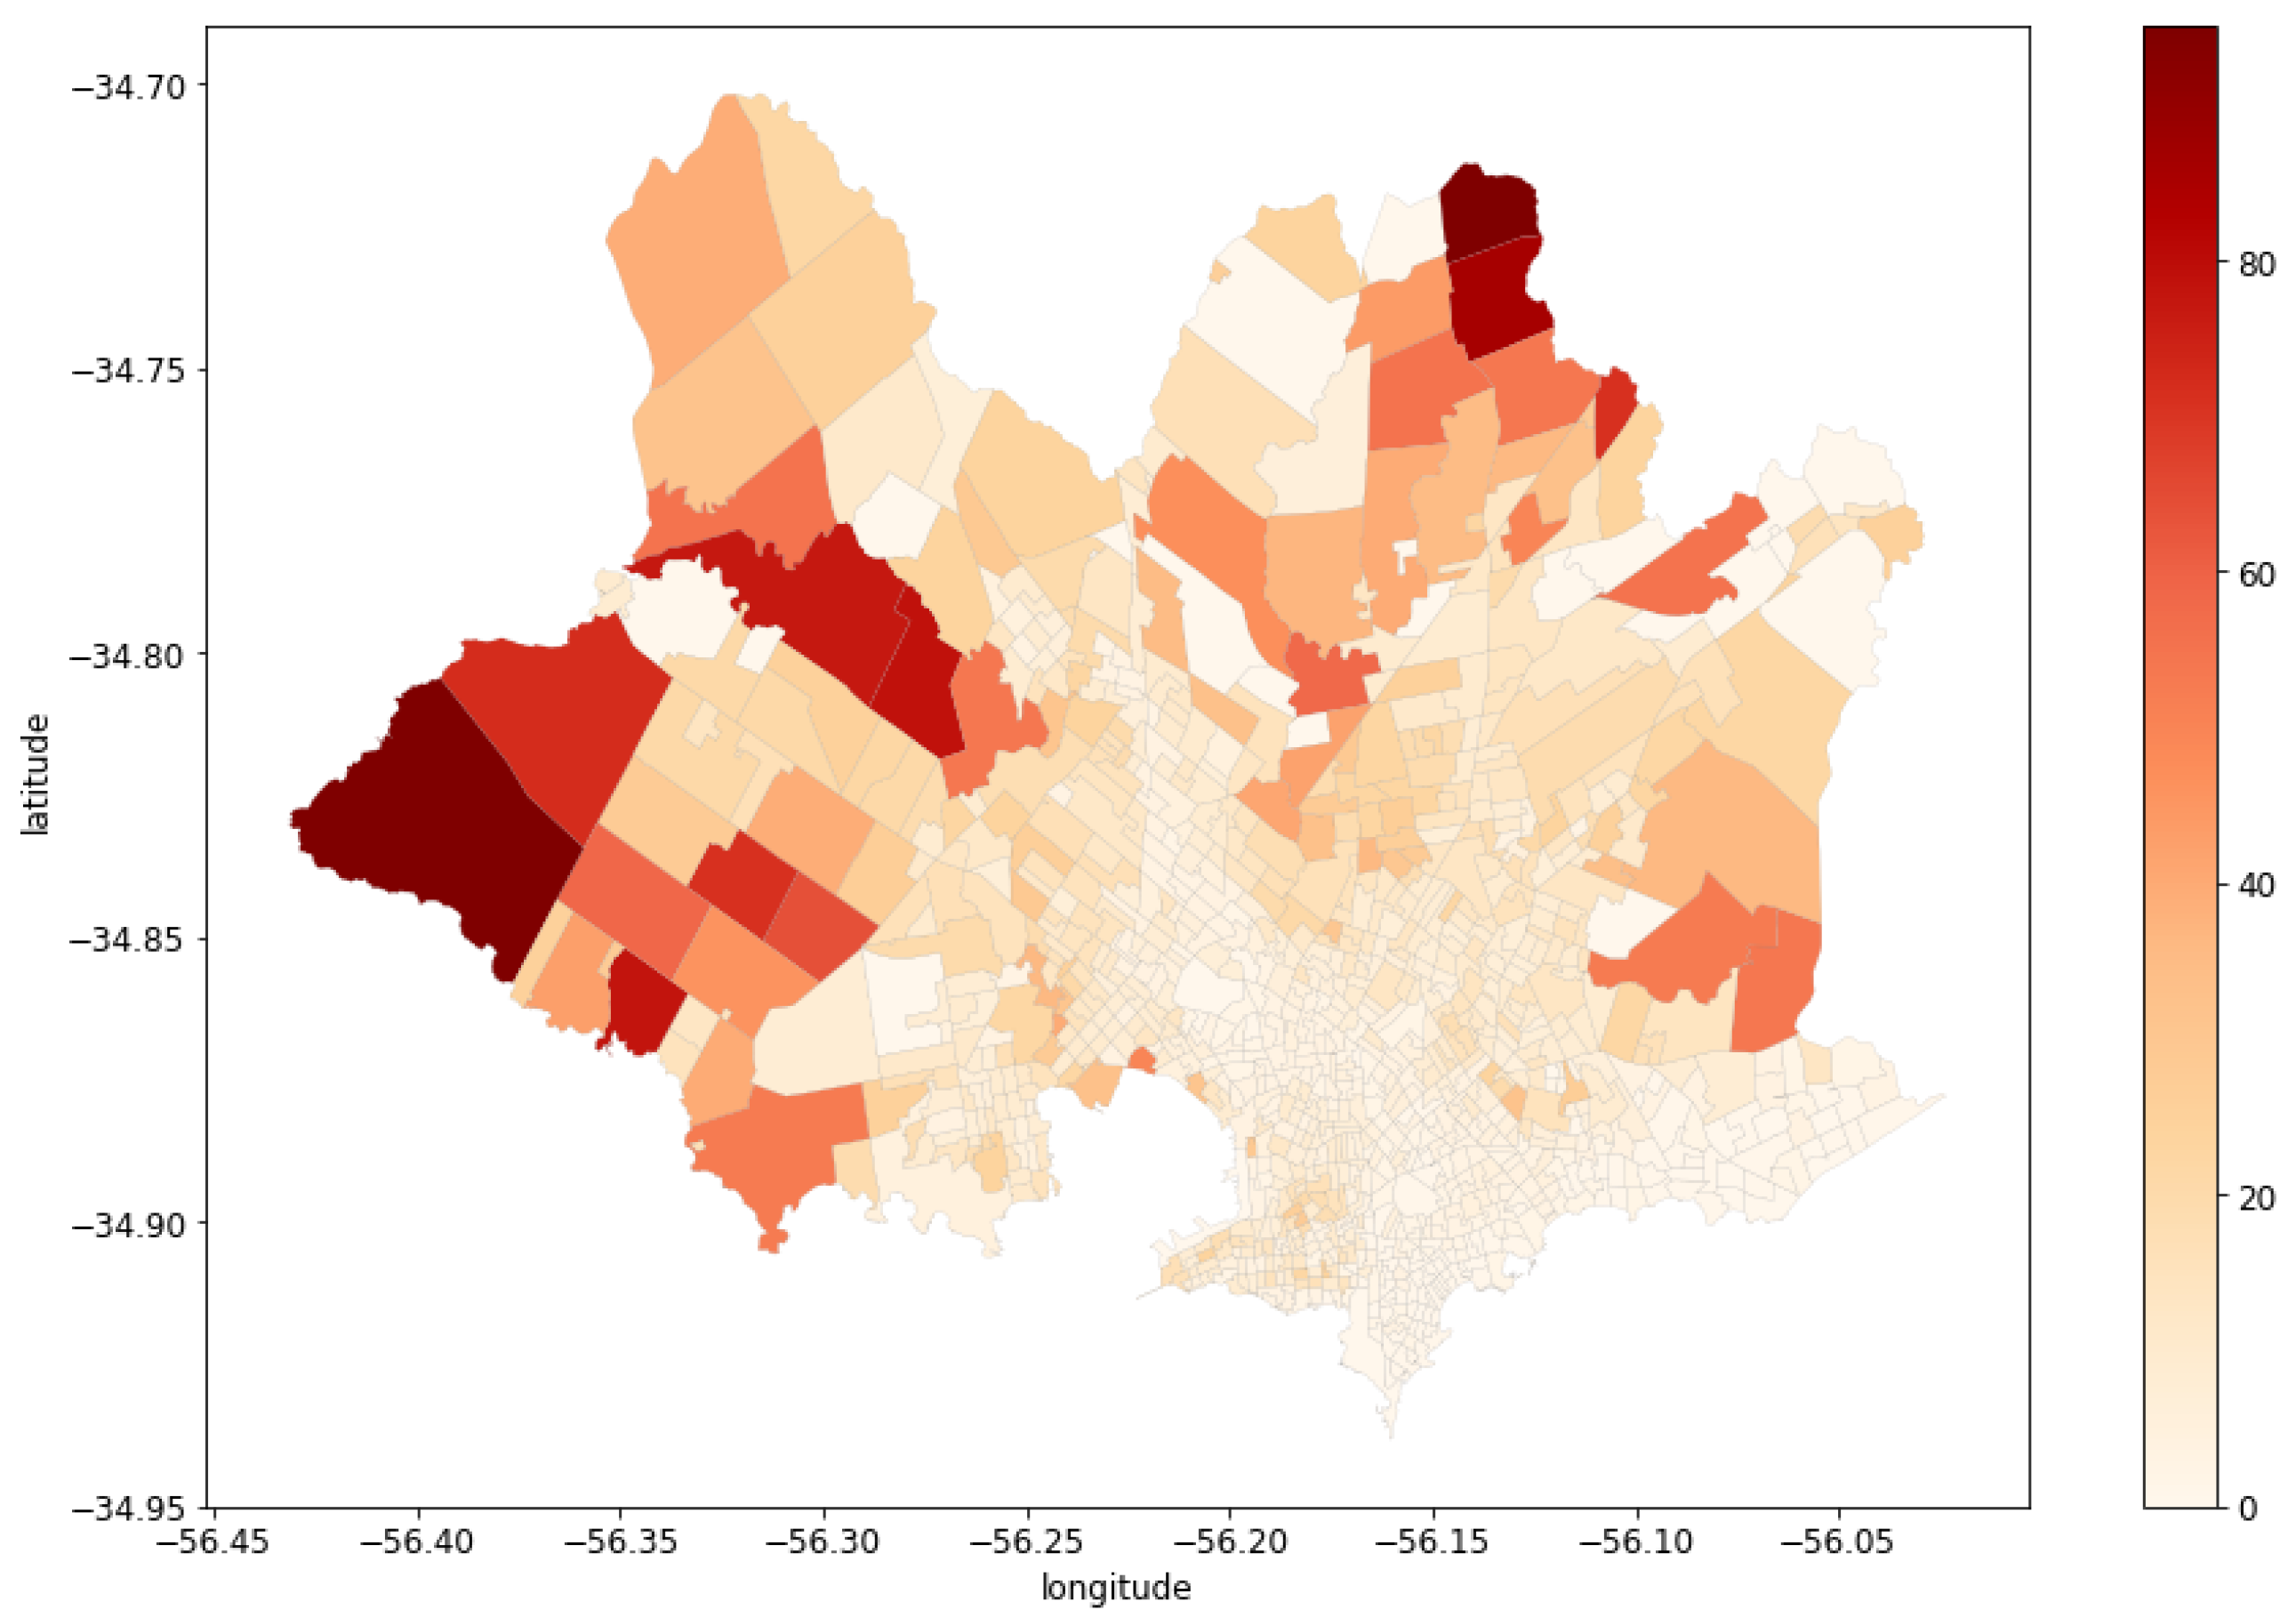
Montevideo has an estimated population of 1,319,108 unevenly distributed, with high population densities near the coastline bordering the Río de la Plata estuary. A socioeconomic description of the population can be obtained by studying Unsatisfied Basic Needs (UBNs), which identify the lack of goods or services that prevent citizens from exercising their social rights. The choropleth map in Figure 2 indicates the percentage of households with one or more UBNs. The most vulnerable citizens are located farther away from the coast and the city center, in sparsely populated areas.
3.1.2. The Public Transportation System In Montevideo, Uruguay
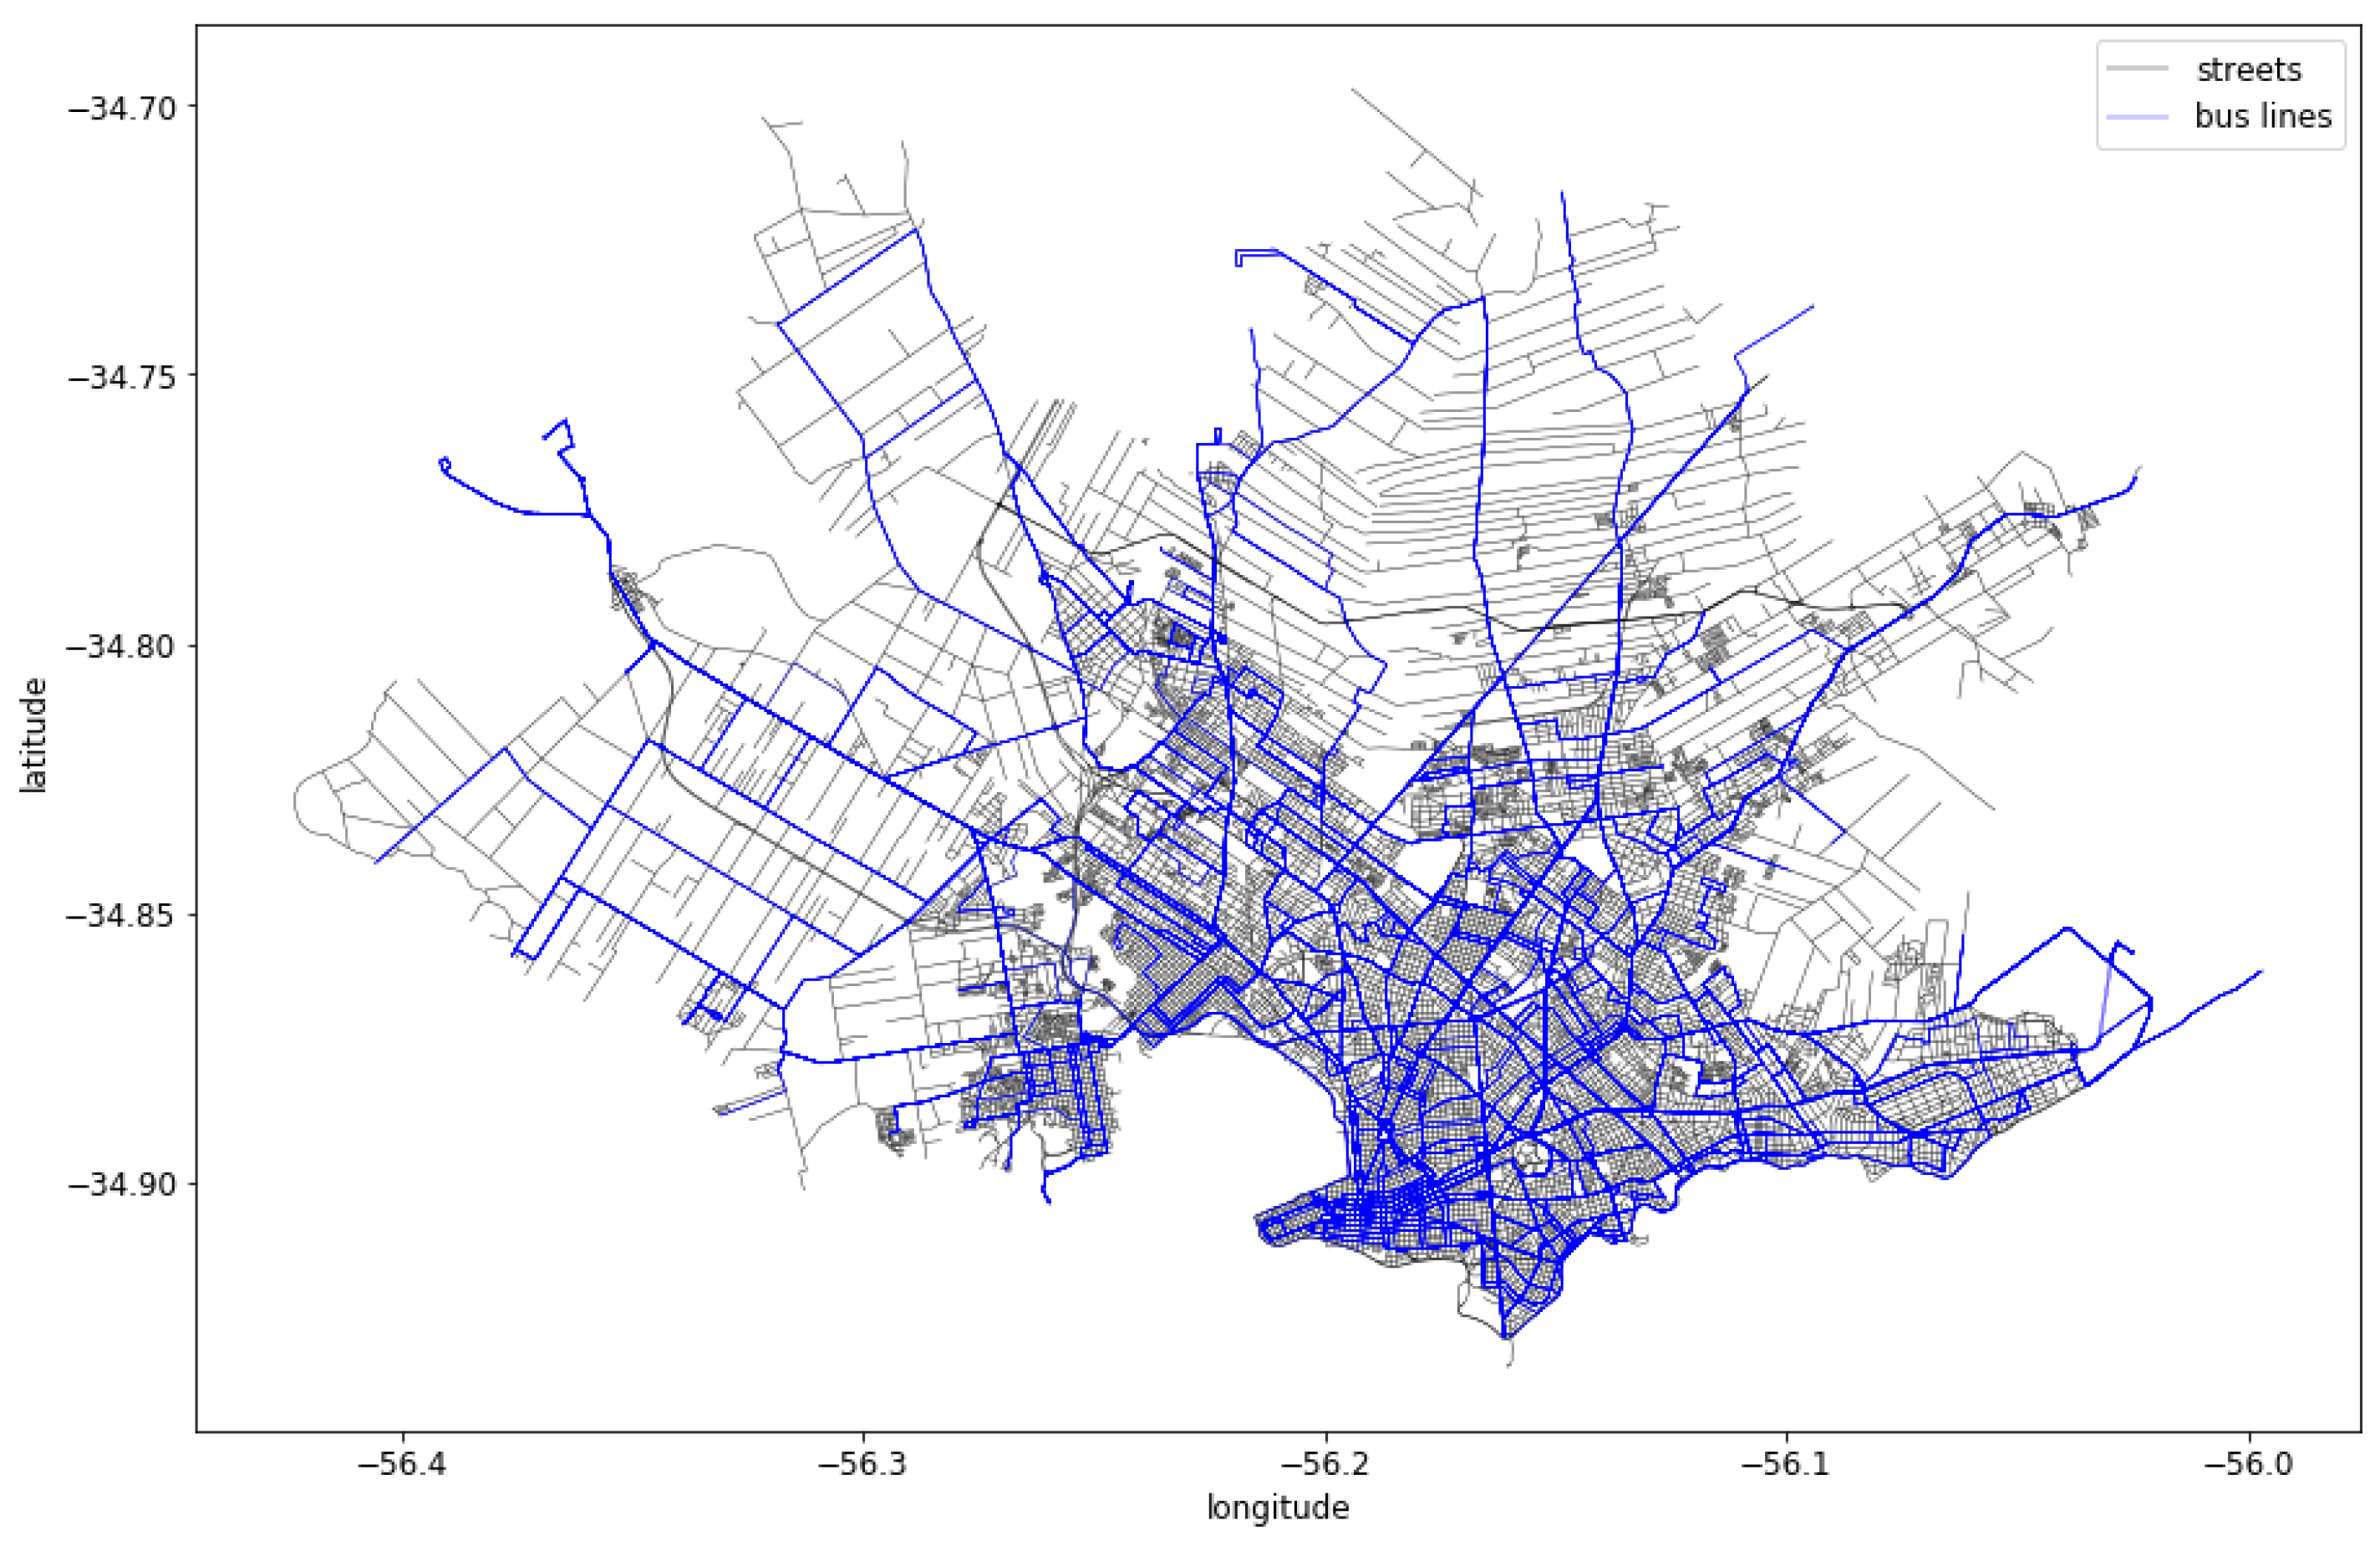
The public transportation system in Montevideo is comprised of 1528 buses operating in 145 main bus lines with different variants, accounting for outward and return trips, as well as shorter versions of the main line. The total number of different bus lines is 1383 (Figure 3). The average bus line length is 16.7 km (median: 16.4 km, longest line: 39.6 km). Intuitively, these figures strike as remarkably large. The bus network is comprised of 4718 bus stops, most of them located in the city center. This fact remarks the important role of this area within the bus network.
Contact-less top-up smart cards are used to allow passengers to pay for tickets without using physical money. Smart cards are are linked to the identity of the owner (a valid ID is required to get one). Two different types of bus tickets exist: one-hour tickets allow boarding up to two buses within an hour, while two-hours tickets grant unlimited bus transfers within a period of two hours. Passengers may transfer between any bus line at any bus stop. In practice, this means that a passenger can even make an outward and return trip in the same line, as long as the boarding time of the second bus is within the validity period of the ticket. Passengers do not validate their smart cards when alighting a bus. This constitutes one of the main challenges for building OD matrices.
3.2. Urban Data Analysis Process
This section describes the urban data analysis process performed with the goal of characterizing how citizens of Montevideo use the public transportation system.
3.2.1. Data Collection and Processing
The data analysis process used national [18] and city [19] open data, and public transportation system data (GPS bus location and bus ticket sales payed with smart cards during 2015, over 150 GB of raw data).
The bus location dataset holds the position of each bus sampled every 10–30 s, including the following information: bus line identifier, trip identifier to set appart different trips of the same bus line, GPS coordinates, instant speed, and time stamp corresponding to the GPS measure. Ticket sales data contain smart card transaction records, including: trip identifier (which allows linking to the bus location dataset), GPS coordinates of the smart card validation, bus stop identifier, time stamp of the smart card validation, unique smart card identifier (hashed for privacy purposes), number of passengers traveling with the same smart card, and leg number (for trips involving transfers).
The data collection process was straightforward in the case of open datasets. The main efforts on this phase were related to data provided by Intendencia de Montevideo. Several meetings with authorities were celebrated, until an agreement was signed granting access and use to the data for research purposes.
Regarding the processing phase, the studied data was structured in Python pandas dataframes. Among the many transformations performed to the datasets, the most significant one was related to the Coordinate Reference System (CRS). In order to be able to combine different datasets, all geospatial data was transformed to WGS 84 (EPSG:4326), which is the standard CRS used by GPS.
To present clear visualizations, the reported results are from tickets sold during May 2015. Pre-hoc analysis of the full dataset suggest that this month is representative of the trends in the complete dataset. The source code for the analysis is configurable to process any subset of the full dataset.
3.2.2. Exploratory Data Analysis
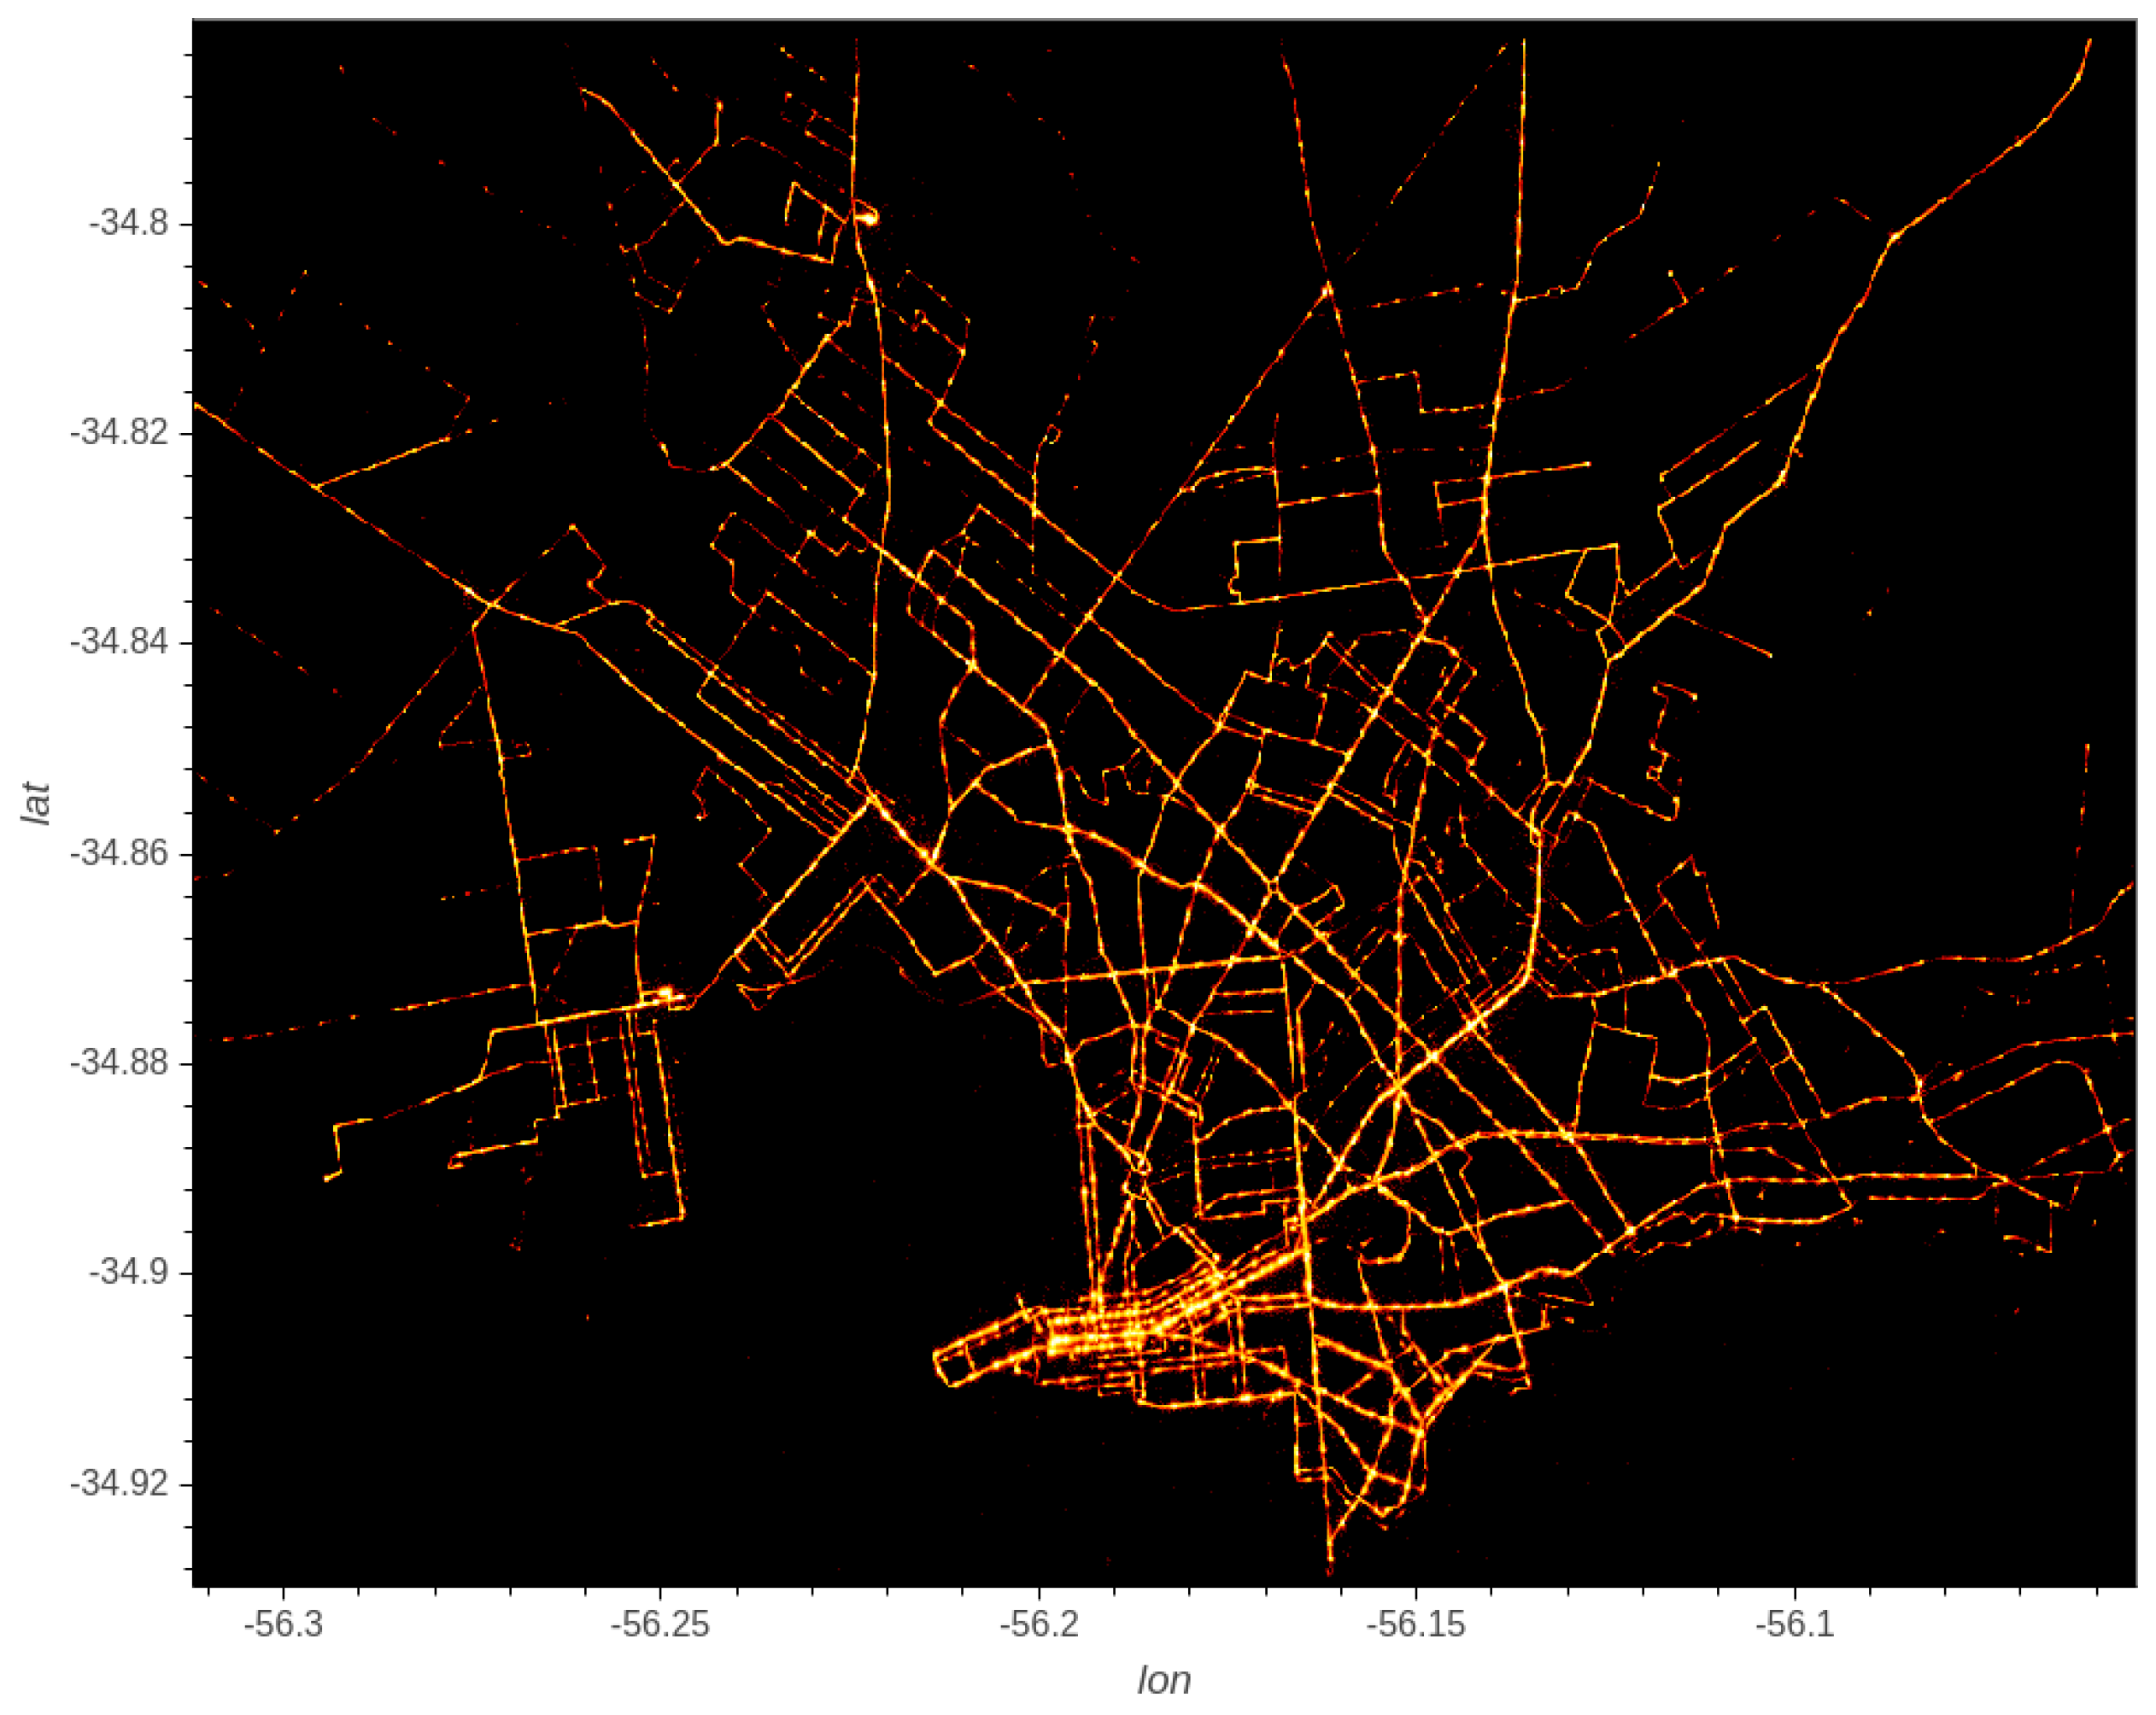
An initial EDA was performed to characterize the dataset of sales with smart cards. Figure 4 shows an aggregated visualization of the geolocation of 20.4 million sales (interactive version available at www.fing.edu.uy/~renzom/msc). Considering the active population in Montevideo (between 15 and 64 years old, ∼830 K people), this corresponds to 25 transactions per inhabitant per month. Dividing the total number of transactions by the total number of unique smartcards used at least once during May (∼654 K), we get a ratio of nearly 30. In Figure 4, the location of each smart card transaction was projected on to a grid of bins of size equal to one pixel of the image. Then, transactions on the same bin were aggregated and a color mapping was applied to generate the final image, where brighter areas indicate high concentration of ticket sales.
The initial visualization of aggregated sales location data uncovers several interesting facts of the underlying dataset. Firstly, the city center is clearly different from other zones, with a significant higher number of smart card transactions. Additionally, the main avenues can be clearly identified due to the higher number of ticket sales. Furthermore, some sales activity is registered outside of the limits of Montevideo. This is an important insight that guided the data cleansing process described in the following section.
3.2.3. Data Cleansing
Data cleansing is mandatory to detect and correct corrupt or inaccurate records [20]. Since no backup source of information was available, the chosen strategy was to delete records that appeared to be corrupted. Filtered data included: records with no corresponding bus line, consecutive tap-ins in the same bus, transactions on May 1st (since they correspond to Labour Day, when the public transport system is mostly inoperative), and transactions occuring in bus lines or bus stops that no longer exist (since sales data correspond to 2015). During the complete data cleansing process 311,772 records were filtered, accounting for of a total of 20,359,835 records.
3.3. Results and Discussion
This section outlines the main results of the urban data analysis process to characterize the use of the public transportation system in Montevideo, Uruguay. A description of the use patterns of smart cards is presented, as well as a spatial and temporal analysis of the use of the transportation system.
3.3.1. Cardholders
The sales dataset holds transactions made with 654,228 different smart cards. As explained in Section 3.2.1, several passengers may travel together using a single smart card. However, the vast majority of passengers use their own personal smart card: over 97% of transactions correspond to individual tickets. Therefore, smart cards can be confidently assumed to represent a single passenger. This is a key assumption used in the OD matrix estimation presented in Section 4, where all passengers under the same smart card are assumed to travel from origin to destination together. Thus, the fact that few group trips are performed using the same smart card provides a certain level of robustness to the OD matrix estimation model.
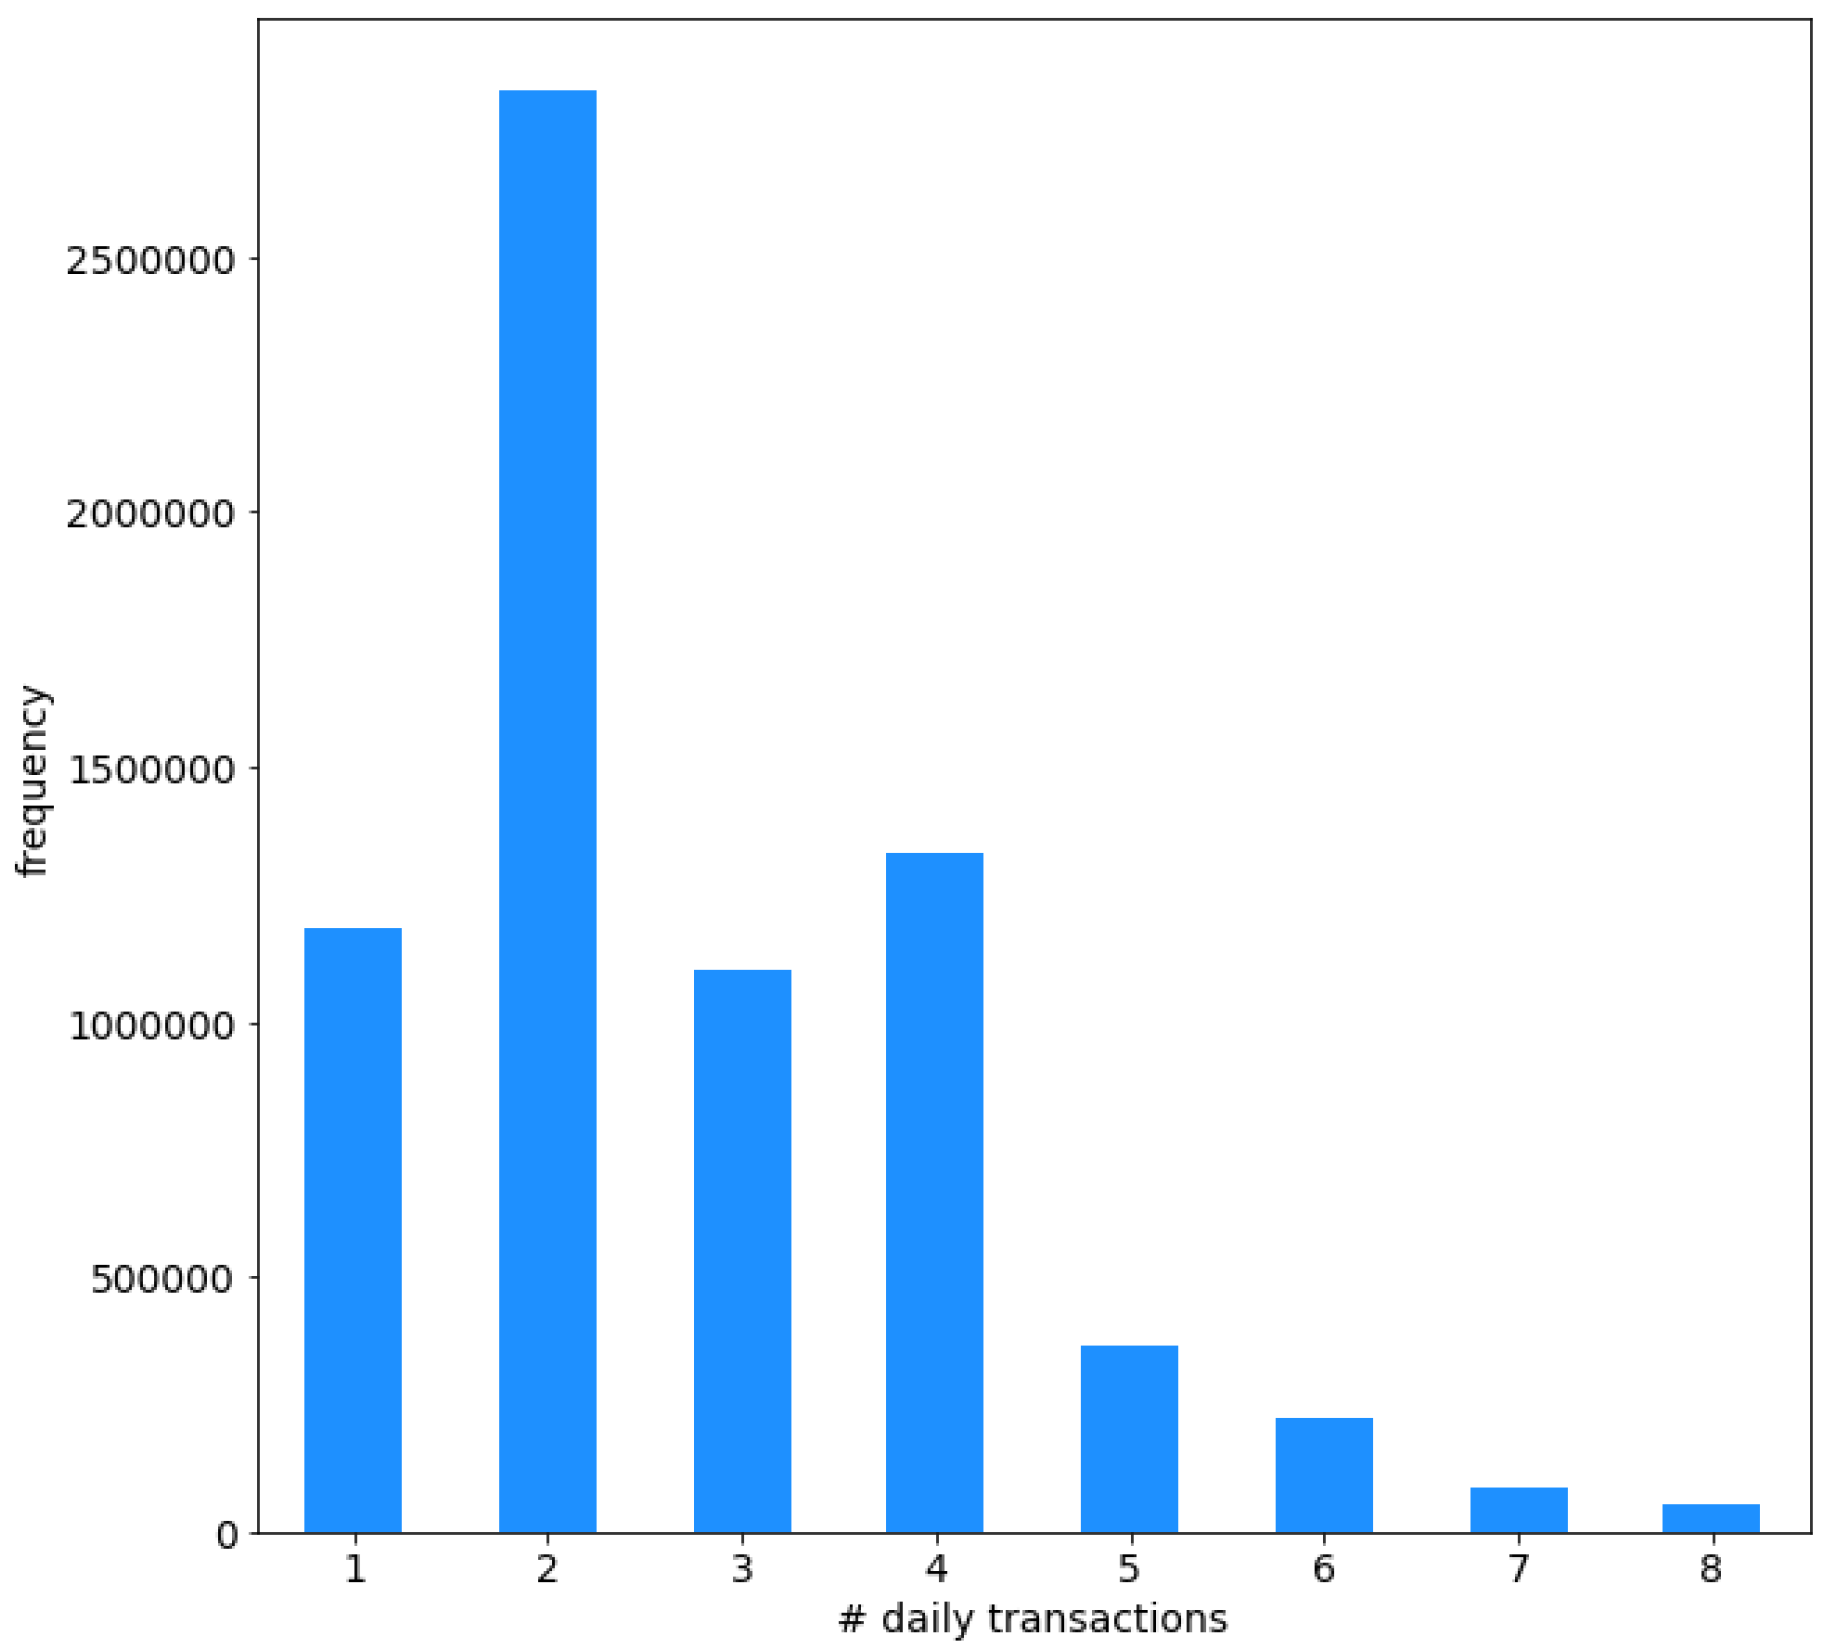
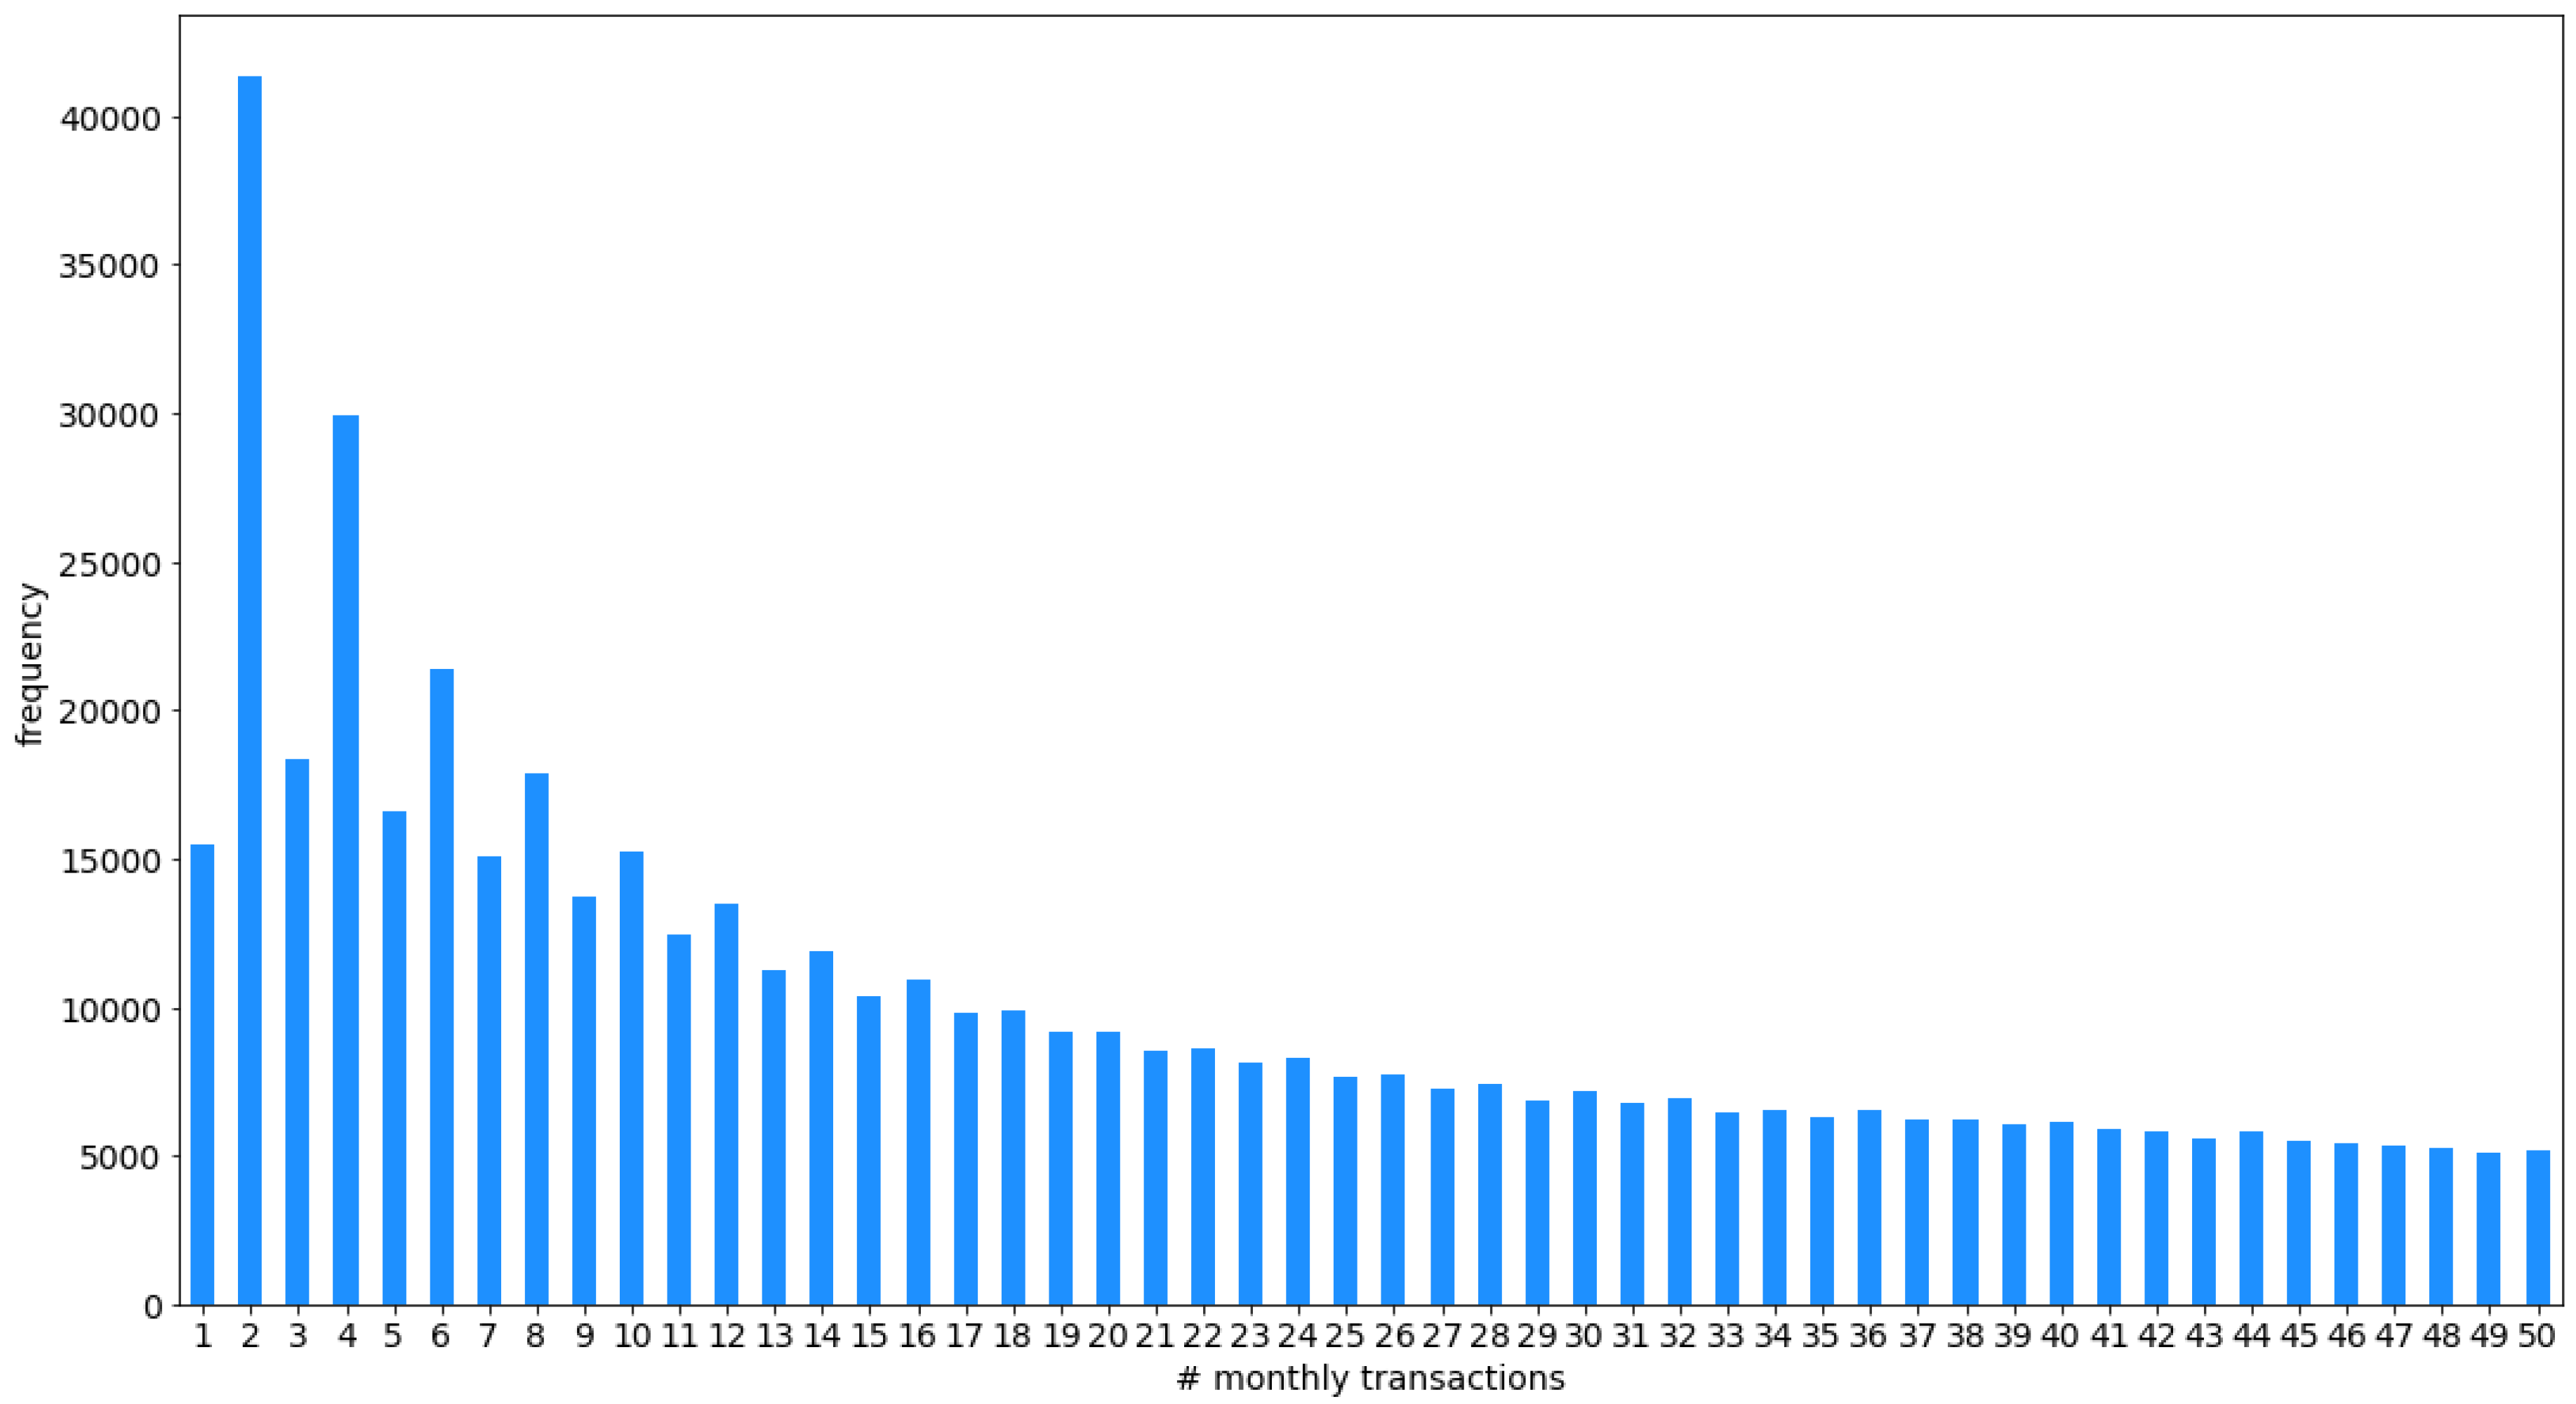
Data analysis can also give insight into the frequency of use of the transportation system. Table 1 reports descriptive statistics of daily and monthly transactions per smart card, including the minimum (min) and maximum (max) values, the 25th (Q1), 50th (Q2), and 75th (Q3) percentiles, and the Median Absolute Deviation (MAD). The 50th percentile corresponds to the median of the distribution of transactions per smart card. Monthly statistics consider all transactions done by each cardholder. Daily statistics only consider days for which at least one transaction was made. Values corresponding to the complete dataset are presented (all weekdays) and also considering only working days and only weekends. Additionally, daily and monthly sales distributions considering all weekdays are displayed in Figure 5 and Figure 6, respectively. Plots are limited to the most occurring values for better visualization.
Regarding monthly use, the median cardholder performs 22 transactions per month, nearly one transaction per working day in the month. However, the MAD is 22.5, suggesting a significant difference between regular and sporadic users of the public transportation system. Regarding daily use, the median cardholder performs two smart card transactions each active day (i.e., each day with at least one transaction). Additionally, more cardholders perform four rather than three transactions (see Figure 5), which could be explained by passengers using trips involving a transfer. Thus, two transactions correspond to the outward trip and the remaining two transactions to the return trip. Daily usage is higher on working days than weekends when looking at the top quartiles. Additionally, monthly usage is also sensibly higher on working days than on weekends. Taking into account that the studied month had nine days in weekends, users perform (in median) roughly one transaction in the whole weekend vs. one transaction per day on working days. This is consistent with the information from the 2016 mobility survey, which states that commutes to work are the main purpose of traveling, accounting for nearly 30.9% of all trips. An in-depth analysis of the effect of the public transportation system in employment in Montevideo is studied in [21].
Identifying outliers within the smart card use statistics can be a useful tool for authorities of the public transportation system. On the one hand, cardholders with very few monthly transactions can be identified by their card ID. In the studied dataset, 15,440 cardholders performed a single trip during the whole month of May 2015. Targeted marketing campaigns could be designed to encourage disengaged citizens to use public transportation more frequently. On the other hand, cardholders with a large number of transactions can also be identified. In the studied dataset a single card was found to perform 54 transactions in a single day. This information can help authorities to further investigate and identify possible abuses to the system.
3.3.2. Transfers
As introduced in Section 3.1.2, the fare scheme allows transfers between any bus line at any bus stop. Thus, a trip can be comprised of several legs, with bus transfers between each leg. Results show that 55.99% of all transactions involve a single direct trip. Similarly, 40.26% of smart card transactions correspond to a trip comprised of two legs and involving one transfer. The number of transactions involving more than two bus transfers are less than 4% of the total dataset. The average number of legs for the studied dataset is 1.37. According to the household mobility survey, the average number of legs when travelling by bus is 1.5. The slight difference between both estimations might be explained due to the fact that the mobility survey considers the walks to/from the bus stop as separate legs (if they are longer than 500 m). Since the cardholders identity is not included in the study dataset for privacy issues, personal information (e.g., home address) cannot be used to infer the walked distance to/from the bus stop. Thus, direct trips requiring the passenger to walk more than 500 m to reach the bus stop are counted as two-legged trips in the mobility survey and as one-legged trips in the urban data analysis approach.
3.3.3. Temporal Analysis of Transactions
The AFC in the public transportation system records the date and time of each transaction, which allow analyzing the distribution of transactions across time.
Firstly, the number of transactions occurring each day of the week was analyzed. As expected, working days show the largest concentration of transactions with an average of ∼3.31 M of transactions and a median of ∼3.44 M. In contrast, transactions during weekends drop significantly, with a clear difference between Saturdays (∼2.19 M transactions) and Sundays (∼1.28 M transactions).
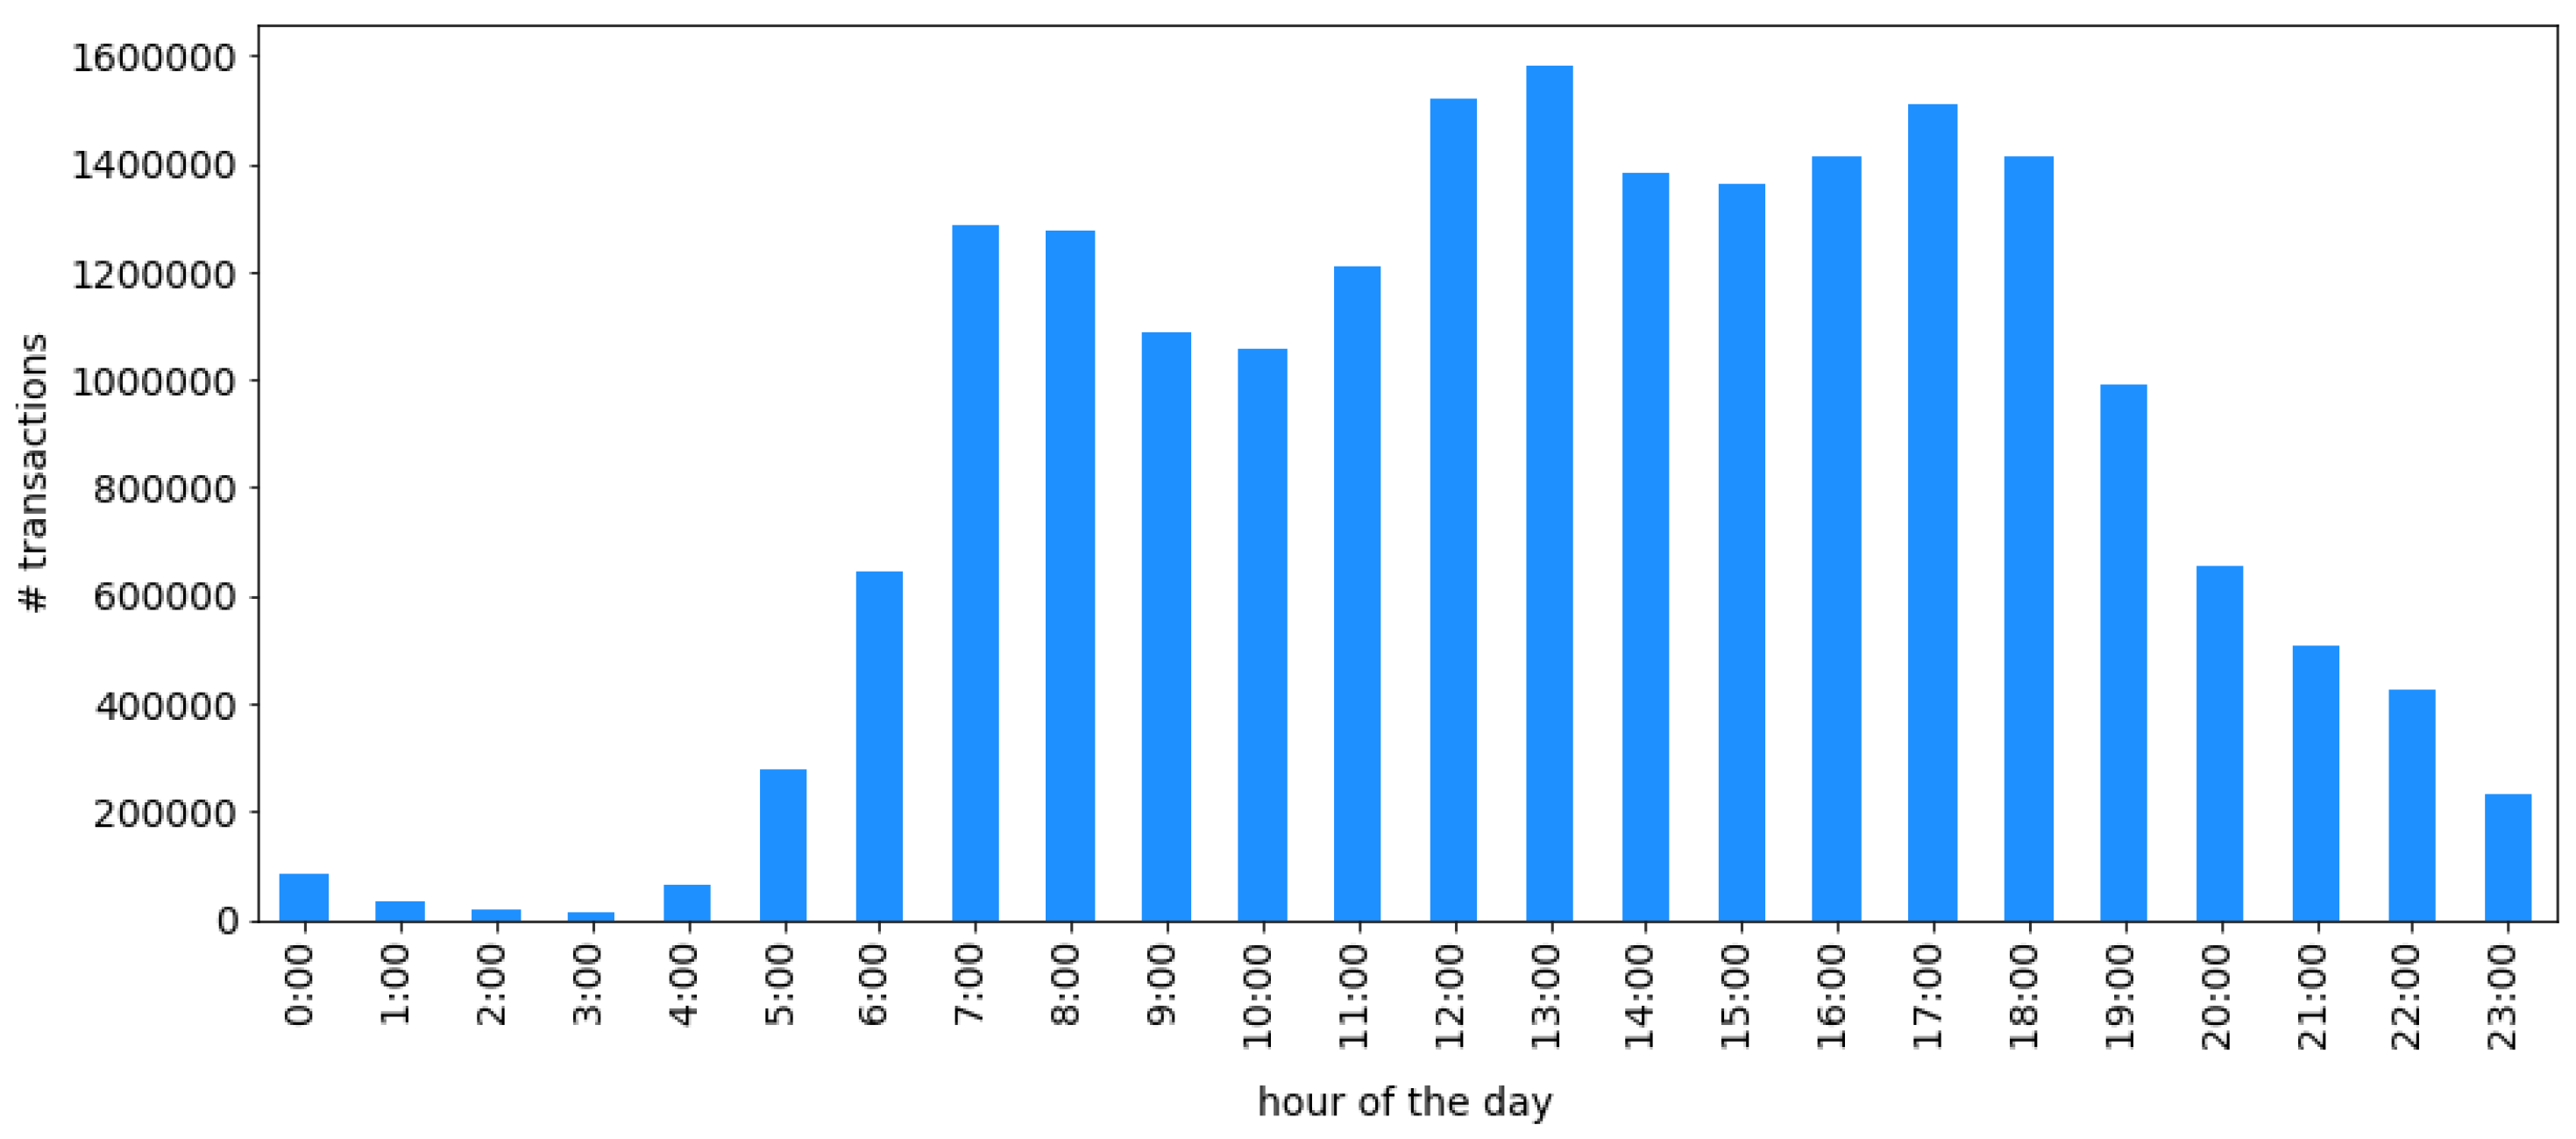
Then, a finer-grain analysis was performed to study the distribution of transactions across time. Figure 7 shows an histogram with the number of smart card transactions at each hour of the day during May 2015. Two clear peaks of smart card transaction activity were detected during the morning (7:00–8:00) and the afternoon (16:00–18:00), probably due to commuting. The morning peak is preceded by an increasing trend of sales starting at 3:00 while the afternoon peak gradually decays as the night approaches. However, an interesting observation is that another peak occurs at midday (12:00–13:00) which might not be foreseen prior to the analysis. In fact, the overall largest amount of transactions occur at 13:00. Finally, it is worth noting that the lowest number of ticket sales happen at 3:00. This finding is used for the OD matrix estimation algorithm presented in Section 4, which considers each new day as starting at 3:00, when fewer sales are made. Results are in line with the 2016 household mobility survey.
3.3.4. Spatiotemporal Analysis of Transactions
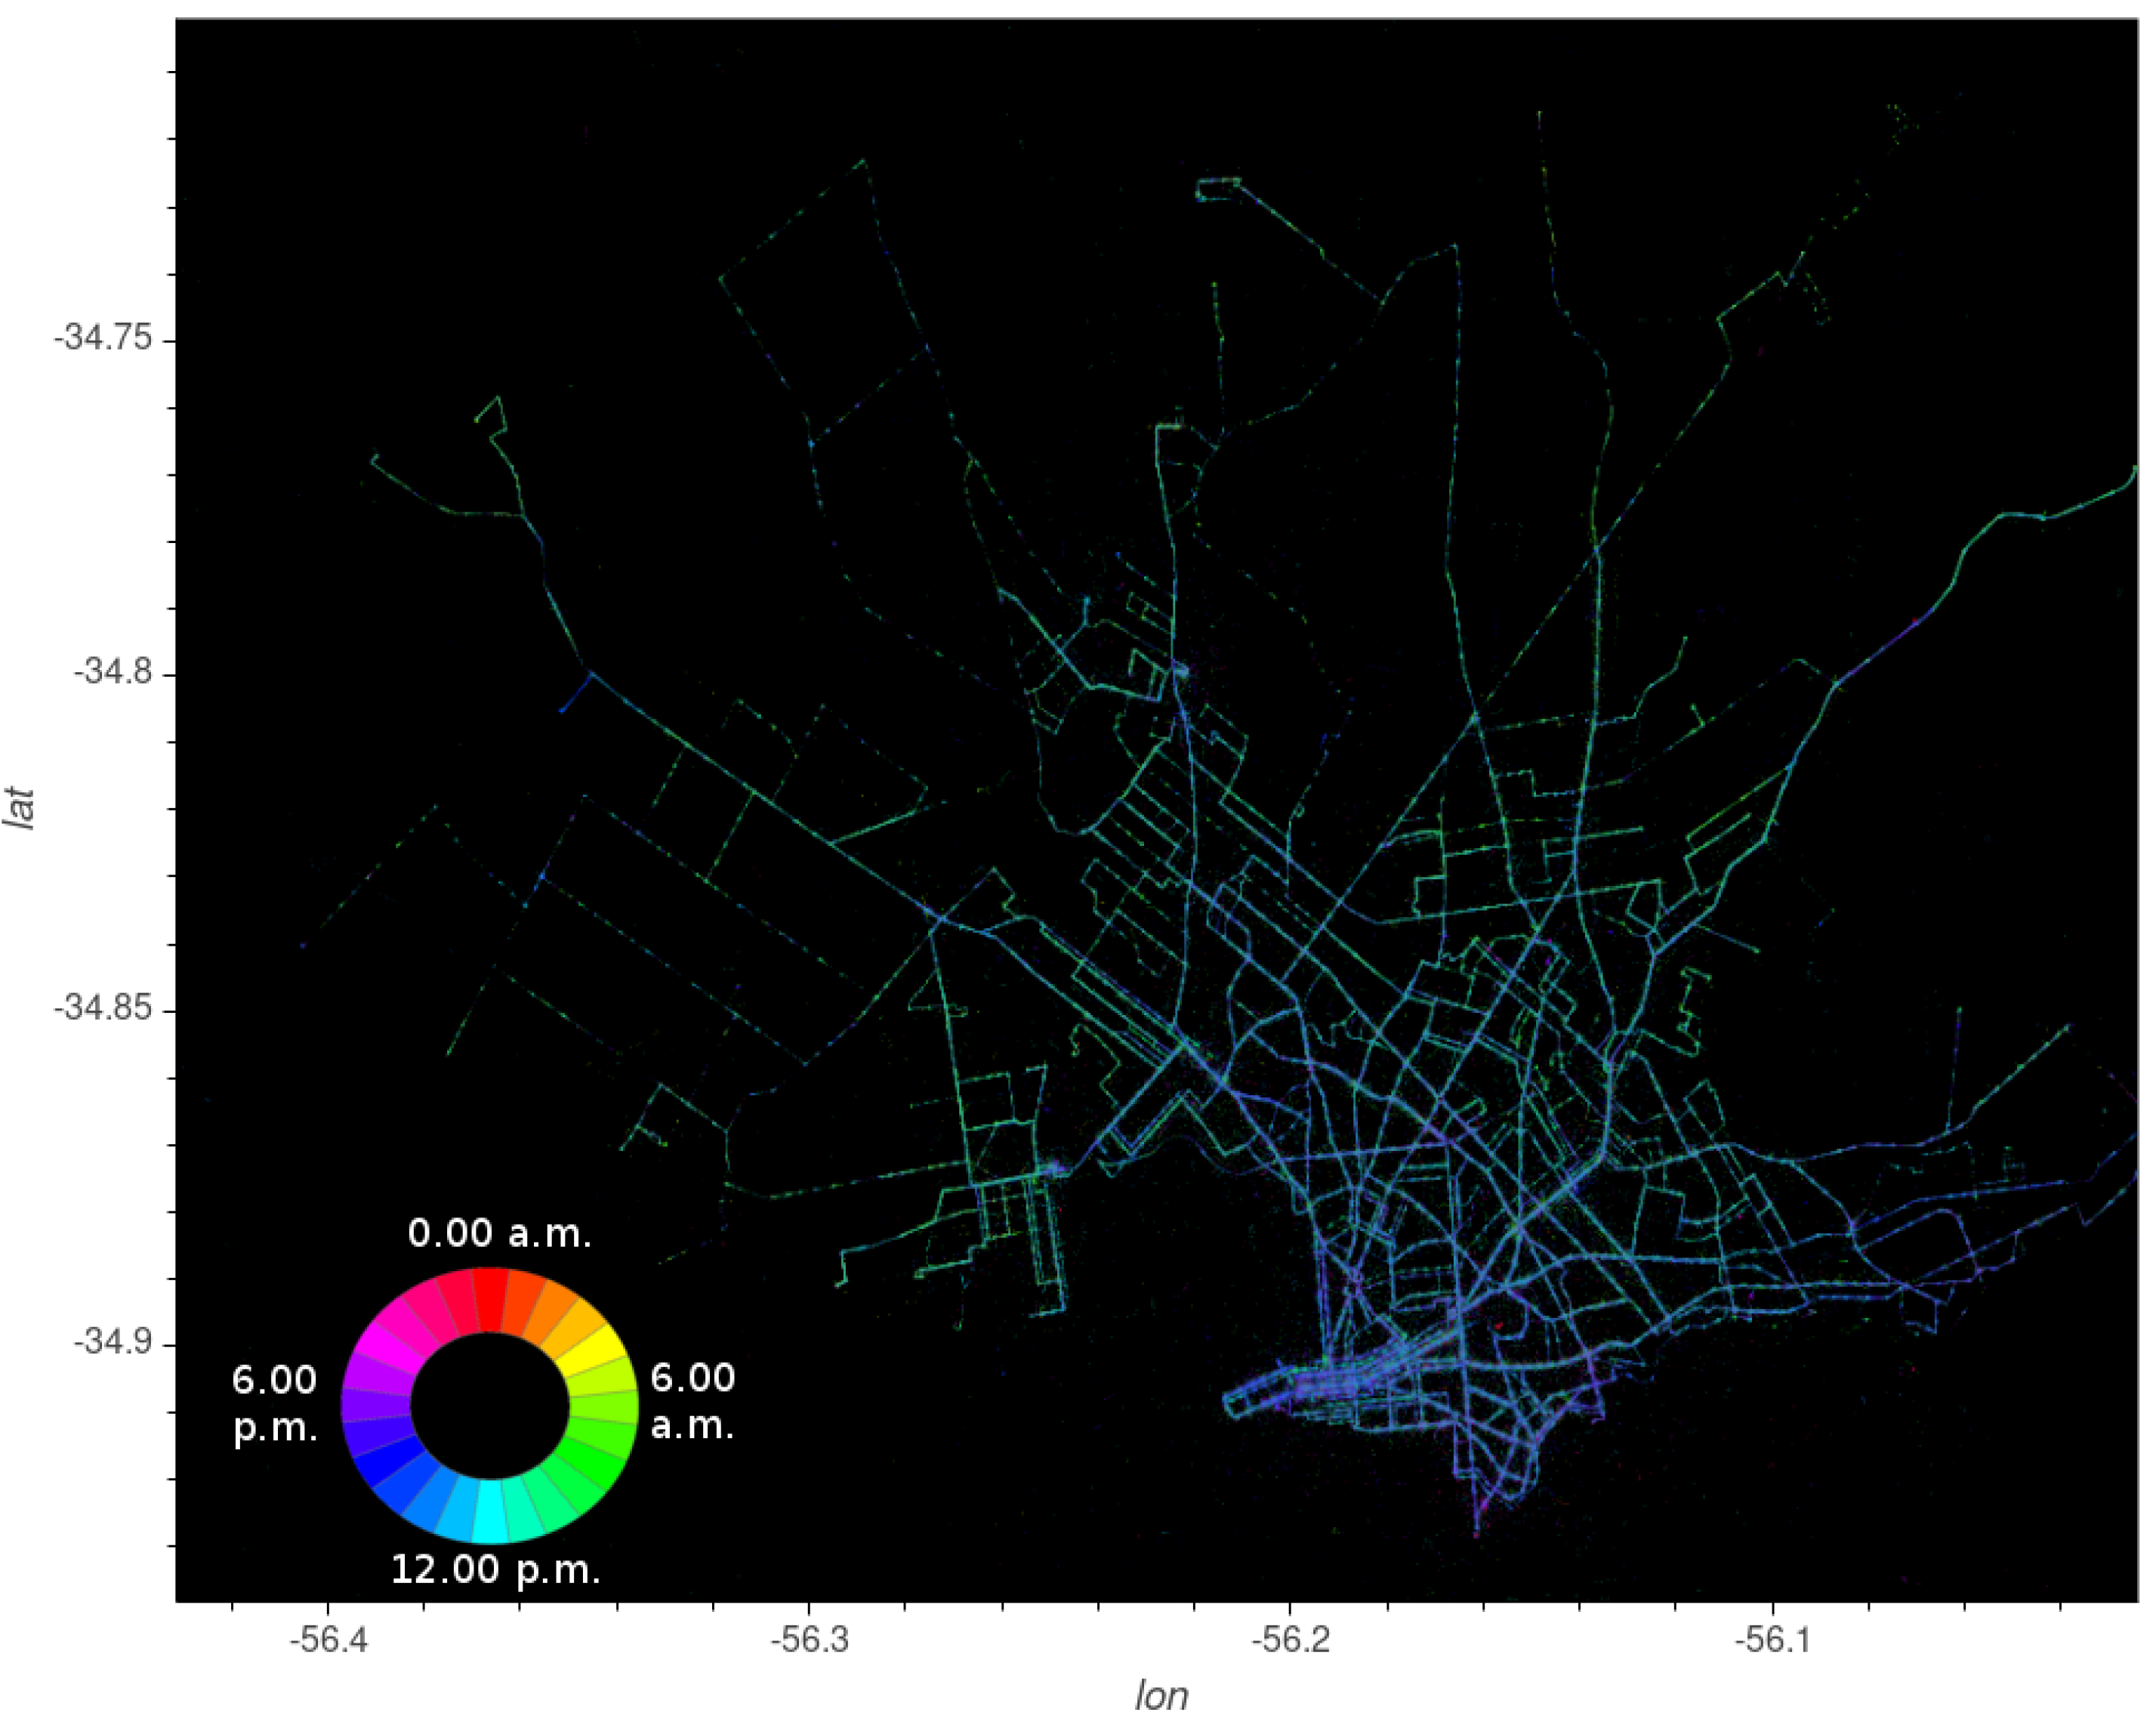
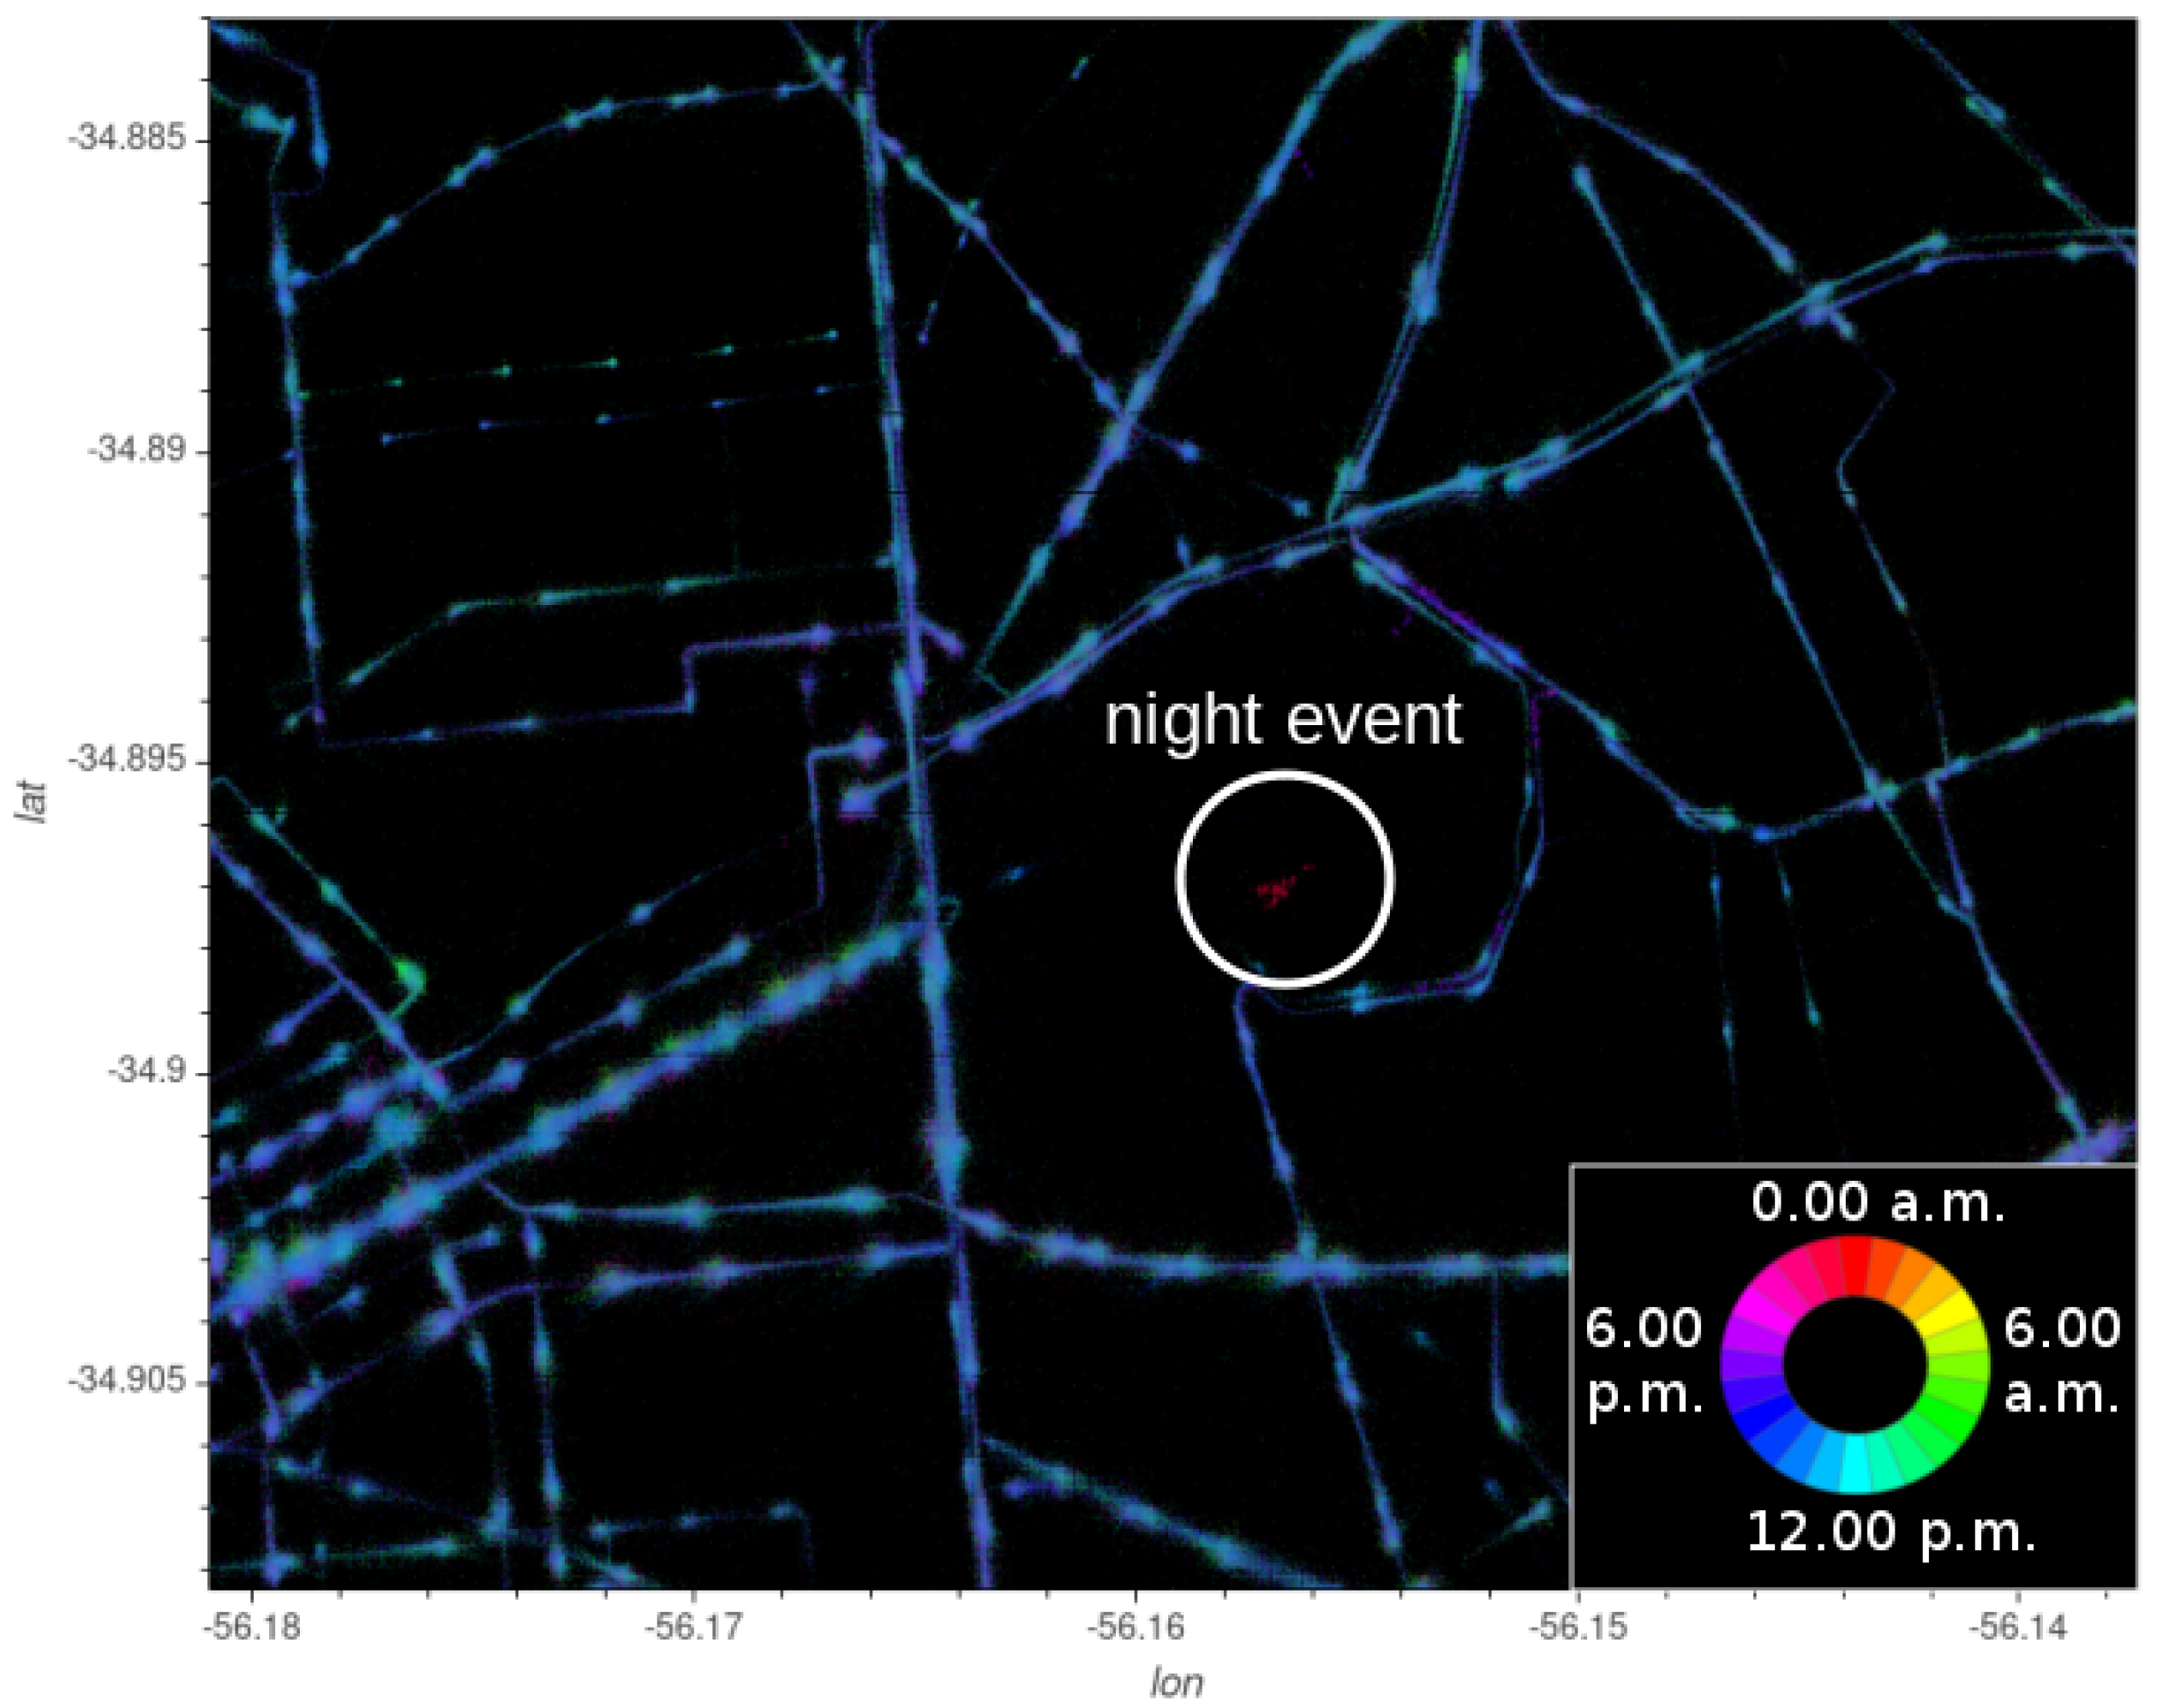
Spatial and temporal dimensions of smartcard transactions can be combined to gain insights that might not arise when studying each dimension independently. Figure 8 shows an aggregated visualization of the spatiotemporal distribution of sales in Montevideo. Each transaction occurring at a given pixel in the image is categorized according to its time stamp. Then, the color of the pixel is set considering the amount of transactions on each category. The color mapping, which is detailed in the visualization, corresponds to: red (0:00), yellow (4:00), green (8:00), cyan (12:00), blue (16:00), and purple (20:00). An interactive version of the visualization is available at www.fing.edu.uy/~renzom/msc.
The city center has most transactions taking place between noon and the afternoon, which might be explained by the fact that many offices and public entities are located in this area. Consequently, most transactions correspond to people commuting back to their homes by the end of the office-hours. A clear difference can also be noticed between areas near the coast and areas farther away. The majority of transactions in areas farther away from the coast occur earlier in the day than those near the coast. This might be explained by people commuting early in the day from these areas to workplaces located closer to the city center. It is worth noting that, as outlined in Section 3.1, areas farther away from the coast are usually more vulnerable from a socioeconomic point of view.
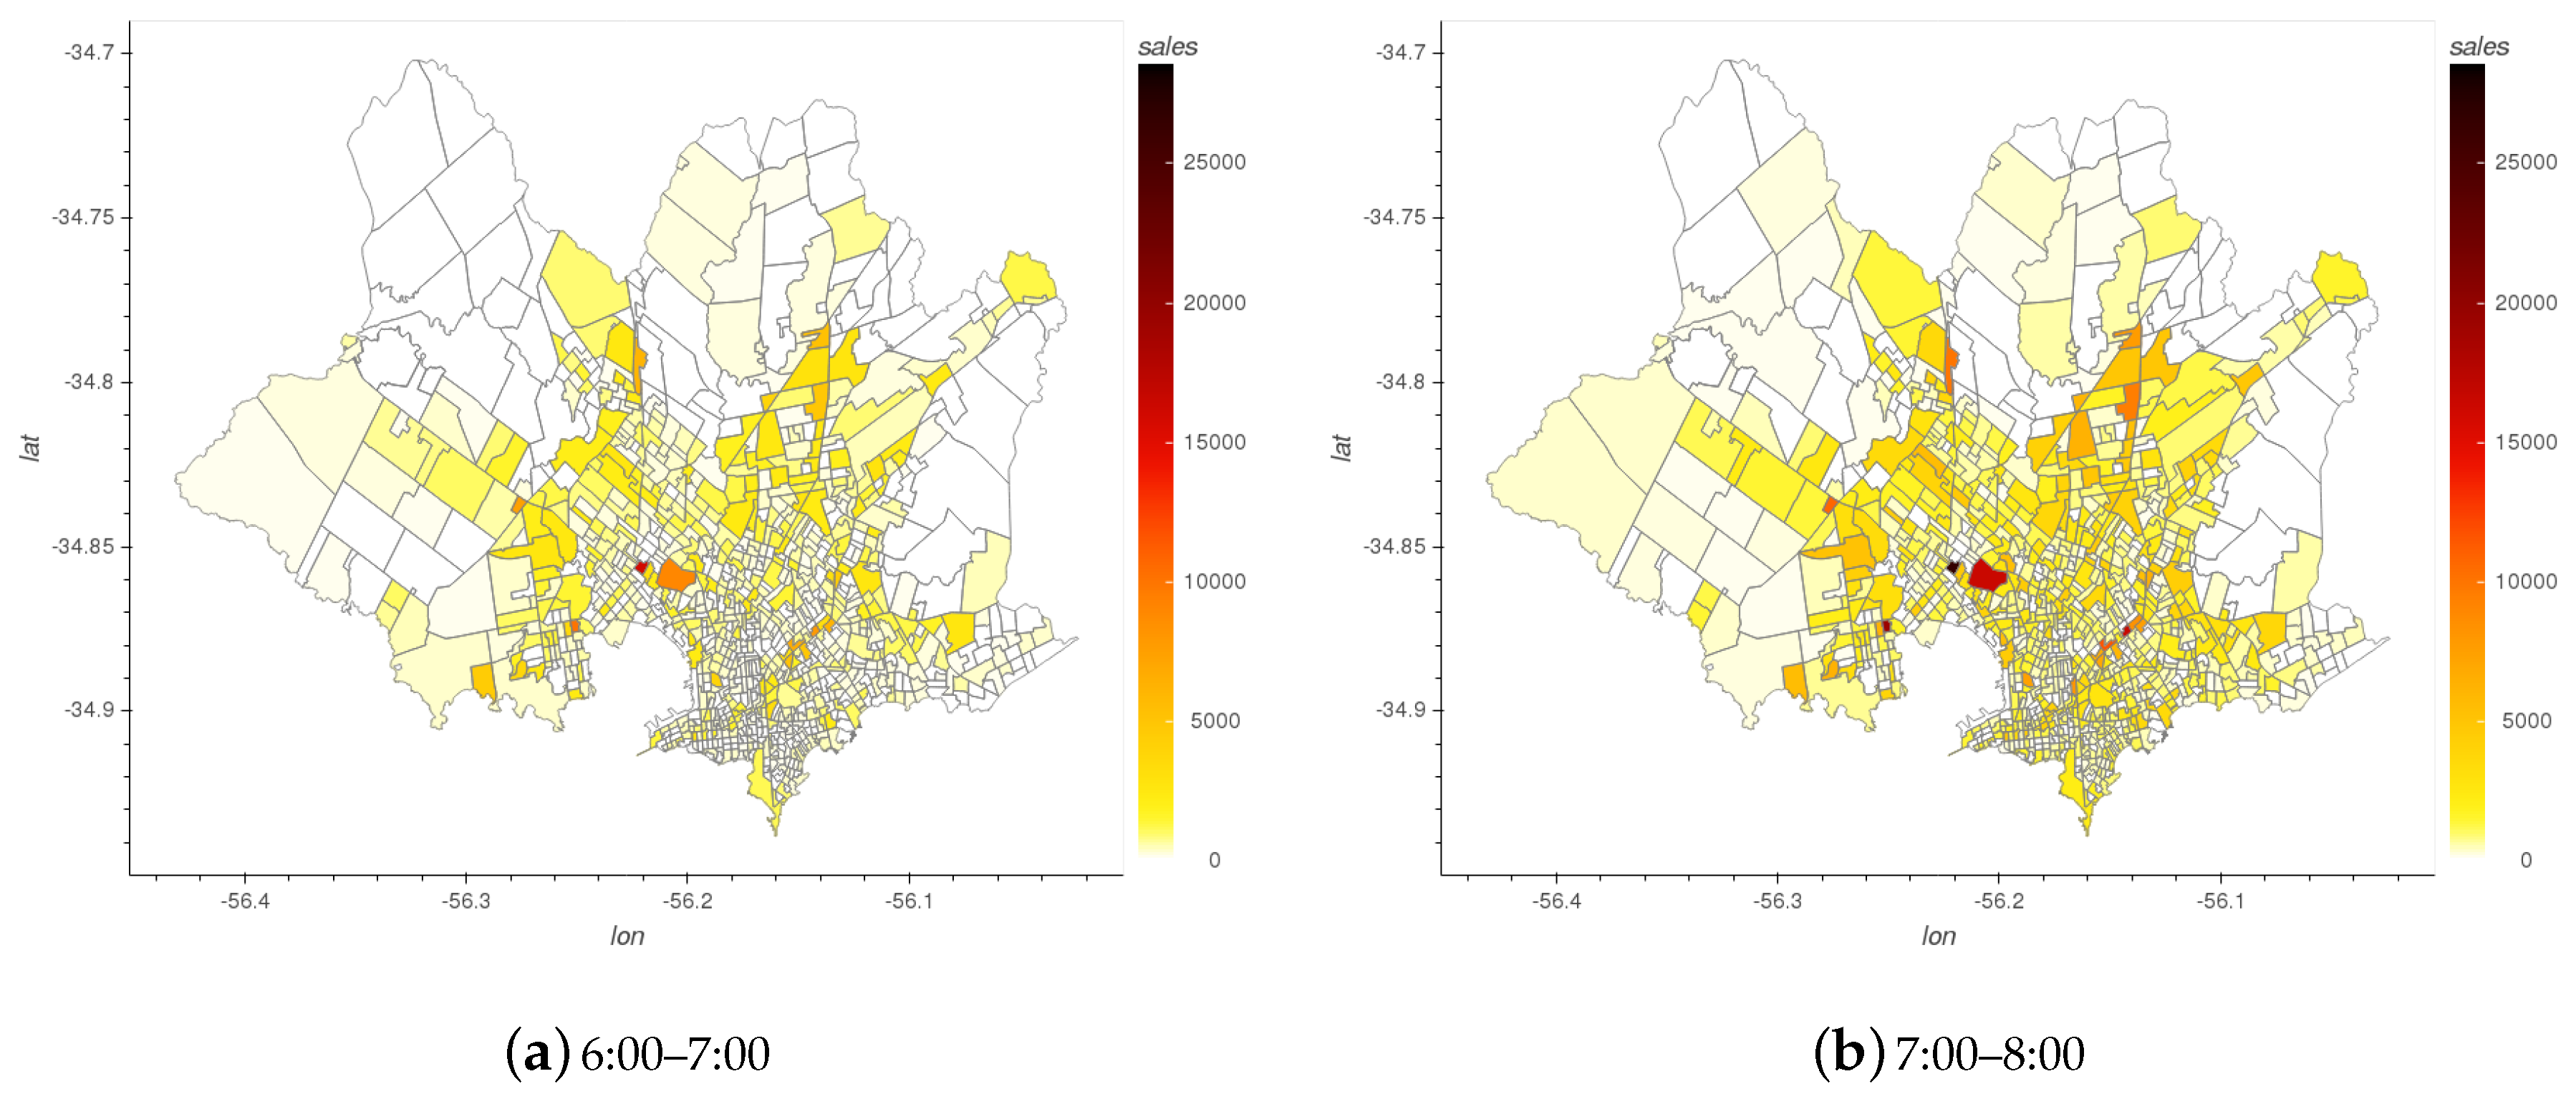
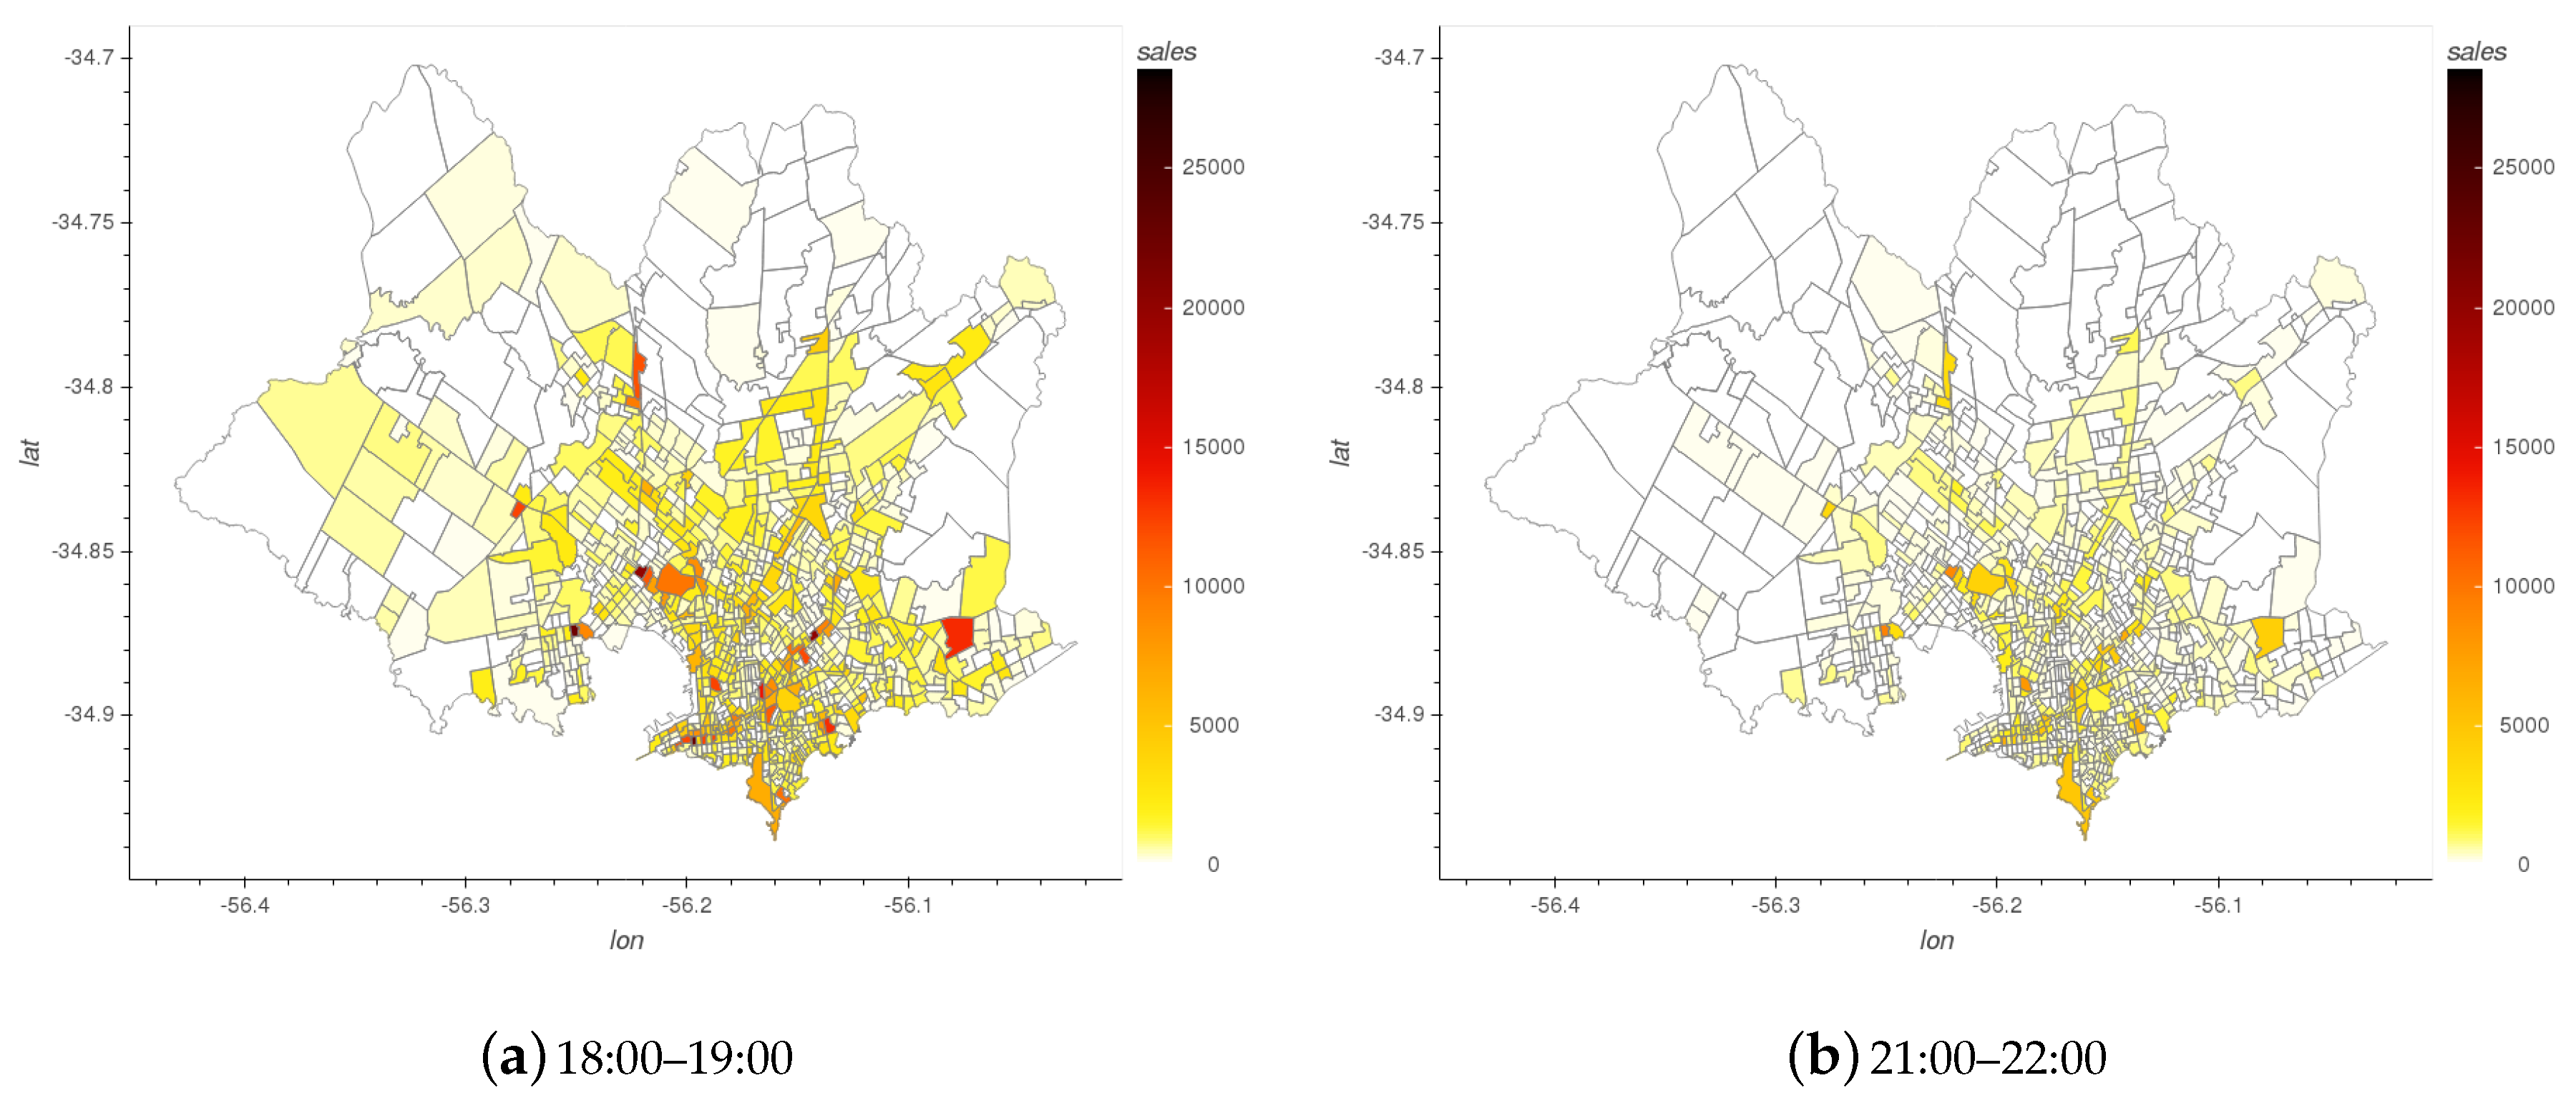
Figure 9 and Figure 10 show choropleth maps of the number of transactions occurring in each census tract in the morning and evening, respectively.
In the morning, those areas farther away from the city center and the coastline have higher smart card transaction activity early (6:00–7:00) than those near the coast. Transaction activity in the city center and near the coastline intensifies an hour later. Between 7:00 and 8:00 large amounts of transactions occur in most areas of Montevideo. A few census tracts show a specially large number of transactions. These areas correspond to the location of bus terminals, where several bus lines converge and many transfers between bus lines occur.
In the evening, a large number of transactions occur in the city center. This is explained by people returning to their homes from workplaces in the city center at the end of office hours (18:00–19:00). Between 21:00 and 22:00 the amount of sales in the whole territory significantly drops. The areas with some remaining transaction activity are, once again, those located farther away from the city center and the coastline. This might be explained by people living in poorly connected areas taking longer to commute back to their homes by the end of the working day or also due to citizens working during night shifts and commuting to their workplace.
Spatiotemporal analysis can be combined with the population and socioeconomic description. Areas with transactions occurring early in the morning/late at night are also more vulnerable from a socioeconomic point of view, as outlined in Section 3.1. This study helps understanding the variation of mobility patterns for citizens with different socioeconomic levels [22].
3.4. Practical Use Cases
This subsection presents two relevant case studies to illustrate different ways in which the proposed methodology applying data analysis can contribute to help authorities with the task of operating public transportation service and improving the quality of service.
3.4.1. Event Detection
The analysis of anomalous registers in either time and/or location data of ticket sales can help authorities to identify special events taking place in the city. The image in Figure 11 presents an aggregated visualization combining spatial and temporal data of smart card transactions for a neighborhood of Montevideo. A small cluster of red pixels (highlighted with a white circle in the figure) is detected on the map. This cluster corresponds to bus ticket sales occurring at midnight, representing a clear outlier from the rest of ticket sales in the dataset. Taking in consideration the location of those ticket sale records (near an outdoor venue), it is reasonable to assume that the transactions correspond to a special social event (e.g., a concert) held at night in that venue. In case the situation repeats periodically, specific action can be taken to satisfy that mobility demand. This relevant case exemplifies how city authorities can take advantage of a methodology using urban data analysis to detect periodical special events in the city and plan the transportation services in response to those events.
3.4.2. Driving Behavior and Safety
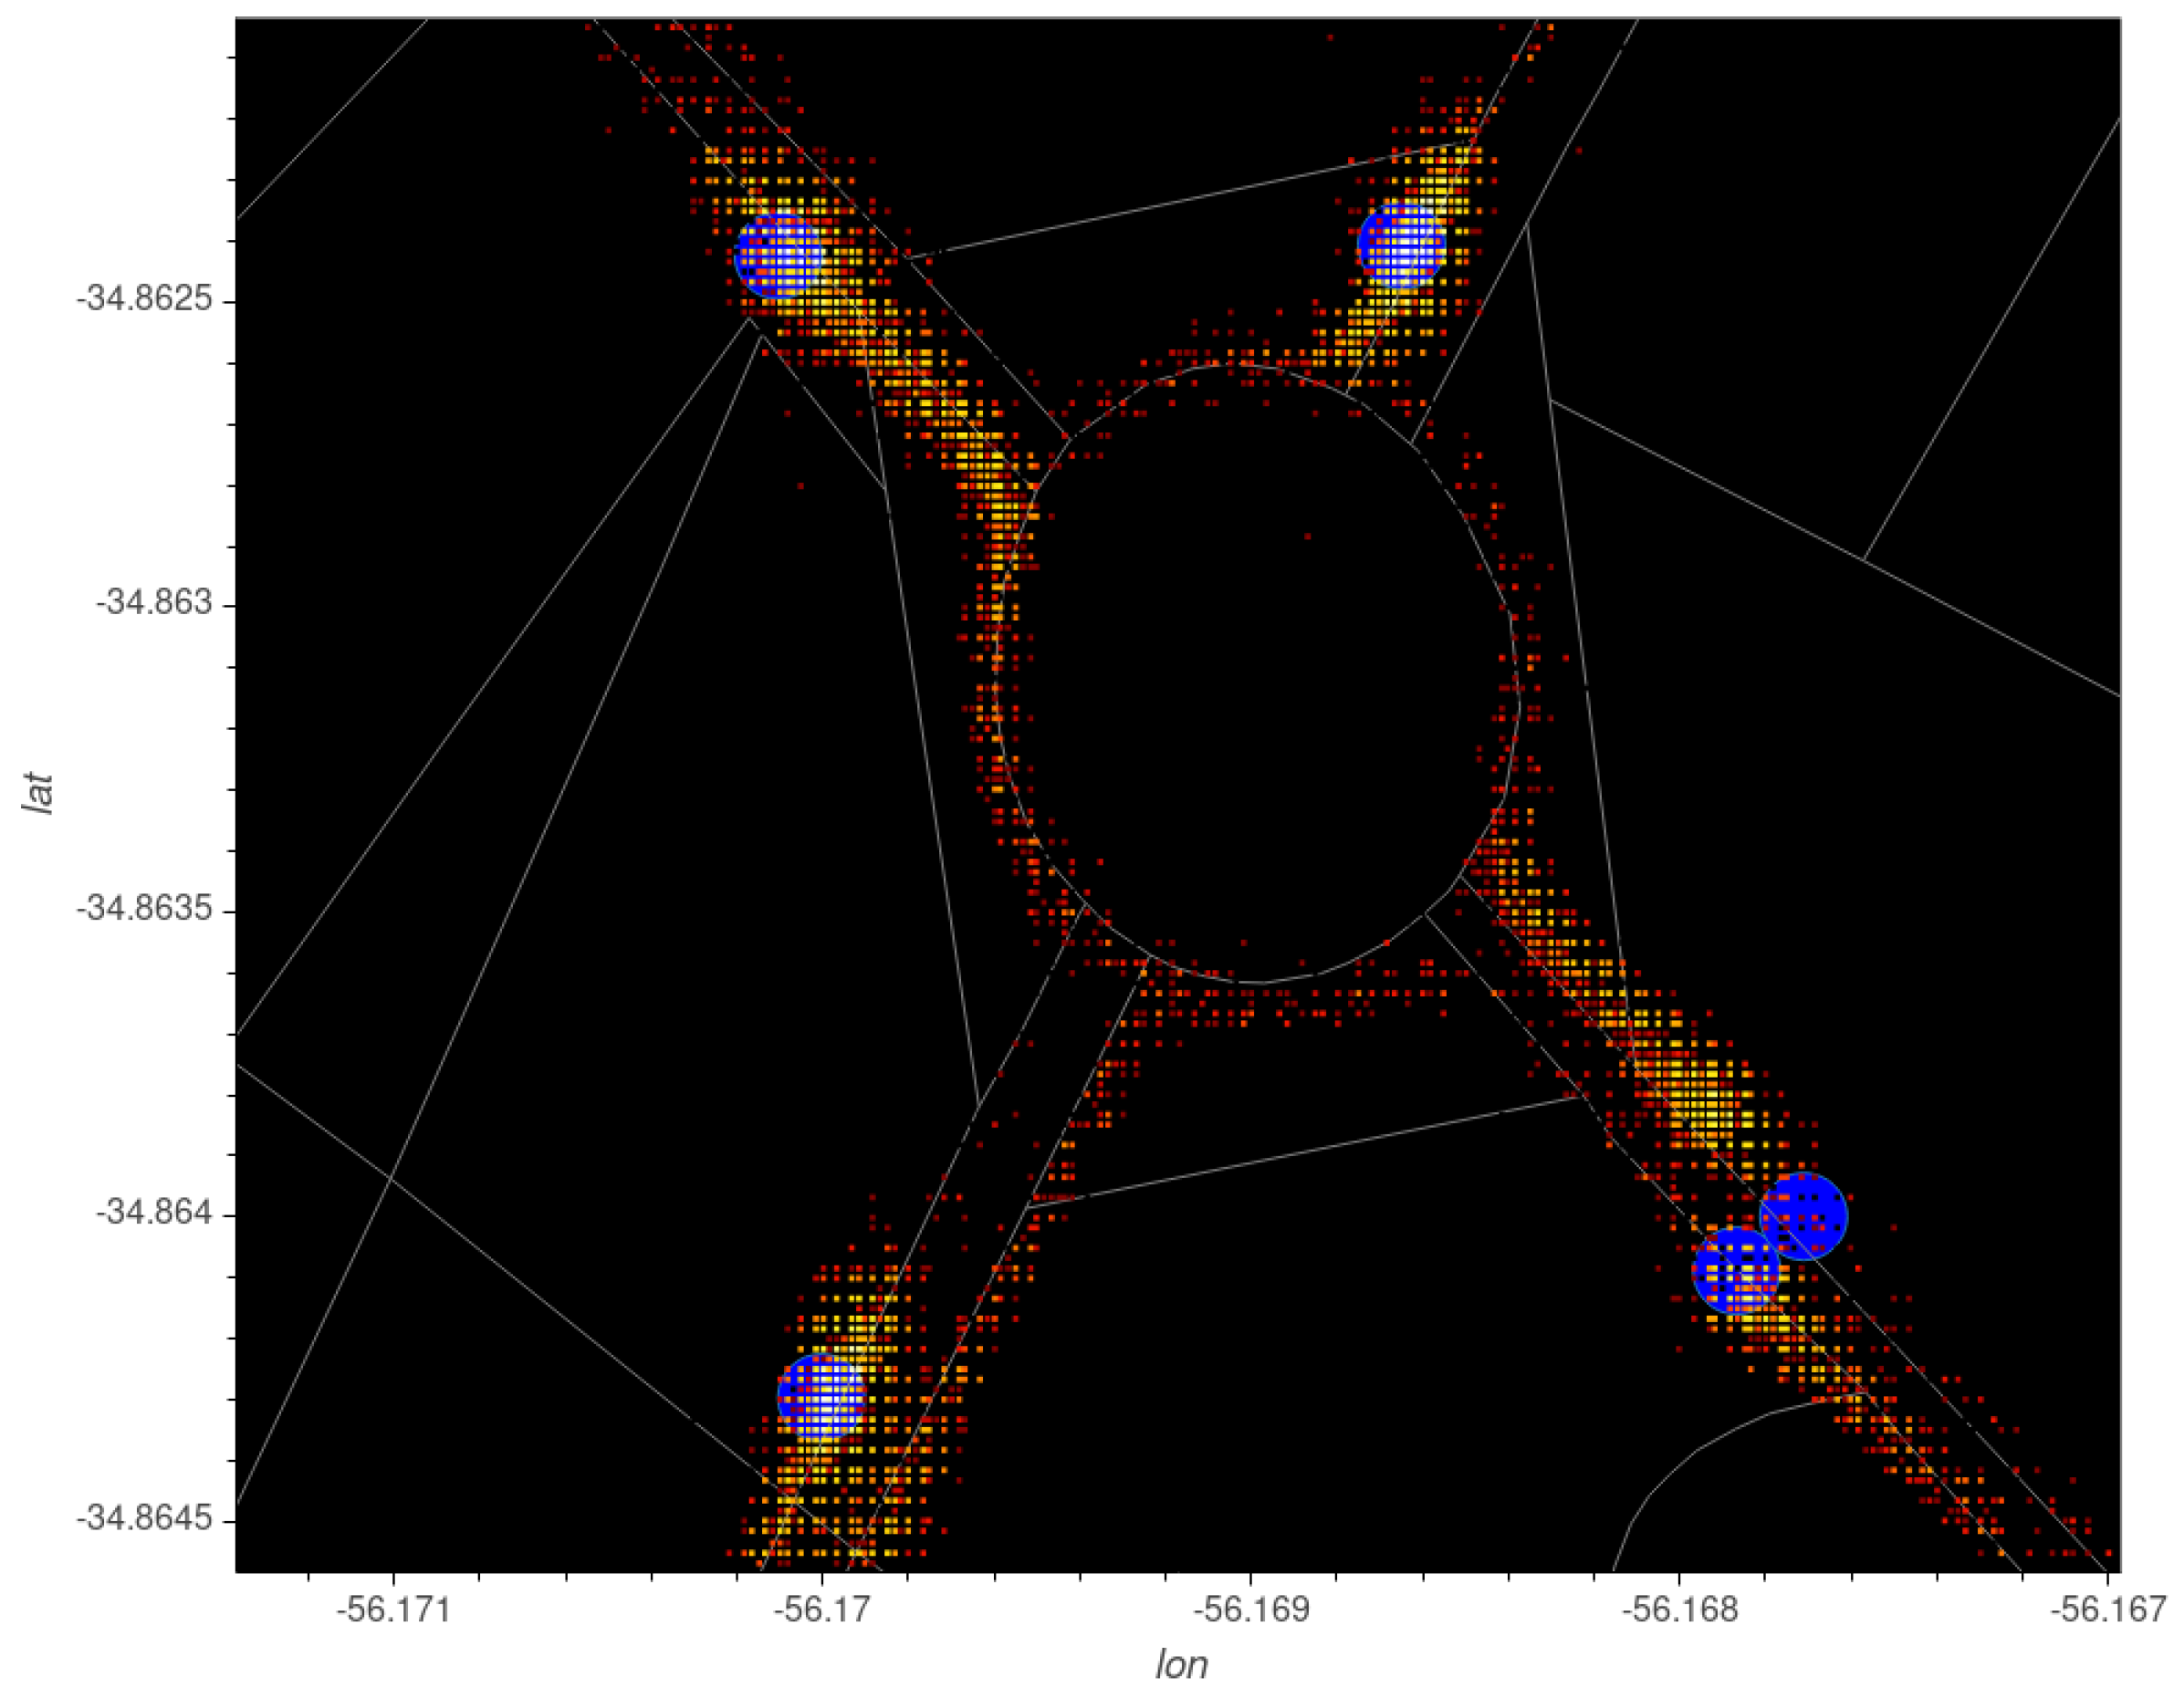
Another relevant application of urban data analysis is related to safety in the public transportation service. The heatmap on Figure 12 reports the location of smartcard transactions near a roundabout. The bus stops nearby are marked in blue. The figure shows that a large number of transactions are recorded when the bus is within the roundabout. This action might be related to a relevant safety issue, since passengers validate their cards standing in front of the ticket machine. Furthermore, this driving pattern is related to a more serious safety issue in those buses where drivers are also in charge of operating the smart card terminal and selling tickets, as in more than 60% of the bus fleet in Montevideo. Data analysis can be applied to analyze and audit driving behavior, to detect anomalous situations that can impact on safety. This way, the proposed methodology helps improving the safety of passengers, bus drivers, pedestrians, and drivers of other vehicles.
4. Origin-Destination Matrices Estimation
This section outlines the details of the generation of OD matrices using data from the ITS in Montevideo, Uruguay. Section 4.1 describes the destination estimation algorithm used to build OD matrices. Then, Section 4.2 presents the computed OD matrix and its validation against a mobility survey is presented in Section 4.3. Finally, an online visualization tool for the computed OD matrix is outlined in Section 4.4.
4.1. Implemented Solution
This subsection presents the destination estimation algorithm using trip chaining and its adaptation to the case study of the ITS in Montevideo.
4.1.1. Destination Estimation Algorithm
The origin of trips is identified by combining smart card and GPS location data, since the location of the bus is recorded whenever a passenger pays for a ticket using a smart card. However, since passengers are only required to validate their smart cards when boarding and not when alighting the bus, the destination of each trip is unknown and must be estimated in order to generate OD matrices.
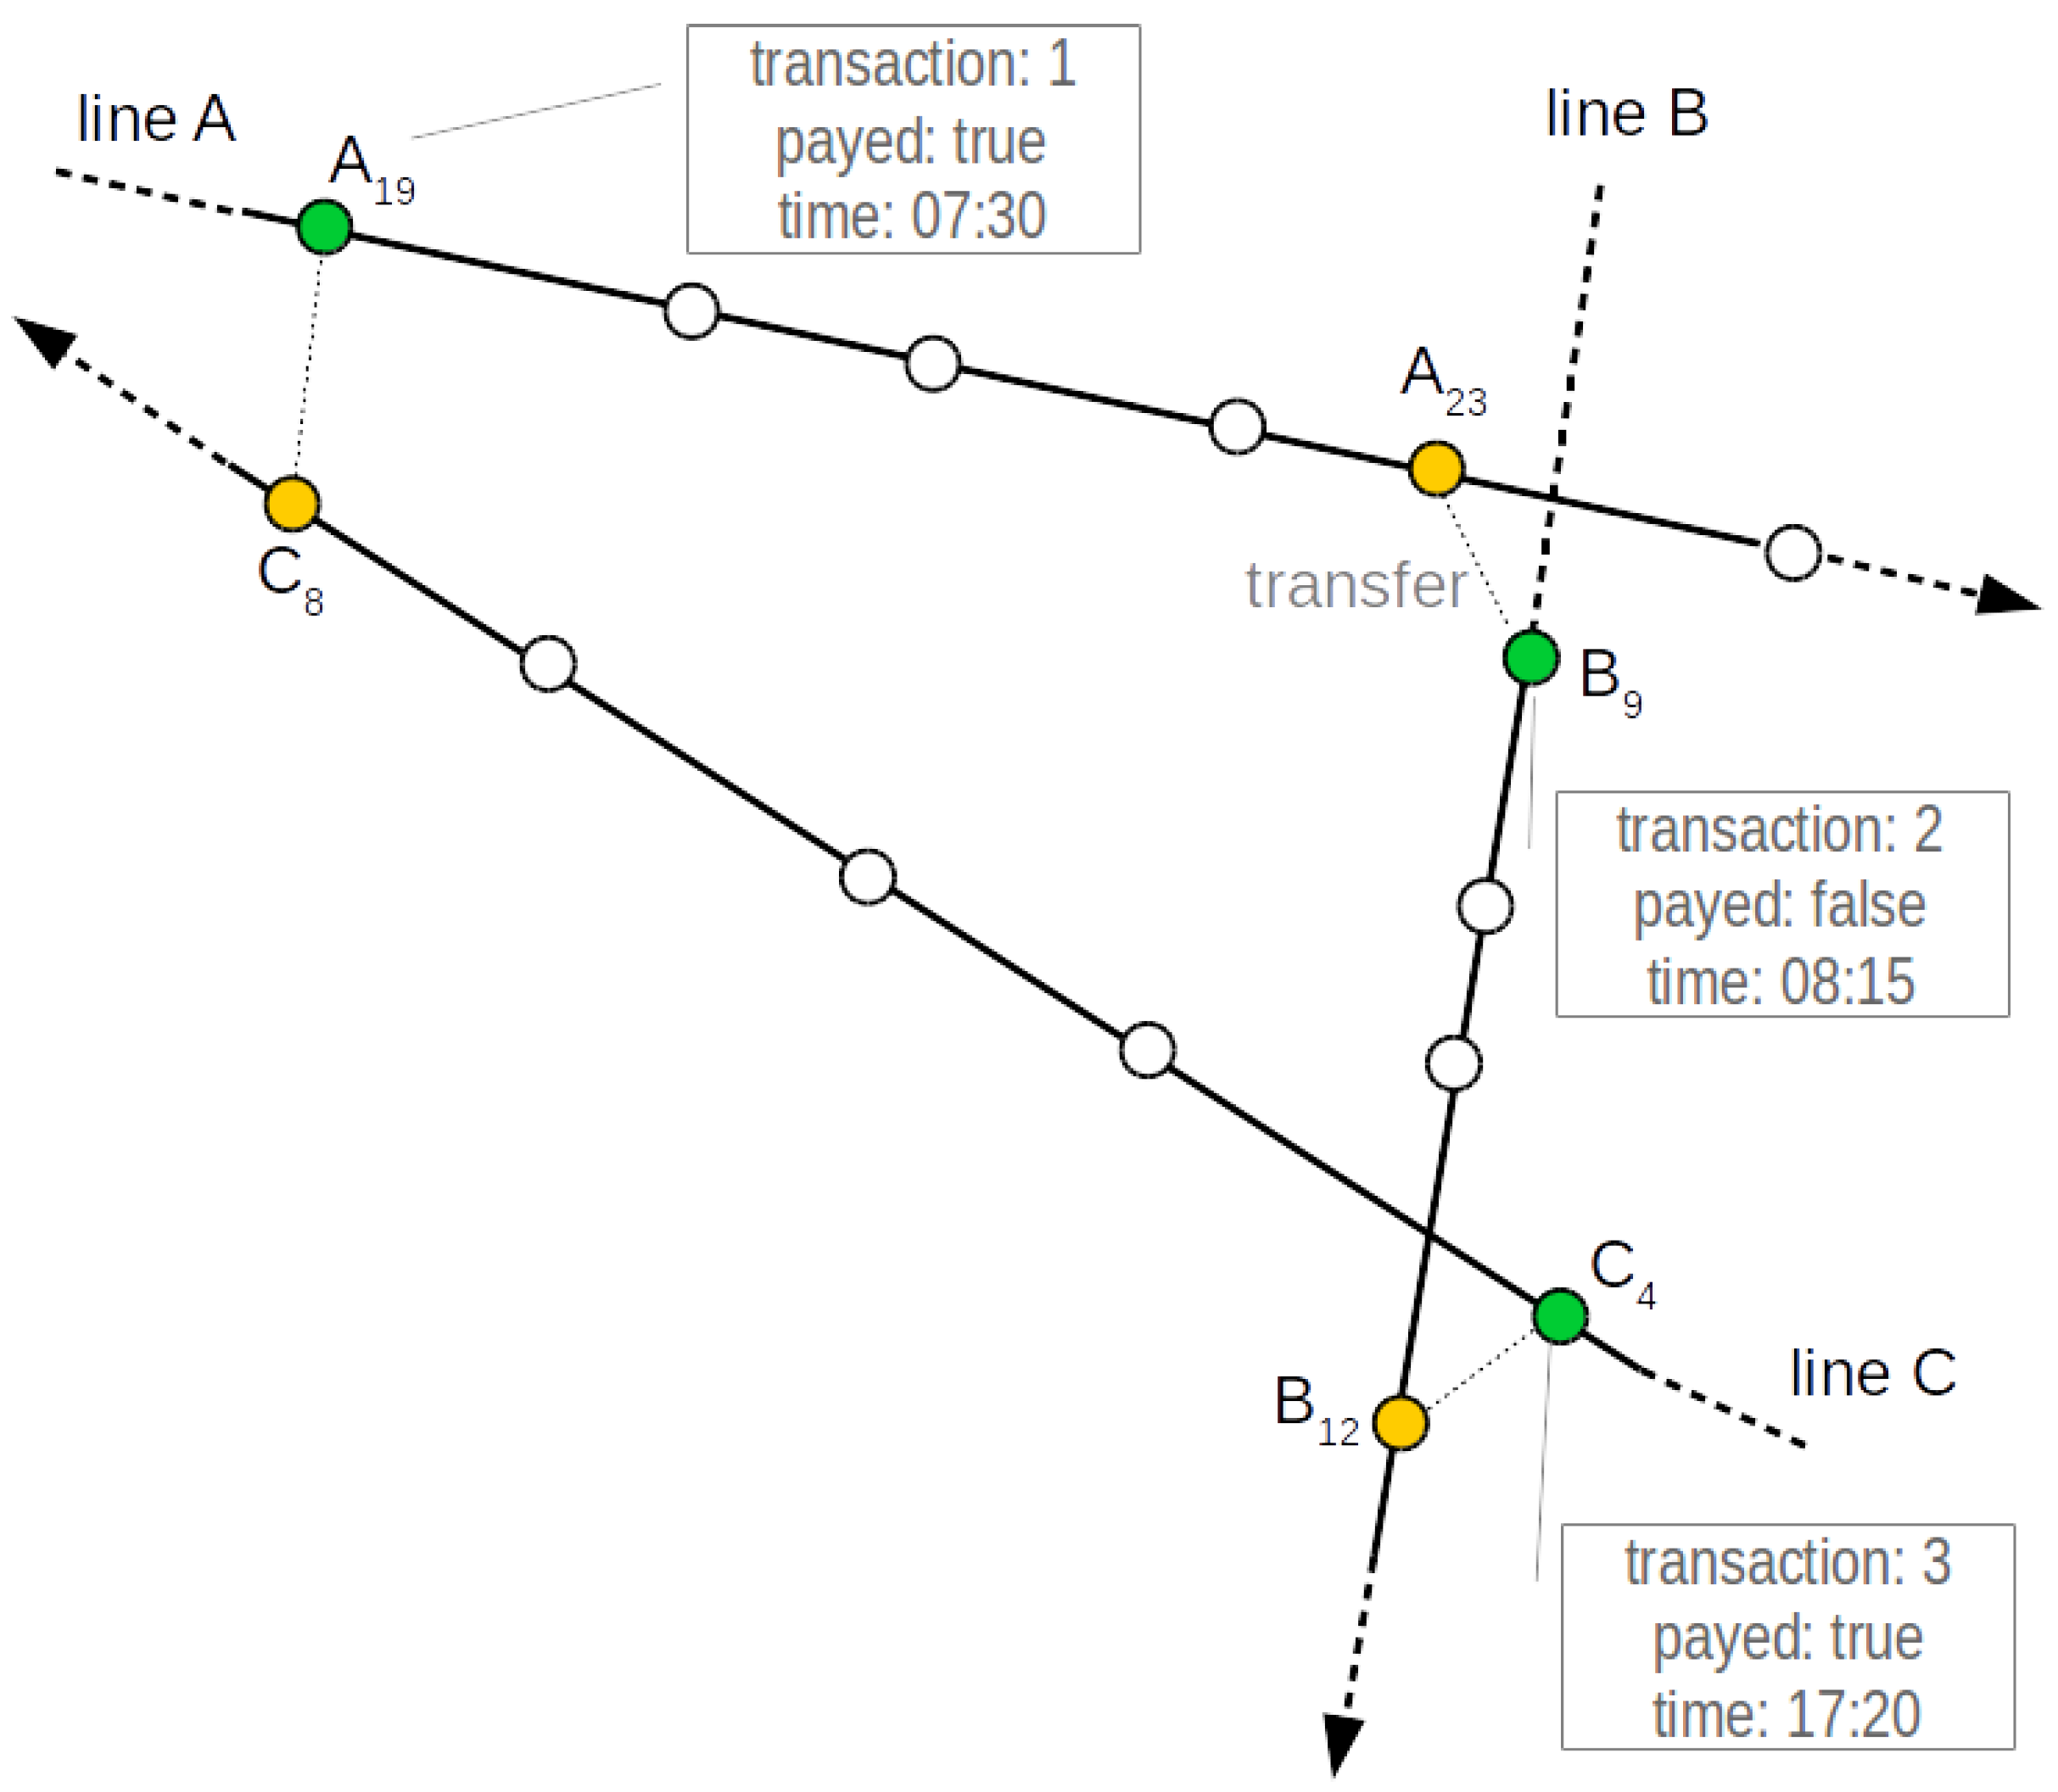
A destination estimation algorithm was developed based on the assumptions of the trip chaining method: (i) the origin of a new trip is near the destination of the previous one; and (ii) at the end of the day, users return to the origin of their first trip of the day. Figure 13 shows an example of the proposed method: the passenger performs three smart card transactions throughout the day. The boarding bus stops associated to each transaction are marked in green, and the estimated destinations of trips and trip legs are marked in orange.
In the example, the first transaction of the day occurs at 07:30, when the passenger boards bus line A at bus stop . Later, at 08:15, the passenger boards bus line B at bus stop without paying for a new ticket. Since the boarding occurred within the validity of the previous ticket, the trip is assumed to be a transfer between buses. The closest stop from line A to bus stop is , which is assumed to be the destination of the leg trip starting at 07:30. The last transaction of the day occurs at 17:20, when the passenger boards line C at bus stop and pays for a new ticket. Bus stop is identified as the destination of the leg trip starting at 08:15, since it is the closest stop from line B to bus stop . Since a new ticket was payed for, no further transfers are considered. Thus, an OD pair is identified between bus stops and . Finally, the destination of the last trip of the day is assumed to be bus stop , since it is the closest bus stop of line C to the origin of the first transaction of the day (). As a result, two OD pairs are identified, one consisting of two leg trips with a bus transfer and the other being a direct trip.
4.1.2. Configuration for the ITS in Montevideo
The destination estimation algorithm processes sales data grouped in chunks corresponding to 24 h periods. Records are split at the time of the day when the lowest sales activity is observed, as recommended by Munizaga et al. [15]. In the studied scenario, the lowest amount of sales occurs at 3:00.
The destination estimation algorithm limits the search of a possible destination bus stop to a configurable radius. The search is sensitive to this parameter: large values may incorrectly identify destinations when other transport modes are used within the chain of bus trips, while a small radius might miss to identify destinations for trips that involve large walks from the bus stop to the destination. In the reviewed works of the related literature, several values were found for this parameter: 800 m [16], 1000 m [13,14], and 2000 m [12]. In this work the maximum distance to search for a destination bus stop was set to 1000 m, which is the median of the values found in the related literature. Additionally, 1000 m is also the maximum distance used to classify a walk as “short” according to the urban mobility survey [23].
4.2. Numerical Results
After the cleansing process, 311,772 records were discarded from the dataset corresponding to May 2015, leading to a cleansed dataset comprised of 20,048,063 records. For the destination estimation process, this dataset was split into chunks, where each chunk held the information for an entire day starting and ending at 3:00. Additionally, since the destination estimation algorithm requires at least two transactions to perform trip-chaining, the records associated to cardholders that only performed one transaction within a given day were filtered from the dataset. As a result, the destination estimation algorithm was applied to a set of 18,885,711 records. Out of these records, the implemented algorithm was able to assign a destination to 15,414,230 trips, achieving a success rate of . This is a highly competitive result, considering the success rates achieved by other works in the related literature, e.g., 57% [13], 66% [12], 80% [14]. Each identified trip holds the following information: boarding bus stop, time stamp at boarding, bus line identifier, and alighting bus stop.
Computed results allowed identifying 9,485,904 OD pairs. At the finest grain, OD matrices were generated considering each pair of bus stops (size 4718 × 4718). At a more coarse grain, OD matrices were built at the census tract level (size 1063 × 1063). Both OD matrices are available at www.fing.edu.uy/~renzom/msc in CSV files with their corresponding metadata. For the sake of visualization, OD matrices in this article are aggregated by municipality (size 8 × 8). Table 2 outlines the estimated OD matrix corresponding to the studied dataset (each municipality is represented by its identifying code).
The largest values are located in the diagonal of the computed OD matrix, which represent trips starting and ending within the same municipality. Municipality B stands out as both the largest generator and attractor of trips when considering the total number of OD pairs. This is consistent with the fact that the city center and other surrounding areas are within municipality B, where multiple workplaces, public offices, and services are located. Considering that most trips correspond to people commuting to their workplaces (30.9% according to the 2016 mobility survey), these observations could suggest that the majority of citizens work either within their own municipalities or travel to municipality B where most job opportunities are located. The lowest number of transactions occur in municipalities F and G, which have large rural areas with lower population density.
4.3. Comparison to the 2016 Mobility Survey
According to the best practices reviewed in the related literature, results of the OD matrix estimation must be compared with other sources of information. To this end, the results from the household urban mobility survey carried out in 2016 [23] were used. The comparison is done at the municipality level, since the survey data does not allow comparing at a finer-grain. The unavailability of more disaggregated sources of OD data somewhat limits the comparison with our proposed OD matrix.
The Spearman correlation coefficient was applied to quantify the similarities between the OD matrix estimated from ITS data and the OD matrix from the mobility survey. To compute this coefficient, matrices were vectorized in row-major order, without losing information since proximity in the matrix does not imply geographical proximity between municipalities. Results show that the estimated OD matrix and the mobility survey OD matrix have a Spearman correlation coefficient of (p-value ), indicating a strong correlation between them, thus validating the proposed approach for OD matrix estimation based on ITS data.
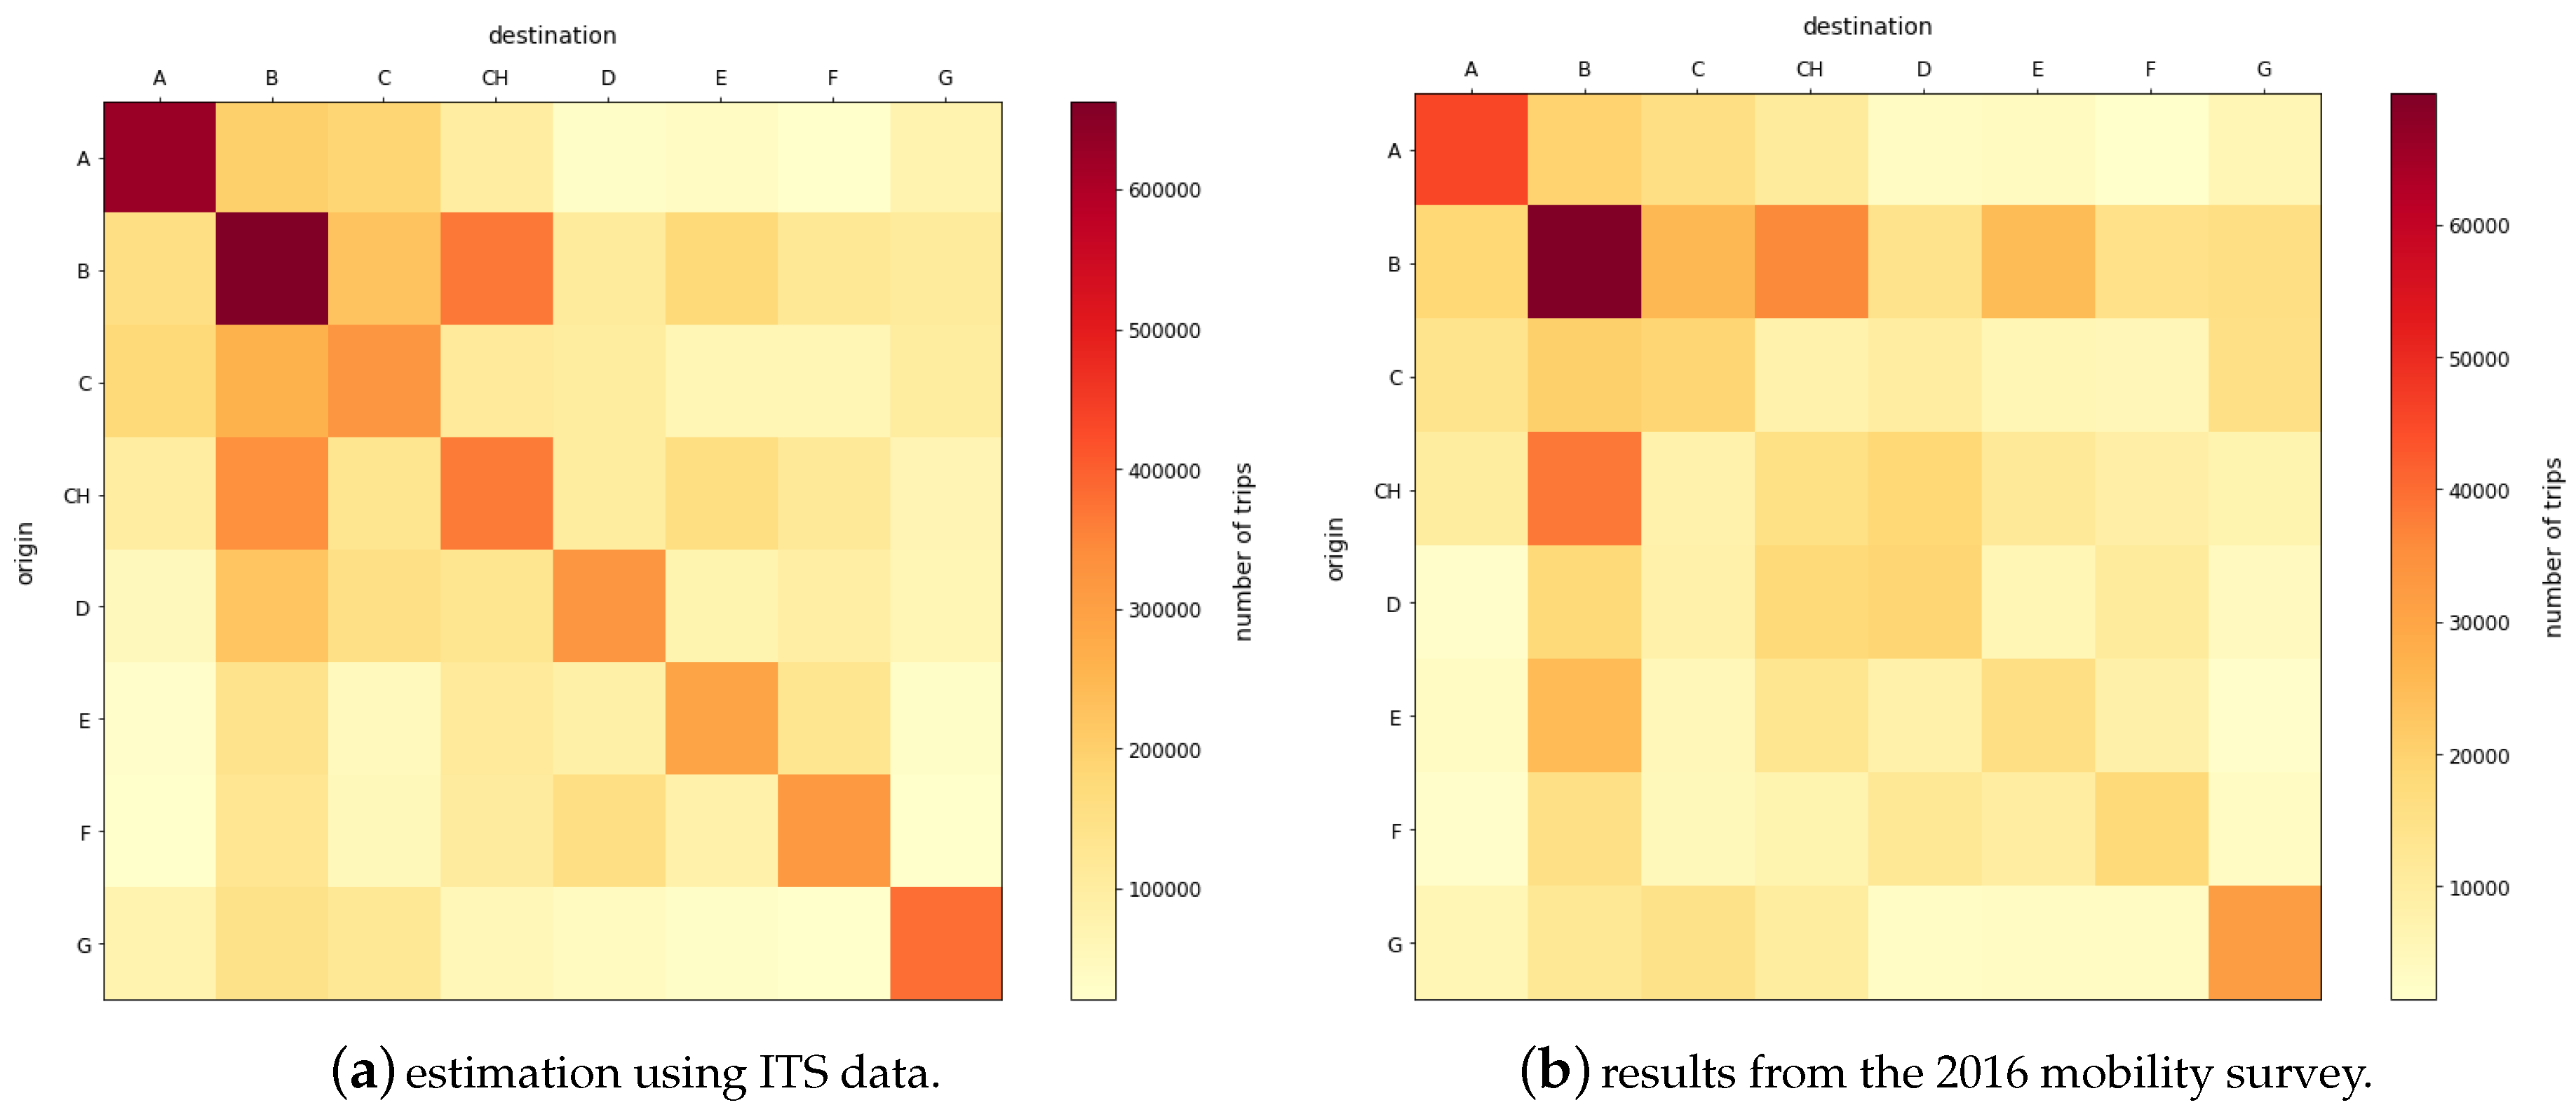
Figure 14 presents a visual comparison between the OD matrices derived from ITS data and from the mobility survey. Each OD matrix is represented as a two-dimensional grid with colors mapped according to the number of transactions occurring in each OD pair.
The visual representation of OD matrices as heatmaps on two-dimensional grids in Figure 14 allows identifying similarities between the results computed with ITS data and those from the mobility survey. Trips within municipalities A and B are the most dominant according to both estimations, followed by trips within municipality G. Both figures show that trips from B to CH and vice versa are also highly dominant. The diagonal of the grid is mapped to more intense colors in Figure 14a than in Figure 14b. This might be a consequence of the larger number of trips considered in the OD matrix generated from ITS data. Despite this observation, an outstanding number of similar patterns are found when comparing the grids both row-wise and column-wise.
Results show that OD matrices generated from ITS data are a valid alternative to understand mobility in a city. The proposed approach for building OD matrices has several advantages: (i) due to the large volume of data generated by ITS compared to the number of individuals that participate in a survey, a finer-grain OD matrix is obtained using data analysis (e.g., bus stop and census tract levels), whereas the mobility survey results only apply to municipalities; and (ii) data analysis allows computing different OD matrices applying different criteria (e.g., days of the week, hours of the day, etc) and the mobility survey refers to working days only. Thus, in order to gain insight on the mobility of citizens under different conditions (e.g., during weekends) a new survey ought to be carried out, with the associated costs and delays.
Regarding costs, the proposed approach for OD matrix estimation provides an attractive alternative for public administrations to characterize mobility in a city. This alternative takes advantage of valuable data that arise from the infrastructure deployed in modern ITS. This is the case of Montevideo, where the ITS infrastructure has been deployed in the last decade. It is worth noting that the proposed approach can be easily applied whenever new data becomes available. This represents a clear advantage in comparison to surveys, which demand a long time to plan, carry out the survey, and process the results. As a consequence, the proposed approach allows easily obtaining an up-to-date view on the mobility of a city while surveys offer a partial and mostly outdated picture.
4.4. OD Matrix Visualization Tool
The last step of every urban data analysis workflow involves presenting results visually to communicate the main findings to help stakeholders make decisions that can shape the studied reality [6]. For this purpose, an interactive web application was developed to show the computed OD matrices in an intuitive and friendly manner.
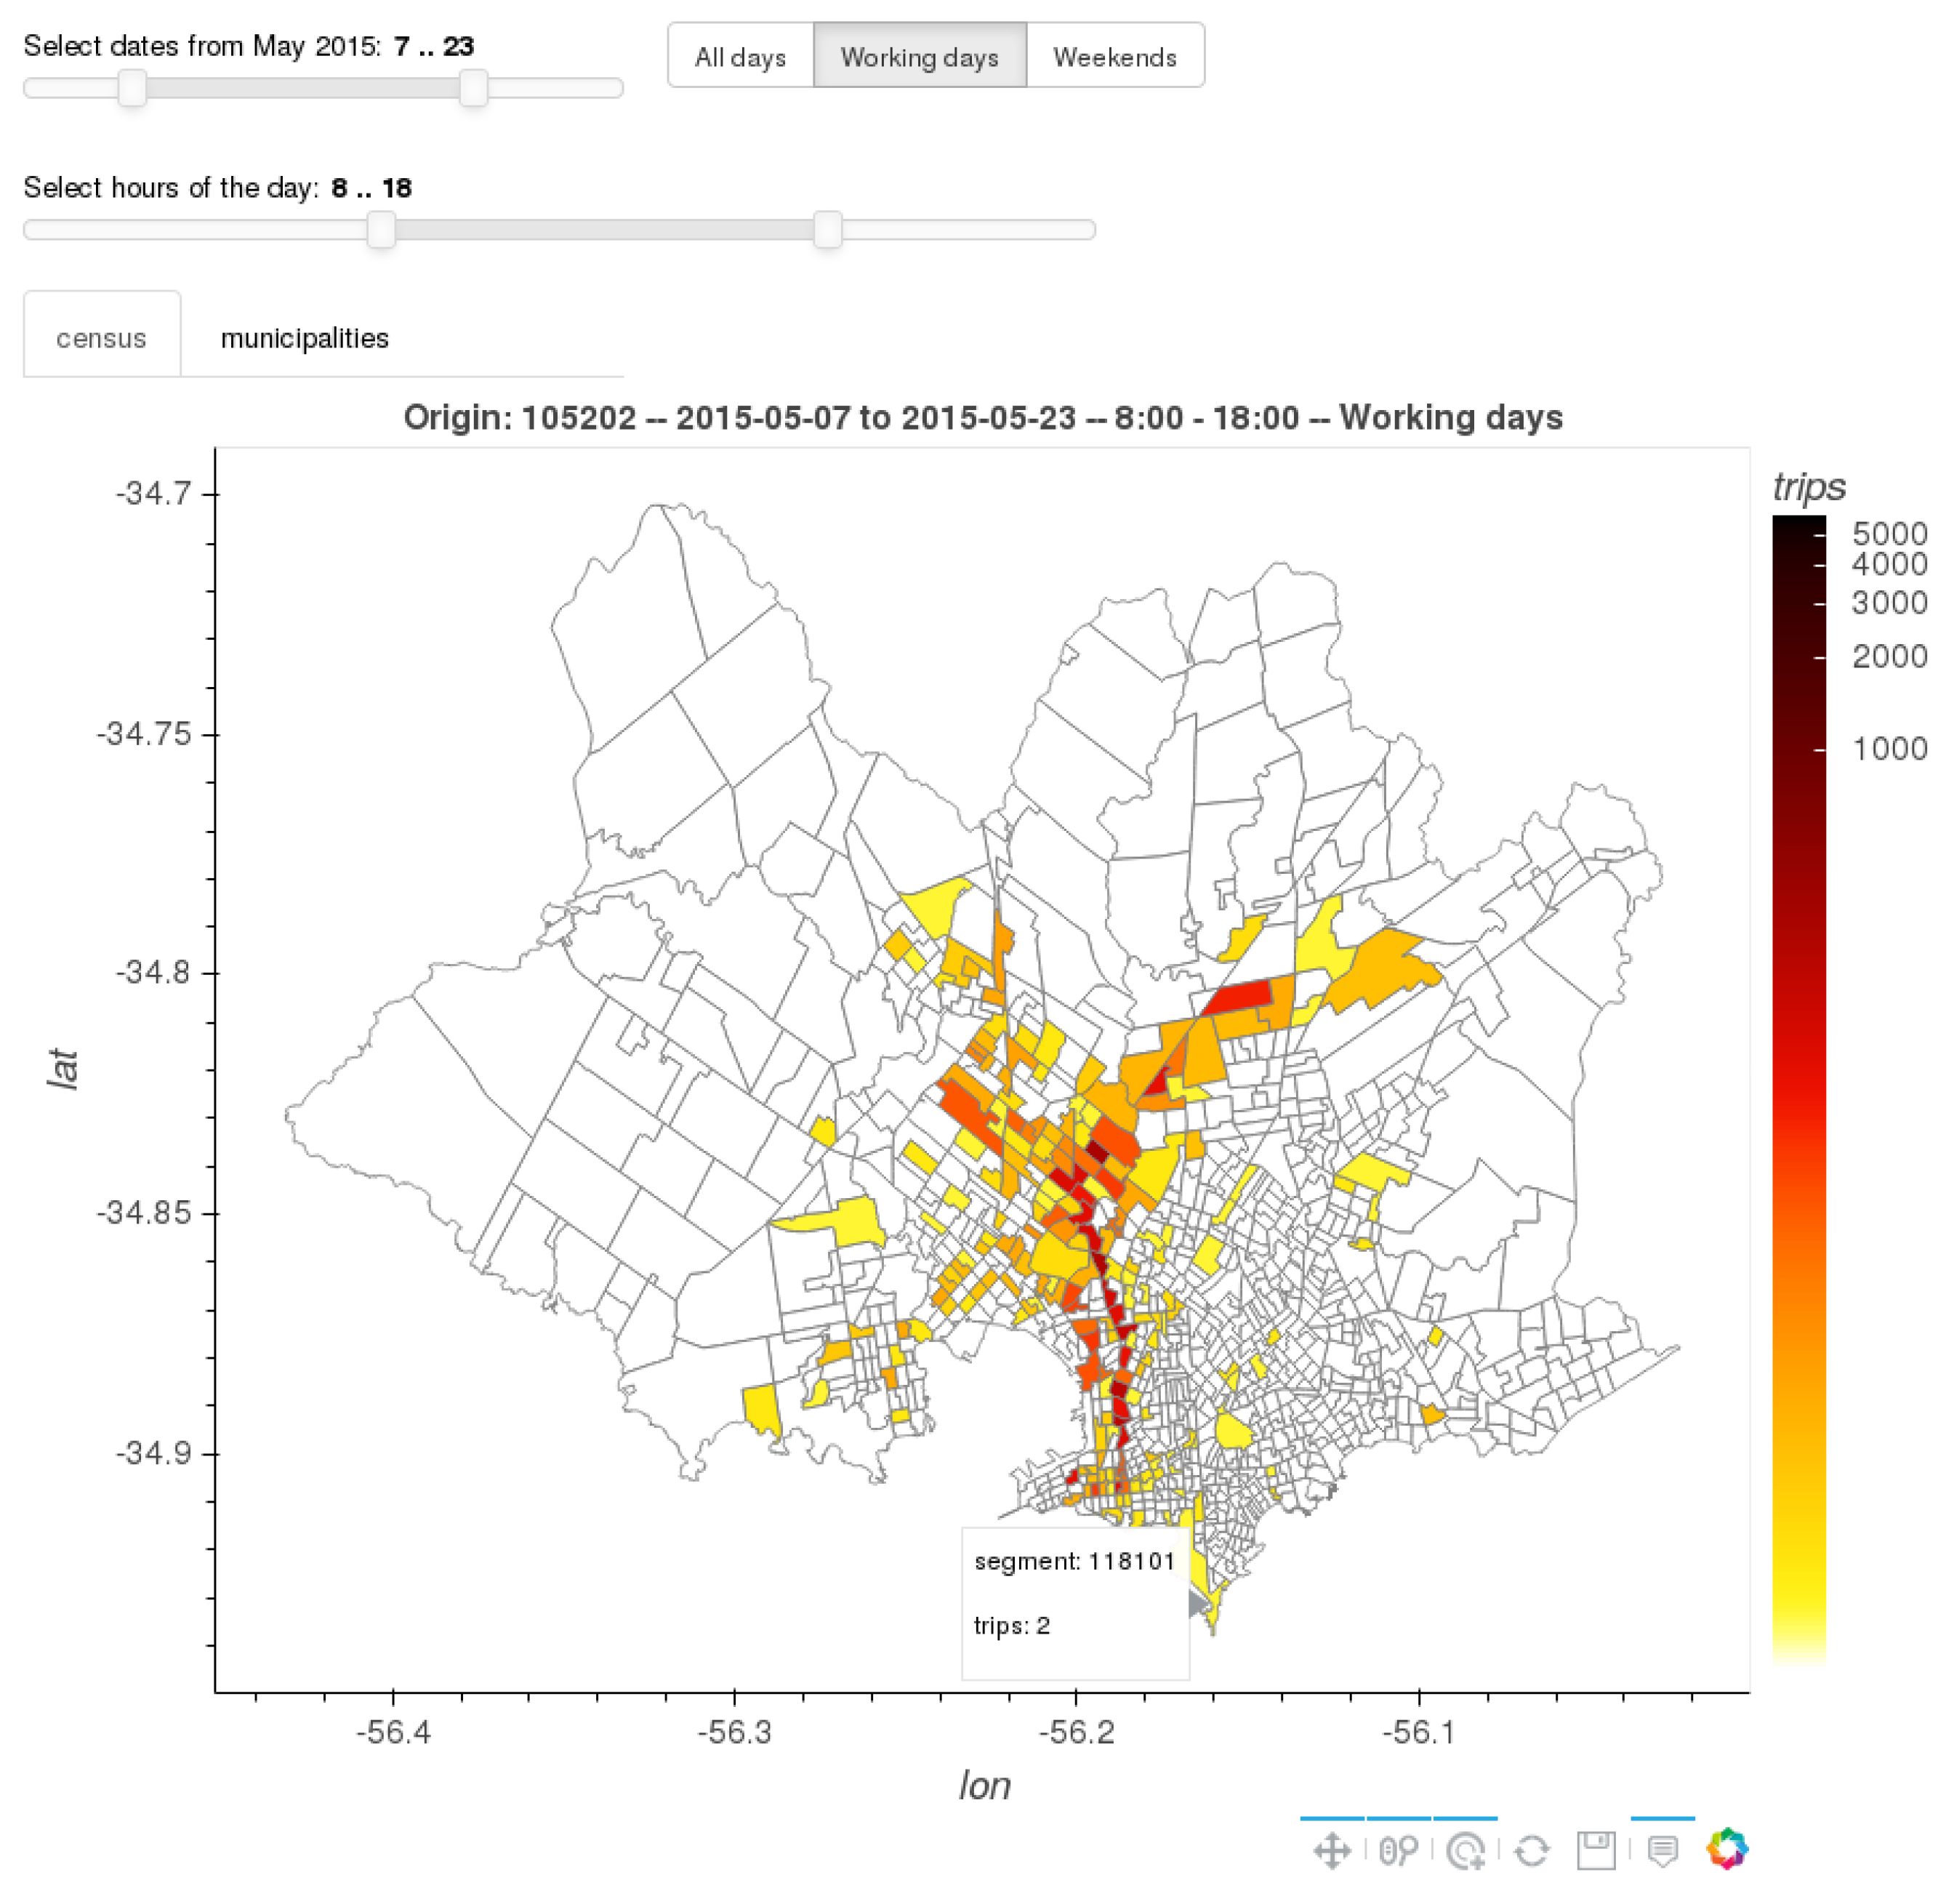
The OD visualization tool allows selecting a geographical zone and creates a heatmap indicating the number of passengers traveling from the selected area to all other areas in the map. The tool was developed using open source software: Python, Pandas for data processing, Geopandas to display the map of the city and the administrative divisions, and the Bokeh library to provide interactivity to the visualization. The web application is freely available at www.fing.edu.uy/~renzom/msc. Figure 15 shows the user interface of the developed tool.
5. Conclusions and Future Work
This article presented an urban data analysis approach to study mobility using ITS data. As a case study, the ITS in Montevideo, Uruguay was analyzed by studying a dataset of GPS bus location and smart card ticket sales. Several insights were obtained through data analysis, including: number of passengers traveling with the same smart card, frequency of use of the smart cards, and number of bus transfers. A temporal analysis of ticket sales was performed, identifying three peak hours during working days. Then, a spatiotemporal analysis revealed that citizens from areas farther away from the coastline start trips earlier than those near the coast. Additionally, two practical use cases were presented: event detection in the city and reckless driving behavior identification.
Besides a purely descriptive utilization of ITS data to characterize a public transportation system, a methodology for building OD matrices using trip chaining was applied to estimate destinations. The implemented algorithm was able to estimate the destination for 81.62% of trips in the studied dataset, a highly competitive result when compared to the ones reported in the related literature.
The OD matrix computed for Montevideo was compared against the one from the 2016 urban mobility survey. Results showed a Spearman correlation coefficient of 0.895, suggesting that the proposed approach is a valid alternative to understand mobility in the city. The proposed approach allows studying mobility at a finer grain, obtaining OD matrices between pairs of bus stops and census tracts, whereas the OD matrix from the mobility survey only applies to municipalities. The implemented solution is inexpensive if the ITS infrastructure is already deployed and it allows computing OD matrices considering different criteria and providing up-to-date mobility information.
An interactive web application was developed to visually display the computed OD matrices. The visualization tool allows selecting a geographical area and displays a heatmap indicating the number of passengers traveling from the selected area to all other in the city. The application supports working at different aggregation levels for OD matrices and offers several tools to filter data.
The main lines for future work include studying other interesting aspects of mobility in the city, e.g., the quality of service offered by the transportation system in terms of punctuality, frequency of lines, and load of passengers. Regarding OD matrices estimation, the proposed approach can be extended to tickets sold without smart cards, to account for all passengers of the transportation system. The destination estimation algorithm can be further refined by using historical passenger data and machine learning techniques to infer frequent destinations when trip chaining fails. Furthermore, activity detection could be used to discriminate between short individual trips using the same ticket from multi-leg trips involving bus transfers [24]. Parameters tuning of the destination estimation algorithm can be studied in case that fine-grain mobility data sources are available. Finally, the results of the analysis can be applied to solve optimization problems, e.g., synchronization of bus schedules [25], demand-based fleet size optimization, bus stops location, and bus line network redesign.
Author Contributions
Conceptualization, R.M. and S.N.; writing, review, and editing, R.M. and S.N. Data analysis, R.M. All authors have read and agreed to the published version of the manuscript.
Funding
This research received no external funding.
Acknowledgments
The work of S. Nesmachnow has been partly supported by ANII and PEDECIBA, Uruguay. R. Massobrio would like to thank Fundación Carolina, Spain.
Conflicts of Interest
The authors declare no conflict of interest.
References
- Grava, S. Urban Transportation Systems; McGraw-Hill: New York, NY, USA, 2000. [Google Scholar]
- Deakin, M.; Waer, H.A. From intelligent to smart cities. Intell. Build. Int. 2011, 3, 140–152. [Google Scholar] [CrossRef]
- Figueiredo, L.; Jesus, I.; Tenreiro, J.; Ferreira, J.; Martins, J. Towards the development of intelligent transportation systems. In Proceedings of the 2001 IEEE Intelligent Transportation Systems, Oakland, CA, USA, 25–29 August 2001; pp. 1206–1211. [Google Scholar]
- Ortúzar, J.; Armoogum, J.; Madre, J.L.; Potier, F. Continuous Mobility Surveys: The State of Practice. Transp. Rev. 2011, 31, 293–312. [Google Scholar] [CrossRef]
- Massobrio, R.; Nesmachnow, S. Urban Data Analysis for the Public Transportation System of Montevideo, Uruguay. In Smart Cities; Nesmachnow, S., Hernández Callejo, L., Eds.; Springer: Cham, Switzerland, 2020; pp. 199–214. [Google Scholar]
- Schutt, R.; O’Neil, C. Doing Data Science: Straight Talk from the Frontline; O’Reilly Media, Inc.: Sebastopol, CA, USA, 2013. [Google Scholar]
- Tukey, J. Exploratory Data Analysis; Addison-Wesley Publishing Company: Boston, MA, USA, 1977. [Google Scholar]
- Ortúzar, J.; Willumsen, L. Modelling Transport; John Wiley & Sons: Hoboken, NJ, USA, 2011. [Google Scholar]
- Pelletier, M.P.; Trépanier, M.; Morency, C. Smart card data use in public transit: A literature review. Transp. Res. Part C Emerg. Technol. 2011, 19, 557–568. [Google Scholar] [CrossRef]
- Li, T.; Sun, D.; Jing, P.; Yang, K. Smart Card Data Mining of Public Transport Destination: A Literature Review. Information 2018, 9, 18. [Google Scholar] [CrossRef] [Green Version]
- Barry, J.; Newhouser, R.; Rahbee, A.; Sayeda, S. Origin and destination estimation in New York City with automated fare system data. Transp. Res. Rec. J. Transp. Res. Board 2002, 1817, 183–187. [Google Scholar] [CrossRef]
- Trépanier, M.; Tranchant, N.; Chapleau, R. Individual Trip Destination Estimation in a Transit Smart Card Automated Fare Collection System. J. Intell. Transp. Syst. 2007, 11, 1–14. [Google Scholar] [CrossRef]
- Wang, W.; Attanucci, J.; Wilson, N. Bus Passenger Origin-Destination Estimation and Related Analyses Using Automated Data Collection Systems. J. Public Transp. 2011, 14, 131–150. [Google Scholar] [CrossRef] [Green Version]
- Munizaga, M.; Palma, C. Estimation of a disaggregate multimodal public transport Origin-Destination matrix from passive smartcard data from Santiago, Chile. Transp. Res. Part C Emerg. Technol. 2012, 24, 9–18. [Google Scholar] [CrossRef]
- Munizaga, M.; Devillaine, F.; Navarrete, C.; Silva, D. Validating travel behavior estimated from smartcard data. Transp. Res. Part C Emerg. Technol. 2014, 44, 70–79. [Google Scholar] [CrossRef]
- Alsger, A.; Mesbah, M.; Ferreira, L.; Safi, H. Use of Smart Card Fare Data to Estimate Public Transport Origin–Destination Matrix. Transp. Res. Rec. J. Transp. Res. Board 2015, 2535, 88–96. [Google Scholar] [CrossRef]
- Instituto Nacional de Estadística, Uruguay. Resultados del Censo de Población 2011: PoblacióN, Crecimiento y Estructura por Sexo y Edad. Available online: http://www.ine.gub.uy (accessed on 30 December 2018).
- Catálogo de Datos Abiertos. Available online: https://catalogodatos.gub.uy/ (accessed on 16 July 2020).
- Sistema de Información Geográfica. Available online: http://sig.montevideo.gub.uy/ (accessed on 16 July 2020).
- Rahm, E.; Do, H.H. Data Cleaning: Problems and Current Approaches. IEEE Data Eng. Bull. 2000, 23, 3–13. [Google Scholar]
- Hernandez, D.; Hansz, M.; Massobrio, R. Job accessibility through public transport and unemployment in Latin America: The case of Montevideo (Uruguay). J. Transp. Geogr. 2020, 85, 102742. [Google Scholar] [CrossRef]
- Nesmachnow, S.; Baña, S.; Massobrio, R. A distributed platform for big data analysis in smart cities: Combining Intelligent Transportation Systems and socioeconomic data for Montevideo, Uruguay. EAI Endorsed Trans. Smart Cities 2017, 2, 1–18. [Google Scholar] [CrossRef] [Green Version]
- Mauttone, A.; Hernández, D.; Encuesta de Movilidad del área Metropolitana de Montevideo. Principales Resultados e Indicadores. 2017. Available online: http://scioteca.caf.com/handle/123456789/1078 (accessed on 30 December 2018).
- Nassir, N.; Hickman, M.; Ma, Z.L. Activity detection and transfer identification for public transit fare card data. Transportation 2015, 42, 683–705. [Google Scholar] [CrossRef]
- Nesmachnow, S.; Muraña, J.; Goñi, G.; Massobrio, R.; Tchernykh, A. Evolutionary Approach for Bus Synchronization. In High Performance Computing; Crespo-Mariño, J.L., Meneses-Rojas, E., Eds.; Springer: Cham, Switzerland, 2020; pp. 320–336. [Google Scholar]
Figure 1.
Data analysis workflow applied in this work.

Figure 2.
Percentage of households with one or more UBNs in Montevideo, Uruguay.

Figure 3.
Bus lines of the public transportation system of Montevideo, Uruguay.

Figure 4.
Aggregated sales with smart cards. Whiter pixels indicate more ticket sales, redder fewer ticket sales. Black pixels indicate no tickets were sold at that location.
Figure 4.
Aggregated sales with smart cards. Whiter pixels indicate more ticket sales, redder fewer ticket sales. Black pixels indicate no tickets were sold at that location.

Figure 5.
Distribution of daily smartcard transactions.

Figure 6.
Distribution of monthly smartcard transactions.

Figure 7.
Histogram of sales with smart cards at different times of the day.

Figure 8.
Spatiotemporal distribution of trips in Montevideo.

Figure 9.
Choropleth map of smart card transactions in the morning.

Figure 10.
Choropleth map of smart card transactions in the evening.

Figure 11.
Event detection: smartcard transactions at midnight near an outdoor venue.

Figure 12.
Driving behavior and safety: spatial distribution of smartcard transactions in a roundabout.
Figure 12.
Driving behavior and safety: spatial distribution of smartcard transactions in a roundabout.

Figure 13.
Example of the trip chaining algorithm to estimate destinations.

Figure 14.
Comparison of OD matrices (ITS data processing vs. mobility survey).

Figure 15.
User interface of the OD matrix visualization tool.


Table 1.
Descriptive statistics of daily and monthly smart card transactions.
| min | Q1 (25%) | Q2 (50%) | Q3 (75%) | max | MAD | ||
|---|---|---|---|---|---|---|---|
| all weekdays | daily | 1 | 2 | 2 | 4 | 54 | 1.2 |
| monthly | 1 | 8 | 22 | 47 | 528 | 22.5 | |
| working days | daily | 1 | 2 | 2 | 4 | 54 | 1.2 |
| monthly | 1 | 7 | 19 | 40 | 492 | 19.0 | |
| weekends | daily | 1 | 2 | 2 | 3 | 32 | 1.1 |
| monthly | 1 | 3 | 5 | 11 | 151 | 5.3 |
Table 2.
Estimated OD matrix by municipalities.
| Destination | ||||||||||
|---|---|---|---|---|---|---|---|---|---|---|
| A | B | C | CH | D | E | F | G | Total | ||
| origin | A | 626,388 | 199,196 | 184,905 | 98,087 | 30,108 | 40,370 | 21,875 | 73,390 | 1,274,319 |
| B | 154,358 | 662,993 | 224,578 | 366,865 | 108,640 | 173,898 | 119,306 | 108,469 | 1,919,107 | |
| C | 174,040 | 260,526 | 320,368 | 111,113 | 102,244 | 64,691 | 62,188 | 101,337 | 1,196,507 | |
| CH | 100,348 | 334,040 | 131,089 | 362,377 | 101,433 | 156,685 | 115,310 | 66,461 | 1,367,743 | |
| D | 48,502 | 222,110 | 148,581 | 130,733 | 321,610 | 71,018 | 93,969 | 64,253 | 1,100,776 | |
| E | 27,463 | 138,400 | 46,288 | 110,868 | 86,344 | 287,243 | 133,179 | 28,827 | 858,612 | |
| F | 21,038 | 127,429 | 51,570 | 108,017 | 155,355 | 82,811 | 315,573 | 20,427 | 882,220 | |
| G | 74,482 | 141,380 | 120,539 | 57,388 | 41,670 | 29,779 | 21,068 | 379,724 | 866,030 | |
| total | 1,226,619 | 2,086,074 | 1,227,918 | 1,345,448 | 947,404 | 906,495 | 882,468 | 842,888 | ||
© 2020 by the authors. Licensee MDPI, Basel, Switzerland. This article is an open access article distributed under the terms and conditions of the Creative Commons Attribution (CC BY) license (http://creativecommons.org/licenses/by/4.0/).
Share and Cite
MDPI and ACS Style
Massobrio, R.; Nesmachnow, S. Urban Mobility Data Analysis for Public Transportation Systems: A Case Study in Montevideo, Uruguay. Appl. Sci. 2020, 10, 5400. https://0-doi-org.brum.beds.ac.uk/10.3390/app10165400
AMA Style
Massobrio R, Nesmachnow S. Urban Mobility Data Analysis for Public Transportation Systems: A Case Study in Montevideo, Uruguay. Applied Sciences. 2020; 10(16):5400. https://0-doi-org.brum.beds.ac.uk/10.3390/app10165400
Chicago/Turabian StyleMassobrio, Renzo, and Sergio Nesmachnow. 2020. "Urban Mobility Data Analysis for Public Transportation Systems: A Case Study in Montevideo, Uruguay" Applied Sciences 10, no. 16: 5400. https://0-doi-org.brum.beds.ac.uk/10.3390/app10165400
Note that from the first issue of 2016, this journal uses article numbers instead of page numbers. See further details here.