Article

Driver Stress State Evaluation by Means of Thermal Imaging: A Supervised Machine Learning Approach Based on ECG Signal

by
Daniela Cardone
1,*,
David Perpetuini
1,
Chiara Filippini
1,
Edoardo Spadolini
2,
Lorenza Mancini
2,
Antonio Maria Chiarelli
1 and
Arcangelo Merla
1,2
1
Department of Neurosciences, Imaging and Clinical Sciences (DNISC), University G. d’Annunzio of Chieti-Pescara, 66100 Chieti, Italy
2
Next2U s.r.l., 65127 Pescara, Italy
*
Author to whom correspondence should be addressed.
Submission received: 14 July 2020 / Revised: 10 August 2020 / Accepted: 13 August 2020 / Published: 15 August 2020
(This article belongs to the Special Issue Ubiquitous Technologies for Emotion Recognition)

Abstract

:

Featured Application

A procedure for a driver’s stress state monitoring was provided by means of thermal infrared imaging. It was validated on ECG-derived parameters through the application of supervised machine learning techniques.

Abstract

Traffic accidents determine a large number of injuries, sometimes fatal, every year. Among other factors affecting a driver’s performance, an important role is played by stress which can decrease decision-making capabilities and situational awareness. In this perspective, it would be beneficial to develop a non-invasive driver stress monitoring system able to recognize the driver’s altered state. In this study, a contactless procedure for drivers’ stress state assessment by means of thermal infrared imaging was investigated. Thermal imaging was acquired during an experiment on a driving simulator, and thermal features of stress were investigated with comparison to a gold-standard metric (i.e., the stress index, SI) extracted from contact electrocardiography (ECG). A data-driven multivariate machine learning approach based on a non-linear support vector regression (SVR) was employed to estimate the SI through thermal features extracted from facial regions of interest (i.e., nose tip, nostrils, glabella). The predicted SI showed a good correlation with the real SI (r = 0.61, p = ~0). A two-level classification of the stress state (STRESS, SI ≥ 150, versus NO STRESS, SI < 150) was then performed based on the predicted SI. The ROC analysis showed a good classification performance with an AUC of 0.80, a sensitivity of 77%, and a specificity of 78%.

1. Introduction

According to the latest estimates by the World Health Organization, approximately 1.35 million people die each year from road traffic accidents and between 20–50 million people suffer from non-fatal injuries [1].
Advanced driver-assistance systems (ADAS) are designed to support humans during the driving process, leading to an increase in road safety. Conventional ADAS technologies are mainly based on controlling the vehicle state through proprioceptive (i.e., Odometry, inertial sensors) and exteroceptive sensors (i.e., Lidar, vision sensors, radar, infrared, and ultrasonic sensors) [2]. These state-of-the-art technologies allow for the recognition of objects [3], alerting the driver about dangerous road conditions [4], providing driver tips to improve their driving comfort and safety [5], recognizing traffic activity and behavior [6], and detecting risky driving conditions [7].
In addition to factors currently evaluated by ADAS technologies, it is also of fundamental importance to monitor the driver’s psycho-physiological state that is strictly related to driving performance as reported by National Highway Traffic Safety Administration (NHTSA) [8]. According to the latest estimation by the NHTSA [8], in the USA, more than 2800 people died and approximately 400,000 people were injured in crashes induced by distracted driving in 2018. In particular, driver drowsiness/fatigue and emotion (i.e., visible anger, sadness, crying, and/or emotional agitation) can increase the risk of car accidents by 3.4 and 9.8 folds, respectively [9].
Driver state monitoring is mainly based on two categories of approaches that depend on the nature of the data collected [10]. The first approach, named the behavioral method, is based on monitoring a driver’s parameters including gaze direction, blinking frequency, percentage of eye closure (PERCLOS), yawning, and head pose. These parameters are evaluated by means of one or multiple visible cameras. This procedure, based on cameras, is indeed contactless and non-invasive, but it is characterized by relevant technical challenges derived from occlusion, illumination variation, and personal privacy issues. Nonetheless, because of its utility, it is often employed in the automobile industry. The second approach, labeled the physiological method, is instead based on monitoring driver’s vital signals, such as those derived from electrocardiography (ECG) [11], photoplethysmography (PPG) [12], electrooculography (EOG) [13], electroencephalography (EEG) [14], galvanic skin response (GSR) [15], and electromyography (EMG) [12].
With focus on driver stress, it is known that a high stress state decreases decision-making capabilities and situational awareness, impairing driving performance [16]. Electroencephalography has been widely employed to monitor drivers’ stress. In particular, human stress can be inferred by measuring an increase in heart rate as well as by measuring variations of parameters associated to heart rate variability (HRV) which, in turn, can dynamically reflect the accumulation of mental workload [17]. Among the variety of indices derived from ECG signals, Baevsky [18] proposed the Stress Index (SI) which is indicative of both sympathetic activity and central regulation.
Although the SI is a sensitive and specific metric to stress, it is based on contact-based technology (e.g., ECG). Indeed, to ensure comfort and non-intrusiveness for drivers, the use of contact sensors for data collection should preferably be avoided. Infrared (IR) or thermal imaging is a passive technology able to evaluate the spontaneous emission of body thermal energy and measure the temperature in a contactless manner. Infrared imaging indeed allows to overcome the limitations of contact devices and, importantly, in comparison with visible cameras, is not affected by illumination and can work in a completely dark environment.
Relevantly to the topic of this study, IR imaging allows to infer the peripheral autonomic activity through the modulation of the cutaneous temperature, which is a known expression of the psycho-physiological state of the subject [19,20]. In fact, experienced emotions, including stress or fatigue, can produce changes in skin temperature [21,22,23]. Particularly, there is great attention in this research field on stress and mental workload monitoring using thermal IR imaging. Puri et al. [24] studied computer users’ stress, reporting an increased blood flow in the frontal vessels of the forehead during stressful situations. The thermal metric was shown to be correlated with stress levels in 12 participants performing a Stroop test (r = 0.9, excluding one outlier). Pavlidis and colleagues [25] tried to assess the stress level by measuring transient perspiratory responses on the perinasal area using thermal IR imaging. These metrics proved to be a good indicator of stress response, because they were sympathetically driven. The authors applied this approach in the context of surgical training, finding a very high correlation between the GSR (galvanic skin response) and the thermal measurement on the finger (r = 0.968) and on the perinasal region (r = 0.943). Kang et al. [26] used thermal IR imaging to assess affective training times by monitoring the cognitive load through facial temperature changes. Learning proficiency patterns were based on an alphanumeric task. Significant correlations, ranging from r = 0.88 to r = 0.96, were found between the nose tip temperature and the response time, accuracy, and the Modified Cooper Harper Scale ratings. Stemberger et al. [27] presented a system for the estimation of cognitive workload levels based on the analysis of facial skin temperature. Beyond thermal infrared imaging of the face, the system relied on head pose estimation, measurement of the temperature variation across regions of the face, and an artificial neural network classifier. The system was capable of accurately classifying mental workload into high, medium, and low levels 81% of the time.
Given the advantages of the use of thermography in driver state monitoring, a relevant number of scientific works on this research field are available. Most of these publications concern driver drowsiness/fatigue monitoring and emotional state detection. Ebrahimian-Hadikiashari et al. [28] investigated driver drowsiness by analyzing the breathing function, monitored by thermography. The authors observed a significant decrease of driver respiration rate from extreme drowsiness to wakefulness conditions. Moreover, Knapik et al. [29] presented an approach for the evaluation of driver’s fatigue, based on yawn detection using thermal imaging. Zhang et al. [30] demonstrated the feasibility of discriminating emotions (e.g., fear versus no fear) by means of thermal imaging, assessing the forehead temperature as indicative for the emotional dimension of drivers’ fear. Focusing on driver stress monitoring, Yamakoshi et al. [31] combined measures from facial skin temperature and hemodynamic variables. The authors observed an increase of sympathetic activity, peripheral vasoconstriction, hence, a significant decrease in peripheral skin temperature during monotonous driving simulation. Basing on differential skin temperatures between peripheral (i.e., nose tip) and truncal parts of the face (i.e., cheeks, jaw, and forehead), they were able to assess an index of a driver’s stress. More recently, Pavlidis et al. [32] studied the effects of cognitive, emotional, sensorimotor, and mixed stressors on driver arousal and performance with respect to a baseline of 59 drivers in a simulation experiment. Perinasal perspiration, revealed by thermal imaging, together with the measure of steering angle and the range of lane departures on the left and right side of the road, showed a more dangerous driving condition in the case of sensorimotor and mixed stressors with respect to the baseline condition.
In this paper, the driver stress state was established by means of IR imaging and supervised machine learning methods. Supervised machine learning approaches are part of artificial intelligence (AI) algorithms, able to automatically learn functions that map an input to an output based on known input–output pairs (training dataset). The function is inferred from labeled training data and can be used for mapping new dataset (test dataset) that allow to evaluate the accuracy of the learned function and understand the level of generalization of the applied model [33].
On the basis of key features of thermal signals extracted from peculiar regions of interest (ROIs), indicative of the psycho-physiological state, an estimation of the ECG-derived SI was performed employing a support vector regression with radial basis function (SVR-RBF) [17]. To test the generalization performances of the model, a leave-one-subject-out cross-validation was utilized. After the cross-validation process, a two-level classification of the stress state (STRESS versus NO STRESS) was performed, relying on the estimated SI.
This work describes a novel approach for a contactless methodology dedicated to driver stress state detection and classification, constituting a significant improvement to actual ADAS technology and, in general, to road security level.

2. Materials and Methods

2.1. Participants

The experimental session involved 10 adults (6 males, age range 22–35, mean 28.4). Before the start of the experimental trials, the participants were adequately informed about the purpose and protocol of the study, and they signed an informed consent form outlining the methods and the purposes of the experimentation in accordance with the Declaration of Helsinki [34].

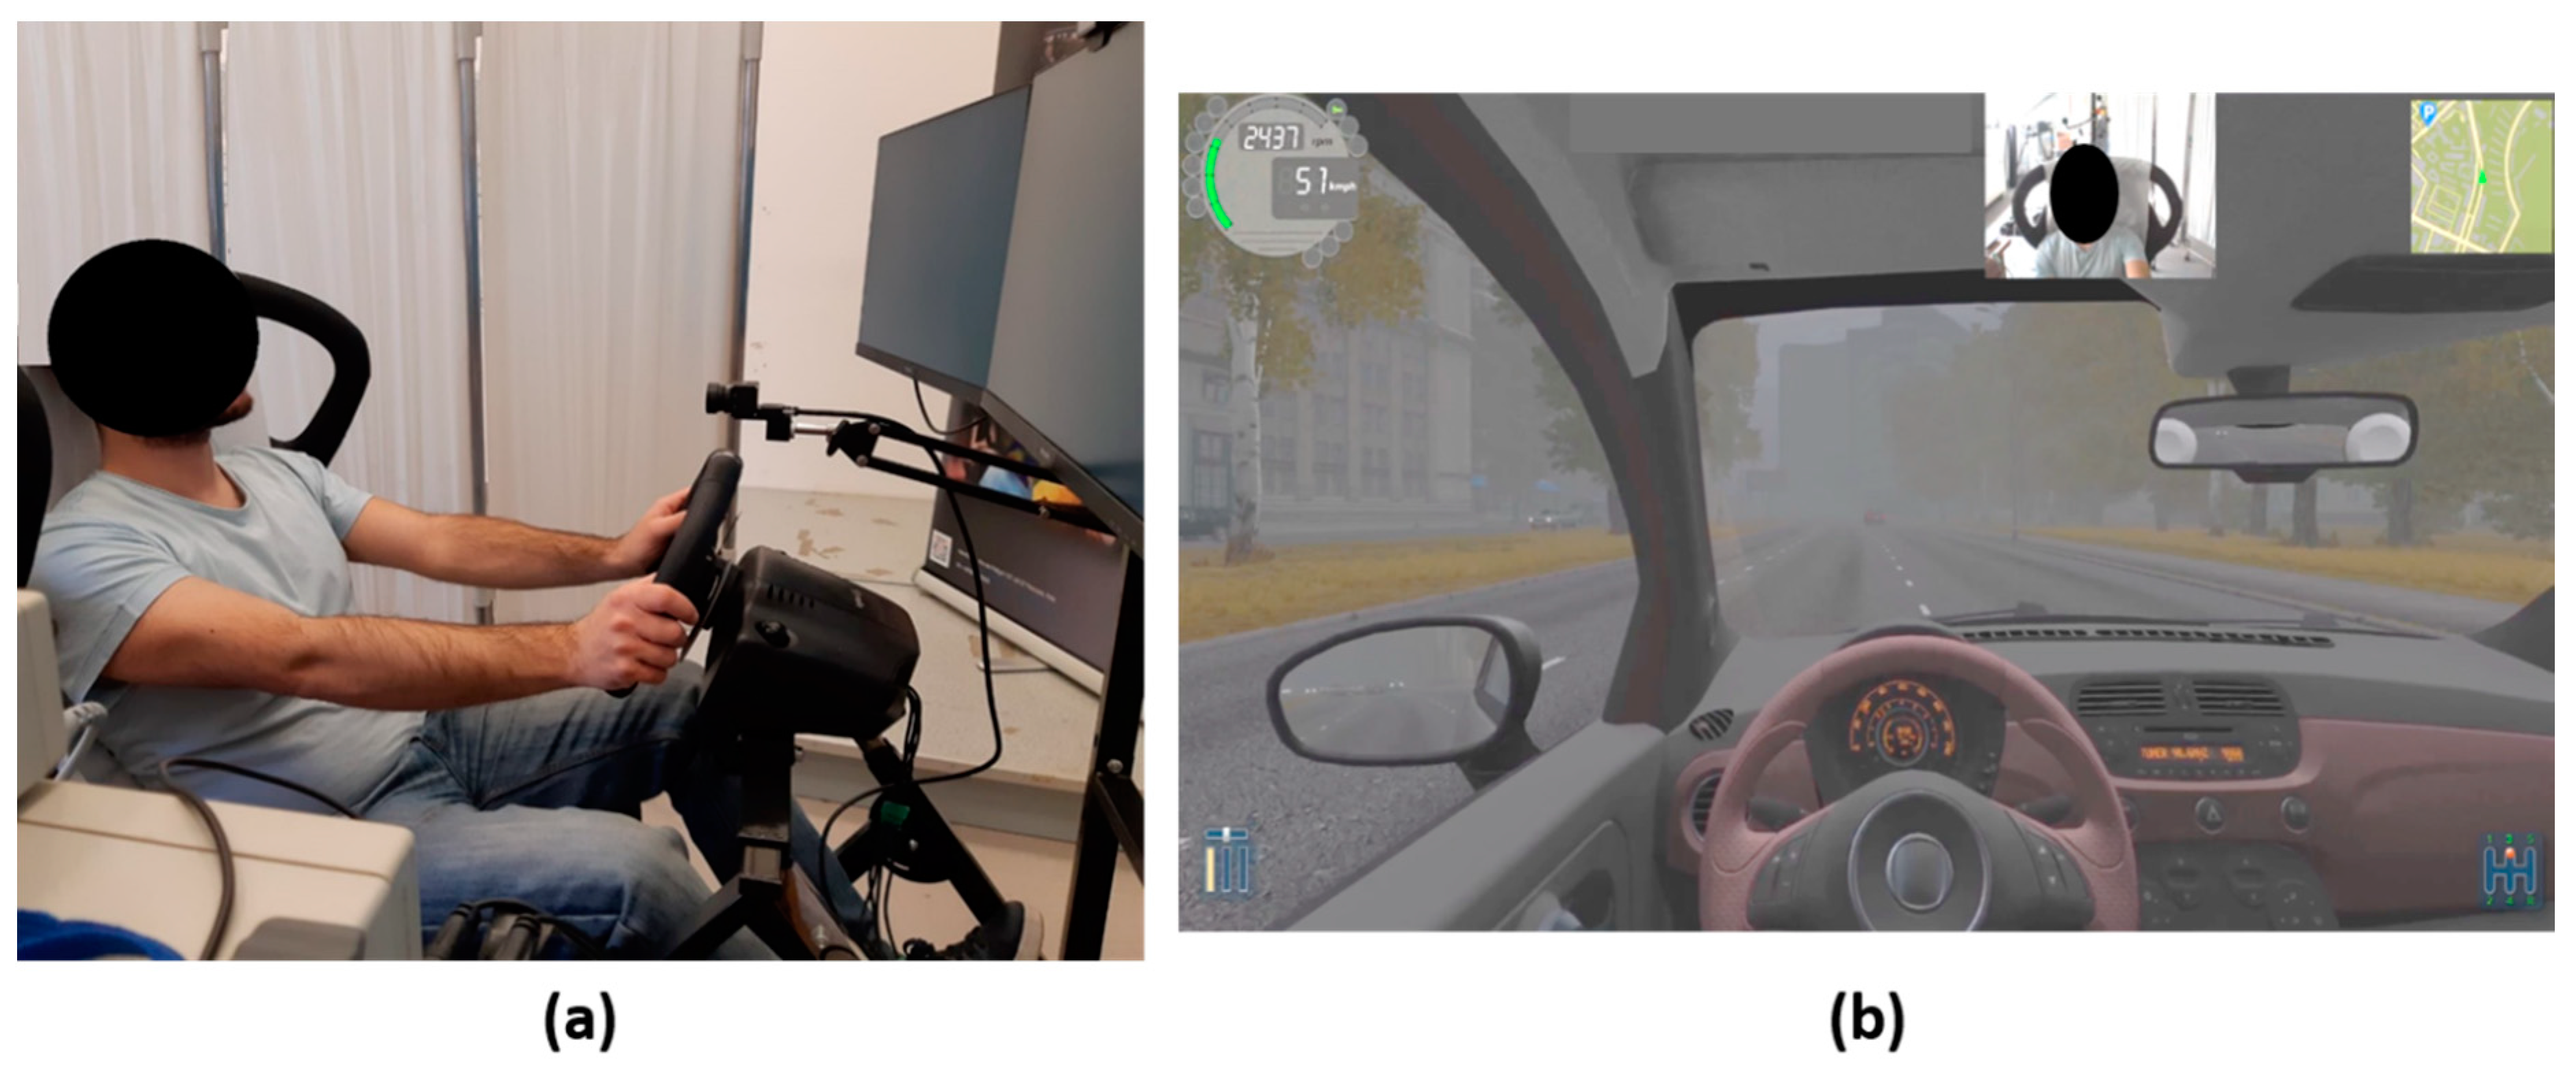
2.2. Procedure and Data Acquisition

Prior to testing, each subject was left in the experimental room for 20 min to allow the baseline skin temperature to stabilize. The recording room was set at a standardized temperature (23 °C) and humidity (50–60%) by a thermostat.
To perform the experiment, a static driver simulator was used (Figure 1a). It was composed of driver’s seat, steering wheel, clutch, brake, and gas pedals, and gearshift. To display the scenario, three 27 inch monitors were used. The total video resolution for the stimulation was 5760 × 1080 pixels. The distance between the driver and road screen was approximately 1.5 m. Participants’ horizontal view angle was 150 degrees. The simulator could produce starter and engine sounds, left and right signal indicators, and flashers and wiper blades. In this study, the sound of the engine, starter, and lights switches were provided.
Participants sat comfortably on the seat of the driving simulator during both acclimatization and measurement periods.
The software used for driving simulation was City Car Driving, Home Edition software (version 1.5) [35] (Figure 1b). The experimental protocol consisted of performing a driving simulation lasting 45 min in an urban context. The experimental conditions were set a priori to ensure the adverse driving condition and guarantee the uniformity of the experimental protocol for all the subjects. An overview of the experimental setting of City Car Driving software is reported in Table 1.
The conditions reported in Table 1 were selected to induce stress in the participants. In particular, the settings associated to traffic and emergency situations guaranteed non-comfortable driving, since the participants were often experiencing non-monotonous situations.
During the execution of the experimental protocol, ECG signals and visible and thermal IR videos were acquired.
The ECG signals were recorded by means of AD Instruments PowerLab system using the lead configuration determined by the Standard Limb Leads (i.e., electrodes positioned at the right arm (RA), left arm (LA), and left leg (LL)) [36].
Visible and thermal IR videos were acquired by the depth camera Intel RealSense D415 and FLIR Boson 320LW IR thermal camera, respectively. The technical characteristics of the two acquisition devices are summarized in Table 2.
For the purpose of this study, the two imaging devices were held together and aligned horizontally. Figure 2 shows the entire imaging acquisition system.

2.3. Analysis of ECG Signals

The ECG signals were recorded at a rate of 1 kHz. The elapsed time periods between the two successive R-peaks of the ECGs (RR signals) were extracted from LabChart7, ADInstruments, and analyzed by the software Kubios HRV Standard [37]. Baevsky’s Stress Index (SI) [18] was evaluated for each subject in 30 s consecutive windows. The SI from Kubios is the square root (to make the index normally distributed) of the Baevsky’s Stress Index proposed in Reference [18].
Baevsky’s SI is calculated based on the distribution of the RR intervals as reported in Equation (1):
S I = A M o × 100 % 2 M o × M x D M n
where Mo is the mode (the most frequent RR interval), AMo is the mode amplitude expressed in percent, and MxDMn is the variation scope reflecting the degree of RR interval variability.
Values of Baevsky’s stress index between 80 and 150 are considered normal [18].

2.4. Analysis of Visible and Thermal Imaging Data

Visible and IR videos of the subjects’ faces were simultaneously recorded during the driving experiment at an acquisition frame rate of 30 Hz and 10 Hz, respectively.
Given the availability of computer vision algorithms for visible videos, in the present study, visible imaging was used as reference for tracking facial landmark features. The purpose of the visible tracking was to transfer the visible facial landmark features tracked to the thermal imagery, estimating the geometrical transformation between the two imaging optical devices.

2.4.1. Visible and Thermal Data Co-Registration

The first step of the developed procedure consisted of an optical co-registration between visible and thermal optics. The co-registration process was a fundamental step of the whole pipeline, since it allowed a proper mapping from an imaging coordinate system to another.
The optical co-registration relied on procedures implemented in OpenCV [38], and it is described in depth in Reference [39]. A root mean square error (RMSE) value was provided by the co-registration procedure, thus indicating the accuracy in the coordinate transformation from visible to IR imagery at the specific distance of 1 m.

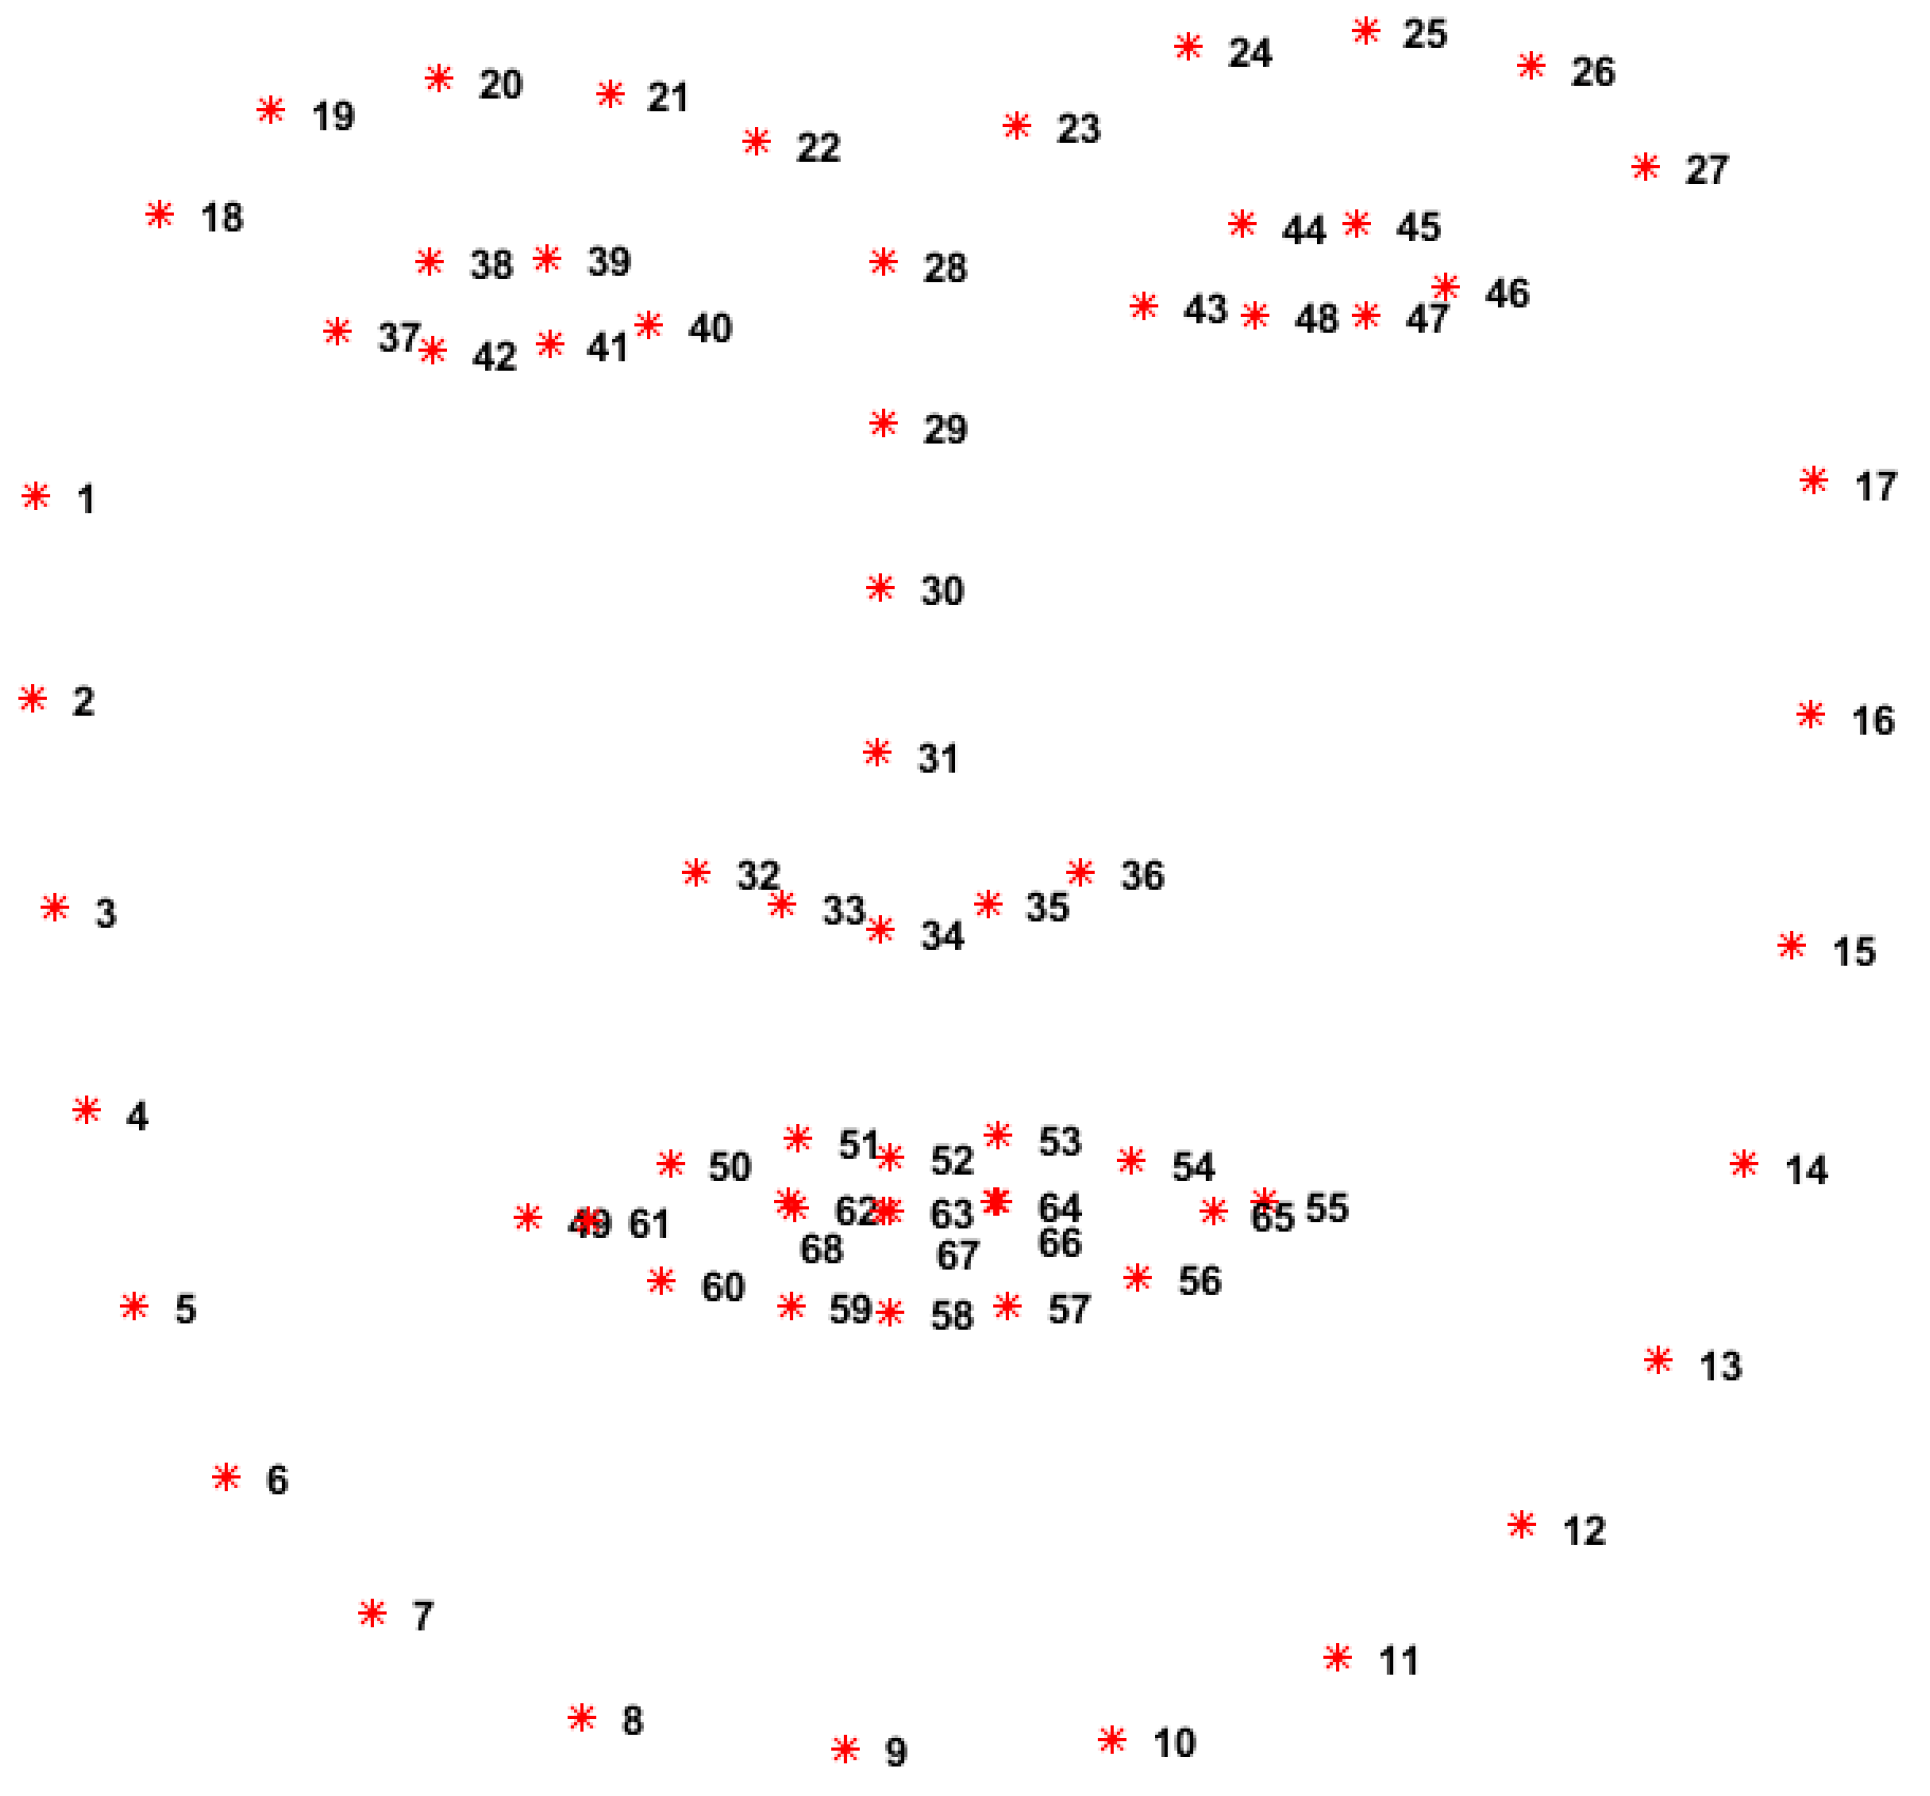
2.4.2. Facial Landmark Detection in the Visible Domain

Visible videos were analyzed through OpenFace [40,41], an open-source software able to perform facial landmark detection, head pose estimation, facial action unit recognition, and eye-gaze estimation. For each frame, a set of 68 facial landmarks was estimated during the experiment. Figure 3 shows the distribution of the 68 facial landmarks.
The landmark detector algorithm within OpenFace relied on the constrained local neural fields (CLNF) procedure [42], whereas the face detector algorithm employed a multi-task convolutional cascaded network (MTCNN) approach [43].

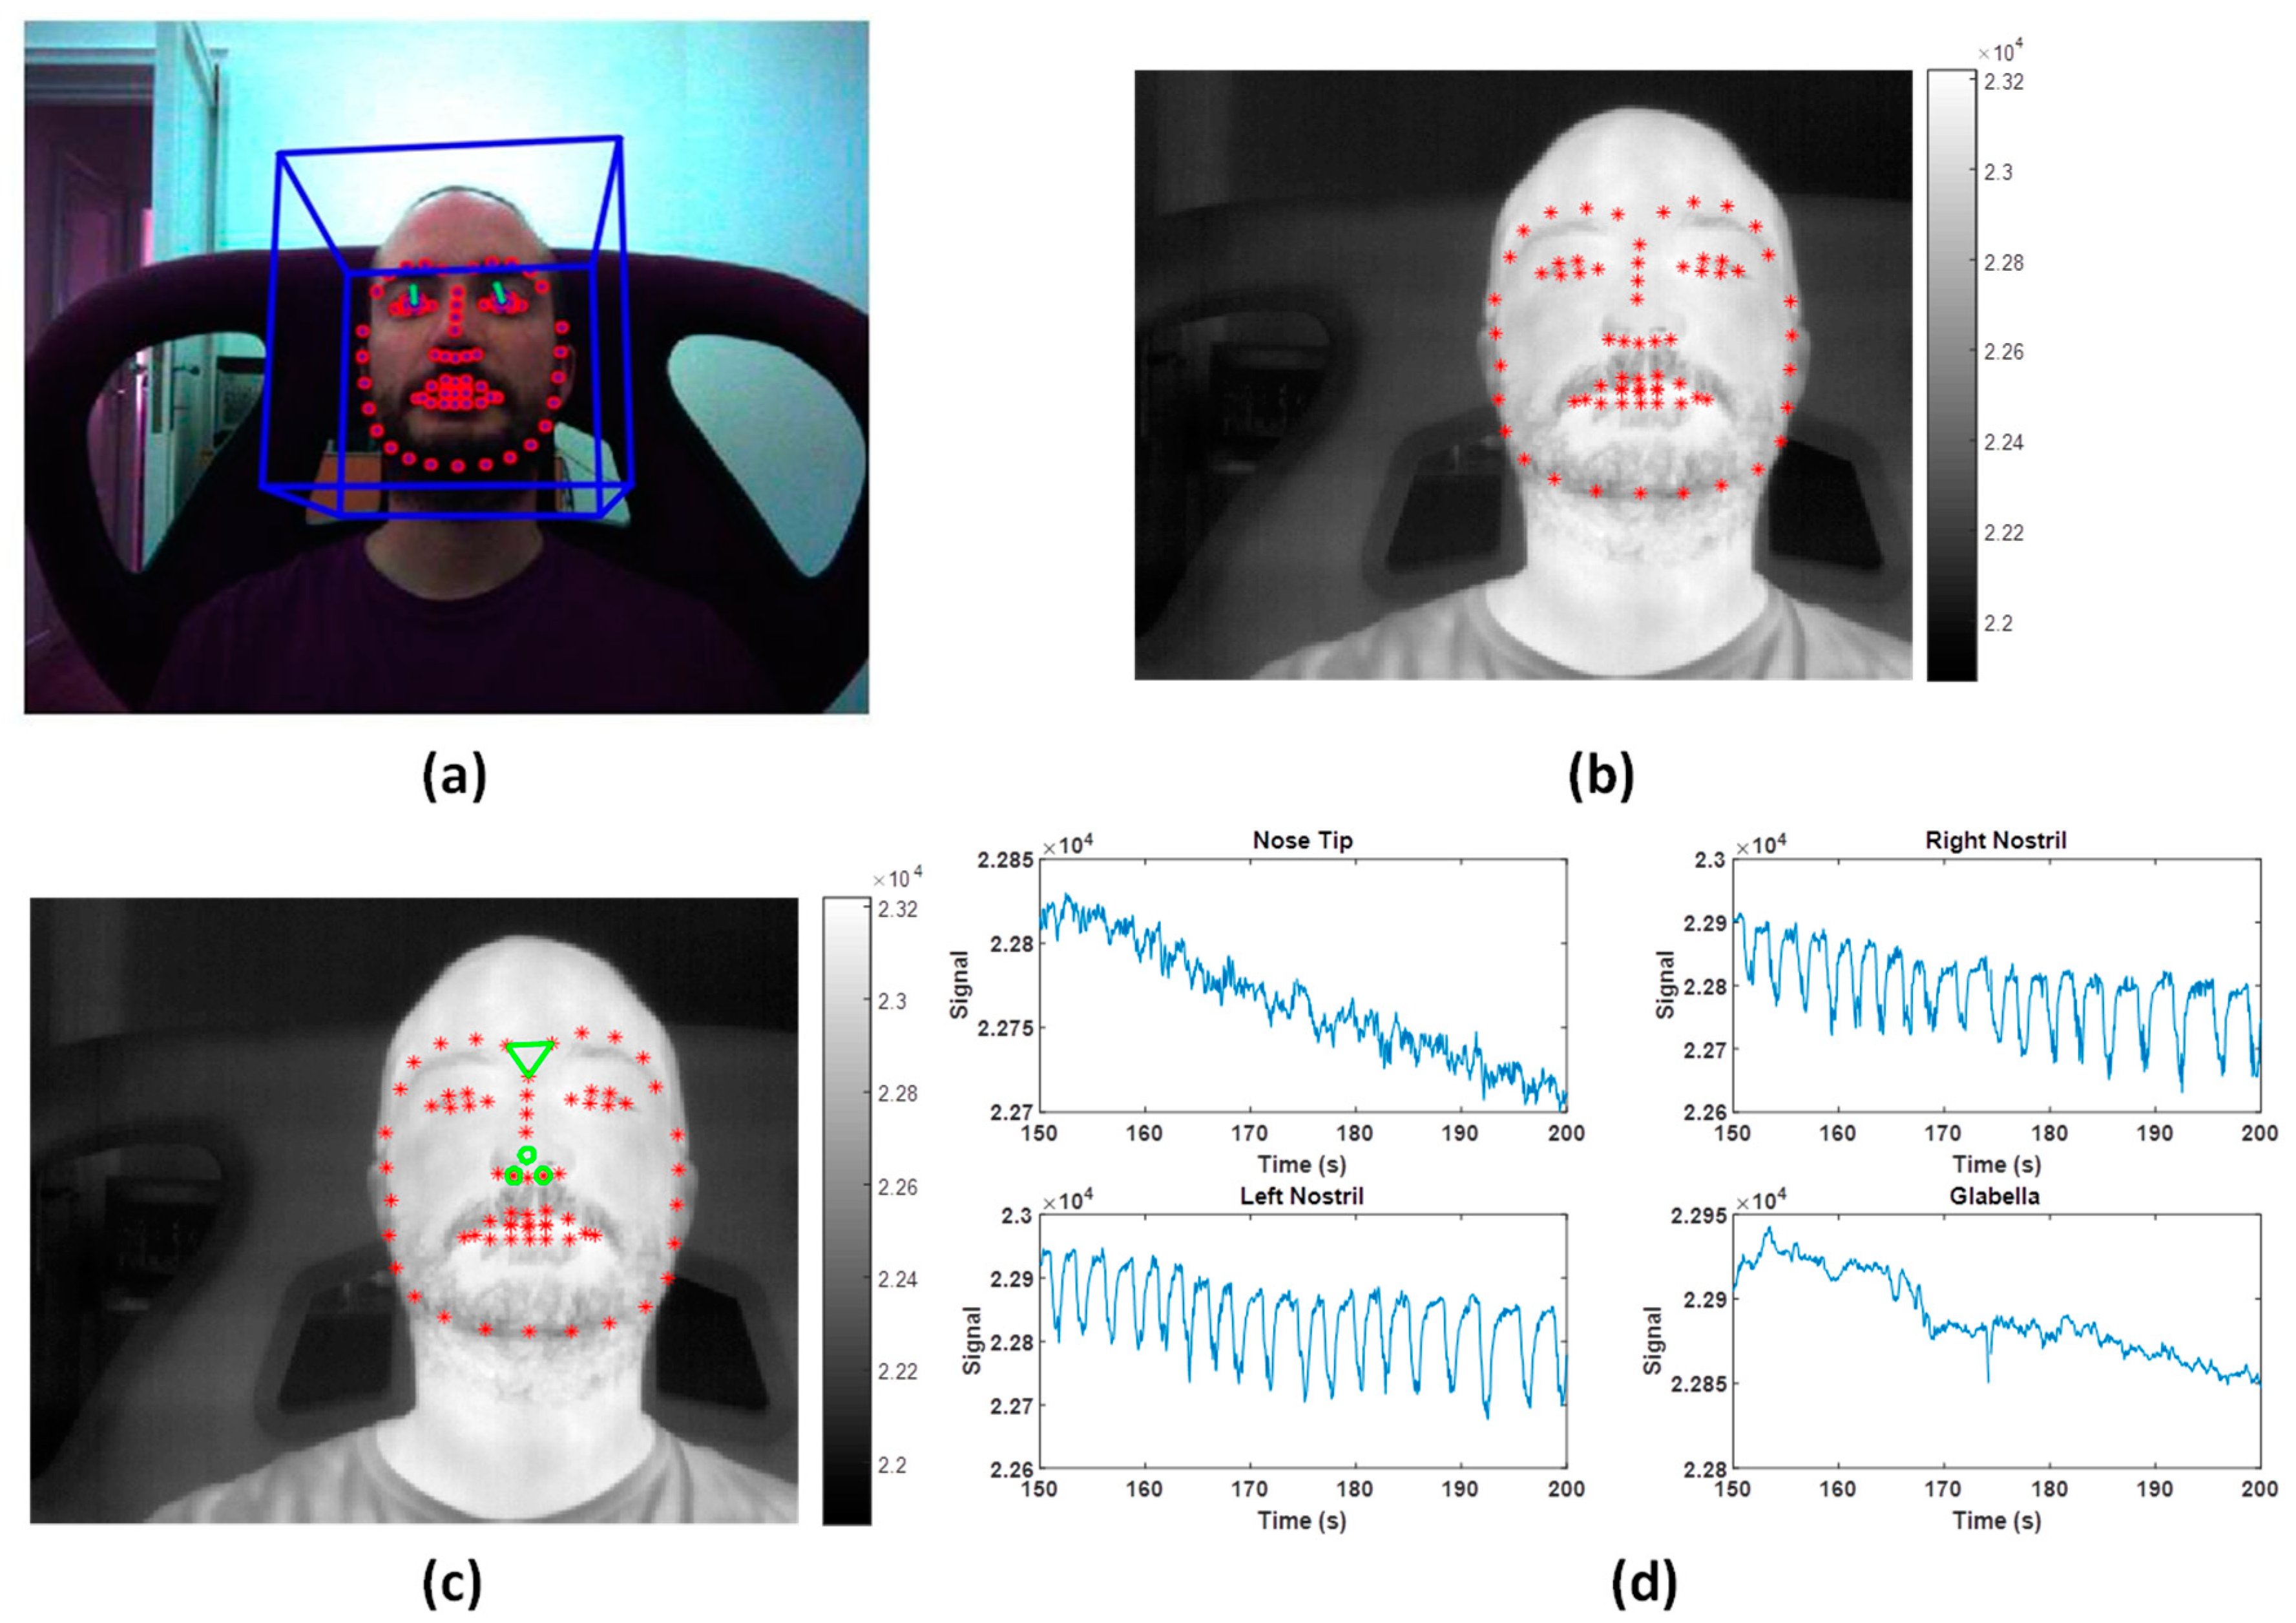
2.4.3. Thermal Data Extraction and Analysis

The sets of the 68 facial landmarks detected in the visible images were identified in the corresponding frames of IR imaging, applying the geometrical transformation obtained from the optical co-registration process. Figure 4a,b show an example of the 68 feature landmarks detected on a visible frame and the set of the 68 points identified on the corresponding thermal image.
A fundamental aspect for obtaining an accurate co-registration was the need of temporal synchronization between visible and IR videos. Since the acquisition frame rate of thermal videos was lower than that of the visible camera, the corresponding frames within the visible domain were determined according to the specific timestamps of IR frames. Specifically, among the visible frames acquired around the IR frame timestamp, the one that minimized the temporal difference with IR imaging was chosen. The timestamps of the frames were considered reliable as the videos were acquired on the same PC.
For each thermal video, four ROIs were considered and positioned on facial areas of physiological importance (nose tip, right and left nostrils, and glabella) [44]. The ROIs’ coordinates were automatically determined from the location of the 68 landmarks. In this way, the initialization of the position of the ROIs was automatically determined (Figure 4c).
With reference to the topographical distribution of the points as represented in Figure 3, the coordinates of the four ROIs were determined, as described in Table 3:
For each ROI, the average value of the pixels was extracted over time (Figure 4d). Relatively to the nostrils’ ROIs, the average value between ROI 2 and ROI 3 was considered for further statistical analysis, them being related to the same physiological process (i.e., breathing function).
For each of the extracted signals, six representative features were computed over consecutive temporal window of 30 s:
(1)
Absolute value of the difference between the average of the signal in the first 5 s and in the last 5 s (Δ);
(2)
Standard deviation of the raw thermal signals (STD);
(3)
The 90th percentile of the raw thermal signals (90th P);
(4)
Kurtosis of the raw thermal signals (K);
(5)
Skewness of the raw thermal signals (S);
(6)
Ratio of the power spectral density of the raw thermal signals evaluated in the low-frequency band (LF = (0.04–0.15) Hz) and in the high-frequency band (HF = (0.15–0.4) Hz) (LF/HF).

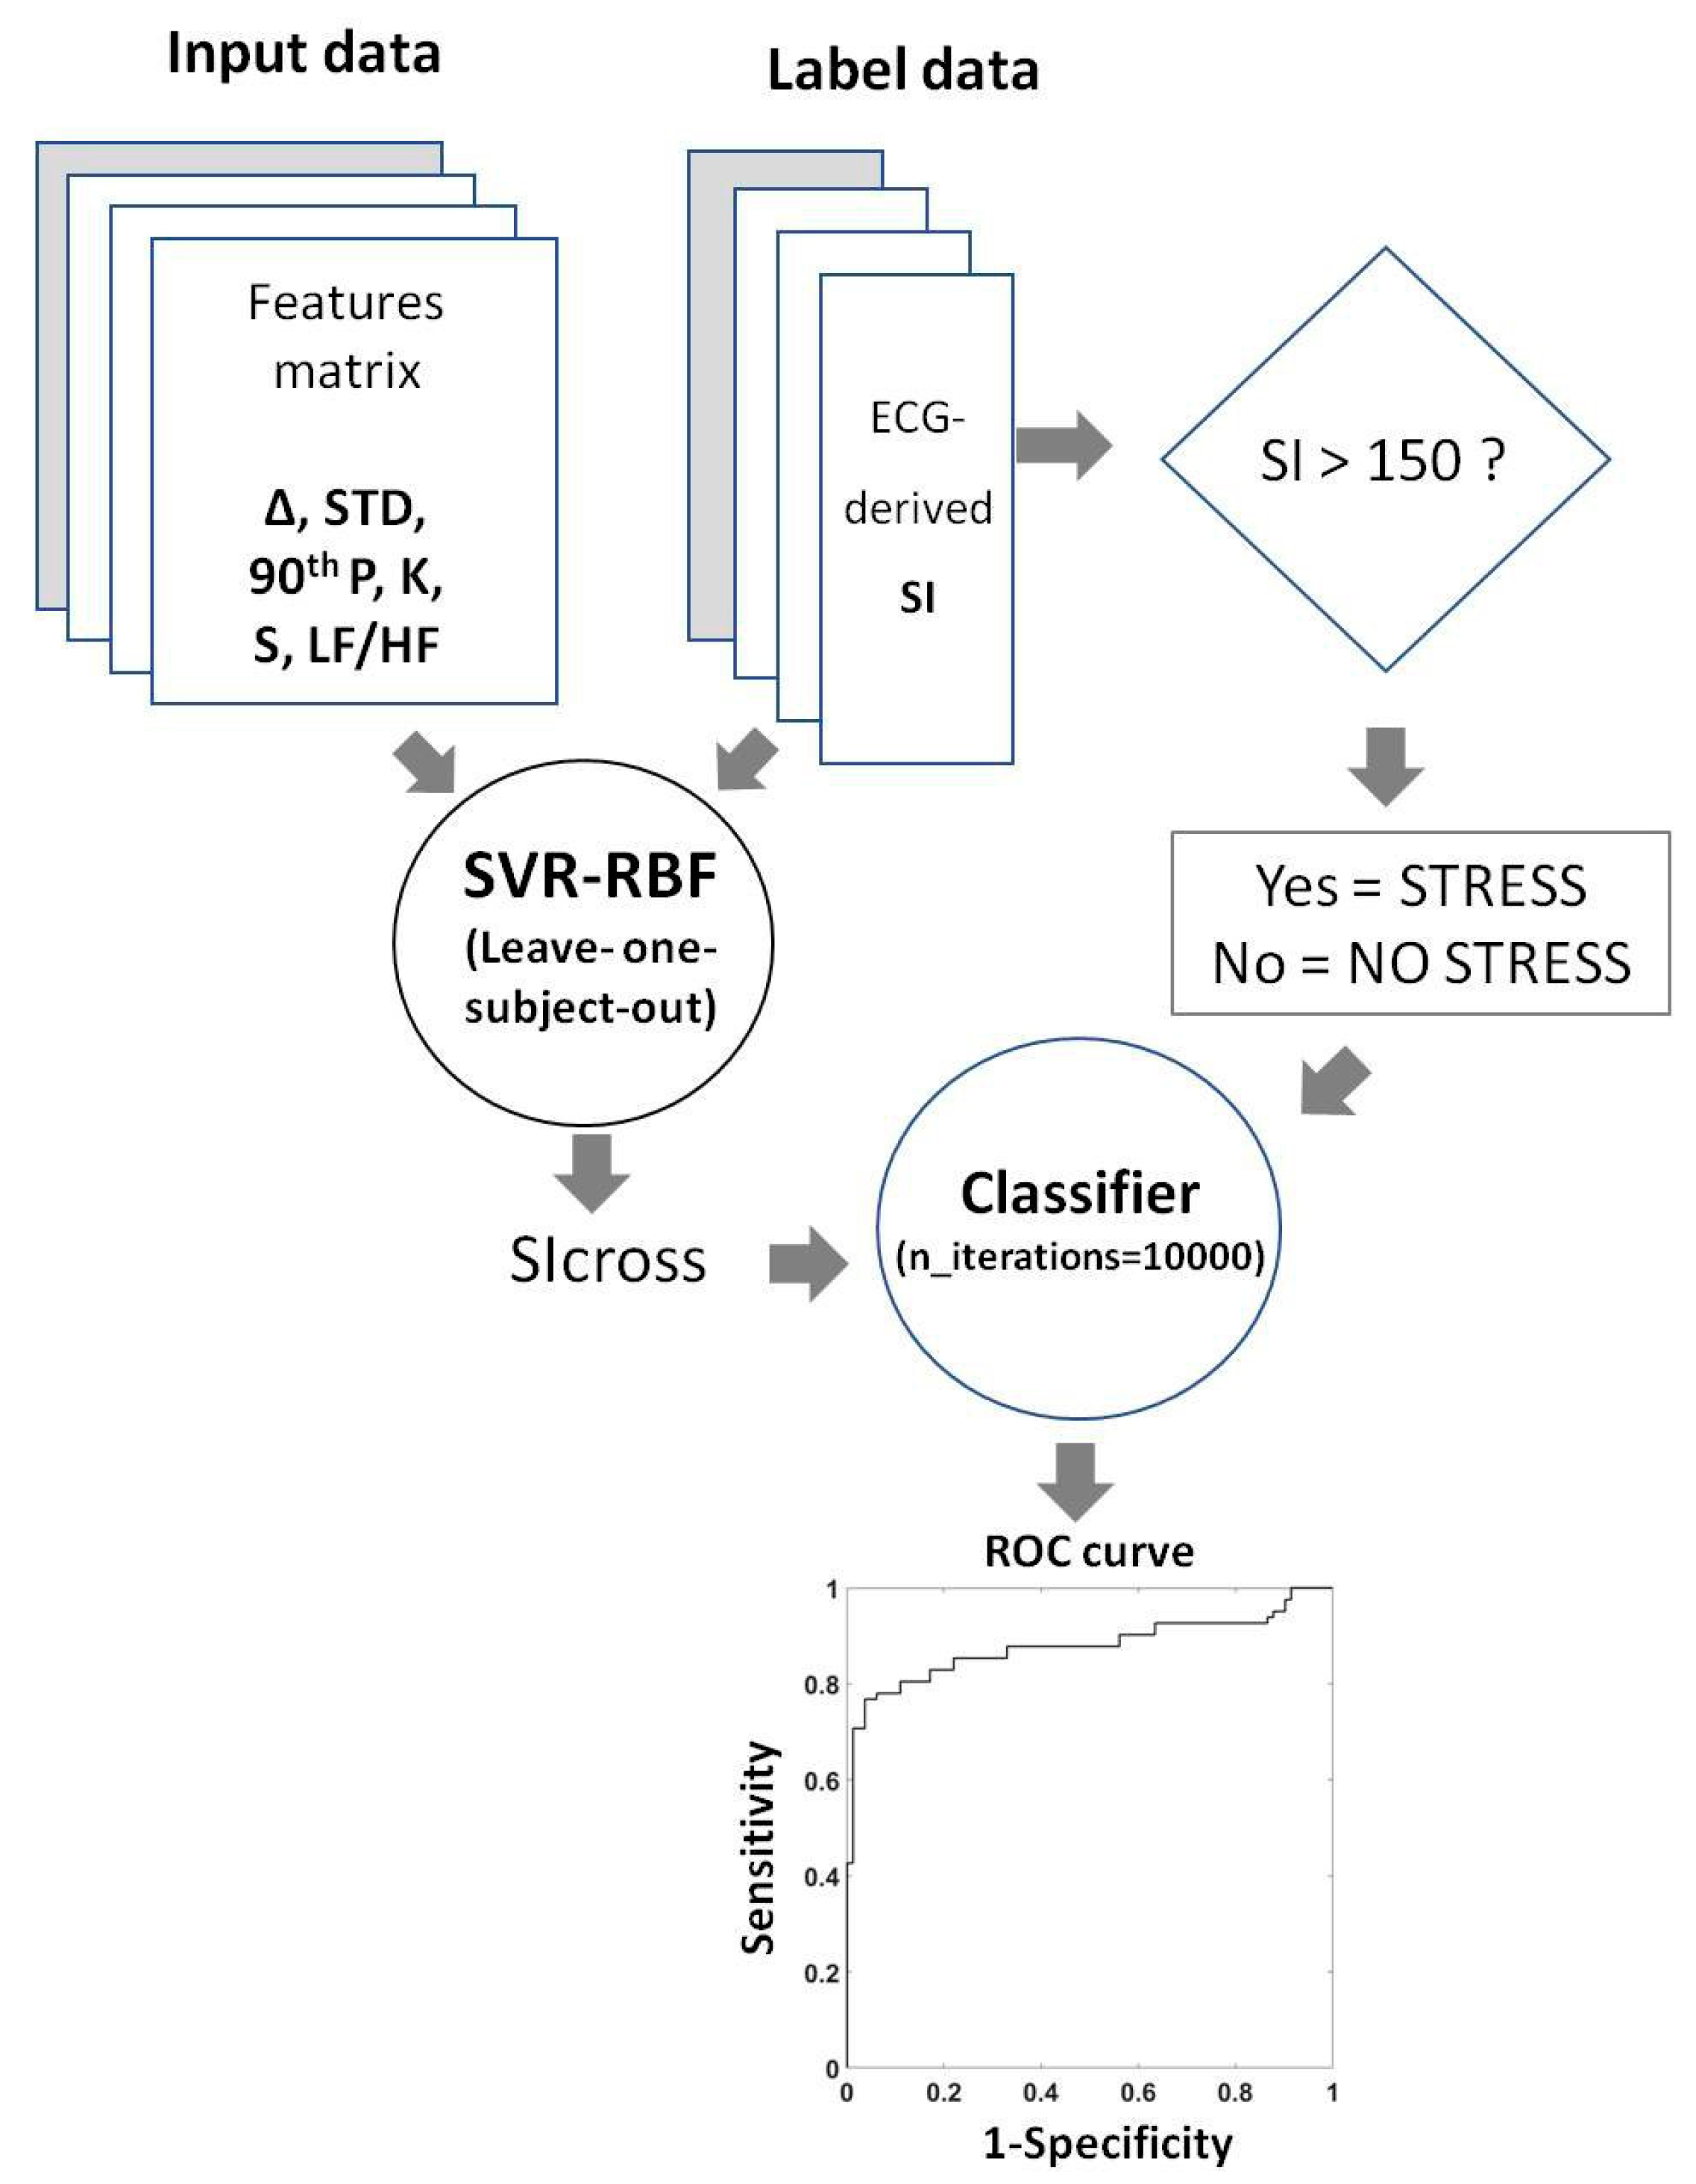
2.4.4. Application of Supervised Machine Learning

Firstly, a machine learning approach was utilized to predict SI relying on features extracted from thermal signals. Specifically, an SVR with RBF kernel was trained on the SI obtained from Kubios through a supervised learning procedure. The SVR-RBF was trained on z-scored data with a fixed nonlinearity exponential parameter γ = 1.
Because of the multivariate (6 regressors) SVR approach, in-sample performance of the procedure did not reliably estimate the out-of-sample performance. The generalization capabilities of the procedure were thus assessed through cross-validation. Specifically, a leave-one-subject-out cross-validation was performed [45]. This cross-validation procedure consisted in leaving one subject (specifically all the samples from the same subject) out of the regression and in estimating the predicted output value on the given subject using the other participants as the training set of the SVR model. This procedure was iterated for all the subjects, and further statistical analyses were performed on the out-of-training-sample estimation of SI from thermal features. Such a metric was labelled SIcross.
Although several machine learning approaches could be suited for such a purpose, given the limited number of independent features available and the exploratory nature of the implemented approach, an SVR-RBF followed by a classification procedure was chosen to limit the procedural complexity. In fact, although SVR-RBF is not a sophisticated approach, it ensures performances which are comparable to more complex machine learning techniques [46].
Secondly, SIcross was used to perform a two-level classification of the driver’s stress (i.e., STRESS versus NO STRESS). The two classes were defined on the basis of the threshold associated to a stress condition assessed by the SI (i.e., SI > 150 for stress condition) [18]. Notably, the experimental recordings confirmed the accordance between SI and the driving conditions. In particular, stressful situations assessed by SI were associated to adverse events during driving simulations (e.g., traffic accidents, collisions with pedestrians, sudden car braking).
Since the two classes did not have an equal number of samples, a bootstrap procedure was implemented to test classification performance on balanced classes [47]. The performances of the classification were evaluated by means of receiver operating characteristic (ROC) analysis [48].
Figure 5 reports the flow chart relating to the described machine learning approach.

3. Results

3.1. Visible and Thermal Imaging Co-Registration and Processing

The spatial RMSE of the optical co-registration was 0.66 ± 0.25 pixels, thus indicating that the accuracy in the coordinate transformation from visible to IR imagery at the specific distance of one meter was less than one pixel.
The percentage value of the correctly identified landmark on the total amount of considered frames and the confidence value in correctly classifying a face are reported in Table 4 for each subject. These parameters were returned by the software OpenFace [40]. The confidence value ranged from 0 (total misclassification of face) to 1 (correct face classification), and it was the result of a landmark detection validation process. In detail, to avoid tracking drift over time, it was necessary to determine if landmark detection succeeded during video processing. The landmark detection validation was performed transforming the area surrounded by the landmarks to a pre-defined reference shape. The vectorized resulting image was then used as a feature vector for a classifier which acts as the validator (i.e., input of the classifier). To train the classifier on the vectorized reference warp, positive and negative landmark detection examples were considered. The positive samples were ground truth landmark labels, whereas the negative samples were generated from the ground truth labels, applying offset and scale transformations. The classifier employed in OpenFace is SVM [49].
On average, 94.66% of the video frames were correctly processed, whereas the confidence index for face classification was 0.90%.
To notice, concerning subjects 3 and 5, the average success and confidence scores were lower with respect to the other subjects, given the scarce lighting conditions of the acquisitions (Table 4). However, in general, for all the subjects, only the frames with high confidence and success scores were considered for further analysis (i.e., success index > 90%, confidence value > 0.8). This ensures there was no impact on the ROIs’ identification and, consequently, on their features’ estimation.
Finally, the average execution time of the developed algorithm was 0.09 s/frames with MATLAB 2016b© (64-bit Windows 7 Pro, Service Pack 1; Intel (R) Core (TM) i5 CPU; 8.00 GB RAM).

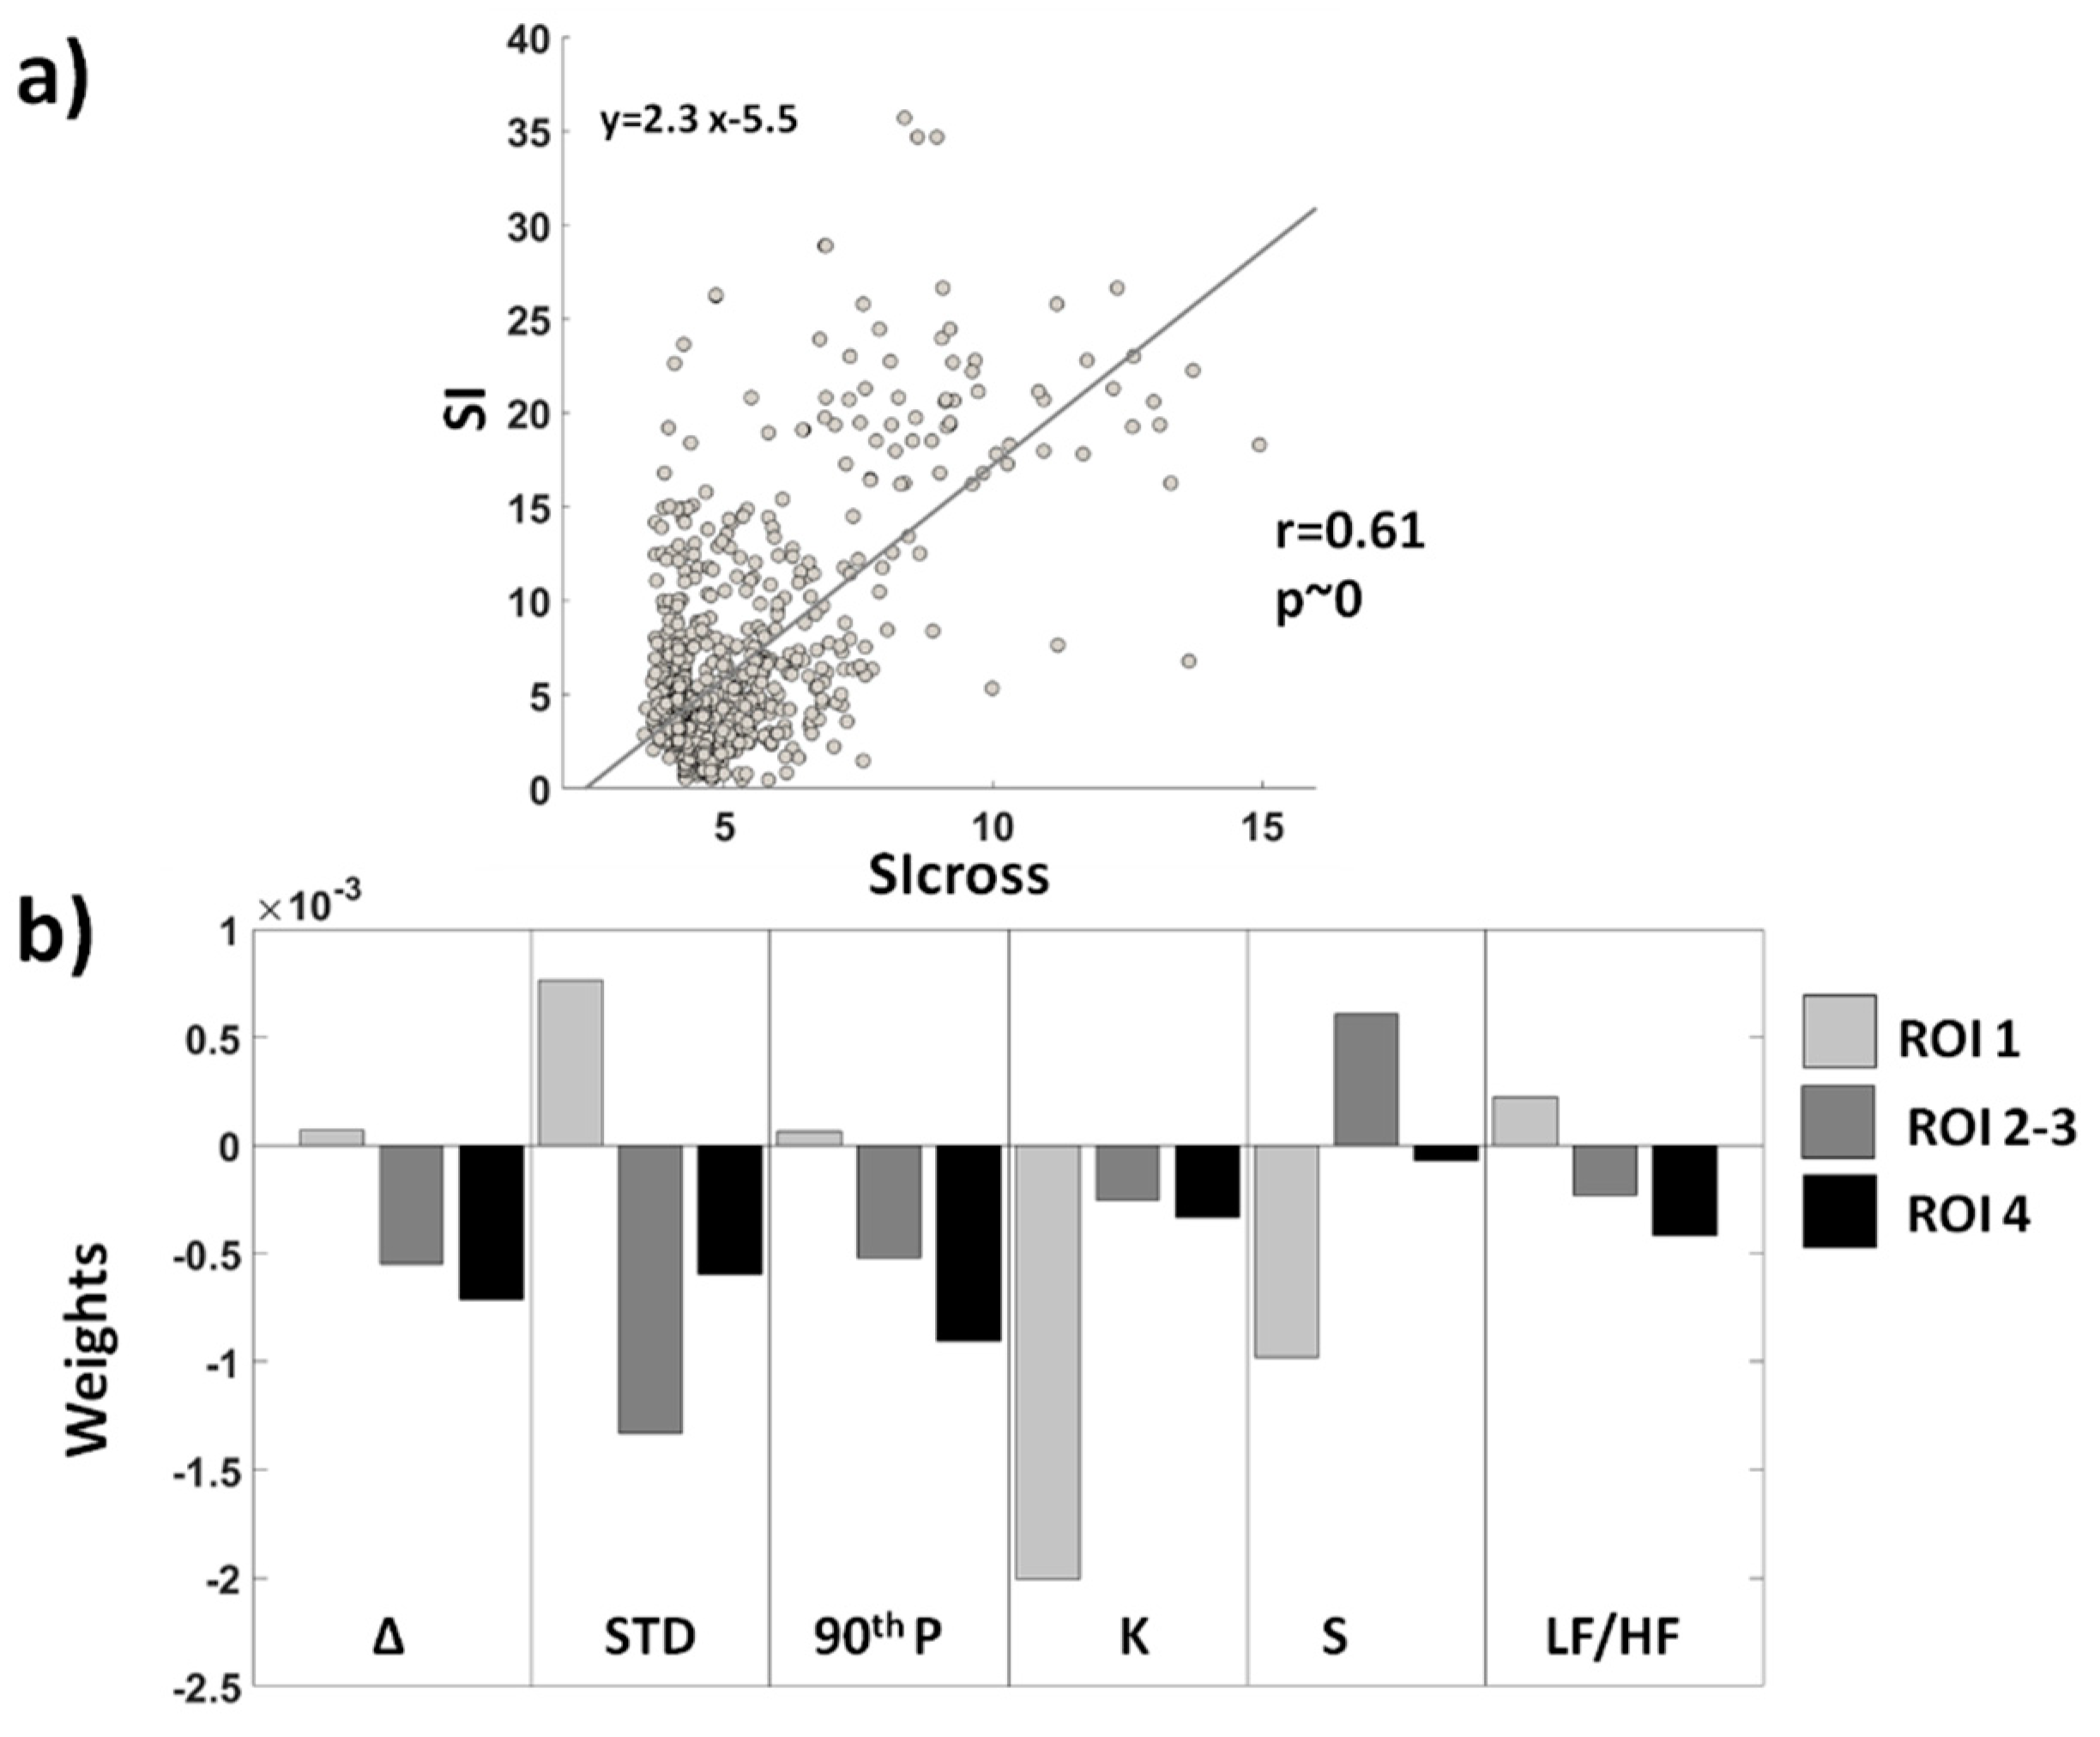
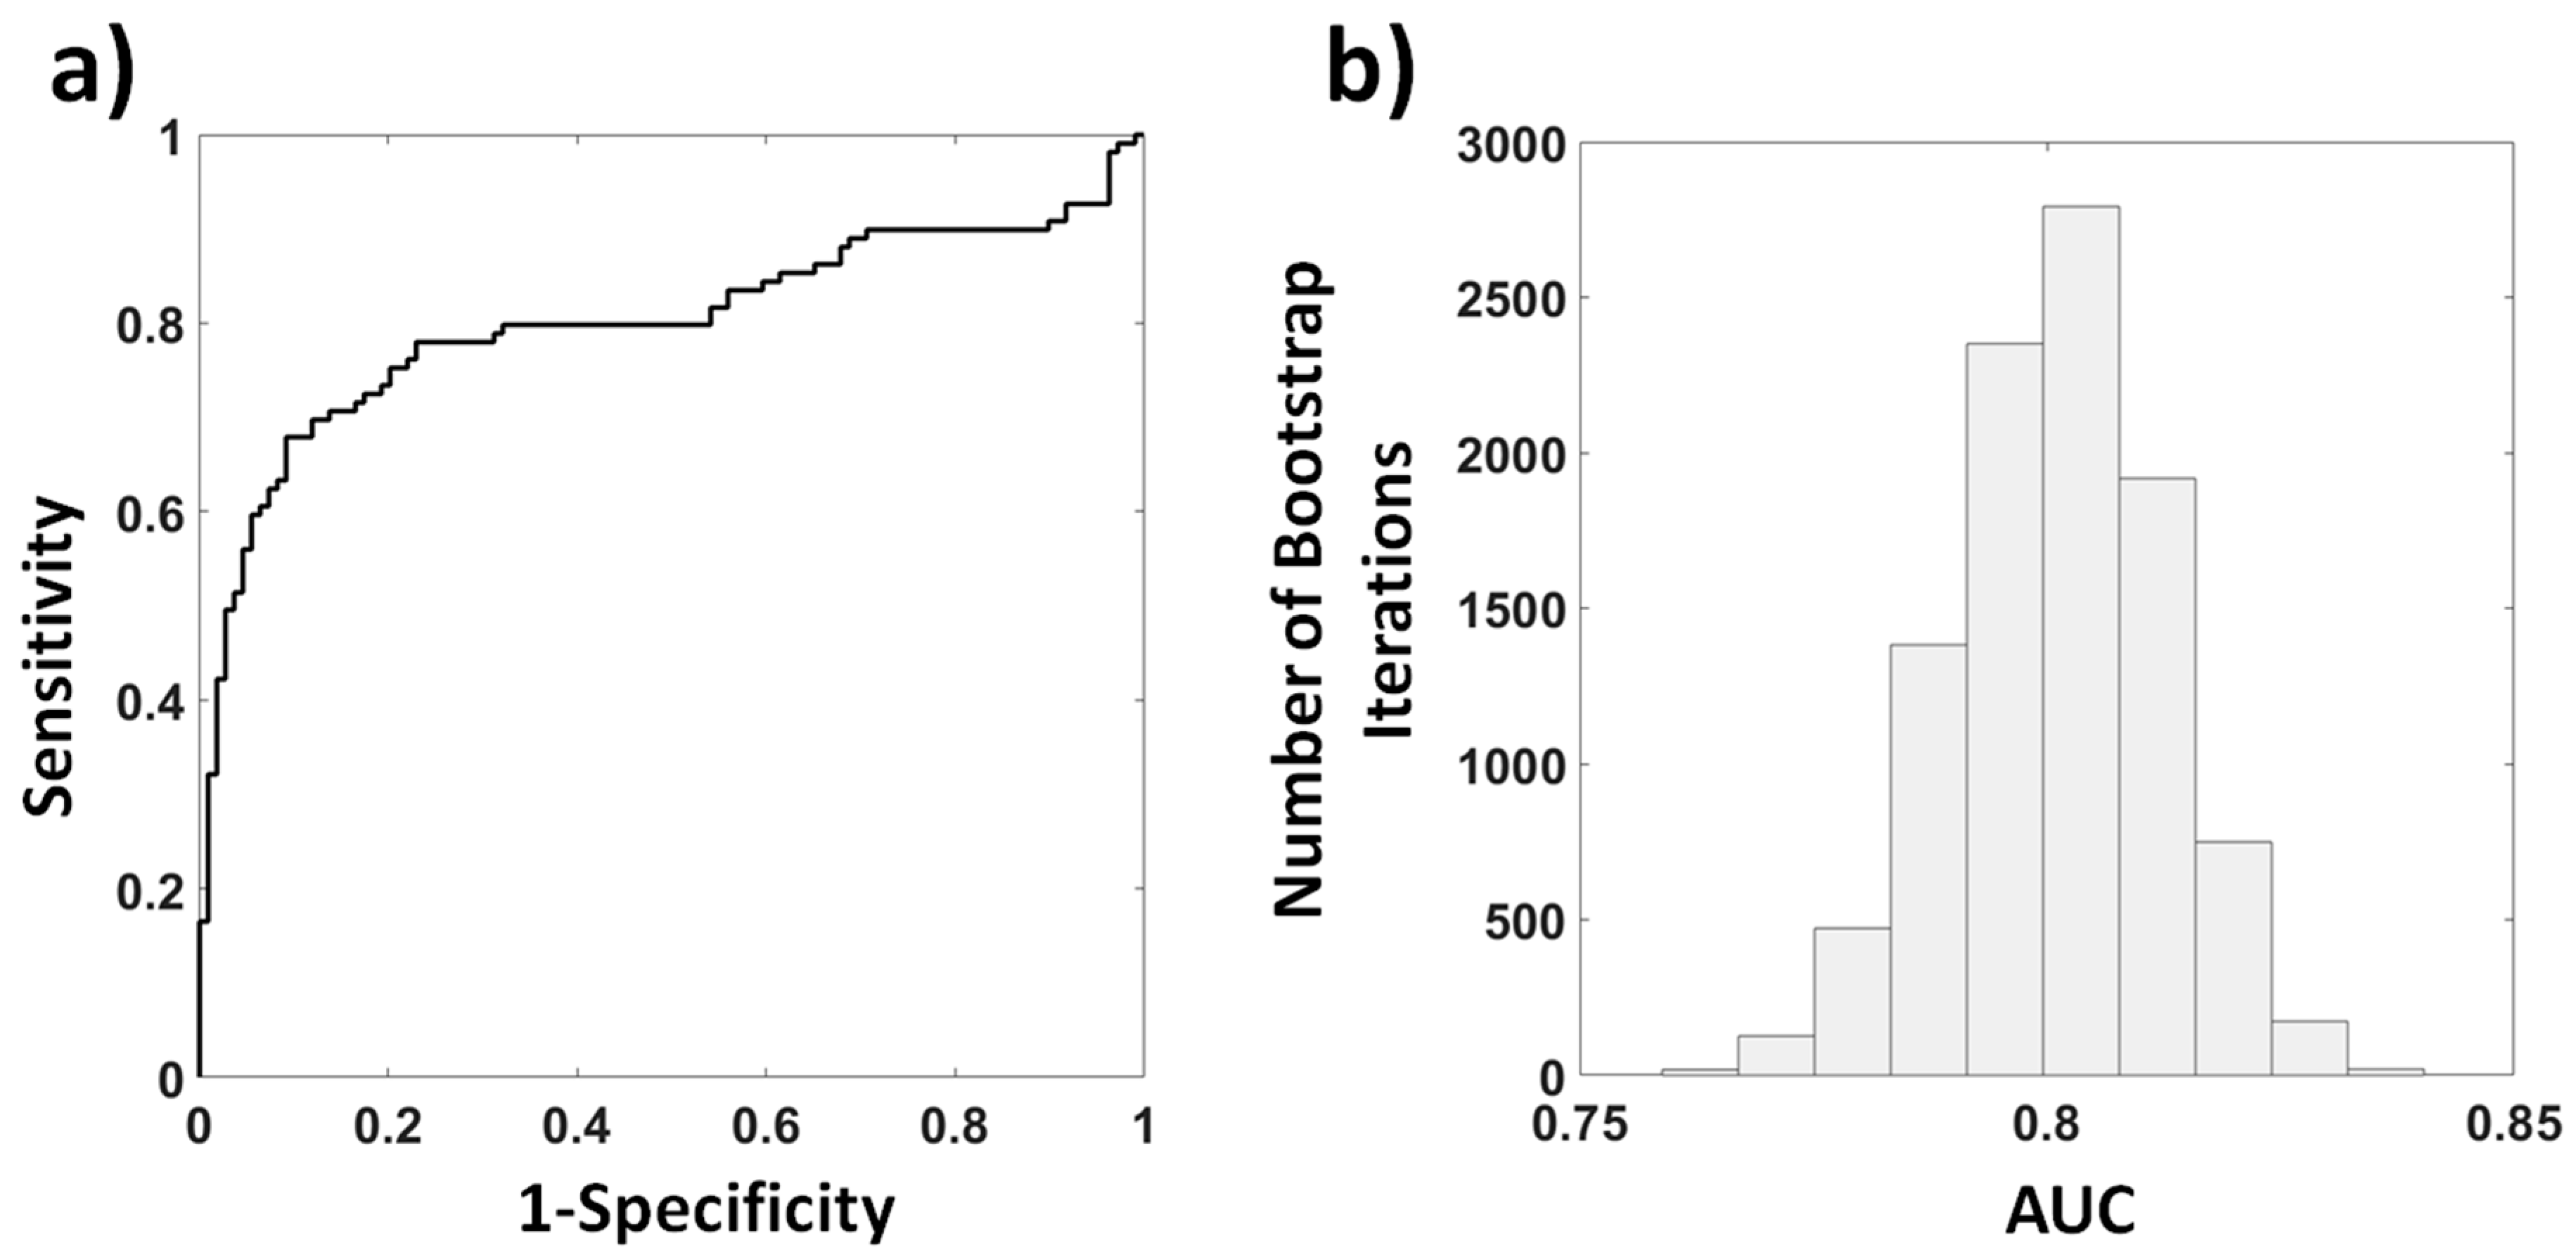
3.2. Performances of Supervised Machine Learning Approach

Across subjects, 849 samples were available for the regression analysis. A significant correlation between SI and predicted SI (SIcross) was obtained (r = 0.61, p = ~0) (Figure 6a), demonstrating a good performance of the multivariate analysis [50]. The weights associated to each z-scored regressor for each ROI are shown in Figure 6b. Considering that both the regressors and SI were normalized, the values of the weights were indicative of the contribution of each model input in the estimation of the SI.
Since the two classes had a different number of samples (125 samples for STRESS versus 696 samples for NO STRESS conditions), a bootstrap procedure was implemented to provide a classification estimates using balanced classes [47].
Figure 7a reports the among iterations average ROC curve (bootstrap performed for n = 10,000 iterations). The average area under curve (AUC) was 0.80 and with standard deviation of 0.01. The distribution of the AUC obtained after the bootstrap is reported in Figure 7b.
By choosing a specific threshold for SIcross, a sensitivity of 77% and a specificity of 78% were obtained as reported in the confusion matrix (Table 5).

4. Discussion

In this study, a novel method for driver stress evaluation based on thermal IR imaging and supervised machine learning approaches was described. Thermal IR imaging and ECG were acquired on ten subjects, while performing an experiment on a driving simulator using the software City Car Driving v.1.5 [35]. The experimental session consisted of 45 min of urban context driving with pre-established weather and traffic conditions. Electrocardiography (ECG) signals were used to infer the stress condition of the drivers. Among the variety of indices derived from the ECG signals, stress was considered [18]. In this study, the SI was evaluated in consecutive 30 s time windows by the software Kubios [36]. In the same temporal window, six representative features from average thermal signals on four ROIs (i.e., nose tip, left and right nostrils, glabella) were extracted. The thermal signals were automatically determined by a real-time tracking procedure. The tracking relied on state-of-the-art computer vision algorithms applied on visible images and the optical co-registration between the visible and thermal imaging devices ensuring high performance on signal processing and speed of extraction. Indeed, the high performances were highlighted by the percentage of correctly processed frames which reached an average of 94.66% by the confidence index for face classification that was 0.90 and by the average processing time that was only 0.09 s/frames.
A multivariate machine learning approach based on Support Vector Regression (SVR) with Radial Basis Function (RBF) kernel was employed to estimate the ECG-based SI through peculiar thermal features extracted from facial ROIs. Those ROIs were chosen on the basis of their physiological importance for stress detection [43]. A total amount of 18 thermal features (six features for each ROIs) were computed and used as predictors, while the SI, evaluated through the ECG signals, was considered as the regression output. A leave-one-subject-out cross-validation was employed to test the generalization of the regression. This procedure was iterated for all the subjects and further statistical analyses were performed on the out-of-training-sample estimation of SI. Such a metric was labeled as SIcross. The correlation between SI and SIcross was r = 0.61 (p = ~0) thus indicating a good estimation of the SI through the considered thermal features (Figure 6a). A feature-based analysis was performed to investigate the relevance of each feature (Figure 6b).
Concerning the nose tip region, the most contributing features to the SI estimation were the kurtosis, the skewness and the standard deviation. The weights associated to the kurtosis and skewness had negative values, thus indicating an inverse relation between SI and the features’ trends. The opposite trend was observed for the weights associated to the standard deviation. This pattern seems to be correlated with sweating or vasoconstriction phenomena, occurring with increasing stress [51,52]. In fact, an increase in the standard deviation and a reduction of the kurtosis and skewness parameters (i.e., flatness and asymmetry of the distribution of the related signal [53]) can be associated to a decrease of uniformity of the signal, thus indicating the presence, for instance, of “cold spots” typically present during sweating and vasoconstriction processes [19]. Concerning the nostrils region, instead, a strong inverse relation between the weight associated to the standard deviation and the SI was found. Since the thermal signals from nostrils are highly related to the breathing function, a lower signal variation (revealed by a decrease in the standard deviation) could be associated to a high breathing rate [54]. This result is in accordance with the findings from References [55,56], where it was shown that stress is associated with an increased respiratory rate. Finally, referring to the glabella region, the most relevant feature to the SI estimation was the 90th percentile, i.e., the value below which 90% of data falls. The weight associated to the 90th percentile was directly related to the SI, thus indicating that an increase in temperature of the glabella could be indicative of a stress condition. This result is in accordance with the findings reported in Reference [57] in which an increase in forehead temperature was associated to the execution of high difficult tasks.
To be noted, when using non-linear regressors, the contribution of each feature in predicting the output does not only depend on the relative weight but also on the non-linearities of the model. Nonetheless, the SVR-RBF employed a single parameter depicting the non-linearity extent for all the features considered. Thus, although not directly regressing the input with the output, the weights of RBF-SVR were still associated to the importance of each regressor.
The SIcross was, then, used to perform a two-level classification of the driver’s stress (i.e., STRESS versus NO STRESS). The two classes were defined on the basis of the threshold associated to a stress condition assessed by Baevsky’s SI [18]. Since the two classes were not balanced, a bootstrap procedure was implemented [47]. The ROC analysis showed a good performance of the classifier with an average AUC of 0.80 (Figure 7b), a sensitivity of 77%, and a specificity of 78% (Table 4).
It is worth noting that the cross-validation and the bootstrap procedures provided the generalization performances of the model, testing its applicability to a wide cohort of drivers. In fact, although stress conditions could elicit different physiological responses among subjects, for ADAS applications, it could be more relevant to detect stress conditions across participants, rather than focusing on a single subject’s stress level.
The main benefit of the developed method with respect to the available literature is the use of supervised machine learning approaches, based on the only thermal features, without accounting for vehicle- or driver’s behavioral-related parameters, reaching performances comparable with more complex approaches [27]. Furthermore, the developed method opens the way to efficient real-time implementation of drivers’ stress state monitoring relying only on thermal IR imaging, being the model already validated and ready to use.
Nonetheless, further studies should be performed to increase the sample size. The machine learning approach used in this study relied on supervised learning which is inherently a data-driven analysis; data-driven analysis is highly affected by the sample size and the performance of the model could indeed improve reducing a possible overfitting effect driven by the limited sample numerosity. To be noted, the present study focused on drivers with a limited age range (i.e., 22–35 years old), involving only young subjects. The most important improvement of the method will be to include in the study sample people with a wider age range. In future studies, beyond increasing the sample size and age range, other factors, such as gender, thermal comfort, and weather conditions during simulated driving sessions, will be considered [58,59,60]. In fact, taking these factors into account could be of fundamental valence in driving stress research, leading to a wide overview of all the aspects concerning the matter of the study.
Furthermore, the present results are relative to simulated driving conditions in which determining variables for IR measurements, like direct ventilation or sunlight, were not considered. Thus, it would be desirable to apply the developed methodology also on real-driving situations, to generalize the applicability of the technique.
As for being state-of-the-art, this is an original and novel study concerning drivers’ stress state evaluation by means of thermal imaging, employing supervised machine learning algorithms. This is a preliminary study, addressed to limited and specific experimental conditions which, however, underlines the feasibility of the method to be verified under wider operating situations.

5. Conclusions

In the present work, a novel and original method allowing for drivers’ stress state evaluation was presented. By using machine learning approaches, it was possible to understand and classify, with a good level of accuracy, the stress state of the subjects while driving in a simulated environment. The presented work constitutes the first step towards the establishment of a reliable detection of the stress s in a non-invasive fashion, ensuring to maintain an ecologic condition during measurements.

Author Contributions

Conceptualization, D.C., D.P., C.F., A.M.C., A.M.; methodology, D.C., D.P.; software, D.C., D.P., E.S.; validation, D.P.; formal analysis, D.C., D.P.; investigation, D.C., D.P., C.F., A.M.C., L.M.; writing—original draft preparation, D.C., C.F., D.P.; writing—review and editing, A.M.C., A.M.; supervision, A.M.; project administration, A.M.; funding acquisition, A.M. All authors have read and agreed to the published version of the manuscript.

Funding

This research was funded by the grants: PON FESR MIUR R&I 2014-2020-ADAS+, grant number ARS01_00459 and ECSEL Joint Undertaking (JU) European Union’s Horizon 2020 Heliaus, grant number 826131.

Conflicts of Interest

The authors declare no conflict of interest.

References

  1. WHO. Global Status Report on Road Safety 2018: Summary (No. WHO/NMH/NVI/18.20); WHO: Geneva, Switzerland, 2018. [Google Scholar]
  2. Bengler, K.; Dietmayer, K.; Farber, B.; Maurer, M.; Stiller, C.; Winner, H. Three decades of driver assistance systems: Review and future perspectives. IEEE Intell. Transp. Syst. Mag. 2014, 6, 6–22. [Google Scholar] [CrossRef]
  3. Weon, I.-S.; Lee, S.-G.; Ryu, J.-K. Object Recognition based interpolation with 3d lidar and vision for autonomous driving of an intelligent vehicle. IEEE Access 2020, 8, 65599–65608. [Google Scholar] [CrossRef]
  4. Catten, J.C.; McClellan, S. System and Method for Alerting Drivers to Road Conditions. U.S. Patent 8,188,887, 29 May 2012. [Google Scholar]
  5. Damiani, S.; Deregibus, E.; Andreone, L. Driver-vehicle interfaces and interaction: Where are they going? Eur. Transp. Res. Rev. 2009, 1, 87–96. [Google Scholar] [CrossRef] [Green Version]
  6. Huynh-The, T.; Banos, O.; Le, B.-V.; Bui, D.-M.; Yoon, Y.; Lee, S. Traffic behavior recognition using the pachinko allocation model. Sensors 2015, 15, 16040–16059. [Google Scholar] [CrossRef] [PubMed] [Green Version]
  7. Cruz, L.C.; Macías, A.; Domitsu, M.; Castro, L.A.; Rodríguez, L.-F. Risky driving detection through urban mobility traces: A preliminary approach. In Context-Awareness and Context-Driven Interaction, Proceedings of the Ubiquitous Computing and Ambient Intelligence, Carrillo, CR, USA, 2–6 December 2013; Urzaiz, G., Ochoa, S.F., Bravo, J., Chen, L.L., Oliveira, J., Eds.; Springer: Cham, Switzerland, 2013; pp. 382–385. [Google Scholar]
  8. Distracted Driving. Available online: https://www.nhtsa.gov/risky-driving/distracted-driving (accessed on 14 August 2020).
  9. Dingus, T.A.; Guo, F.; Lee, S.; Antin, J.F.; Perez, M.; Buchanan-King, M.; Hankey, J. Driver crash risk factors and prevalence evaluation using naturalistic driving data. Proc. Natl. Acad. Sci. USA 2016, 113, 2636–2641. [Google Scholar] [CrossRef] [Green Version]
  10. Guettas, A.; Ayad, S.; Kazar, O. Driver state monitoring system: A review. In Proceedings of the 4th International Conference on Big Data and Internet of Things, Tangier, Morocco, 23–24 October 2019; pp. 1–7. [Google Scholar]
  11. Minhad, K.N.; Ali, S.H.M.; Reaz, M.B.I. Happy-anger emotions classifications from electrocardiogram signal for automobile driving safety and awareness. J. Transp. Health 2017, 7, 75–89. [Google Scholar] [CrossRef]
  12. Lee, B.G.; Chong, T.W.; Lee, B.L.; Park, H.J.; Kim, Y.N.; Kim, B. Wearable mobile-based emotional response-monitoring system for drivers. IEEE Trans. Hum.-Mach. Syst. 2017, 47, 636–649. [Google Scholar] [CrossRef]
  13. Barua, S.; Ahmed, M.U.; Ahlström, C.; Begum, S. Automatic driver sleepiness detection using EEG, EOG and contextual information. Expert Syst. Appl. 2019, 115, 121–135. [Google Scholar] [CrossRef]
  14. Zeng, H.; Yang, C.; Dai, G.; Qin, F.; Zhang, J.; Kong, W. EEG classification of driver mental states by deep learning. Cogn. Neurodyn. 2018, 12, 597–606. [Google Scholar] [CrossRef]
  15. Chen, L.; Zhao, Y.; Ye, P.; Zhang, J.; Zou, J. Detecting driving stress in physiological signals based on multimodal feature analysis and kernel classifiers. Expert Syst. Appl. 2017, 85, 279–291. [Google Scholar] [CrossRef]
  16. Healey, J.A.; Picard, R.W. Detecting stress during real-world driving tasks using physiological sensors. IEEE Trans. Intell. Transp. Syst. 2005, 6, 156–166. [Google Scholar] [CrossRef] [Green Version]
  17. Munla, N.; Khalil, M.; Shahin, A.; Mourad, A. Driver stress level detection using HRV analysis. In Proceedings of the 2015 International Conference on Advances in Biomedical Engineering (ICABME), Beirut, Lebanon, 16–18 September 2015; pp. 61–64. [Google Scholar]
  18. Baevsky, R.M.; Chernikova, A.G. Heart rate variability analysis: Physiological foundations and main methods. Cardiometry 2017, 66–76. [Google Scholar] [CrossRef] [Green Version]
  19. Cardone, D.; Merla, A. New frontiers for applications of thermal infrared imaging devices: Computational psychopshysiology in the neurosciences. Sensors 2017, 17, 1042. [Google Scholar] [CrossRef] [PubMed] [Green Version]
  20. Filippini, C.; Perpetuini, D.; Cardone, D.; Chiarelli, A.M.; Merla, A. Thermal infrared imaging-based affective computing and its application to facilitate human robot interaction: A review. Appl. Sci. 2020, 10, 2924. [Google Scholar] [CrossRef]
  21. Engert, V.; Merla, A.; Grant, J.A.; Cardone, D.; Tusche, A.; Singer, T. Exploring the use of thermal infrared imaging in human stress research. PLoS ONE 2014, 9, e90782. [Google Scholar] [CrossRef] [Green Version]
  22. Cruz-Albarran, I.A.; Benitez-Rangel, J.P.; Osornio-Rios, R.A.; Morales-Hernandez, L.A. Human emotions detection based on a smart-thermal system of thermographic images. Infrared Phys. Technol. 2017, 81, 250–261. [Google Scholar] [CrossRef]
  23. Perpetuini, D.; Cardone, D.; Bucco, R.; Zito, M.; Merla, A. Assessment of the Autonomic Response in Alzheimer’s Patients During the Execution of Memory Tasks: A Functional Thermal Imaging Study. Available online: https://0-www-ingentaconnect-com.brum.beds.ac.uk/content/ben/car/2018/00000015/00000010/art00007 (accessed on 25 June 2020).
  24. Puri, C.; Olson, L.; Pavlidis, I.; Levine, J.; Starren, J. StressCam: Non-contact measurement of users’ emotional states through thermal imaging. In CHI’05 Extended Abstracts on Human Factors in Computing Systems; ACM: Portland, OR, USA, 2005; pp. 1725–1728. [Google Scholar]
  25. Pavlidis, I.; Tsiamyrtzis, P.; Shastri, D.; Wesley, A.; Zhou, Y.; Lindner, P.; Buddharaju, P.; Joseph, R.; Mandapati, A.; Dunkin, B.; et al. Fast by nature-how stress patterns define human experience and performance in dexterous tasks. Sci. Rep. 2012, 2, 305. [Google Scholar] [CrossRef] [Green Version]
  26. Kang, J.; McGinley, J.A.; McFadyen, G.; Babski-Reeves, K. Determining learning level and effective training times using thermography. In Proceedings of the Army Science Conference, Orlando, FL, USA, 27–30 November 2006. [Google Scholar]
  27. Stemberger, J.; Allison, R.S.; Schnell, T. Thermal imaging as a way to classify cognitive workload. In Proceedings of the 2010 Canadian Conference on Computer and Robot Vision, Ottawa, ON, Canada, 31 May–2 June 2010; pp. 231–238. [Google Scholar]
  28. Ebrahimian-Hadikiashari, S.; Nahvi, A.; Homayounfard, A.; Bakhoda, H. Monitoring the variation in driver respiration rate from wakefulness to drowsiness: A non-intrusive method for drowsiness detection using thermal imaging. J. Sleep Sci. 2018, 3, 1–9. [Google Scholar]
  29. Knapik, M.; Cyganek, B. Driver’s fatigue recognition based on yawn detection in thermal images. Neurocomputing 2019, 338, 274–292. [Google Scholar] [CrossRef]
  30. Zhang, M.; Ihme, K.; Drewitz, U. Discriminating drivers’ emotions through the dimension of power: Evidence from facial infrared thermography and peripheral physiological measurements. Transp. Res. Part F Traffic Psychol. Behav. 2019, 63, 135–143. [Google Scholar] [CrossRef]
  31. Yamakoshi, T.; Yamakoshi, K.; Tanaka, S.; Nogawa, M.; Park, S.B.; Shibata, M.; Sawada, Y.; Rolfe, P.; Hirose, Y. Feasibility study on driver’s stress detection from differential skin temperature measurement. In Proceedings of the 2008 30th Annual International Conference of the IEEE Engineering in Medicine and Biology Society, Vancouver, BC, Canada, 20–24 August 2008; pp. 1076–1079. [Google Scholar]
  32. Pavlidis, I.; Dcosta, M.; Taamneh, S.; Manser, M.; Ferris, T.; Wunderlich, R.; Akleman, E.; Tsiamyrtzis, P. Dissecting driver behaviors under cognitive, emotional, sensorimotor, and mixed stressors. Sci. Rep. 2016, 6, 25651. [Google Scholar] [CrossRef] [PubMed]
  33. Praveena, M.; Jaiganesh, V. A literature review on supervised machine learning algorithms and boosting process. Int. J. Comput. Appl. 2017, 169, 32–35. [Google Scholar] [CrossRef]
  34. World Medical Association Declaration of Helsinki: Ethical principles for medical research involving human subjects. JAMA 2000, 284, 3043–3045. [CrossRef]
  35. City Car Driving—Car Driving Simulator, PC Game. Available online: https://citycardriving.com/ (accessed on 26 June 2020).
  36. Conover, M.B. Understanding Electrocardiography; Elsevier Health Sciences: St. Luis, MO, USA, 2002; ISBN 978-0-323-01905-7. [Google Scholar]
  37. Tarvainen, M.P.; Niskanen, J.-P.; Lipponen, J.A.; Ranta-aho, P.O.; Karjalainen, P.A. Kubios HRV—A Software for Advanced Heart Rate Variability Analysis. In Proceedings of the 4th European Conference of the International Federation for Medical and Biological Engineering, Antwerp, Belgium, 23–27 November 2008; Vander Sloten, J., Verdonck, P., Nyssen, M., Haueisen, J., Eds.; Springer: Berlin/Heidelberg, Germany, 2009; pp. 1022–1025. [Google Scholar]
  38. Bradski, G.; Kaehler, A. Learning OpenCV: Computer Vision with the OpenCV Library; O’Reilly Media, Inc.: Champaign, IL, USA, 2008; ISBN 978-0-596-55404-0. [Google Scholar]
  39. Filippini, C.; Spadolini, E.; Cardone, D.; Bianchi, D.; Preziuso, M.; Sciarretta, C.; del Cimmuto, V.; Lisciani, D.; Merla, A. Facilitating the child–robot interaction by endowing the robot with the capability of understanding the child engagement: The case of mio amico robot. Int. J. Soc. Robot. 2020, 1–13. [Google Scholar] [CrossRef]
  40. Baltrušaitis, T.; Robinson, P.; Morency, L.-P. OpenFace: An open source facial behavior analysis toolkit. In Proceedings of the 2016 IEEE Winter Conference on Applications of Computer Vision (WACV), Lake Placid, NY, USA, 7–9 March 2016; pp. 1–10. [Google Scholar]
  41. Amos, B.; Ludwiczuk, B.; Satyanarayanan, M. Openface: A general-purpose face recognition library with mobile applications. CMU Sch. Comput. Sci. 2016, 6, 1–18. [Google Scholar]
  42. Baltrusaitis, T.; Robinson, P.; Morency, L.-P. Constrained Local Neural Fields for Robust Facial Landmark Detection in the Wild. In Proceedings of the IEEE International Conference on Computer Vision Workshops, Sydney, Australia, 2–8 December 2013; pp. 354–361. [Google Scholar]
  43. Zhang, K.; Zhang, Z.; Li, Z.; Qiao, Y. Joint Face Detection and Alignment Using Multitask Cascaded Convolutional Networks. IEEE Signal Process. Lett. 2016, 23, 1499–1503. [Google Scholar] [CrossRef] [Green Version]
  44. Ioannou, S.; Gallese, V.; Merla, A. Thermal infrared imaging in psychophysiology: Potentialities and limits. Psychophysiology 2014, 51, 951–963. [Google Scholar] [CrossRef] [Green Version]
  45. Vehtari, A.; Gelman, A.; Gabry, J. Practical Bayesian model evaluation using leave-one-out cross-validation and WAIC. Stat. Comput. 2017, 27, 1413–1432. [Google Scholar] [CrossRef] [Green Version]
  46. Crone, S.F.; Guajardo, J.; Weber, R. A study on the ability of support vector regression and neural networks to forecast basic time series patterns. In Proceedings of the IFIP International Conference on Artificial Intelligence in Theory and Practice, Santiago, Chile, 21–24 August 2006; Springer: Boston, MA, USA, 2006; pp. 149–158. [Google Scholar]
  47. Dupret, G.; Koda, M. Bootstrap re-sampling for unbalanced data in supervised learning. Eur. J. Oper. Res. 2001, 134, 141–156. [Google Scholar] [CrossRef]
  48. Zweig, M.H.; Campbell, G. Receiver-operating characteristic (ROC) plots: A fundamental evaluation tool in clinical medicine. Clin. Chem. 1993, 39, 561–577. [Google Scholar] [CrossRef]
  49. Baltrušaitis, T. Automatic Facial Expression Analysis. Ph.D. Thesis, University of Cambridge, Cambridge, UK, 2014. [Google Scholar]
  50. Dahliani, E.R.; Rahmatan, H.; Djufri. The correlation between students’ interest and learning outcomes in biology. JPhCS 2020, 1460, 012072. [Google Scholar] [CrossRef]
  51. Widanti, N.; Sumanto, B.; Rosa, P.; Fathur Miftahudin, M. Stress level detection using heart rate, blood pressure, and GSR and stress therapy by utilizing infrared. In Proceedings of the 2015 International Conference on Industrial Instrumentation and Control (ICIC), Pune, India, 28–30 May 2015; pp. 275–279. [Google Scholar]
  52. Lacy, C.R.; Contrada, R.J.; Robbins, M.L.; Tannenbaum, A.K.; Moreyra, A.E.; Chelton, S.; Kostis, J.B. Coronary vasoconstriction induced by mental stress (simulated public speaking). Am. J. Cardiol. 1995, 75, 503–505. [Google Scholar] [CrossRef]
  53. Kim, H.-Y. Statistical notes for clinical researchers: Assessing normal distribution (2) using skewness and kurtosis. Restor. Dent. Endod. 2013, 38, 52–54. [Google Scholar] [CrossRef] [PubMed]
  54. Pereira, C.B.; Yu, X.; Czaplik, M.; Rossaint, R.; Blazek, V.; Leonhardt, S. Remote monitoring of breathing dynamics using infrared thermography. Biomed. Opt. Express 2015, 6, 4378–4394. [Google Scholar] [CrossRef] [PubMed]
  55. Widjaja, D.; Orini, M.; Vlemincx, E.; Van Huffel, S. Cardiorespiratory Dynamic Response to Mental Stress: A Multivariate Time-Frequency Analysis. Comput. Math. Methods Med. 2013, 2013. [Google Scholar] [CrossRef] [PubMed]
  56. Vlemincx, E.; Taelman, J.; Peuter, S.D.; Diest, I.V.; Bergh, O.V.D. Sigh rate and respiratory variability during mental load and sustained attention. Psychophysiology 2011, 48, 117–120. [Google Scholar] [CrossRef]
  57. Lohani, M.; Payne, B.R.; Strayer, D.L. A review of psychophysiological measures to assess cognitive states in real-world driving. Front. Hum. Neurosci. 2019, 13. [Google Scholar] [CrossRef]
  58. Hill, J.D.; Boyle, L.N. Driver stress as influenced by driving maneuvers and roadway conditions. Transp. Res. Part F Traffic Psychol. Behav. 2007, 10, 177–186. [Google Scholar] [CrossRef]
  59. Matthews, G.; Joyner, L.A.; Newman, R. Age and gender differences in stress responses during simulated driving. Proc. Hum. Factors Ergon. Soc. Annu. Meet. 1999, 43, 1007–1011. [Google Scholar] [CrossRef]
  60. Daanen, H.A.; Van De Vliert, E.; Huang, X. Driving performance in cold, warm, and thermoneutral environments. Appl. Ergon. 2003, 34, 597–602. [Google Scholar] [CrossRef]
Figure 1. Experimental setting for the proposed study: (a) driving simulator, lateral view; (b) screenshot of the software used for the driving simulation: City Car Driving [34].
Applsci 10 05673 g001
Figure 2. Imaging acquisition system: (a) depth visible camera and (b) thermal camera.
Applsci 10 05673 g002
Figure 3. Schematic representation of the 68 facial landmarks identified by the algorithm implemented in the OpenFace software.
Applsci 10 05673 g003
Figure 4. (a) Facial landmark identification in the visible image by OpenFace; (b) facial landmark identification in the corresponding thermal image applying the geometrical transformation obtained from the optical co-registration process; (c) Regions Of Interest (ROIs) identification (nose tip, right and left nostrils, glabella); (d) average thermal signals extracted from the ROIs in an exemplificative time window of 50 s. Notice the breathing signal is clearly appreciable from the right and left nostrils’ average thermal signals plots.
Applsci 10 05673 g004
Figure 5. Flow chart of the applied machine learning approach: the thermal features are used as predictors whilst the Electrocardiogram(ECG)-derived Stress Index (SI) is considered as the regression output. Support Vector Regression with Radial Basis Function kernel (SVR-RBF) was used as regressor. A leave-one-subject-out cross-validation was employed to test the generalization of the regression. The result of the regression (SIcross) was then used to perform a two-level classification of the driver’s stress (i.e., STRESS versus NO STRESS). Since the two classes were not balanced, a bootstrap procedure was implemented. Receiver Operating Characteristic (ROC) analysis was executed to investigate the performance of the classifier.
Applsci 10 05673 g005
Figure 6. (a) Correlation plot between SI and SIcross. The equation of the interpolating line is reported in the top left section of the graph. A good performance of the multivariate analysis is revealed by the correlation score (r = 0.61, p = ~0); (b) weights associated to each z-scored regressor for each ROI. The weights are indicative of the contribution of each model input in the estimation of the SI.
Applsci 10 05673 g006
Figure 7. Results after bootstrap procedure (n_iterations = 10,000). (a) Among iteration average ROC curve and (b) distribution of the Area Under Curve (AUC) obtained after the bootstrap procedure. The average AUC was 0.80 with a standard deviation of 0.01.
Applsci 10 05673 g007
Table 1. Experimental settings of the driving software City Car Driving.
City Car Driving SettingsConditions
Weather• Season: Autumn
• Weather condition: Foggy
• Time of the day: Daytime
Traffic• Traffic density: 50%
• Traffic behavior: Intense traffic
• Fullness of traffic: 60%
Territory• Area: New city
• Location: Modern district
Emergency situations• Dangerous change of traffic: Often
• Emergency braking of the car ahead: Often
• Pedestrian crossing the road in a wrong place: Often
• Accident on the road: Often
• Dangerous entrance of the vehicle into the oncoming lane: Rarely
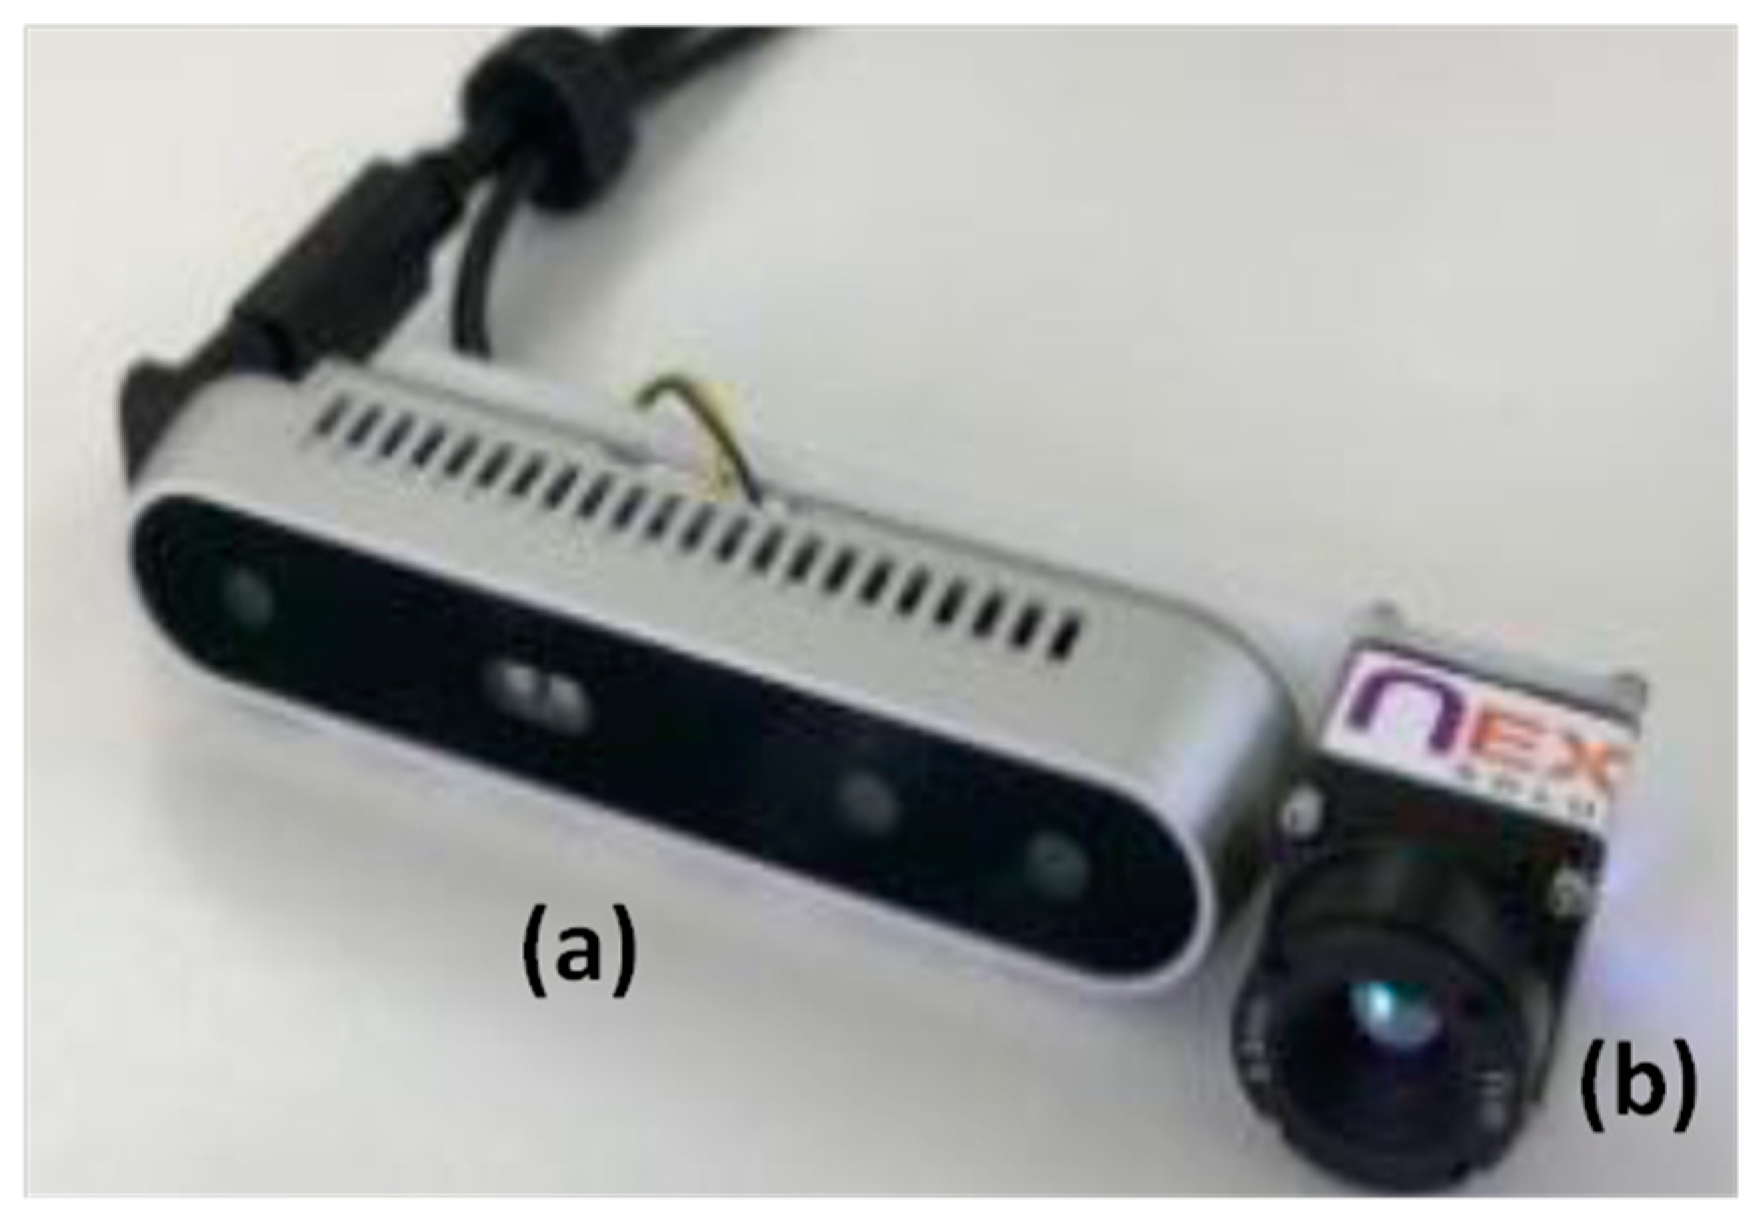
Table 2. Technical characteristics of the depth camera Intel RealSense D415 and FLIR Boson 320LW IR thermal camera.
Technical DataIntel RealSense D415FLIR Boson 320 LWIR
Weight4.54 g7.5 g without lens
Dimensions99 × 20 × 23 mm21 × 21 × 11 mm without lens
Spatial resolutionFull HD 1080p (1920 × 1080)320 × 256
Acquisition rate30 fps @ 1080p30 fps
Field of view (FOV)69.4° × 42.5° × 77° (±3°)92° HFoV 1
Sensors technologyRolling Shutter, 1.4 μm × 1.4 μm pixel sizeUncooled VOx microbolometer
Thermal Sensitivity-<50 mK (Professional)
1 Horizontal field of view.
Table 3. Geometrical features of the considered ROIs.
Region of Interest (ROI)ROI ShapeROI Position Relative to 68 Facial Landmark
ROI 1—Nose tipCircle C = [ x 31 + x 34 2 , y 31 + y 34 2 ] , d = 7 pixel 1
ROI 2—Right nostrilCircle C = [ x 33 , y 33 ] , d = 7 pixel 1
ROI 3—Left nostrilCircle C = [ x 35 , y 35 ] , d = 7 pixel 1
ROI 4—GlabellaPolygonPolyline ([P22, P23, P28]) 2
1 C = circle center; d = circle diameter; 2 Pn = n-th landmark; n = 1, …, 68.
Table 4. Indices of performance of landmark identification and face classification on visible imaging.
Subject IDSuccess (%)Confidence
Subject 01100.000.93
Subject 0299.870.98
Subject 0377.900.76
Subject 0499.970.98
Subject 0570.540.66
Subject 0698.940.96
Subject 0799.870.91
Subject 0899.800.93
Subject 0999.860.97
Subject 1099.810.96
Table 5. Confusion matrix of the classification procedure.
ConditionsNO STRESSSTRESS
NO STRESS78%22%
STRESS23%77%

