Article

COVID-XNet: A Custom Deep Learning System to Diagnose and Locate COVID-19 in Chest X-ray Images

by
Lourdes Duran-Lopez
1,*,
Juan Pedro Dominguez-Morales
1,
Jesús Corral-Jaime
2,
Saturnino Vicente-Diaz
1 and
Alejandro Linares-Barranco
1,3
1
Robotics and Tech. of Computers Lab, ETSII-EPS, Universidad de Sevilla, 41011 Seville, Spain
2
Servicio de Oncología Médica, Clinica Universidad de Navarra, 28027 Madrid, Spain
3
Smart Computer Systems Researh and Engineering Lab (SCORE), Research Institute of Computer Engineering (I3US), Universidad de Sevilla, 41012 Seville, Spain
*
Author to whom correspondence should be addressed.
Submission received: 15 July 2020 / Revised: 7 August 2020 / Accepted: 13 August 2020 / Published: 16 August 2020

Abstract

:

Featured Application

This work could be used to aid radiologists in the screening process, contributing to the fight against COVID-19.

Abstract

The COVID-19 pandemic caused by the new coronavirus SARS-CoV-2 has changed the world as we know it. An early diagnosis is crucial in order to prevent new outbreaks and control its rapid spread. Medical imaging techniques, such as X-ray or chest computed tomography, are commonly used for this purpose due to their reliability for COVID-19 diagnosis. Computer-aided diagnosis systems could play an essential role in aiding radiologists in the screening process. In this work, a novel Deep Learning-based system, called COVID-XNet, is presented for COVID-19 diagnosis in chest X-ray images. The proposed system performs a set of preprocessing algorithms to the input images for variability reduction and contrast enhancement, which are then fed to a custom Convolutional Neural Network in order to extract relevant features and perform the classification between COVID-19 and normal cases. The system is trained and validated using a 5-fold cross-validation scheme, achieving an average accuracy of 94.43% and an AUC of 0.988. The output of the system can be visualized using Class Activation Maps, highlighting the main findings for COVID-19 in X-ray images. These promising results indicate that COVID-XNet could be used as a tool to aid radiologists and contribute to the fight against COVID-19.

1. Introduction

COVID-19 is the disease caused by the new severe acute respiratory syndrome coronavirus 2 (SARS-CoV-2), which was recently declared a pandemic [1]. Coronaviruses are an extensive family of viruses that may affect both humans and animals, causing problems to the respiratory system [2]. Other well-known human coronaviruses identified in the past are SARS-CoV and the Middle East respiratory syndrome-related coronavirus (MERS-CoV), which have had around 8100 and 2500 confirmed cases, with a case fatality rate of around 9.2% and 37.1%, respectively [3,4].
Globally, as of 12 August 2020, the number of confirmed deaths worldwide caused by COVID-19 has surpassed 700 k, with more than 215 countries, areas or territories affected and a total of more than 18 million confirmed cases [2], plunging humanity into a severe state of fear whose outcome is still unknown.
COVID-19 spreads through direct contact with respiratory drops that are produced when an infected person coughs, speaks, sneezes, or even breaths. These droplets can enter the host’s body through the nose, mouth, and tear ducts, giving a passage to the mucous membranes in the throat. Through this process of transmission, the virus reaches the respiratory tract.
Some studies have confirmed angiotensin receptor 2 (ACE2) as the receptor through which the virus enters the respiratory mucosa [5]. After reaching the lung alveoli, the virus starts to replicate itself, increasing the viral load within the host cell. Type II pneumocytes are destroyed, releasing specific inflammatory mediators. Consequently, lungs might become inflamed, which could lead to pneumonia in the most severe cases [6].
Early detection of COVID-19 is crucial to control outbreaks and prevent the virus from spreading. Current diagnostic tests for COVID-19 include reverse-transcription polymerase chain reaction (RT-PCR), real-time RT-PCR (rRT-PCR), and reverse-transcription loop-mediated isothermal amplification (RT-LAMP) [7].
Patients who have been exposed to the virus and present severe symptoms could still get a negative result in the RT-PCR test [7,8,9]. Therefore, in these cases, COVID-19 should be diagnosed with medical imaging techniques, such as X-ray or chest Computed Tomography (CT) [7]. Although CT has proved to be one of the most precise diagnostic methods for COVID-19 [10], it has some important limitations, including around 70× higher ionizing radiation than X-ray [11], its high cost, and the fact that it cannot be performed as a bedside test [12]. Therefore, it is not routinely used in COVID-19 diagnosis [13]. Moreover, it is not suitable for monitoring the evolution of specific cases, particularly in critically ill patients. On the other hand, X-ray is a less sensitive modality in the detection of COVID-19 as compared to CT with a reported baseline sensitivity of 69% [14]. However, X-ray is a cheaper and faster alternative, and it is also available in most hospitals. Therefore, X-ray will likely be the primary imaging modality used for COVID-19 diagnosis and management. With high clinical suspicion for COVID-19 infection, positive X-ray findings can obviate the need for CT scanning [14]. However, it is important to consider that these techniques may present limitations to particular patients such as pregnant women, since they could cause harm to unborn children [15].
The most common findings that radiologists look for when analyzing X-ray images for COVID-19 diagnosis are multiple, patchy, sub-segmental, or segmental ground glass density shadows in both lungs [16]. This process could be automated in order to aid experts when making a decision [17]. For this, Computer-Aided Diagnosis (CAD) systems, which have been widely used for medical image analysis and diagnosis in the last years [18,19], could play an important role.
Although COVID-19 is a very recent topic, many researchers have carried out studies to find solutions during this crisis. In [20], a review of recent artificial intelligence-based CAD systems for COVID-19 diagnosis in CT and X-ray images is presented; however, since our work is based on X-ray images, we only focused on the latter. Ghoshal et al. [21] presented a Bayesian Convolutional Neural Network (CNN) to estimate the diagnosis uncertainty in COVID-19 prediction, distinguishing between COVID-19 and non-COVID-19 cases (other types of pneumonia and healthy patients), obtaining an accuracy of 92.9%. Narin et al. [22] performed a binary classification between COVID-19 and normal cases comparing different Deep Learning (DL) models, achieving 98.0% accuracy with the ResNet50 model in the best case. Zhang et al. [23] presented a ResNet-based model for classifying COVID-19 (0.952 AUC), highlighting the pneumonia-affected regions by applying the Gradient-weighted Class Activation Mapping (Grad-CAM) method. Finally, Wang et al. [24] proposed a Deep CNN to classify between COVID-19, non-COVID-19 (distinguishing between viral and bacterial), and normal cases, obtaining an accuracy of 83.5%.
These studies achieved accurate solutions to fight against the COVID-19 pandemic. However, they have some limitations that should be considered. First of all, they used small datasets with less than 400 COVID-19 X-ray images in total in the best case. To validate the system, some of them only used 10 X-ray images for the COVID-19 class. Moreover, works that proposed not only COVID-19 detection, but also locating affected areas of the lungs, did not include any ground truth comparison or medical supervision with the obtained results.
In this work, we present a DL-based CAD system, named COVID-XNet, which classifies between COVID-19 and normal frontal X-ray chest images. The network focuses on specific regions of the lungs in order to perform a prediction and detect whether the patient has COVID-19. The output of the system can be then represented in a heatmap-like plot by performing the Class Activation Map (CAM) algorithm, which locates the affected areas. The high reliability obtained in the results, which were supervised by a lung specialist, indicates that this system could be used to aid expert radiologists as a screening test for COVID-19 diagnosis in patients with clinical manifestations, helping them throughout this stage and to overcome this situation.
The rest of the paper is structured, as follows: first, materials and methods are presented in Section 2, focusing on the dataset and the CNN model. Subsequently, results and discussion are presented in Section 3, where a quantitative evaluation is performed, along with the visualization of the pulmonary areas that are affected by COVID-19. Finally, the conclusions over the obtained results are presented in Section 4.

2. Materials and Methods

In this section, the dataset used for this work and the custom CNN model are described, detailing each of them in different subsections.

2.1. Materials

In this work, different publicly-available datasets were taken into account to build a diverse and large collection of chest X-ray images from healthy patients and COVID-19 cases. Both posteroanterior (PA) and anteroposterior (AP) projections were considered, discarding lateral X-ray images.
For the COVID-19 class, chest X-ray images were obtained from the BIMCV-COVID19+ dataset, being provided by the Medical Imaging Databank of the Valencia Region (BIMCV) [25] and from the COVID-19 image data collection from Cohen et al. [26]. On the other hand, for healthy patients, images were obtained from the PadChest dataset, also provided by BIMCV [27]. From the total number of images labeled as normal from this dataset, around the first 10% were used, since, otherwise, the imbalance between the number of cases for COVID-19 and healthy patients would have been very high. Therefore, a total of 2589 images from 1429 patients and 4337 images from 4337 patients were considered for COVID-19 and normal classes, respectively.

2.2. Methods

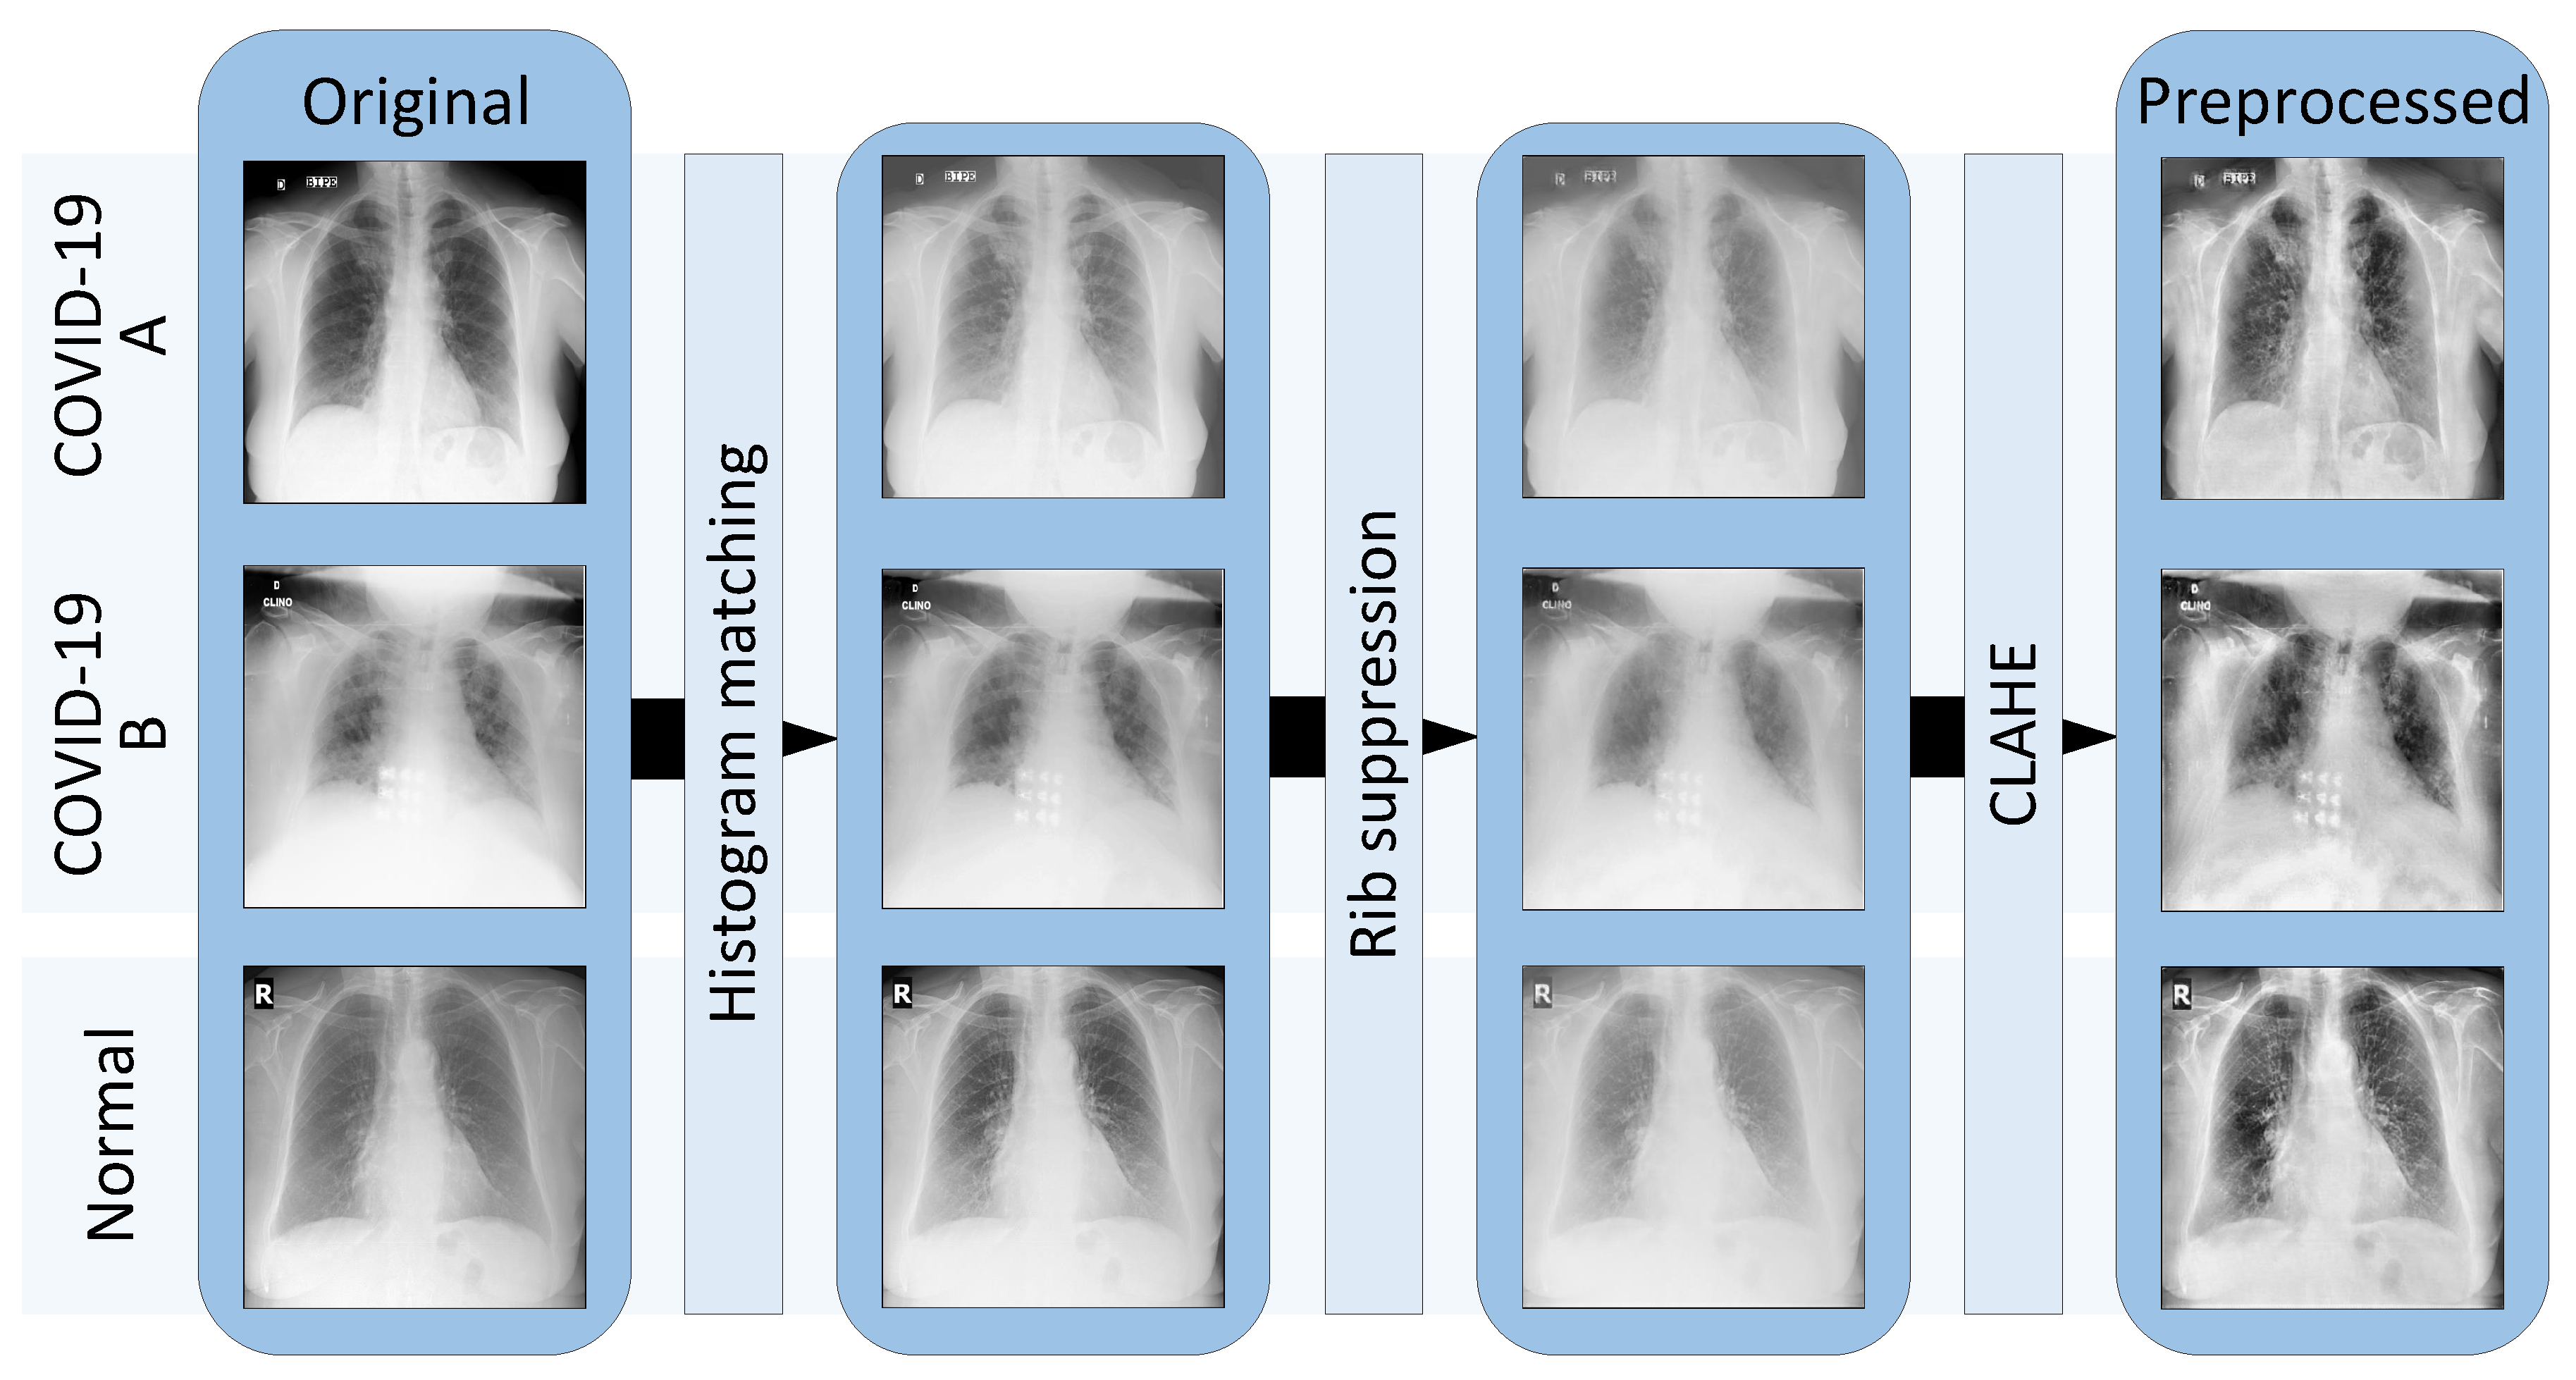
2.2.1. Preprocessing Step

A preprocessing step, which included different techniques, was applied to the original images in order to reduce the large variability of these images.
Firstly, all of the images were converted to grayscale. Because the original images came from different hospitals and, consequently, from different X-ray machines, a histogram matching process was applied to every image, taking one of them as a reference [28]. Therefore, all images in the dataset were similar in terms of histogram distribution.
Subsequently, rib shadows were suppressed from the X-ray images with a pretrained autoencoder model developed by Chuong M. Huynh, which is publicly available in GitHub (www.github.com/hmchuong/ML-BoneSuppression). This makes it easier for the network to focus on relevant information within the lungs. Rib shadows suppression has been applied in other works related to lung cancer, pulmonary nodules, and pneumonia detection in chest radiography, proving to be a useful approach to help radiologists and machine learning systems when diagnosing lung related diseases [29,30,31,32,33].
After this process, a contrast enhancement method, called Contrast Limited Adaptive Histogram Equalization (CLAHE) [34], was used to improve local contrast and enhance image definition.
Figure 1 shows the whole preprocessing phase, where each algorithm’s output is presented for three different examples.

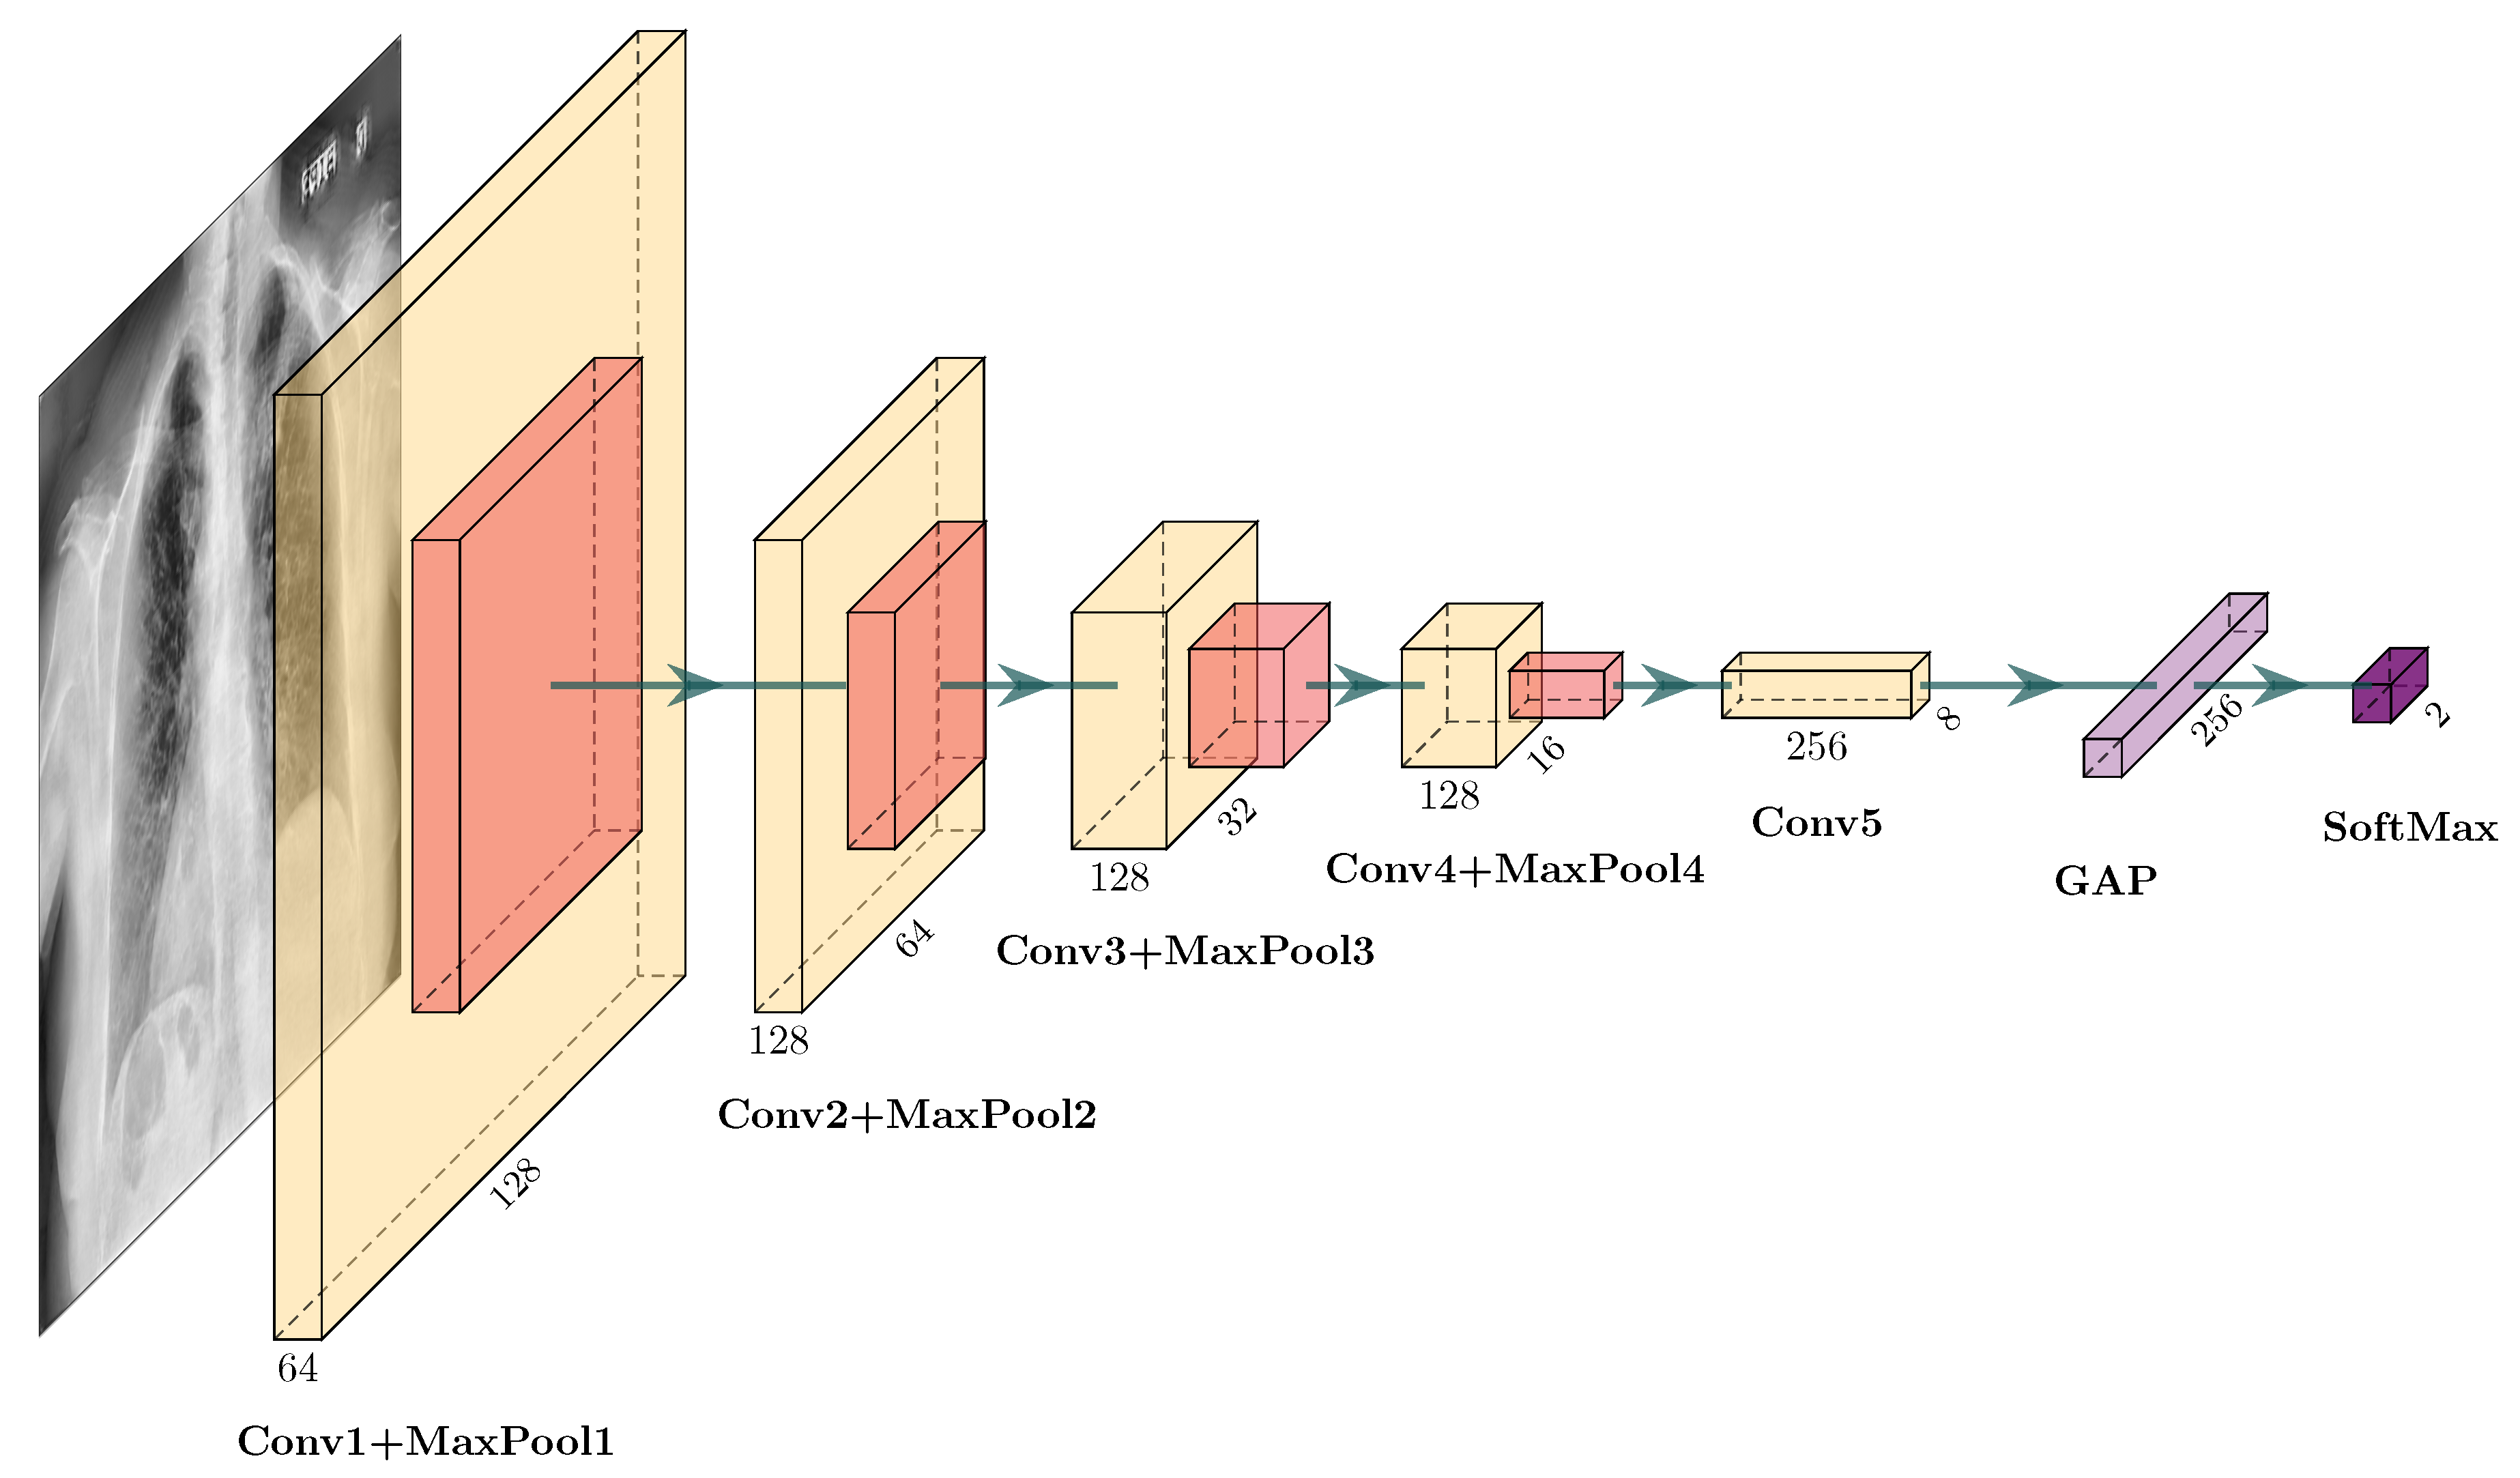
2.2.2. Convolutional Neural Network

After applying the preprocessing step, the obtained images were used as input to a custom CNN model that was trained from scratch to classify between COVID-19 and normal cases. This model consists of the following set of layers: five convolutions, four max poolings, a Global Average Pooling (GAP), and a final softmax layer (see Figure 2). This custom model was selected by means of an Exhaustive Grid Search over the number of layers and kernel’s sizes, prioritizing accuracy and computational complexity. Layers were explored from one up to the maximum number of layers that allowed having features of over one × one pixels before the GAP layer. Kernel sizes were explored from three × three up to 11 × 11. The best configuration over all the different possibilities was the one selected.

2.2.3. Training and Testing the Network

To ensure that our model was generalizing well with data that it had not been trained with, a stratified five-fold cross-validation was used to train and validate the network with all the images. This allowed obtaining more robust results on the different metrics that were used, which are presented in Section 2.2.4. For this approach, the images were split in five different sets, taking into account that images from the same patient were only present in a single set. Subsequently, the model was trained five times, where four out of the five sets were used for training and the remaining one for validation. Therefore, for each fold, 80% of the dataset was considered when training the system and the remaining 20% when validating it.
Data augmentation techniques were use in order to increase the variability of the dataset. Random rotations (up to a maximum of 15 degrees), width shift (up to 20%), height shift (up to 20%), shear (up to 20%), zoom (up to 20%), and horizontal flips were applied to the input images.
In this work, Tensorflow (www.tensorflow.org) and Keras (www.keras.io) were used to train and test the CNN model. The Adadelta optimizer [35] and a batch size of 32 were set for the learning phase. Input images were resized to 128 × 128 pixels to reduce the computational complexity. Because the dataset that we used is unbalanced (i.e., there are more images corresponding to the normal class than to COVID-19), the class_weight parameter was set accordingly in Keras in order to give more importance to the COVID-19 class when training the network.

2.2.4. Performance Metrics

The following metrics were used to measure the performance of the system for the COVID-19 detection task: sensitivity (1), specificity (2), precision (3), and F1-score (4); since the dataset is unbalanced (see Section 2.1 and Section 2.2.3), the balanced accuracy was also used (5). In addition, the Area Under Curves (AUCs) of the Receiver Operating Characteristic (ROC) was calculated.
Sensitivity = 100 × T P T P + F N
Specificity = 100 × T N T N + F P
Precision = 100 × T P T P + F P
F1-score = 2 × Precision × Sensitivity Precision + Sensitivity
Balanced   accuracy = Sensitivity + Specificity 2
where TP and FP refer to true positive cases (when the system diagnoses a COVID-19 case correctly) and false positive cases (the system detects a normal X-ray image as a COVID-19 case), respectively. On the other hand, TN and FN refer to true negative cases (the system detects a normal case correctly) and false negative cases (the system diagnoses a COVID-19 case as normal), respectively.
However, we believe that only reporting the metrics of the system is not the best option to validate a model that performs COVID-19 detection in X-ray images, since the system could be learning patterns that are not related to COVID-19. This becomes a greater problem when working with small datasets that do not contemplate the variability of these images that were caused by different factors, such as the X-ray machine used and the patient’s constitution, position, or condition. For this reason, we proposed the application of CAMs to visualize what the system is focusing on when performing the prediction. In this way, CAMs can be used by specialists to validate the system’s output.

2.2.5. Class Activation Maps

Zhou et al. demonstrated that, even without providing any information of the object location inside an input image, convolutional units of CNNs work as unsupervised object detectors [36,37]. With this idea in mind, CAMs can be generated. A CAM for a particular class highlights the regions of the input image that the CNN considered relevant to perform the prediction. With this method, which allows visualizing the output of a CNN, the network cannot have any fully connected layer. Therefore, a GAP layer is applied to the feature maps obtained after the last convolution or pooling layer of the network, and the features obtained are then used to perform the classification with a SoftMax activation function.

2.2.6. Post-Processing

Because the relevant information for COVID-19 detection in frontal X-ray images only lies inside the lung area [30,32], lungs were segmented from the original images in order to discard surrounding regions. With this process, CAMs (see Section 2.2.5) only focus on this area and, therefore, clearer results in terms of visualization of the system’s output are provided. This lung segmentation step was performed using a CNN based on the U-Net model [38], which was used to solve the Radiological Society of North America (RSNA®) Pneumonia Detection Challenge (www.kaggle.com/eduardomineo/u-net-lung-segmentation-montgomery-shenzhen).

3. Results and Discussion

In this section, a quantitative evaluation of the system was performed following the performance metrics presented in Section 2.2.4. In addition, a qualitative evaluation was carried out, in which the output of the system was compared with the corresponding ground truth descriptions, and also verified by a lung specialist, in order to validate the results.

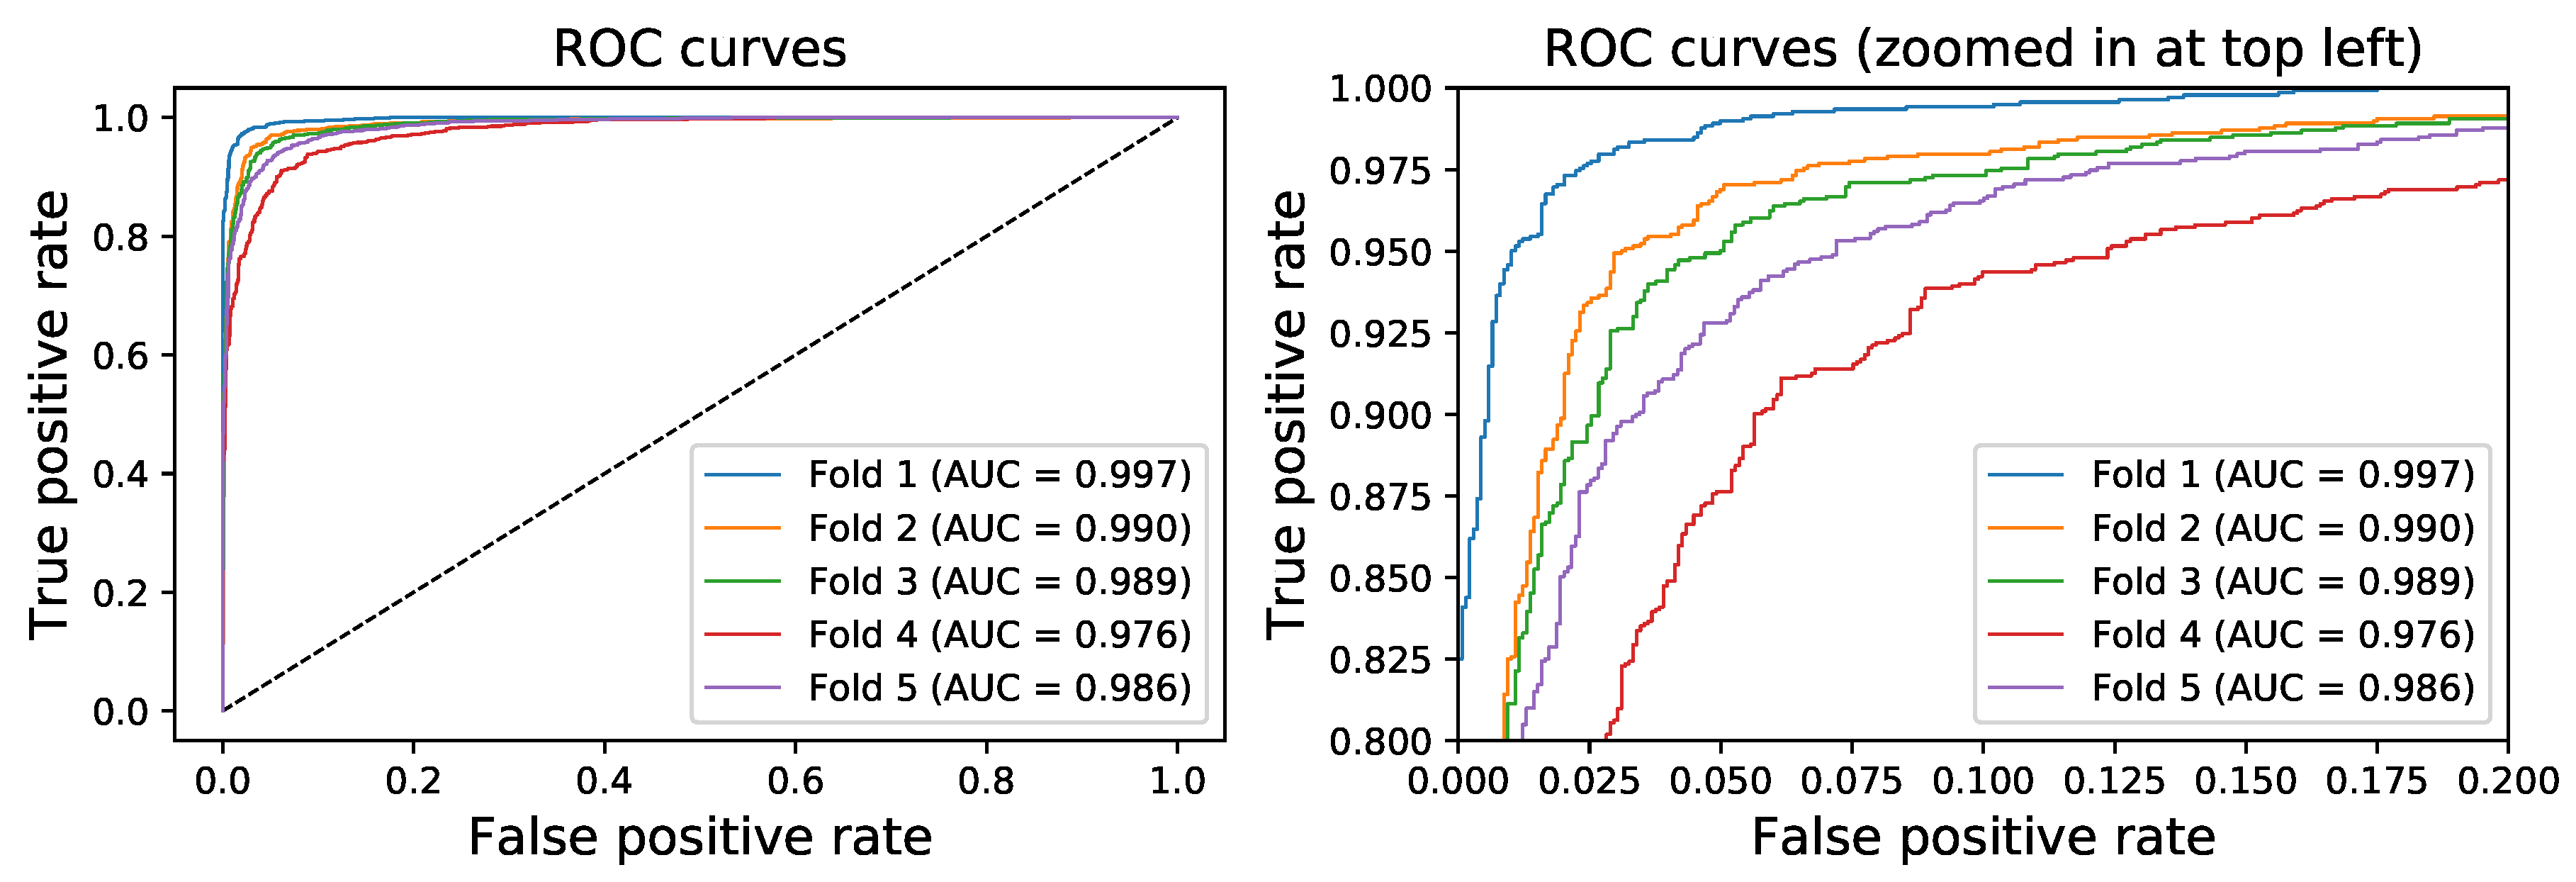
3.1. Quantitative Evaluation

The results achieved by the network after training and validating the CNN using the five-fold cross-validation are summarized in Table 1. Figure 3 presents the ROC curve for each of the cross-validation folds, which also reports their corresponding AUC values.
As can be seen, the achieved results demonstrate that the system is able to generalize well, obtaining similar and stable results across the different folds. Each of these sets achieved balanced accuracies greater than 91%, and AUC values above 0.97, which confirms that the system is very reliable when performing the classification. After calculating the average of the metrics obtained over all of the different cross-validation folds, the system achieved 92.53% sensitivity, 96.33% specificity, 93.76% precision, 93.14% F1-score, 94.43% balanced accuracy, and an AUC value of 0.988.

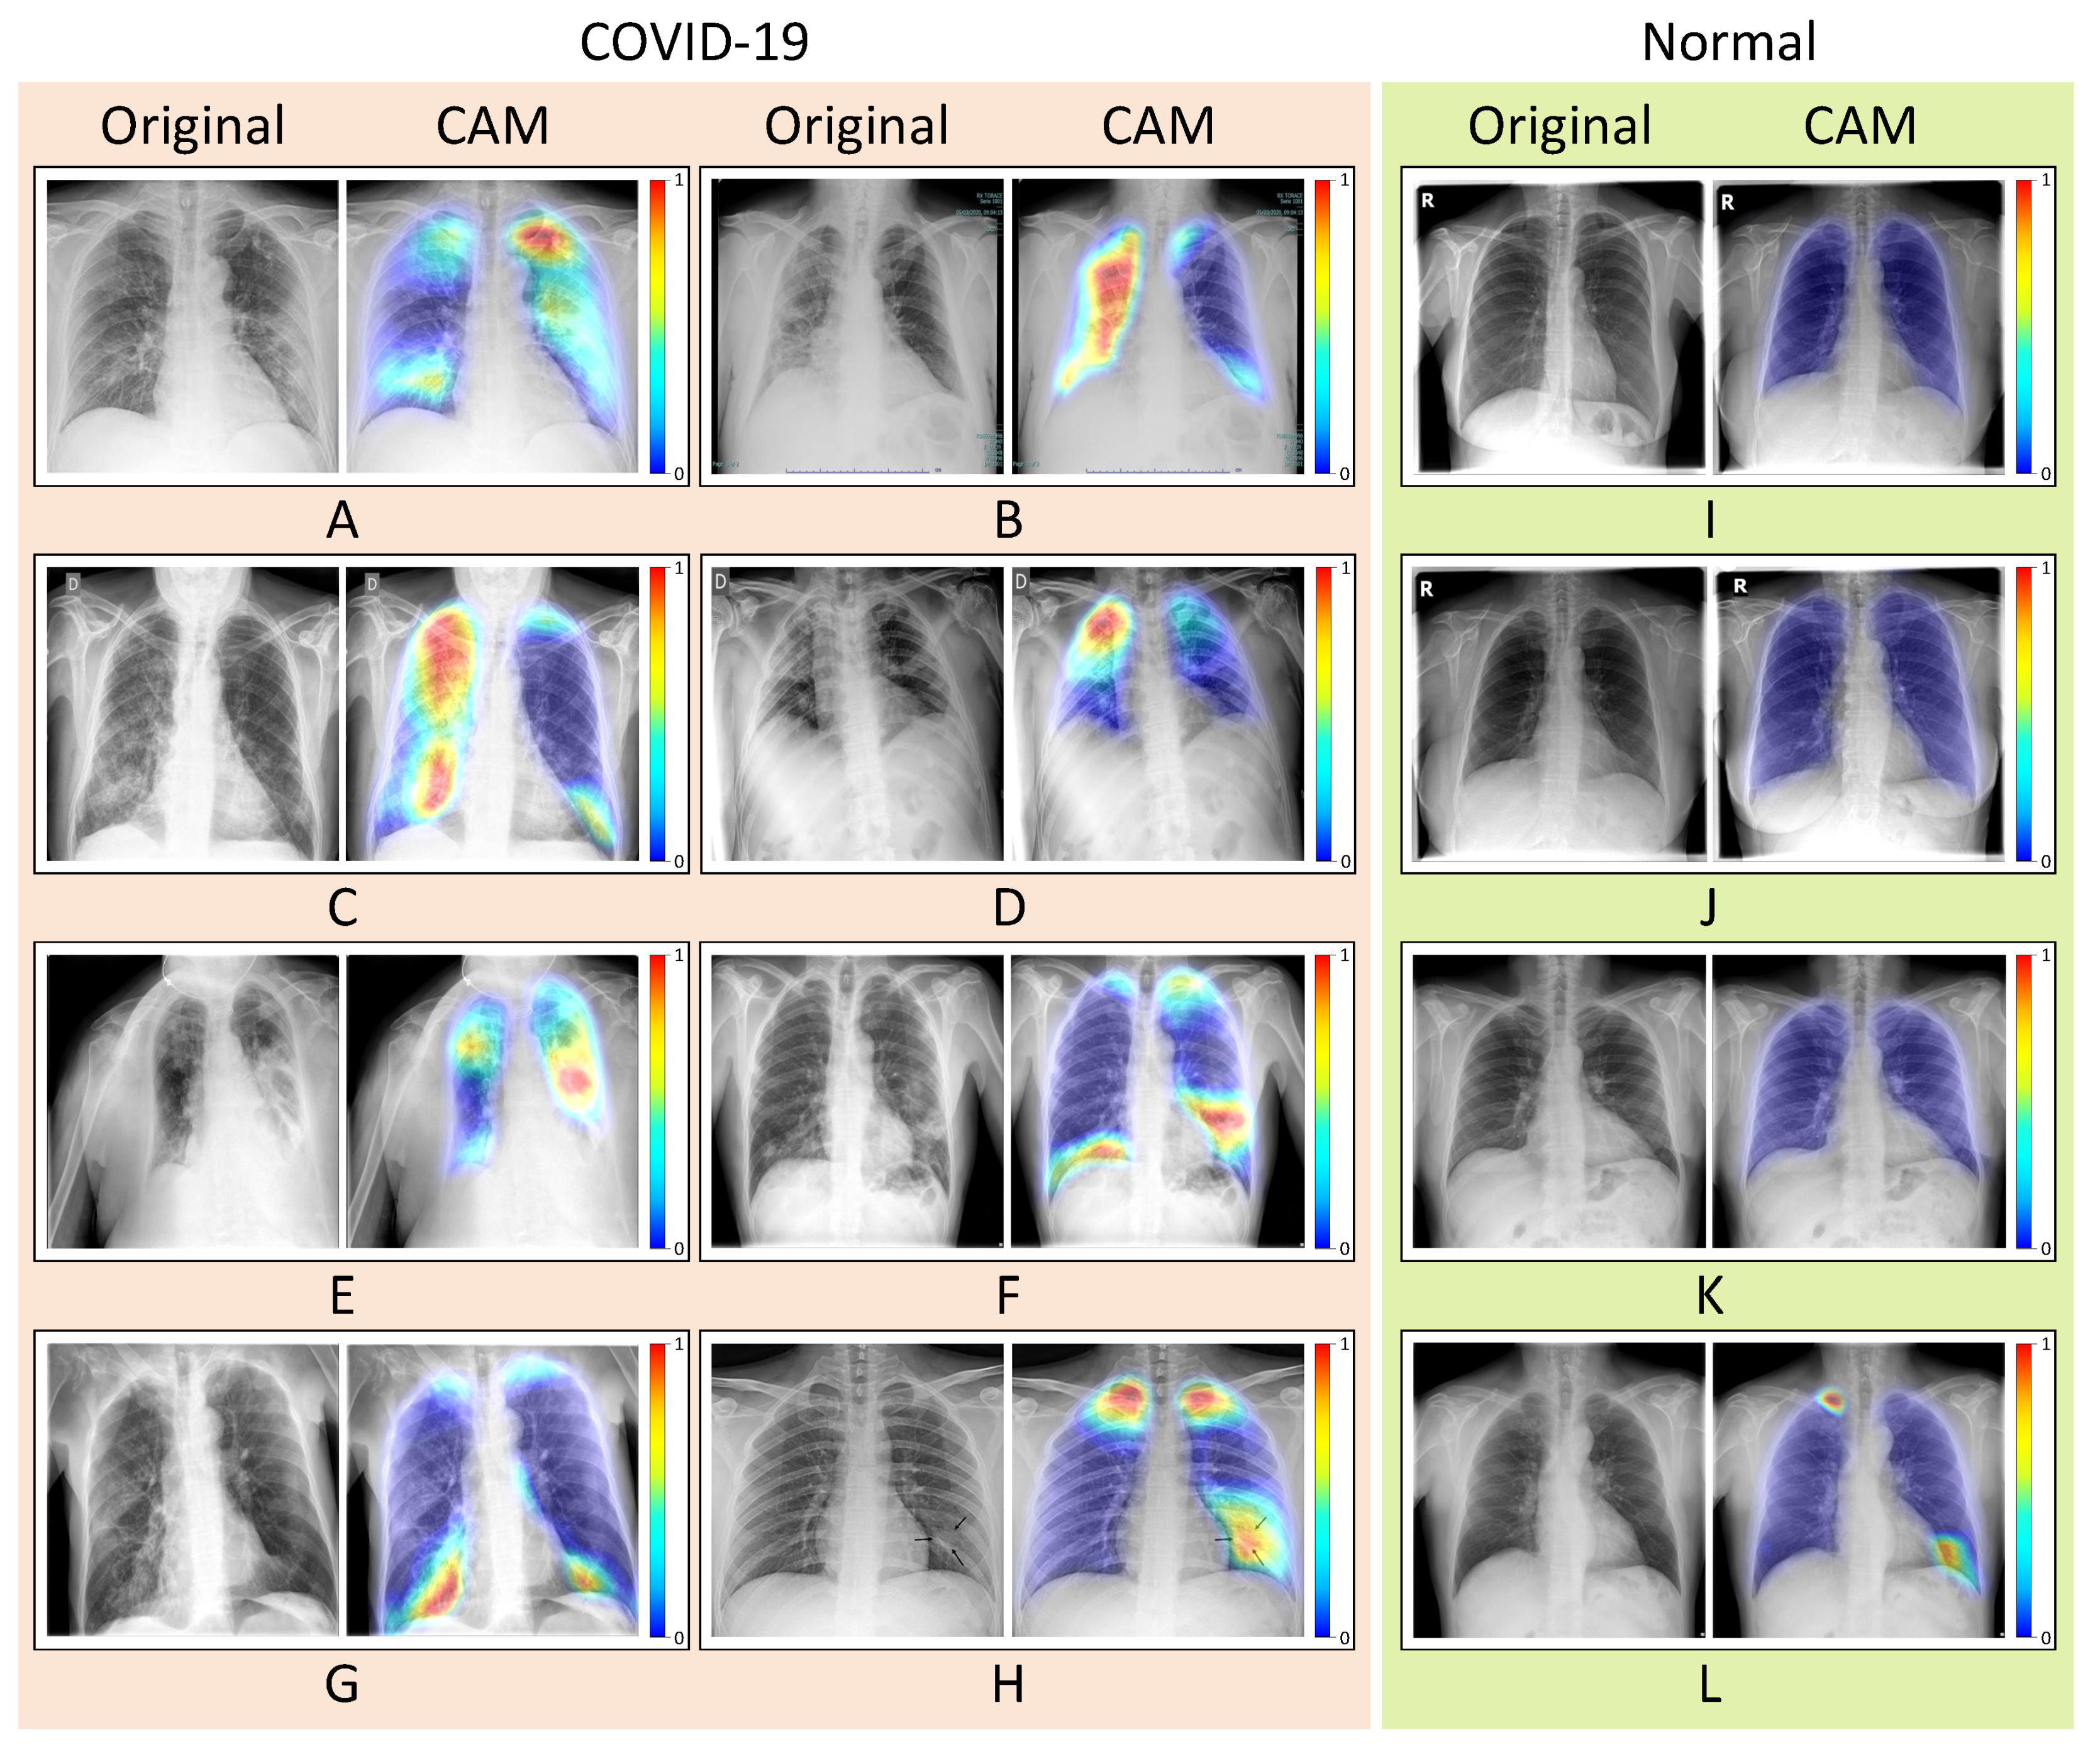
3.2. Qualitative Evaluation

CAMs are used to visualize what the network is focusing on when performing the classification, as introduced in Section 2.2.5. Figure 4 shows different input images and their corresponding CAM heatmaps obtained with COVID-XNet. The most relevant information that the network considered when performing the prediction for the COVID-19 class is highlighted in red, while regions that were not relevant for COVID-19 detection (considered as normal) are presented in dark blue.
The examples that are shown in Figure 4 present different cases that correspond to true positives (A–H), true negatives (I–K) and false positives (L). The heatmaps obtained for the true positive cases were compared to the ground truth descriptions provided in the datasets in order to verify whether the system was highlighting the correct regions inside the lung area. It is important to mention that these results were also validated by a lung specialist.
The ground truth corresponding to Figure 4A reports patchy ground-glass opacities in right upper and lower lung zones and patchy consolidation in the left middle to lower lung zones. Furthermore, several calcified granulomas were incidentally noted in the left upper lung zone. Figure 4B shows a right interstitial paracardiac thickening with a tendency to cavitation in its most cranial portion, along with a mild right hilar enlargement. Figure 4C presents consolidations in the base of the right hemithorax and an interstitial pattern that affects most of that lung. Moreover, a small pseudonodular consolidation is presented in the left paracardiac region, which could suggest another affected area. In Figure 4D, the ground truth describes the presence of right upper lobe opacity. The report for Figure 4E details the existence of alveolar infiltrates in the right upper and lower lobe, and also in the left parahilar area. As can be seen in the corresponding heatmaps for these cases (A–E), relevant areas that were described in the ground truths were detected by the system. In the case shown in Figure 4F, the patient is reported to present opacities in the base of the right lung and in the left middle and lower lung zones. The output heatmap matches this description, along with a smaller region in the left upper area which is not mentioned in the report. Lower and middle to upper right lobe consolidations are reported in Figure 4G, together with a mild small consolidation in the left lower lobe. In this case, the system was not able to detect consolidations in the middle to upper right lung area. Finally, the ground truth of Figure 4H report COVID-19 pneumonia manifesting as a single nodular lesion. The AP chest radiograph shows a single nodular consolidation (black arrows) in the left lower lung zone. In the latter case, the system detected consolidations marked by ground truth arrows, but it also mistakenly highlighted upper areas in both lungs.
For normal cases (I–L), the system did not detect any relevant COVID-19 area, except for Figure 4L, where two small regions were highlighted.
These promising results prove that, even when training the system with a large unbalanced dataset obtained from different sources, our custom model is learning specific characteristics and patterns appropriately.

4. Conclusions

In this work, the authors have presented a novel CAD system, COVID-XNet, for detecting COVID-19 in frontal chest X-ray images. The system, which consists of a custom CNN, was trained and validated from scratch with X-ray images that were obtained from publicly-available datasets. These images were preprocessed with different methods (histogram matching, rib suppression, and CLAHE) in order to enhance the relevant information. Using a five-fold cross-validation scheme, COVID-XNet achieved 92.53% sensitivity, 96.33% specificity, 93.76% precision, 93.14% F1-score, 94.43% balanced accuracy, and an AUC value of 0.988 on average over the different folds.
CAMs were used to visualize the output of the CNN, where the relevant features that the system considered for COVID-19 detection were highlighted. The obtained heatmaps were compared and verified with their corresponding ground truths from the radiologists that diagnosed these cases, and were also validated by a lung specialist.
In this work, we combined X-ray images from different publicly-available sources in order to obtain an updated dataset with a larger quantity of images than other state-of-the-art works, making the system more robust, since a greater variability of cases were explored when training and validating the model. In addition, as this work is proposed as a supporting tool to aid specialists in the screening process, we believe that it is important to verify the results with a ground truth. For this reason, a lung specialist supervised and validated our work, which is an aspect that most state-of-the-art works did not consider.
The proposed system could be useful as a screening test for COVID-19 diagnosis in combination with patients’ clinical manifestations and/or laboratory results to discard severe cases and decide whether the patient should be hospitalized. The performance of the system when predicting new unseen images shows that the model generalizes well, proving that COVID-XNet could be the first step for developing a universal CAD system for COVID-19 diagnosis in X-ray images.
This work, by no means, presents a solution that is currently ready for its production phase. More tests and improvements should be performed before considering the use of any deep learning solution in hospitals. COVID-XNet was never conceived as a replacement for human radiologists, but as a tool to aid them and contribute to the fight against COVID-19. Future research will focus on training and testing the model with more images, since, currently, only a few small datasets are available.

Author Contributions

Conceptualization, L.D.-L.; Methodology, L.D.-L.; Software, L.D.-L. and J.P.D.-M.; Validation, L.D.-L., J.P.D.-M. and J.C.-J.; Formal analysis, L.D.-L. and J.P.D.-M.; Investigation, L.D.-L.; Resources, L.D.-L., J.P.D.-M., S.V.-D. and A.L.-B.; Data curation, L.D.-L.; Writing—original draft preparation, L.D.-L. and J.P.D.-M.; Writing—review and editing, L.D.-L., J.P.D.-M., J.C.-J., S.V.-D. and A.L.-B.; Visualization, L.D.-L.; Supervision, J.P.D.-M., J.C.-J., S.V.-D. and A.L.-B.; project Administration, S.V.-D. and A.L.-B.; Funding acquisition, S.V.-D. and A.L.-B. All authors have read and agreed to the published version of the manuscript.

Funding

This work was partially supported by the Spanish grant (with support from the European Regional Development Fund) COFNET (TEC2016-77785-P), and by the Andalusian Regional Project PAIDI2020 (with FEDER support) PROMETEO (AT17_5410_USE).

Conflicts of Interest

The authors declare no conflict of interest. The funders had no role in the design of the study; in the collection, analyses, or interpretation of data; in the writing of the manuscript, or in the decision to publish the results.

Abbreviations

The following abbreviations are used in this manuscript:
APAnteroposterior
AIArtificial Intelligence
AUCArea Under Curve
CADComputer-Aided Diagnosis
CAMClass Activation Map
CLAHEContrast Limited Adaptive Histogram Equalization
CNNConvolutional Neural Network
CoVCoronavirus
COVID-19Coronavirus Disease 2019
CTComputer Tomography
DLDeep Learning
GAPGlobal Average Pooling
MERSMiddle East respiratory syndrome
PAPosteroanterior
RSNARadiological Society of North America
ROCReceiver Operating Characteristic
RT-LAMPReverse-Transcription Loop-Mediated Isothermal Amplification
RT-PCRReverse-Transcription Polymerase Chain Reaction
rRT-PCTreal-time RT-PCR
SARSSevere Acute Respiratory Syndrome

References

  1. Zheng, Y.Y.; Ma, Y.T.; Zhang, J.Y.; Xie, X. COVID-19 and the cardiovascular system. Nat. Rev. Cardiol. 2020, 17, 259–260. [Google Scholar] [CrossRef] [Green Version]
  2. World Health Organization. Coronavirus Disease (COVID-19) Pandemic. 2020. Available online: https://www.who.int/emergencies/diseases/novel-coronavirus-2019 (accessed on 16 August 2020).
  3. Cui, J.; Li, F.; Shi, Z.L. Origin and evolution of pathogenic coronaviruses. Nat. Rev. Microbiol. 2019, 17, 181–192. [Google Scholar] [CrossRef] [Green Version]
  4. Momattin, H.; Al-Ali, A.Y.; Al-Tawfiq, J.A. A Systematic Review of therapeutic agents for the treatment of the Middle East Respiratory Syndrome Coronavirus (MERS-CoV). Travel Med. Infect. Dis. 2019, 30, 9–18. [Google Scholar] [CrossRef]
  5. Singhal, T. A review of coronavirus disease-2019 (COVID-19). Indian J. Pediatr. 2020, 87, 281–286. [Google Scholar] [CrossRef] [Green Version]
  6. Hussain, A.; Kaler, J.; Tabrez, E.; Tabrez, S.; Tabrez, S.S. Novel COVID-19: A comprehensive review of transmission, manifestation, and pathogenesis. Cureus 2020, 12, e8184. [Google Scholar]
  7. Zhai, P.; Ding, Y.; Wu, X.; Long, J.; Zhong, Y.; Li, Y. The epidemiology, diagnosis and treatment of COVID-19. Int. J. Antimicrob. Agents 2020, 55, 105955. [Google Scholar] [CrossRef] [PubMed]
  8. Kucirka, L.M.; Lauer, S.A.; Laeyendecker, O.; Boon, D.; Lessler, J. Variation in false-negative rate of reverse transcriptase polymerase chain reaction–based SARS-CoV-2 tests by time since exposure. Ann. Intern. Med. 2020. [Google Scholar] [CrossRef] [PubMed]
  9. Li, Y.; Yao, L.; Li, J.; Chen, L.; Song, Y.; Cai, Z.; Yang, C. Stability issues of RT-PCR testing of SARS-CoV-2 for hospitalized patients clinically diagnosed with COVID-19. J. Med. Virol. 2020, 92, 903–908. [Google Scholar] [CrossRef] [PubMed] [Green Version]
  10. Fang, Y.; Zhang, H.; Xie, J.; Lin, M.; Ying, L.; Pang, P.; Ji, W. Sensitivity of chest CT for COVID-19: Comparison to RT-PCR. Radiology 2020, 92, 200432. [Google Scholar] [CrossRef]
  11. Lin, E.C. Radiation risk from medical imaging. In Mayo Clinic Proceedings; Elsevier: Amsterdam, The Netherlands, 2010; Volume 85, pp. 1142–1146. [Google Scholar]
  12. Lu, W.; Zhang, S.; Chen, B.; Chen, J.; Xian, J.; Lin, Y.; Shan, H.; Su, Z.Z. A clinical study of noninvasive assessment of lung lesions in patients with coronavirus disease-19 (COVID-19) by bedside ultrasound. Ultraschall Med. Eur. J. Ultrasound 2020, 41, 300–307. [Google Scholar] [CrossRef]
  13. Self, W.H.; Courtney, D.M.; McNaughton, C.D.; Wunderink, R.G.; Kline, J.A. High discordance of chest X-ray and computed tomography for detection of pulmonary opacities in ED patients: Implications for diagnosing pneumonia. Am. J. Emerg. Med. 2013, 31, 401–405. [Google Scholar] [CrossRef] [PubMed] [Green Version]
  14. Jacobi, A.; Chung, M.; Bernheim, A.; Eber, C. Portable chest X-ray in coronavirus disease-19 (COVID-19): A pictorial review. Clin. Imaging 2020, 64, 35–42. [Google Scholar] [CrossRef] [PubMed]
  15. Ratnapalan, S.; Bentur, Y.; Koren, G. Doctor, will that X-ray harm my unborn child? Cmaj 2008, 179, 1293–1296. [Google Scholar] [CrossRef] [PubMed] [Green Version]
  16. Jin, Y.H.; Cai, L.; Cheng, Z.S.; Cheng, H.; Deng, T.; Fan, Y.P.; Fang, C.; Huang, D.; Huang, L.Q.; Huang, Q.; et al. A rapid advice guideline for the diagnosis and treatment of 2019 novel coronavirus (2019-nCoV) infected pneumonia (standard version). Mil. Med. Res. 2020, 7, 4. [Google Scholar] [CrossRef] [Green Version]
  17. Civit-Masot, J.; Luna-Perejón, F.; Domínguez Morales, M.; Civit, A. Deep Learning system for COVID-19 diagnosis aid using X-ray pulmonary images. Appl. Sci. 2020, 10, 4640. [Google Scholar] [CrossRef]
  18. Duran-Lopez, L.; Dominguez-Morales, J.P.; Conde-Martin, A.F.; Vicente-Diaz, S.; Linares-Barranco, A. PROMETEO: A CNN-based computer-aided diagnosis System for WSI prostate cancer detection. IEEE Access 2020, 8, 128613–128628. [Google Scholar] [CrossRef]
  19. Dominguez-Morales, J.P.; Jimenez-Fernandez, A.F.; Dominguez-Morales, M.J.; Jimenez-Moreno, G. Deep neural networks for the recognition and classification of heart murmurs using neuromorphic auditory sensors. IEEE Trans. Biomed. Circuits Syst. 2017, 12, 24–34. [Google Scholar] [CrossRef]
  20. Shi, F.; Wang, J.; Shi, J.; Wu, Z.; Wang, Q.; Tang, Z.; He, K.; Shi, Y.; Shen, D. Review of artificial intelligence techniques in imaging data acquisition, segmentation and diagnosis for COVID-19. IEEE Rev. Biomed. Eng. 2020. [Google Scholar] [CrossRef] [Green Version]
  21. Ghoshal, B.; Tucker, A. Estimating uncertainty and interpretability in deep learning for coronavirus (COVID-19) detection. arXiv 2020, arXiv:2003.10769. [Google Scholar]
  22. Narin, A.; Kaya, C.; Pamuk, Z. Automatic detection of coronavirus disease (COVID-19) using X-ray images and deep convolutional neural networks. arXiv 2020, arXiv:2003.10849. [Google Scholar]
  23. Zhang, J.; Xie, Y.; Li, Y.; Shen, C.; Xia, Y. COVID-19 screening on chest X-ray images using deep learning based anomaly detection. arXiv 2020, arXiv:2003.12338. [Google Scholar]
  24. Wang, L.; Wong, A. Covid-net: A tailored deep convolutional neural network design for detection of COVID-19 cases from chest X-ray images. arXiv 2020, arXiv:2003.09871. [Google Scholar]
  25. Vayá, M.D.L.I.; Saborit, J.M.; Montell, J.A.; Pertusa, A.; Bustos, A.; Cazorla, M.; Galant, J.; Barber, X.; Orozco-Beltrán, D.; Garcia, F.; et al. BIMCV COVID-19+: A large annotated dataset of RX and CT images from COVID-19 patients. arXiv 2020, arXiv:2006.01174. Available online: https://bimcv.cipf.es/bimcv-projects/bimcv-covid19/ (accessed on 16 August 2020).
  26. Cohen, J.P.; Morrison, P.; Dao, L. COVID-19 image data collection. arXiv 2020, arXiv:2003.11597. Available online: https://github.com/ieee8023/covid-chestxray-dataset (accessed on 16 August 2020).
  27. Bustos, A.; Pertusa, A.; Salinas, J.M.; de la Iglesia-Vayá, M. Padchest: A large chest X-ray image dataset with multi-label annotated reports. arXiv 2019, arXiv:1901.07441. Available online: https://bimcv.cipf.es/bimcv-projects/padchest/ (accessed on 16 August 2020).
  28. Gonzales, R.C.; Woods, R.E. Digital Image Processing; Prentice Hall: Upper Saddle River, NJ, USA, 2002. [Google Scholar]
  29. Qin, C.; Yao, D.; Shi, Y.; Song, Z. Computer-aided detection in chest radiography based on artificial intelligence: A survey. Biomed. Eng. Online 2018, 17, 113. [Google Scholar] [CrossRef] [Green Version]
  30. Soleymanpour, E.; Pourreza, H.R. Fully automatic lung segmentation and rib suppression methods to improve nodule detection in chest radiographs. J. Med. Signals Sens. 2011, 1, 191. [Google Scholar] [CrossRef] [Green Version]
  31. Oda, S.; Awai, K.; Suzuki, K.; Yanaga, Y.; Funama, Y.; MacMahon, H.; Yamashita, Y. Performance of radiologists in detection of small pulmonary nodules on chest radiographs: Effect of rib suppression with a massive-training artificial neural network. Am. J. Roentgenol. 2009, 193, W397–W402. [Google Scholar] [CrossRef] [Green Version]
  32. Gordienko, Y.; Gang, P.; Hui, J.; Zeng, W.; Kochura, Y.; Alienin, O.; Rokovyi, O.; Stirenko, S. Deep learning with lung segmentation and bone shadow exclusion techniques for chest X-ray analysis of lung cancer. In Advances in Intelligent Systems and Computing, Proceedings of the International Conference on Computer Science, Engineering and Education Applications, Kiev, Ukraine, 18–20 January 2018; Springer: Berlin/Heidelberg, Germany, 2018; pp. 638–647. [Google Scholar]
  33. Gusarev, M.; Kuleev, R.; Khan, A.; Rivera, A.R.; Khattak, A.M. Deep learning models for bone suppression in chest radiographs. In Proceedings of the 2017 IEEE Conference on Computational Intelligence in Bioinformatics and Computational Biology (CIBCB), Manchester, UK, 23–25 August 2017; IEEE: Piscataway, NJ, USA, 2017; pp. 1–7. [Google Scholar]
  34. Reza, A.M. Realization of the contrast limited adaptive histogram equalization (CLAHE) for real-time image enhancement. J. VLSI Signal Process. Syst. Signal Image Video Technol. 2004, 38, 35–44. [Google Scholar] [CrossRef]
  35. Zeiler, M.D. Adadelta: An adaptive learning rate method. arXiv 2012, arXiv:1212.5701. [Google Scholar]
  36. Zhou, B.; Khosla, A.; Lapedriza, A.; Oliva, A.; Torralba, A. Object detectors emerge in deep scene CNNs. arXiv 2014, arXiv:1412.6856. [Google Scholar]
  37. Zhou, B.; Khosla, A.; Lapedriza, A.; Oliva, A.; Torralba, A. Learning deep features for discriminative localization. In Proceedings of the IEEE Conference on Computer Vision and Pattern Recognition, Las Vegas, NV, USA, 27–30 June 2016; pp. 2921–2929. [Google Scholar]
  38. Ronneberger, O.; Fischer, P.; Brox, T. U-net: Convolutional networks for biomedical image segmentation. In Lecture Notes in Computer Science, Proceedings of the International Conference on Medical Image Computing and Computer-Assisted Intervention, Munich, Germany, 5–9 October 2015; Springer: Berlin/Heidelberg, Germany, 2015; pp. 234–241. [Google Scholar]
Figure 1. Preprocessing flowchart describing the different steps to obtain the final images for the dataset. COVID-19 A and B correspond to images from BIMCV-COVID19 and the COVID-19 image data collection from Cohen et al., respectively.
Applsci 10 05683 g001
Figure 2. Diagram of COVID-XNet. It consists of five convolutional layers (Conv), four max pooling layers (MaxPool), a GAP layer, and a softmax layer. Conv1, Conv2, and Conv3 use five × five kernel size, while Conv4 and Conv5 use three × three. All MaxPool layers use 2 × 2 kernels.
Applsci 10 05683 g002
Figure 3. (Left): ROC curve for each cross-validation set. (Right): zoomed in at top left. AUC values are shown in the legend.
Applsci 10 05683 g003
Figure 4. CAMs obtained for the COVID-19 class together with their corresponding original images. Images (AH) represent COVID-19 cases, while (IL) correspond to healthy patients. CAMs are represented with heatmaps, where the most relevant regions for COVID-19 detection are highlighted in red.
Applsci 10 05683 g004
Table 1. Cross-validation results for each of the folds, where sensitivity, specificity, precision, F1-score, AUC, and balanced accuracy are reported. The average of these metrics over the different folds are also shown.
Fold TestActual ClassesPredicted ClassesSensitivitySpecificityPrecisionF1-ScoreAUCBalanced Accuracy
NormalCOVID-19
1st foldNormal8511696.71%98.15%96.89%96.8%0.99797.43%
98.15%1.85%
COVID-1917499
3.29%96.71%
2nd foldNormal8392894.00%96.77%94.54%94.27%0.99095.38%
96.77%3.23%
COVID-1931485
6%94%
3rd foldNormal8343393.02%96.19%93.57%93.29%0.98994.61%
96.19%3.81%
COVID-1936480
6.98%93.02%
4th foldNormal8155288.95%94.00%89.82%89.39%0.97691.48%
94%6%
COVID-1957459
11.05%88.95%
5th foldNormal8393090%96.55%93.98%91.94%0.98693.27%
96.55%3.45%
COVID-1952468
10%90%
AverageNormal96.33%3.67%92.53%96.33%93.76%93.14%0.98894.43%
COVID-197.47%92.53%

