Force Reduction in a Short-Stroke Vibration Tubular Generator for Vehicle Energy Harvesting Application

1
Integrated Actuators Laboratory, École polytechnique fédérale de Lausanne, Rue de la Maladière 71 B, P.O. Box 526, CH-2002 Neuchâtel 2, Switzerland
2
Electric Machines and Drives Research Center, Korea Electrotechnology Research Institute, 12 Bulmosan-ro 10 beon-gil, Seongsan-gu, Changwon-si, Gyeongsangnam-do 51543, Korea
*
Author to whom correspondence should be addressed.
Appl. Sci. 2020, 10(17), 5847; https://0-doi-org.brum.beds.ac.uk/10.3390/app10175847
Submission received: 8 July 2020
/
Revised: 10 August 2020
/
Accepted: 17 August 2020
/
Published: 24 August 2020
(This article belongs to the Special Issue Automobile Energy Harvesting Technologies)
Abstract
:This paper examines methods to reduce the detent force and electromagnetic force in a short-stroke vibration tubular generator used to harvest energy from a vehicle suspension system but still achieve the design targets of power and power density. A well-known skewing permanent magnet approach and a novel approach named the unbalanced model (or moving teeth arrangement) were considered. A multi-objective optimization-based response surface method was also investigated. The results from 2D and 3D finite element analyses (FEA) revealed that when the permanent magnet array in the proposed machine was skewed by 45°, the detent force decreased by 13.1%. When parts of the slot were shifted by the same angle (45°), the unbalanced model could even reduce detent force by 32.7%. However, output power and power density also decreased accordingly. Among these approaches, multi-objective optimization, which can find the trade-off between various physical responses, seemed to be the best solution. A prototype based on an optimal design was fabricated, tested and its behavior was in excellent agreement with the FEA.
1. Introduction
Since 2004, the number of papers on energy harvesting from vehicle suspension systems has dramatically increased [1,2]. It has been reported that the rotary electromagnetic (EM) shock absorber (or indirect drive model) can generate higher power and power density with higher sensitivity to small stroke changes than a linear model (or direct drive model). In addition, a rotating device using a hydraulic transmission can hold a huge amount of force and absorb force effectively. However, it has a complex configuration and requires that various mechanism parts (ball, screw, rack, pinion, etc.) to be accurately designed, which are major drawbacks. On the other hand, a linear machine is simple to design and easy to integrate with any dampers without any extra components. However, the power conversion efficiency and power density of this topology are relatively lower for small scale units.
One of the common topologies for this application is coreless tubular model [3,4,5,6,7], which has non-magnetic material for winding slot to minimize detent force. For instance, under 10 Hz excitation of 2.54 mm peak-to-peak stroke, peak-to-peak force of a single PM layer tubular machine is only 91 N, while maximum power is 1.66 W. In [6], Asadi et al. proposed a coreless hybrid damper composed of axial PMs and iron pole. When this electric generator is excited by an amplitude of 12.7 mm and frequency of 15 Hz, average output power is around 48.5 W, while maximum the highest rate of damping force is 284.5 N.
Recently, the performance of the linear EM shock absorber using a tubular permanent magnet (PM) machine has been significantly improved using a cored model [8,9,10]. The first model was designed with a 2-phase, 16-slot, 8-pole configuration. Except for the different material used for the winding slot, this machine has the same working principle as other coreless models using the same number of slots and poles (or slot-to-pole ratio). By using carbon steel (S20C), as well as applying a novel hybrid PM structure, the output power (225 W) is much higher than that obtained from the coreless models. An optimal 1-phase, 8-slot, 8-pole machine can even increase the output power by more than two times (339.5 W). The idea is to rearrange the relative position between the excited flux density and slots by changing the slot–pole combination. In this way the power on each slot is maximized, hence, the total power can be dramatically increased. Compared with conventional tubular machines designed for vehicle suspension systems, the maximum and average power density (0.311 and 0.087 W/cm3) from the 8-slot 8-pole model are superior. However, when output power is increased, detent force and electromagnetic force are also increased. It was reported that maximum force in 16-slot 8-pole and 8-slot 8-ploe model obtained from FEA are 2789.6 and 2040.4 N, respectively. According to suggestions from manufacturers, in a mid-size car (such as an SUV) and in a heavier vehicle (such as a school bus), the maximum force value has to be smaller than 2000 and 3000 N, respectively. In real driving conditions, this high force has a negative impact on the safety and driving comfort of the driver due to ripple and mechanical vibrations. Because of the specific configuration, in which electrical components are attached to the inner and outer frame of the shock absorber, the detent force (under no-load condition) and electromagnetic force (under the load condition) have to be minimized.
In this paper, the main objective is to reduce the detent and maximum electromagnetic force of the tubular PM machine proposed in [4], while ensuring other performances still achieved their design targets. The first classical approach involves skewing the PM array by different angles. Although the skewing effect has been widely investigated for rotating machines, its impact on the tubular machine has not been deeply considered. Secondly, a multi-objective optimization approach based response surface method (RSM) can be implemented to find the trade-off between the machine’s performance and force. Finally, a novel approach based on an unbalanced model (or iron teeth arrangement) can be applied to the optimal 8-slot 8-pole model above. Although the skewing PM approach and unbalanced model can significantly reduce the detent force and electromagnetic force, the output power is decreased accordingly. Hence, using multi-objective optimization seems to be the best solution to satisfy the various physical responses.
It should be noted that the design targets for maximum and average power are 250 and 100 W, and the targets for maximum and average power density are 0.250 and 0.100 W/cm3, respectively. To verify the validity of the FEM analysis, a prototype was fabricated and tested.
2. Skewing Effects
2.1. Investigated Model
Generally, the skewing approach is applied to rotating and linear machines, but the number of papers about its impacts on a tubular generator is still modest [11,12,13,14]. Unlike the unbalanced model or the addition of auxiliary teeth [15,16,17], the skewing method does not require any extra components, hence, the volume and mass of the machine remain the same. In [12], PMs are in triangular skewing, which introduces an angular component, and consequently alters the radial and axial component in the form of amplitude. 2.5D and 3D analysis prove that the detent force in a tubular linear machine is decreased when the skewing amplitude Δs is increased.
In [12,13], PMs are skewed and divided into a multi-slice shape. In the first case, small PM segments are parallel to each other, following two helical paths with opposite screw direction. The multi-slice method was used to avoid calculating the full 180° model, thus, reducing the calculation time. In another case, individual PM pieces were cut in one piece out of a hollow shaft with two parallel oblique planes. This is called a plane skewed method. Computational results show that force ripple is reduced from 41.6 N (on the un-skewed model) to 8.32 N (on the plane skewed model) [13]. In term of reducing force ripple, the skewing method using multi-slice PM is more effective the than plane skewed method. However, the feasibility of this method needs to be further investigated in detail.
According to the back-up data from [12], a single-slot single-pole model is considered to reduce the complexity and time consumed in 3D FEM analysis. By assuming that the 8-slot 8-pole machine is symmetrical, the performance of the full model is simply multiplied by 8 times. In the other approach, when a single-slot single-pole model has a boundary condition applied (periodicity), its performance is equivalent to the full model. Figure 1 shows a cross-section of the single-slot, single-pole model, which was taken from an optimal 8-slot 8-pole machine proposed in [9].
The axial PM width is 5 mm, the radial PM width is 18 mm, and the tooth width is 6.4 mm. The iron core and spacers are still composed of carbon steel S20C, a magnetic material. With the same number of turns per slot, phase resistance is smaller by eight times (5.37 Ω). As mentioned in [9], PM ring is wrapped by a cover comprised of stainless steel 1.1 mm thick. In addition to a 0.3 mm mechanical air gap, the total magnetic air gap is 1.4 mm. It should be noted that in this paper, the standard operating conditions for all models are 0.25 m/s of the vibration speed, 10 Hz of the vibration frequency and 11.25 mm of the peak-to-peak stroke length. To increase the machine’s performance, a hybrid PM structure proposed in [8,9,10] was also implemented. Specifications of the model to be investigated are summarized again in Table 1.
Because one pole pitch is τp = 23 mm, when the PMs are skewed by 30°, it means that the PM ring is shifted by:
Similarly, when the model presented in Figure 1 is skewed by 75°, it means that the PM ring is shifted by nearly 4.79 mm. In this section, five skewing angles are considered, of 30°, 45°, 60°, 75°, and 120°.
2.2. Finite Element Analysis
In the analyzed model, there are totally 626,641 node elements, 6175 line elements, 112,807 face elements, and 464,299 volume elements. To improve the accuracy of the 3D FEM analysis, all elements are second order mesh. Mesh distribution and magnetization of the radial and axial PMs of the investigated model with a skewing angle of 75° in the different planes are presented in Figure 2.
When the proposed model is skewed by 75° and operated under the rated condition (vrms = 0.25 m/s), it seems that there is a saturation phenomenon on the iron teeth and spacers, with a flux density of around 2.0 T (Figure 3). In the original model without skewing effect, the maximum electromagnetic force, and maximum and average power were 325.8 N, 51.4 and 18.3 W, respectively. In an extreme case, when the PMs are skewed by 120°, the maximum force is reduced by 43.9% to 182.8 N. However, the maximum and average power are also significantly decreased to 31.6 and 13.0 W. In terms of the detent force, although it is relatively smaller than the electromagnetic force, the ratio of reduction for different skewing angles is similar.
Comparison of the machine’s performance for different skewing angles is shown in Figure 4 and Figure 5. From Table 2, the performance of the full 8-slot 8-pole model can be easily estimated by multiplying with 8. There are two cases which can both limit electromagnetic force to be less than 2000 N and achieve the design targets for output power, including skewing angles of 75°, and 120°. For example, when the skewing angle is 120°, the electromagnetic force, maximum and average power of the full model are about 1462.64 N, 252.80, and 104.32 W, respectively.
It can be concluded that although the classical approach using the skewing effect can dramatically reduce the detent force and electromagnetic force, the output power is decreased accordingly. In reality, this approach is also difficult for manufacturers to fabricate.
3. Multi-Objective Optimization
3.1. Factorial Design
Based on the optimal model in [9], the general dimensions of the single-phase, 8-slot 8-pole machine are presented in Figure 6. This machine was optimized for the design targets of maximum and average power of 180 and 75 W, maximum and average power density of 0.180 and 0.075 W/cm3, respectively, and the electromagnetic force was minimized simultaneously.
As shown in Figure 7, the geometries of the proposed machine can be defined by several factors, but in this case, three factors were selected, the tooth width wt, axial PM width wam, and radial PM thickness trm. Because pole pitch τp and slot pitch τs are constant (23 mm), when one factor (tooth width or axial PM width) varies, other variables (slot width, number of turns per slot, resistance per phase, radial PM width) are varied too. In the first step, using Minitab software, the fractional factorial designs were applied to clarify the sensitivity of each variable.
Table 3 shows the combination of different variables and the performance of the machine, including maximum and average power (Pm and Pav), maximum and average power density (Pd_m and Pd_av), and the maximum value of the electromagnetic force (Fm). As mentioned in [9], the iron teeth have to be beveled for the winding path, hence, the investigated machine has an equivalent outer air gap of 0.25 mm.
Figure 8 is the Pareto charts, which show the magnitude and importance of the three factors to the machine’s performance. Not only the major factors but their interactions are investigated in the fractional factorial designs. The reference line corresponding to alpha is 0.05 and the confidence interval is 95%. Although none of the three factors are significantly sensitive to the output power and power density, the tooth width wt, and axial PM width wam are the factors most sensitive to the electromagnetic force. Therefore, tooth width wt and axial PM width wam were selected for the next optimization step using RSM. The total thickness of the spacer and radial PM (or axial PM thickness) is 9.05 mm, and the thickness of the radial PM trm was randomly chosen to be 6.5 mm (the same as the machine in [9]), so the thickness of the spacer tsp is 2.55 mm.
3.2. Multi-Objective Optimization Based RSM
Multi-objective optimization (MOO) is a method of multiple criteria decision making, concerned with mathematical optimization problems where more than one objective function needs to be optimized simultaneously. The output of the MOO is a set of solutions that define the best trade-off between various physical responses [18,19,20]. In electrical machine design, MOO using the RSM is widely employed for modeling performance. The main idea of the RSM is to use a sequence of designed experiments to obtain an optimal response [21,22,23,24,25,26]. In RSM, a polynomial model, called a fitted model, is generally constructed to represent the relationship between the performance and the design parameters [21]. Figure 9 shows the effect plots for the major factors. To evaluate the effectiveness of the MOO, several cases were studied as shown in Table 4.
The relationship between the machine’s performance and the two selected factors can be presented by fitted second-order polynomial functions as follows:
Firstly, if power and power density are optimized while electromagnetic force is freely varied without any constraints, the responses for tooth width wt and axial PM width wam are 6.8 and 8.2 mm, respectively. In this case, maximum Pm and average power Pav are 345.7 and 126.4 W, maximum Pd_m and average power density Pd_av are 0.332 and 0.121 W/cm3, respectively. These results both achieve the design targets and have an acceptable margin for deviation. Because the electromagnetic force Fm is freely varied, there is no response for it from Minitab software. But after re-checking by FEA, it is expected to be around 2638.3 N, which is higher than the limitation (≤2000 N).
Secondly, output power and power density are maximized, and electromagnetic force is minimized without any constraints. The responses from the Minitab software for tooth width wt and axial PM width wam are 7.4 and 7.2 mm, respectively. In this case, the maximum Pm and average power Pav are expected to be 349.2 and 125.2 W, while force Fm is around 2121.4 N. Although force decreased by nearly 24.4%, it is still slightly higher than the limitation.
Thirdly, power and power density are maximized without any constraints, and maximum value of the electromagnetic force is limited to ≤2000 N, and the responses from the Minitab software for tooth width wt and axial PM width wam are 8.6 and 7.2 mm, respectively. In this case, the average power Pav and power density Pd_av are expected to be 121.6 W and 0.114 W/cm3. Although these results satisfy the original design targets, the margin for deviation is still relatively small. However, the maximum electromagnetic force Fm was successfully reduced to approximately 1755.1 N.
The results summarized in Table 4 suggest that all of the design targets, as well as the constraints for the machine’s performance, can be achieved using multi-objective optimization. Additionally, it can be intuitively observed that when electromagnetic force is reduced with a different setup, output power, and power density are decreased as well. It should be noted that the detent force is not mentioned during optimization because of its significantly smaller value than the electromagnetic force.
3.3. Experiments
Unfortunately, because force’s measurement has not successfully conducted, the aim of this section is to only evaluate the validity of the design. It is worth to mention that there always have differences and errors during manufacturing process, which effects to machine’s performance. A prototype was fabricated based on the responses in case 1. Although the electromagnetic force of this model was higher than the limitation, the power and power density had a better tolerance margin (about 20% of tolerance for average power and power density). Figure 10 shows the components and assembly of the prototype. The test bench is the same as the one used for previous machines in [8,9].
During the manufacturing process, two important changes were made. Firstly, the material of the inner iron frame is carbon steel S20C instead of stainless steel. Secondly, during optimization stage, fill factor was 50% with 396 turns per slot. However, fill factor was possibly increased to approximately 55.6% by manufacturer, hence the number of turns per slot is 440. Consequently, output power, power density, and electromagnetic force were all increased together. The machine’s performance following these different changes is summarized in Table 5.
Figure 11 shows the no-load voltage back EMF calculated by simulation and the corresponding experiment when the vibration speed is 0.25 m/s. Because of the noise and great shaking in the testing system caused by the high rotation speed of the sub-motor, the measured maximum, and RMS back EMF from the experiment (355.7 and 190.6 V) were slightly higher than the analyzed results (330.1 and 189.6 V).
A comparison of the simulated and experimental output power under the full load condition is presented in Figure 12. When the vibration speed was 0.250 m/s, the maximum and average output power obtained in the experiment were 426.5 and 130.6 W, which were slightly lower than the FEM analysis. Unfortunately, it was not possible to measure the electromagnetic force.
4. Unbalanced Model
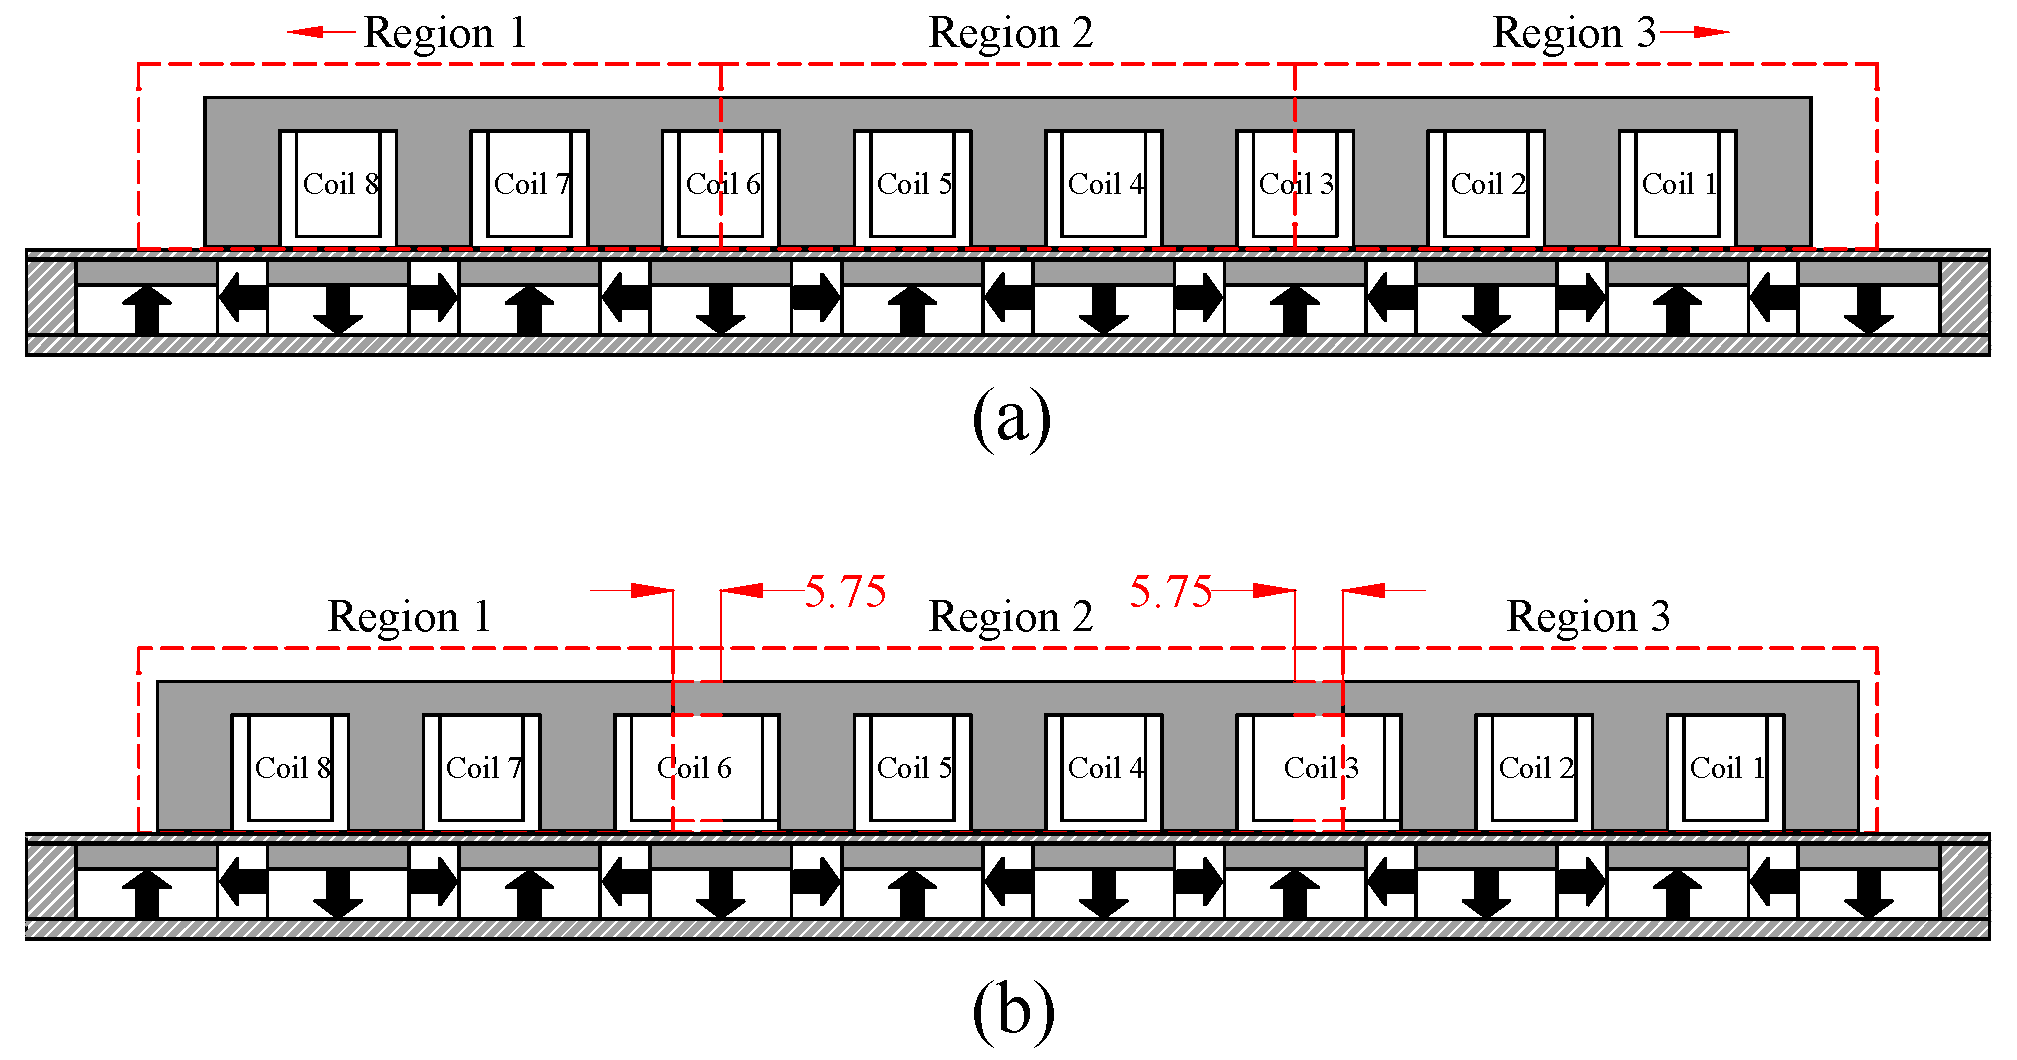
In conventional studies, a three-phase linear machine is divided into three domains and their positions are rearranged to generate a phase difference in the pulsation force between each domain [21]. Similarly, a cross-section of the optimal 8-slot 8-pole model in Chapter IV and its three separated domains are shown in Figure 13a.
Region 1 and region 3 are symmetric with region 2. Because the pole pitch is τp = 23 mm, when region 1 is shifted to the left and region 3 is shifted to the right by 45°, the width of slots 3 and 6 are increased by 0.125 τp = 2.875 mm. In this section, while region 2 is fixed, regions 1 and 3 were shifted in the opposite directions by three amounts, 0.125 τp (45° or 2.875 mm), 0.25 τp (90° or 5.75 mm), and 0.375 τp (135° or 8.625 mm).
Figure 13b presents an example, when regions 1 and 3 were reversely shifted by 5.75 mm. This means that the widths of slots 3 and 6 were extended by 5.75 mm as well. Hence, the axial length of region 2, the slot area, and the number of turns per slot were increased accordingly. In this case, the number of turns in slots 1, 2, 4, 5, 7, and 8 was 440, while it was 468 turns in slots 3 and 6.
A comparison of the detent force and the electromagnetic force is presented in Figure 14. It should be noted that the detent force is an interaction between the PM and iron core when there is no applied current, the so-called no-load condition. It is intuitively perceivable that the detent force and electromagnetic force are dramatically reduced by increasing shifting lengths of regions 1 and 3. When the shifting length is 8.625 mm (or 135°), the maximum values are only around 206.3 and 715.2 N, respectively, which are 10.9 and 4.5 times smaller than those in the optimal model. This effective reduction can be best explained by examining the force waveforms produced by each region.
Considering the best case, when regions 1 and 3 are reversely shifted by 8.625 mm (or 135°), the detent force on each region is as shown in Figure 15. Because region 2 retained the configuration of the optimal model, the detent force on this region is the highest. However, the phase difference of the detent force on region 2 and the sum of the force on regions 1 and 3 is mostly 180°, so the total force on the whole machine is dramatically reduced. The effect of this approach can be even greater if an optimization process is applied.
Despite the great reduction in force, the proposed machine has to satisfy other performance criteria as well. According to a report in [21], when a permanent magnet linear synchronous machine is designed with the teeth arrangement approach (or unbalanced model), only the relative position of the moving teeth are modified without any performance sacrifice. However, that machine was operated by linear motion or one direction motion, and its characteristics are different from a short-stroke, vibration generator.
The evidence from Figure 16 proves not only that the detent force is mostly reduced, but output power is also significantly decreased from 435.4 W to only 136.9 W, which is much lower than the design target. This is because of the relative position between winding slots 1, 2, 3, 6, 7, and 8, and because the excited flux density is shifted to an unaligned position. Only slots 4 and 5 remained in aligned position with the maximum excited flux density, and produced maximum power.
In general, unbalanced model (or teeth arrangement) configuration is extremely effective to reduce force without any notable increase in volume and mass. However, same as skewing approach, there is a conflict of interest between output power and force.
5. Conclusions
This study focused on reducing the detent force and electromagnetic force in a specific short-stroke vibration tubular generator for vehicle energy harvesting application. Several approaches were investigated, including the skewing effect, multi-objective optimization, and the un-balanced model or teeth arrangement approach. The analyses results suggest that output power and electromagnetic force are proportional. Although the proposed approaches can productively reduce the forces, output power is decreased accordingly. While the decision will depend on the priority of the design (power or force), as well as design targets, multi-objective optimization was found to be the best solution to satisfy various physical responses.
The un-balanced model is a novel simple approach, and can effectively reduce these forces. When the two regions of the iron core are shifted by 8.625 mm (135°), force is significantly decreased from 3223.3 N to only 715.2 N. This approach has advantage of reducing force without significant change of the volume. However, maximum power is also decreased by nearly 3.3 times. In general, further designs for tubular machines or linear machines can refer to the proposed approaches to minimize forces with only a slight change, or even without change, in active volume and mass.
A prototype was fabricated based on an optimal design, and its behavior was in excellent agreement with the 2D FEA. However, it was not possible to measure electromagnetic force because of a problem with test bench.
Author Contributions
Conceptualization, M.-T.D. and Y.-D.C.; methodology, M.-T.D. and Y.-D.C.; software, M.-T.D.; validation, M.-T.D.; writing—original draft preparation, M.-T.D.; writing—review and editing, M.-T.D.; visualization, Y.P.; supervision, Y.-D.C. and Y.P.; project administration, Y.-D.C. All authors have read and agreed to the published version of the manuscript.
Funding
The research work presented here was carried out at Electric Machines and Drives Research Center, Korea Electrotechnology Research Institute (KERI) and supported in part by the Civil-Military Technology Cooperation Program (No.: 16-CM-EN-17), funded by the Defense Acquisition Program Administration and the Ministry of Trade, Industry & Energy in Korea.
Conflicts of Interest
The authors declare no conflict of interest.
References
- Abdelkareem, M.A.A.; Xu, L.; Ali, M.K.A.; Elagouz, A.; Mi, J.; Guo, S.; Liu, Y.; Zuo, L. Vibration energy harvesting in automotive suspension system: A detailed review. Appl. Energy 2018, 229, 672–699. [Google Scholar] [CrossRef]
- Zhang, R.; Wang, X.; John, S. A Comprehensive Review of the Techniques on Regenerative Shock Absorber Systems. Energies 2018, 11, 1167. [Google Scholar] [CrossRef] [Green Version]
- Zuo, L.; Scully, B.; Shestani, J.; Zhou, Y. Design and characterization of an electromagnetic energy harvester for vehicle suspensions. Smart Mater. Struct. 2010, 19, 045003. [Google Scholar] [CrossRef] [Green Version]
- Tang, X.; Lin, T.; Zuo, L. Design and Optimization of a Tubular Linear Electromagnetic Vibration Energy Harvester. IEEE/ASME Trans. Mechatron. 2014, 19, 615–622. [Google Scholar] [CrossRef]
- Duong, M.-T.; Chun, Y.-D.; Han, P.-W.; Park, B.-G.; Bang, D.-J.; Lee, J.-K. Design of an Electromagnetic Energy Harvesting System Applied to the Shock Absorber of a Sport Utility Vehicle: Part I. Single Permanent Magnet Layer Coreless Type. J. Magn. 2017, 22, 435–442. [Google Scholar] [CrossRef] [Green Version]
- Asadi, E.; Ribeiro, R.; Behrad Khamesee, M.; Khajepour, A. A new adaptive hybrid electromagnetic damper: Modelling, optimization, and experiment. Smart Mater. Struct. 2015, 24, 075003. [Google Scholar] [CrossRef]
- Ebrahimi, B.; Khamesee, M.B.; Golnaraghi, F. Eddy current damper feasibility in automobile suspension: Modeling, simulation and testing. Smart Mater. Struct. 2009, 18, 015017. [Google Scholar] [CrossRef]
- Duong, M.-T.; Chun, Y.-D.; Hong, D.-K. Design of a High-Performance 16-Slot 8-Pole Electromagnetic Shock Absorber Using a Novel Permanent Magnet Structure. Energies 2018, 11, 3352. [Google Scholar] [CrossRef] [Green Version]
- Duong, M.; Chun, Y.; Han, P.; Park, B.; Bang, D.; Lee, J. Optimal Design of a Novel Single-Phase 8 Slot-8 Pole Tubular Electromagnetic Shock Absorber to Harvest Energy. IEEE Trans. Ind. Electron. 2019, 67, 1180–1190. [Google Scholar] [CrossRef]
- Duong, M.-T.; Chun, Y.-D. Optimal Design of a Novel Exterior Permanent Magnet Tubular Machine for Energy Harvesting from Vehicle Suspension System. IEEE Trans. Energy Convers. 2020, 1. [Google Scholar] [CrossRef]
- Liu, C.; Yu, H.; Hu, M.; Liu, Q.; Zhou, S. Detent Force Reduction in Permanent Magnet Tubular Linear Generator for Direct-Driver Wave Energy Conversion. IEEE Trans. Magn. 2013, 49, 1913–1916. [Google Scholar] [CrossRef]
- Schmulling, B.; Lessmann, M.; Riemer, B.; Hameyer, K. The Multi-Slice Method for the Design of a Tubular Linear Motor with a Skewed Reaction Rail. In Proceedings of the 2008 18th International Conference on Electrical Machines, Vilamoura, Portugal, 6–9 September 2008; pp. 1–5. [Google Scholar]
- Juliani, A.D.P.; Leβmann, M.; Gonzaga, D.P.; Hameyer, K. Development and Optimization of a Tubular Linear Synchronous Motor Considering Various Skewing Methods and Eddy Current Losses. In Proceedings of the XIX International Conference on Electrical Machines—ICEM 2010, Rome, Italy, 6–8 September 2010; pp. 1–6. [Google Scholar]
- Janssen, J.L.G.; Paulides, J.J.H.; Lomonova, E.A.; Vandenput, A.J.A. Cogging Force Reduction in Tubular Permanent Magnet Actuators. In Proceedings of the 2007 IEEE International Electric Machines Drives Conference, Antalya, Turkey, 3–5 May 2007; Volume 1, pp. 266–271. [Google Scholar]
- Kim, Y.-J.; Lee, K.-M.; Watada, M. A Study on the Reduction of Cogging Force of Stationary Discontinuous Armature Linear Synchronous Motor Using Auxiliary Teeth. J. Magn. 2011, 16, 281–287. [Google Scholar] [CrossRef]
- Zhu, Y.; Lee, S.-G.; Chung, K.-S.; Cho, Y.-H. Investigation of Auxiliary Poles Design Criteria on Reduction of End Effect of Detent Force for PMLSM. IEEE Trans. Magn. 2009, 45, 2863–2866. [Google Scholar] [CrossRef]
- Kim, Y.-J.; Jung, S.-Y. Minimization of Outlet Edge Force Using Stair Shape Auxiliary Teeth in a Stationary Discontinuous Armature Linear Permanent Magnet Motor. IEEE Trans. Magn. 2011, 47, 3228–3231. [Google Scholar] [CrossRef]
- Wang, Q.; Zhao, B.; Zhao, H.; Li, Y.; Zou, J. Optimal Design of Tubular Transverse Flux Motors With Low Cogging Forces for Direct Drive Applications. IEEE Trans. Appl. Supercond. 2016, 26, 1–5. [Google Scholar] [CrossRef]
- Chun, Y.D.; Wakao, S.; Kim, T.H.; Jang, K.B.; Lee, J. Multiobjective design optimization of brushless permanent magnet motor using 3D equivalent magnetic circuit network method. IEEE Trans. Appl. Supercond. 2004, 14, 1910–1913. [Google Scholar] [CrossRef]
- Han, P.-W.; Seo, U.-J.; Choi, J.-H.; Chun, Y.-D.; Koo, D.-H.; Lee, J. Optimizing Design Variables for High Efficiency Induction Motor Considering Cost Effect by Using Genetic Algorithm. J. Electr. Eng. Technol. 2012, 7, 948–953. [Google Scholar] [CrossRef]
- Chung, S.-U.; Kim, J.-M. Double-Sided Iron-Core PMLSM Mover Teeth Arrangement Design for Reduction of Detent Force and Speed Ripple. IEEE Trans. Ind. Electron. 2016, 63, 3000–3008. [Google Scholar] [CrossRef]
- Lee, J.-Y.; Chang, J.-H.; Kang, D.-H.; Kim, S.-I.; Hong, J.-P. Tooth Shape Optimization for Cogging Torque Reduction of Transverse Flux Rotary Motor Using Design of Experiment and Response Surface Methodology. IEEE Trans. Magn. 2007, 43, 1817–1820. [Google Scholar] [CrossRef]
- Lee, S.; Hong, J.; Lee, W.; Hwang, S.; Lee, J.; Kim, Y. Optimal Design for Noise Reduction in Interior Permanent Magnet Motor. In Proceedings of the Conference Record of the 2006 IEEE Industry Applications Conference Forty-First IAS Annual Meeting, Tampa, FL, USA, 8–12 October 2006; Volume 4, pp. 1927–1932. [Google Scholar]
- Jolly, L.; Jabbar, M.A.; Qinghua, L. Design optimization of permanent magnet motors using response surface methodology and genetic algorithms. IEEE Trans. Magn. 2005, 41, 3928–3930. [Google Scholar] [CrossRef]
- Park, J.M.; Kim, S.I.; Hong, J.P.; Lee, J.H. Rotor Design on Torque Ripple Reduction for a Synchronous Reluctance Motor With Concentrated Winding Using Response Surface Methodology. IEEE Trans. Magn. 2006, 42, 3479–3481. [Google Scholar] [CrossRef]
- Hong, D.-K.; Woo, B.-C.; Koo, D.-H.; Kang, D.-H. Optimum Design of Transverse Flux Linear Motor for Weight Reduction and Improvement Thrust Force Using Response Surface Methodology. IEEE Trans. Magn. 2008, 44, 4317–4320. [Google Scholar] [CrossRef]
Figure 1.
Cross-section of the 1/8 model without and with a skewing angle of 75°.

Figure 2.
Mesh and magnetization of the 1/8 model with a skewing angle of 75°.

Figure 3.
Flux density (skewing angle 75°).

Figure 4.
Output power for different skewing angles.

Figure 5.
Detent force and electromagnetic force for different skewing angles.


Figure 6.
General dimensions of the 8-slot 8-pole machine (mm) [10].
Figure 6.
General dimensions of the 8-slot 8-pole machine (mm) [10].

Figure 7.
Factors for optimization (mm) [10].
Figure 7.
Factors for optimization (mm) [10].

Figure 8.
Effects of the three factors on the machine’s performance.

Figure 9.
Main effect plot.

Figure 10.
Prototype.

Figure 11.
No-load voltage back EMF (vrms = 0.25 m/s).

Figure 12.
Output power under full load condition (vrms = 0.25 m/s).

Figure 13.
Cross-section of the: (a) Optimal 8-slot 8-pole machine; (b) proposed machine with teeth arrangement (5.75 mm of shifting length).
Figure 13.
Cross-section of the: (a) Optimal 8-slot 8-pole machine; (b) proposed machine with teeth arrangement (5.75 mm of shifting length).

Figure 14.
Detent and electromagnetic force for different shifting lengths.

Figure 15.
Detent force on each region when shifting length is 8.625 mm.

Figure 16.
Output power for different shifting lengths.


Table 1.
Specifications of the single slot single pole model.
| Item | Value |
|---|---|
| Magnetic air gap, g (mm) | 1.4 |
| Radial permanent magnet (PM) thickness, trm (mm) | 7.0 |
| Axial PM width, wam (mm) | 5.0 |
| Radial PM width, wrm (mm) | 18.0 |
| Spacer thickness, tsp (mm) | 2.0 |
| Spacer width, wsp (mm) | 18.0 |
| Tooth width, wt (mm) | 6.4 |
| Tooth thickness, tt (mm) | 14.0 |
| Pole pitch, τp (mm) | 23.0 |
| Slot pitch, τs (mm) | 23.0 |
| Back iron thickness, tb (mm) | 4.0 |
| Number of turns/slot | 361 |
| Phase resistance, (Ω) | 5.37 |
| Material of the axial PM/radial PM | 50SH, Br = 1.4 T/40SH, Br = 1.26 T |
| Material of the tooth, back iron, spacer | S20C |
Table 2.
Performance of the 1/8 model for different skewing angles.
| Skewing Angle | Output Power (W) | Force (N) | ||
|---|---|---|---|---|
| Maximum | Average | Detent | Electromagnetic | |
| 0° | 51.43 | 18.25 | 171.19 | 325.82 |
| 30° | 50.15 | 17.84 | 160.08 | 305.75 |
| (97.5%) | (97.8%) | (93.5%) | (93.8%) | |
| 45° | 47.89 | 17.37 | 149.91 | 284.26 |
| (85.1%) | (95.2%) | (87.6%) | (87.2%) | |
| 60° | 45.33 | 16.69 | 135.57 | 260.65 |
| (87.5%) | (91.5%) | (79.2%) | (80.0%) | |
| 75° | 42.28 | 15.87 | 121.37 | 236.35 |
| (88.1%) | (87.0%) | (70.9%) | (72.5%) | |
| 120° | 31.60 | 13.04 | 82.56 | 182.83 |
| (61.4%) | (71.5%) | (48.2%) | (56.1%) | |
Table 3.
Factors and machine’s performance.
| wt | wam | trm | Pm | Pav | Pd_m | Pd_av | Fm |
|---|---|---|---|---|---|---|---|
| (mm) | (mm) | (mm) | (W) | (W) | (W/cm3) | (W/cm3) | (N) |
| 6 | 8 | 8 | 335.67 | 111.71 | 0.328 | 0.109 | 2729.24 |
| 6 | 8 | 3 | 284.10 | 104.73 | 0.277 | 0.102 | 2444.29 |
| 6 | 12 | 8 | 262.85 | 105.12 | 0.258 | 0.103 | 3826.74 |
| 6 | 12 | 3 | 229.62 | 100.34 | 0.225 | 0.098 | 3481.17 |
| 10 | 8 | 8 | 302.74 | 100.40 | 0.277 | 0.092 | 1789.28 |
| 10 | 8 | 3 | 275.41 | 99.80 | 0.252 | 0.091 | 1635.07 |
| 10 | 12 | 8 | 308.61 | 106.34 | 0.283 | 0.098 | 2876.06 |
| 10 | 12 | 3 | 288.78 | 108.33 | 0.265 | 0.100 | 2835.73 |
Table 4.
Factors and machine’s performance.
| Item | Case 1 | Case 2 | Case 3 | Target | |
|---|---|---|---|---|---|
| Setup | Pm | Maximize | Maximize | Maximize | 250 |
| Pav | Maximize | Maximize | Maximize | 100 | |
| Pd_m | Maximize | Maximize | Maximize | 0.250 | |
| Pd_av | Maximize | Maximize | Maximize | 0.100 | |
| Fm | Free | Minimize | ≤2000 | ≤2000 | |
| Response | wt | 6.8 | 7.4 | 8.6 | - |
| wam | 8.2 | 7.2 | 7.2 | - | |
| Pm | 345.71 | 349.20 | 339.32 | 250 | |
| Pav | 126.43 | 125.22 | 121.60 | 100 | |
| Pd_m | 0.332 | 0.333 | 0.318 | 0.250 | |
| Pd_av | 0.121 | 0.119 | 0.114 | 0.100 | |
| Fm | 2683.30 | 2121.39 | 1755.07 | ≤2000 | |
Table 5.
Machine’s performance following changes.
| Item | SUS | S20C | |
|---|---|---|---|
| 396 Turns/Slot | 440 Turns/Slot | ||
| Max. output power, Pm (W) | 350.5 | 401.5 | 435.4 |
| Ave. output power, Pav (W) | 127.7 | 152.0 | 166.4 |
| Max. power density, Pd_m (W) | 0.337 | 0.386 | 0.419 |
| Ave. power density, Pd_av (W) | 0.123 | 0.146 | 0.160 |
| Max. electromagnetic force, Fm (N) | 2683.3 | 3131.6 | 3223.3 |
© 2020 by the authors. Licensee MDPI, Basel, Switzerland. This article is an open access article distributed under the terms and conditions of the Creative Commons Attribution (CC BY) license (http://creativecommons.org/licenses/by/4.0/).
Share and Cite
MDPI and ACS Style
Duong, M.-T.; Perriard, Y.; Chun, Y.-D. Force Reduction in a Short-Stroke Vibration Tubular Generator for Vehicle Energy Harvesting Application. Appl. Sci. 2020, 10, 5847. https://0-doi-org.brum.beds.ac.uk/10.3390/app10175847
AMA Style
Duong M-T, Perriard Y, Chun Y-D. Force Reduction in a Short-Stroke Vibration Tubular Generator for Vehicle Energy Harvesting Application. Applied Sciences. 2020; 10(17):5847. https://0-doi-org.brum.beds.ac.uk/10.3390/app10175847
Chicago/Turabian StyleDuong, Minh-Trung, Yves Perriard, and Yon-Do Chun. 2020. "Force Reduction in a Short-Stroke Vibration Tubular Generator for Vehicle Energy Harvesting Application" Applied Sciences 10, no. 17: 5847. https://0-doi-org.brum.beds.ac.uk/10.3390/app10175847
Note that from the first issue of 2016, this journal uses article numbers instead of page numbers. See further details here.