Private Label and Macroeconomic Indexes: An Artificial Neural Networks Application


Department of Business Administration and Marketing, University of Seville, 41018 Seville, Spain
*
Author to whom correspondence should be addressed.
Appl. Sci. 2020, 10(17), 6043; https://0-doi-org.brum.beds.ac.uk/10.3390/app10176043
Submission received: 31 July 2020
/
Revised: 26 August 2020
/
Accepted: 28 August 2020
/
Published: 31 August 2020
(This article belongs to the Special Issue Applied Artificial Neural Networks)
Abstract
:Retail companies operate with a private label assortment of 40–45% of their total assortment, which has led to a significant growth of private labels in recent years in their countries of origin; however, when retail companies decide to internationalize, it is important to know which macroeconomic indicators are more relevant when entering a new country or continent. For that reason, in this study we have as a main objective to establish which are the most transcendental macroeconomic variables for the volume and value of the private label. For this purpose, we have analyzed a total of 1400 samples, creating an artificial neural network (ANN). The results show that the most important macroeconomic indicator that must be taken into consideration above other macroeconomic indicators for retail companies to be successful within a country is the per capita debt. In addition, we have considered in this research that unemployment is not the most important primary indicator for the volume of the private label.
1. Introduction
For retail distribution, private labels have been the fundamental basis on which to base strategies essential to sustainable growth [1,2], with different lines of study emerging within the literature [3,4,5,6,7,8]. However, increasingly these studies are moving towards a methodology based on statistics as a starting point [9]; thus, proliferating studies based on data mining to manage large volumes of data [10,11,12,13,14] with artificial neural networks are an increasingly more commonly used methodology [15].
Artificial Neural Networks (ANN) are information processing systems whose structure and operation are inspired by biological neural networks [16]. These networks are usually a supervised learning algorithm so that the ANNs themselves adjust their own architecture and parameters in order to minimize the error functions that indicate the degree of adjustment of the data studied [17]. Over the last decades, Artificial Neural Networks (ANN) have received a particular interest as a technology for data mining, since they offer the means to model effectively and efficiently large and complex problems [17]. In this regard, numerous articles rely on this technology to predict or establish results that assist in business decision making [18,19,20,21,22,23,24].
At present, there is little work being done on ANN models to estimate the importance of macroeconomic variables [25] for distribution, and virtually no research focuses on private labels, which is a tool used by retailers to overcome the marginal problems inherent in the distribution of manufacturers’ brands [26], and which has been an essential tool for retailers in recent years [27]. Therefore, research is needed to determine, for different organizations, which are the most important macroeconomic variables when implementing private labels in a given country, which is our main objective in this study.
For the development of the study we will follow the following structure: after this introduction we will justify the selected macroeconomic variables. In Section 3, we will explain the process we used to collect the data, identifying the measures used for each of the variables we will study, as well as detailing the software used for their analysis. In Section 4 we will carry out the analysis of the data and results. Section 5 will contain the conclusions we draw from this study, together with the study limitations and possible future research.
2. Theoretical Framework
Private labels are brands that can be manufactured by the distributor or an outside manufacturer, managed and marketed by the distributor under the name of the brand or under the distributor’s own brand, and that can be distributed in the brand’s own establishments or in those of other chains [28].
For consumers, the attraction of private labels has been of a quality comparable to that of national brands at prices 10–40% lower [29], thus, in recent years it has led to an increase in the retail shelf [30], leading to private labels representing a share of over 30% across Europe [31], and to being a strategic tool used by retailers to increase profits.
In this sense, given the importance of the private label, it would be of great importance for retailers and/or other organizations to know if macroeconomic indicators can be a determining factor for the implementation of private label in various countries, thus, in this study we have followed previous studies [32] to determine the main macro indicators with respect to private label, namely GDP, Unemployment, Average Wage, Per Capita Debt, and Consumer Price Index. Urban Concentration was not used in this study, because of its low impact.
2.1. GDP
The GDP measures the monetary value of the final goods and services produced by a country in a given period, taking into account all the product generated within the borders [33]. It is one of the most important indicators to measure the economic temperature of the country [34]; thus, it can be one of the essential indicators to determine consumer behavior.
In this regard, some authors argue that the market share of private labels generally rises when the economy is suffering and falls in stronger economic periods [35]. They therefore believe that GDP can be a key factor in the adoption of private labels [36]. In response, several authors estimate that the share of private labels will double within 10 to 11 years after the recession [37].
2.2. Unemployment
Unemployment is a mismatch in the labor market, where the supply of labor (by workers) exceeds the demand for labor (by companies) [38].
When there are more people willing to offer their work to companies than there are jobs available, unemployment results. This imbalance in employment causes changes in the individuals who are in this situation, both on a mental level and on a purchasing behavior level [39]. Therefore, several studies have taken unemployment into account when studying private labels [32,35] and several have had this indicator as one of the main macroeconomic indicators for the economic study of a country [40,41]. For this reason, it will be one of the macroeconomic indicators used in this study for the analysis of the private label.
2.3. Consumer Price Index (CPI)
The Consumer Price Index is an instrument that measures the evolution of all the prices of goods and services that are part of household consumption [42]. The increase in the price of certain goods and services can lead to a consumer behavior that is more likely to opt for lower-priced products, to which they have greater accessibility [43].
2.4. Average Salary
The average salary is the average amount of money a worker receives in a given country or region over a period of time [46]. From a macroeconomic point of view, wages are a determining factor in the health of a country’s economy [47]. Moreover, it also reflects the state of the job satisfaction of workers [48]. For this reason, some researchers have sought relationships between the average wage and the private label [27,49]. In this sense, it is established that the higher the average wage in the country where the study of private labels is based, the lower its consumption and the higher the share of national brands.
For all the above reasons, we have included the average salary in our research as one of the indices that can be influential in the private label and that should be studied to evaluate its influence.
2.5. Debt per Capita
Per capita debt is a macroeconomic indicator that gives us the average amount that each inhabitant of a given country should contribute to pay the total public debt [50]. With the existence or increase of public debt and, consequently, of per capita debt, consumers may be more reluctant to buy national brands, of a higher price, because part of their income has to go to pay taxes on public debts. Therefore, it can be a variable that can influence the purchasing behavior of our consumer [51] and in the case of the private label it can be an indicator that strengthens the own brand as the indicator itself increases.
Therefore, debt per capita is a macroeconomic indicator that we will incorporate in our study to estimate its influence with respect to private labels.
3. Methodology
To study private labels, we considered necessary the study of two variables: the volume of the market share of private labels and the value of the market share of private labels. In order to obtain information on these variables, we contacted the Private Label Manufacturers Association (PLMA) and its private label directory. Our study is based on data from 19 countries within the European Union from 2008 to 2017. The variable “volume” was evaluated in physical units, representing the sales of this product category. The variable “value” of own brands was measured in monetary units and represents the sales of this product category. The data for GDP, unemployment, Consumer Price Index, average wage, and per capita indicator have been extracted from the World Bank [52]. For the analysis of the above data we have used IBM SPSS Statistics. This tool is considered the market’s leading statistical software, designed to solve business and research problems through ad hoc analysis, hypothesis testing, geospatial analysis, and predictive analytics, integrating artificial neural networks as one of its main features. For common regressions we have used the statistical software R.
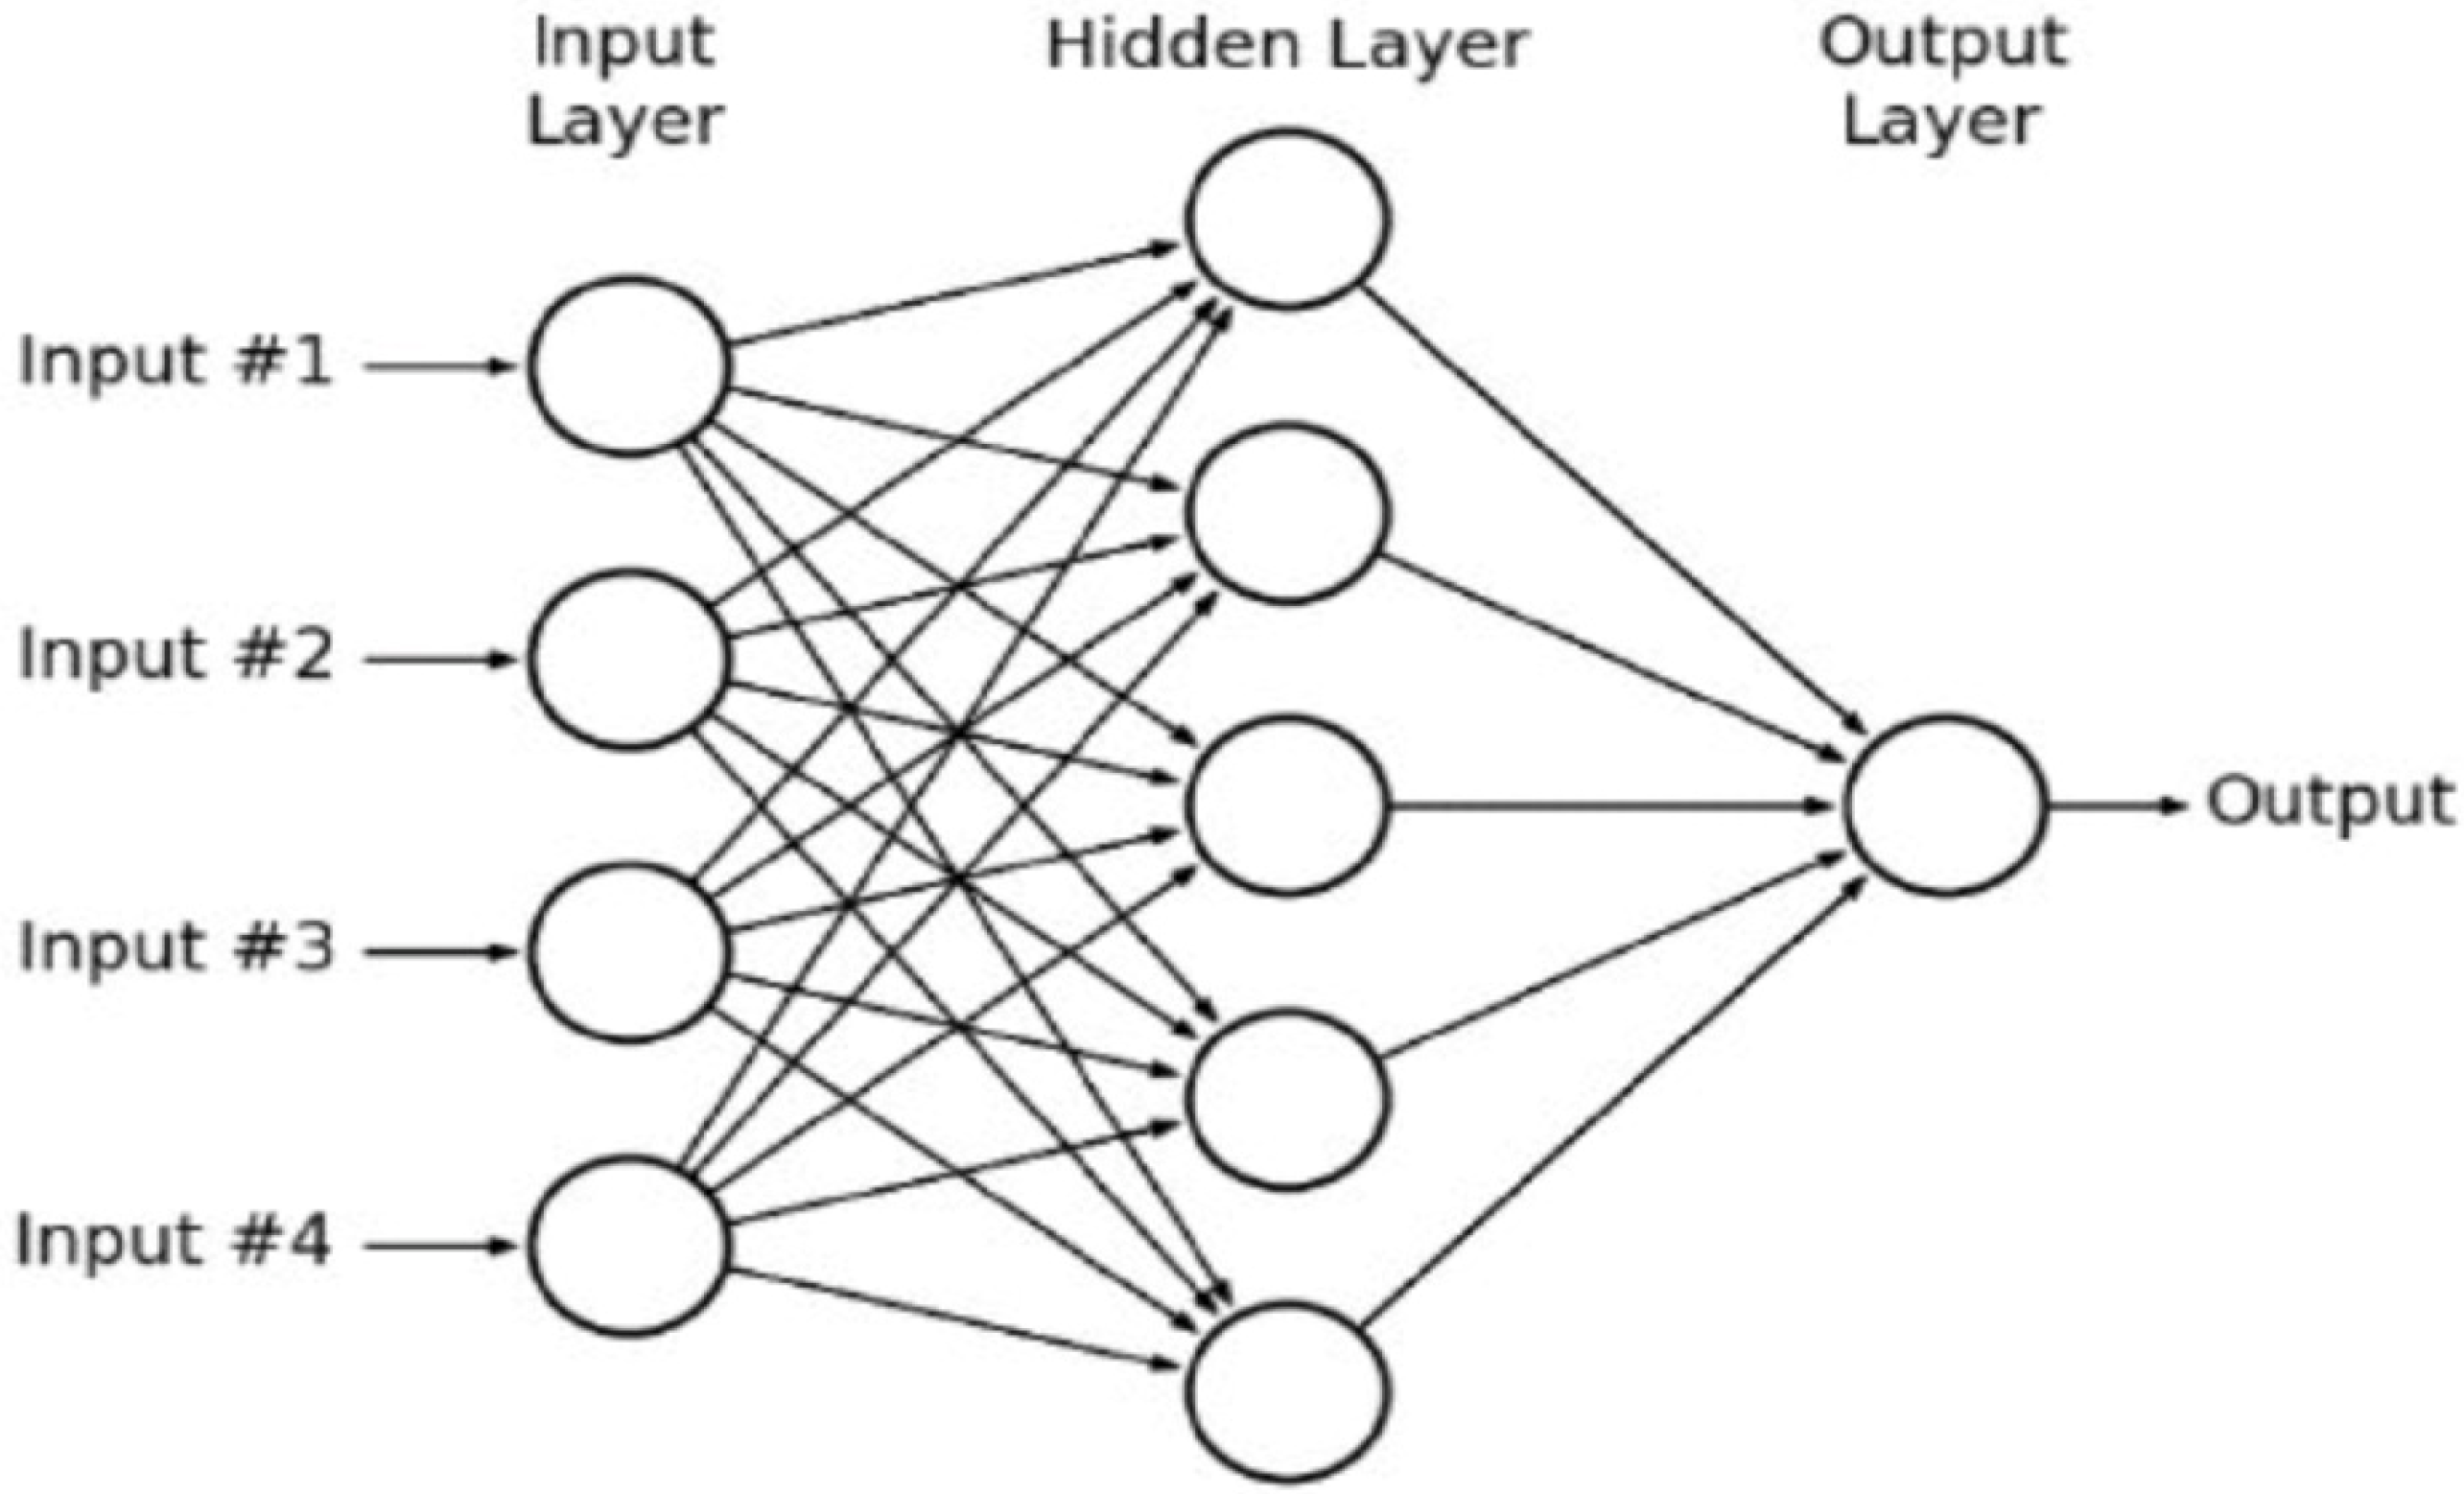
Neural networks used in predictive applications, such as multilayer perceptron network (MLP), are monitored in the sense that the results predicted by the model can be compared with the known values of the target variables [53].
The MLP transforms the inputs and outputs through some non-linear functions. The output of the input network is determined by the activation of the output layer units as follows:
where ∫() is the activation function, xh is hidden layer node activation, and who is the interconnection between the hidden layer node and the output layer node. For example, the MLP function can be seen in Figure 1 [54]:
Finally, indicate that the hyperparameters selected to train the artificial neural networks have been in both cases (for both Volume and Value) the following: the same five independent variables as input with tanh activation function, a hidden layer with which we obtained better results than with others, and an output layer that as it was quantitative had as activation function the identity. In both cases, the selected error function has been the sum of squares the type of training chosen has been the batch, the optimization algorithm has been Scaled conjugate gradient, and the initial Lambda = 0.0000005.
4. Results
Multilayer Perceptron (MLP) generates a predictive model for one or more dependent (target) variables based on the values of the predictor variables. In this sense we have performed two analyses, the first one for the “volume” and a second analysis for the “value” of the private label.
4.1. Volume
In Table 1, we see the distribution that has been made to divide the entire sample into two data sets, one used to train the perceptron and the other to test its predictive ability since we have data on what the network should return.
In Table 2, we summarize the most relevant characteristics of the network used. In this sense, we can observe that for the volume (dependent variable), we have used five macroeconomic variables (GDP, Average Wage, Debt per Capita, Unemployment, and CPI) that will serve as predictors.
To finish defining the network, we have to specify the activation functions of each layer. The activation function “relates” the weighted sum of units in a layer to the values of units in the correct layer. The Activation function of the output layer used is the Identity. This function has the following form: γ(c) = c. It takes real value arguments and returns them unchanged. When automatic architecture selection is used, this is the Activation function for the output layer units if there are dependent variables measured in scale. Furthermore, for the input, the Hyperbolic Tangent has been used. This function has the following form: γ(c) = tanh(c) = (ec − e−c)/(ec + e−c). It takes real value arguments and transforms them into the range (−1, 1).
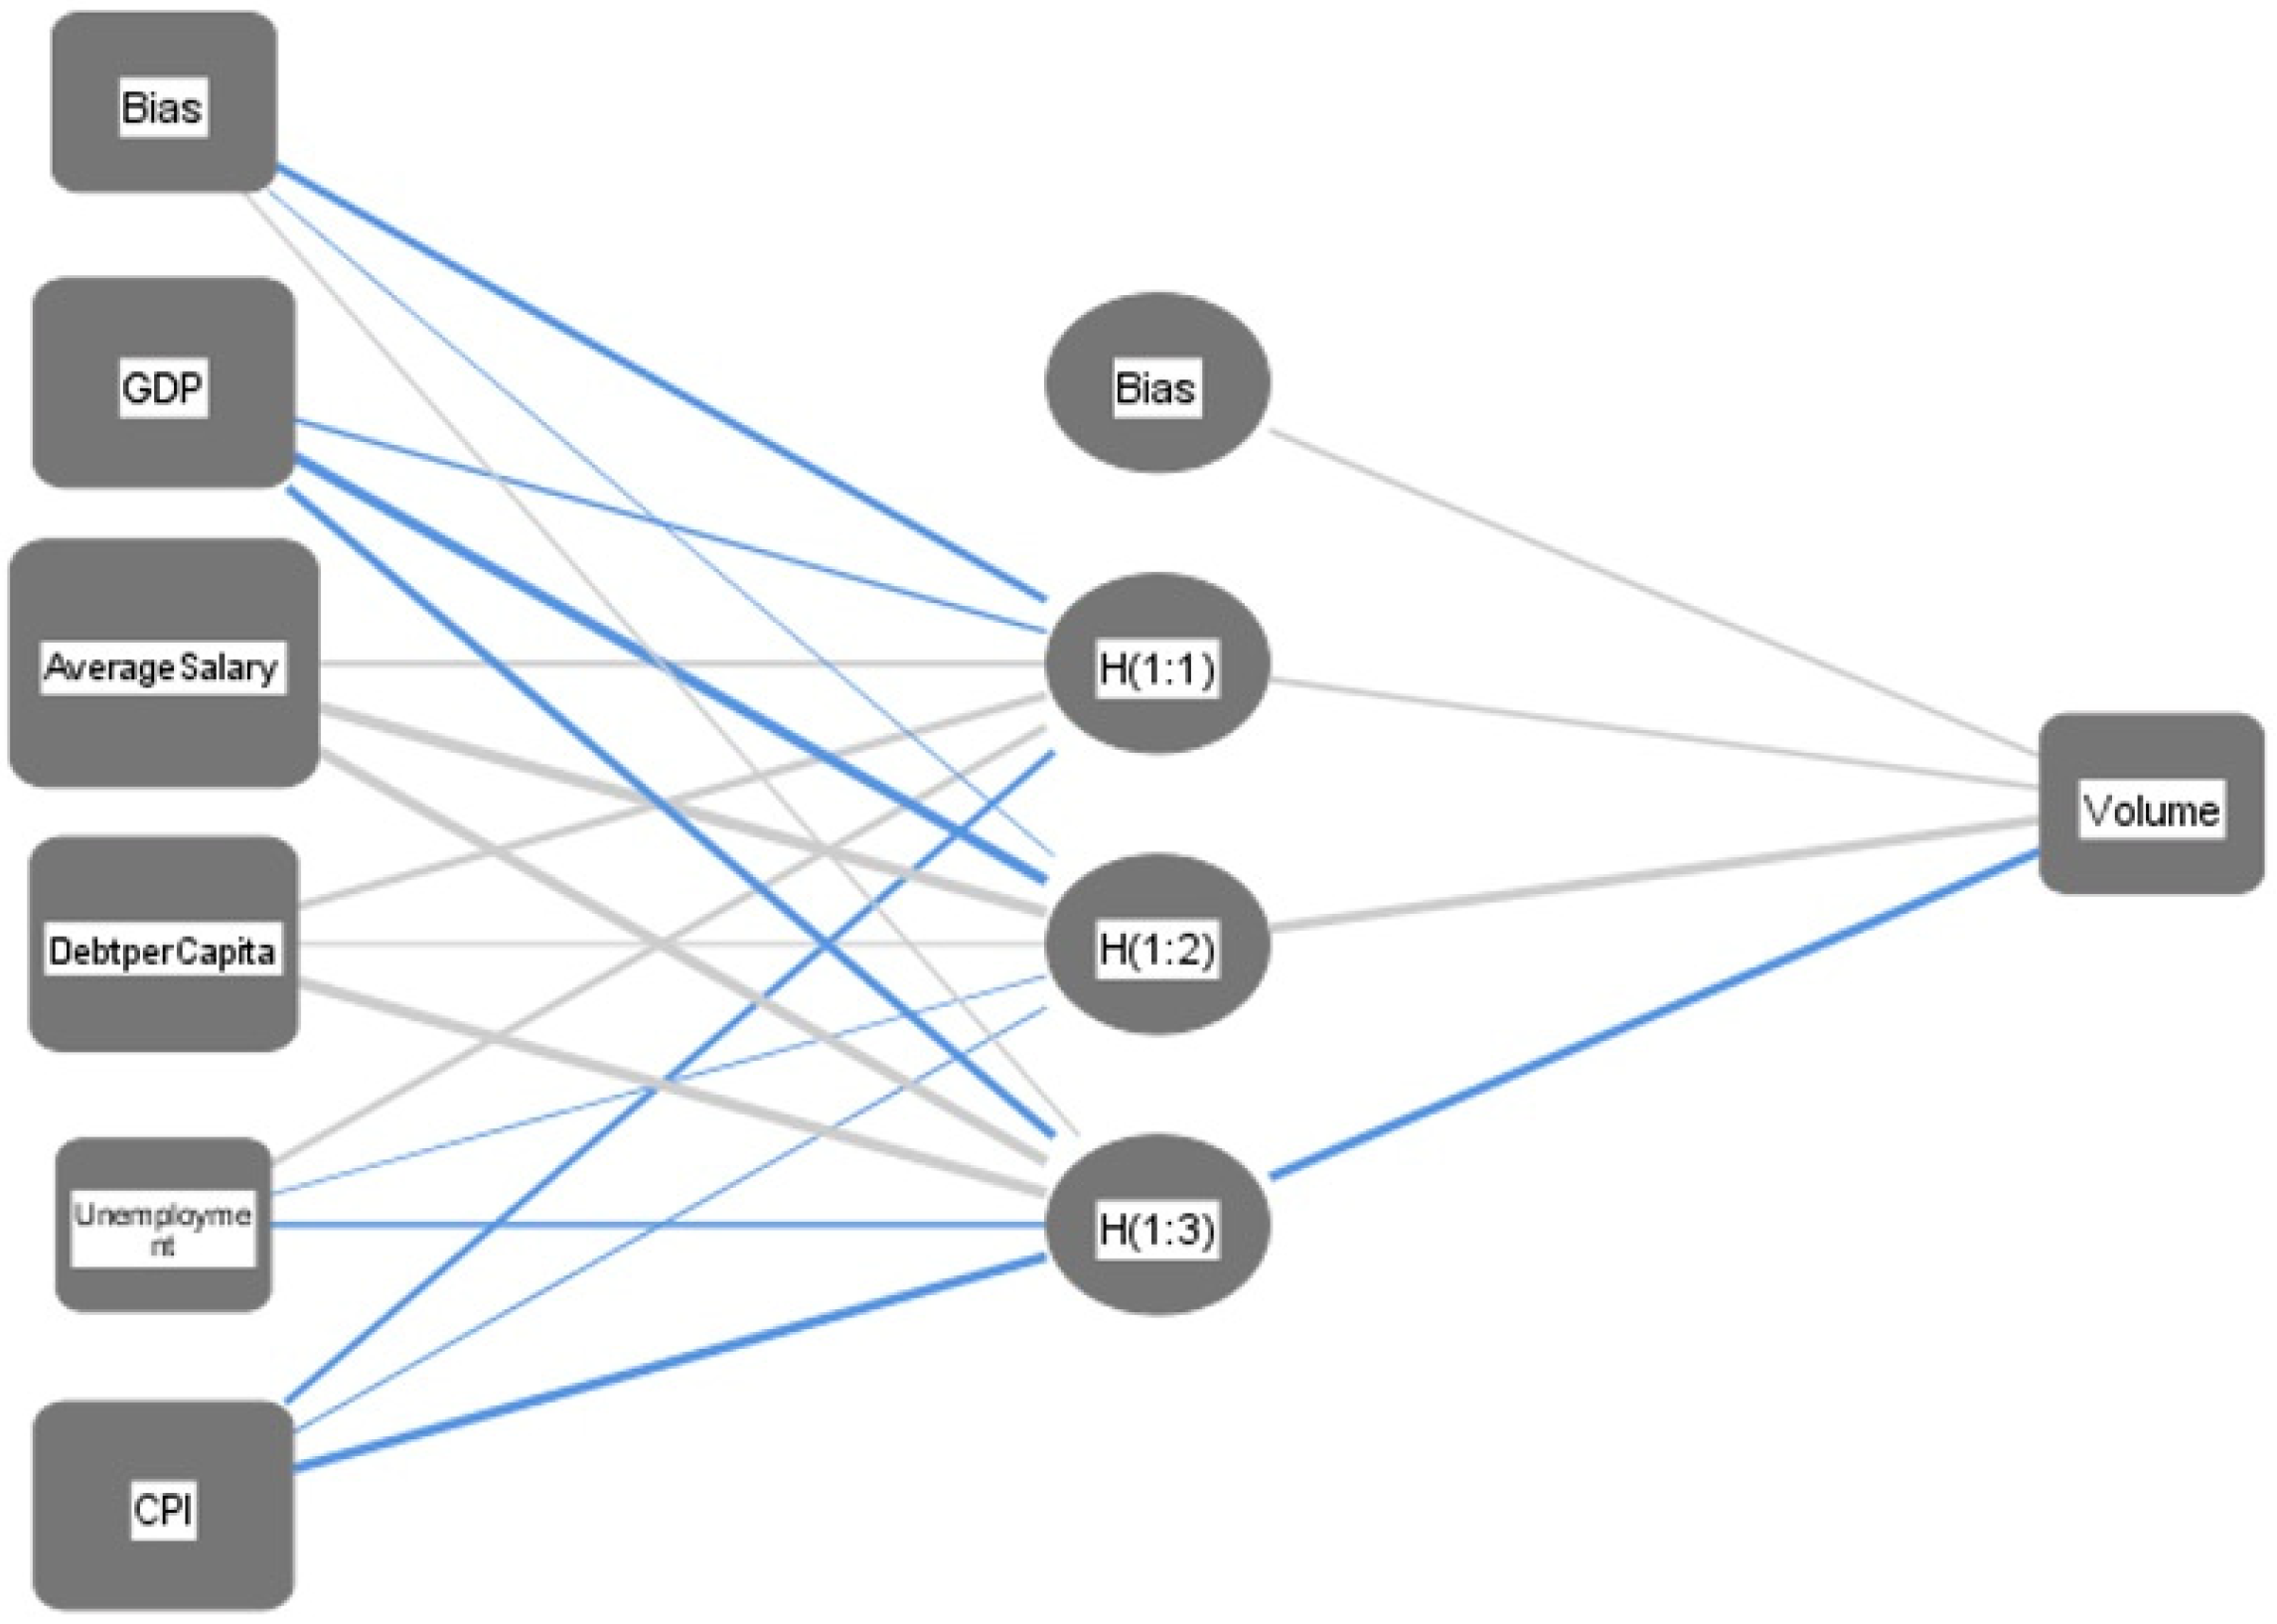
The input layer contains the predictors. The hidden layer contains unobservable nodes (or units). The value of each hidden unit is a function of the predictors; the exact form of the function depends, on the one hand, on the type of network and, on the other hand, on user-controllable specifications. The output layer contains the answers. Again, the exact form of the function depends, on the one hand, on the type of network and, on the other hand, on user-controllable specifications.
In Figure 2, we can observe the definitive structure of the artificial neural network architecture.
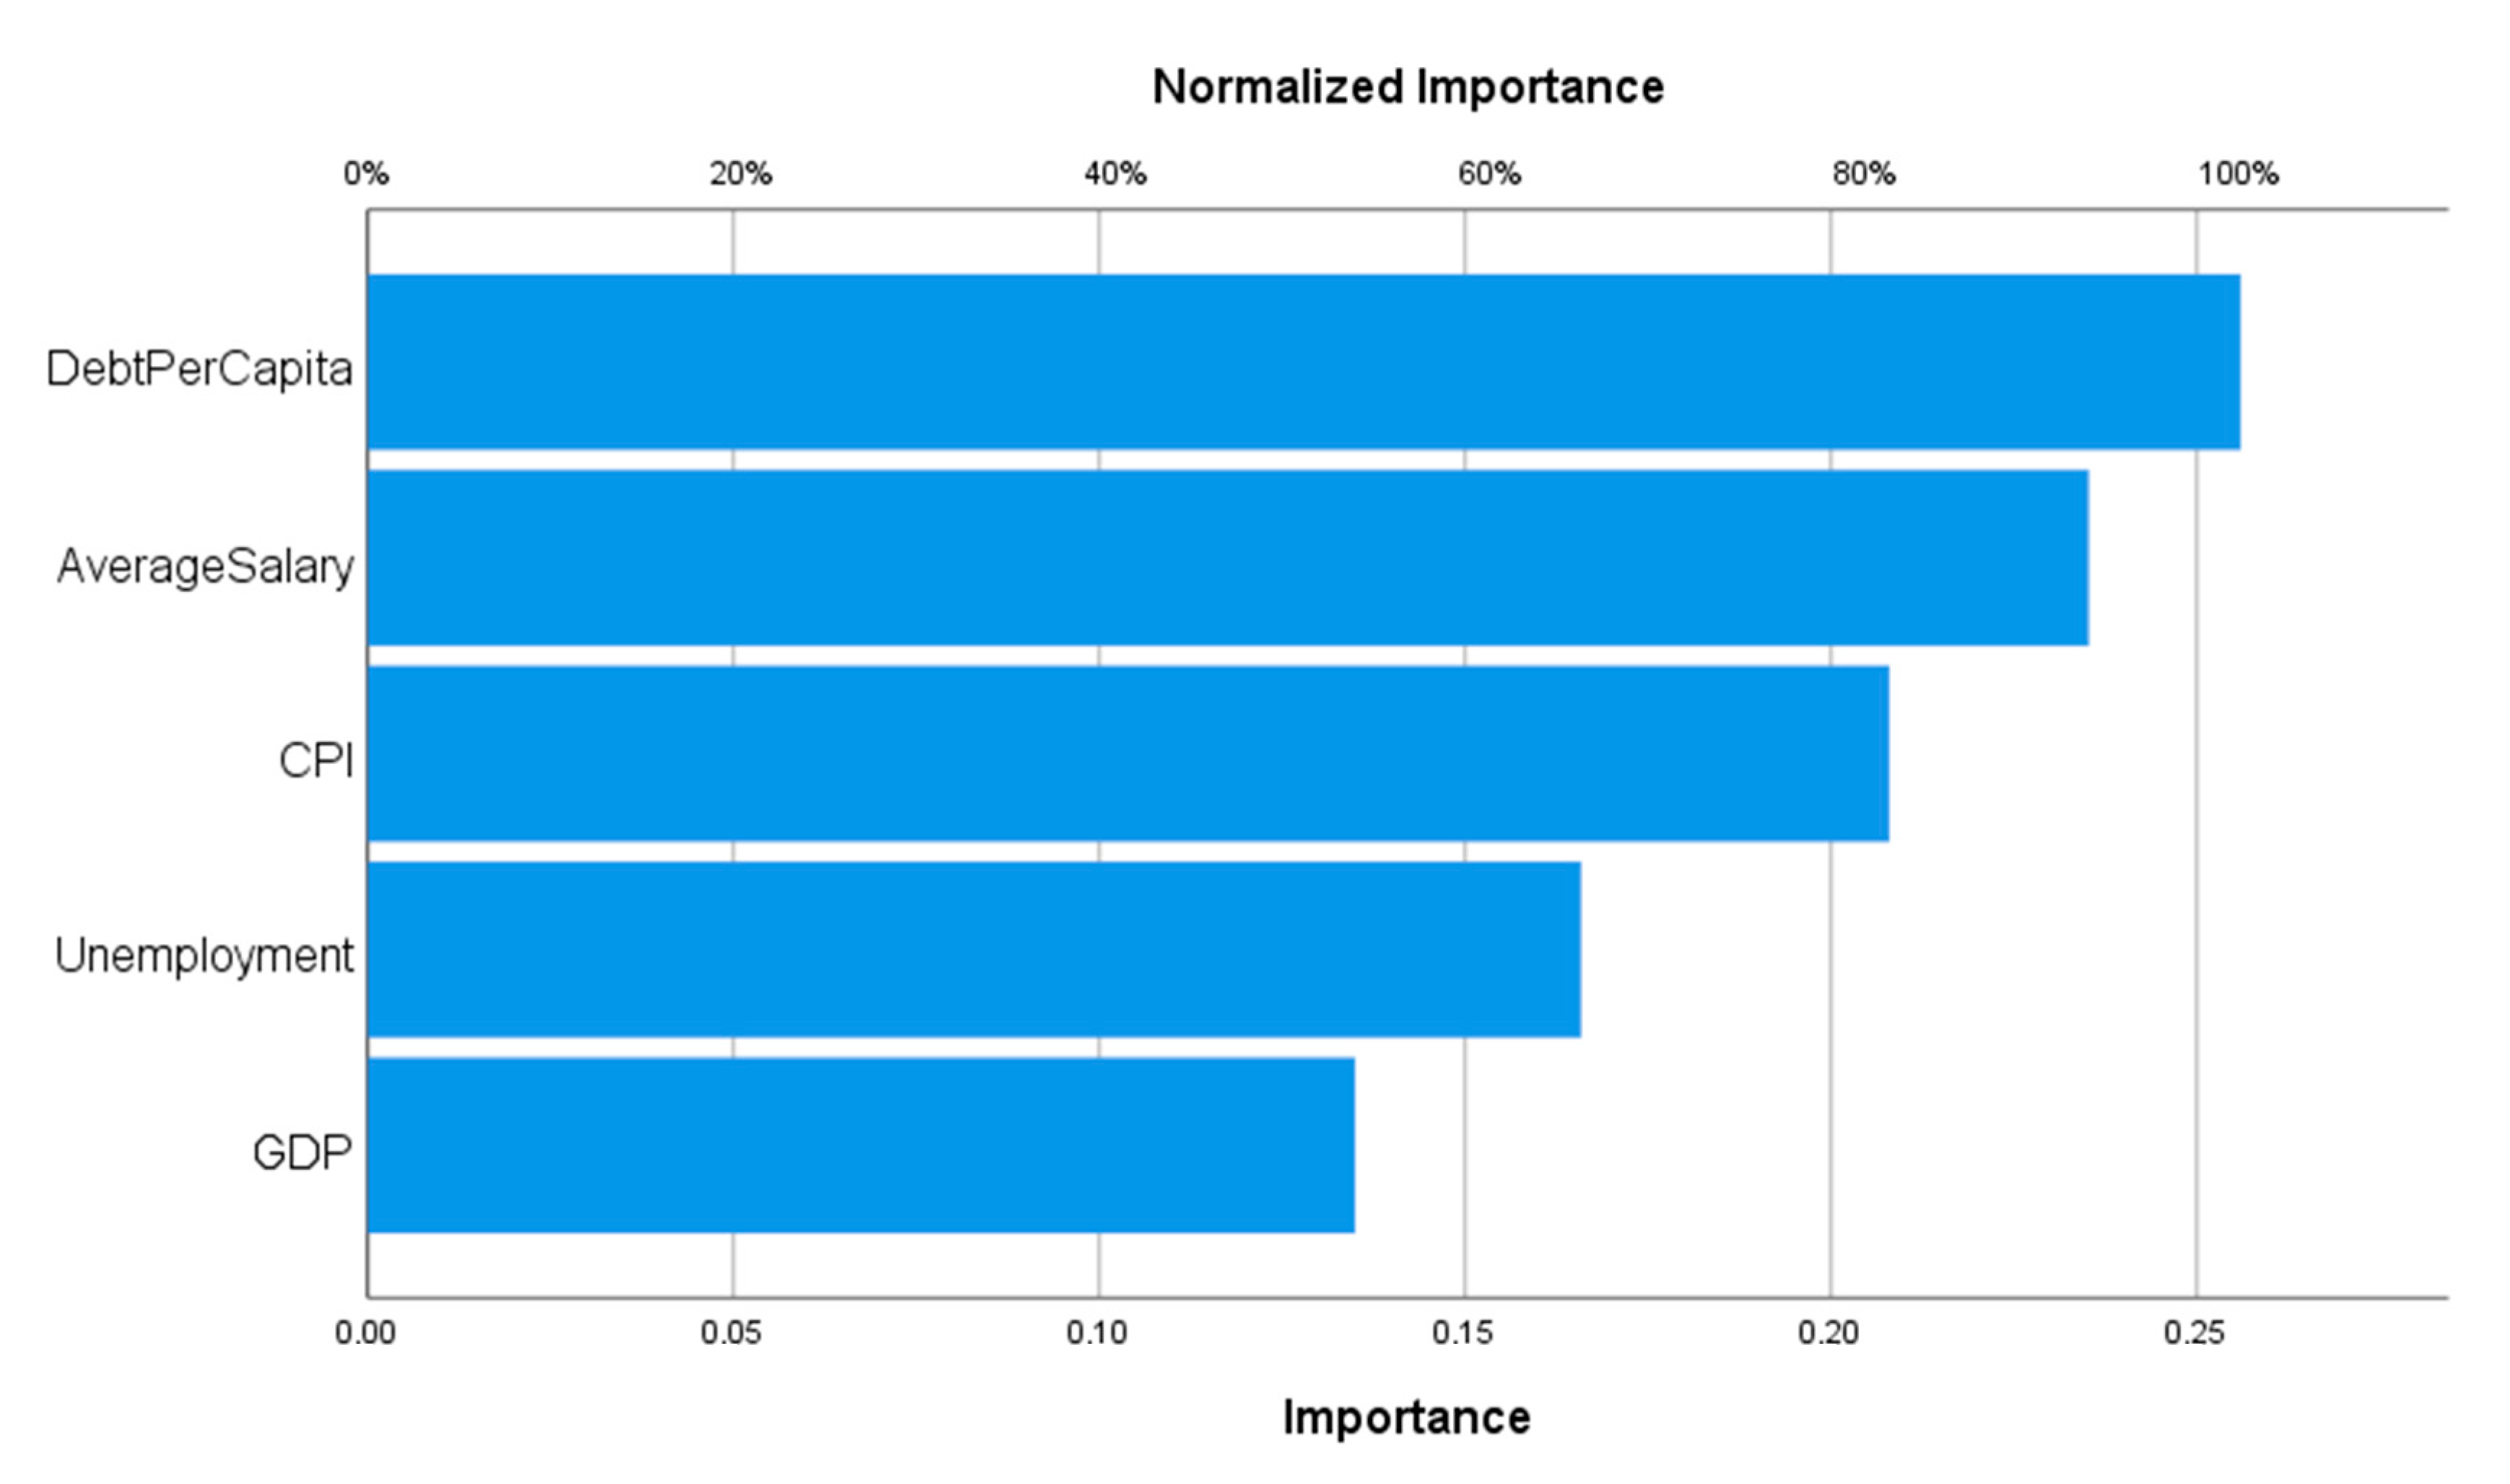
Once trained, in Figure 3 we can view how the independent variables influence the dependent variables and their importance. The importance of an independent variable is a measure of how much the value predicted by the network model changes for different values of the independent variable [55]. Normalized or standardized importance is the result of the importance values divided by the values of the major importance and expressed as percentages [56]. In this case we have that for the volume of the private label the network reports an importance of the following independent variables: for the GDP the importance is 13.5%, the average salary 23.5%, the Per Capita Debt 25.6%, the Unemployment 64.8%, and finally for the Consumer Price Index an importance of 20.8%.
Finally, it is necessary to evaluate the adjustment of the neural network, which we can see in Table 3.
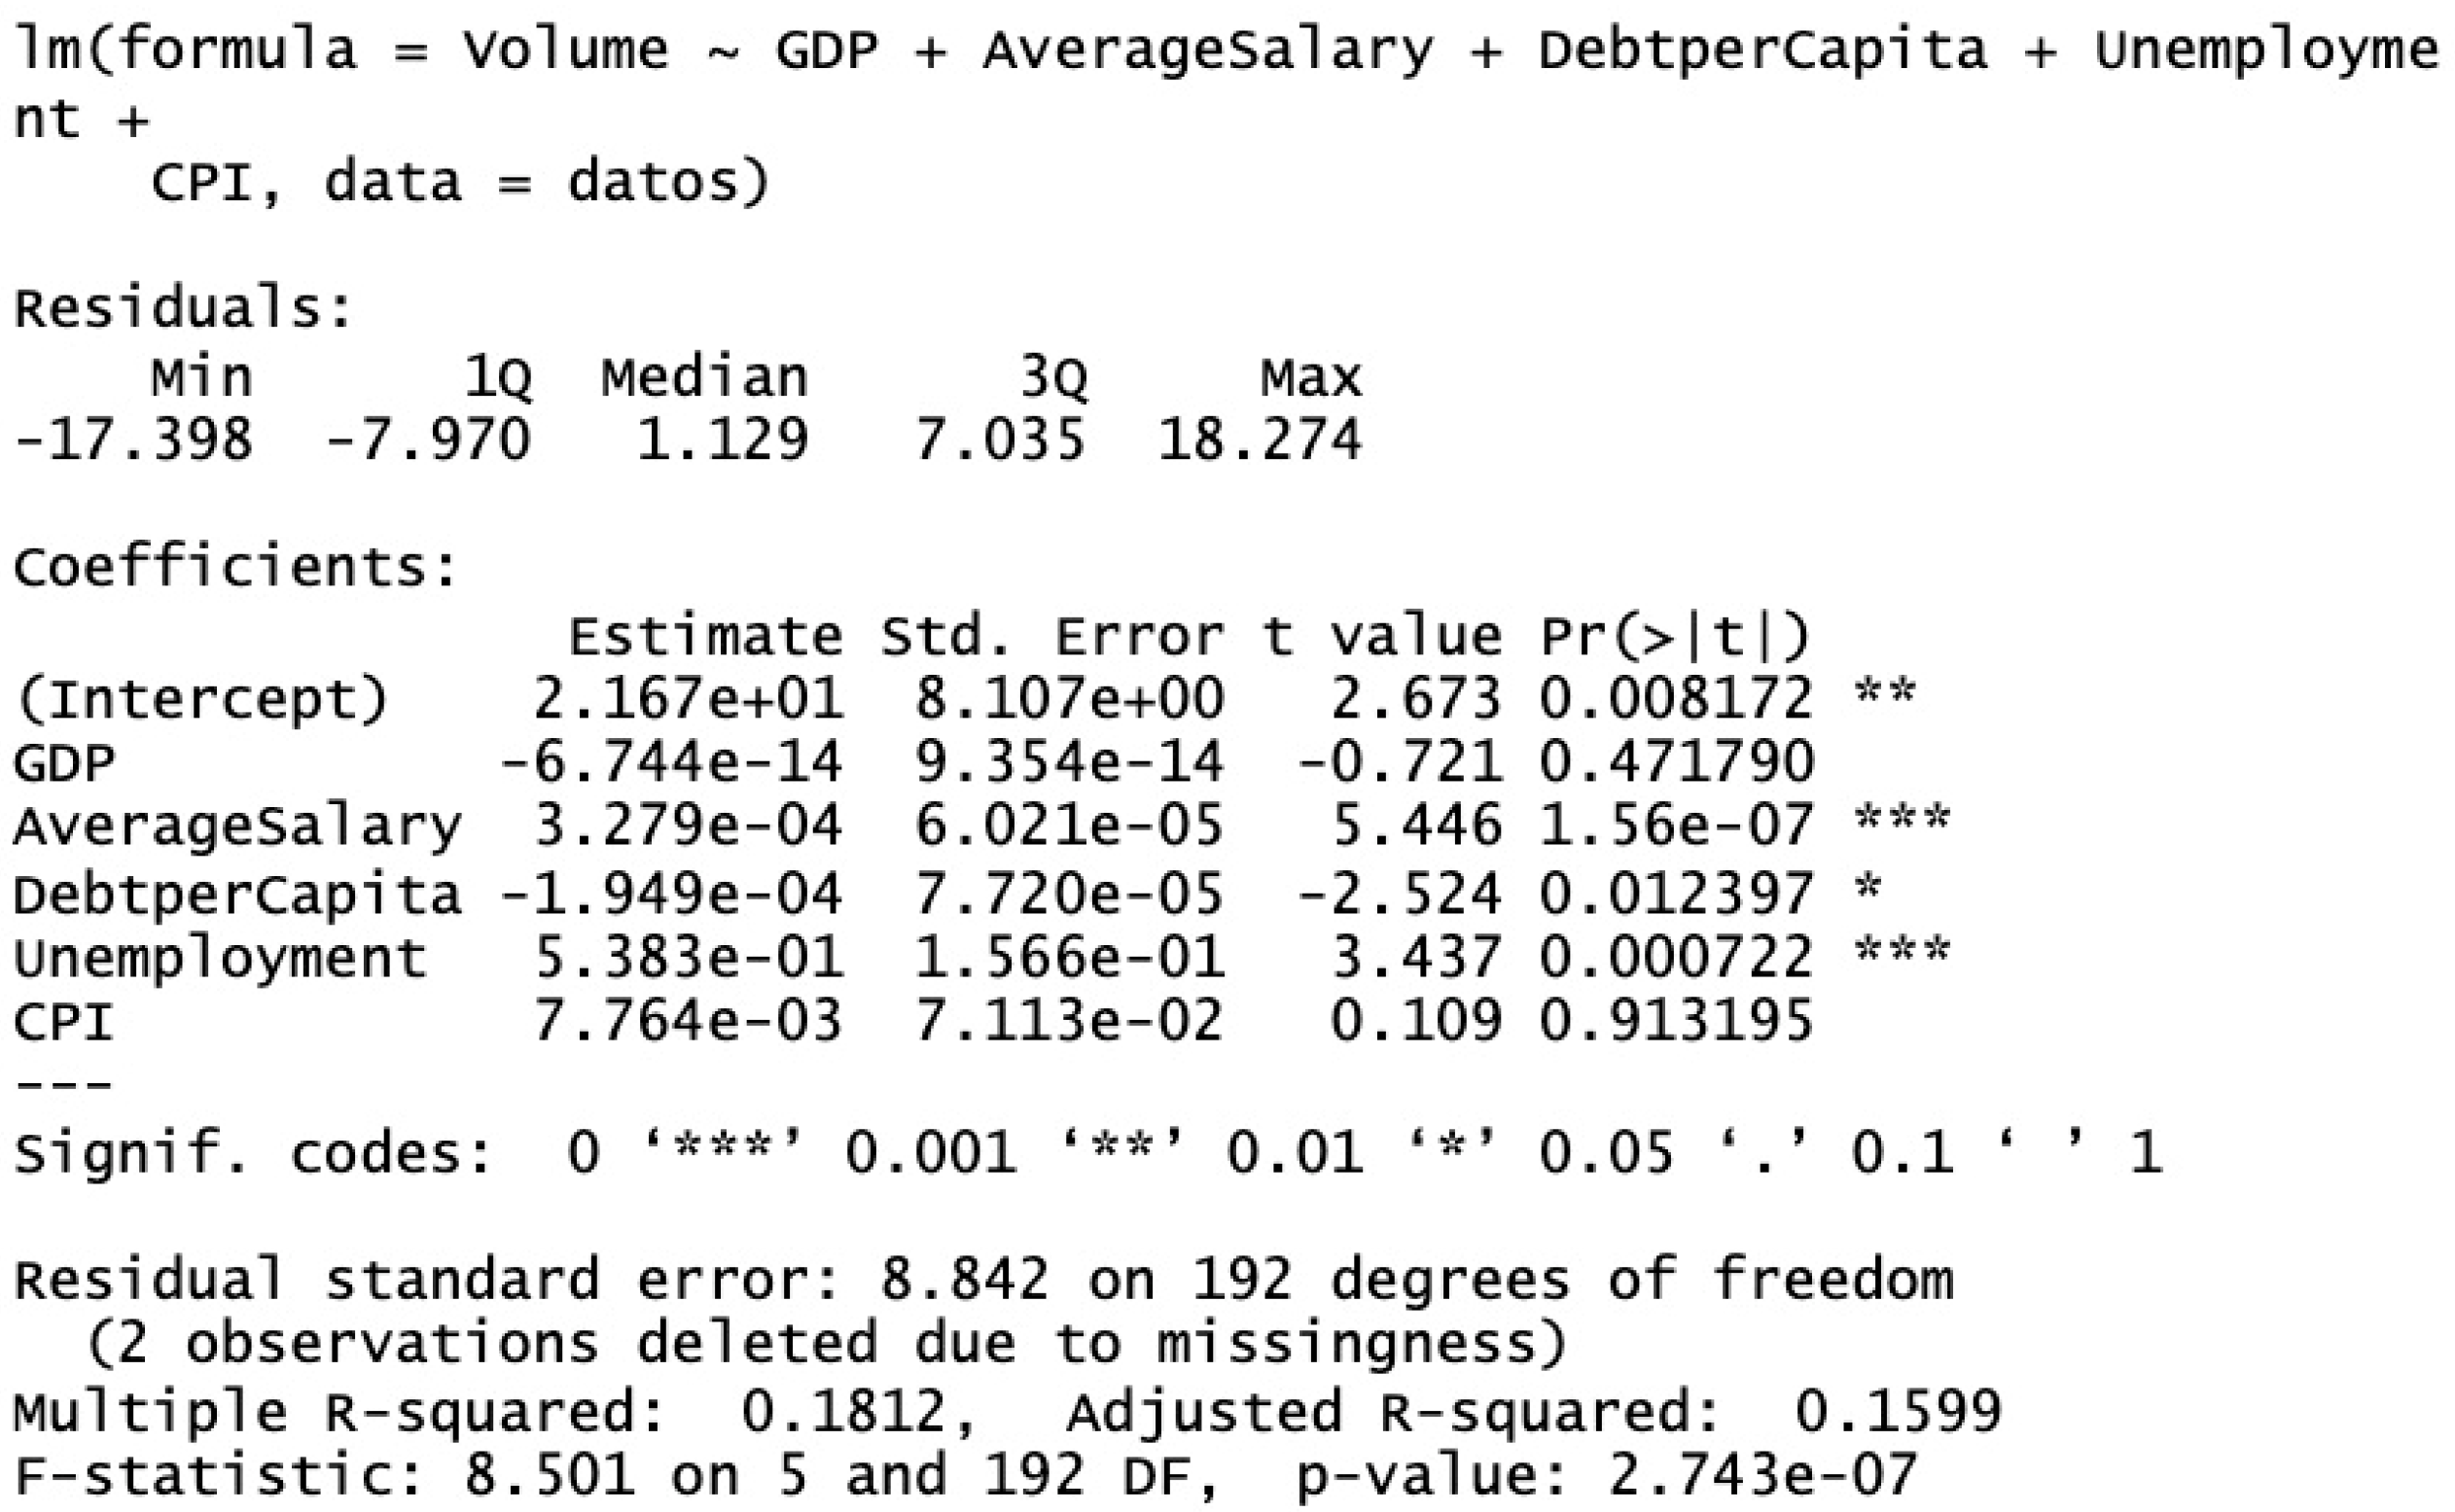
In order to check if this adjustment is good or bad, we have made a regression with the same variables and the results obtained can be contrasted in Figure 4.
After performing the regression we corroborate that the most appropriate method is the ANNs since the RMSE of the regression is 8.842, as we can see in Figure 4, while for the artificial neural network in the worst case we have an RMSE of 8.75, which we managed to lower to 3.062 in the case of the test set, coinciding in addition with a wide number of cases in the literature [57,58,59,60].
4.2. Value
As in Table 1, in Table 4 we observe the distribution that has been made to divide the entire sample into two data sets; one used to train the perceptron and the other to test its predictive ability.
In Table 5, we can observe the parameters of the artificial neural network for the variable value of the own brand; in this sense we have not altered the parameters to be homogeneous with the “volume” and proceed to its correct comparison.
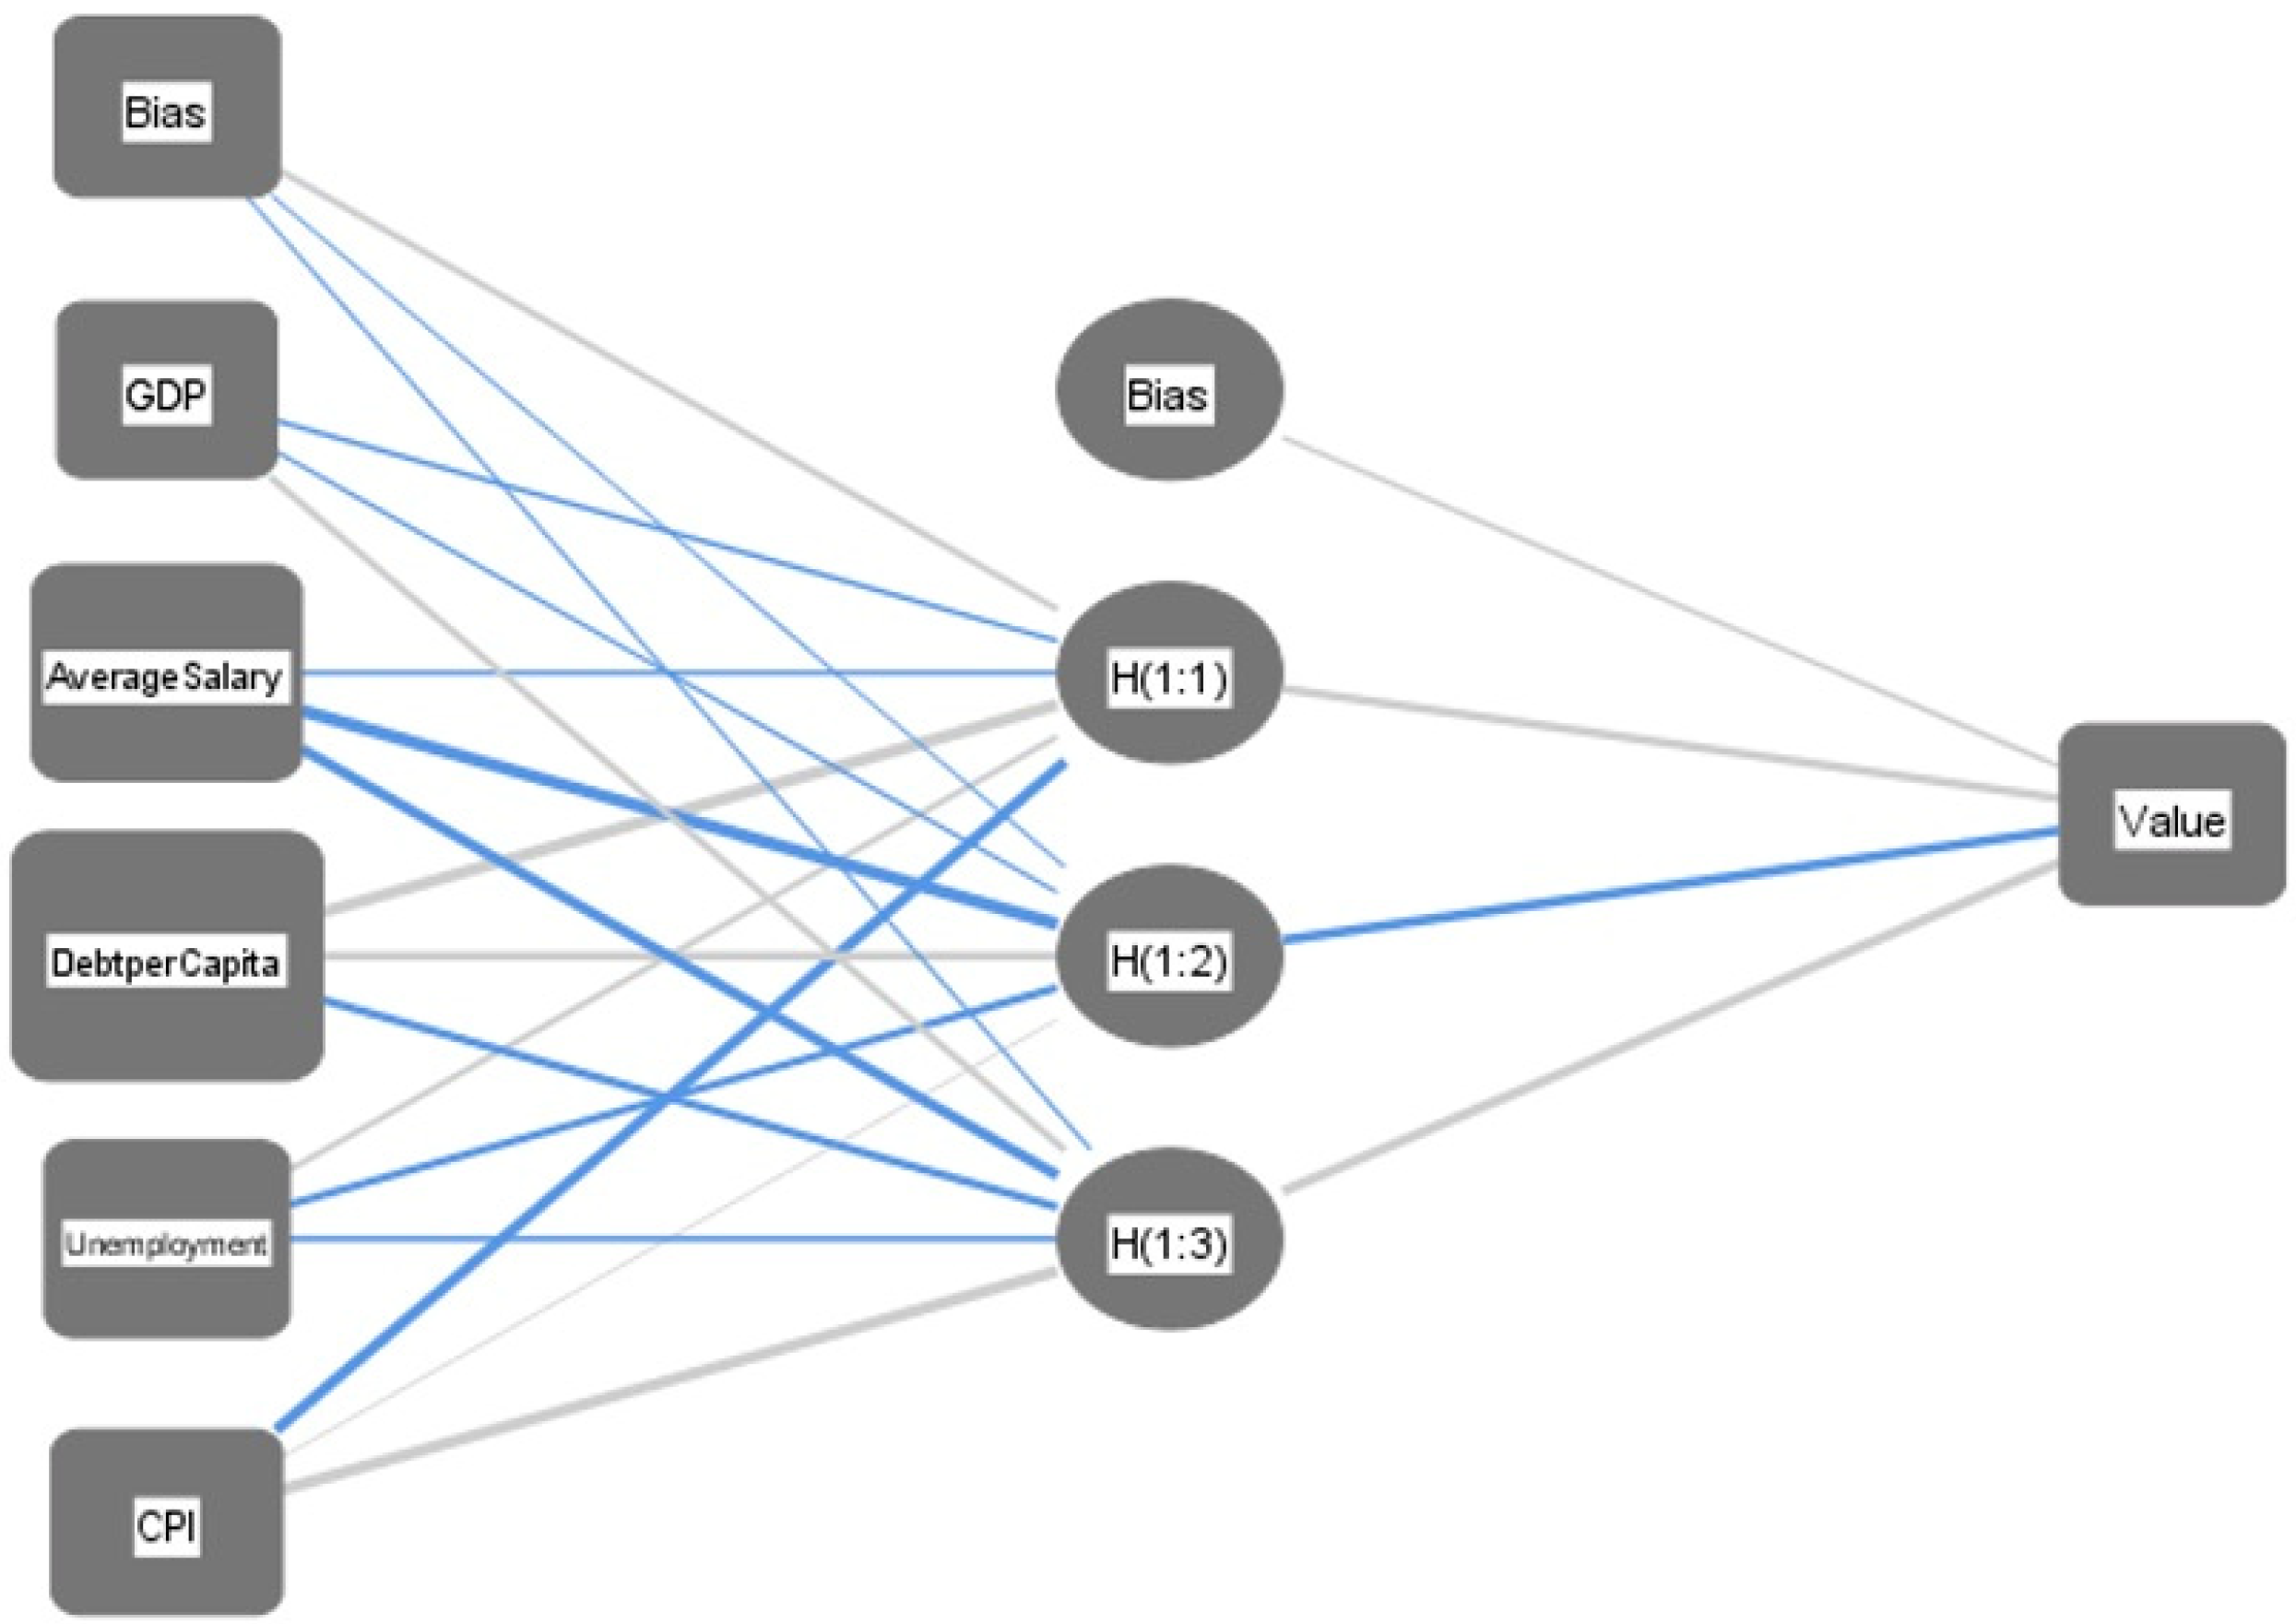
In Figure 5 we will observe how the artificial neural network is illustrated, which has a total of five covariates (+ the bias) whose last output is the value of the private label.
As in the previous case, once the network is trained, we can observe the importance of the independent variables within the network (Figure 6): for the GDP the importance is 14.0%, the average salary has an importance of 24.4%, the Debt Per Capital 25.1%, the Unemployment 18.3%, and finally the Consumer Price Index 18.2%.
The adjustment of this neural network can be seen on the Table 6.
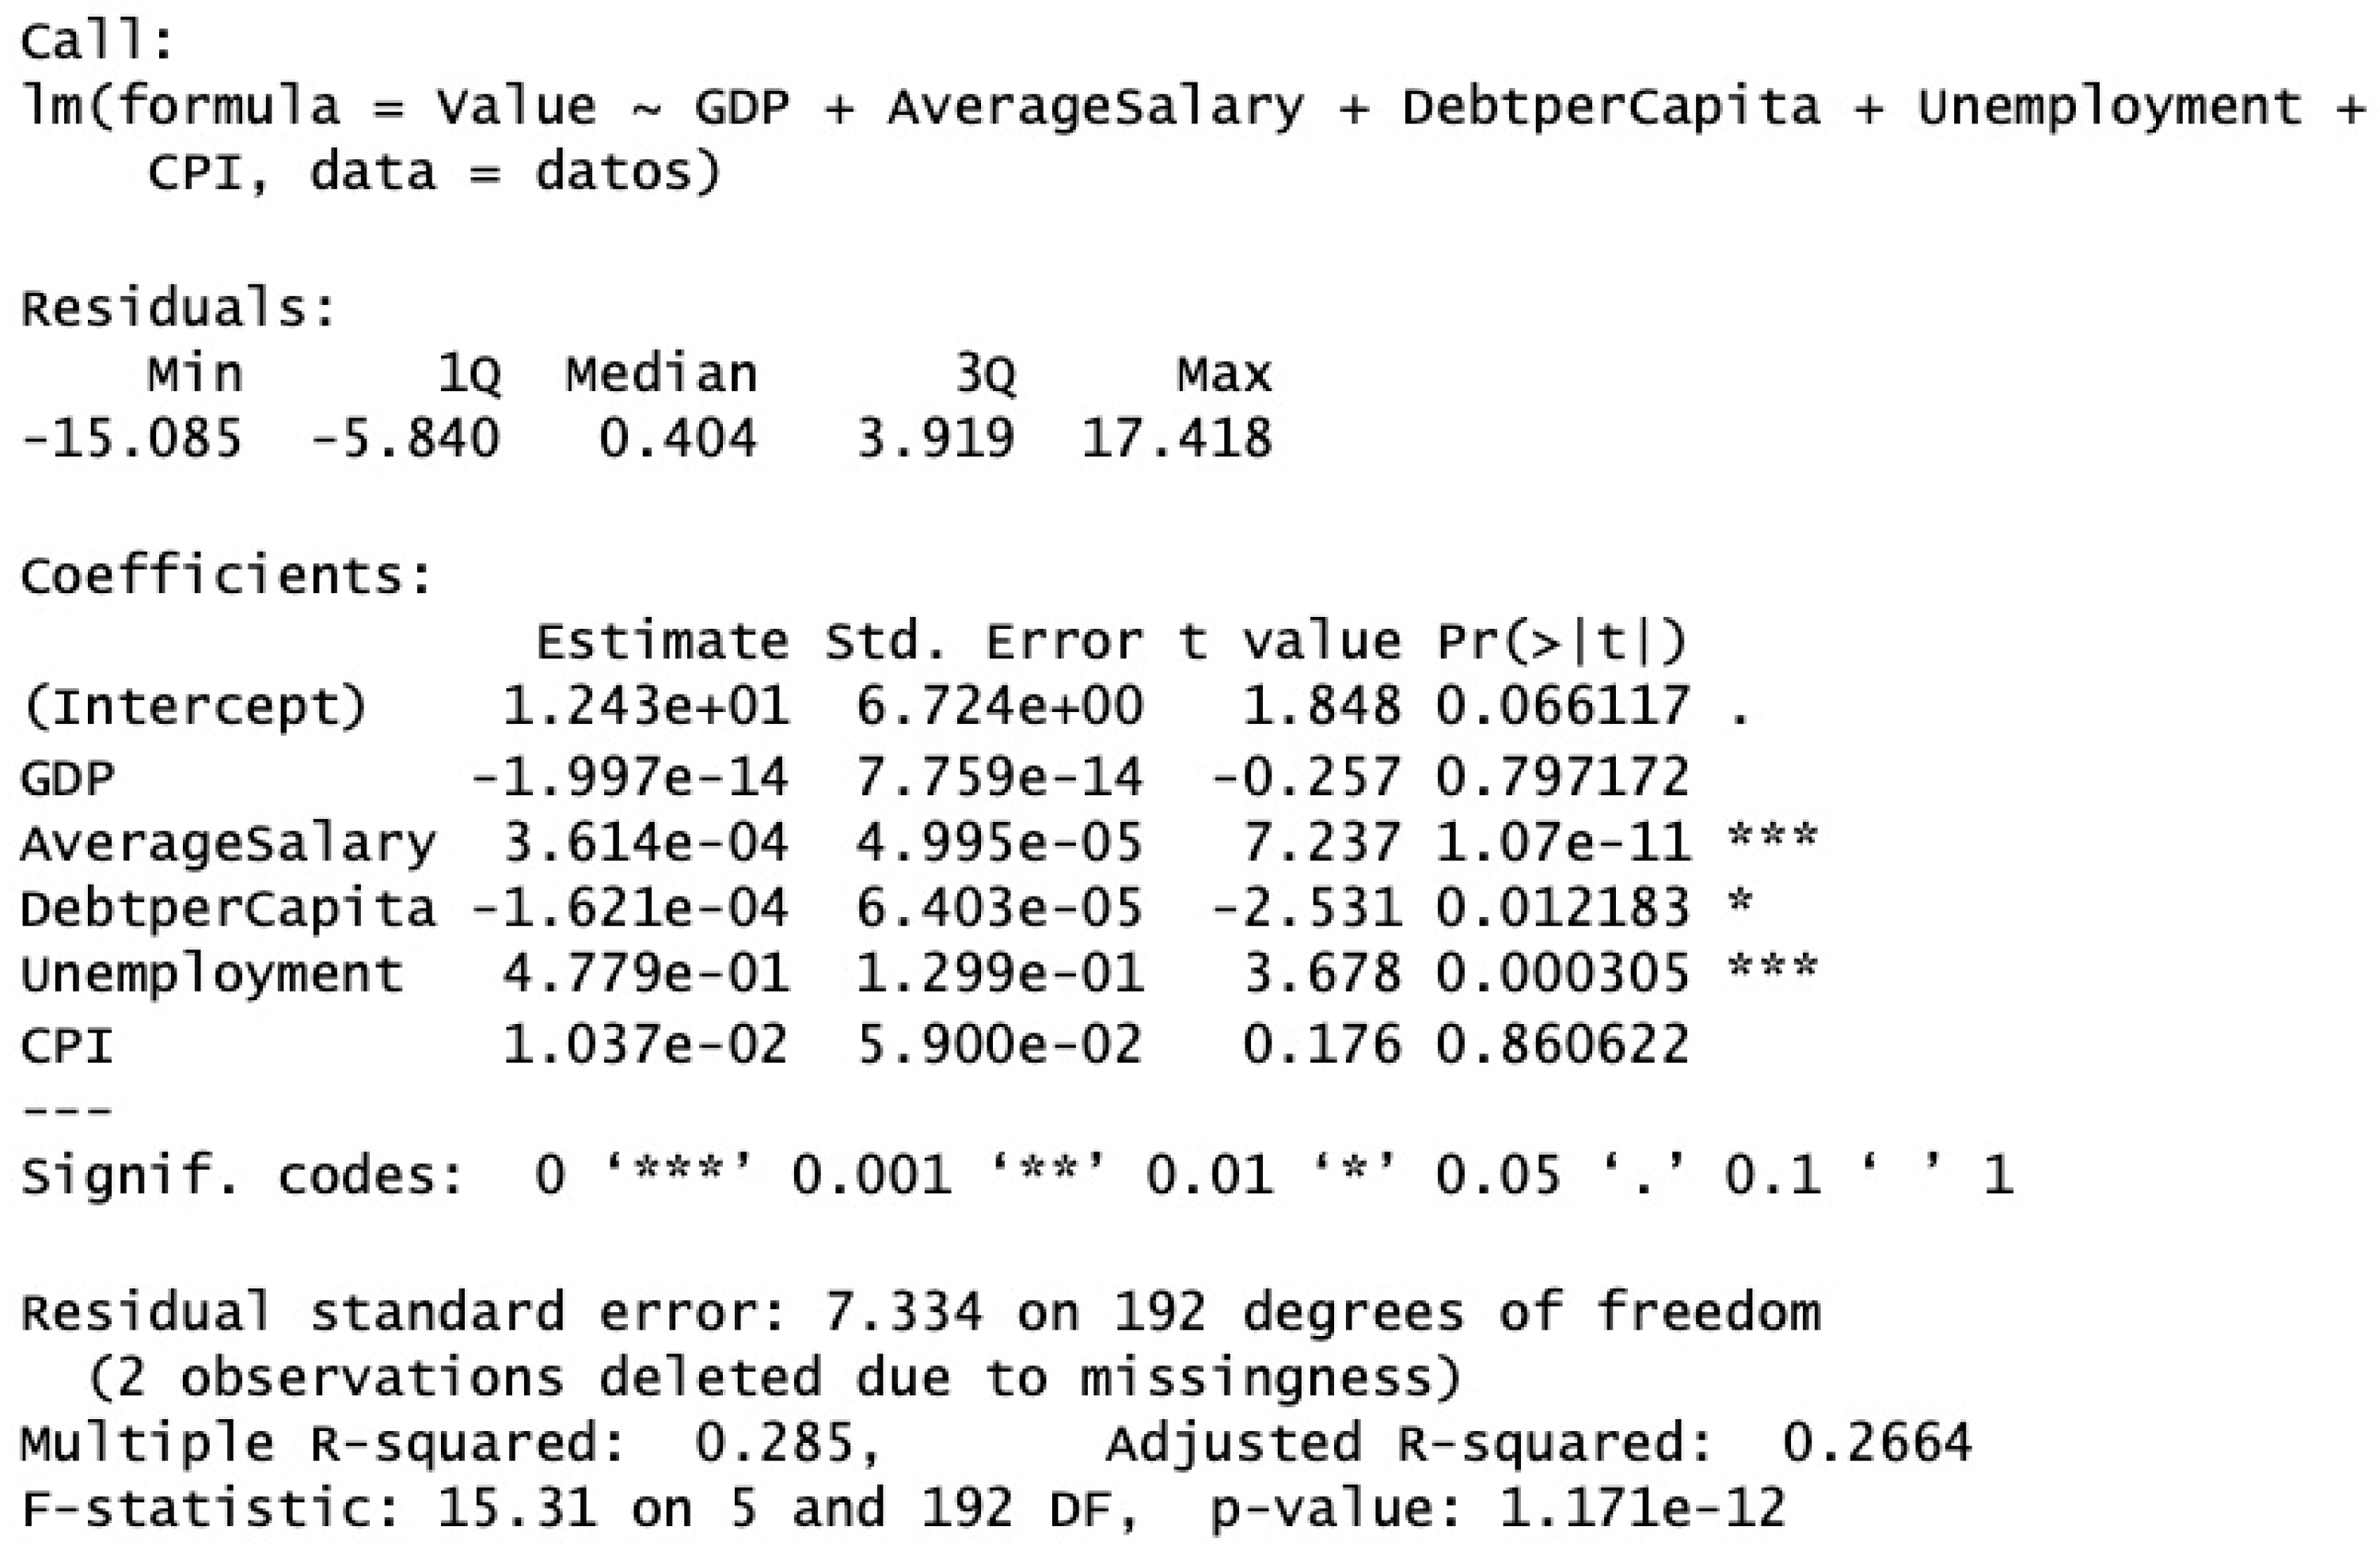
As in the previous case, in order to check if this adjustment is good or bad, we have made a regression with the same variables and the results obtained can be contrasted in Figure 7.
As for the value, the same as volume happens, the RMSE of the regression is 7.334, while in the worst case we have an RMSE in the ANN of 5.047, reaching only 3.004 in the best case.
5. Results and Conclusions
It is important for the various retail organizations operating with a private label assortment of 40–45% of their total private label assortment [61] to know which macroeconomic indicators are most important when entering a new country. In this research, Europe was taken as the main study sample, since it is the continent that has grown its private label the most and can be a reference to be able to promote private labels in other locations. It has been discovered which are the most influential macroeconomic indicators at the time of implementing private labels.
In this sense, for the “volume” of the own brand we have obtained the following data: the GDP has an importance of 13.5%, the average salary 23.5%, the Debt Per Capital 25.6%, the Unemployment 16.6%, and finally the Consumer Price Index has an importance of 20.8%. Therefore, we estimate that the different organizations should pay special attention to the Per Capita Debt; thus, it is likely that when a country is highly indebted, its consumers will feel apprehensive about spending more than usual and will tend to save in their shopping baskets, with the private brand being an alternative to the national brand. The next indicator that organizations should set when entering a new country is the average salary as the main macroeconomic indicator. This is because the lower the average salary of a country’s inhabitants, the more likely it is that the private label will be sold above the national brand. In this sense, we recommend that organizations look at the Per Capita Debt of the country itself and subsequently at the average salary of its inhabitants when entering a new country as the first macroeconomic option. As next options, we report the importance of the Consumer Price Index, Unemployment, and as the last option the GDP. These last data are curious, in the sense that the importance of Unemployment has always been determined in the literature of the private label so that users tend to buy the private label; however, in comparison with other macroeconomic indexes, in our study a minor importance is reported, which could be due to the fact that citizens of a country, even if they remain unemployed, continue to receive subsidies from the state and do not modify to a great extent their purchase patterns between national and private labels.
We have also been able to check that the error made by the neural network is much less than that of classical regression, thus, the neural network has greater explanatory power than regression.
With respect to the “value” of the private label, we obtain data analogous to the “volume” since the debt per capita is the macroeconomic indicator that has more relevance; in this sense it is possible that when the country is in a high indebtedness, the consumers of the country are reluctant to buy products with a higher quality and therefore a higher price. As a result, consumers perceive the private label as a cheaper alternative to the national brand and one that is in line with the level of debt and economic possibilities of the consumers. The second most relevant indicator is the average salary, thus, the lower the average salary of the consumers, the more value they will give to the private brand as an alternative to the national brand; this result is in line with the previous result, since the more indebted and the smaller the average salary the consumer in the country receives, the more value the private brand will bring to them compared to the national brand.
Therefore, we recommend that organizations that are considering entering a new country or continent where most of their assortment is based on private labels, they should first consider the macroeconomic indicator of the country’s Per Capita Debt, since it is a determining factor and is above other macroeconomic indicators when it comes to private label. In this sense, if they heed these recommendations, they may have a better chance of succeeding in implementing their organization in the new country or continent.
As a main limitation we can say that this work should incorporate new continents to see if the pattern in Europe is the same as in other locations; in addition, it would be interesting to raise studies disaggregated by countries within the continents studied.
Author Contributions
Conceptualization, E.G.-C. and J.-P.C.-S.; Methodology, E.G.-C. and J.-P.C.-S.; Software, E.G.-C. and J.-P.C.-S.; Validation, E.G.-C. and J.-P.C.-S.; Formal Analysis, E.G.-C. and J.-P.C.-S.; Investigation, E.G.-C. and J.-P.C.-S.; Resources, E.G.-C. and J.-P.C.-S.; Data Curation, E.G.-C. and J.-P.C.-S.; Writing—Original Draft Preparation, E.G.-C. and J.-P.C.-S.; Writing—Review & Editing, E.G.-C. and J.-P.C.-S.; Visualization, E.G.-C. and J.-P.C.-S.; Supervision, E.G.-C. and J.-P.C.-S. All authors have read and agreed to the published version of the manuscript.
Funding
This research received no external funding.
Conflicts of Interest
The authors declare no conflict of interest.
References
- Bergès-Sennou, F.; Bontems, P.; Réquillart, V. Economics of private labels: A survey of literature. J. Agric. Food Ind. Organ. 2004, 2. [Google Scholar] [CrossRef]
- Geyskens, I.; Gielens, K.; Gijsbrechts, E. Proliferating private-label portfolios: How introducing economy and premium private labels influences brand choice. J. Mark. Res. 2010, 47, 791–807. [Google Scholar] [CrossRef] [Green Version]
- Hoch, S.J.; Banerji, S. When do private labels succeed? MIT Sloan Manag. Rev. 1993, 34, 57. [Google Scholar]
- Narasimhan, C.; Wilcox, C.N.T. Private labels and the channel relationship: A cross-category analysis. J. Bus. 1998, 71, 573–600. [Google Scholar] [CrossRef]
- Nenycz-Thiel, M.; Romaniuk, J. Understanding premium private labels: A consumer categorisation approach. J. Retail. Consum. Serv. 2016, 29, 22–30. [Google Scholar] [CrossRef]
- Sharma, V.; Kedia, B.; Yadav, V.; Mishra, S. Tapping the potential space-positioning of private labels. J. Indian Bus. Res. 2020, 12, 43–61. [Google Scholar] [CrossRef]
- Ter Braak, A.; Geyskens, I.; Dekimpe, M.G. Taking private labels upmarket: Empirical generalizations on category drivers of premium private label introductions. J. Retail. 2014, 90, 125–140. [Google Scholar] [CrossRef]
- Wu, J.-J.; Chang, Y.-S. Towards understanding members’ interactivity, trust, and flow in online travel community. Ind. Manag. Data Syst. 2005, 105, 937–954. [Google Scholar] [CrossRef]
- Bronnmann, J.; Asche, F. The value of product attributes, brands and private labels: An analysis of frozen seafood in germany. J. Agric. Econ. 2015, 67, 231–244. [Google Scholar] [CrossRef]
- Cui, Y.; Kara, S.; Chan, K.C. Manufacturing big data ecosystem: A systematic literature review. Robot. Comput. Manuf. 2020, 62, 101861. [Google Scholar] [CrossRef]
- Iqbal, R.; Doctor, F.; More, B.; Mahmud, S.; Yousuf, U. Big data analytics: Computational intelligence techniques and application areas. Technol. Forecast. Soc. Chang. 2020, 153, 119253. [Google Scholar] [CrossRef] [Green Version]
- Mayer-Schönberger, V.; Cukier, K. Big Data: La Revolución de los Datos Masivos; Turner: Nashville, TN, USA, 2013. [Google Scholar]
- Russom, P. Big Data Analytics. TDWI Best Pract. Report Fourth Quart. 2011, 19, 1–34. [Google Scholar]
- Wu, X.; Zhu, X.; Wu, G.; Ding, W. Data mining with big data. IEEE Trans. Knowl. Data Eng. 2013, 26, 97–107. [Google Scholar] [CrossRef]
- Baroni, M. Linguistic generalization and compositionality in modern artificial neural networks. Philos. Trans. R. Soc. B Boil. Sci. 2019, 375, 20190307. [Google Scholar] [CrossRef] [Green Version]
- Hilera González, J.R.; Martínez Hernando, V.J. Redes Neuronales Artificiales: Fundamentos, Modelos y Aplicaciones; Alfaomega: México city, Mexico, 2000. [Google Scholar]
- Izaurieta, F.; Saavedra, C. Redes Neuronales Artificiales. Dep. Física, Univ. Concepción Chile 2000. Available online: https://d1wqtxts1xzle7.cloudfront.net/36957207/Redes_neuronales.pdf?1426217567=&response-content-disposition=inline%3B+filename%3DRedes_Neuronales_Artificiales.pdf&Expires=1598850350&Signature=VsoZs1qKmhzPfnDyIdO~DSX5ZSUMcSsQDWs3MSkT~yPMGGShviM-VxtIx6RMSwusK4pyJCfrsaqr8k12CoQcnNzLZKvcL-D-eUev~BHCg7ev6hW60rkIyE-m6O27di1s66NdAe9TwjiAsaFsnBsh~tCUbd83-ihdZBpK0rvayfXwv0x6PXWfX0jOS-pWwIJDsprkCRfnzHr4sjpG7OZyqWiB2O6VaySfDmnrKF1db3cWwhfUokrtZUyBfXWxBoQkLDEDSsqLiN9lbyfjlcnXkzj~VU8ZExxda9ZphGLOEZSXnwrkapgclDwX~TOZmBHxxgFXxOmPHHYCZ~-NpjpfKg__&Key-Pair-Id=APKAJLOHF5GGSLRBV4ZA (accessed on 26 August 2020).
- Basheer, I.; Hajmeer, M. Artificial neural networks: Fundamentals, computing, design, and application. J. Microbiol. Methods 2000, 43, 3–31. [Google Scholar] [CrossRef]
- Cinca, C.S.; del Brío, B.M. Predicción de la quiebra bancaria mediante el empleo de redes neuronales artificiales. Rev. Española de Financ. Contab. 1993, 22, 153–176. [Google Scholar]
- De Brébisson, A.; Simon, É.; Auvolat, A.; Vincent, P.; Bengio, Y. Artificial Neural Networks Applied to Taxi Destination Prediction. arXiv 2015, arXiv:1508.00021. [Google Scholar]
- Dölling, O.R.; Varas, E.A. Artificial neural networks for streamflow prediction. J. Hydraul. Res. 2002, 40, 547–554. [Google Scholar] [CrossRef]
- Pol, A.P.; Moreno, J.J.M.; Far, A.C. Predicción del consumo de éxtasis a partir de redes neuronales artificiales. Adicciones 2000, 12, 29. [Google Scholar] [CrossRef]
- Cabello, J.T.; March, J.; Sorribas, A. Aproximación metodológica al uso de redes neuronales artificiales para la predicción de resultados en medicina. Med. Clínica 2004, 122, 59–67. [Google Scholar] [CrossRef]
- Zhang, G.; Patuwo, B.E.; Hu, M.Y. Forecasting with artificial neural networks. Int. J. Forecast. 1998, 14, 35–62. [Google Scholar] [CrossRef]
- Jahn, M. Artificial neural network regression models in a panel setting: Predicting economic growth. Econ. Model. 2020, 91, 148–154. [Google Scholar] [CrossRef]
- Mills, D.E. Why retailers sell private labels. J. Econ. Manag. Strat. 1995, 4, 509–528. [Google Scholar] [CrossRef]
- Gil-Cordero, E.; Rondan-Cataluña, F.J.; Rey-Moreno, M. Premium private label strategies: Social networks and traditional perspectives. J. Innov. Knowl. 2020. [Google Scholar] [CrossRef]
- Lybeck, A.; Holmlund-Rytkönen, M.; Sääksjärvi, M. Store brands vs. manufacturer brands: Consumer perceptions and buying of chocolate bars in Finland. Int. Rev. Retail. Distrib. Consum. Res. 2006, 16, 471–492. [Google Scholar] [CrossRef]
- Halstead, D.; Ward, C.B. Assessing the vulnerability of private label brands. J. Prod. Brand Manag. 1995, 4, 38–48. [Google Scholar] [CrossRef]
- Martinelli, E.; Vergura, D.T. Satisfying customers through premium private labels. In Handbook of Research on Management of Cultural Products; IGI Global: Hershey, PA, USA, 2020; pp. 33–56. [Google Scholar]
- PLMA. Private Label Today. Available online: https://www.plmainternational.com/es/industry-news/private-label-today (accessed on 3 July 2020).
- Gil Cordero, E.; Rondan-Cataluña, F.J.; Rey-Moreno, M. Influence of macroeconomic indices on european private labels. J. Bus. Econ. Manag. 2016, 17, 1237–1251. [Google Scholar] [CrossRef] [Green Version]
- De Motes, J.M. Del caos al cosmos: Una nueva serie enlazada del producto interior bruto de españa entre 1850 y 2000. Rev. Econ. Appl. 2009, 17, 5–45. [Google Scholar]
- Lahiri, K.; Sheng, X. Learning and heterogeneity in GDP and inflation forecasts. Int. J. Forecast. 2010, 26, 265–292. [Google Scholar] [CrossRef] [Green Version]
- Dubé, J.-P.; Hitsch, G.J.; Rossi, P.E. Income and wealth effects on private-label demand: Evidence from the great recession. Mark. Sci. 2018, 37, 22–53. [Google Scholar] [CrossRef] [Green Version]
- Lamey, L.; Deleersnyder, B.; Dekimpe, M.G.; Steenkamp, J.-B.E.M. How business cycles contribute to private-label success: Evidence from the United States and Europe. J. Mark. 2007, 71, 1–15. [Google Scholar] [CrossRef]
- Lamey, L.; Deleersnyder, B.; Steenkamp, J.-B.E.; Dekimpe, M.G. The effect of business-cycle fluctuations on private-label share: What has marketing conduct got to do with it? J. Mark. 2012, 76, 1–19. [Google Scholar] [CrossRef]
- Sanhueza, C. Desempleo. Obs. Econ. 2009, 4–6. [Google Scholar] [CrossRef] [Green Version]
- del Pozo Iribarría, J.A.; Ruiz, M.Á.; Pardo, A.; San Martín, R. Efectos de La duración del desempleo entre los desempleados. Psicothema 2002, 14, 440–443. [Google Scholar]
- Debelle, G.; Vickery, J. The macroeconomics of australian unemployment. Unempl. Aust. Labour Mark. 1998, 1998, 2355265. [Google Scholar]
- Nymoen, R.; Lindbeck, A. Unemployment and Macroeconomics. Scand. J. Econ. 1994, 96, 135. [Google Scholar] [CrossRef]
- de Motes, J.M. La Inflación En España: Un Índice de Precios de Consumo, 1830–2012; Banco de España, Eurosistema: Madrid, Spain, 2013. [Google Scholar]
- Lunnemann, P.; Mathä, T.Y. Consumer Price Behaviour in Luxembourg: Evidence from Micro Cpi Data; BCE: Frankfurt, Germany, 2005. [Google Scholar]
- Gabrielsen, T.S.; Steen, F.; Sørgard, L. Private Label Entry as a Competitive Force: An Analysis of Price Responses in the Norwegian Food Sector. 2001. Available online: https://openaccess.nhh.no/nhh-xmlui/bitstream/handle/11250/165856/A51_01.pdf?sequence=1&isAllowed=y (accessed on 26 August 2020).
- Vargas-Hernandez, J.; Noruzi Reza, M. A Study on different perspectives on private labels. Int. J. Humanit. Soc. Sci. 2011, 1, 95–97. [Google Scholar]
- Economipedia. Salario Medio; Economipedia: Madrid, Spain, 2020. [Google Scholar]
- Bennàssar, M.L. Sistemas de remuneración y política salarial. In el Salario Concepto, Estructura Y Cuantía; La Ley: Madrid, Spain, 2007; pp. 330–508. [Google Scholar]
- Diaz-Serrano, L.; Cabral Vieira, J.A. Low Pay, Higher Pay and Job Satisfaction within the European Union. Empir. Evid. Fourteen Ctries. 2005. Available online: https://www.researchgate.net/publication/5166648_Low_Pay_Higher_Pay_and_Job_Satisfaction_within_the_European_Union_Empirical_Evidence_from_Fourteen_Countries (accessed on 26 August 2020).
- Morkunas, M.; Volkov, A.; Galnaitytė, A. Government or invisible hand? Who is in charge of retail food prices? Evidence from the Baltics. J. Int. Stud. 2019, 12, 147–157. [Google Scholar] [CrossRef]
- Heikal, M.; Khaddafi, M.; Ummah, A. Influence analysis of return on assets (ROA), return on equity (ROE), net profit margin (NPM), debt to equity ratio (DER), and current ratio (CR), against corporate profit growth in automotive in indonesia stock exchange. Int. J. Acad. Res. Bus. Soc. Sci. 2014, 4. [Google Scholar] [CrossRef]
- Dita, A.H.; Murtaqi, I. The effect of net profit margin, price to book value and debt to equity ratio to stock return in the indonesian consumer goods industry. J. Bus. Manag. 2014, 3, 305–315. [Google Scholar]
- Forge, I. Organización de la Información y de los Datos Estadísticos en el Campo Del Medio Ambiente: Propuestas Metodológicas; United Nations: Geneva, Switzerland, 1994. [Google Scholar]
- Hennypuspitasari. Warnita. In IBM SPSS Neural Networks 20; Center for Open Science: Charlottesville, VA, USA, 2019. [Google Scholar]
- Hassan, H.; Abdelazim, N.; Mohamed, Z.; Oliver, S. Assessment of artificial neural network for bathymetry estimation using high resolution satellite imagery in shallow lakes: Case study el burullus lake. Int. Water Technol. J. 2015, 5, 248–259. [Google Scholar]
- Chong, A.Y.-L. Predicting m-commerce adoption determinants: A neural network approach. Expert Syst. Appl. 2013, 40, 523–530. [Google Scholar] [CrossRef]
- Liébana-Cabanillas, F.; Marinković, V.; Kalinić, Z. A SEM-neural network approach for predicting antecedents of m-commerce acceptance. Int. J. Inf. Manag. 2017, 37, 14–24. [Google Scholar] [CrossRef]
- Sahoo, S.; Jha, M.K. Groundwater-level prediction using multiple linear regression and artificial neural network techniques: a comparative assessment. Hydrogeol. J. 2013, 21, 1865–1887. [Google Scholar] [CrossRef]
- Tosun, E.; Aydin, K.; Bilgili, M. Comparison of linear regression and artificial neural network model of a diesel engine fueled with biodiesel-alcohol mixtures. Alex. Eng. J. 2016, 55, 3081–3089. [Google Scholar] [CrossRef] [Green Version]
- Abyaneh, H.Z. Evaluation of multivariate linear regression and artificial neural networks in prediction of water quality parameters. J. Environ. Health Sci. Eng. 2014, 12, 40. [Google Scholar] [CrossRef] [Green Version]
- Latt, Z.Z.; Wittenberg, H. Improving flood forecasting in a developing country: A comparative study of stepwise multiple linear regression and artificial neural network. Water Resour. Manag. 2014, 28, 2109–2128. [Google Scholar] [CrossRef]
- Euromonitor. The New Face of Private Label. Available online: https://go.euromonitor.com/new-face-of-private-label-global-market-trends-2018-strategy-briefing.html (accessed on 7 July 2020).
Figure 1.
The multilayer perceptron network (MLP) function.

Figure 2.
Artificial Neural Network Volume.

Figure 3.
Standardized Importance of independent variables for Volume.

Figure 4.
Regression Volume.

Figure 5.
Artificial Neural Network Value.

Figure 6.
Standardized Importance of independent variables for Value.

Figure 7.
Regression Value.


Table 1.
Case allocation summary for Volume.
| Percentage | ||
|---|---|---|
| Sample | Training | 73.2% |
| Test | 26.8% | |
| Valid | 100.0% | |
Table 2.
Description of the network Volume. CPI: Consumer Price Index.
| Covariates | 1 | GDP |
| 2 | AverageSalary | |
| 3 | PerCapitaDebt | |
| 4 | Unemployment | |
| 5 | CPI | |
| Number of Units 1 | 5 | |
| Change of Scale Method for Covariates | Standardized | |
| Number of Hidden Layers | 1 | |
| Number of Units in the Hidden Layer 1 2 | 3 | |
| Activation Function | Tanh | |
| Dependent Variables | 1 | VolumenMD |
| Number of Units 1 | 1 | |
| Change of Scale Method for Scale Dependents | Standardized | |
| Activation Function | Identity | |
| Error Function 3 | Sum of squares | |
1 The number of units in the input layer is the number of covariates plus the total number of factor levels; 2 Not including the unit of bias; 3 A sum of squares error is reported since the dependent variables are of the type scale.
Table 3.
Adjustment of the neural network Volume.
| Summary of the Model | ||
|---|---|---|
| Training | Sum of Squares Error 1 | 29.172 |
| Relative Error 2 | 0.408 | |
| Stop Rule Used | 1 consecutive step(s) without decreasing the error 3 | |
| Training Time | 0:00:00.04 | |
| Test | Sum of Squares Error 1 | 9.377 |
| Relative Error 2 | 0.451 | |
| Dependent variable: Volume | ||
1 A sum of squares error is shown, since the output layer has scale dependent variables. This is the error function that the network tries to minimize during training; 2 The relative error of each scale dependent variable is the quotient between the sum of the quadratic errors of the dependent variable and the sum of the quadratic errors of the "null" model, in which the mean value of the dependent variable is used as the predicted value for all cases; 3 Not including the unit of bias.
Table 4.
Case allocation summary for Value.
| Percentage | ||
|---|---|---|
| Sample | Training | 70.2% |
| Test | 29.8% | |
| Valid | 100.0% | |
Table 5.
Description of the network Value.
| Input Layer | Covariates | 1 | GDP |
| 2 | AverageSalary | ||
| 3 | PerCapitaDebt | ||
| 4 | Unemployment | ||
| 5 | CPI | ||
| Number of Units 1 | 5 | ||
| Change of Scale Method for Covariates | Standardized | ||
| Hidden Layer | Number of Hidden Layers | 1 | |
| Number of Units in the Hidden Layer 1 2 | 3 | ||
| Activation Function | Tanh | ||
| Output Layer | Dependent Variables | 1 | ValorMD |
| Number of Units 1 | 1 | ||
| Change of Scale Method for Scale Dependents | Standardized | ||
| Activation Function | Identity | ||
| Error Function 3 | Sum of squares | ||
1 The number of units in the input layer is the number of covariates plus the total number of factor levels; 2 Not including the unit of bias; 3 A sum of squares error is reported since the dependent variables are of the type scale.
Table 6.
Adjustment of the neural network Value.
| Summary of the Model | ||
|---|---|---|
| Training | Sum of Squares Error 1 | 25.476 |
| Relative Error 2 | 0.367 | |
| Stop Rule Used | 1 consecutive step without decreasing the error 3 | |
| Training Time | 0:00:00.03 | |
| Test | Sum of Squares Error 1 | 9.025 |
| Relative Error 2 | 0.341 | |
| Dependent variable: Value | ||
1 A sum of squares error is shown, since the output layer has scale dependent variables. This is the error function that the network tries to minimize during training; 2 The relative error of each scale dependent variable is the quotient between the sum of the quadratic errors of the dependent variable and the sum of the quadratic errors of the "null" model, in which the mean value of the dependent variable is used as the predicted value for all cases; 3 Not including the unit of bias.
© 2020 by the authors. Licensee MDPI, Basel, Switzerland. This article is an open access article distributed under the terms and conditions of the Creative Commons Attribution (CC BY) license (http://creativecommons.org/licenses/by/4.0/).
Share and Cite
MDPI and ACS Style
Gil-Cordero, E.; Cabrera-Sánchez, J.-P. Private Label and Macroeconomic Indexes: An Artificial Neural Networks Application. Appl. Sci. 2020, 10, 6043. https://0-doi-org.brum.beds.ac.uk/10.3390/app10176043
AMA Style
Gil-Cordero E, Cabrera-Sánchez J-P. Private Label and Macroeconomic Indexes: An Artificial Neural Networks Application. Applied Sciences. 2020; 10(17):6043. https://0-doi-org.brum.beds.ac.uk/10.3390/app10176043
Chicago/Turabian StyleGil-Cordero, Eloy, and Juan-Pedro Cabrera-Sánchez. 2020. "Private Label and Macroeconomic Indexes: An Artificial Neural Networks Application" Applied Sciences 10, no. 17: 6043. https://0-doi-org.brum.beds.ac.uk/10.3390/app10176043
Note that from the first issue of 2016, this journal uses article numbers instead of page numbers. See further details here.