Retinal Image Analysis for Diabetes-Based Eye Disease Detection Using Deep Learning
by
 , and
, and
Tahira Nazir
1, 
Aun Irtaza
1,
Ali Javed
2 ,
,
Hafiz Malik
3,
Dildar Hussain
4,* and
and
Rizwan Ali Naqvi
5,* 1
Department of Computer Science, University of Engineering and Technology, Taxila 47050, Pakistan
2
Department of Software Engineering, University of Engineering and Technology, Taxila 47050, Pakistan
3
Department of Electrical and Computer Engineering, University of Michigan-Dearborn, MI 48128, USA
4
School of Computational Sciences, Korea Institute for Advanced Study (KIAS), 85 Hoegiro Dongdaemun-gu, Soeul 02455, Korea
5
Department of Unmanned Vehicle Engineering, Sejong University, 209, Neundong-ro, Gwangjin-gu, Seoul 05006, Korea
*
Authors to whom correspondence should be addressed.
Appl. Sci. 2020, 10(18), 6185; https://0-doi-org.brum.beds.ac.uk/10.3390/app10186185
Submission received: 10 August 2020
/
Revised: 1 September 2020
/
Accepted: 3 September 2020
/
Published: 5 September 2020
(This article belongs to the Special Issue Artificial Intelligence and Beyond in Medical and Healthcare Engineering)
Abstract
:Diabetic patients are at the risk of developing different eye diseases i.e., diabetic retinopathy (DR), diabetic macular edema (DME) and glaucoma. DR is an eye disease that harms the retina and DME is developed by the accumulation of fluid in the macula, while glaucoma damages the optic disk and causes vision loss in advanced stages. However, due to slow progression, the disease shows few signs in early stages, hence making disease detection a difficult task. Therefore, a fully automated system is required to support the detection and screening process at early stages. In this paper, an automated disease localization and segmentation approach based on Fast Region-based Convolutional Neural Network (FRCNN) algorithm with fuzzy k-means (FKM) clustering is presented. The FRCNN is an object detection approach that requires the bounding-box annotations to work; however, datasets do not provide them, therefore, we have generated these annotations through ground-truths. Afterward, FRCNN is trained over the annotated images for localization that are then segmented-out through FKM clustering. The segmented regions are then compared against the ground-truths through intersection-over-union operations. For performance evaluation, we used the Diaretdb1, MESSIDOR, ORIGA, DR-HAGIS, and HRF datasets. A rigorous comparison against the latest methods confirms the efficacy of the approach in terms of both disease detection and segmentation.
1. Introduction
Diabetes is a disease in which blood sugar levels are too high. Victims are at the risk of developing different eye diseases i.e., diabetic retinopathy (DR) [1], diabetic macular edema (DME) [2], and glaucoma [3] that may result in a form of complete vision loss. DR is a disease that damages the retina, and blurred vision, floaters, and sudden vision loss are the main DR symptoms. Hemorrhages, microaneurysms, hard and soft exudates are the abnormality signs [4] of DR.
- Hard exudates are bright yellow-colored spots with a waxy appearance on the retina, which are formed because of the leakage of blood from vessels.
- Soft exudates are white lesions on the retina that occur due to occlusion of the arteriole.
- Hemorrhages develop due to blood leakage from damaged vessels and appear as dark red spots.
- Microaneurysms developed due to distortions in the boundary of blood vessels and appear as small red dots on the retina.
DME is another eye disease that occurs when a patient already suffers from DR and is a cause of vision loss. Additional medical conditions resulting from poor blood sugar control increase the risk of blindness for people with DME that can occur at any phase of DR, although it is more likely to occur later as the disease progresses. DME leads to an accumulation of fluid in the macula region resulting in swelling of the macula, which is the central part of the retina that is dedicated to central vision. Loss of central vision occurs due to any damage in the macula region. Blurry vision, double vision, floaters and blindness are the common symptoms of DME if untreated [5].
Glaucoma is an eye disease that damages the optic disk (OD) and optic cup (OC) and causes vision loss in advanced stages, calculated to affect approximately 80 million people around the world [6,7]. Some basic structural glaucoma signs are disc size, cup to disc ratio (CDR), the ratio of neuroretina rim in the inferior, superior, nasal and temporal quadrants, and peripapillary atrophy etc. are typically focused on the OD. OD is the morphological structure seen in the cross-sectional view of the optic nerve linking to the retina, and OC is the central part of OD. Glaucoma damages the optic nerve due to the imbalance in intraocular pressure (IOP) inside the eye. The affected nerve fibers deteriorates the retinal layer and increases the CDR and OD [8]. IOP causes injury to the nerve fibers comprising the optic nerve, and the OD initiates formation of a crater like-hole in front of the optic nerve head. Glaucoma causes the boundary of the disc to enlarge and its color changes from pink to pale.
Eye diseases are normally diagnosed by measuring IOP, obtaining a patient’s medical history, performing visual field loss tests accompanied by visual evaluation of disease through ophthalmoscopy to analyze the color, size, and shape of the optic nerve [8]. Therefore, segmentation of the affected region is not only beneficial for further intensive clinical evaluation by experts but also effective for preparing a computer-based automatic procedure for classification and is further robust to localization errors [9]. Initially, ophthalmologists diagnose eye diseases through visual checkup of DR lesions, OD, by determining the CDR, diameter, and ratio of disc area, and border irregularity. However, because of the limited number of available ophthalmologists, early disease diagnosis is usually delayed [10], when the timely diagnosis and cure of disease have the potential to avoid vision loss. To deal with these shortcomings, research is aiming for automated glaucoma detection through computer-aided diagnosis (CAD)-based solutions.
For automated detection of eye diseases, handcrafted features have been used to differentiate between affected and normal regions of the images [11,12,13,14,15,16,17,18,19,20,21,22,23,24,25]. However, these features cannot effectively represent the DR, DME and glaucoma regions because of color, size, higher intra-class variations, bright regions other than OD, thus resulting in unsatisfactory results of CAD solutions [26]. For performance optimization of CAD systems, glaucoma classification is performed through a correctly segmented glaucoma region called region of interest (ROI), which enhances the detection ability, as the affected region gives a good representation of the glaucoma characteristics. Therefore, the segmentation is the main phase before the classification for the performance improvement of CAD systems.
Various computer vision and deep learning-based approaches were employed for DR detection [14,15,27,28] and classification, DME detection [2,5,29,30,31] and identify glaucoma signs from the retinal images [32,33,34,35,36,37,38,39]. A literature review of important methods to detect DR, DME and glaucoma is summarized in Table 1.
In the presented work, we present a deep learning (DL) approach that detects the bounding box (bboxes) of disease regions. Finally, instead of segmenting the whole image, we segment the localized regions. Experimentation proved that this approach is efficient to both complexity and time consumption. The proposed method is based on FRCNN and FKM clustering.
Our proposed method deals with the inadequate sample problem using unsupervised pre-training and supervised fine-tuning regions for localization. FRCNN is a single-stage training technique that classifies region proposals and refines their localization. In the test phase, FRCNN produces some class-independent region proposals of images and gets a fixed-size feature descriptor form each proposal using a CNN; afterward, the softmax layer classifies the regions accurately. Finally, FKM clustering precisely extracts the regions from localized regions. The proposed method detects the abnormalities of DR, DME, and Glaucoma regions simultaneously using FRCNN.
The contributions of our work are given below:
- Early and automated detection of diabetes-based eye diseases regions using machine learning-based segmentation is a complex task. In the presented methodology, we used the FRCNN-based method for localization of disease regions. Our findings conclude that the combination of FRCNN with FKM clustering results in accurate localization of the affected areas, which ensure the precise recognition of the disease in an automated manner.
- To accomplish the human-level performance over the challenging dataset i.e., ORIGA and MESSIDOR, the retinal images are represented by the FRCNN deep features, that are then segmented through the FKM clustering.
- The proposed method can detect the signs of disease including early signs simultaneously and has no issue in learning to detect an image of a healthy eye.
- The available datasets do not have bbox ground truths, so first, we developed the bbox annotations from given ground truths of the dataset which are necessary for the training of FRCNN.
The rest of our paper is organized as follows: Section 2 briefly explains the proposed architecture i.e., localization and segmentation of localized regions. In Section 3, the experimental results and their discussion are presented to highlight the significance of findings. Section 4 presents the general discussion and the last section follows with the conclusions and future work suggestions.
2. Proposed Methodology
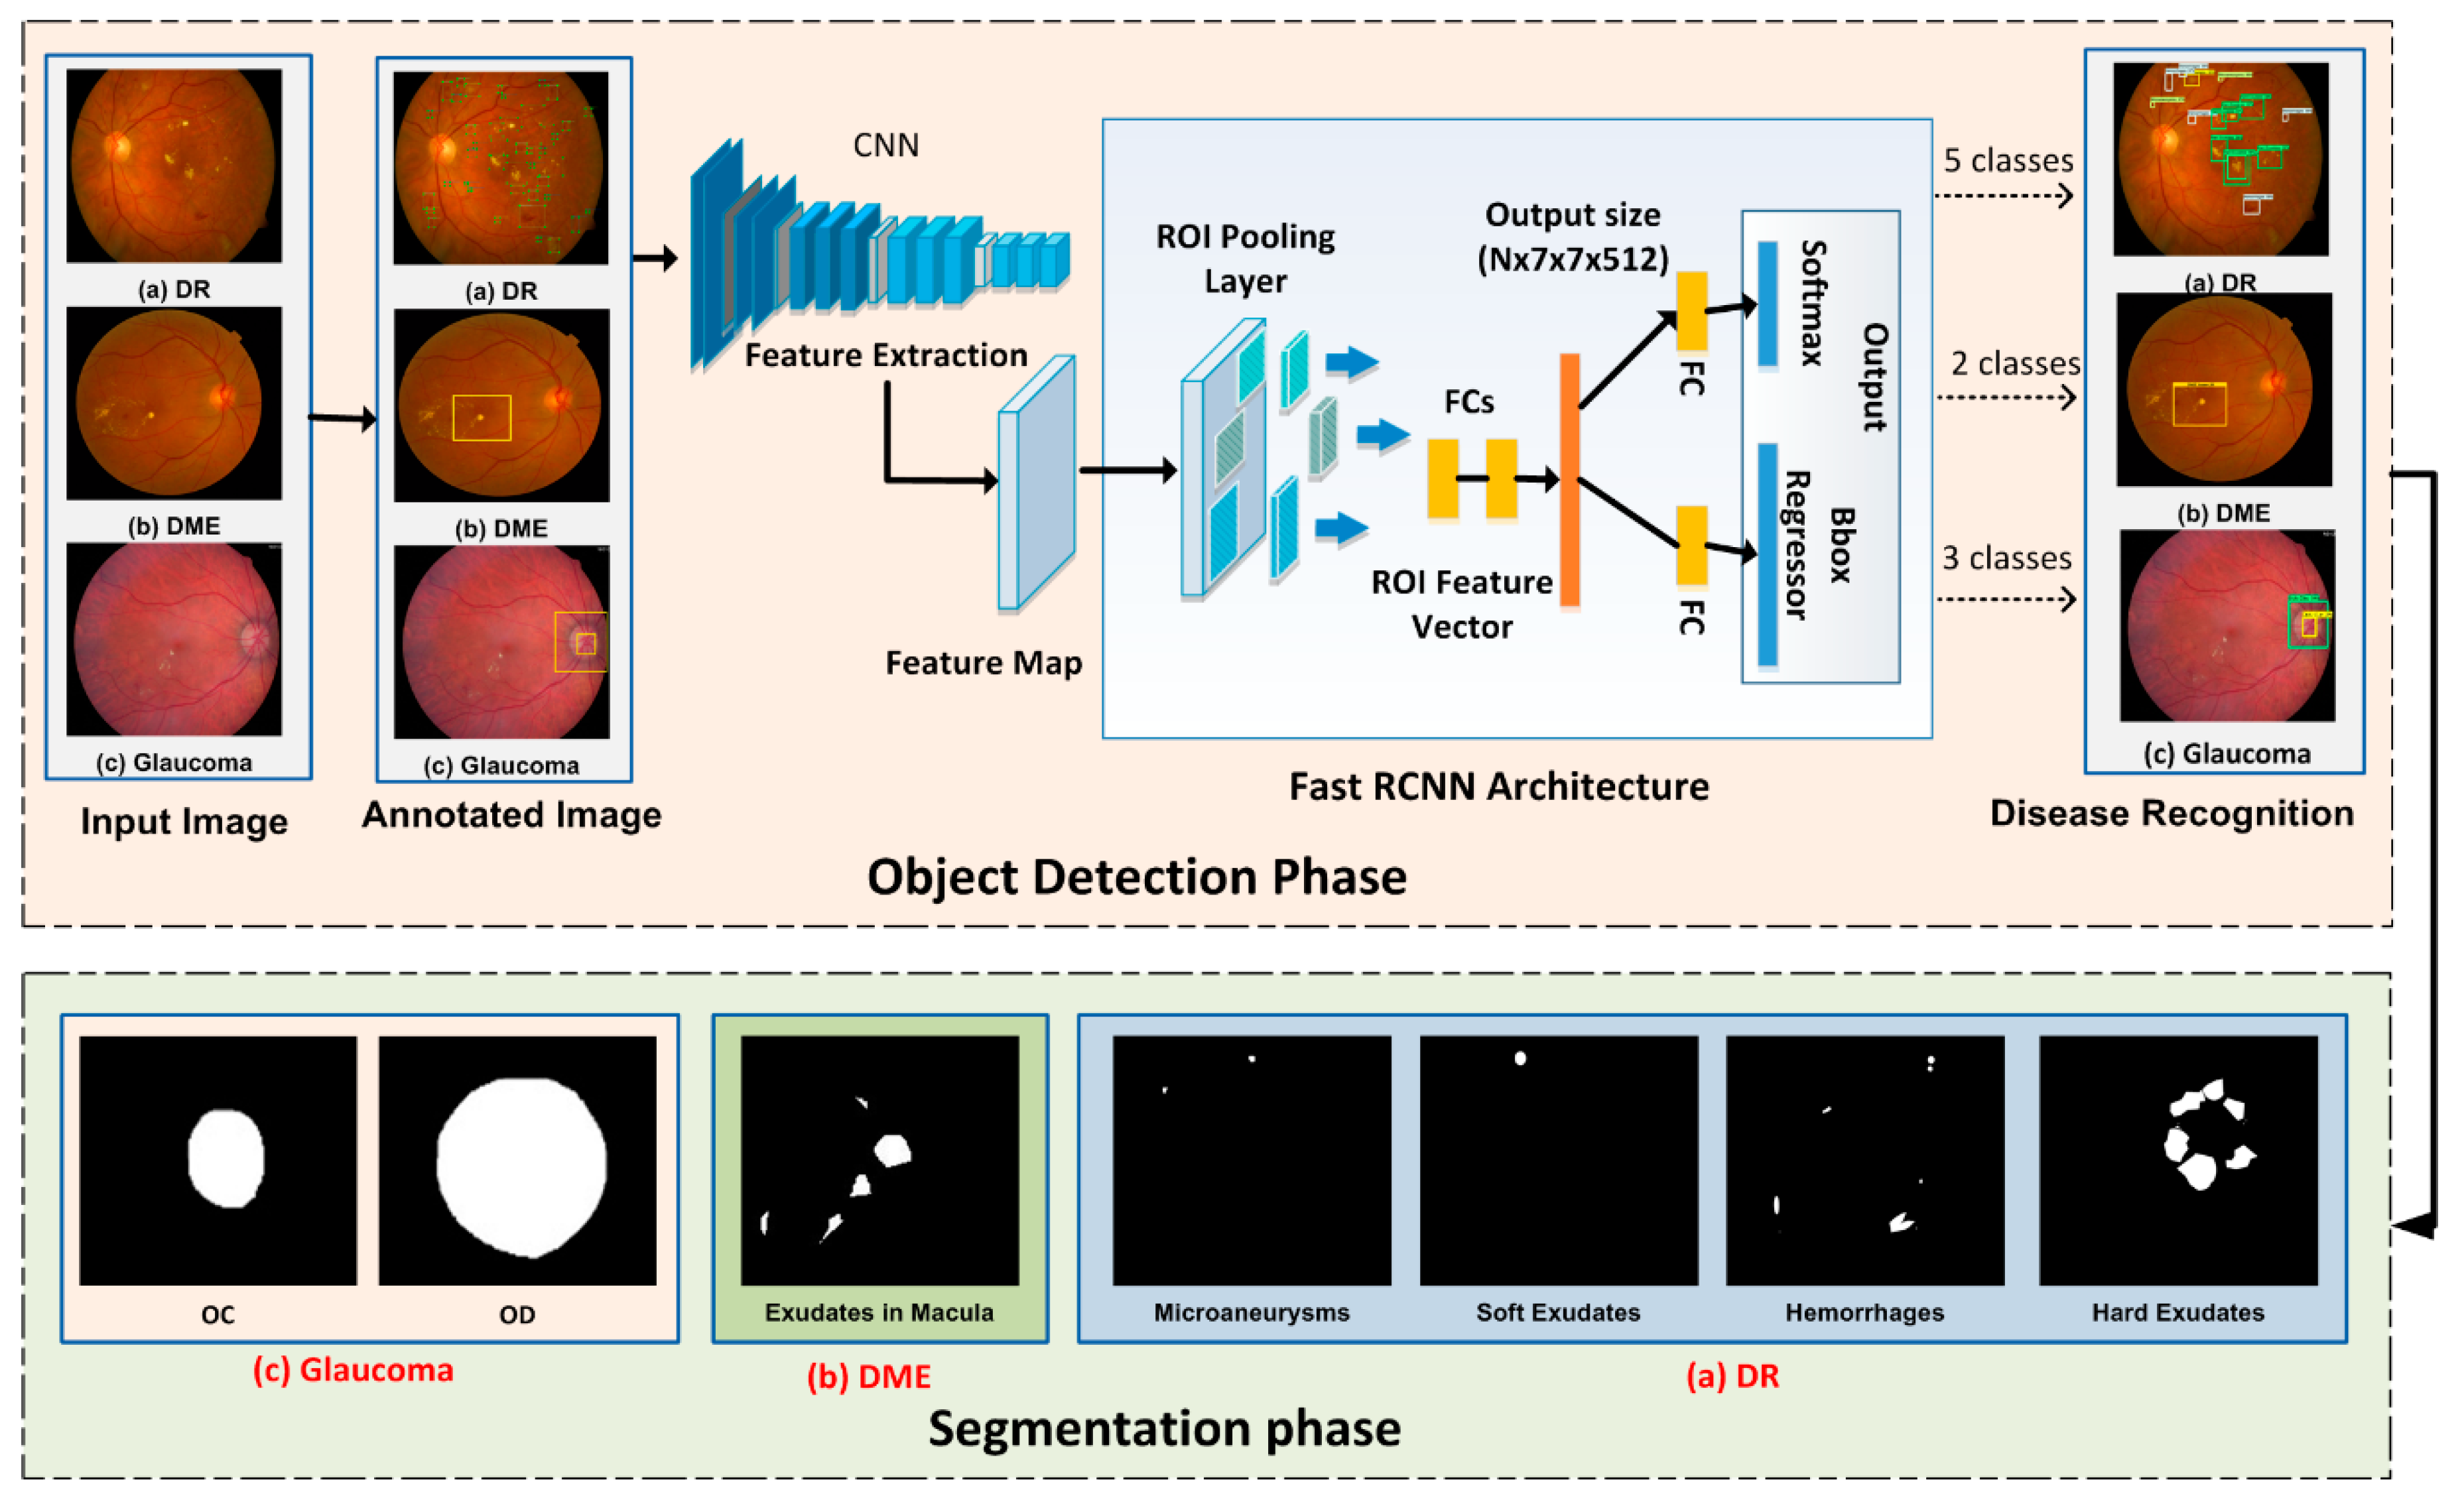
Diabetes-based eye diseases detection from fundus images is considered a two-way method. The first is the detection and localization of disease, and the second step is the segmentation of localized regions using the FKM clustering. In the localization step, we utilize the FRCNN method. We develop the annotations for three diseases and passes to the FRCNN training which extracts the features from images and passes to the RoI pooling layer as an input of the group and bbox regression fully connected layer. The model is evaluated by using the test images to localize the affected portions with a score of regression confidence. At the last, FKM clustering is applied for the segmentation, which is considered as a robust method, especially for image segmentation. Figure 1 shows the framework of the proposed method.
2.1. Ground Truth Generation
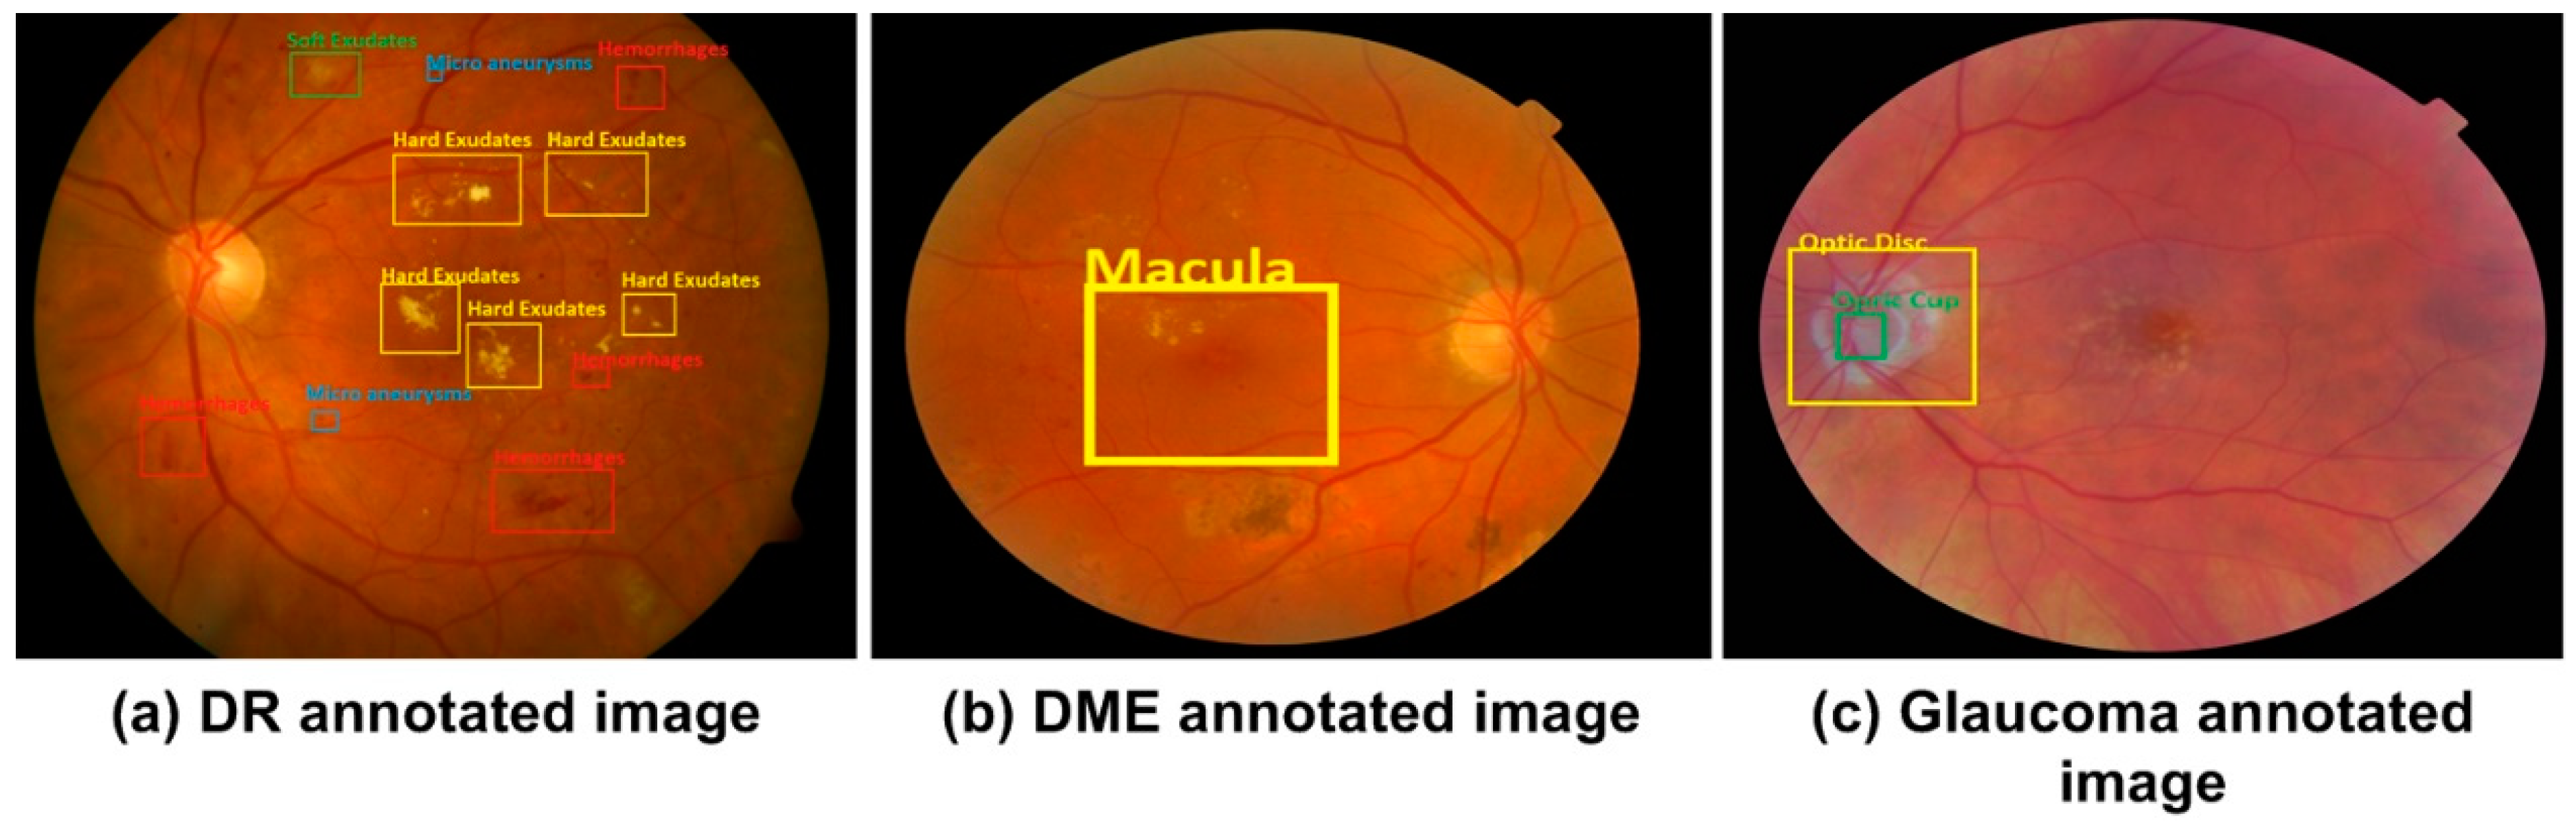
The ground-truth bbox against each image is required to identify the affected region for the training process. The LabelImg [42] tool is used to annotate the retinal images and manually create a bboxes for each image. Figure 2 shows an example of an original image and the corresponding ground truth image. The annotations are saved in .xml files which includes the class of object and their bbox values i.e., xmin, ymin, xmax, ymax, width and height. Xml file is created against each image and these files are used to create the csv file, train.record file is created from csv file which is later used in the training process.
We have generated the annotations of three diseases according to their signs, as shown in Table 2. The DR affected image has the five classes i.e., microaneurysms, soft exudates, hard exudate, hemorrhages, and background, DME has the two classes i.e., DME and background. The third disease glaucoma has the three classes i.e., OD, OC, and background class.
2.2. Localization Phase
The nature of the tasks is same i.e., to localize objects, therefore, the procedure applied remain consistent. Only difference comes in form of the number of classes that varies for all the three diseases.
2.2.1. Localization of DR Regions
The FRCNN takes the images and the region proposals as an input. Our method uses max-pooling and convolutional (Conv) layers to processes the whole image and produces the feature map of Conv. From the Conv feature map, fixed-size feature vectors are extracted using the ROI pooling layer. And then supplied into a series of fully connected (fc) layers before branching into separate output layers, the first layer computes Softmax-probability estimates over k = 5 region classes and the other layer produces four real-valued numbers for five region classes which represent a position of the bbox for one of the five classes [43]. We have trained the model for multi-class DR object detection using FRCNN, which can accurately localize the multiclass objects from an image. For DR localization, there are 4 + 1 classes in total i.e., hemorrhages, microaneurysms, soft-, and hard- exudates, plus one background class.
The RoI pooling layer resizes the features into a fixed-size of hyper-parameters h × w (i.e., 7 × 7) by using the max-pooling process. In our proposed method, the RoI consists of a four-sided (d,e,f,g)) quadrilateral window, where (f,g) represent the height and width and (d,e) represent the top left corner. The max-pooling layer divides f × g, the window of the RoI, into F × G, a sub-division grid of size f/F × G/G, and then max-pooling applied independently in the sub-division values into corresponding output cell. The RoI pooling layer is an extraordinary instance of spatial pyramid layer utilized in SPPnets [44], in which there is just one pyramid pooling level. We utilized the calculation of pooling sub-window given in [44].
2.2.2. Localization of DME Region
FRCNN can be train to localize the binary class objects, we have used FRCNN for the localization of macula region from retinal image. In this case, we have two region classes i.e., background and macula region which are represented by 0 or 1. The region inside the bbox represents the macula and other portion of the image is considered as background.
Th max-pooling and Conv layers are used to processes the whole image and produces the feature map. From Conv feature map, fixed-size feature vectors are extracted using the ROI pooling layer. And then supplied into a series of fc layers before branching into separate output layers, the first layer computes softmax-probability estimates over k = 2 region classes and the other layer produces four real-valued numbers for two region classes of DME which represent a position of the bbox for one of the DME classes.
2.2.3. Localization of Glaucoma Regions
For recognition of the third eye disease i.e., glaucoma, we have trained our method for three classes i.e., OD, OC, and background. FRCNN localized the OD and OC regions, and rest of the portion of retinal image is considered as background. The max-pooling and Conv layers produces the feature map, fixed-size feature vectors are extracted using the ROI pooling layer from the Conv feature map. And then supplied into a series of fc layers before branching into separate output layers, the first layer computes Softmax-probability estimates over k = 3 region classes and the other layer produces four real-valued numbers for three region classes which represent a position of the box for one of the glaucoma classes.
Feature Extraction
Object localization approaches employ a sliding window to identify the region of interest, i.e., vehicles, buildings, etc. However, advances of DL methods like CNN have replaced the earlier detection approaches with good performance. However, these techniques are economically expensive as they stick to the sliding window method for localizing the objects, so FRCNN proposes regions by a selective search approach to improve the performance and can train all network weights with backpropagation. FRCNN is initialized by the CNN network and experiences three conversions: (i) the RoI layer substitutes the max-pooling layer with h = w = 7 for VGG16. (ii) the and softmax layers are changed with two sibling output layers which are the and Softmax over the k + 1 category and bbox regressor. (iii) Our proposed method takes two inputs: the list of images I(x,y) and the list of ROIs from the input images [45].
FRCNN can train all weights with backpropagation, which does not appear in SPPnet [26] because the SPP layer becomes inefficient when RoI derives from different sample images. In FRCNN training, mini-batches are sampled by using the “stochastic gradient descent” (SGD), first N images, and then R/N ROIs are sampled through every retinal sample. Mini-batch computation decreases as N decreases. For example, If N = 2, R = 128, and R/N become 64, which means the training method is 64 times faster than sampling a single RoI from 128 diverse samples (i.e., RCNN and SPPnets) [44].
Multi-Task Loss
FRCNN is the end-to-end learning framework that uses multi-task loss function to learn the class of region and the related bbox position and size. Each ROI is labeled with class name u and bbox regression target v. let p be the output of Softmax sibling layer that is the probability distribution over k classes including background class, and t be the result of regressor sibling layer that is bbox tuple for each class k [46].
We used a multi-task loss L on each labeled ROI to jointly train for classification loss and bbox regression loss as shown in Equation (1):
The log loss for true class u is Lcls(p,u) = –logpu and Lloc(tu,v) denotes a smooth L1 loss (SL1) for regression output as in Equation (2):
where:
In Equation (1), λ denotes a hypermeter that determines the relative weight of the regression loss versus the classification loss to the overall loss. we used λ = 1 for all experiments. The [u > = 1] means that there is no Lloc defined for the background class. In Equation (3), x will be the distance between vectors. The RoI pooling layer uses backpropagation to transmit the derivatives as used in [47].
SGD Hypermeters
In the SGD hyperparameters process, fc layers of FRCNN use zero-mean Gaussian distributions along with standard deviations 0.01 and 0.001, respectively. In the initial step the values of biases are set to 0. Global learning rate (LR) for all layers is set to 0.001, and we execute SGD for iterating k mini-batches. The parameter decay of 0.0005 and the value of momentum is 9 that is used on weights and biases.
Testing through FRCNN
Once the FRCNN model is trained, the localization expands by little extra than performing a forward pass, and object proposals are computed. The framework inputs the image and a list of R objects proposals to score. We used the probabilities of Softmax cross-entropy [48] to detect the DR affected regions, macula region, and glaucoma regions i.e., OD and OC. Each region has i-ths class, score and bbox value. To have a precise localization, the obtained proposals are applied to consider the region having a higher level IoU overlap.
2.3. Segmentation of Regions through Fuzzy K-Means Clustering
The localized regions are cropped using calculated coordinates to determine the accurate affected region’s boundary. We have used the fuzzy k-means (FKM) technique separately for the segmentation of regions of three eye diseases. In the case of DR segmentation, the localized regions are segmented separately. The localized regions are set to foreground and the value of other portion is set to zero means black color. Similarly, the localized macular region is segmented through FKM clustering method. At last, we segmented the glaucoma localized regions i.e., OD and OC separately. The FKM method is described as follows: The method [49] divides the image into k regions where Ri, (l = 1, 2, 3, …, k) are related to the cluster centered Cr. There is a fuzzy relationship between regions and image data. The FKM method is based on minimizing distortion given by Equation (4):
Here k is the number of clusters while the f is fuzzifier parameter that pointedly manipulates the data points and resultant clusters. While for a given data point Xi and a cluster Cj, ∈ [0,1] represents the belongings among the centers of the cluster Cj and Xi, while gi,j represents the distance among Cj and Xi.
FKM clustering improves by mapping illustrative vectors and partitioning of data points [50]. It performs the following steps:
- (1)
- Specify the number of clusters
- (2)
- Set Cj(0) to the initial clusters.
- (3)
- Compute the membership of all datapoints for each using following equation:where m is the fuzzification coefficient.
- (4)
- Update cluster centers using following equation:
- (5)
- Repeat from step 3, till the FKM is converged (the centroids updated between two passes is not greater than ε, the defined sensitivity threshold).
Finally, we have clustered the regions into affected and non-affected portions.
3. Experimental Results
3.1. Datasets
We have employed five open source databases (i.e., Diaretdb1, MESSIDOR, HRF, DRHAGIS and ORIGA) that we utilized in our experiments for eye diseases detection, which do not have bbox ground truths, so we first developed the bbox annotations of the datasets which are necessary for the FRCNN training.
Diaretdb1 [51] is the dataset used for benchmarking of DR identification from retinal images. The Diaretdb1 database comprises 89 fundus samples of which 84 images contain the DR signs and the five remaining samples are considered as normal, that means they have no sign of DR. DR lesions are characterized by the following signs; hemorrhages, microaneurysms, hard and soft exudates. The images are of size 1500*1125 pixels and were taken with a fundus camera utilizing the same 50-degree field-of-view (FOV) with different image settings. The MESSIDOR database comprises 1200 images having two grades DR and DME. The images were captures with a 3CCD camera with a 45-degree FOV with a resolution of 2304 × 1536, 2240 × 1488, and 1440 × 960 pixels.
HRF stands for a high-resolution fundus database developed by the ophthalmology department, at Friendrich Alexander University Erlangen-Nuremberg (Erlangen, Germany) and the Brno University, Faculty of Electrical Engineering and Communication, Department of Biomedical Engineering, Brno (Czech Republic). The HRF database has a total of 45 images in which 15 images are of healthy patients, 15 images of patients with DR, and 15 images are from glaucomatous patients [52]. DRHAGIS stands for Diabetic Retinopathy Hypertension Age-related macular degeneration and Glaucoma images database, and was developed by Health Intelligence (Sandback, UK). The database consists of 40 images in which 10 images are affected with glaucoma [53]. ORIGA is the Online Retinal Fundus Image Database for Glaucoma analysis, with 650 data samples, containing 168 glaucomatous and 482 normal images. The images were collected from the Singapore Eye Research Institute [54] and were annotated by medical experts.
3.2. Evaluation Metrics
For analyzing the efficiency of our proposed technique, we have considered the following evaluation metrics:
FRCNN performed the localization of eye-diseases by using the greedy intersecting measure of the predicted box and ground truth called Intersection over Union (IoU). The correct prediction is true positive TP and the other is a false positive:
To calculate the average precision (AP) we iterate through test images as per precision. Equation (8) represents the mean average precision (mAP):
Here T is the number of test images, AP(ti) is the average precision for given test image category. This means that we calculate the AP for each category for given test image category, ti, and then the average of each category across all test images. Then all AP scores would then give us a single number which is mAP [55], it describes how good the trained model is for detecting bboxes with respect to bboxes of ground truth.
For segmentation, we have utilized the specificity (SP), sensitivity (SE), area under the curve (AUC), accuracy (Acc) and Dice coefficient (Dc) as the evaluation measures:
3.3. Results
This part demonstrates the proposed method results and the evaluation of the introduced technique with latest approaches.
3.3.1. Evaluation of FRCNN
To analyze the evaluation power of FRCNN, we evaluated it with other techniques like RCNN [56], and SPPnet [44], which use a similar pre-trained framework and bbox regression. SPPnet uses five scales in training and testing while FRCNN uses single scale testing and training. The RCNN technique achieves good performance by using a deep ConvNet, however, it has some limitations: i.e., training is expensive in time and space, ConvNet to SVMs to bbox regressors and the detection of objects is slow. We used FRCNN, that utilizes the ideas from SPP-net and RCNN and fixes the key issue in SPPnet by sharing computation of Conv layers among various proposals and exchanging the order of producing region proposals and running the CNN. FRCNN utilizes a backpropagation estimation, also added the bbox regression and classification head, and trained the model with a multi-task loss. FRCNN approach has a large improvement in mAP because of the fine-tuning process of Conv layers and reduces the disk storage due to no need for cache features. The proposed method achieves the precise localization of disease regions with mAP of 0.94 (in Table 3) in comparison with other approaches.
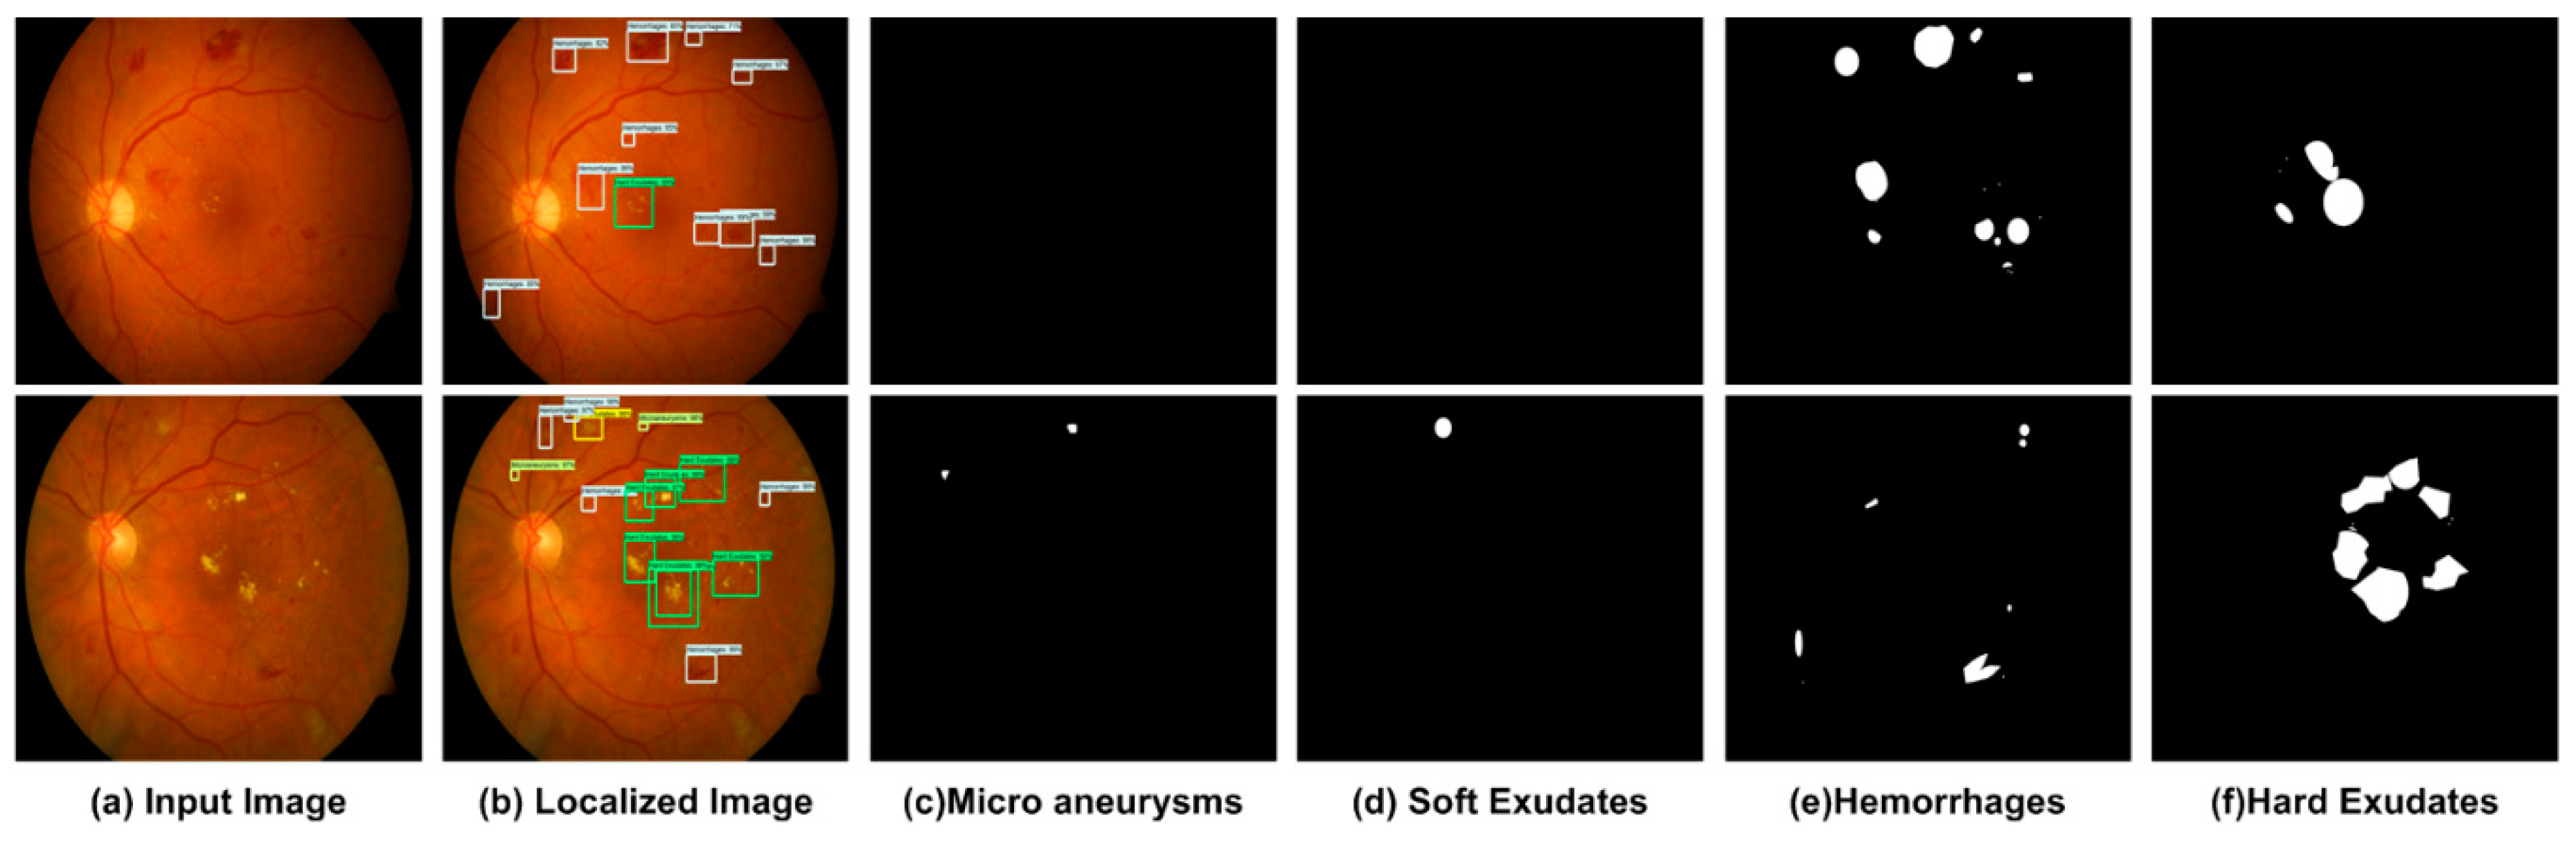
3.3.2. Localization of DR Regions
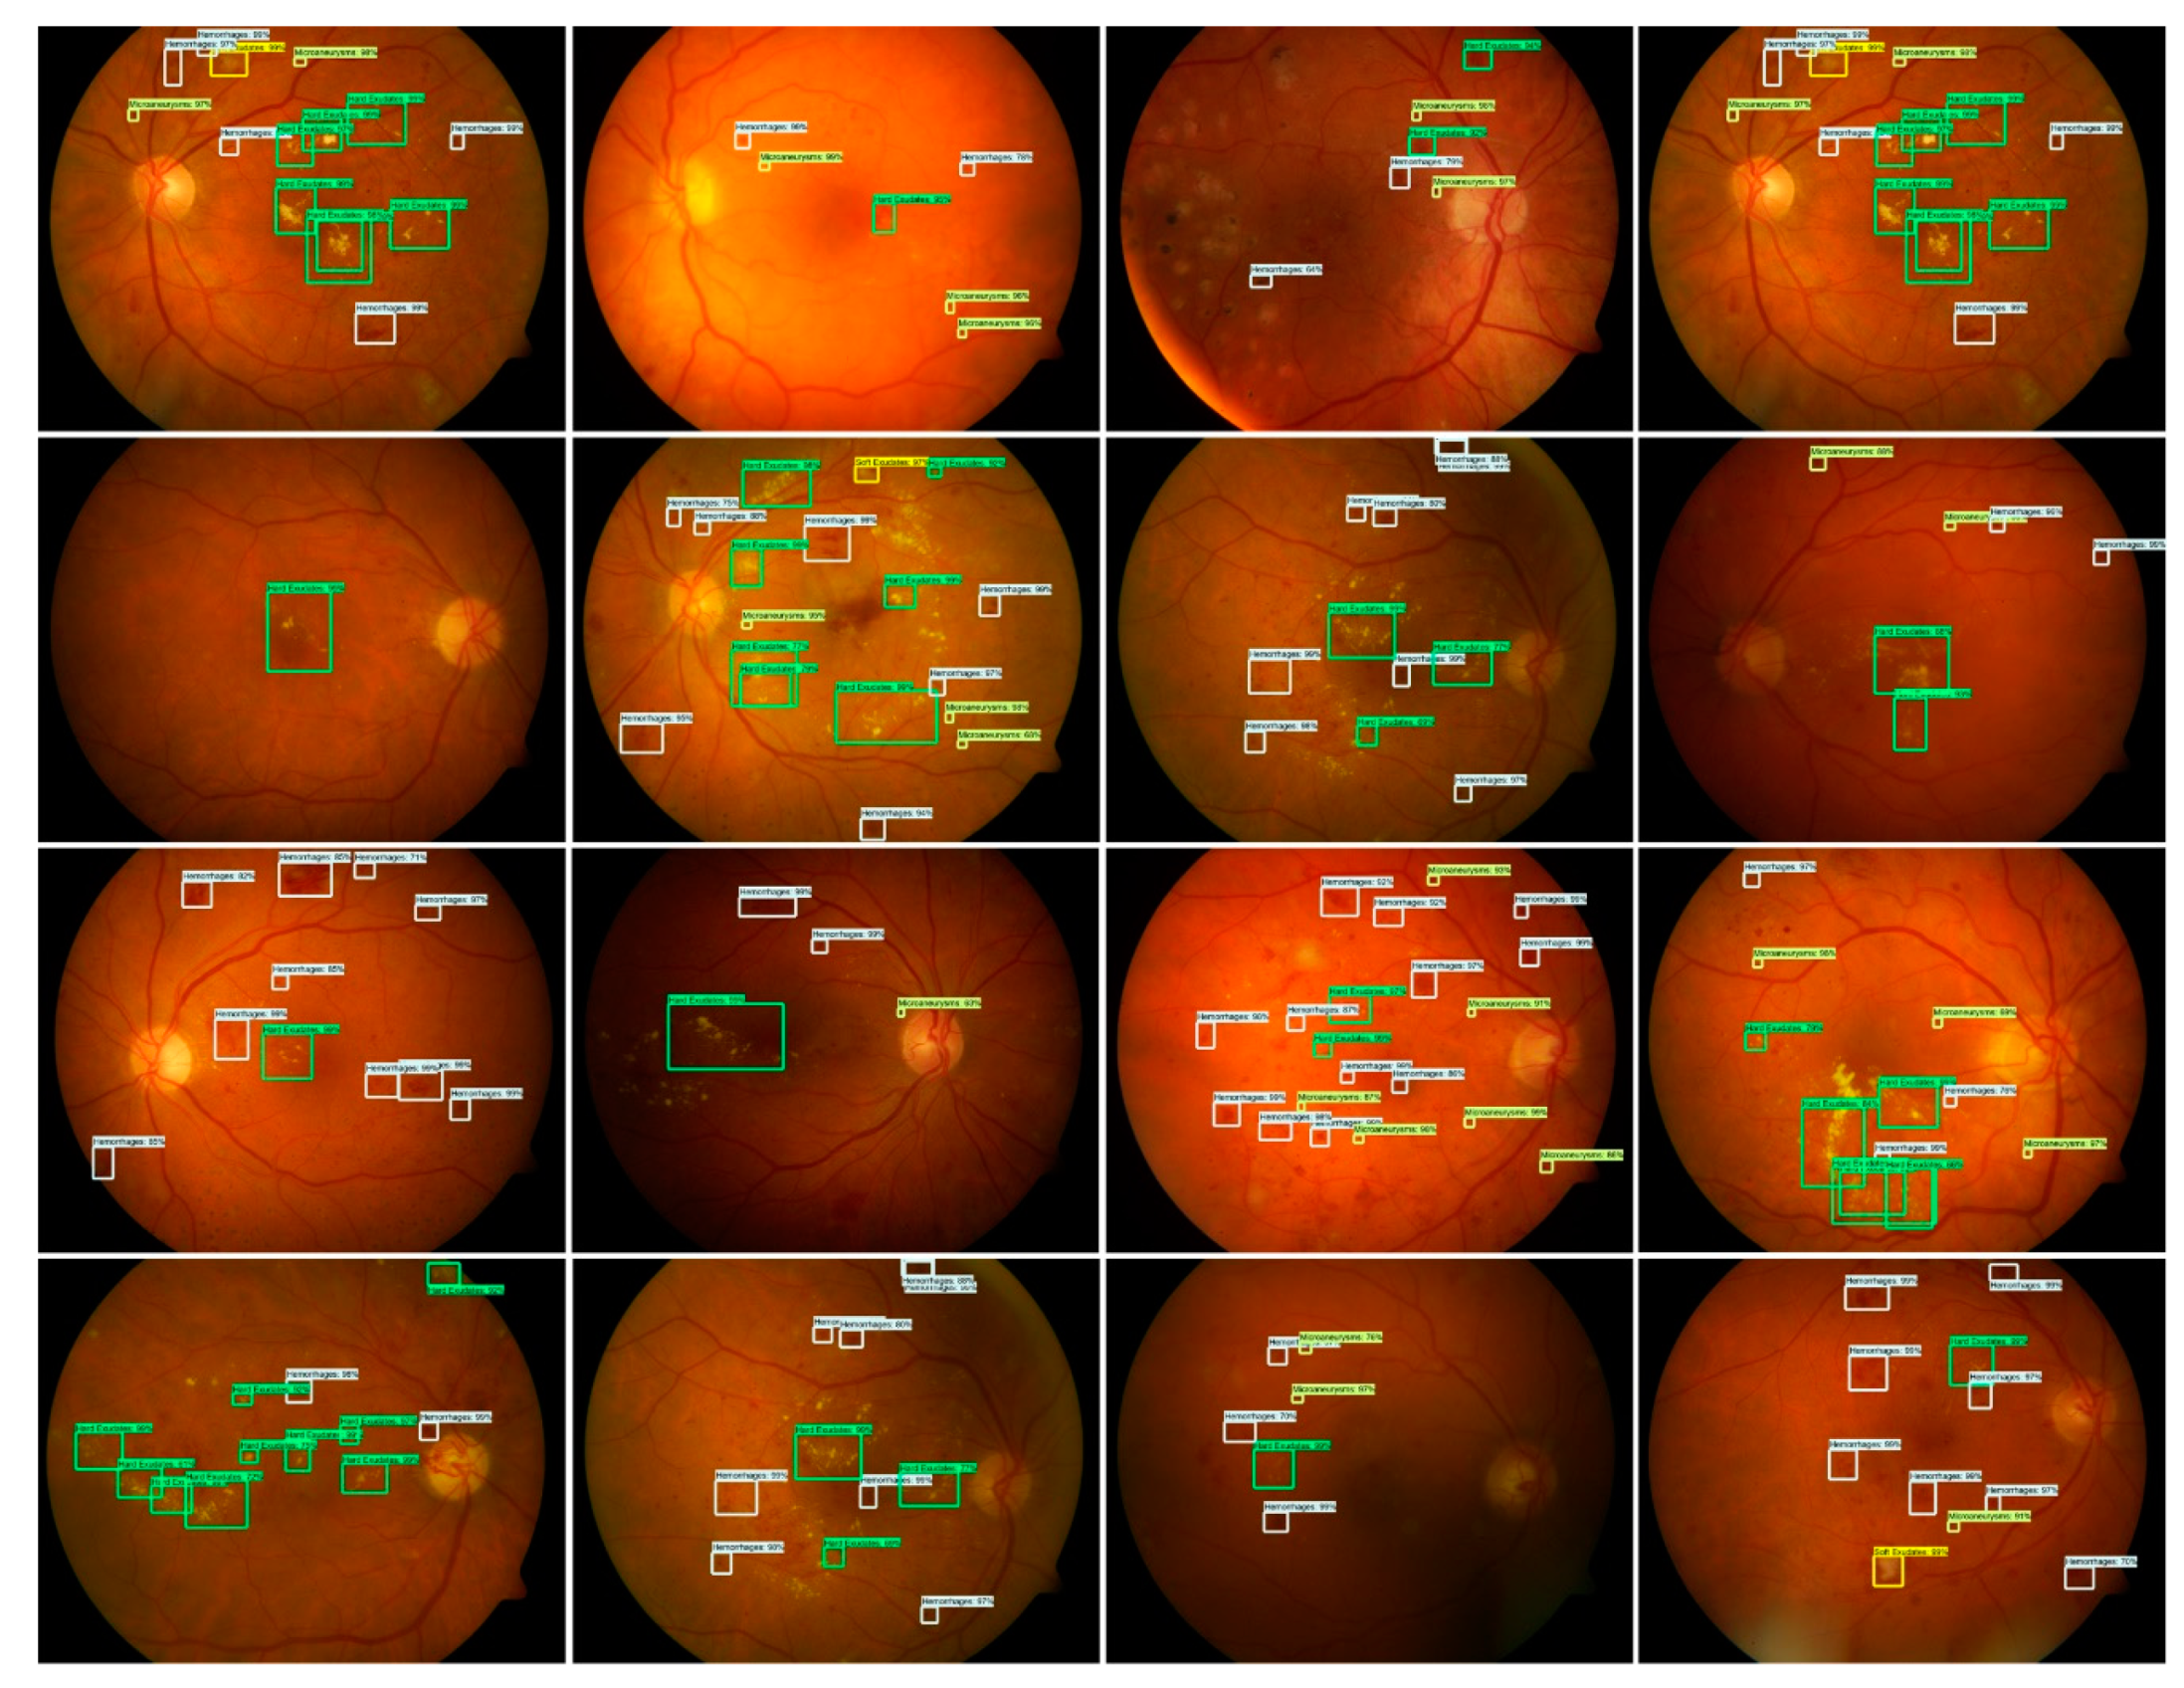
For localization of the DR signs (i.e., hemorrhages, microaneurysms, hard and soft exudates), the affected regions are considered a positive example while other portion and background are considered a negative example. The overlapped region is labeled through the threshold value IoU, less than 0.3, considered the region as background. Similarly, IoU value greater than 0.7 the regions are considered as affected regions.
We adopted the FRCNN method for DR lesions localization. The localization outcome of FRCNN as shown Figure 3 having 16 test retinal images with a confidence score. The test results show a higher score which is greater than 0.89 and up to 0.99.
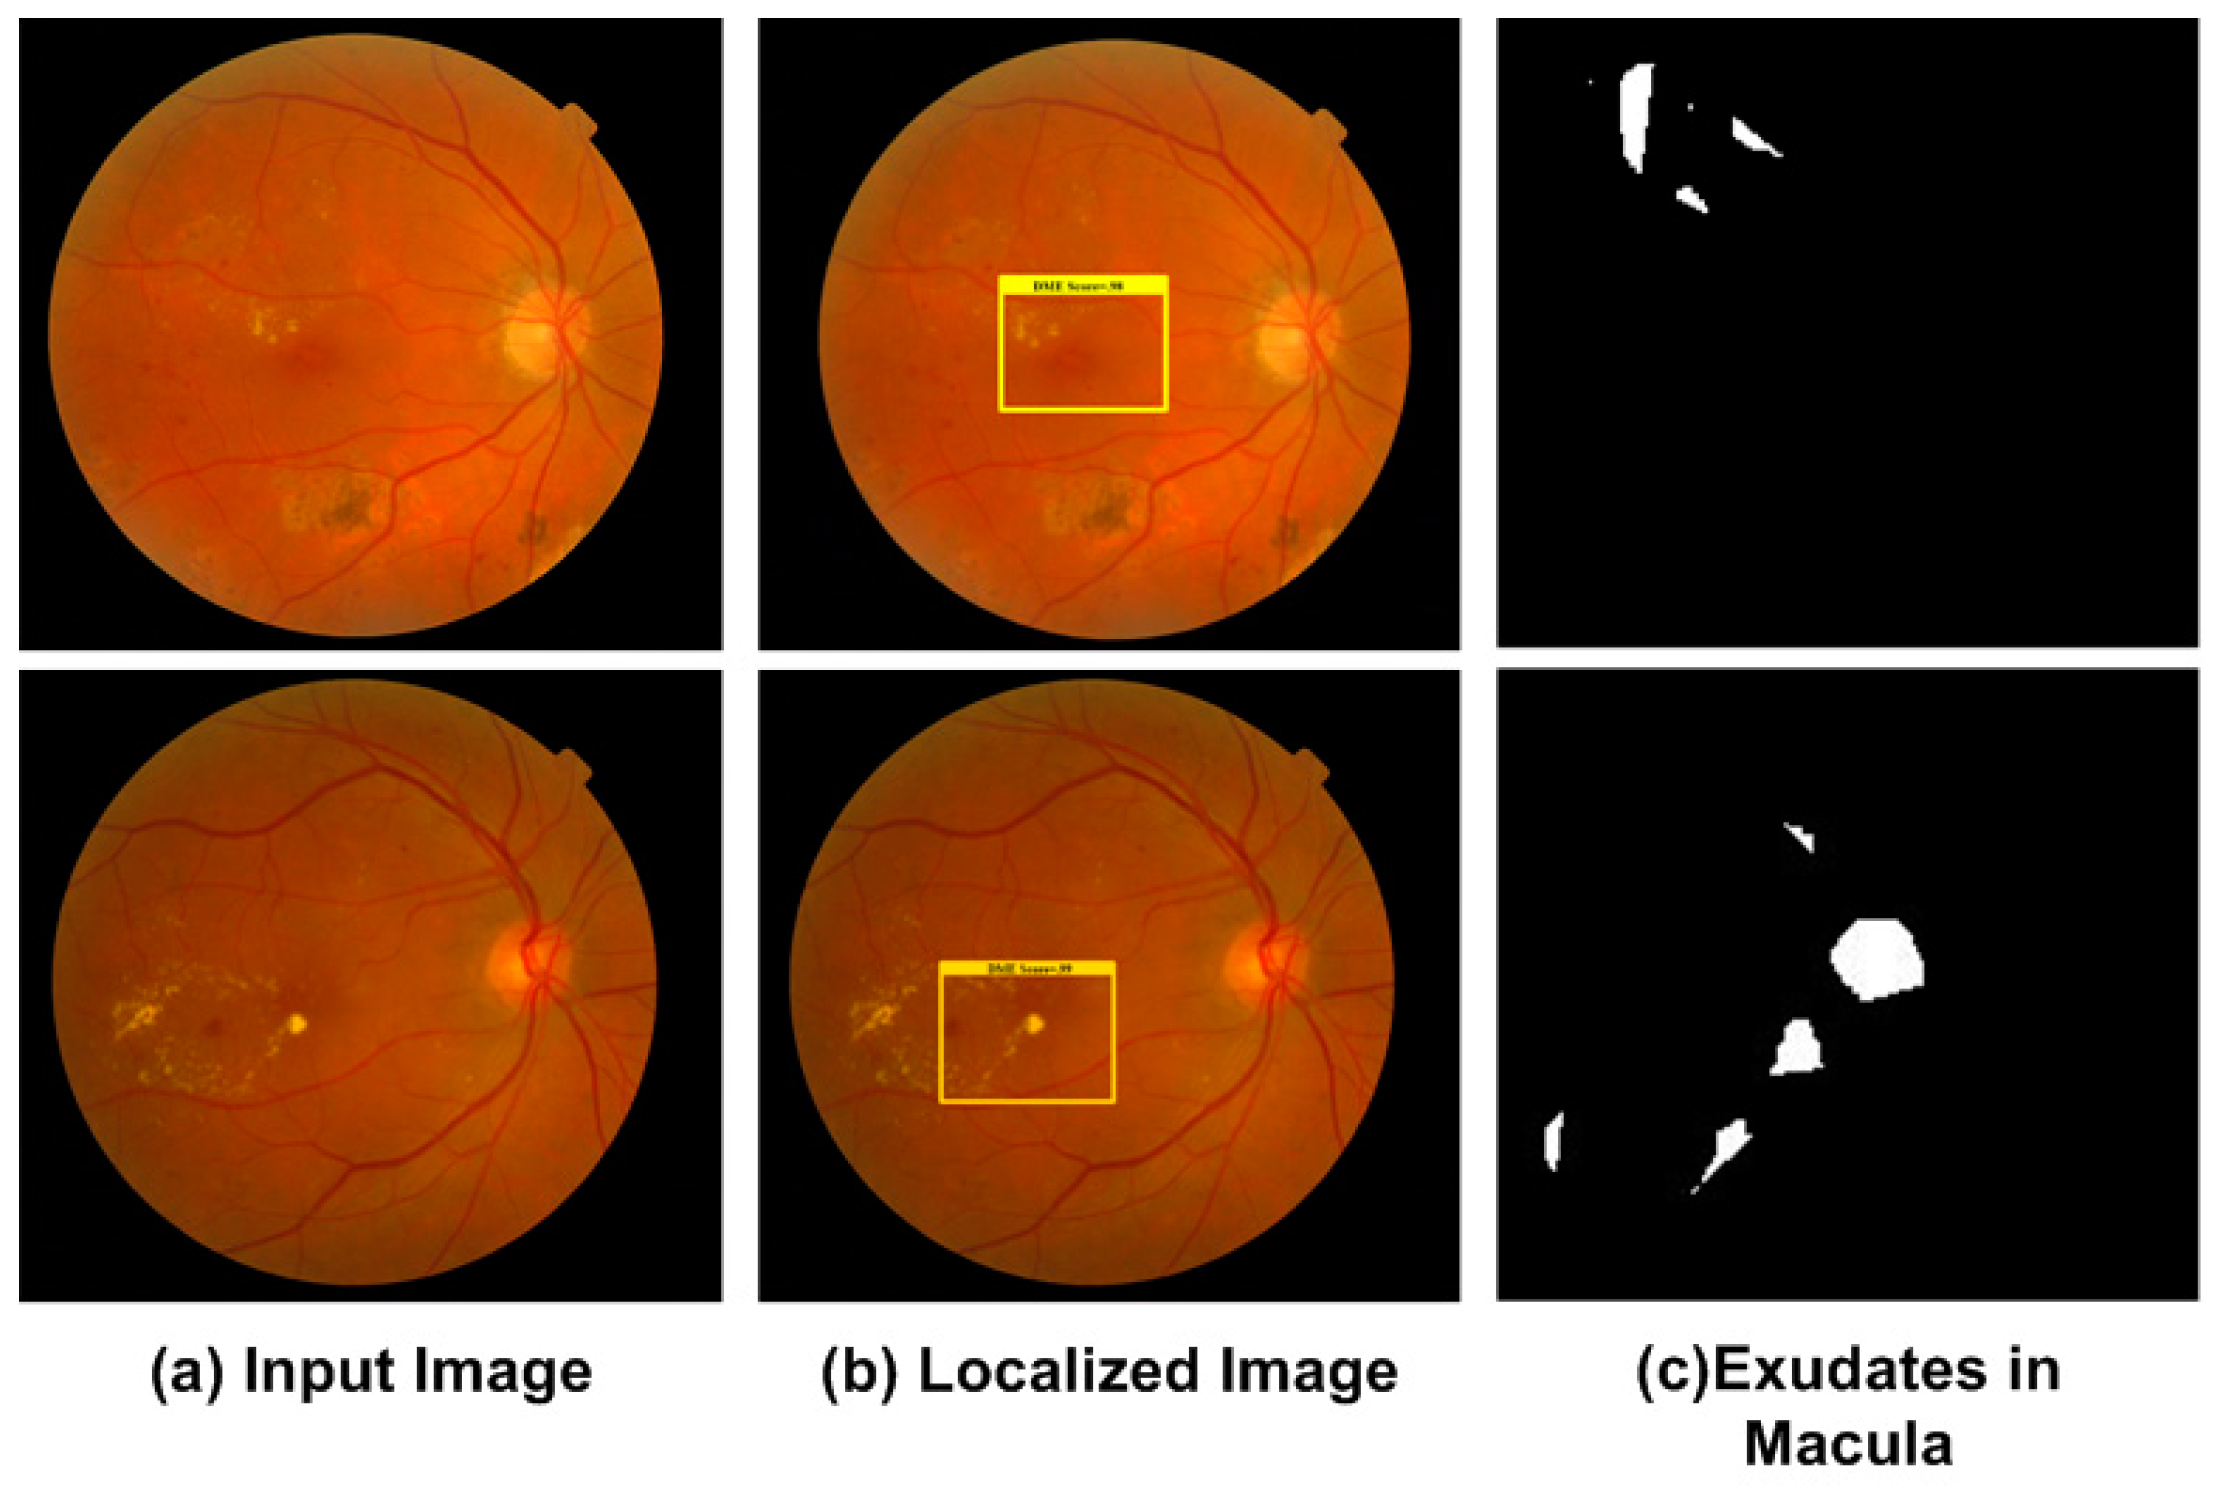
3.3.3. Localization of DME Regions
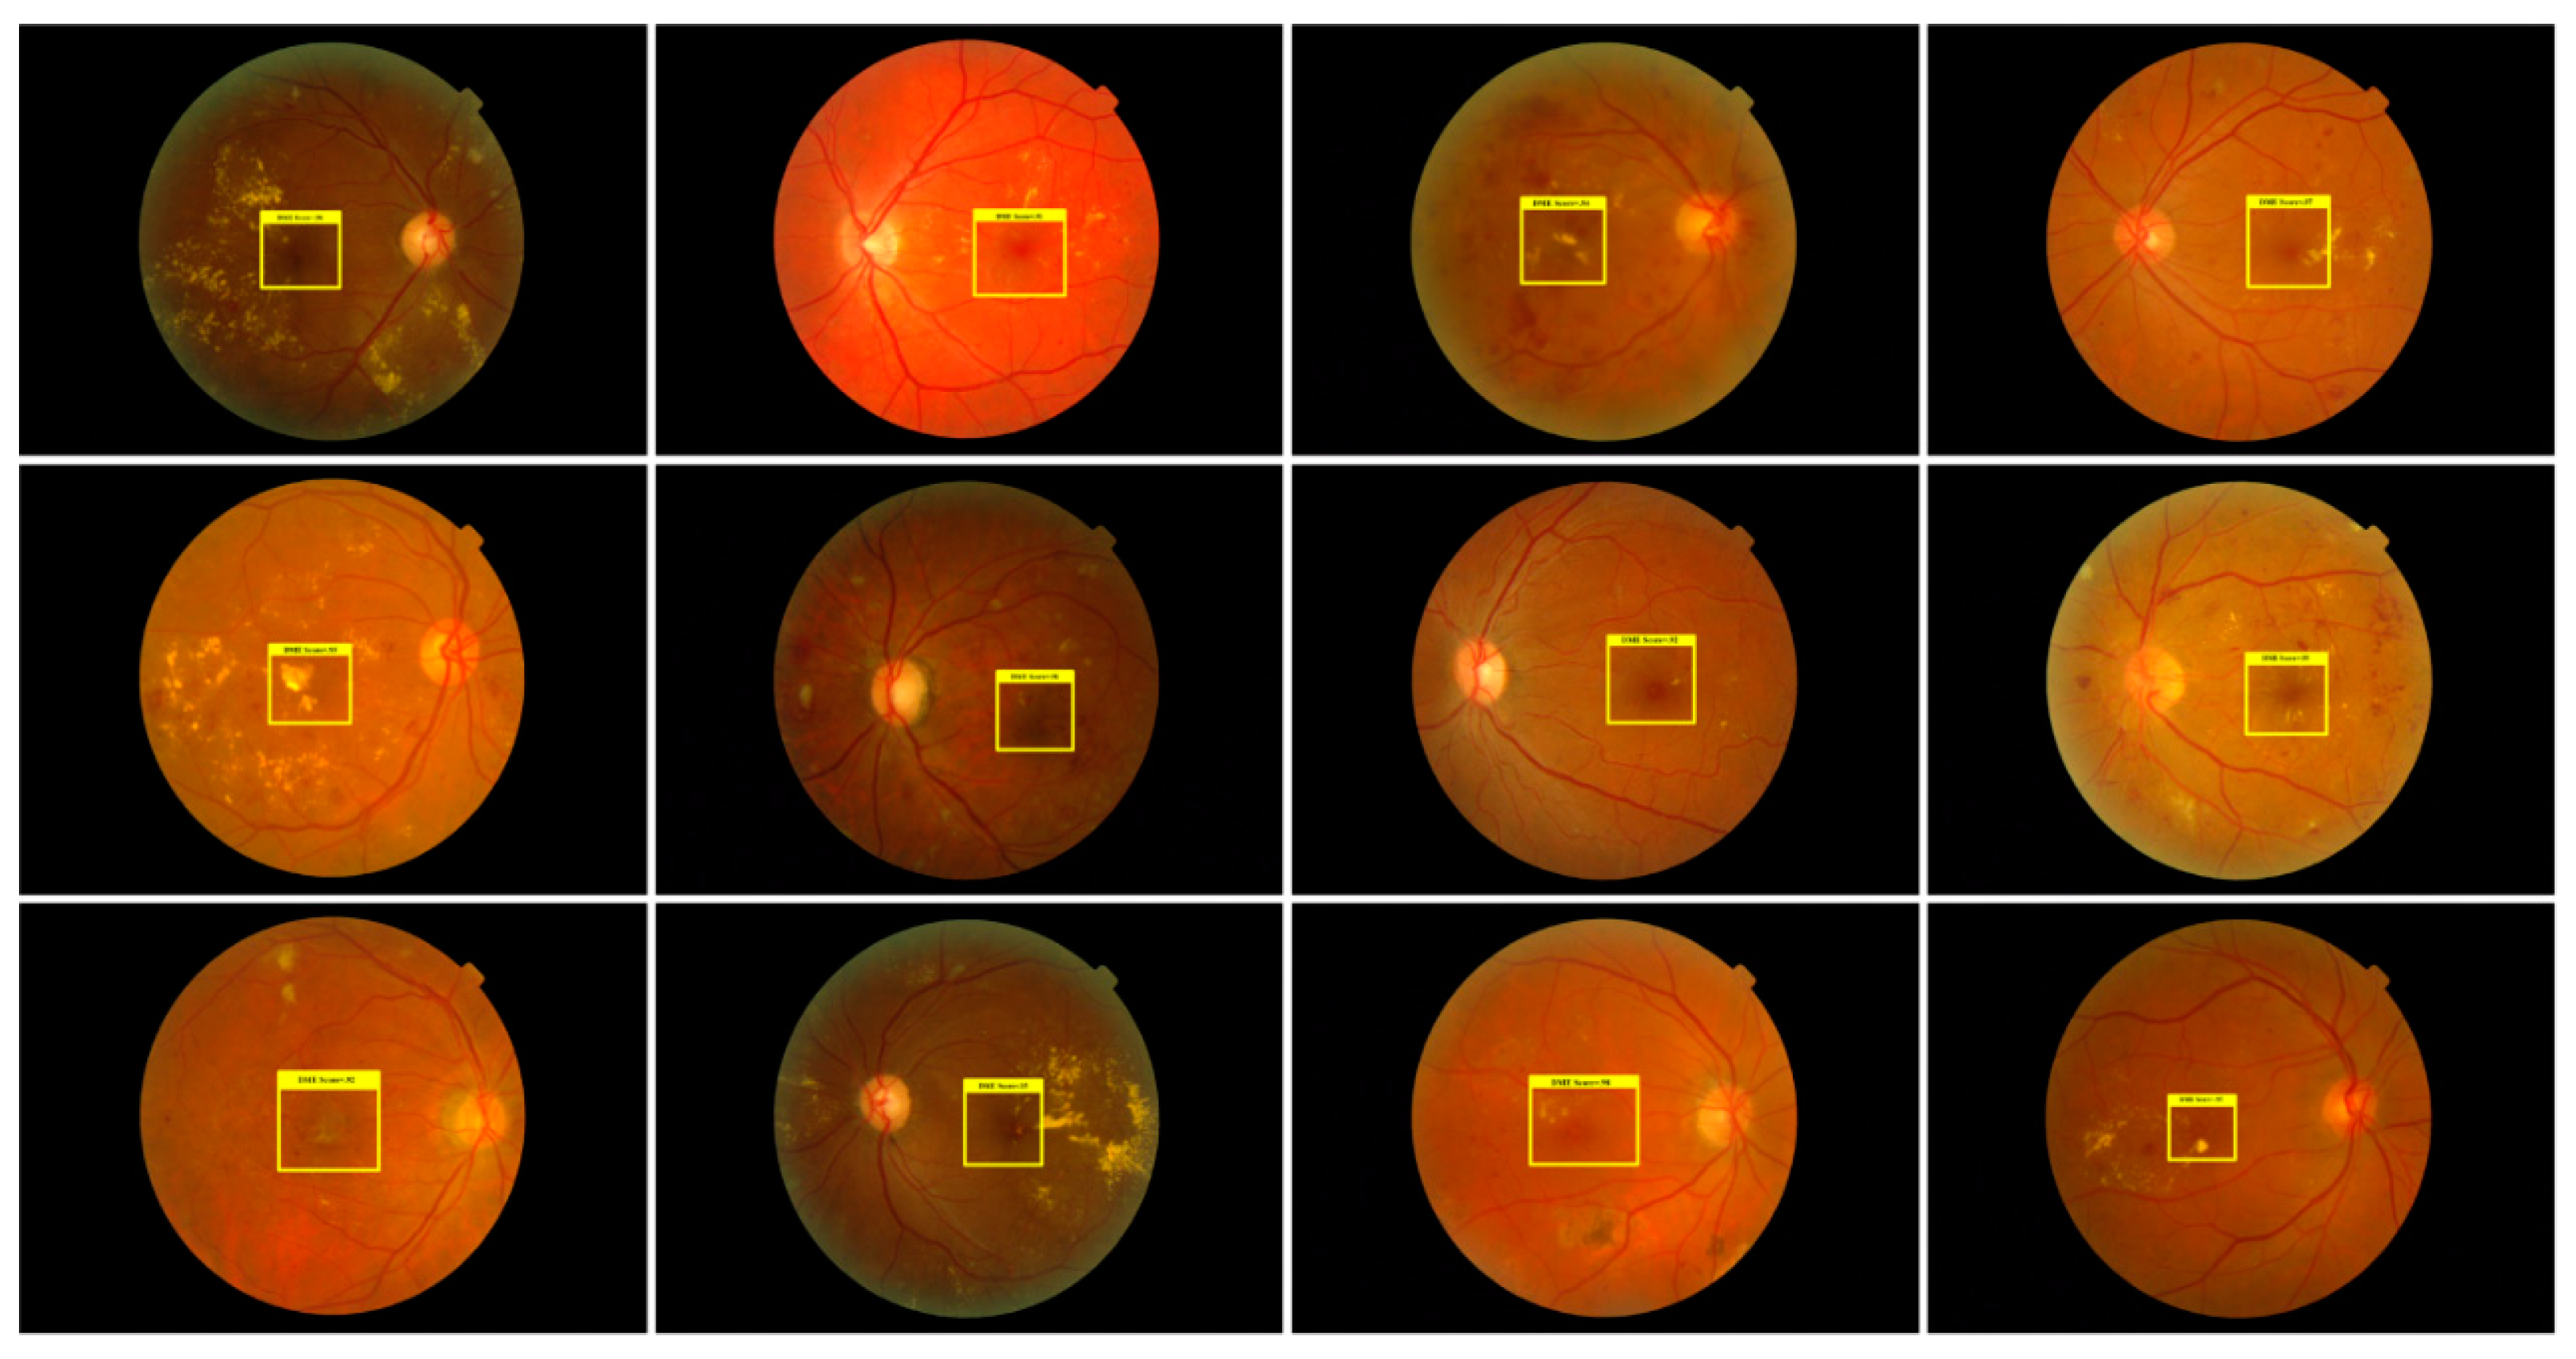
For performance evaluation of DME detection from retinal images, we have used the MESSIDOR dataset. FRCNN precisely localized the macula region and Softmax layer classify normal and DME- affected regions. Visualization results of DME localization are shown in Figure 4, FRCNN localized the macular edema region at regressor layer with a mean average precision of 0.943.
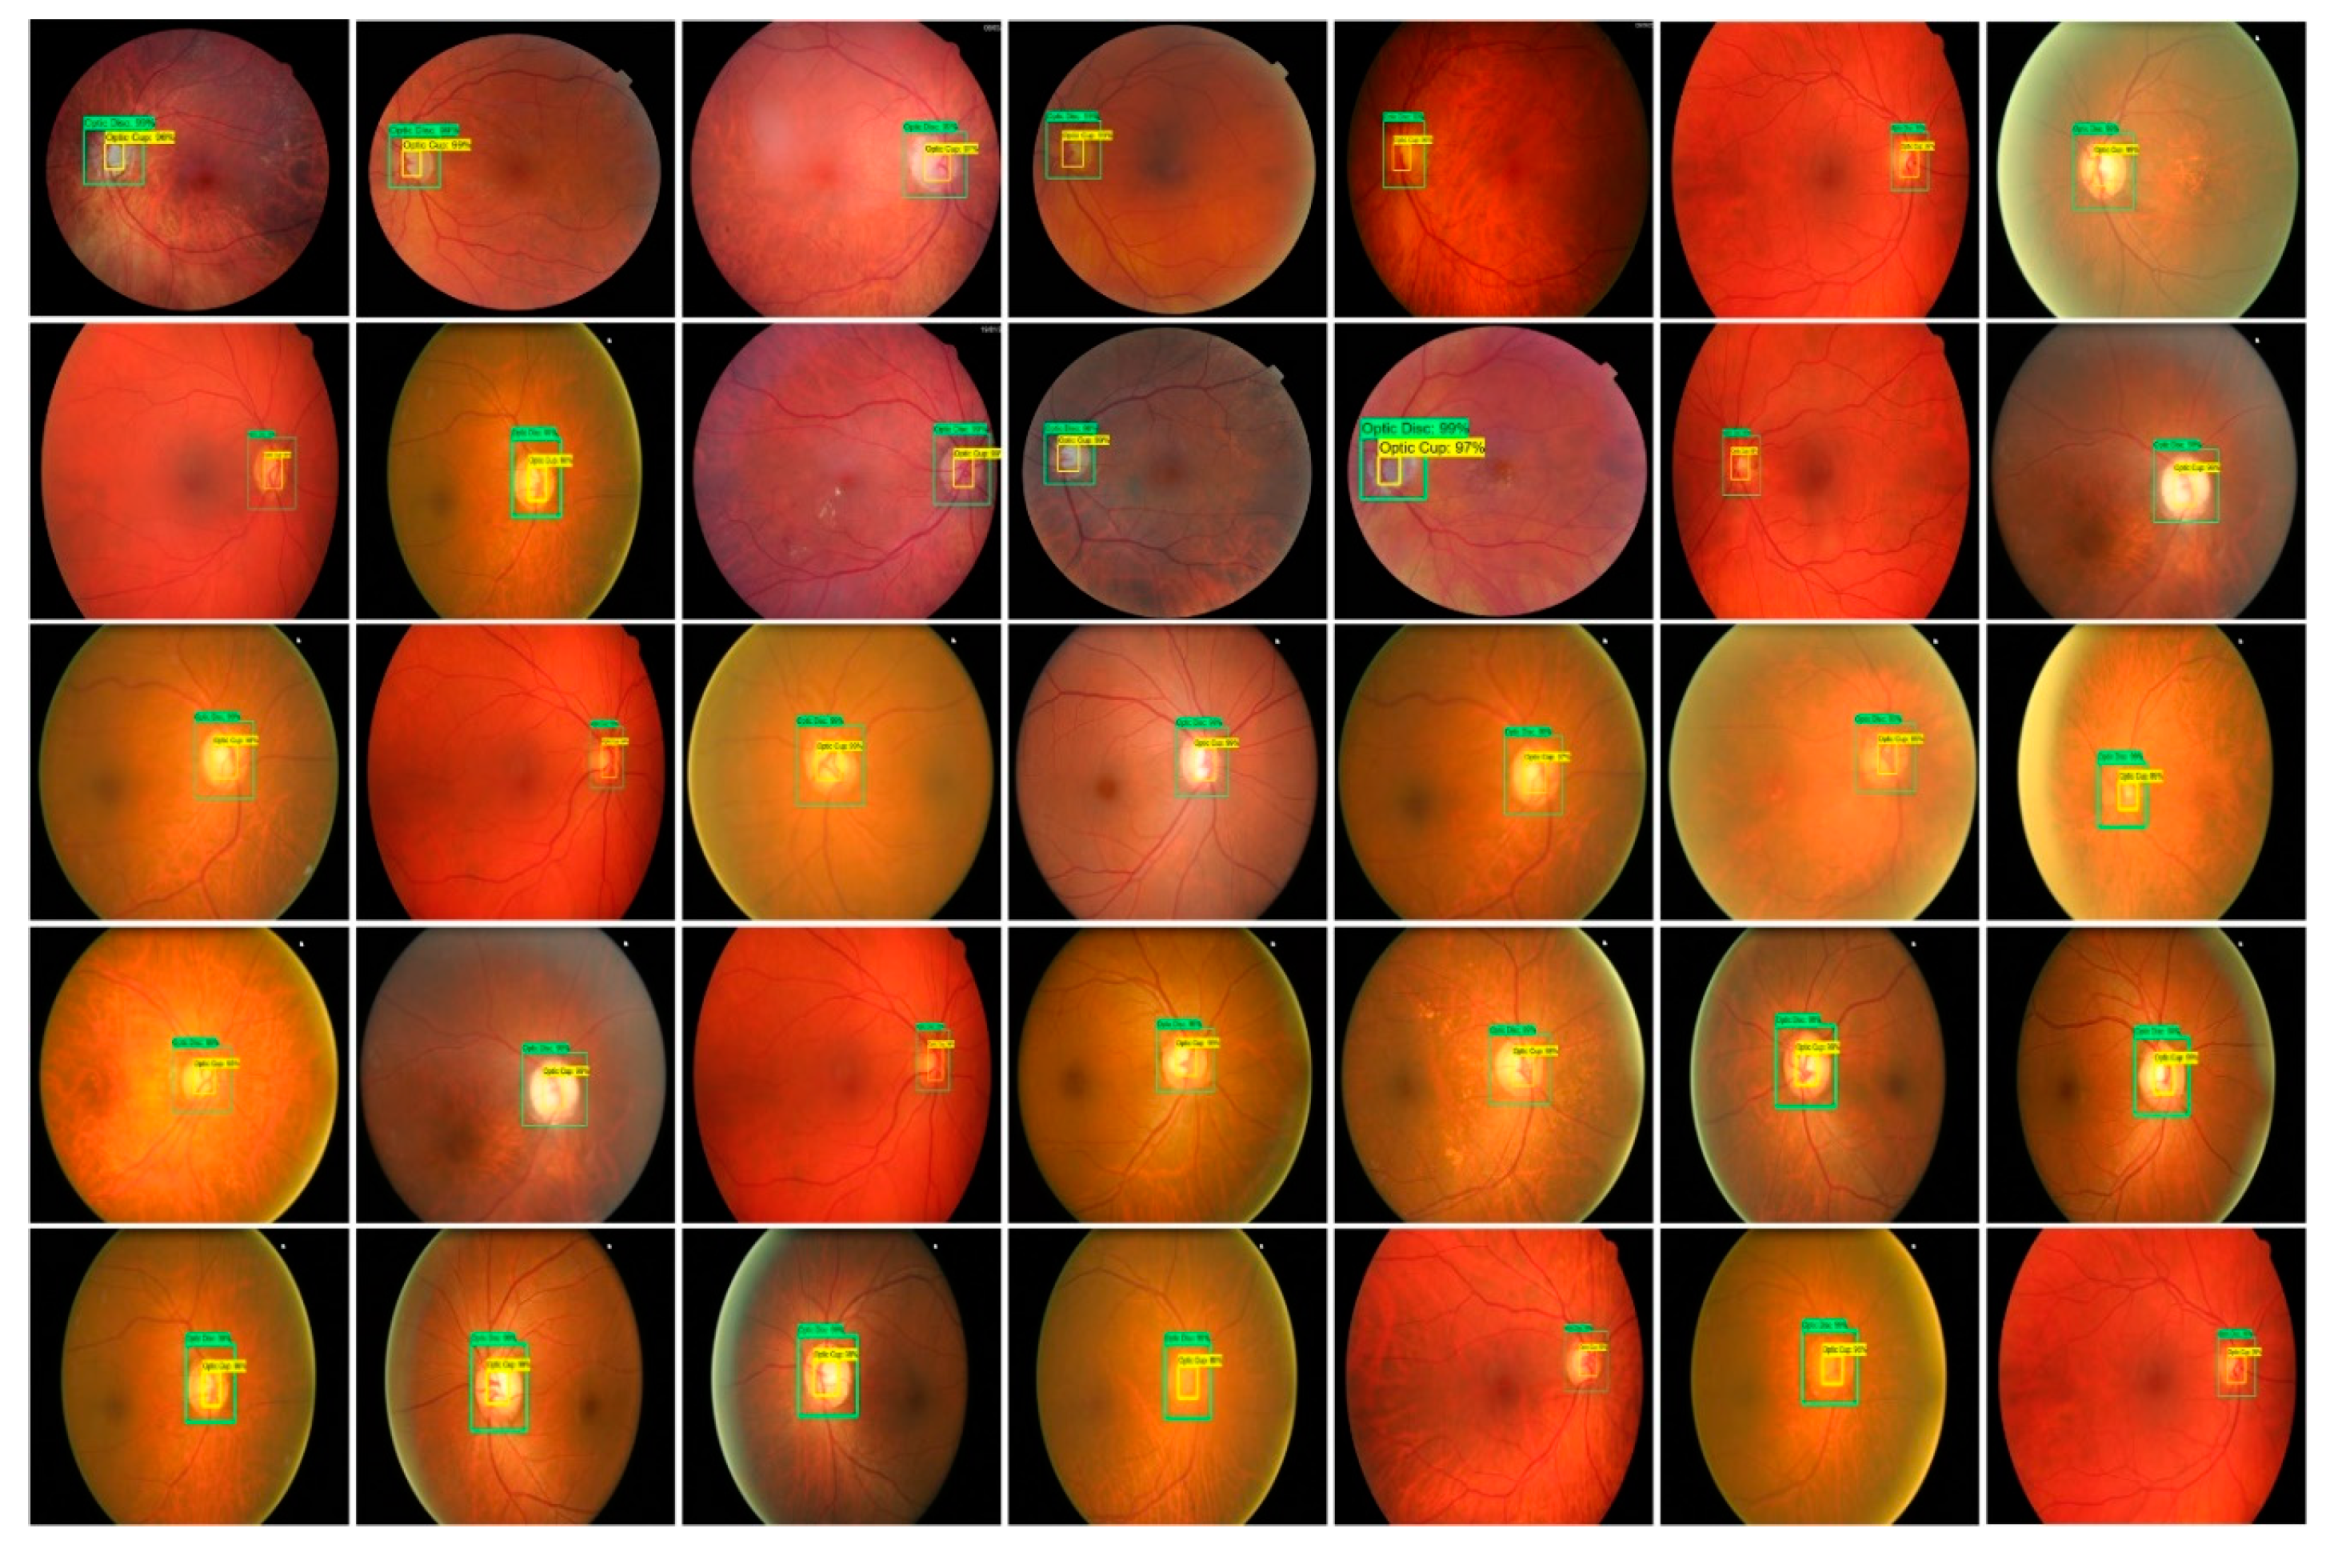
3.3.4. Localization of Glaucoma Regions
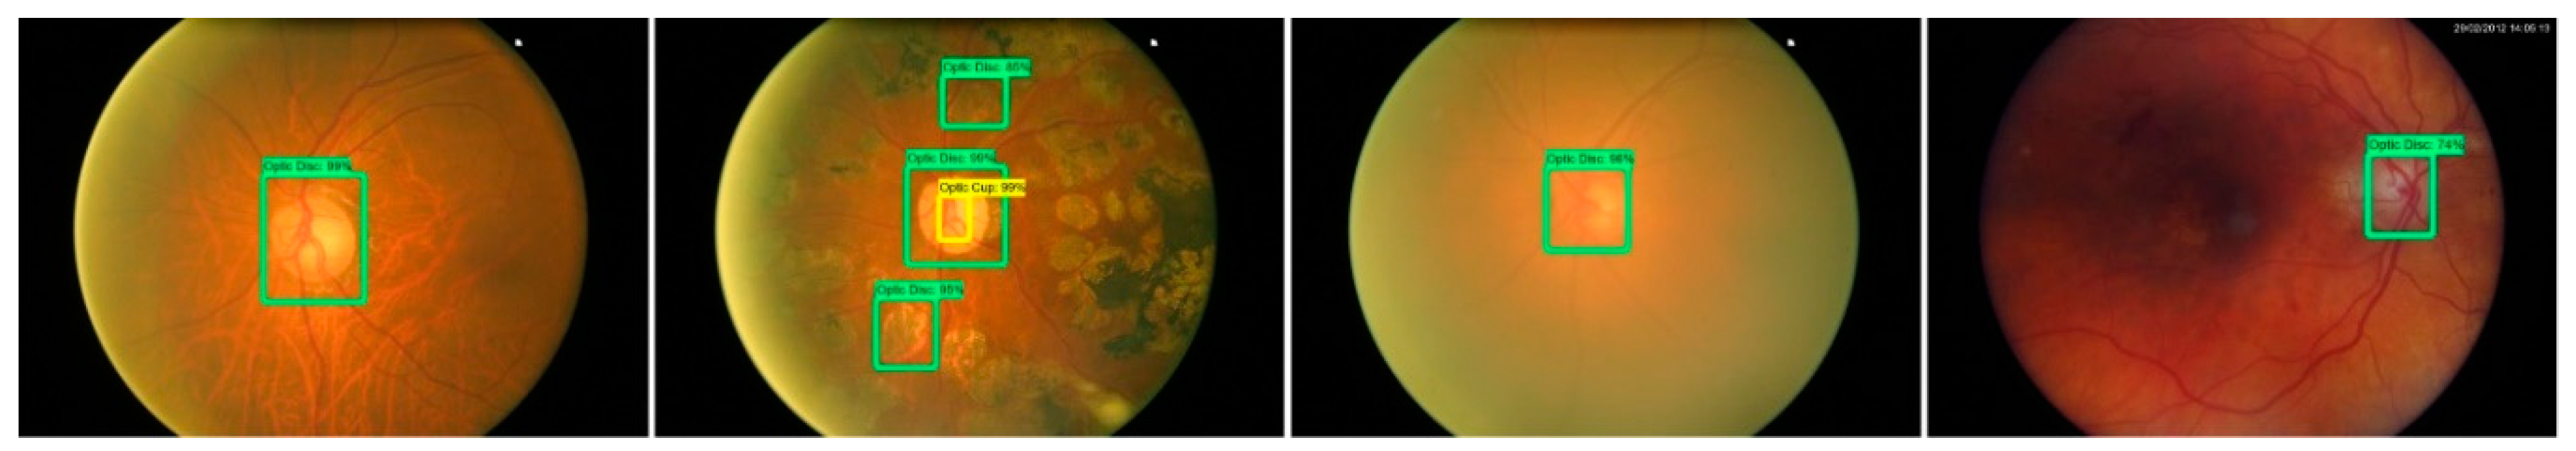
We adopted the FRCNN method for glaucoma localization. Given an image for the glaucoma region, RPN generates several random rectangular region proposals with associated region scores. The glaucoma localization outcome of FRCNN as shown in Figure 5 having 35 test images from three datasets. The test results show a higher score which is greater than 0.84 and up to 0.94. The precision of glaucoma localization is reported in Table 4 on three datasets i.e., HRF, DR-HAGIS, and ORIGA (i.e., 0.946, 0.940, and 0.938 respectively) Our method achieved mAP over all datasets is 0.940, we can say our method can localize the glaucoma regions accurately.
3.3.5. Segmentation Results
Extracting the localization of the affected regions not only generates a low dimensional initial sample that is economically effective but also enables deep NN to emphasis on the significant portion of the image.
The pixel-wise segmentation results of DR signs are presented in Figure 6. All four signs of DR are segmented separately which are localized through the FRCNN method. The segmented images are then compared with ground truth images. The proposed method results are evaluated by using the SE, SP, and Acc for all images of the test dataset. Table 5 shows that the proposed system obtained average scores of SE as 0.961, SP as 0.965, and Acc as 0.952. Our proposed method shows good performance due to the accurate localization of lesions by using FRCNN.
The localized macula region is segmented through FKM clustering. The visual segmentation results of DME are presented in Figure 7, which clearly shows the abnormalities i.e., exudates in macula region. The presented work achieved the average values of acc, SP, and SE as 0.958, 0.958, and 0.96, respectively.
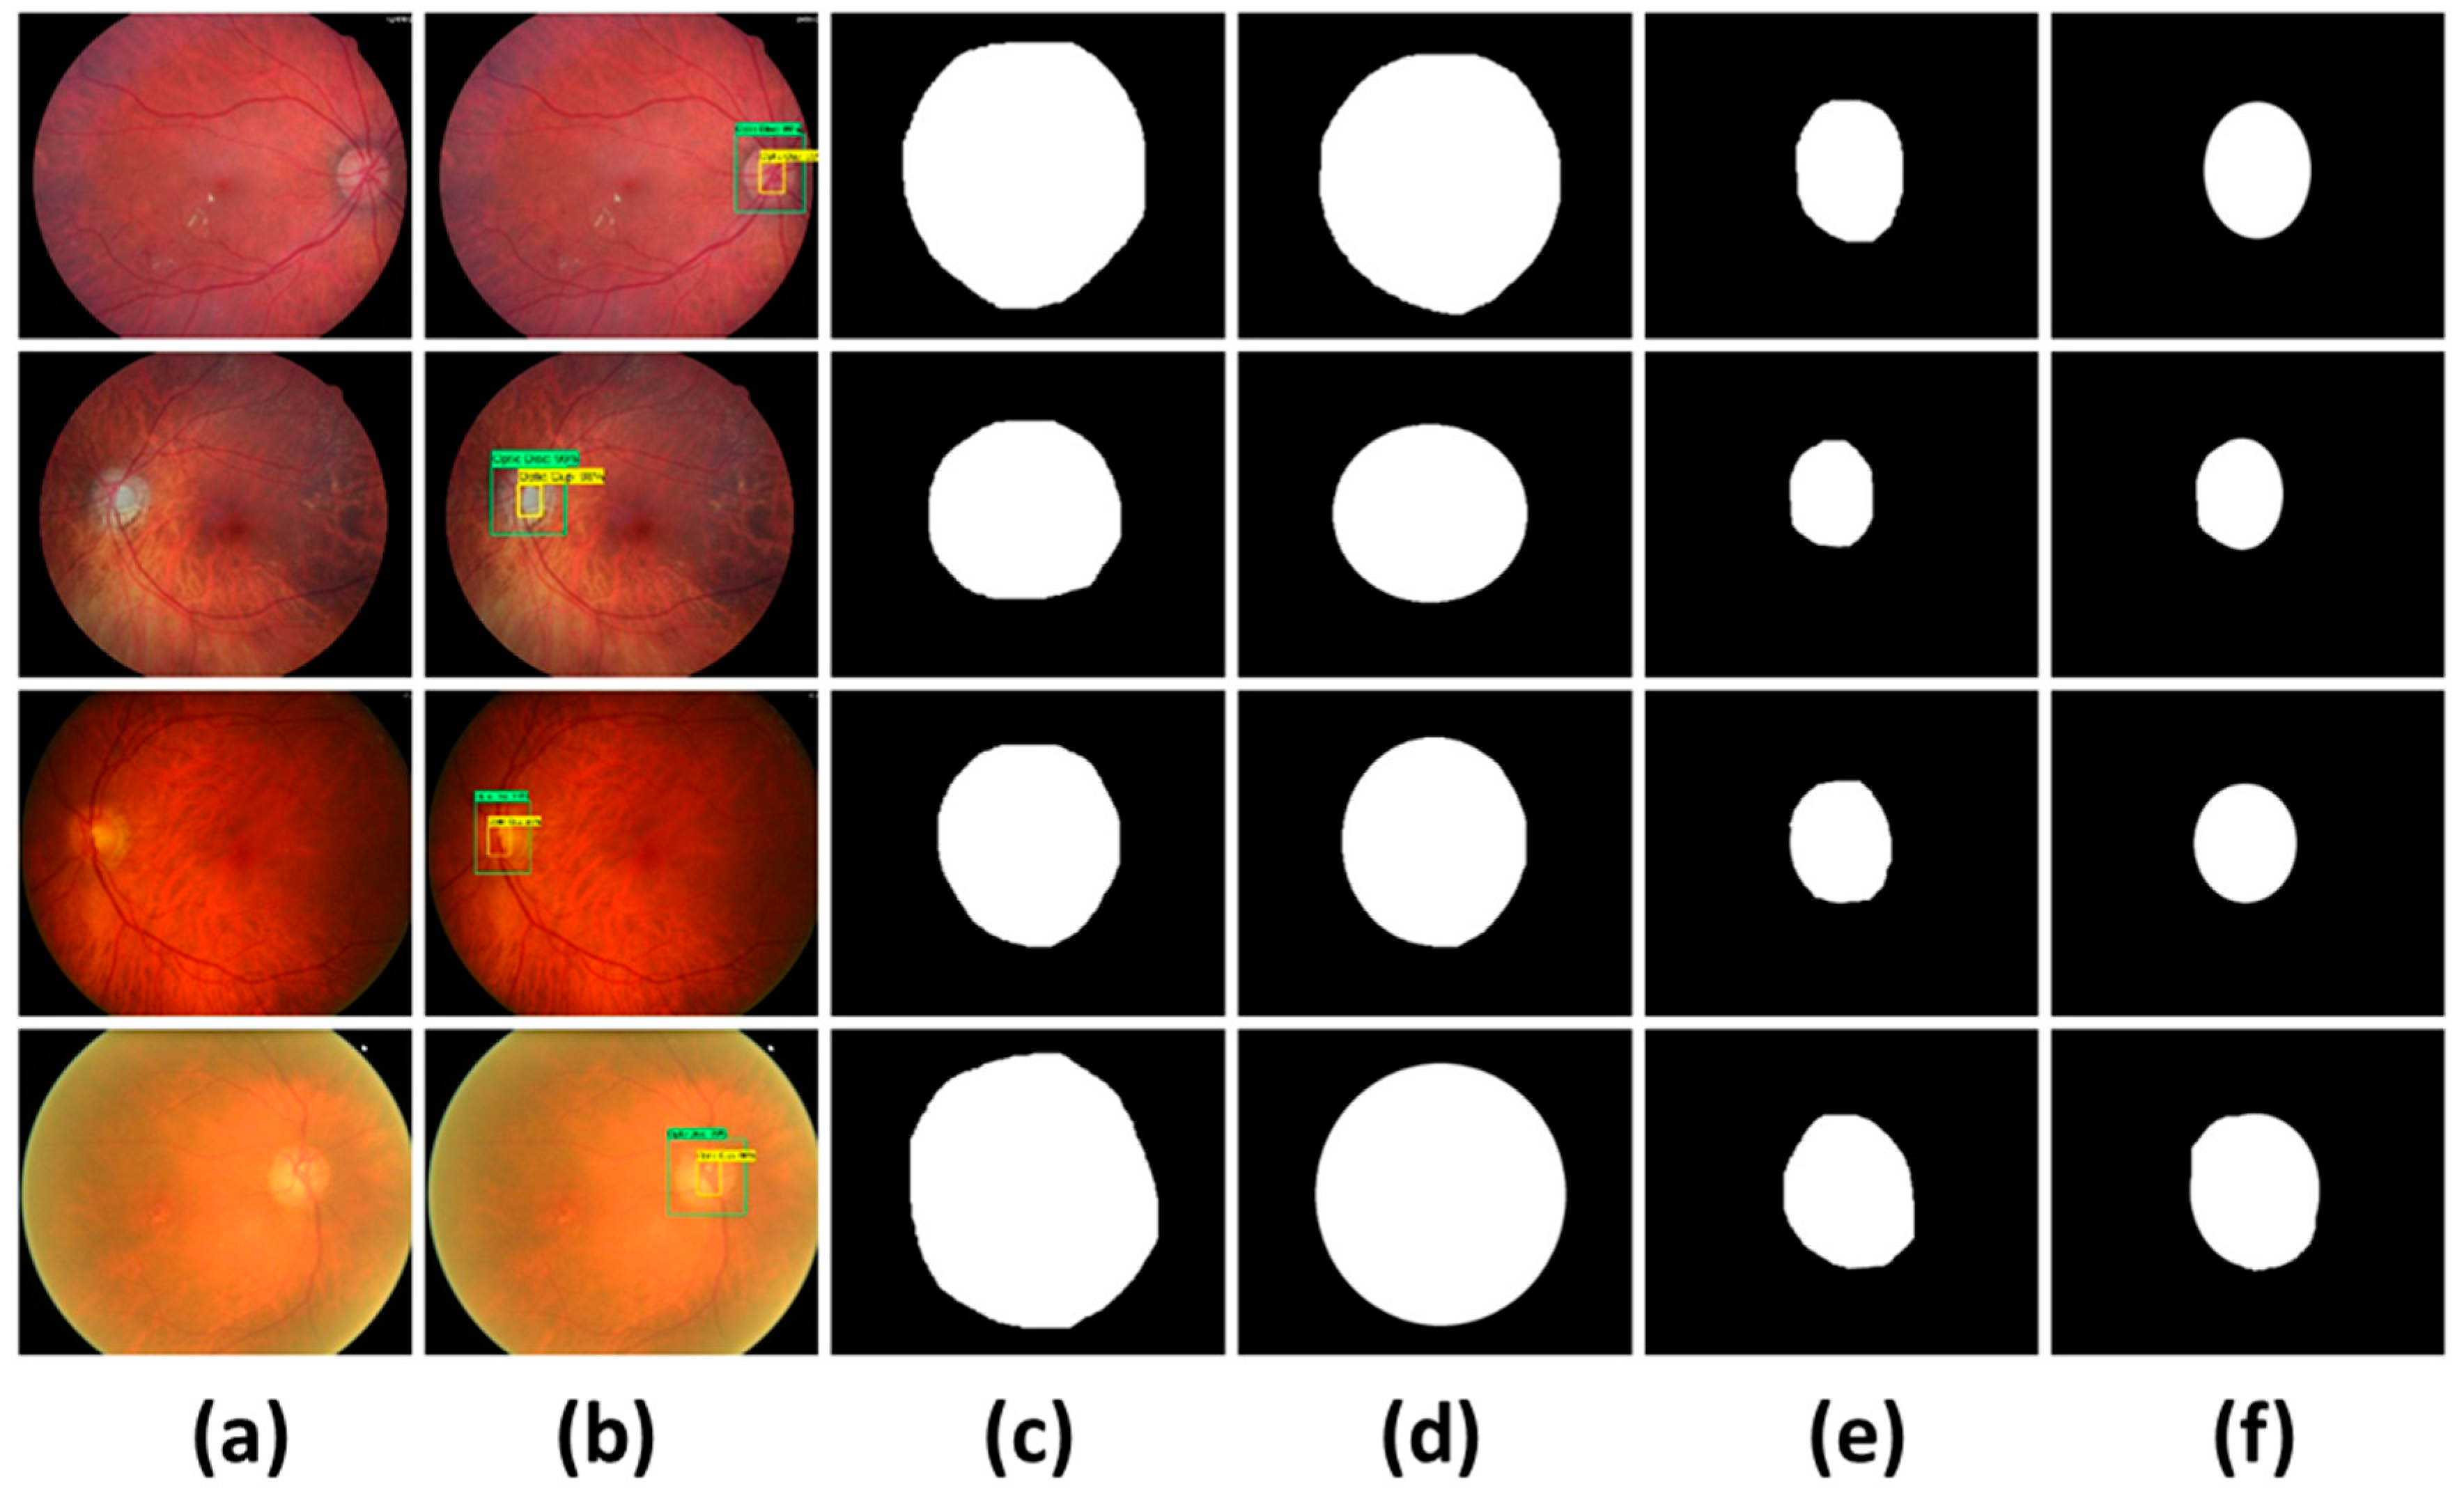
Figure 8 depicts the segmentation results of the glaucoma regions of three datasets. Table 6 demonstrates that the proposed system attained average values of SE as 0.951, SP as 0.961, Acc as 0.952, and Di as 0.928. It is observed that the proposed methodology shows good segmentation performance due to the accurate localization of OD and OC by using FRCNN.
The proposed method achieved good performance due to the accurate localization of OD and OC regions using FRCNN. However, in few images FRCNN detected the false OD regions (as shown in Figure 9 due to following reasons: (i) visual similarity of OD with brighter regions. (ii) Fails to detect the OC at low intensity areas.
3.4. Comparative Studies
In this section we compare our method for the DR, DME, and glaucoma detection against state-of-the-art methods. For DR detection we compared our method against the works of Zeng et al. [28], Gulshan et al. [57], Zhou et al. [58], Kaur et al. [59], Abbas et al. [60], and Colomer et al. [61] using a 10-fold cross validation scheme. The proposed method was implemented using Matlab-2019 and run on an Nvidia GTX1070 GPU-based system. The comparative results using accuracy (Acc), specificity (SP), sensitivity (SE), and area under the curve (AUC) are reported in Table 7. From the results it can be observed that our method achieved 95% accuracy, which is highest then all the compared methods. In terms of specificity, the work of Kaur et al. [59] was the closest to our method where the difference is just 0.5%. However, this method exhibited the lower sensitivity, where our method supersedes this approach by a significant margin of 8%. Although, the method of Zhou et al. [58] showed higher sensitivity then our method, where performance difference is 3%; but contrary to this, the method showed approximately 10% more performance loss than our method in terms of specificity. The higher sensitivity rate with lower specificity rate reflects that the method by Zhou et al. [58] mislabel the non-DR signs as DR, which may lead towards the imprecise diagnosis for the healthy patients. Similarly, in terms of AUC our method also outperformed all the comparative approaches. The consistent performance of the proposed method is attributed towards the low-resolution feature map generation based on the region proposals. The region proposals assist in accurate localization of the DR even for the images suffering from the low illumination. Hence, based on the results it can be concluded that our method is more precise for DR sign detection as compared to the other approaches used for the comparison.
For DME detection we have compared our method against the works of Li et al. [62], Deepak et al. [63], Medhi et al. [64], Rekhi et al. [2], Lim et al. [65], Rahim et al. [66], Syed et al. [67], Varadarajan et al. [68] and Xiaodong et al. [69] using the MESSIDOR dataset. The results of the comparison are presented in Table 8. In terms of sensitivity, our method has achieved the SE of 0.96 which is equal to Syed’s method. However, in terms of specificity and accuracy, our method performed better than Syed’s method and all other methods. Significant difference in terms of sensitivity can be observed against Li et al. [62], Lim et al. [65], and Rahim et al. [66], where this difference ranges from 11–26%. The method Lim et al. [65] which showed higher specificity in comparison to the sensitivity shows that the method considered the DME regions as non-DME regions, whereas, the methods, i.e., Rahim et al. [66] where sensitivity is higher than the specificity reflect that the method considered even the non-DME regions as DME. According to the Table 8, our method has achieved the SP of 0.958 which is higher than other methods (i.e., 0.55–0.95), although SP of Xiaodong’s method is 0.97 but its SE value is lower than our method. Hence, the performance comparison reflects that our method reliably detects the DME.
For glaucoma detection, we compared our method against the works of Liao et al. [70], Chen et al. [71], Xu et al. [72], Li et al. [73], Bajwa et al. [37], Ramani et al. [39], Parakash et al. [74] and Krishna et al. [12]. The comparison results using ORIGA, HRF, and DR HAGIS datasets are reported in Table 9. For glaucoma detection, the comparative methods have applied different sets of performance evaluation measures. For fair comparison, we have reported the performance of our method using all the performance evaluation measures i.e., SE, SP, AUC, dice score (Dc), and computation test time over all the three datasets. From the results we can observe that, our method has acquired the highest SE and AUC rates i.e., 0.945, and 0.947, respectively, that signifies the reliability of our approach. The proposed method achieved the specificity of 0.96 which is slightly lower (only for the HRF dataset) than the methods presented in [39,74], but both methods showed lower sensitivity rates, which clearly shows their inability to detect the glaucoma signs.
In terms of SE over HRF dataset our method showed an approximately 10% performance gain over the work of Ramani et al. [39], and approximately 24% performance gain over the work of Parakash et al. [74]. In terms of AUC, and SE our method showed significant performance gain than all the comparative approaches. Liao et al. [70] also reported the performance of their method using Dc measure, where our method also outperformed their work. Moreover, our technique can easily run on CPU or GPU machines and each image test time is 0.9 s which is faster than the work of Ramani et al. [39], which take 1.49 s. Hence, based on the result it can be concluded that our method is also equally reliable for the glaucoma detection.
4. Discussion
We have applied af RCNN technique for the localization and recognition of the diabetes-based eye diseases. Our method is based on fast RCNN and Fuzzy k-means clustering. Our main contribution is to present a consolidated model to target three eye diseases i.e., diabetic retinopathy, diabetic macular edema and glaucoma. In localization, the proposed model achieved mAP of 0.945, 0.943 and 0.941 for DR, DME and glaucoma, respectively. FRCNN utilizes a backpropagation estimation, also added the bbox regression and classification head, and trained the model with a multi-task loss. The proposed method detects the abnormalities of DR, DME, and glaucoma regions simultaneously using FRCNN and lastly, FKM clustering precisely extracts the regions from localized regions. For segmentation we have achieved the accuracy of 0.952, 0.958 and 0.9526 for DR, DME and glaucoma regions, respectively.
The existing literature emphasized on the recognition of these diseases individually and there is very limited amount of work available which expands the scope of the modern machine/deep learning models to simultaneously detect multiple eye diseases. The fundamental reason is that each disease is based on different abnormality signs which are specific to that particular eye disease. Moreover, the model which is optimized for one disease may give bad performance for other diseases. However, with this work we have addressed this misconception and came-up with a robust approach in the form of a model which can detect and recognize three different eye diseases with very high accuracy. Therefore, with this work we have proved that the deep learning models have the potential to detect multiple eye diseases just like an ophthalmologist. Moreover, this work is more towards the application end of the computer vision and our target audience is the engineers and manufacturers particularly those developing intelligent CAD systems.
5. Conclusions
In the presented work, a novel methodology is proposed based on FRCNN with FKM clustering for automated localization and recognition of diabetes-based eye diseases, i.e., glaucoma, DR and DME in retinal images. The proposed technique is composed of two phases: a disease detection and localization phase and the other is the segmentation of the localized regions through the FKM clustering. The FRCNN technique can extract the deep features with an optimal representation of eye diseases and increases the performance of segmentation in contrast with the latest solutions. The results demonstrate that the proposed solution achieved the mean IoU of 0.95 and mAP value above 0.94 into three diseases. Moreover, our proposed approach can also be utilized to resolve the different segmentation complexities of medical imaging as well. The research work will be extended by addressing other retinal image diseases i.e., cataracts, age-related macular edema degeneration, etc. in the future.
Author Contributions
Conceptualization, T.N. and A.I.; methodology, T.N. and A.I.; software, A.I., and A.J.; Experimental design, T.N., A.I., A.J.; validation, T.N., A.I., H.M., and A.J., H.M.; Writing—original draft, T.N.; Writing—Review and Editing, A.I.; H.M.; Funding Acquisition, D.H., R.A.N.; Project Administration, D.H., R.A.N.; Supervision, D.H., R.A. All authors have read and agreed to the published version of the manuscript.
Funding
This work is supported by the KIAS (Research Number: CG076601) and in part by Sejong University Faculty Research Fund.
Conflicts of Interest
The authors declare that they have no conflict of interest.
References
- Mateen, M.; Wen, J.; Hassan, M.; Nasrullah, N.; Sun, S.; Hayat, S. Automatic Detection of Diabetic Retinopathy: A Review on Datasets, Methods and Evaluation Metrics. IEEE Access 2020, 8, 48784–48811. [Google Scholar] [CrossRef]
- Rekhi, R.S.; Issac, A.; Dutta, M.K. Automated detection and grading of diabetic macular edema from digital colour fundus images. In Proceedings of the 2017 4th IEEE Uttar Pradesh Section International Conference on Electrical, Computer and Electronics (UPCON), Mathura, India, 26–28 October 2017; pp. 482–486. [Google Scholar]
- Al-Bander, B.; Al-Nuaimy, W.; Al-Taee, M.A.; Zheng, Y. Automated glaucoma diagnosis using deep learning approach. In Proceedings of the 2017 14th International Multi-Conference on Systems, Signals & Devices (SSD), Marrakech, Morocco, 28–31 March 2017; pp. 207–210. [Google Scholar]
- Zago, G.; Andreão, R.V.; Dorizzi, B.; Salles, E.O.T. Diabetic retinopathy detection using red lesion localization and convolutional neural networks. Comput. Biol. Med. 2020, 116, 103537. [Google Scholar] [CrossRef] [PubMed]
- Kunwar, A.; Magotra, S.; Sarathi, M.P. Detection of high-risk macular edema using texture features and classification using SVM classifier. In Proceedings of the 2015 International Conference on Advances in Computing, Communications and Informatics (ICACCI), Kochi, India, 10–13 August 2015; pp. 2285–2289. [Google Scholar]
- Quigley, H.; Broman, A.T. The number of people with glaucoma worldwide in 2010 and 2020. Br. J. Ophthalmol. 2006, 90, 262–267. [Google Scholar] [CrossRef] [Green Version]
- Bourne, R.R.; Flaxman, S.R.; Braithwaite, T.; Cicinelli, M.V.; Das, A.; Jonas, J.B.; Keeffe, J.; Kempen, J.H.; Leasher, J.; Limburg, H.; et al. Magnitude, temporal trends, and projections of the global prevalence of blindness and distance and near vision impairment: A systematic review and meta-analysis. Lancet Glob. Health 2017, 5, e888–e897. [Google Scholar] [CrossRef] [Green Version]
- Al-Bander, B.; Williams, B.M.; Al-Nuaimy, W.; Al-Taee, M.A.; Pratt, H.; Zheng, Y. Dense Fully Convolutional Segmentation of the Optic Disc and Cup in Colour Fundus for Glaucoma Diagnosis. Symmetry 2018, 10, 87. [Google Scholar] [CrossRef] [Green Version]
- Chen, X.; Xu, Y.; Wong, D.W.K.; Wong, T.Y.; Liu, J. Glaucoma detection based on deep convolutional neural network. In Proceedings of the 2015 37th Annual International Conference of the IEEE Engineering in Medicine and Biology Society (EMBC), Milan, Italy, 25–29 August 2015; Volume 2015, pp. 715–718. [Google Scholar]
- Mary, M.C.V.S.; Rajsingh, E.B.; Naik, G.R. Retinal Fundus Image Analysis for Diagnosis of Glaucoma: A Comprehensive Survey. IEEE Access 2016, 4, 4327–4354. [Google Scholar] [CrossRef]
- Sinthanayothin, C. Image Analysis for Automatic Diagnosis of Diabetic Retinopathy; University of London: London, UK, 1999. [Google Scholar]
- Krishna, B.S.; Gnanasekaran, T. Unsupervised Automated Retinal Vessel Extraction Framework Using Enhanced Filtering and Hessian Based Method with Hysteresis Thresholding. J. Med. Imaging Health Inf. 2019, 9, 1000–1010. [Google Scholar] [CrossRef]
- Khansari, M.M.; O’Neill, W.D.; Penn, R.D.; Blair, N.P.; Shahidi, M. Detection of Subclinical Diabetic Retinopathy by Fine Structure Analysis of Retinal Images. J. Ophthalmol. 2019, 2019, 5171965. [Google Scholar] [CrossRef]
- Qummar, S.; Khan, F.G.; Shah, S.; Khan, A.; Shamshirband, S.; Rehman, Z.U.; Khan, I.A.; Jadoon, W. A Deep Learning Ensemble Approach for Diabetic Retinopathy Detection. IEEE Access 2019, 7, 150530–150539. [Google Scholar] [CrossRef]
- Pan, X.; Jin, K.; Cao, J.; Liu, Z.; Wu, J.; You, K.; Lu, Y.; Xu, Y.; Su, Z.; Jiang, J.; et al. Multi-label classification of retinal lesions in diabetic retinopathy for automatic analysis of fundus fluorescein angiography based on deep learning. Graefe’s Arch. Clin. Exp. Ophthalmol. 2020, 258, 779–785. [Google Scholar] [CrossRef]
- Shankar, K.; Sait, A.R.W.; Gupta, D.; Lakshmanaprabu, S.; Khanna, A.; Pandey, H.M.; Kathiresan, S. Automated detection and classification of fundus diabetic retinopathy images using synergic deep learning model. Pattern Recognit. Lett. 2020, 133, 210–216. [Google Scholar] [CrossRef]
- Riaz, H.; Park, J.; Choi, H.; Kim, H.; Kim, J. Deep and Densely Connected Networks for Classification of Diabetic Retinopathy. Diagnostics 2020, 10, 24. [Google Scholar] [CrossRef] [PubMed] [Green Version]
- Agurto, C.; Murray, V.; Yu, H.; Wigdahl, J.; Pattichis, C.S.; Nemeth, S.; Barriga, E.S.; Soliz, P. A Multiscale Optimization Approach to Detect Exudates in the Macula. IEEE J. Biomed. Health Inf. 2014, 18, 1328–1336. [Google Scholar] [CrossRef] [PubMed]
- Rekhi, R.S.; Issac, A.; Dutta, M.K.; Travieso, C.M. Automated classification of exudates from digital fundus images. In Proceedings of the 2017 International Conference and Workshop on Bioinspired Intelligence (IWOBI), Funchal, Portugal, 10–12 July 2017; pp. 1–6. [Google Scholar]
- Dey, A.; Dey, K.N. Automated Glaucoma Detection from Fundus Images of Eye Using Statistical Feature Extraction Methods and Support Vector Machine Classification. In Industry Interactive Innovations in Science, Engineering and Technology; Lecture Notes in Networks and Systems; Springer: Singapore, 2016; Volume 11, pp. 511–521. [Google Scholar]
- Krishnan, M.M.R.; Faust, O. Automated glaucoma detection using hybrid feature extraction in retinal fundus images. J. Mech. Med. Biol. 2013, 13, 1350011. [Google Scholar] [CrossRef]
- Khan, M.W.; Sharif, M.; Yasmin, M.; Fernandes, S.L. A new approach of cup to disk ratio based glaucoma detection using fundus images. J. Integr. Des. Process. Sci. 2016, 20, 77–94. [Google Scholar] [CrossRef]
- Nayak, J.; Acharya, R.; Bhat, P.S.; Shetty, N.; Lim, T.C. Automated diagnosis of glaucoma using digital fundus images. J. Med. Syst. 2009, 33, 337–346. [Google Scholar] [CrossRef]
- Salam, A.A.; Akram, M.U.; Wazir, K.; Anwar, S.M.; Majid, M. Autonomous Glaucoma detection from fundus image using cup to disc ratio and hybrid features. In Proceedings of the 2015 IEEE International Symposium on Signal Processing and Information Technology (ISSPIT), Abu Dhabi, UAE, 7–10 December 2015; pp. 370–374. [Google Scholar] [CrossRef]
- Agrawal, D.K.; Kirar, B.S.; Pachori, R.B. Automated glaucoma detection using quasi-bivariate variational mode decomposition from fundus images. IET Image Process. 2019, 13, 2401–2408. [Google Scholar] [CrossRef]
- Dromain, C.; Boyer, B.; Ferre, R.; Canale, S.; Delaloge, S.; Balleyguier, C. Computed-aided diagnosis (CAD) in the detection of breast cancer. Eur. J. Radiol. 2013, 82, 417–423. [Google Scholar] [CrossRef]
- Abràmoff, M.D.; Lou, Y.; Erginay, A.; Clarida, W.; Amelon, R.; Folk, J.C.; Niemeijer, M. Improved Automated Detection of Diabetic Retinopathy on a Publicly Available Dataset Through Integration of Deep Learning. Investig. Opthalmol. Vis. Sci. 2016, 57, 5200. [Google Scholar] [CrossRef] [Green Version]
- Zeng, X.; Chen, H.; Luo, Y.; Bin Ye, W. Automated Diabetic Retinopathy Detection Based on Binocular Siamese-Like Convolutional Neural Network. IEEE Access 2019, 7, 30744–30753. [Google Scholar] [CrossRef]
- Ren, F.; Cao, P.; Zhao, D.; Wan, C. Diabetic macular edema grading in retinal images using vector quantization and semi-supervised learning. Technol. Health Care 2018, 26, 389–397. [Google Scholar] [CrossRef] [PubMed] [Green Version]
- Marín, D.; Gegundez-Arias, M.E.; Ponte, B.; Alvarez, F.; Garrido, J.; Ortega, C.; Vasallo, M.J.; Bravo, J.M. An exudate detection method for diagnosis risk of diabetic macular edema in retinal images using feature-based and supervised classification. Med. Biol. Eng. 2018, 56, 1379–1390. [Google Scholar] [CrossRef] [PubMed]
- Perdomo, O.; Otalora, S.; Rodríguez, F.; Arevalo, J.; González, F.A.; Chen, X.; Garvin, M.K.; Liu, J.; Trucco, E.; Xu, Y. A Novel Machine Learning Model Based on Exudate Localization to Detect Diabetic Macular Edema. In Proceedings of the Ophthalmic Medical Image Analysis Third International Workshop, Athens, Greece, 21 October 2016; pp. 137–144. [Google Scholar] [CrossRef] [Green Version]
- Jiang, Y.; Duan, L.; Cheng, J.; Gu, Z.; Xia, H.; Fu, H.; Li, C.; Liu, J. JointRCNN: A Region-Based Convolutional Neural Network for Optic Disc and Cup Segmentation. IEEE Trans. Biomed. Eng. 2020, 67, 335–343. [Google Scholar] [CrossRef]
- Shankaranarayana, S.M.; Ram, K.; Mitra, K.; Sivaprakasam, M. Joint optic disc and cup segmentation using fully convolutional and adversarial networks. In Fetal, Infant and Ophthalmic Medical Image Analysis; Springer: Berlin/Heidelberg, Germany, 2017; pp. 168–176. [Google Scholar]
- Raghavendra, U.; Fujita, H.; Bhandary, S.V.; Gudigar, A.; Tan, J.H.; Acharya, U.R. Deep convolution neural network for accurate diagnosis of glaucoma using digital fundus images. Inf. Sci. 2018, 441, 41–49. [Google Scholar] [CrossRef]
- Sevastopolsky, A. Optic disc and cup segmentation methods for glaucoma detection with modification of U-Net convolutional neural network. Pattern Recognit. Image Anal. 2017, 27, 618–624. [Google Scholar] [CrossRef] [Green Version]
- Abbas, Q. Glaucoma-Deep: Detection of Glaucoma Eye Disease on Retinal Fundus Images using Deep Learning. Int. J. Adv. Comput. Sci. Appl. 2017, 8, 41–45. [Google Scholar] [CrossRef] [Green Version]
- Bajwa, M.N.; Malik, M.I.; Siddiqui, S.A.; Dengel, A.; Shafait, F.; Neumeier, W.; Sheraz Ahmed, S. Two-stage framework for optic disc localization and glaucoma classification in retinal fundus images using deep learning. BMC Med. Inf. Decis. Mak. 2019, 19, 136. [Google Scholar]
- Lu, Z.; Chen, D. Weakly Supervised and Semi-Supervised Semantic Segmentation for Optic Disc of Fundus Image. Symmetry 2020, 12, 145. [Google Scholar] [CrossRef] [Green Version]
- Ramani, R.G.; Shanthamalar, J.J. Improved image processing techniques for optic disc segmentation in retinal fundus images. Biomed. Signal Process. Control. 2020, 58, 101832. [Google Scholar] [CrossRef]
- Zhang, W.; Zhong, J.; Yang, S.; Gao, Z.; Hu, J.; Chen, Y.; Yi, Z. Automated identification and grading system of diabetic retinopathy using deep neural networks. Know. Based Syst. 2019, 175, 12–25. [Google Scholar] [CrossRef]
- De La Torre, J.; Valls-Mateu, A.; Puig, D. A deep learning interpretable classifier for diabetic retinopathy disease grading. Neurocomputing 2020, 396, 465–476. [Google Scholar] [CrossRef] [Green Version]
- Tzutalin. LabelImg. Available online: https://github.com/tzutalin/labelImg (accessed on 11 January 2020).
- Wang, X.; Shrivastava, A.; Gupta, A. A-Fast-RCNN: Hard Positive Generation via Adversary for Object Detection. In Proceedings of the 2017 IEEE Conference on Computer Vision and Pattern Recognition (CVPR), Honolulu, HI, USA, 21–26 July 2017; pp. 3039–3048. [Google Scholar]
- He, G.K.; Zhang, X.; Ren, S.; Sun, J. Spatial pyramid pooling in deep convolutional networks for visual recognition. IEEE Trans. Pattern Anal. Mach. Intell. 2015, 37, 1904–1916. [Google Scholar] [CrossRef] [PubMed] [Green Version]
- Girshick, R.; Donahue, J.; Darrell, T.; Malik, J.; Malik, J. Rich Feature Hierarchies for Accurate Object Detection and Semantic Segmentation. In Proceedings of the 2014 IEEE Conference on Computer Vision and Pattern Recognition, Columbus, OH, USA, 24–27 June 2014; pp. 580–587. [Google Scholar]
- Denton, E.L.; Zaremba, W.; Bruna, J.; LeCun, Y.; Fergus, R. Exploiting linear structure within convolutional networks for efficient evaluation. In Advances in Neural Information Processing Systems; MIT Press: Cambridge, MA, USA, 2014; pp. 1269–1277. [Google Scholar]
- Girshick, R. Fast R-CNN. In Proceedings of the 2015 IEEE International Conference on Computer Vision (ICCV), Las Condes, Chile, 11–18 December 2015; pp. 1440–1448. [Google Scholar]
- Qin, Z.; Kim, D. Rethinking Softmax with Cross-Entropy: Neural Network Classifier as Mutual Information Estimator. 2019. Available online: https://arxiv.org/abs/1911.10688 (accessed on 25 January 2020).
- Heil, J.; Häring, V.; Marschner, B.; Stumpe, B. Advantages of fuzzy k-means over k-means clustering in the classification of diffuse reflectance soil spectra: A case study with West African soils. Geoderma 2019, 337, 11–21. [Google Scholar] [CrossRef]
- Rashid, J.; Shah, S.M.A.; Irtaza, A.; Mahmood, T.; Nisar, M.W.; Shafiq, M.; Gardezi, A. Topic Modeling Technique for Text Mining Over Biomedical Text Corpora through Hybrid Inverse Documents Frequency and Fuzzy K-Means Clustering. IEEE Access 2019, 7, 146070–146080. [Google Scholar] [CrossRef]
- Kauppi, T.; Kalesnykiene, V.; Kamarainen, J.-K.; Lensu, L.; Sorri, I.; Raninen, A.; Voutilainen, R.; Uusitalo, H.; Kalviainen, H.; Pietilä, J. The DIARETDB1 diabetic retinopathy database and evaluation protocol. BMVC 2007, 1, 1–10. [Google Scholar]
- Odstrcilik, J.; Kolar, R.; Kubena, T.; Cernosek, P.; Budai, A.; Hornegger, J.; Gazarek, J.; Svoboda, O.; Jan, J.; Angelopoulou, E. Retinal vessel segmentation by improved matched filtering: Evaluation on a new high-resolution fundus image database. IET Image Process. 2013, 7, 373–383. [Google Scholar] [CrossRef]
- Holm, S.; Russell, G.; Nourrit, V.; McLoughlin, N. DR HAGIS—A fundus image database for the automatic extraction of retinal surface vessels from diabetic patients. J. Med. Imaging 2017, 4, 14503. [Google Scholar] [CrossRef] [Green Version]
- Zhang, Z.Z.; Yin, F.S.; Liu, J.J.; Wong, W.K.; Tan, N.M.; Lee, B.H.; Cheng, J.; Wong, T.Y. ORIGA-light: An online retinal fundus image database for glaucoma analysis and research. In Proceedings of the 2010 Annual International Conference of the IEEE Engineering in Medicine and Biology, Buenos Aires, Argentina, 31 August–4 September 2010; Volume 2010, pp. 3065–3068. [Google Scholar]
- Arafat, Y.; Iqbal, M.J. Urdu-Text Detection and Recognition in Natural Scene Images Using Deep Learning. IEEE Access 2020, 8, 96787–96803. [Google Scholar] [CrossRef]
- Girshick, R.; Donahue, J.; Darrell, T.; Malik, J. Region-Based Convolutional Networks for Accurate Object Detection and Segmentation. IEEE Trans. Pattern Anal. Mach. Intell. 2015, 38, 142–158. [Google Scholar] [CrossRef]
- Gulshan, V.; Peng, L.; Coram, M.; Stumpe, M.C.; Wu, D.; Narayanaswamy, A.; Venugopalan, S.; Widner, K.; Madams, T.; Cuadros, J.; et al. Development and Validation of a Deep Learning Algorithm for Detection of Diabetic Retinopathy in Retinal Fundus Photographs. JAMA 2016, 316, 2402–2410. [Google Scholar] [CrossRef]
- Zhou, L.; Zhao, Y.; Yang, J.; Yu, Q.; Xu, X. Deep multiple instance learning for automatic detection of diabetic retinopathy in retinal images. IET Image Process. 2018, 12, 563–571. [Google Scholar] [CrossRef]
- Kaur, J.; Mittal, D. A generalized method for the segmentation of exudates from pathological retinal fundus images. Biocybern. Biomed. Eng. 2018, 38, 27–53. [Google Scholar] [CrossRef]
- Abbas, Q.; Fondon, I.; Sarmiento, A.; Jiménez, S.; Alemany, P. Automatic recognition of severity level for diagnosis of diabetic retinopathy using deep visual features. Med. Biol. Eng. 2017, 55, 1959–1974. [Google Scholar] [CrossRef] [PubMed]
- Granero, A.C.; Igual, J.; Naranjo, V. Detection of Early Signs of Diabetic Retinopathy Based on Textural and Morphological Information in Fundus Images. Sensors 2020, 20, 1005. [Google Scholar] [CrossRef] [Green Version]
- Li, X.; Hu, X.; Yu, L.; Zhu, L.; Fu, C.-W.; Heng, P. CANet: Cross-Disease Attention Network for Joint Diabetic Retinopathy and Diabetic Macular Edema Grading. IEEE Trans. Med. Imaging 2020, 39, 1483–1493. [Google Scholar] [CrossRef] [Green Version]
- Deepak, K.S.; Medathati, N.K.; Sivaswamy, J. Detection and discrimination of disease-related abnormalities based on learning normal cases. Pattern Recognit. 2012, 45, 3707–3716. [Google Scholar] [CrossRef]
- Medhi, J.P.; Dandapat, S. An effective fovea detection and automatic assessment of diabetic maculopathy in color fundus images. Comput. Biol. Med. 2016, 74, 30–44. [Google Scholar] [CrossRef]
- Lim, S.; Zaki, W.M.D.W.; Hussain, A.; Kusalavan, S.; Lim, S.L. Automatic classification of diabetic macular edema in digital fundus images. In Proceedings of the 2011 IEEE Colloquium on Humanities, Science and Engineering, Penang, Malaysia, 5–6 December 2011; pp. 265–269. [Google Scholar]
- Rahim, S.; Palade, V.; Jayne, C.; Holzinger, A.; Shuttleworth, J. Detection of diabetic retinopathy and maculopathy in eye fundus images using fuzzy image processing. In International Conference on Brain Informatics and Health; Springer: Cham, Switzerland, 2015; pp. 379–388. [Google Scholar]
- Syed, A.M.; Akram, M.; Akram, T.; Muzammal, M.; Khalid, S.; Khan, M.A. Fundus Images-Based Detection and Grading of Macular Edema Using Robust Macula Localization. IEEE Access 2018, 6, 58784–58793. [Google Scholar] [CrossRef]
- Varadarajan, A.V.; Bavishi, P.; Ruamviboonsuk, P.; Chotcomwongse, P.; Venugopalan, S.; Narayanaswamy, A.; Cuadros, J.; Kanai, K.; Bresnick, G.; Tadarati, M.; et al. Predicting optical coherence tomography-derived diabetic macular edema grades from fundus photographs using deep learning. Nat. Commun. 2020, 11, 130–138. [Google Scholar] [CrossRef] [Green Version]
- He, X.; Zhou, Y.; Wang, B.; Cui, S.; Shao, L. DME-Net: Diabetic Macular Edema Grading by Auxiliary Task Learning. In Medical Image Computing and Computer Assisted Intervention—MICCAI 2019. MICCAI 2019; Lecture Notes in Computer Science; Springer: Cham, Switzerland, 2019; Volume 11764, pp. 788–796. [Google Scholar]
- Liao, W.; Zou, B.; Zhao, R.; Chen, Y.; He, Z.; Zhou, M. Clinical Interpretable Deep Learning Model for Glaucoma Diagnosis. IEEE J. Biomed. Health Informatics 2019, 24, 1405–1412. [Google Scholar] [CrossRef]
- Chen, X.; Xu, Y.; Yan, S.; Wong, D.W.K.; Wong, T.Y.; Liu, J. Automatic Feature Learning for Glaucoma Detection Based on Deep Learning. In Proceedings of the Bioinformatics Research and Applications; Springer Science and Business Media LLC: Berlin/Heidelberg, Germany, 2015; pp. 669–677. [Google Scholar]
- Xu, Y.; Lin, S.; Wong, D.W.K.; Liu, J.; Xu, D. Efficient Reconstruction-Based Optic Cup Localization for Glaucoma Screening. In Proceedings of the Computer Vision; Springer Science and Business Media LLC: Berlin/Heidelberg, Germany, 2013; pp. 445–452. [Google Scholar]
- Li, A.; Cheng, J.; Wong, D.W.K.; Liu, J. Integrating holistic and local deep features for glaucoma classification. In Proceedings of the 2016 38th Annual International Conference of the IEEE Engineering in Medicine and Biology Society (EMBC), Orlando, FL, USA, 16–20 August 2016; pp. 1328–1331. [Google Scholar]
- Prakash, N.B.; Selvathi, D. An Efficient Detection System for Screening Glaucoma InRetinal Images. Biomed. Pharmacol. J. 2017, 10, 459–465. [Google Scholar] [CrossRef]
Figure 1.
Framework of the proposed method. In the object detection phase, the ROI for the concerned disease is detected using FRCNN. In the segmentation phase, the detected regions of all three diseases are segmented out through FKM clustering.
Figure 1.
Framework of the proposed method. In the object detection phase, the ROI for the concerned disease is detected using FRCNN. In the segmentation phase, the detected regions of all three diseases are segmented out through FKM clustering.

Figure 2.
Sample annotated images for all three diseases. (a) represents the image annotations for DR signs/objects i.e., microaneurysms, soft exudates, hard exudate, hemorrhages. (b) represents the DME sign (macula) (c) represents the image annotations for Glaucoma i.e., OC and OD.
Figure 2.
Sample annotated images for all three diseases. (a) represents the image annotations for DR signs/objects i.e., microaneurysms, soft exudates, hard exudate, hemorrhages. (b) represents the DME sign (macula) (c) represents the image annotations for Glaucoma i.e., OC and OD.

Figure 3.
Test results of DR.

Figure 4.
Test results of DME.

Figure 5.
Localization results on test images.

Figure 6.
Segmentation results of DR signs.

Figure 7.
DME segmentation Results.

Figure 8.
Segmentation Results (a). input images, (b). localized images, (c). OD segmentation, (d). OD ground truths, (e). OC segmentation, and (f). OC ground truths.
Figure 8.
Segmentation Results (a). input images, (b). localized images, (c). OD segmentation, (d). OD ground truths, (e). OC segmentation, and (f). OC ground truths.

Figure 9.
False detection results.


Table 1.
A comparison of diabetes-based eye diseases methods.
| Reference | Method | Findings | Shortcomings |
|---|---|---|---|
| Pan et al. [15] | The model is based on DenseNet, ResNet50, and VGG16 models | Detection of DR lesions and the method is computationally robust. | The method may not classify microaneurysms efficiently because these are easily misclassified under the pervading presence of fluorescein |
| Zeng et al. [28] | A Siamese-like CNN framework by employing the concept of weigh-sharing layers based on Inception V3. | The work exhibits promising results for DR prediction with kappa score of 0.829. | It may not perform well for those sample databases where paired fundus images are not available. |
| Qummar et al. [14] | Five different frameworks of CNN named Dense169, Inception V3, Resnet50, Dense121, and Xception were employed. | To locate and classify the DR lesions into different classes according to the severity level of moles. | The method suffers from high computational cost. |
| Zhang et al. [40] | A DL framework named DeepDR was presented for DR detection. In addition, a new database for DR labelled DR images was also introduced. | The proposed network has attained the sensitivity value of 97.5%, along with the specificity value of 97.7%. | The introduced model needs to be evaluated on more complex and larger dataset. |
| Torre et al. [41] | A DL based method was used to predict the expected DR class and assign scores to individual pixels to exhibit their relevance in each input sample. The assigned score was employed to take final classification decision. | The introduced DL framework acquired more than 90% of sensitivity and specificity values. | The evaluation performance of the presented algorithm can be improved through appropriate measures. |
| Rekhi et al. [2] | The method was based on geometrical, morphological, and orientation features. The classification was performed through SVM. | Grading and classification of DME from fundus images with an accuracy of 92.11%. | The detection accuracy needs further improvement. |
| Kunwar et al. [5] | The method was based on texture features and the SVM classifier. | high-risk DME detection with accuracy of 86%. | Experiments were performed on small dataset. |
| Marin et al. [30] | The method was based on thresholding and regularized regression techniques. | DME risk detection with 0.90 sensitivity. | The detection performance requires improvement. |
| Perdomo et al. [31] | The presented method was composed of two-stage CNNs | The method detects regions of interest in the retinal image and then predicts its class of DME | The technique is computationally complex. |
| Jiang et al. [32] | The end-to-end Region- based Convolutional Neural Network was used for OD and OC segmentation. | OD and OC segmentation with AUC of 0.901. The method is robust to glaucoma detection. | The method is computationally complex because it employs two separate RCNNs to compute the bboxes of the OC and OD, respectively. |
| Bajwa et al. [37] | The localization was achieved through RCNN, while the other stage used deep CNN to classify the computed disc into glaucomatous or healthy. | Localization and classification of glaucoma with AUC of 0.874. | The method is computationally complex as it takes two-stage framework to localize and classify the glaucoma. The performance is affected by increasing the network hierarchy as it results in losing the discriminative set of features. |
| Zheng Lu et al. [38] | The Modified U-Net model was improved by minimizing the original U-shape structure through adding 2-dimensional convolutional layer. | Before OD segmentation, the ground-truths were generated through the GrabCut method. | The presented technique requires less training, however, shows lower segmentation accuracy as compare latest approaches because of missing ground truths. |
| Ramani et al. [39] | The region-based pixel density calculation method based on Circular Hough Transform with Hough Peak Value Selection and Red Channel Super-pixel method. | The technique is robust and efficient to optic disc segmentation. | The detection accuracy is affected over the images having pathological distractions. |
Table 2.
Classes of eye diseases.
| DR | DME | Glaucoma |
|---|---|---|
| 0. Background 1. Microaneurysms 2. Soft Exudates 3. Hard Exudates 4. Hemorrhages | 0. Background 1. Macula Region | 0. Background 1. OD 2. OC |
Table 3.
Performance comparison of the presented technique with other approaches.
| Technique | mAP |
|---|---|
| SPPnet [44] | 0.85 |
| RCNN [56] | 0.89 |
| FRCNN (Proposed) | 0.94 |
Table 4.
Glaucoma results.
| Dataset | Img1 | Img2 | Img3 | Img4 | Img5 | Img6 | Img7 | Img8 | mAP |
|---|---|---|---|---|---|---|---|---|---|
| HRF | 0.949 | 0.942 | 0.963 | 0.935 | 0.99 | 0.891 | 0.953 | 0.941 | 0.946 |
| DR HAGIS | 0.937 | 0.94 | 0.975 | 0.891 | 0.912 | 0.939 | 0.99 | 0.933 | 0.940 |
| ORIGA | 0.941 | 0.935 | 0.899 | 0.876 | 0.97 | 0.99 | 0.94 | 0.95 | 0.938 |
Table 5.
Performance of Proposed method over Diaredb1 database.
| DR Signs | Acc | SP | SE |
|---|---|---|---|
| Hard Exudates | 0.958 | 0.941 | 0.957 |
| Soft Exudates | 0.943 | 0.961 | 0.955 |
| Micro aneurysms | 0.957 | 0.954 | 0.943 |
| Hemorrhages | 0.952 | 0.96 | 0.951 |
Table 6.
Performance of Proposed method over three databases.
| Database | Acc | Dc | SP | SE |
|---|---|---|---|---|
| HRF | 0.958 | 0.952 | 0.97 | 0.957 |
| DR HAGIS | 0.943 | 0.89 | 0.961 | 0.955 |
| ORIGA | 0.957 | 0.943 | 0.954 | 0.943 |
| Average | 0.9526 | 0.9283 | 0.961 | 0.951 |
Table 7.
Performance comparison against DR detection methods.
| Technique | SP | SE | Acc | AUC |
|---|---|---|---|---|
| Zeng et al. [28] | 0.635 | 0.77 | - | 0.94 |
| Gulshan et al. [57] | 0.91 | - | 0.913 | 0.96 |
| Zhou et al. [58] | 0.863 | 0.995 | - | - |
| Kaur et al. [59] | 0.96 | 0.88 | 0.93 | - |
| Colomer et al. [61] | 0.818 | 0.81 | 0.93 | - |
| Abbas et al. [60] | 0.94 | 0.92 | - | 0.92 |
| Proposed | 0.965 | 0.961 | 0.95 | 0.967 |
Table 8.
Performance comparison against DME detection methods over MESSIDOR dataset.
| Method | SE | SP | Acc |
|---|---|---|---|
| Li et al. [62] | 0.70 | 0.76 | 0.912 |
| Deepak et al. [63] | 0.95 | 0.90 | - |
| Medhi et al. [64] | 0.95 | 0.95 | - |
| Rekhi et al. [2] | - | - | 0.921 |
| Lim et al. [65] | 0.80 | 0.90 | - |
| Rahim et al. [66] | 0.85 | 0.55 | - |
| Syed et al. [67] | 0.96 | 0.95 | 0.935 |
| Varadarajan et al. [68] | 0.85 | 0.80 | - |
| Xiaodong et al. [69] | 0.959 | 0.97 | - |
| Proposed | 0.96 | 0.958 | 0.958 |
Table 9.
Performance comparison of the Proposed Method with latest techniques.
| Method | Year | Dataset | SE | SP | AUC | Dc | Time |
|---|---|---|---|---|---|---|---|
| Liao et al. [70] | 2019 | ORIGA | - | - | 0.88 | 0.9 | - |
| Chen et al. [71] | 2015 | ORIGA | - | - | 0.838 | - | - |
| Xu et al. [72] | 2013 | ORIGA | 0.58 | - | 0.823 | - | - |
| Li et al. [73] | 2016 | ORIGA | - | - | 0.8384 | - | - |
| Bajwa et al. [37] | 2019 | ORIGA | 0.71 | - | 0.868 | - | - |
| Ramani et al. [39] | 2020 | HRF | 0.849 | 0.999 | - | - | 1.49 s |
| N.B Parakash et al. [74] | 2017 | HRF | 0.7025 | 0.997 | - | - | - |
| Krishna et al. [12] | 2019 | DR HAGIS | 0.94 | - | - | - | - |
| Proposed | ORIGA | 0.941 | 0.945 | 0.94 | 0.943 | 0.9 s | |
| HRF | 0.95 | 0.96 | 0.963 | 0.952 | 0.9 s | ||
| DR HAGIS | 0.945 | 0.941 | 0.94 | 0.89 | 0.9 s |
© 2020 by the authors. Licensee MDPI, Basel, Switzerland. This article is an open access article distributed under the terms and conditions of the Creative Commons Attribution (CC BY) license (http://creativecommons.org/licenses/by/4.0/).
Share and Cite
MDPI and ACS Style
Nazir, T.; Irtaza, A.; Javed, A.; Malik, H.; Hussain, D.; Naqvi, R.A. Retinal Image Analysis for Diabetes-Based Eye Disease Detection Using Deep Learning. Appl. Sci. 2020, 10, 6185. https://0-doi-org.brum.beds.ac.uk/10.3390/app10186185
AMA Style
Nazir T, Irtaza A, Javed A, Malik H, Hussain D, Naqvi RA. Retinal Image Analysis for Diabetes-Based Eye Disease Detection Using Deep Learning. Applied Sciences. 2020; 10(18):6185. https://0-doi-org.brum.beds.ac.uk/10.3390/app10186185
Chicago/Turabian StyleNazir, Tahira, Aun Irtaza, Ali Javed, Hafiz Malik, Dildar Hussain, and Rizwan Ali Naqvi. 2020. "Retinal Image Analysis for Diabetes-Based Eye Disease Detection Using Deep Learning" Applied Sciences 10, no. 18: 6185. https://0-doi-org.brum.beds.ac.uk/10.3390/app10186185
Note that from the first issue of 2016, this journal uses article numbers instead of page numbers. See further details here.