Osmotic Dehydration for the Production of Novel Pumpkin Cut Products of Enhanced Nutritional Value and Sustainability

Abstract
:Featured Application
Abstract
1. Introduction
2. Materials and Methods
2.1. Raw Materials
2.2. Osmotic Dehydration (OD) Processing
2.3. Mass Transfer Calculations
2.4. Reference OD Processing Conditions
2.5. Quality Monitoring of OD-Processed Pumpkin during Refrigerated Storage
2.5.1. Color
2.5.2. Texture
2.5.3. Sensory Analysis
2.5.4. Vitamin C
2.5.5. Microbiological Analysis
2.5.6. Kinetic Modelling
2.6. Statistical Analysis
3. Results
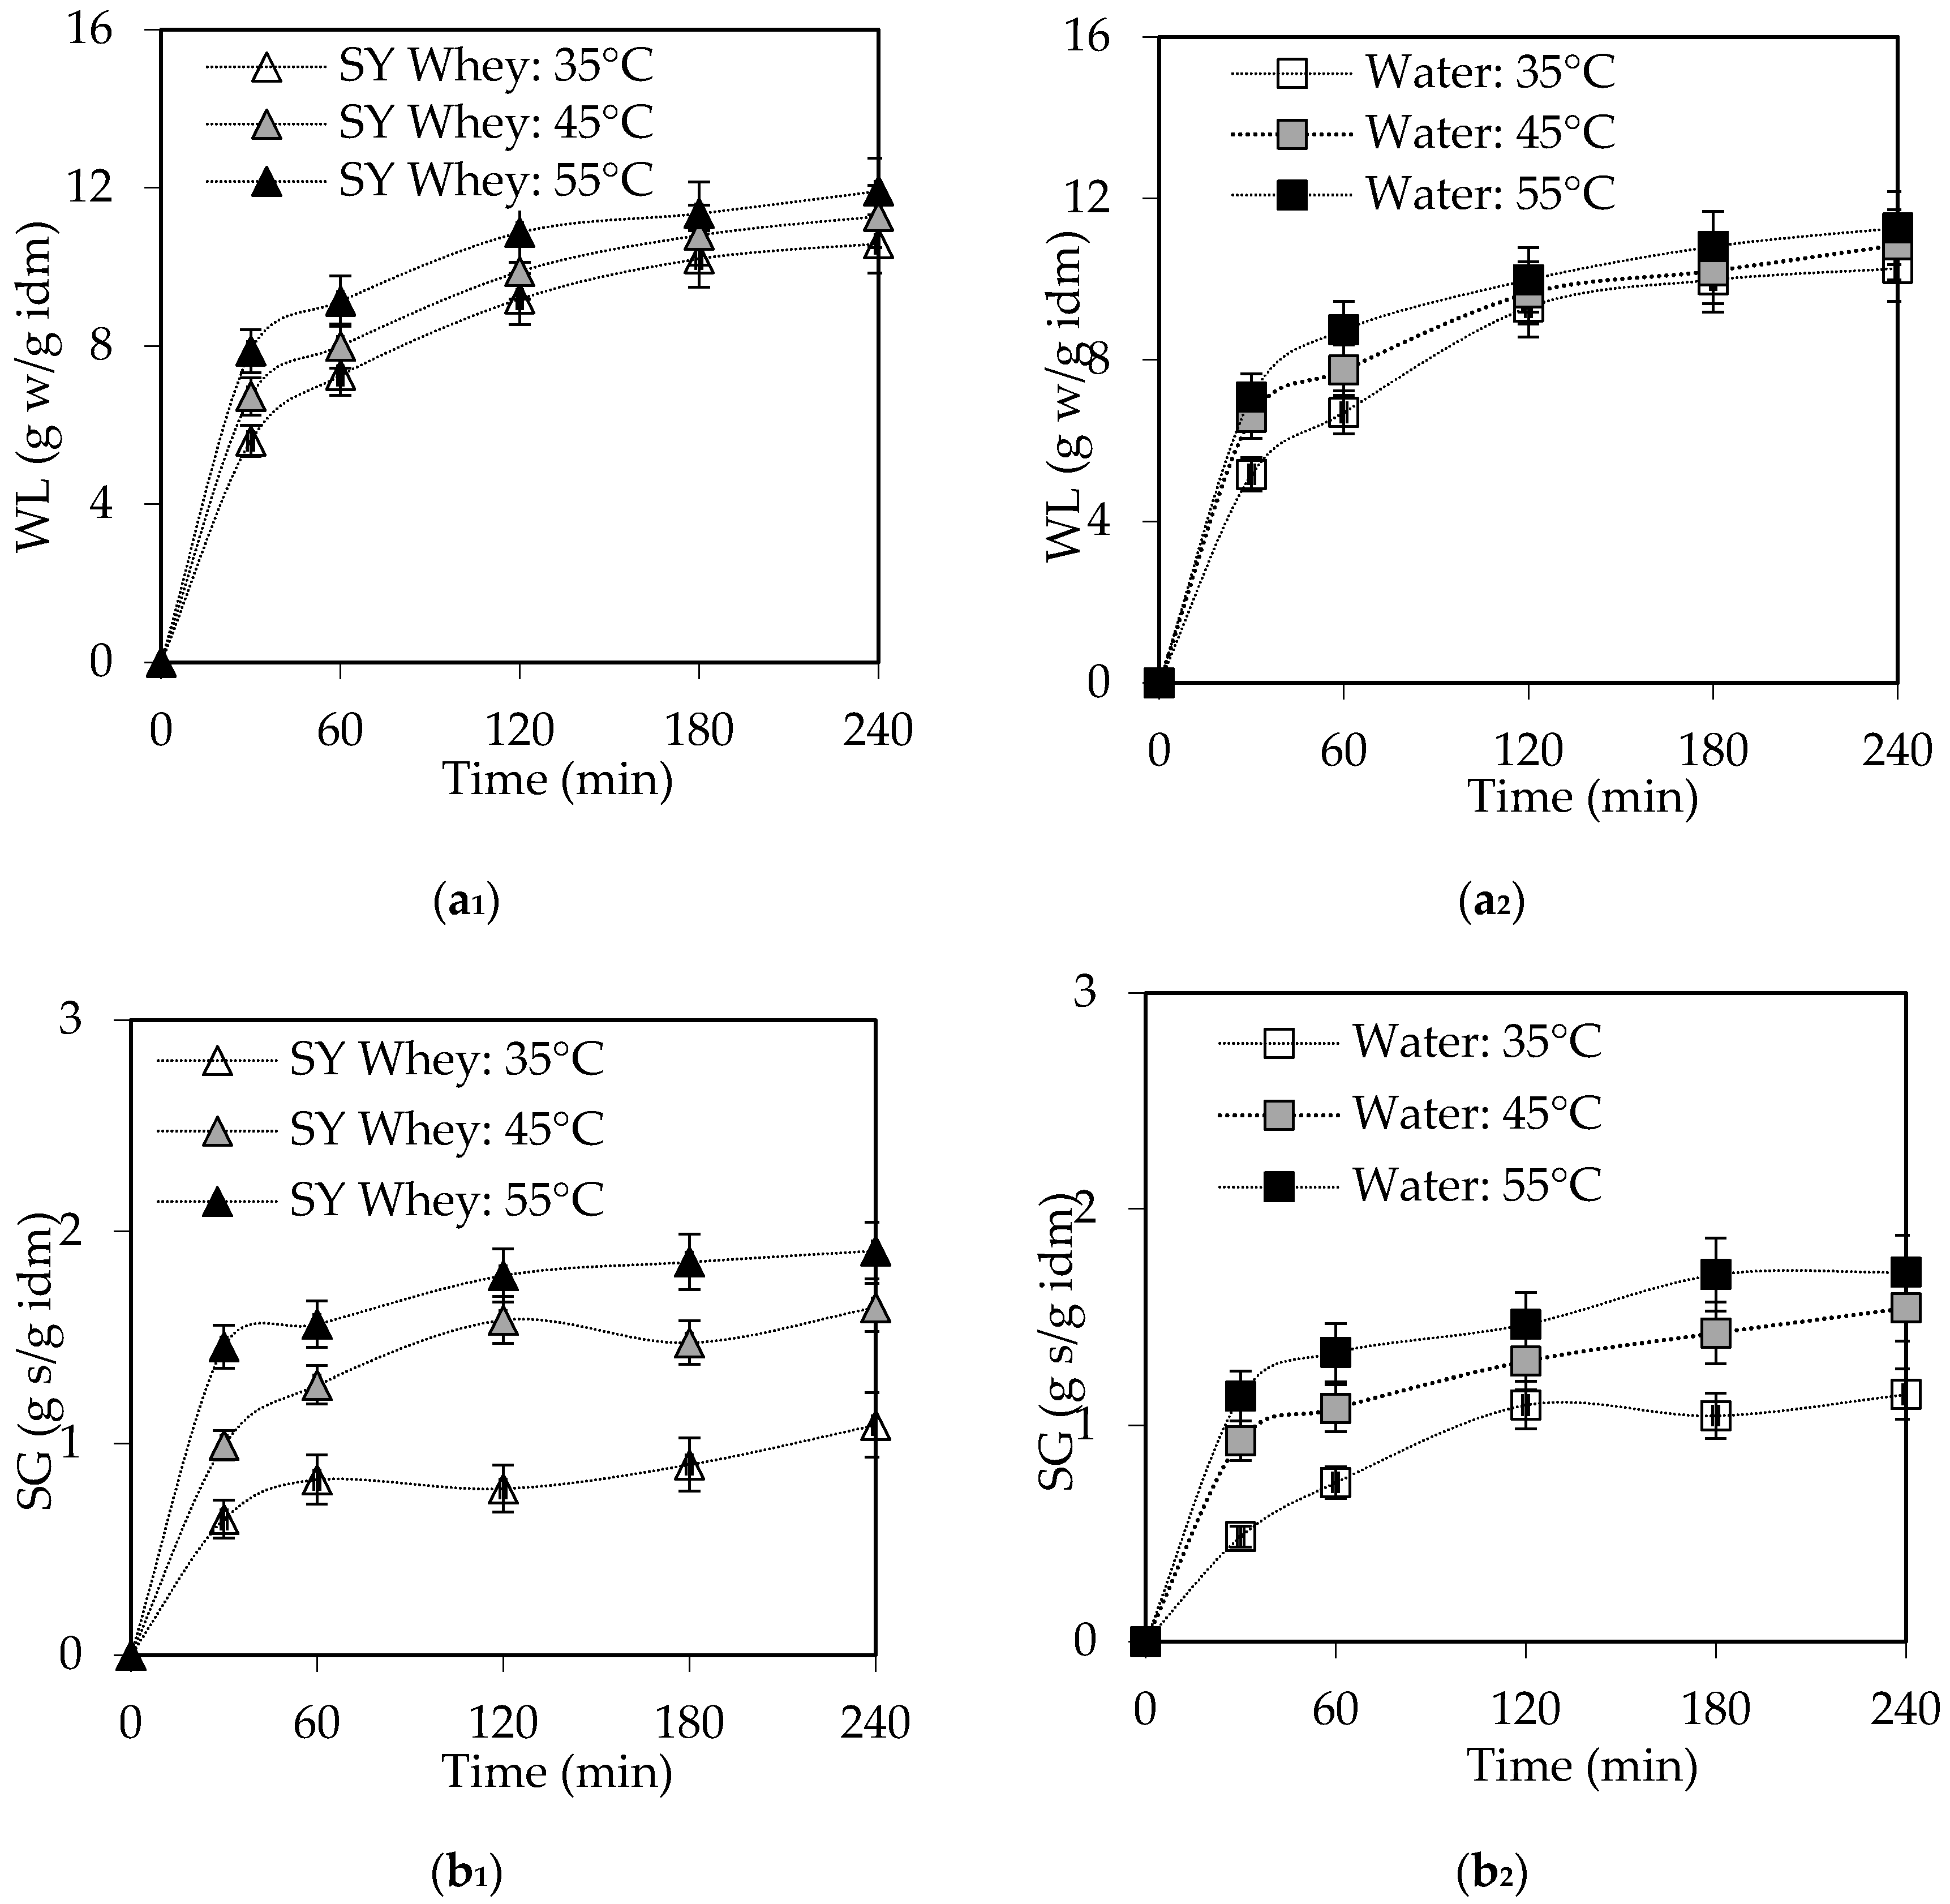
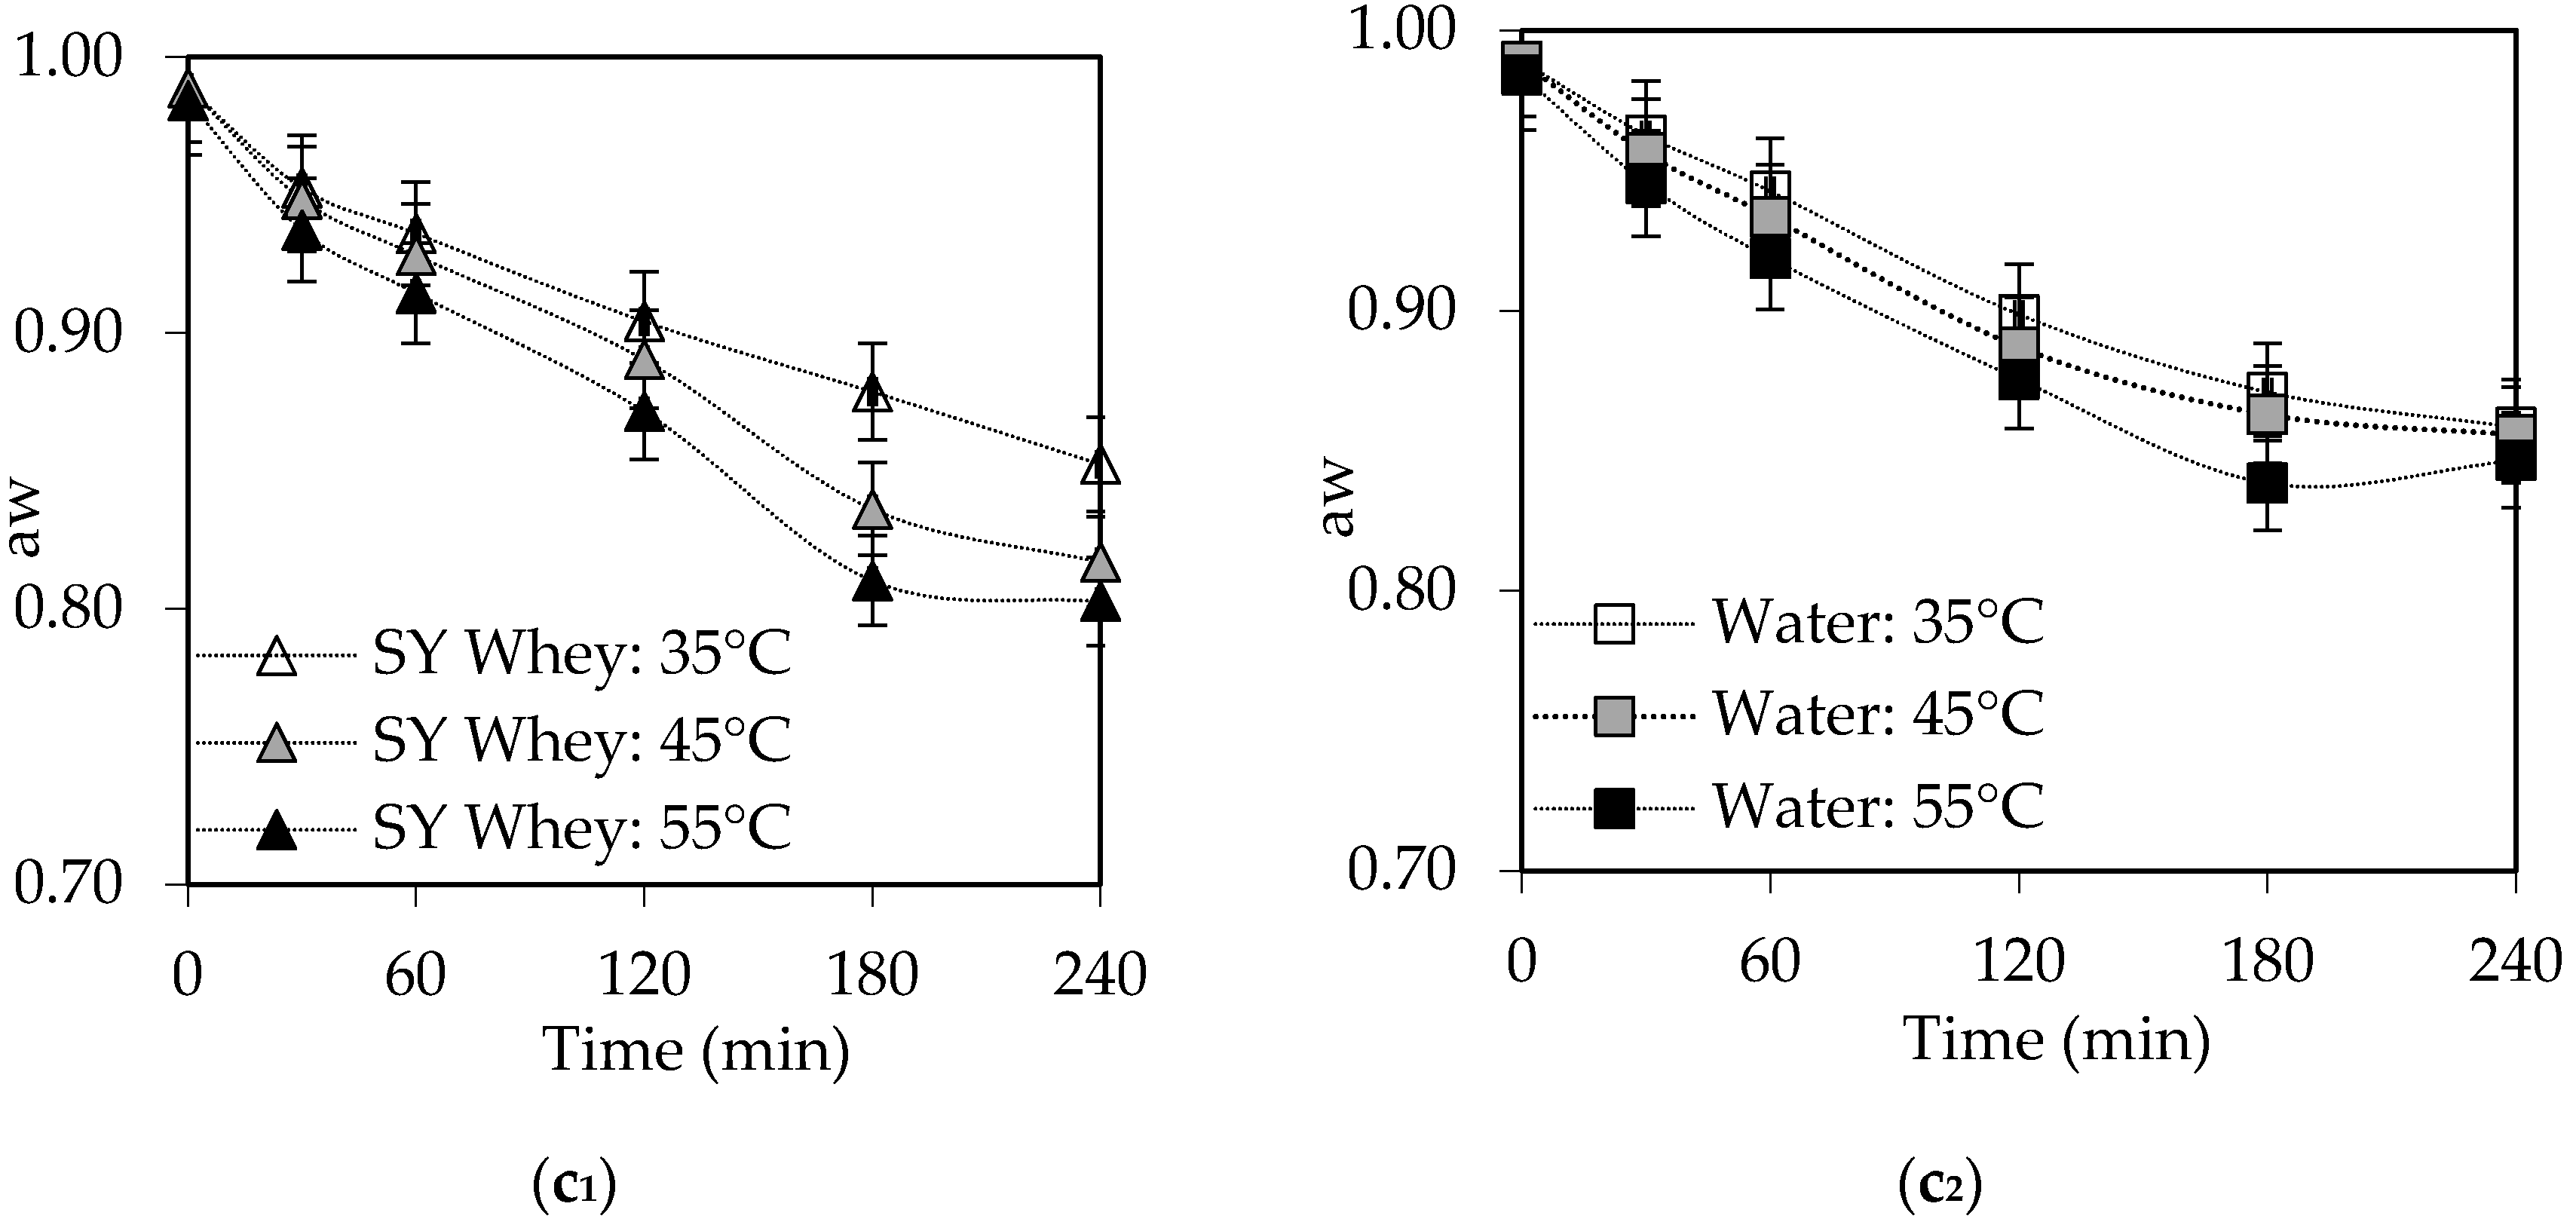
3.1. Mass Transfer and Water Activity Decrease during OD Processing
3.2. Selection of the Reference Osmotic Dehydration Conditions
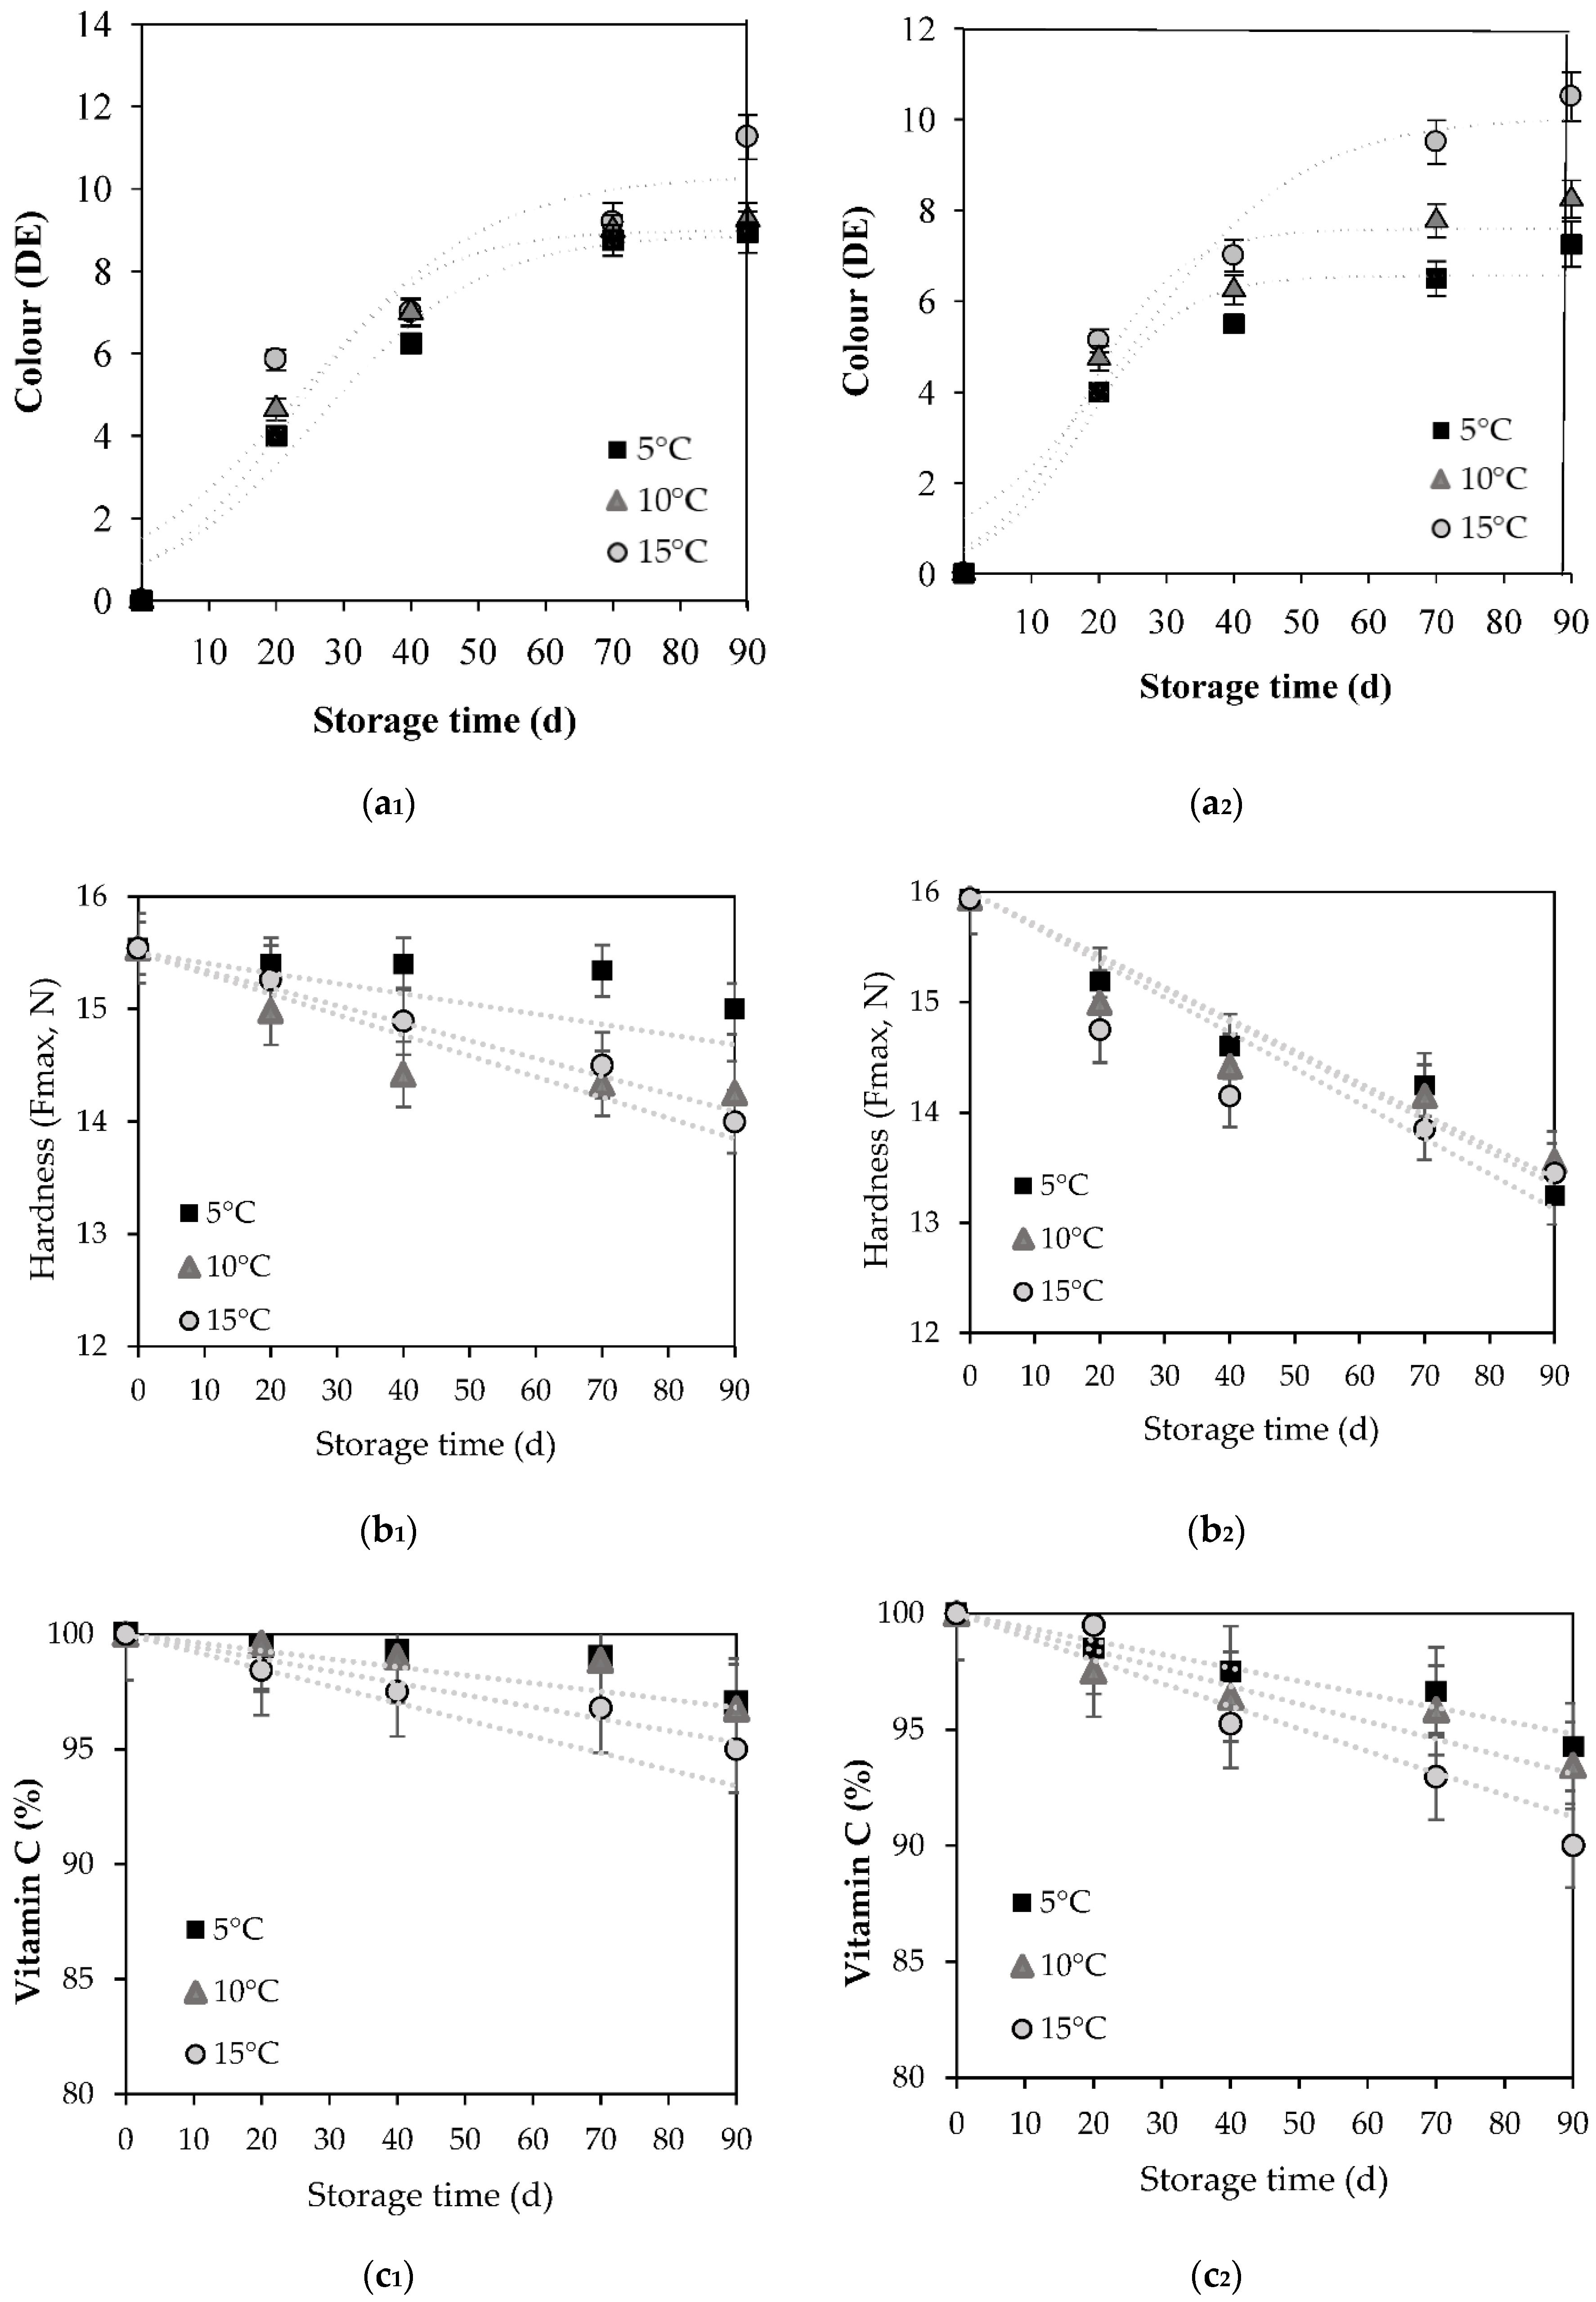
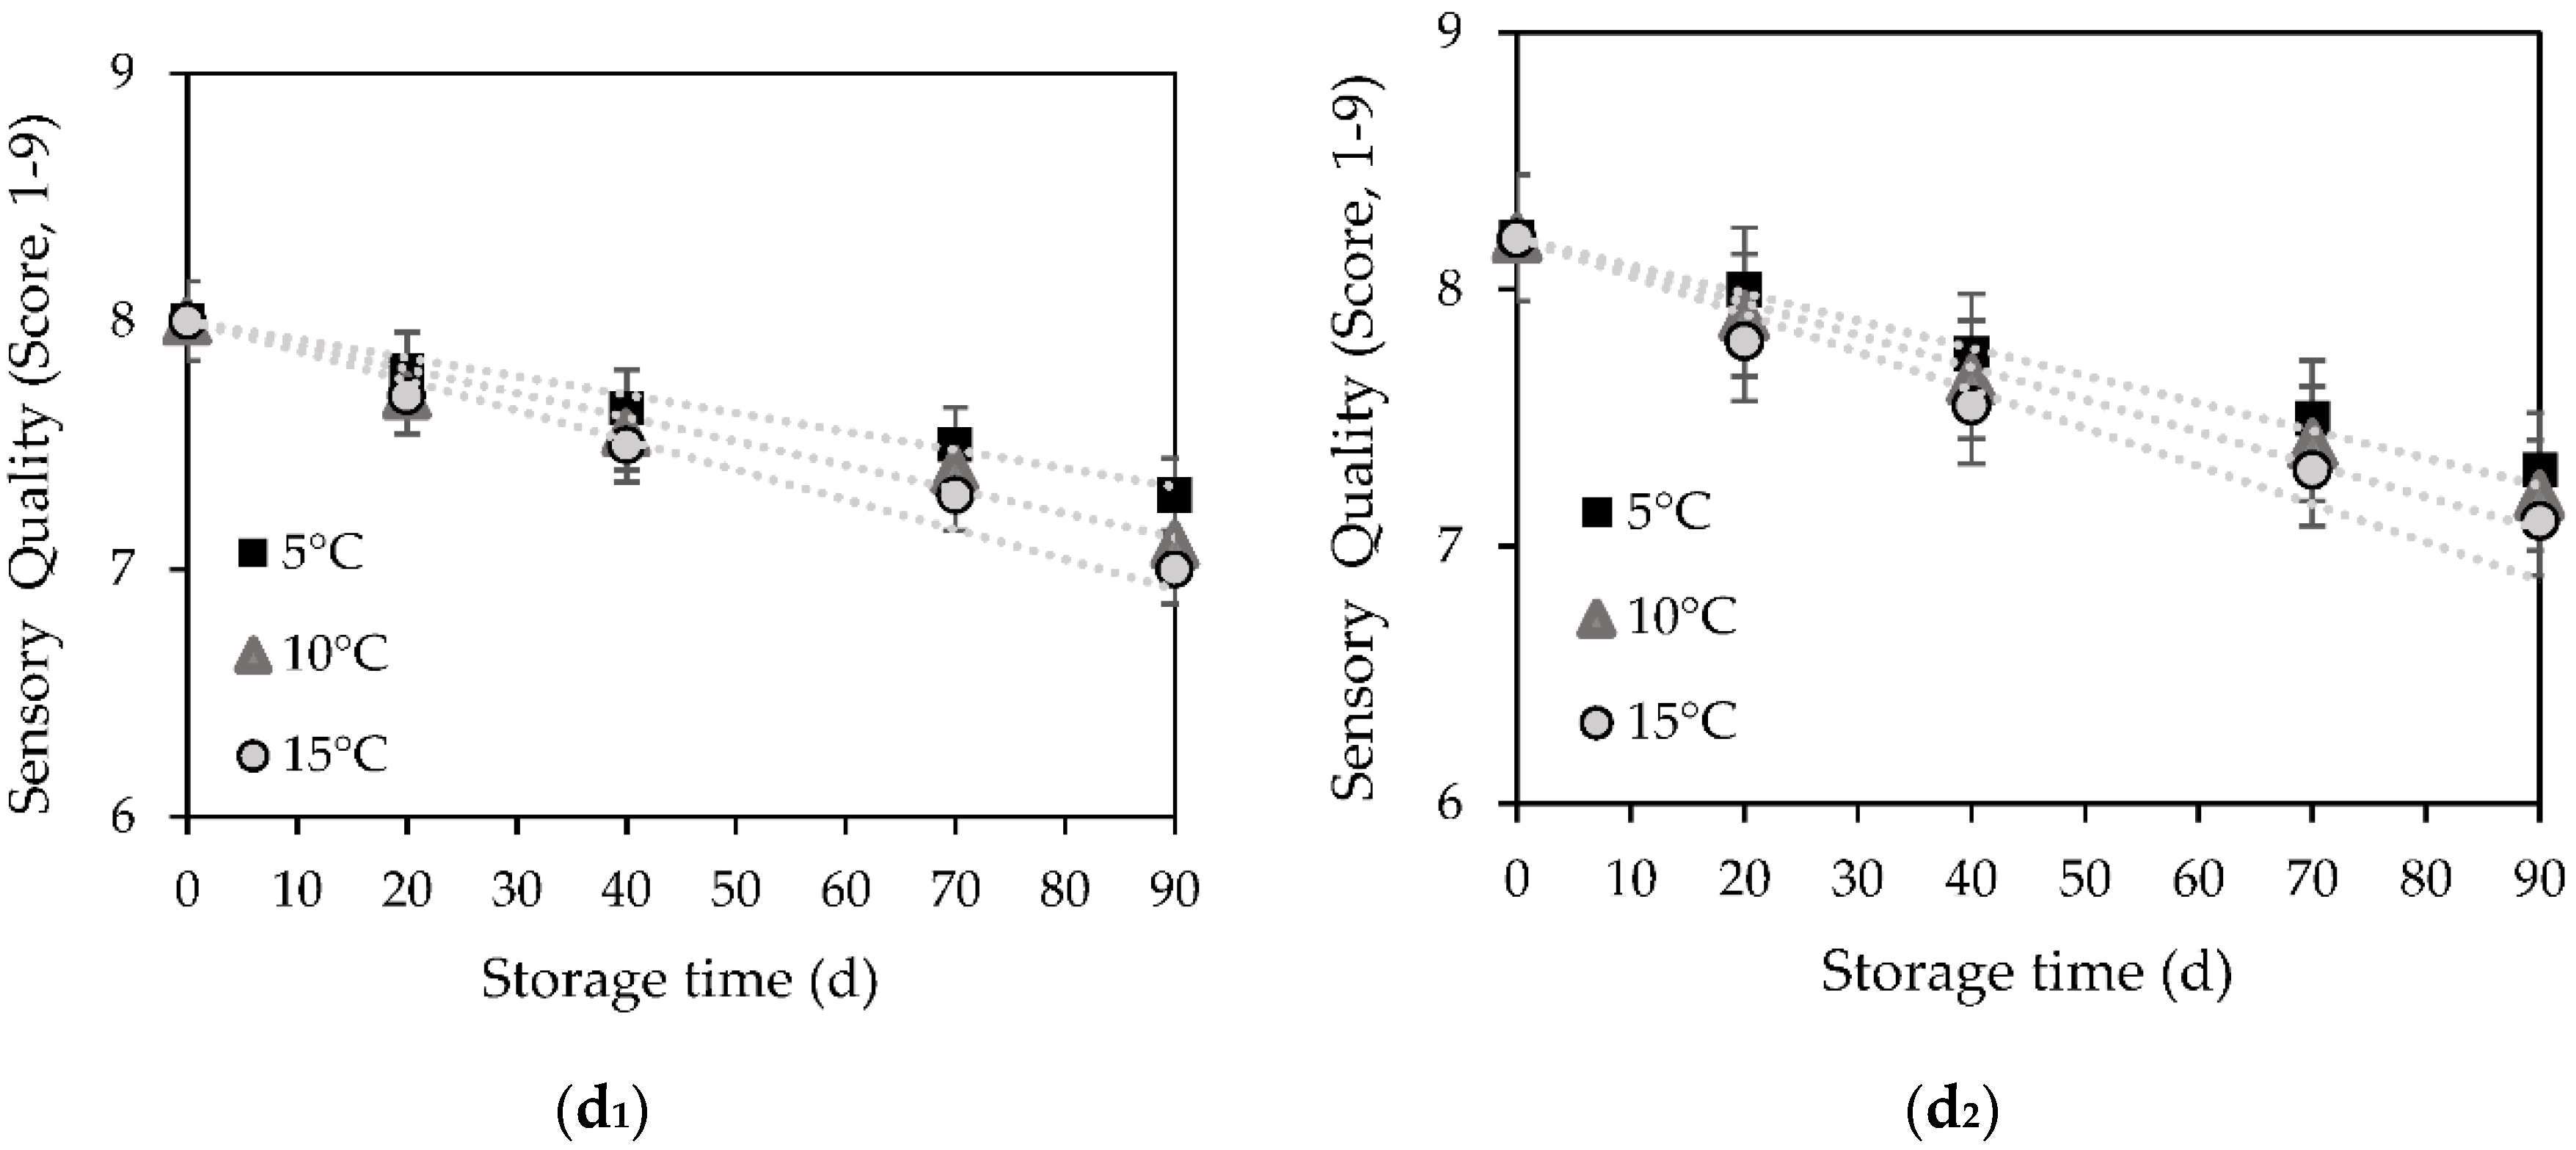
3.3. Quality and Sensory Characteristics of Osmotically Dehydrated Pumpkin
3.4. Microbial Growth during Cold Storage
4. Discussion
4.1. Mass Transfer and Water Activity Decrease during OD Processing
4.2. Quality and Sensory Characteristics of Osmotically Dehydrated Pumpkin
4.2.1. Color Change during Cold Storage
4.2.2. Textural Changes during Cold Storage
4.2.3. Vitamin C Loss during Cold Storage
4.2.4. Sensory Evaluation during Cold Storage
4.2.5. Microbial Growth during Cold Storage
5. Conclusions
Author Contributions
Funding
Conflicts of Interest
References
- Smithers, G.W. Whey-ing up the options—Yesterday, today and tomorrow. Int. Dairy J. 2015, 48, 2–14. [Google Scholar] [CrossRef]
- Flinois, J.C.; Dando, R.; Padilla-Zakour, O.I. Effects of replacing buttermilk with yogurt acid whey in ranch dressing. J. Dairy Sci. 2019, 102, 7874–7883. [Google Scholar] [CrossRef] [PubMed] [Green Version]
- Fischer, C.; Kleinschmidt, T. Synthesis of galactooligosaccharides using sweet and acid whey as a substrate. Int. Dairy J. 2015, 48, 15–22. [Google Scholar] [CrossRef]
- Hourigan, J.A.; Lifran, E.V.; Vu, L.T.T.; Listiohadi, Y.; Sleigh, R.W. Lactose: Chemistry, processing and utilization. In Advances in Dairy Ingredients; Smithers, G.W., Augustin, M.A., Eds.; Wiley-Blackwell: Ames, IA, USA, 2013; pp. 31–69. [Google Scholar]
- Pázmándi, M.; Maráz, A.; Ladányi, M.; Kovács, Z. The impact of membrane pretreatment on the enzymatic production of whey-derived galacto-oligosaccharides. J. Food Process Eng. 2017, 41, e12649. [Google Scholar] [CrossRef]
- Paraman, I.; Sharif, M.K.; Supriyadi, S.; Rizvi, S.S.H. Agro-food industry byproducts into value-added extruded foods. Food Bioprod. Process. 2015, 96, 78–85. [Google Scholar] [CrossRef] [Green Version]
- Ramya, V.; Jain, N.K. A Review on Osmotic Dehydration of Fruits and Vegetables: An Integrated Approach. J. Food Process Eng. 2016, 40, e12440. [Google Scholar] [CrossRef]
- Ciurzynska, A.; Kowalska, H.; Czajkowska, K.; Lenart, A. Osmotic dehydration in production of sustainable and healthy food. Trends Food Sci. Technol. 2016, 50, 186–192. [Google Scholar] [CrossRef]
- Ahmed, I.; Mabood Qazi, I.; Jamal, S. Developments in osmotic dehydration technique for the preservation of fruits and vegetables. Innov. Food Sci. Emerg. Technol. 2016, 34, 29–43. [Google Scholar] [CrossRef]
- Giannakourou, M.S.; Dermesonlouoglou EKTaoukis, P.S. Osmodehydrofreezing: An Integrated Process for Food Preservation during Frozen Storage. Foods 2020, 9, 1042. [Google Scholar] [CrossRef]
- James, C.; Purnell GJames, S.J. A Critical Review of Dehydrofreezing of Fruits and Vegetables. Food Bioprocess Technol. 2014, 7, 1219–1234. [Google Scholar] [CrossRef]
- Brochier, B.; Marczak, L.D.F.; Noreña, C.P.Z. Osmotic Dehydration of Yacon Using Glycerol and Sorbitol as Solutes: Water Effective Diffusivity Evaluation. Food Bioprocess Technol. 2015, 8, 623–636. [Google Scholar] [CrossRef]
- Chaguri, L.; Sanchez, M.S.; Flammia, V.P.; Tadini, C.C. Green Banana (Musa cavendishii) Osmotic Dehydration by Non-Caloric Solutions: Modeling, Physical-Chemical Properties, Color, and Texture. Food Bioprocess Technol. 2017, 10, 615–629. [Google Scholar] [CrossRef]
- Dermesonlouoglou, E.; Bimpilas, A.; Andreou, V.; Katsaros, G.J.; Giannakourou, M.C.; Taoukis, P.S. Process optimization and kinetic modeling of quality of fresh-cut strawberry cubes pretreated by high pressure and osmosis. J. Food Process. Preserv. 2016, 41, e13137. [Google Scholar] [CrossRef]
- Dermesonlouoglou, E.K.; Zachariou, I.; Andreou, V.; Taoukis, P.S. Effect of pulsed electric fields on mass transfer and quality of osmotically dehydrated kiwifruit. Food Bioprod. Process. 2016, 100, 535–554. [Google Scholar] [CrossRef]
- Dermesonlouoglou, E.K.; Angelikaki, F.; Giannakourou, M.C.; Katsaros, G.J.; Taoukis, P.S. Minimally Processed Fresh-Cut Peach and Apricot Snacks of Extended Shelf-Life by Combined Osmotic and High Pressure Processing. Food Bioprocess Technol. 2018, 1–16. [Google Scholar] [CrossRef]
- Thalerngnawachart, S.; Duangmal, K. Influence of humectants on the drying kinetics, water mobility, and moisture sorption isotherm of osmosed air-dried papaya. Dry. Technol. 2016, 34, 574–583. [Google Scholar] [CrossRef]
- Angilelli, K.G.; Orives, J.R.; da Silva, H.C.; Coppo, R.L.; Moreira, I.; Borsato, D. Multicomponent Diffusion during Osmotic Dehydration Process in Melon Pieces: Influence of Film Coefficient. J. Food Process. Preserv. 2015, 39, 329–337. [Google Scholar] [CrossRef]
- Dermesonlouoglou, E.K.; Giannakourou, M.C.; Taoukis, P.S. Kinetic modelling of the degradation of quality of osmo-dehydrofrozen tomatoes during storage. Food Chem. 2007, 103, 985–993. [Google Scholar] [CrossRef]
- Matusek, A.; Czukor, B.; Meresz, P. Comparison of sucrose and fructo-oligosaccharides as osmotic agents in apple. Innov. Food Sci. Emerg. Technol. 2008, 9, 365–373. [Google Scholar] [CrossRef]
- Rubio-Arraez, S.; Capella, J.V.; Ortolá, M.D.; Castelló, M.L. Modelling osmotic dehydration of lemon slices using new sweeteners. Int. J. Food Sci. Technol. 2015, 50, 2046–2051. [Google Scholar] [CrossRef]
- Ferrando, M.; Spiess, W.E.L. Cellular response of plant tissue during the osmotic treatment with sucrose, maltose and trehalose solutions. J. Food Eng. 2001, 49, 115–127. [Google Scholar] [CrossRef]
- Gibson, G.R.; Probert, H.M.; Loo, J.V.; Rastall, R.A.; Roberfroid, M.B. Dietary modulation of the human colonic microbiota: Updating the concept of prebiotics. Nutr. Res. Rev. 2004, 17, 259–275. [Google Scholar] [CrossRef] [PubMed] [Green Version]
- Montesano, D.; Rocchetti, G.; Putnik, P.; Lucini, L. Bioactive profile of pumpkin: An overview on terpenoids and their health-promoting properties. Curr. Opin. Food Sci. 2018, 22, 81–87. [Google Scholar] [CrossRef]
- Seremet, L.; Botez, E.; Nistor, O.V.; Andronoiu, D.G.; Mocanu, G.D. Effect of different drying methods on moisture ratio and rehydration of pumpkin slices. Food Chem. 2016, 195, 104–109. [Google Scholar] [CrossRef] [PubMed]
- Monteiro, R.L.; Link, J.V.; Tribuzi, G.; Carciofi, B.A.M.; Laurindo, J.B. Effect of multi-flash drying and microwave vacuum drying on the microstructure and texture of pumpkin slices. LWT-Food Sci. Technol. 2018, 96, 612–619. [Google Scholar] [CrossRef]
- Tunde-Akintunde, T.Y.; Ogunlakin, G.O. Influence of drying conditions on the effective moisture diffusivity and energy requirements during the drying of pretreated and untreated pumpkin. Energy Convers. Manag. 2011, 52, 1107–1113. [Google Scholar] [CrossRef]
- Abraao, A.S.; Lemos, A.M.; Vilela, A.; Sousa, J.M.; Nunes, F.M. Influence of osmotic dehydration process parameters on the quality of candied pumpkins. Food Bioprod. Process. 2013, 91, 481–494. [Google Scholar] [CrossRef]
- Correa, J.L.; Ernesto, D.B.; Alves, J.G.; Andrade, R.S. Optimisation of vacuum pulse osmotic dehydration of blanched pumpkin. Int. J. Food Sci. Technol. 2014, 49, 2008–2014. [Google Scholar] [CrossRef]
- de Souza Silva, K.; Caetano, L.C.; Garcia, C.C.; Romero, J.T.; Santos, A.B.; Mauro, M.A. Osmotic dehydration process for low temperature blanched pumpkin. J. Food Eng. 2011, 105, 56–64. [Google Scholar] [CrossRef]
- Derossi, A.; De Pilli, T.; Giuliani, R.; Orlando, I.; Palmieri, L.; Severini, C. Study on prestabilization of pumpkin (Cucurbita moschata) by osmotic dehydration in quaternary complex solution. J. Food Process Eng. 2011, 34, 398–413. [Google Scholar] [CrossRef]
- Lech, K.; Michalska, A.; Wojdyło, A.; Nowicka, P.; Figiel, A. The influence of physical properties of selected plant materials on the process of osmotic dehydration. LWT-Food Sci. Technol. 2018, 91, 588–594. [Google Scholar] [CrossRef]
- Mayor, L.; Moreira, R.; Chenlo, F.; Sereno., A.M. Kinetics of osmotic dehydration of pumpkin with sodium chloride solutions. J. Food Eng. 2006, 74, 253–262. [Google Scholar] [CrossRef]
- Mayor, L.; Moreira, R.; Sereno, A.M. Shrinkage, density, porosity and shape changes during dehydration of pumpkin (Cucurbita pepo L.) fruits. J. Food Eng. 2011, 103, 29–37. [Google Scholar] [CrossRef]
- Dermesonlouoglou, E.K.; Giannakourou, M.C. Modelling dehydration of apricot in a non-conventional multi-component osmotic solution: Effect on mass transfer kinetics and quality characteristics. J. Food Sci. Technol. 2018, 55, 4079–4089. [Google Scholar] [CrossRef]
- Dermesonlouoglou, E.K.; Giannakourou, M.C. Evaluation and modelling of osmotic pre-treatment of peach using alternative agents in a multiple-component solution. J. Sci. Food Agric. 2019, 99, 1240–1249. [Google Scholar] [CrossRef]
- Rastogi, N.K.; Raghavarao, K.S.M.S. Kinetics of osmotic dehydration of coconut. J. Food Process Eng. 1995, 18, 187–197. [Google Scholar] [CrossRef]
- Rastogi, N.K.; Raghavarao, K.S.M.S. Water and solute diffusion coefficients of carrot as a function of temperature and concentration during osmotic dehydration. J. Food Eng. 1997, 34, 429–440. [Google Scholar] [CrossRef]
- Nishinari, K.; Kohyama, K.; Kumagai, H.; Funami, T.; Bourne, M.C. Parameters of Texture Profile Analysis. Food Sci. Technol. Res. 2013, 19, 519–521. [Google Scholar] [CrossRef] [Green Version]
- Dermesonlouoglou, E.K.; Zachariou, I.; Andreou, V.; Taoukis, P.S. Quality assessment and shelf life modeling of pulsed electric field pretreated osmodehydrofrozen kiwifruit slices. Int. J. Food Stud. 2018, 7, 34–51. [Google Scholar] [CrossRef]
- Giannakourou, M.C.; Taoukis, P.S. Stability of dehydrofrozen green peas pretreated with nonconventional osmotic agents. J. Food Sci. 2003, 68, 2002–2010. [Google Scholar] [CrossRef]
- Pękosławska, A.; Lenart, A. Osmotic dehydration of pumpkin in starch syrup. J. Fruit Ornam. Plant Res. 2009, 17, 107–113. [Google Scholar]
- Parniakov, O.; Bals, O.; Lebovka, N.; Vorobiev, E. Effects of electric field assisted osmotic dehydration on freezing-thawing and texture of apple tissue. J. Food Eng. 2016, 183, 32–38. [Google Scholar] [CrossRef]
- Assis, F.R.; Morais, R.M.S.C.; Morais, A.M.M.B. Osmotic dehydration with sorbitol combined with hot air convective drying of apple cubes. J. Food Sci. Technol. 2017, 54, 3152–3160. [Google Scholar] [CrossRef] [PubMed]
- Lazou, A.E.; Dermesonlouoglou, E.K.; Giannakourou, M.C. Modeling and Evaluation of the Osmotic Pretreatment of Tomatoes (S. lycopersicum) with Alternative Sweeteners for the Production of Candied Products. Food Bioprocess Technol. 2020, 13, 948–996. [Google Scholar] [CrossRef]
- Rocha, A.M.C.N.; Morais, A.M.M.B. Shelf life of minimally processed apple (cv. Jonagored) determined by color changes. Food Control 2003, 14, 13–20. [Google Scholar] [CrossRef]
- Barbagallo, R.N.; Chisari, M.; Caputa, G. Effects of calcium citrate and ascorbate as inhibitors of browning and softening in minimally processed ‘Birgah’ eggplants. Postharvest Biol. Technol. 2012, 73, 107–114. [Google Scholar] [CrossRef]
- Dermesonlouoglou, E.K.; Pourgouri, S.; Taoukis, P.S. Kinetic study of the effect of the osmotic dehydration pre-treatment to the shelf life of frozen cucumber. Innov. Food Sci. Emerg. Technol. 2008, 9, 542–549. [Google Scholar] [CrossRef]


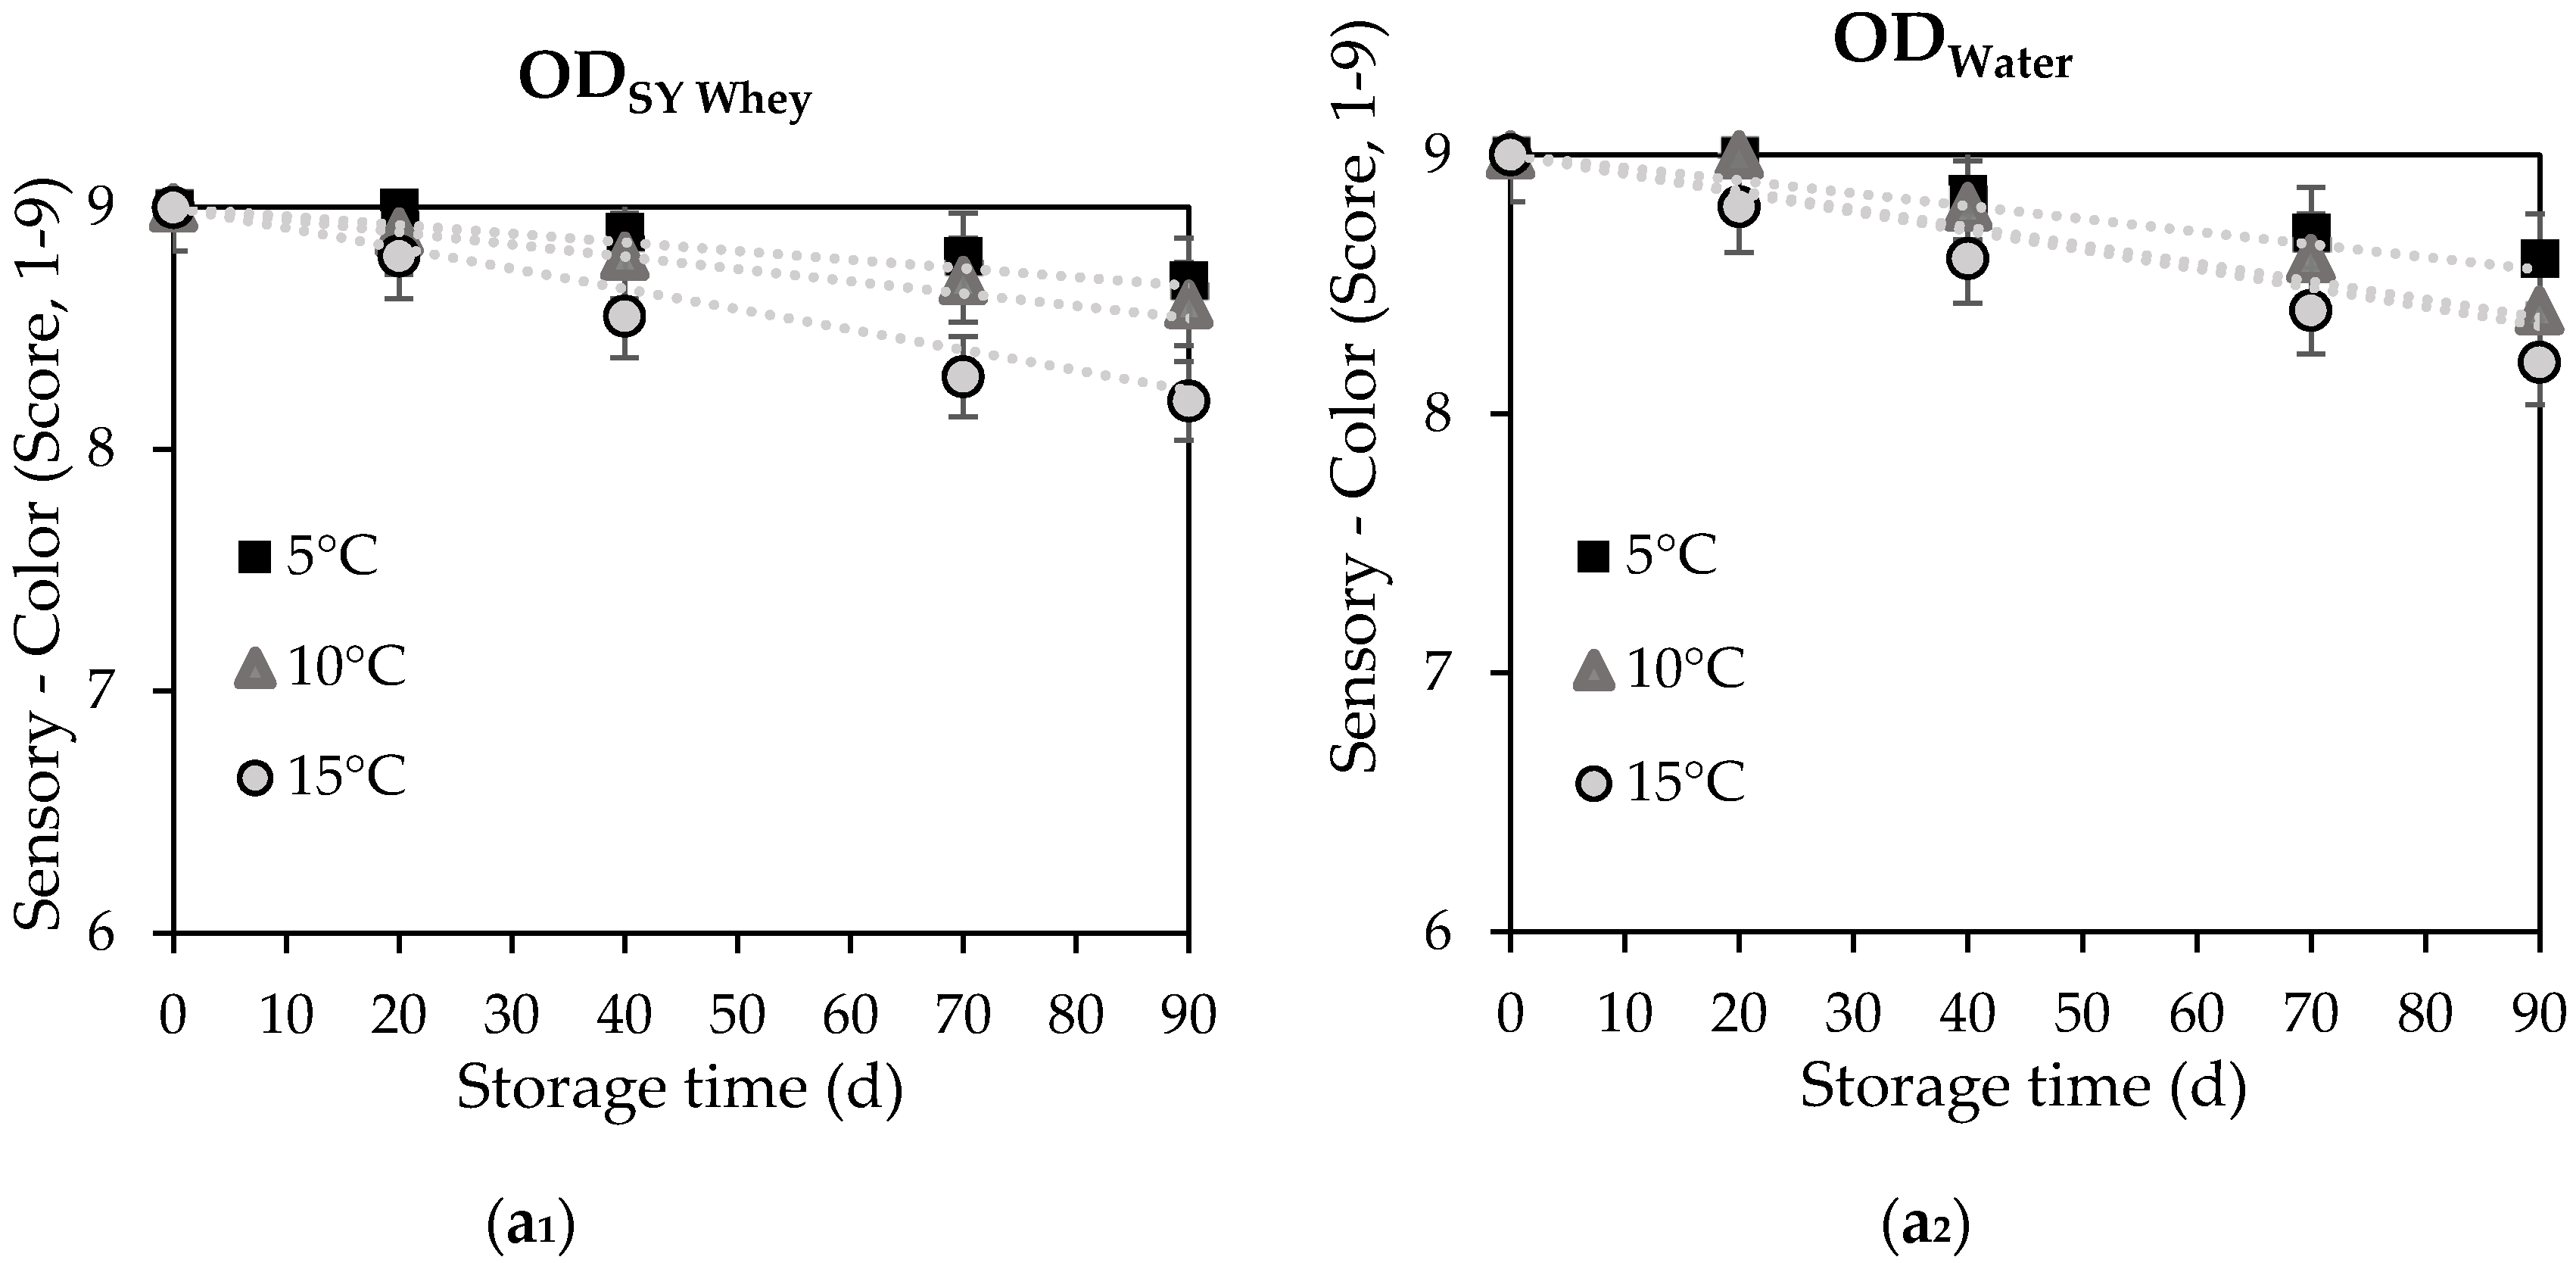
 ) 5 °C, (
  ) 10 °C, (
  ) 15 °C; lines represent the respective model fit.
) 5 °C, ( ) 10 °C, ( ) 15 °C; lines represent the respective model fit.
) 15 °C; lines represent the respective model fit.
) 5 °C, ( ) 10 °C, ( ) 15 °C; lines represent the respective model fit.


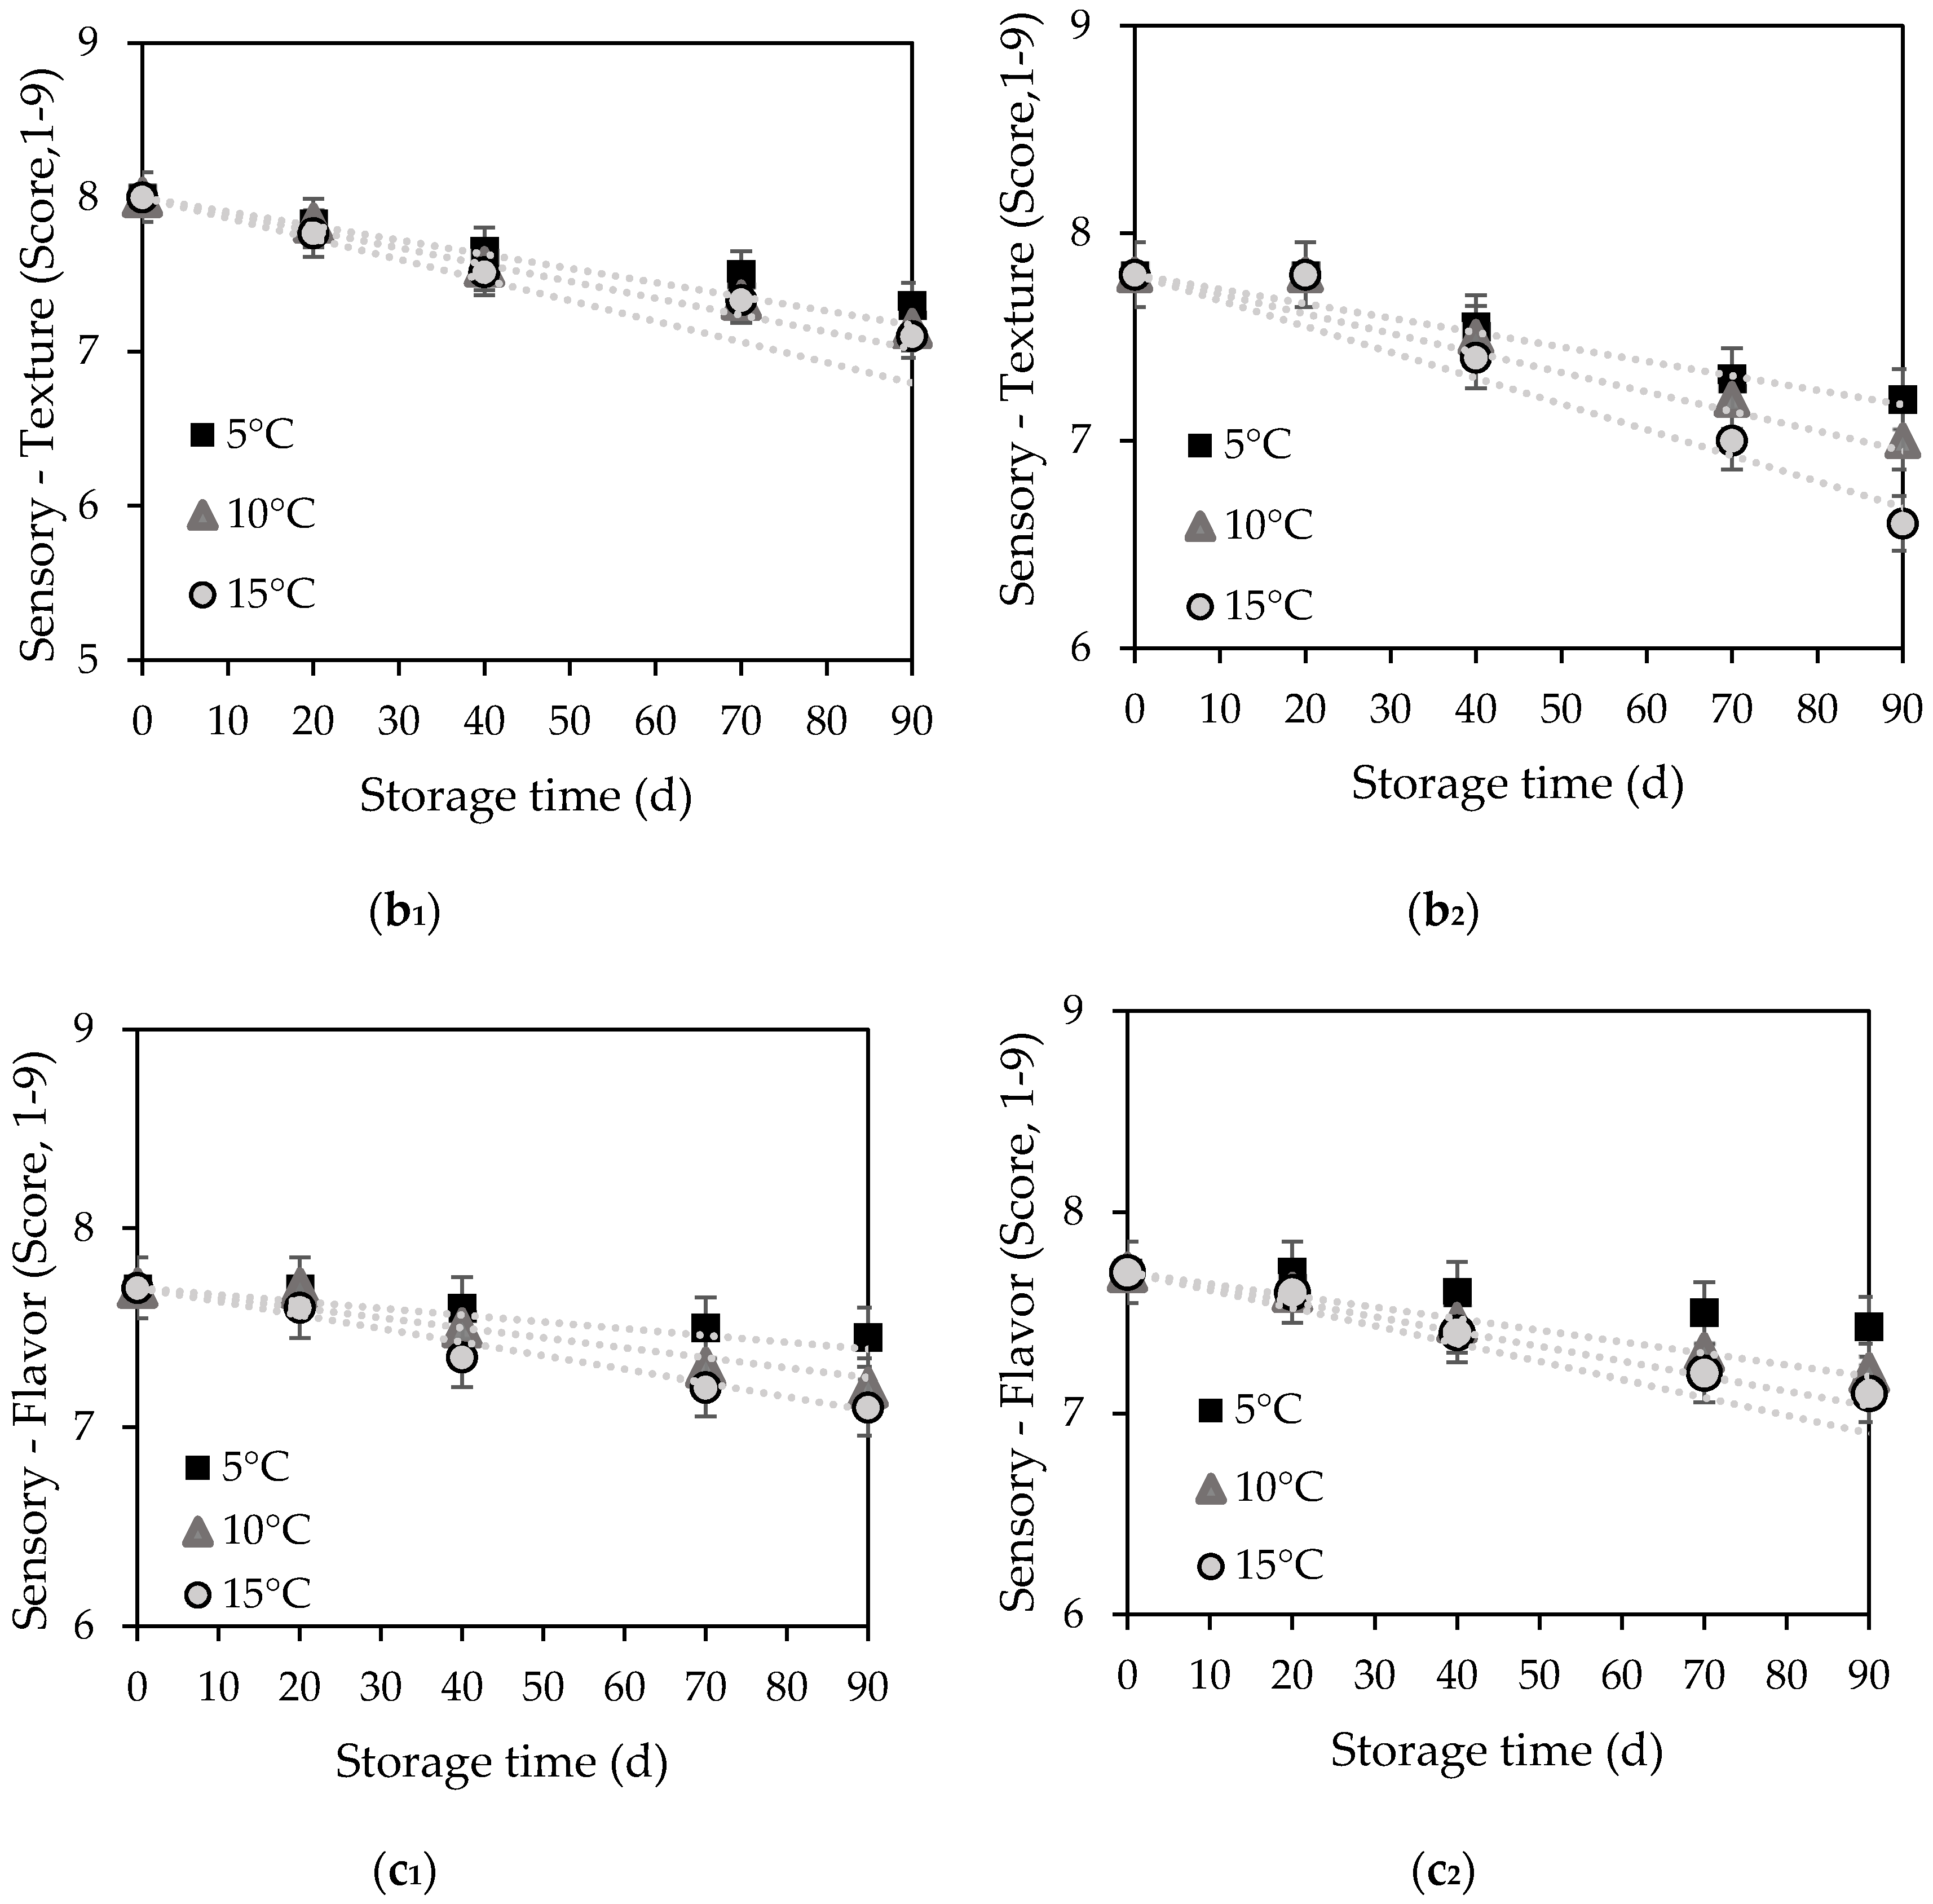
 ) 5 °C, (
  ) 10 °C, (
  ) 15; lines represent the respective model fit.
) 5 °C, ( ) 10 °C, ( ) 15; lines represent the respective model fit.
) 15; lines represent the respective model fit.
) 5 °C, ( ) 10 °C, ( ) 15; lines represent the respective model fit.


| Temperature (°C) | ODWater | ODSY Whey | |
|---|---|---|---|
| Dew (×10−9 m2/s) (Adj. R2) | 35 | 2.699 a ± 0.157 (0.9948) | 2.777 a ± 0.134 (0.9964) |
| 45 | 3.108 ab ± 0.216 (0.9927) | 3.150 ab ± 0.264 (0.9896) | |
| 55 | 3.741 bc ± 0.331 (0.9895) | 3.974 c ± 0.397 (0.9871) | |
| Dew,ref (×10−9 m2/s) | 35–55 | 2.914 ± 0.215 | 2.759 ± 0.245 |
| Ea (kJ/mol) (Adj. R2) | 13.69 ± 1.29 (0.9913) | 19.42 ± 2.12 (0.9608) | |
| Des (×10−9 m2/s) (Adj. R2) | 35 | 2.509 a ± 0.283 (0.9805) | 3.115 ab ± 0.517 (0.9554) |
| 45 | 2.940 ab ± 0.329 (0.9797) | 3.782 b ± 0.386 (0.9863) | |
| 55 | 3.991 b ± 0.509 (0.9792) | 5.589 c ± 0.753 (0.9820) | |
| Des,ref (×10−9 m2/s) | 35–55 | 2.992 ± 0.323 | 3.505 ± 0.361 |
| Ea (kJ/mol) (Adj. R2) | 15.00 ± 1.86 (0.9650) | 24.45 ±.2.80 (0.9567) |
| Fresh | ODSY Whey | ODWater | |
|---|---|---|---|
| Water activity (aw) | 0.9842 a ± 0.0008 | 0.8854 b ± 0.0035 | 0.8927 b ± 0.0012 |
| pH | 6.173 a ± 0.010 | 3.712 b ± 0.015 | 3.661 b ± 0.022 |
| Hardness (Fmax, N) | 11.50 a ± 2.10 | 15.24 a ± 1.20 | 15.94 a ± 1.50 |
| Color (L) | 76.1 a ± 0.7 | 74.3 b ± 0.9 | 76.5 a ± 0.8 |
| Color (a) | 5.80 a ± 0.41 | 7.92 b ± 1.15 | 7.21 b ± 0.69 |
| Color (b) | 65.2 a ± 1.1 | 68.6 b ± 0.7 | 70.0 b ± 0.3 |
| Total sensory quality (S, 1–9) | 8.3 a ± 0.6 | 8.2 a ± 0.3 | 7.9 a ± 0.5 |
| Vitamin C (CvitC, mg/100 g fresh or OD material) | 13.91 a ± 1.38 | 81.36 b ± 3.24 | 77.06 b ± 3.80 |
| Kinetic Parameters | Temperature (°C) | ODSY Whey | ODWater |
|---|---|---|---|
| kcolor (d−1) ΔEmax t0 (Adjusted R2) | 5 | 6.56 aA ± 0.53 7.12 aA ± 4.29 18.02 aA ± 3.80 (0.9582) | 8.89 aA ± 0.72 12.02 bA ± 4.16 26.39 bA ± 4.71 (0.9722) |
| 10 | 7.59 aA ± 0.63 7.05 aA ± 4.35 17.65 aA ± 3.93 (0.9553) | 8.98 aA ± 0.69 10.10 bAB ± 3.86 22.26 aB ± 4.25 (0.9699) | |
| 15 | 10.05 aB ± 1.10 12.71 aB ± 5388 25.01 aB ± 6.53 (0.9498) | 10.33 aB ± 1.62 13.80 aA ± 8.81 24.30 aA ± 9.59 (0.9061) | |
| kref (d−1) | 5–15 | 6.07 a ± 0.34 | 8.70 a ± 0.43 |
| Ea (kJ/mol) (R2) | 28.36 a ± 5.47 (0.9640) | 9.14 b ± 5.07 (0.7950) | |
| ktexture (d−1) (R2) | 5 | −0.0114 aA ± 0.0014 (0.9154) | −0.0223 bA ± 0.0017 (0.9638) |
| 10 | −0.0142 aA ± 0.0011 (0.9624) | −0.0269 bAB ± 0.0014 (0.9826) | |
| 15 | −0.0197 aA ± 0.0007 (0.9918) | −0.0320 bC ± 0.0021 (0.9736) | |
| kref (d−1) (R2) | 5–15 | 0.01118 ± 4.91 × 10⁻⁵ | 0.02234 ± 6.26 × 10⁻⁵ |
| Ea (kJ/mol) | 36.40 a ± 4.51 (0.9848) | 24.06 b ± 0.29 (0.9998) | |
| kvitaminC (d−1) (R2) | 5 | −0.00041 aA ± 3.75 × 10⁻⁵ (0.9526) | −0.00058 bA ± 2.39 × 10⁻⁵ (0.9900) |
| 10 | −0.00065 aB ± 7.46 × 10⁻⁵ (0.9269) | −0.00079 bB ± 4.64 × 10⁻⁵ (0.9797) | |
| 15 | −0.00084 aC ± 8.49 × 10⁻⁵ (0.9419) | −0.00101 bC ± 6.68 × 10⁻⁵ (0.9743) | |
| kref (d−1) (R2) | 5–15 | −0.00038 ± 2.82 × 10⁻⁵ | −0.00061 ± 1.22 × 10⁻⁵ |
| Ea (kJ/mol) | 47.86 b ± 7.37 (0.9768) | 36.98 a ± 2.05 (0.9969) | |
| ksensory (d−1) (R2) | 5 | −0.00735 aA ± 0.00062 (0.9583) | −0.01090 bA ± 0.00036 (0.9934) |
| 10 | −0.00939 aB ± 0.00032 (0.9926) | −0.01252 bB ± 0.00057 (0.9874) | |
| 15 | −0.01215 aC ± 0.00050 (0.9896) | −0.01479 bC ± 0.00083 (0.9811) | |
| kref (d−1) (R2) | 5–15 | 0.00732 ± 5.94 × 10⁻⁵ | 0.01084 ± 1.36 × 10⁻⁵ |
| Ea (kJ/mol) | 33.48 a ± 0.83 (0.9993) | 20.32 b ± 1.28 (0.9960) |
© 2020 by the authors. Licensee MDPI, Basel, Switzerland. This article is an open access article distributed under the terms and conditions of the Creative Commons Attribution (CC BY) license (http://creativecommons.org/licenses/by/4.0/).
Share and Cite
Dermesonlouoglou, E.; Paraskevopoulou, E.; Andreou, V.; Taoukis, P. Osmotic Dehydration for the Production of Novel Pumpkin Cut Products of Enhanced Nutritional Value and Sustainability. Appl. Sci. 2020, 10, 6225. https://0-doi-org.brum.beds.ac.uk/10.3390/app10186225
Dermesonlouoglou E, Paraskevopoulou E, Andreou V, Taoukis P. Osmotic Dehydration for the Production of Novel Pumpkin Cut Products of Enhanced Nutritional Value and Sustainability. Applied Sciences. 2020; 10(18):6225. https://0-doi-org.brum.beds.ac.uk/10.3390/app10186225
Chicago/Turabian StyleDermesonlouoglou, Efimia, Eleni Paraskevopoulou, Varvara Andreou, and Petros Taoukis. 2020. "Osmotic Dehydration for the Production of Novel Pumpkin Cut Products of Enhanced Nutritional Value and Sustainability" Applied Sciences 10, no. 18: 6225. https://0-doi-org.brum.beds.ac.uk/10.3390/app10186225