Tool Wear and Material Removal Predictions in Micro-EDM Drilling: Advantages of Data-Driven Approaches


1
Department of Mechanical Engineering, KU Leuven and Member Flanders Make, 3001 Leuven, Belgium
2
School of Mechanical and Electrical Engineering, Guangdong University of Technology, Guangzhoug 510000, China
*
Author to whom correspondence should be addressed.
Appl. Sci. 2020, 10(18), 6357; https://0-doi-org.brum.beds.ac.uk/10.3390/app10186357
Submission received: 6 August 2020
/
Revised: 6 September 2020
/
Accepted: 10 September 2020
/
Published: 12 September 2020
(This article belongs to the Special Issue Micro EDM Drilling)
Abstract
:In micro electrical discharge drilling, regression models are commonly used for predicting the material removal rate (MRR) and tool wear rate (TWR) from the applied processing parameters. However, these models can be inaccurate since the processing parameters might not always be representative of the actual machining conditions, which depend on several other factors such as the tool length or gap flushing efficiency. In order to increase the prediction accuracy, the present work investigates the capability of data-driven regression models for tool wear and material removal prediction. The errors in predicting the MRR and TWR are shown to decrease of about 65% and 85% respectively when using data collected through process monitoring as input of the regression models. Data-driven approaches for in-process tool wear prediction have also been implemented in drilling experiments, demonstrating that a more accurate control of the hole depth (50% average reduction of the depth error) can be achieved by using data-driven predictive models.
1. Introduction
Micro electrical discharge machining (micro-EDM) drilling is a thermal process in which material removal occurs through electric discharges sequenced at high-frequency. Thanks to its non-contact nature, micro-EDM drilling allows the machining of any conductive material regardless of its hardness or strength. For this reason, it is widely applied in industry for making small holes in difficult-to-machine materials such as titanium alloys, tungsten carbide and nickel superalloys [1,2,3]. Typical applications in the automotive and aerospace sectors include spray holes for diesel injector nozzles [4] and cooling holes for turbine blades [5].
Due to the nature of electric discharges, in micro-EDM drilling material is inevitably not only removed from the workpiece, but also from the tool electrode. This results in significant tool wear, which can be of the same order of magnitude as the amount of material removed from the workpiece when using brass or copper tubes as drilling tool [6,7]. Therefore, methodologies for predicting the wear of the tool electrode as well as of the material removal on the workpiece side are needed for accurately controlling the depth of a micro-EDMed hole.
Traditionally, regression models have been used for predicting what is commonly denoted as the material removal rate (MRR) and tool wear rate (TWR) from the setting of micro-EDM processing parameters. Skoczypiec et al. [8] used a regression model for predicting the TWR in micro-EDM drilling of siliconized silicon carbide (SiSiC) considering three processing parameters as input (pulse-on time, voltage and current). Puertas et al. [9] developed a procedure using a multiple linear regression model for predicting several machining characteristics, including the MRR and TWR. Mohan et al. [10] established a non-linear regression model for predicting the TWR and MRR when machining aluminium matrix composites. Methods different from regression models have also been tried. For instance, Suganthi et al. [11] proposed a combination of adaptive neuro-fuzzy inference system (ANFIS) and artificial neural network (ANN) methods for predicting the MRR and TWR from the applied setting of processing parameters. Barenji et al. [12] applied a response surface methodology (RSM) to predict the MRR and TWR in EDM of tool steel, considering the pulse-on time, current, and voltage as input processing parameters.
In all above-mentioned methods the processing parameters are used to predict the tool wear and material removal. However, the processing parameters might not always be extremely representative of the actual machining conditions, which depend on several other factors such as the tool length or gap flushing efficiency [13,14]. Meaningful information about the actual machining conditions could be obtained through process monitoring, which involves the use of sensors for monitoring and recording physical quantities during the machining process. Extensive sets of data are generated through process monitoring. These data could be used in addition or even in replacement of the set processing parameters to build regression models in order to obtain a more accurate prediction of the MRR and TWR.
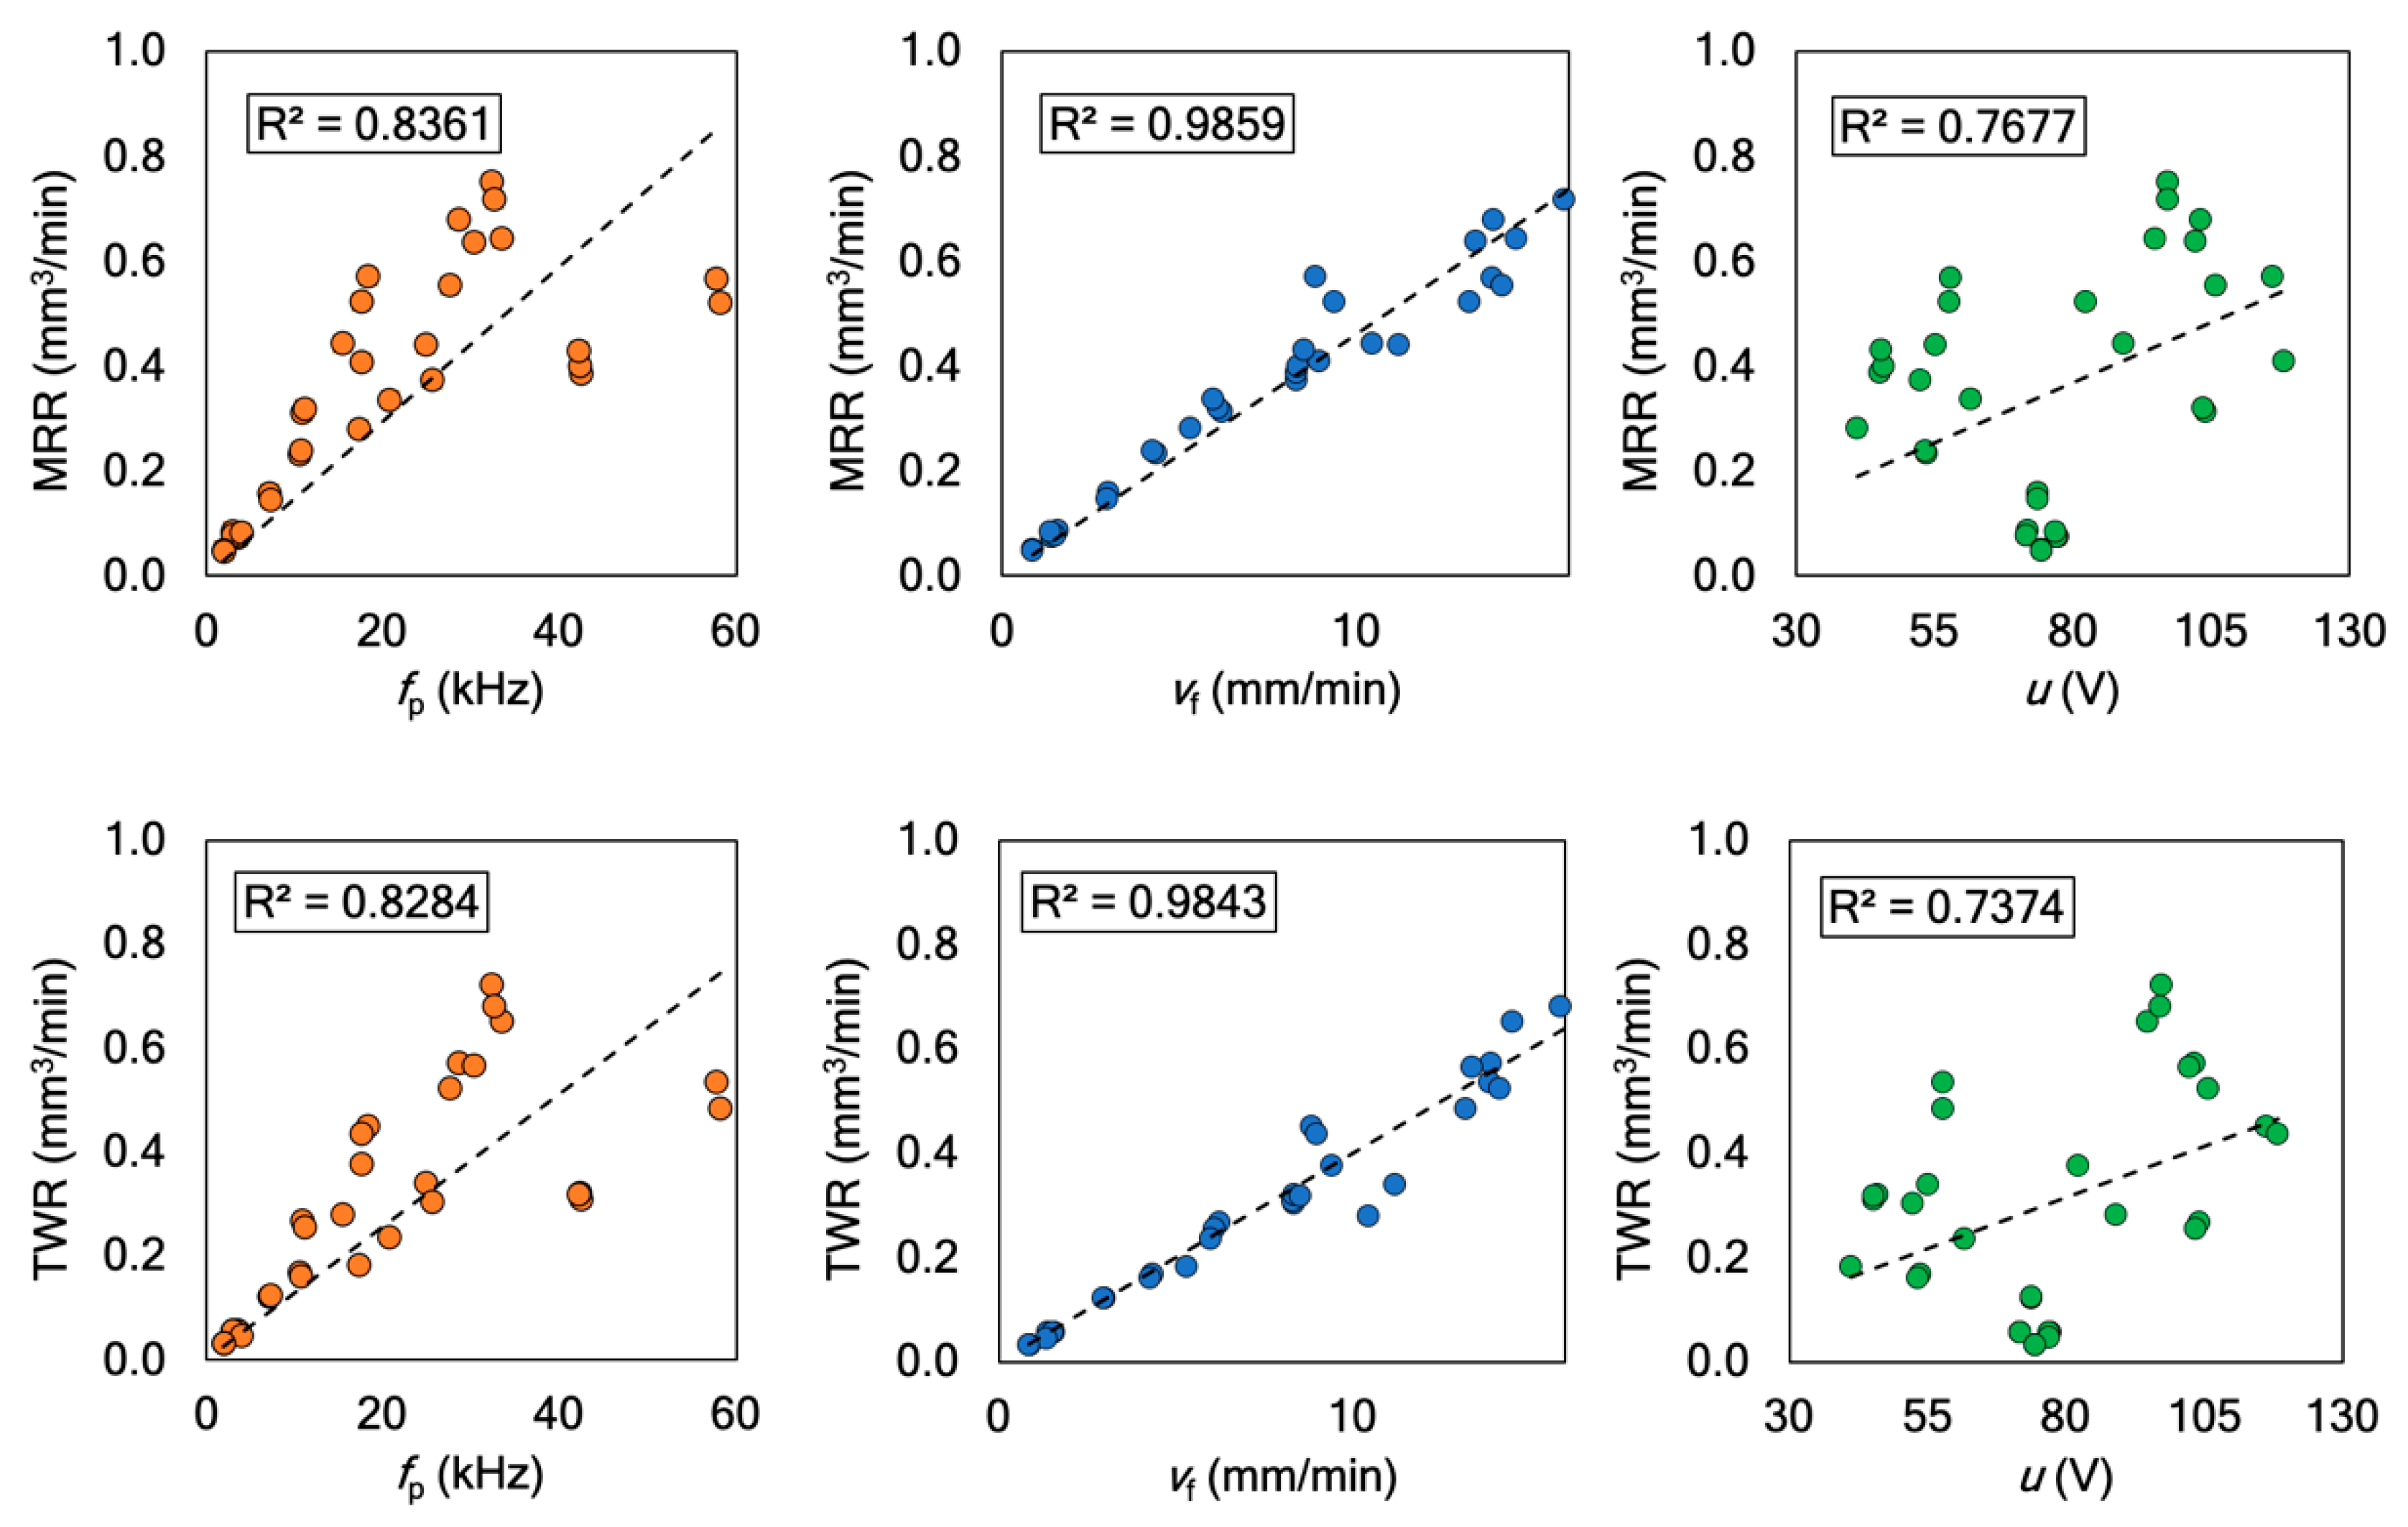
Previous research work has already proved that a good degree of correlation can be established between the main material removal performance indicators (MRR or TWR) and specific physical quantities that can be monitored during the micro-EDM process. Bissacco et al. [15] have shown that a linear correlation exists between the average tool wear per discharge and the average energy per electric discharge, which can be computed by monitoring the current and gap voltage signals. Similarly, D’Urso and Ravasio [16] have demonstrated that the average discharge energy is representative of the machining conditions and can be correlated to the drilling time and tool wear. In a recent study at KU Leuven [17], it has also been found that the average tool feed rate, average gap voltage and average amount of normal discharge pulses per unit time, which can be monitored during the micro-EDM drilling process, display a high degree of correlation to the MRR and TWR. In particular, the average tool feed rate has shown the highest correlation to the MRR and TWR (Pearson’s correlation coefficient above 0.8).
In this paper, previous study is further extended to investigate the applicability of data-driven approaches for tool wear and material removal prediction in micro-EDM drilling. Multiple linear regression (MLR) is used to model the relationship between the material removal performance indicators (MRR and TWR) and the average amount of normal discharge pulses per time unit, average tool feed rate, and average gap voltage. These average values are monitored and recorded at regular steps during the drilling process. Different regression models are built, using data collected through process monitoring in addition or in replacement of the processing parameters for predicting the MRR and TWR. The advantages of data-driven approaches with respect to traditional regression models solely based on processing parameters are analysed. The MLR models are implemented into a process monitoring strategy, which is used for controlling the hole depth based on the in-process prediction of tool wear.
The paper is structured as follows. Section 2 details the materials and methods applied in this research, including a description of the experimental setup for micro-EDM drilling. Section 3 provides detailed explanations about the regression models. Section 4 presents the in-line strategies for predicting the tool wear and controlling the hole depth. In Section 5, the experimental results are presented and discussed, focusing on the prediction accuracy of the regression models and precision of the control strategy based on in-process tool wear prediction. Some concluding remarks, including a summary of the main achievements and future research directions, are given in Section 6.
2. Materials and Methods
2.1. Experimental Setup
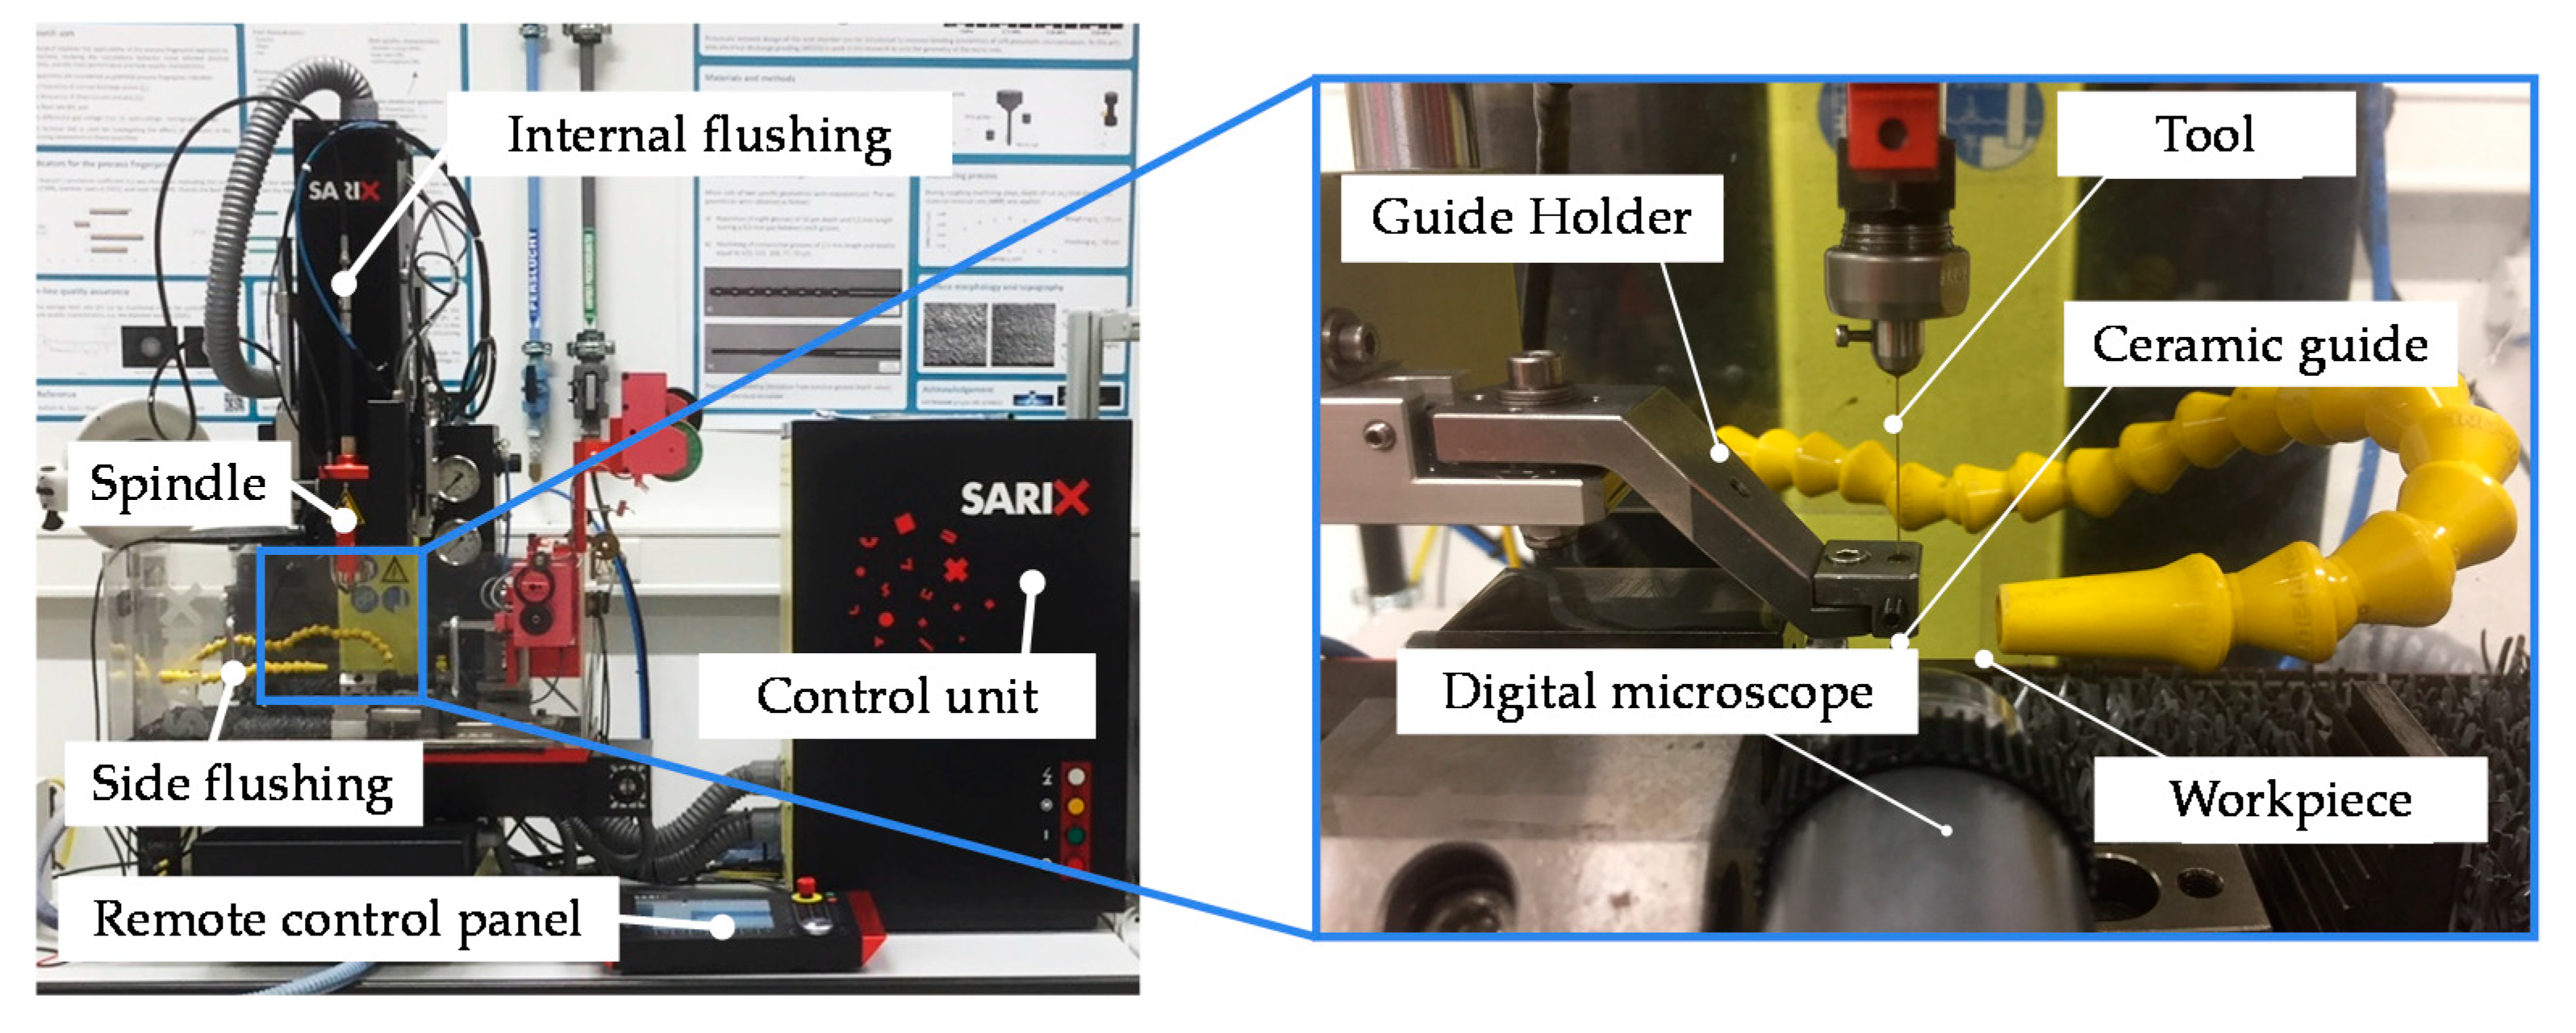
Micro-EDM drilling experiments are carried out on a SARIX® SX-100-HPM machine tool (Sarix SA, Sant’Antonino, Switzerland) in order to obtain the required datasets for testing the data-driven approaches for tool wear prediction. The machine tool is equipped with a PULSAR power supply from SARIX® and a process monitoring system, which is embedded in the control unit of the machine tool. This system allows for monitoring and recording of several quantities during the drilling process, such as the amount of discharge pulses and the average gap voltage. Regarding the architecture and operation of this process monitoring system, further details can be found in the published previous work [17].
Small plates of Ti6Al4V alloy of 2 mm thickness, 6 mm width and 70 mm length are used as workpiece. Ti6Al4V is selected as workpiece material since it is widely used, especially in the aerospace and biomedical sectors [5,18,19]. Brass tubes provided by SARIX® (outer diameter: 350 µm, inner diameter: 130 µm) are used as tool electrode, which means that the aspect ratio of the micro holes is approximately 6. Hydrocarbon oil (HEDMA® 111) is applied as dielectric liquid. In particular, side flushing and internal flushing through the tubular tool are applied simultaneously.
Brass tubular tools of small diameter are rather flexible. For this reason, a tool guiding system is used to reduce the run out of the tool electrode when approaching the workpiece. This guiding system consists of a ceramic tool guide and a guide holder, as shown in the magnified view in Figure 1. During the experiments, the guide holder is positioned such that the ceramic guide is above the top surface of the workpiece at a distance of approximately 2 mm.
In order to drill holes of constant depth, the micro-EDM drilling process is continued until the breakthrough of the tool electrode through the workpiece is observed. The Ti6Al4V plates are clamped as cantilevers to facilitate observation of this breakthrough. A Dino-Lite® Edge AM4115ZT digital microscope (AnMo Electronics Corporation, New Taipei, Taiwan) is used to monitor the drilling process, which is interrupted as soon as sparks are visually observed at the bottom surface of the workpiece. This allows to interrupt the drilling process before the tool has fully broken through, avoiding the instabilities in the discharging process occurring during the breakthrough stage [20,21], as these are not the subject of this research.
2.2. Data Collection
In order to obtain a heterogeneous dataset for training the regression models, the processing parameters applied in the micro-EDM drilling experiments are varied following a two-level full factorial Design of Experiments (DoE). Five processing parameters are varied, for a total of 32 experimental runs: pulse-on time (Ton), open voltage (Uo), charging frequency of the pulse generator (F), gain factor of the servo control loop (K) and reference gap voltage (Ue). The 32 experimental runs are performed in random order. The number of experimental runs is limited to only 32 experiments since the goal of this study is to compare the performance of different predictive models rather than showing the highest prediction accuracy, which can be achieved by each predictive model. It is believed that the accuracy of the predictive models would improve by increasing the number of experimental runs and therefore the amount of training data.
The five processing parameters in the DoE are selected so as to include variations to some of the main factors influencing the material removal process in micro-EDM drilling, namely the energy input per discharge (Ton, Uo), the cycle frequency of the power supply system (F) and the settings of the servo feed control system (K, Ue). The levels of each parameter are set so as to cover a wide process window. The choice is carried out based on the recommendations from the machine vendor and previously-reported research work, which is carried out using a similar combination of tool and workpiece materials [22,23,24]. Table 1 is a summary of the factors and levels of the DoE.
In all experimental runs, a constant tool rotation speed equal to 750 rpm is set and negative polarity is applied to the tool electrode. The energy index (E) and current index (I) are kept constant and equal to 301 and 70 respectively. According to the machine vendor, the energy index is the parameter determining the shape of the discharge pulses. The chosen energy index provides triangular-shaped pulses. When this energy index is selected, the current index can be used as a parameter to regulate the pulse peak current as shown in one of our previous studies [21]. Both the energy index and current index can vary the energy input per discharge pulse. In this study, the values of E and I are kept constant since the effects of variations to the discharge energy are already taken into account into the DoE by varying other processing parameters (Ton, Uo).
A second dataset is recorded for evaluating the prediction accuracy of the regression models at experimental conditions which are different from the ones applied when recording the training data. In this case, 10 experimental runs are performed by randomly varying the processing parameters within the process window defined by the DoE. In other words, this means that the five processing parameters that are included in the DoE are set randomly to a value between the minimum (Level − 1) and maximum (Level + 1) levels applied in the DoE. The processing parameters applied in each of these 10 experimental runs are listed in Table 2. All other processing parameters are kept constant and set as mentioned above.
During all experiments, three quantities are monitored and recorded using the monitoring system embedded in the control unit of the SARIX® machine: the average amount of normal discharge pulses per time unit (fp), average tool feed rate (vf), and average gap voltage (u). These quantities are recorded in order to be used as tool wear and material removal predictors since they are highly correlated to the wear of the tool electrode. This has been demonstrated by numerous experimental and theoretical studies in literature, for instance references [17,25,26,27,28]. The values of fp, vf, and u are computed using an averaging window corresponding to steps of 50 µm in drilling depth, similarly to what was done in [17,29]. The value of 50 µm refers to the nominal drilling depth as read by the z-axis encoder of the machine tool. Due to the longitudinal wear of the tool electrode, it does not correspond to the depth of the hole being drilled. The computed values of fp, vf, and u at every drilling step are automatically stored into a comma-separated value (.csv) text file.
The material removal rate (MRR) and tool wear rate (TWR) for each experimental run are computed at the end of the micro-EDM drilling experiments. The MRR is calculated as the ratio between the volume of material removed from the workpiece (Vw) and the total machining time (T), approximating the holes to a cylinder:
where H is the thickness of the workpiece and Din is the inlet of a drilled hole, which is measured by means of a VideoCheck HA coordinate measuring machine (Werth Messtechnik GmbH, Gießen, Germany) in optical mode. Similarly, the TWR is computed as the ratio between the volume of material removed from the tool (Vt) and the total machining time (T). To compute Vt, the nominal inner (dt) and outer (Dt) diameters of the brass tubular tool are used. As shown in Equation (2), Vt is calculated by subtracting the workpiece thickness (H) from the monitored value of the drilling depth when the breakthrough is observed (Zb).
3. Predictive Models
Multiple linear regression (MLR) models are built for predicting the MRR and TWR. The models are built using MATLAB® software and its dedicated function for linear regression. In a MLR model, linear functions are used to define the relationship between a response and a set of explanatory variables. The response can be explained as follows:
where is the predicted value of the response, is a constant, is the regression coefficient for the i-th explanatory variable, is the value of the i-th explanatory variable and nv is the total number of explanatory variables.
In this study, three regression models are built by using different explanatory variables to predict the same responses (MRR or TWR). Table 3 shows a summary of the explanatory variables, which are used in each model. The regression models are denoted as follows: PP, DD and PP + DD. In the PP model, the processing parameters are considered as explanatory variables. This model is used as a reference to analyse the effects of the data-driven approaches in terms of prediction accuracy. In the DD model, data collected through process monitoring are used for predicting the MRR and TWR. In particular, the average values of fp, vf and u are used (Fp, Vf, and U). These average values are computed at the end of each experimental run from the recorded values of fp, vf and u, which are stored in the .csv files. The PP + DD model combines the explanatory variables used in the two other models. This model is built in order to understand whether combining the processing parameters with the information collected through process monitoring could be more advantageous.
The normalised mean square error (NRMSE) is used to evaluate the prediction accuracy of the MLR models. The NRMSE is computed from the squared difference (SD) between the predicted () and observed () values of the MRR and TWR for each j-th experimental run of the validation dataset. The average of the observed values ( is used for normalisation. In Equations (4) and (5), the formulas for computing the SD and NRMSE are shown respectively. Here nr is the total number of experimental runs in the validation dataset (i.e., 10).
4. In-Process Tool Wear Prediction and Hole Depth Control
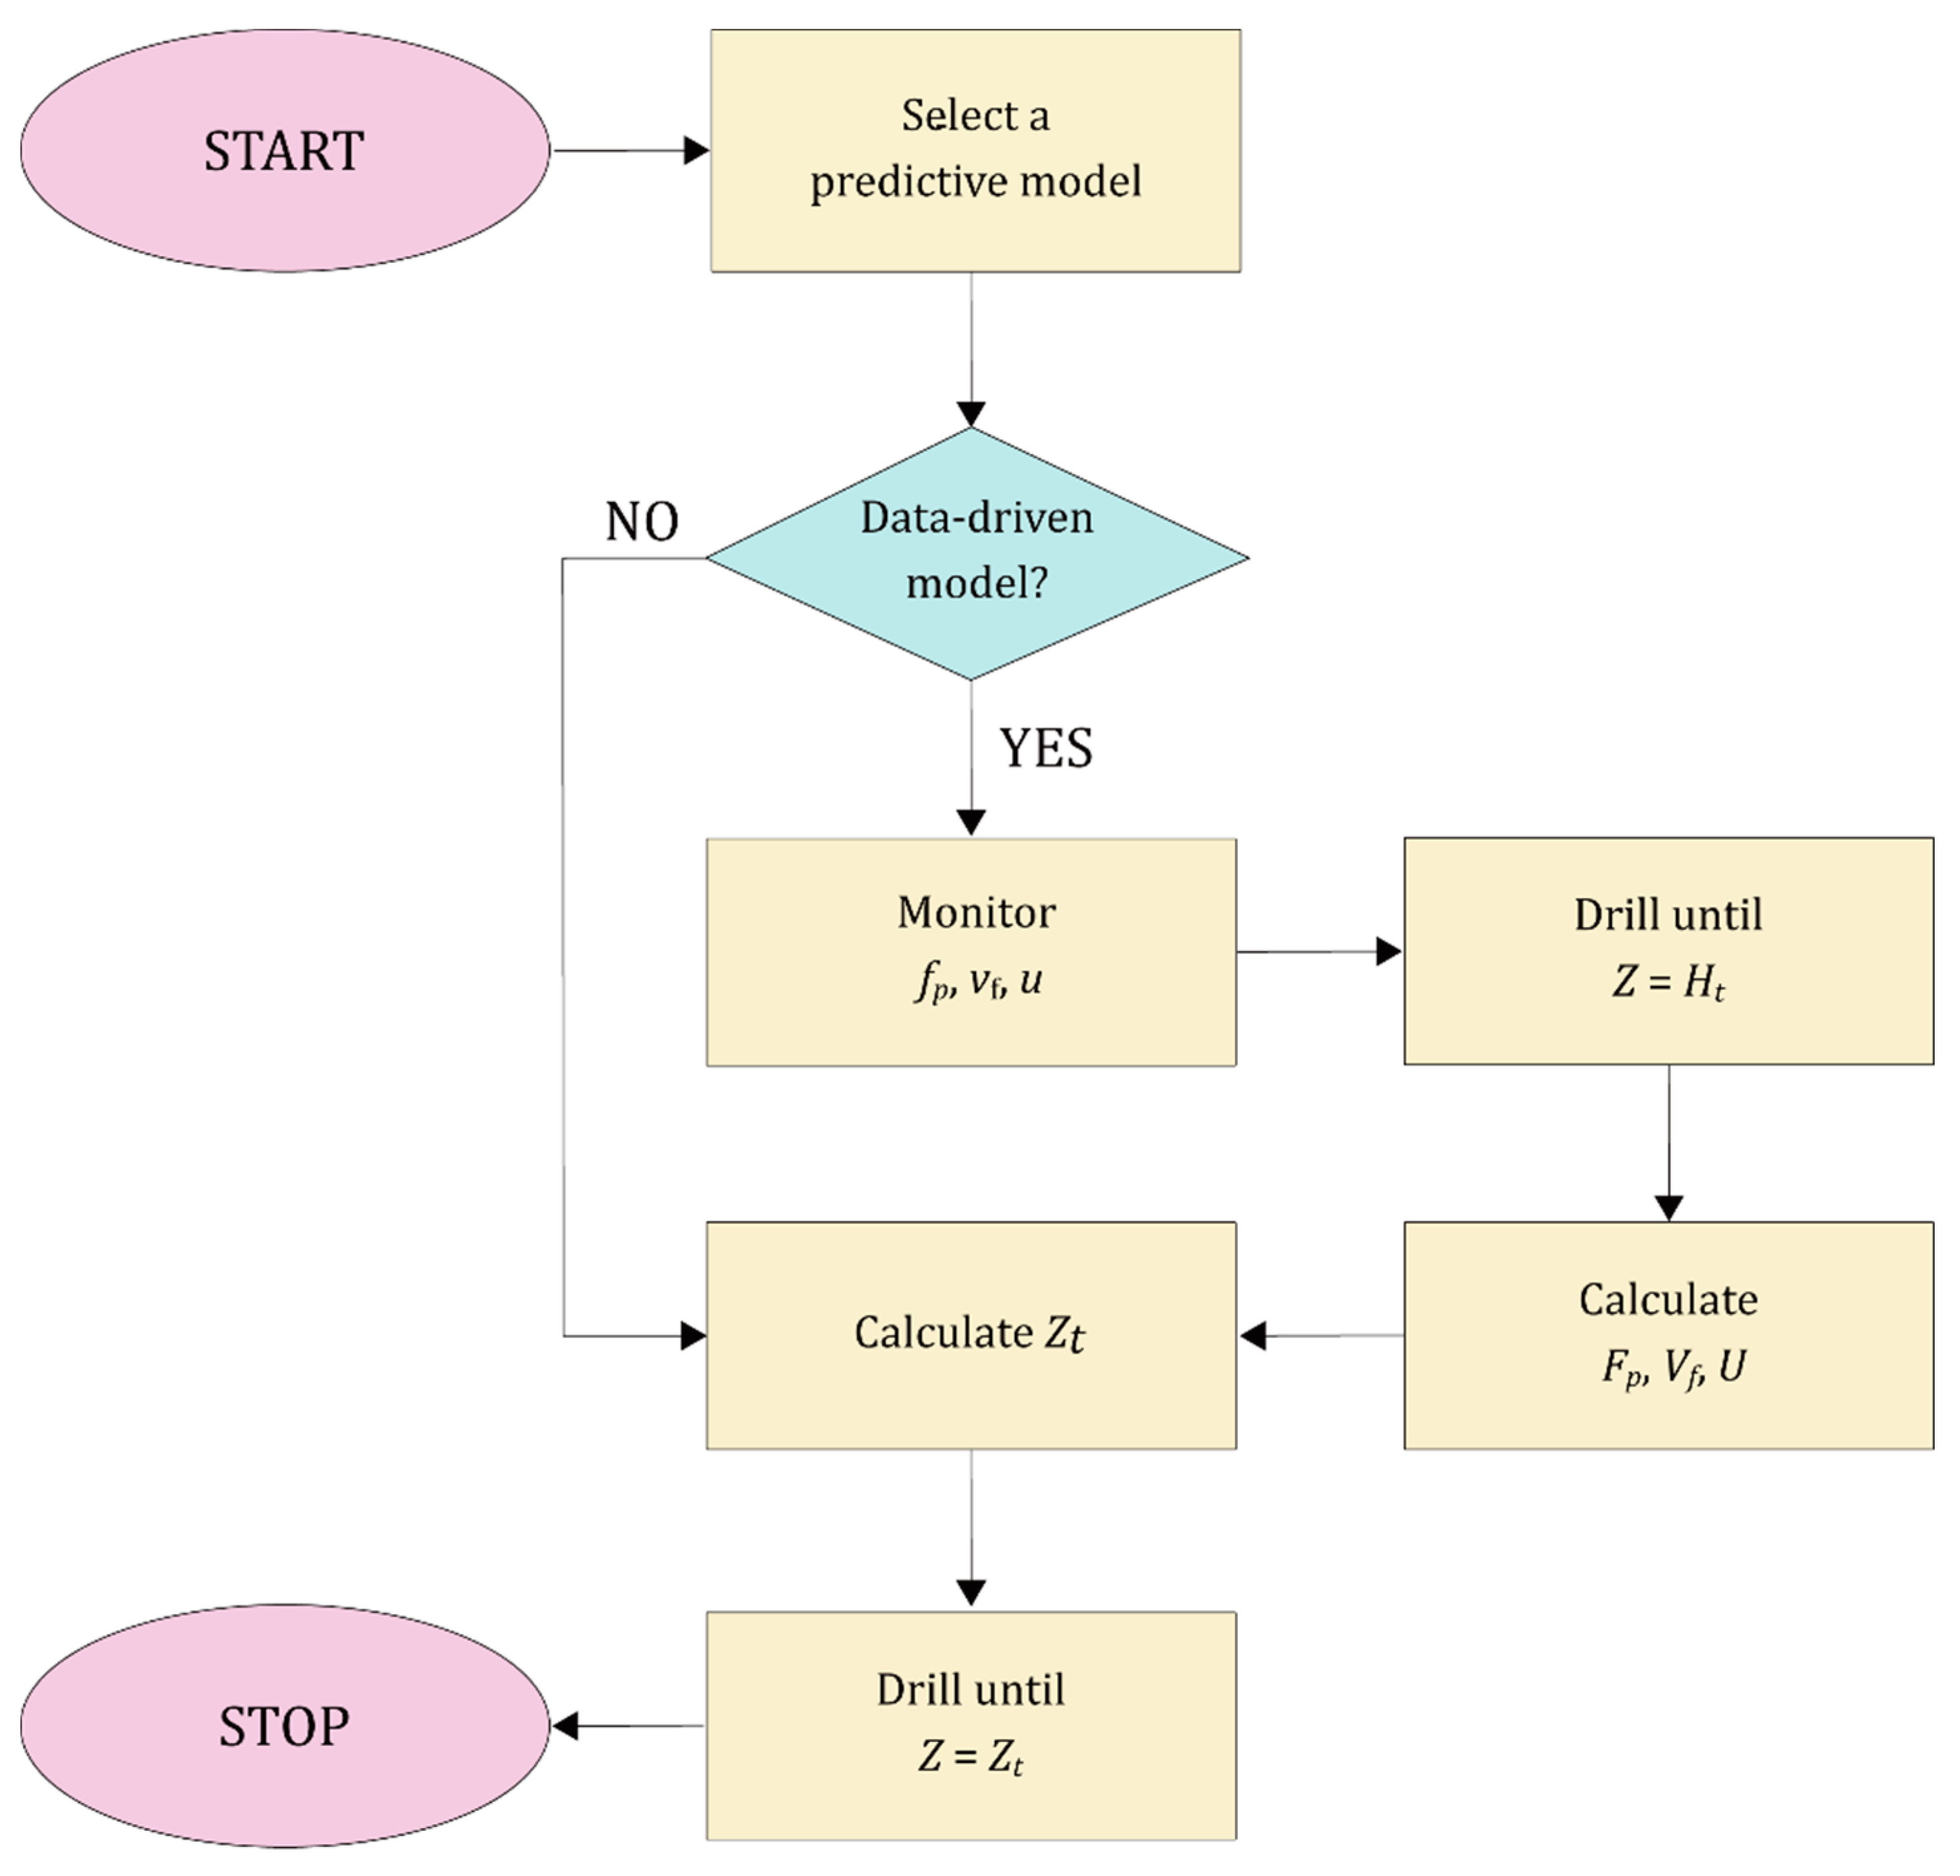
A comparison between data-driven and traditional approaches is carried out by implementing a control strategy for in-process tool wear prediction (Figure 2). The control strategy, which is programmed in G-code language, enables to select one of the three regression models for predicting the TWR. The selection of the predictive models must be done by the machine user before starting the drilling process.
The regression equations of the predictive models, as computed using MATLAB software, are implemented in the G-code. When selecting the DD or PP + DD model, the system embedded in the control unit of the SARIX® machine tool is used for monitoring fp, vf, and u. These three quantities are monitored at regular steps of 50 µm until a drilling depth (Z) equal to the target drilling depth (Ht) is reached. The average values of fp, vf, and u are computed when Z = Ht. Since the tool electrode is inevitably wearing during the drilling process, this condition guarantees that a hole having a depth lower than Ht has been drilled if Z = Ht, while at the same time it also allows to obtain a reliable estimation of the average values of the monitored quantities (Fp, Vf, and U). The MLR models are used for predicting the MRR and TWR. From the predicted values of the TWR and MRR (TWRp and MRRp), the target drilling depth (Zt), which needs to be reached to drill a hole of depth equal to Ht, is calculated as:
where At is the cross sectional area of the tool electrode and Tp is the monitored drilling time at Z = Ht. The value of Zt is computed when Z = Ht if the DD or DD + PP predictive models are chosen, while Zt is computed at the start of the drilling process when selecting the PP predictive model. After computing Zt, the drilling process is continued until Z = Zt is reached.
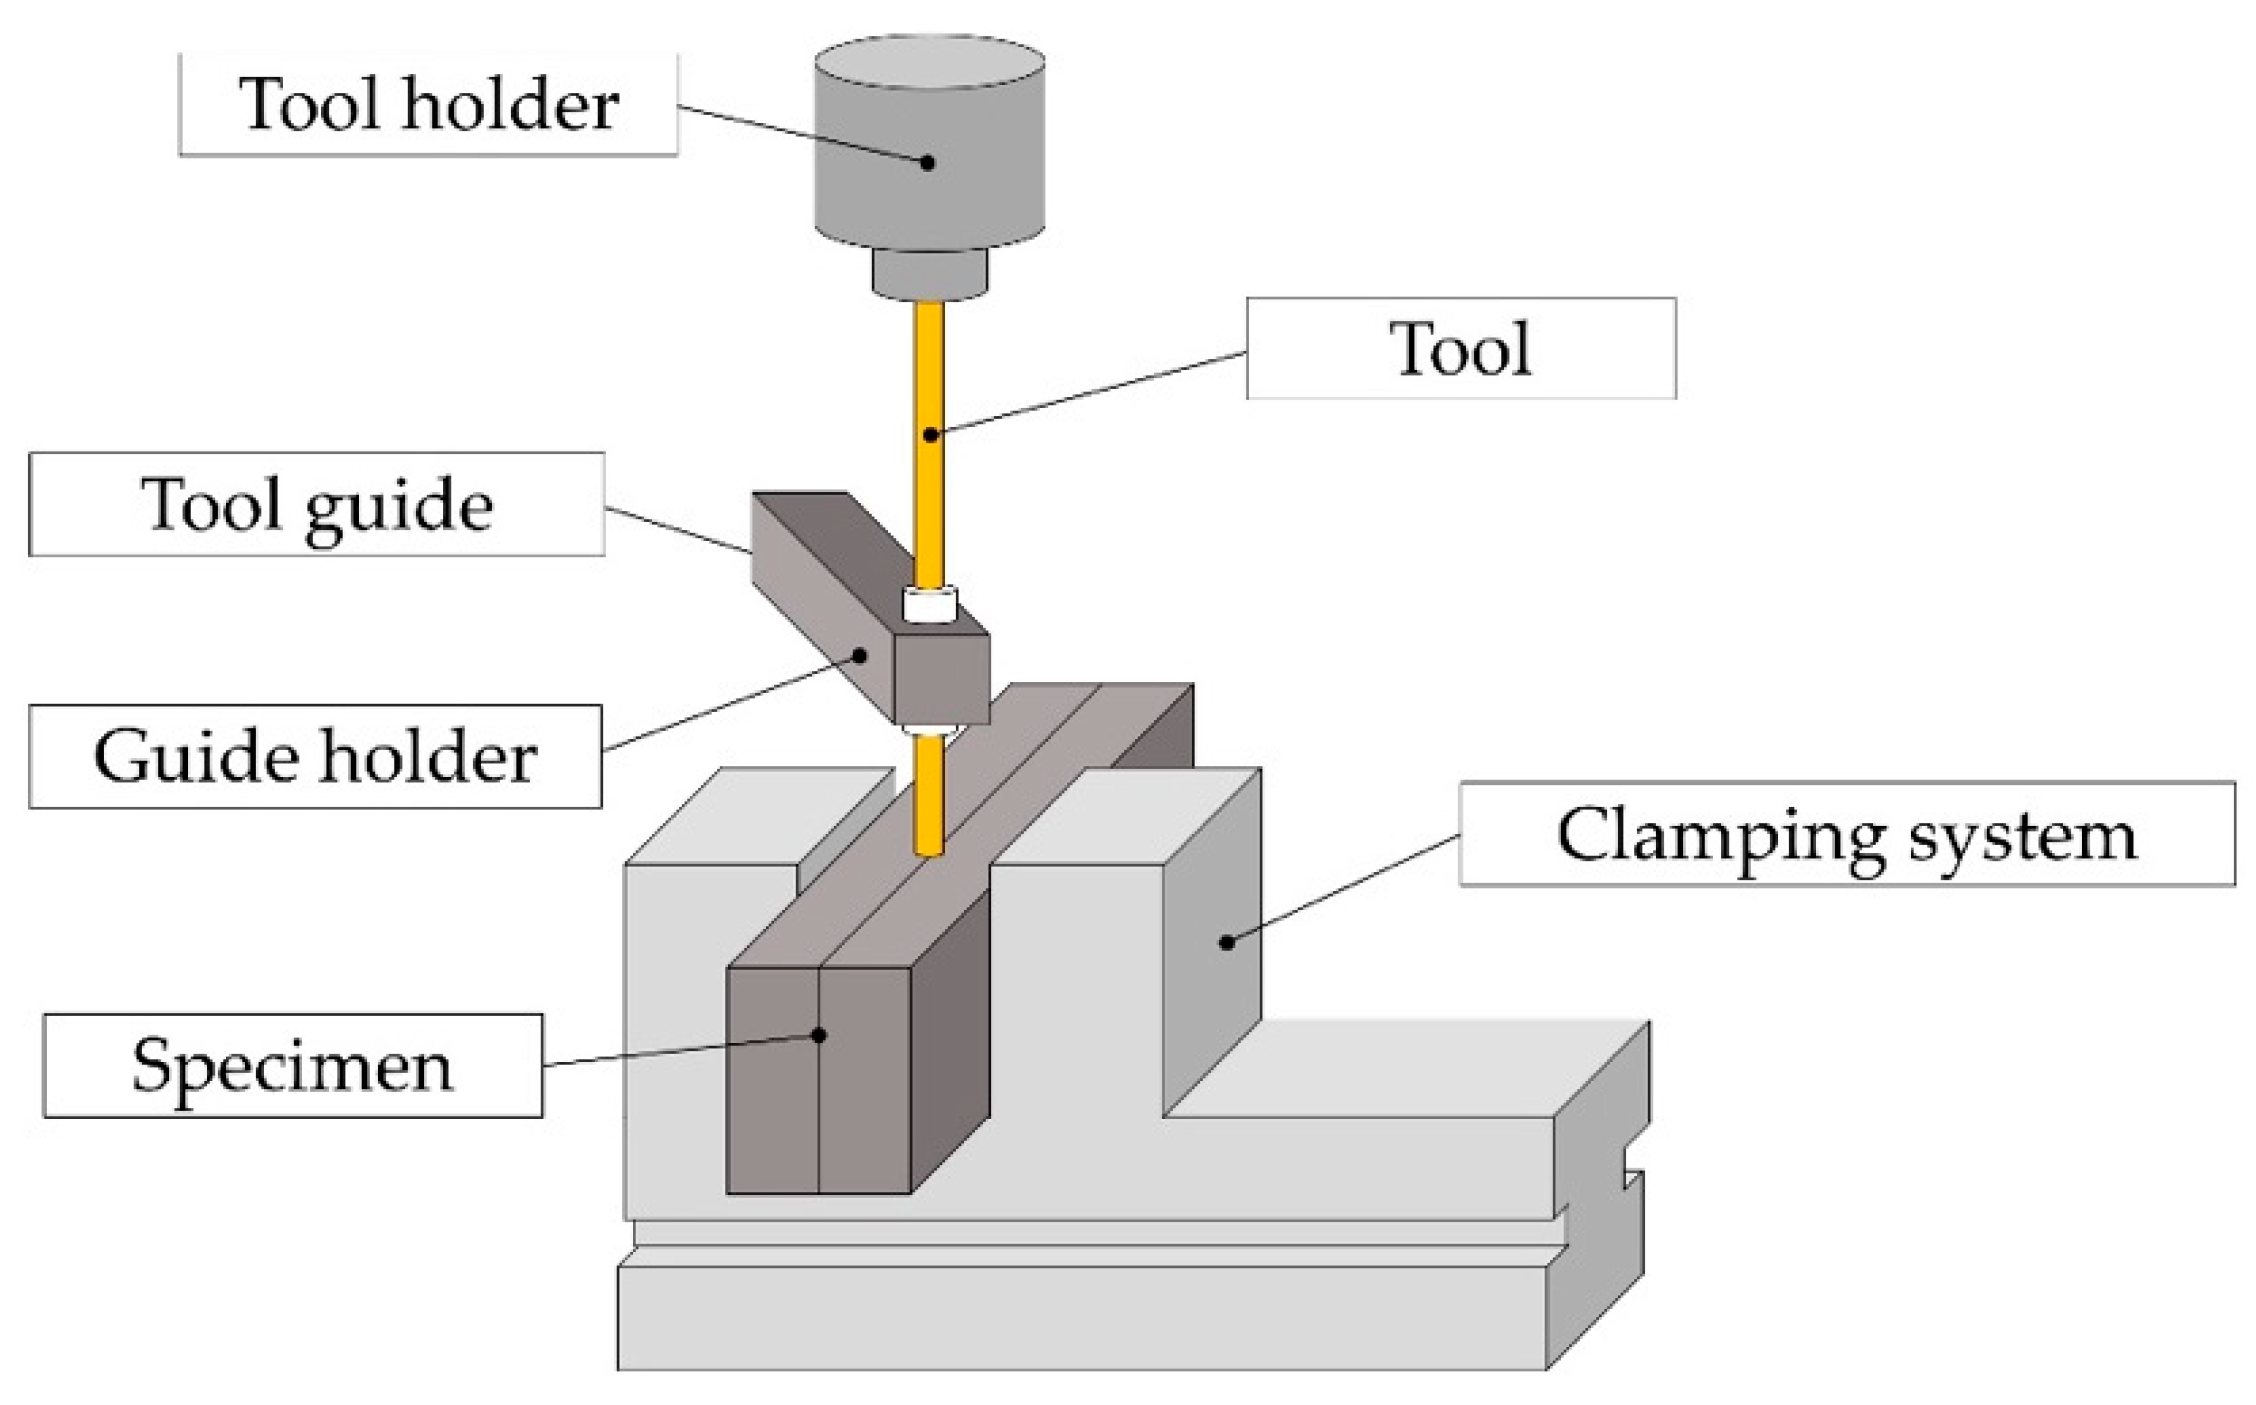
In order to test the control strategy, micro-EDM drilling experiments are carried out for blind holes into specimens composed of two parts. The two parts are obtained by wire-EDM cutting of a Ti6Al4V plate. Two sets of experiments are carried out by varying the target hole depth: 1.5 mm and 2.5 mm. During the experiments, the specimens are placed into the workpiece clamp as in Figure 3. The drilling experiments are performed along the intersection line of the two parts. This allows easy inspection of the holes after drilling. For every drilled hole, after measuring the actual hole depth (Ha), the depth error (ΔH) is computed as in Equation (7).
5. Results and Discussion
5.1. Predictive Models
Table 4 shows the regression coefficients for the three MLR models. The coefficients correspond to the explanatory variables in Table 3. They are computed when the responses (MRR or TWR) are expressed in mm3/min, while the values of Fp, Vf, and U are expressed in Hz, mm/min and V respectively. The units for the processing parameters are listed in Table 1.
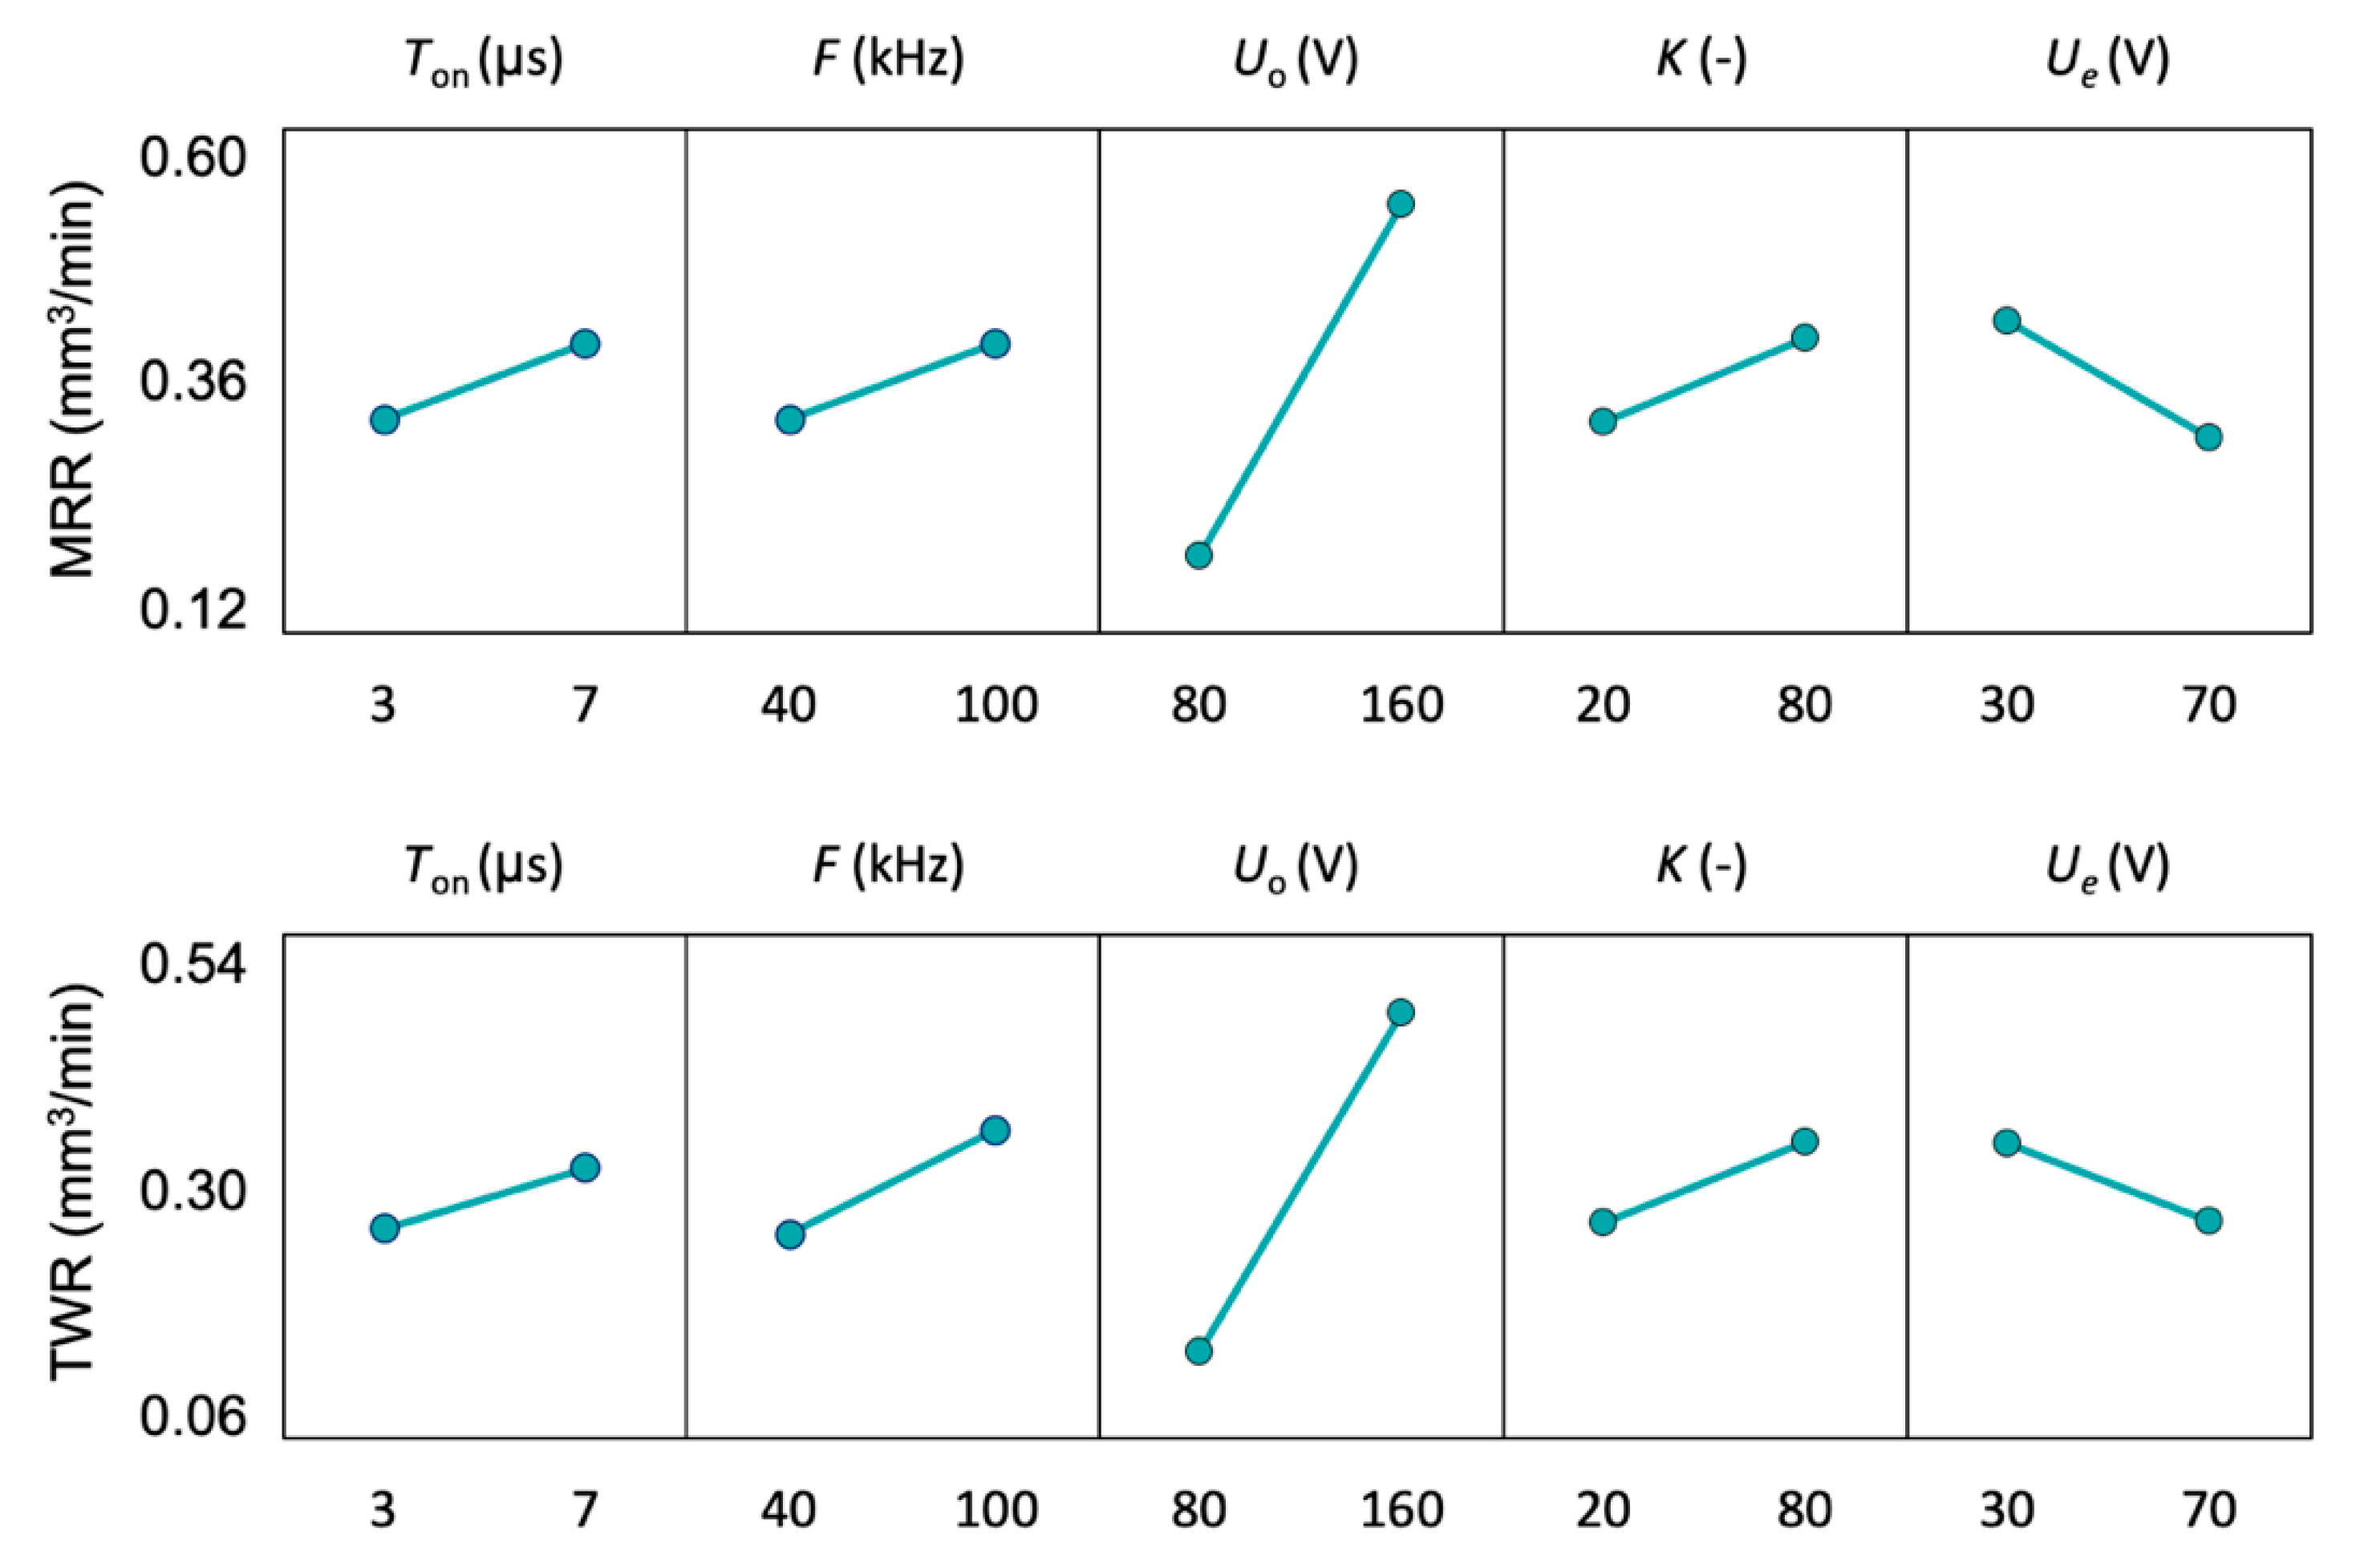
The three MLR models are built using the training data, which are collected by varying five processing parameters during the drilling experiments following a full factorial DoE. The effects of these processing parameters on the MRR and TWR can be investigated by analysing the training data. As shown in the main effect plots in Figure 4, the open voltage is the parameter having a higher influence on both responses at the investigated process conditions. The reason can be mainly attributed to the fact that the open voltage determines the energy input per discharge on the SARIX® machine tool, therefore strongly influencing the material removal and tool wear rate. The servo control parameters have also an influence on the MRR and TWR, which both increases with the gain factor. This is because an increase of the gain factor results in a more aggressive regulation of the servo control system. On the contrary, both the MRR and TWR decreases when increasing the reference voltage. This is due to the fact that a higher reference voltage corresponds to a less aggressive servo regulation since the reference voltage is closer to the open voltage level.
The main effect plots show that the processing parameters can have considerably different effects on the MRR and TWR. These effects might depend on several factors, including the workpiece material, tool material, tool size and dielectric fluid. This means that it is difficult to predict which processing parameters are having a higher influence on the MRR and TWR before performing a series of preliminary drilling experiments. Therefore, the selection of the processing parameters to be considered as explanatory variables of a predictive model can be challenging and risky. On the contrary, when following data-driven approaches, the monitored quantities show a relatively high degree of correlation to the MRR and TWR (see Figure 5), which means that all explanatory variables included in the DD predictive model have an influence on the responses. This suggests that data-driven predictive models could have a higher prediction accuracy than traditional predictive models, especially when selecting a low number of explanatory variables or when using a set of training data in which limited variations of the processing parameters are considered.
5.2. Prediction Accuracy
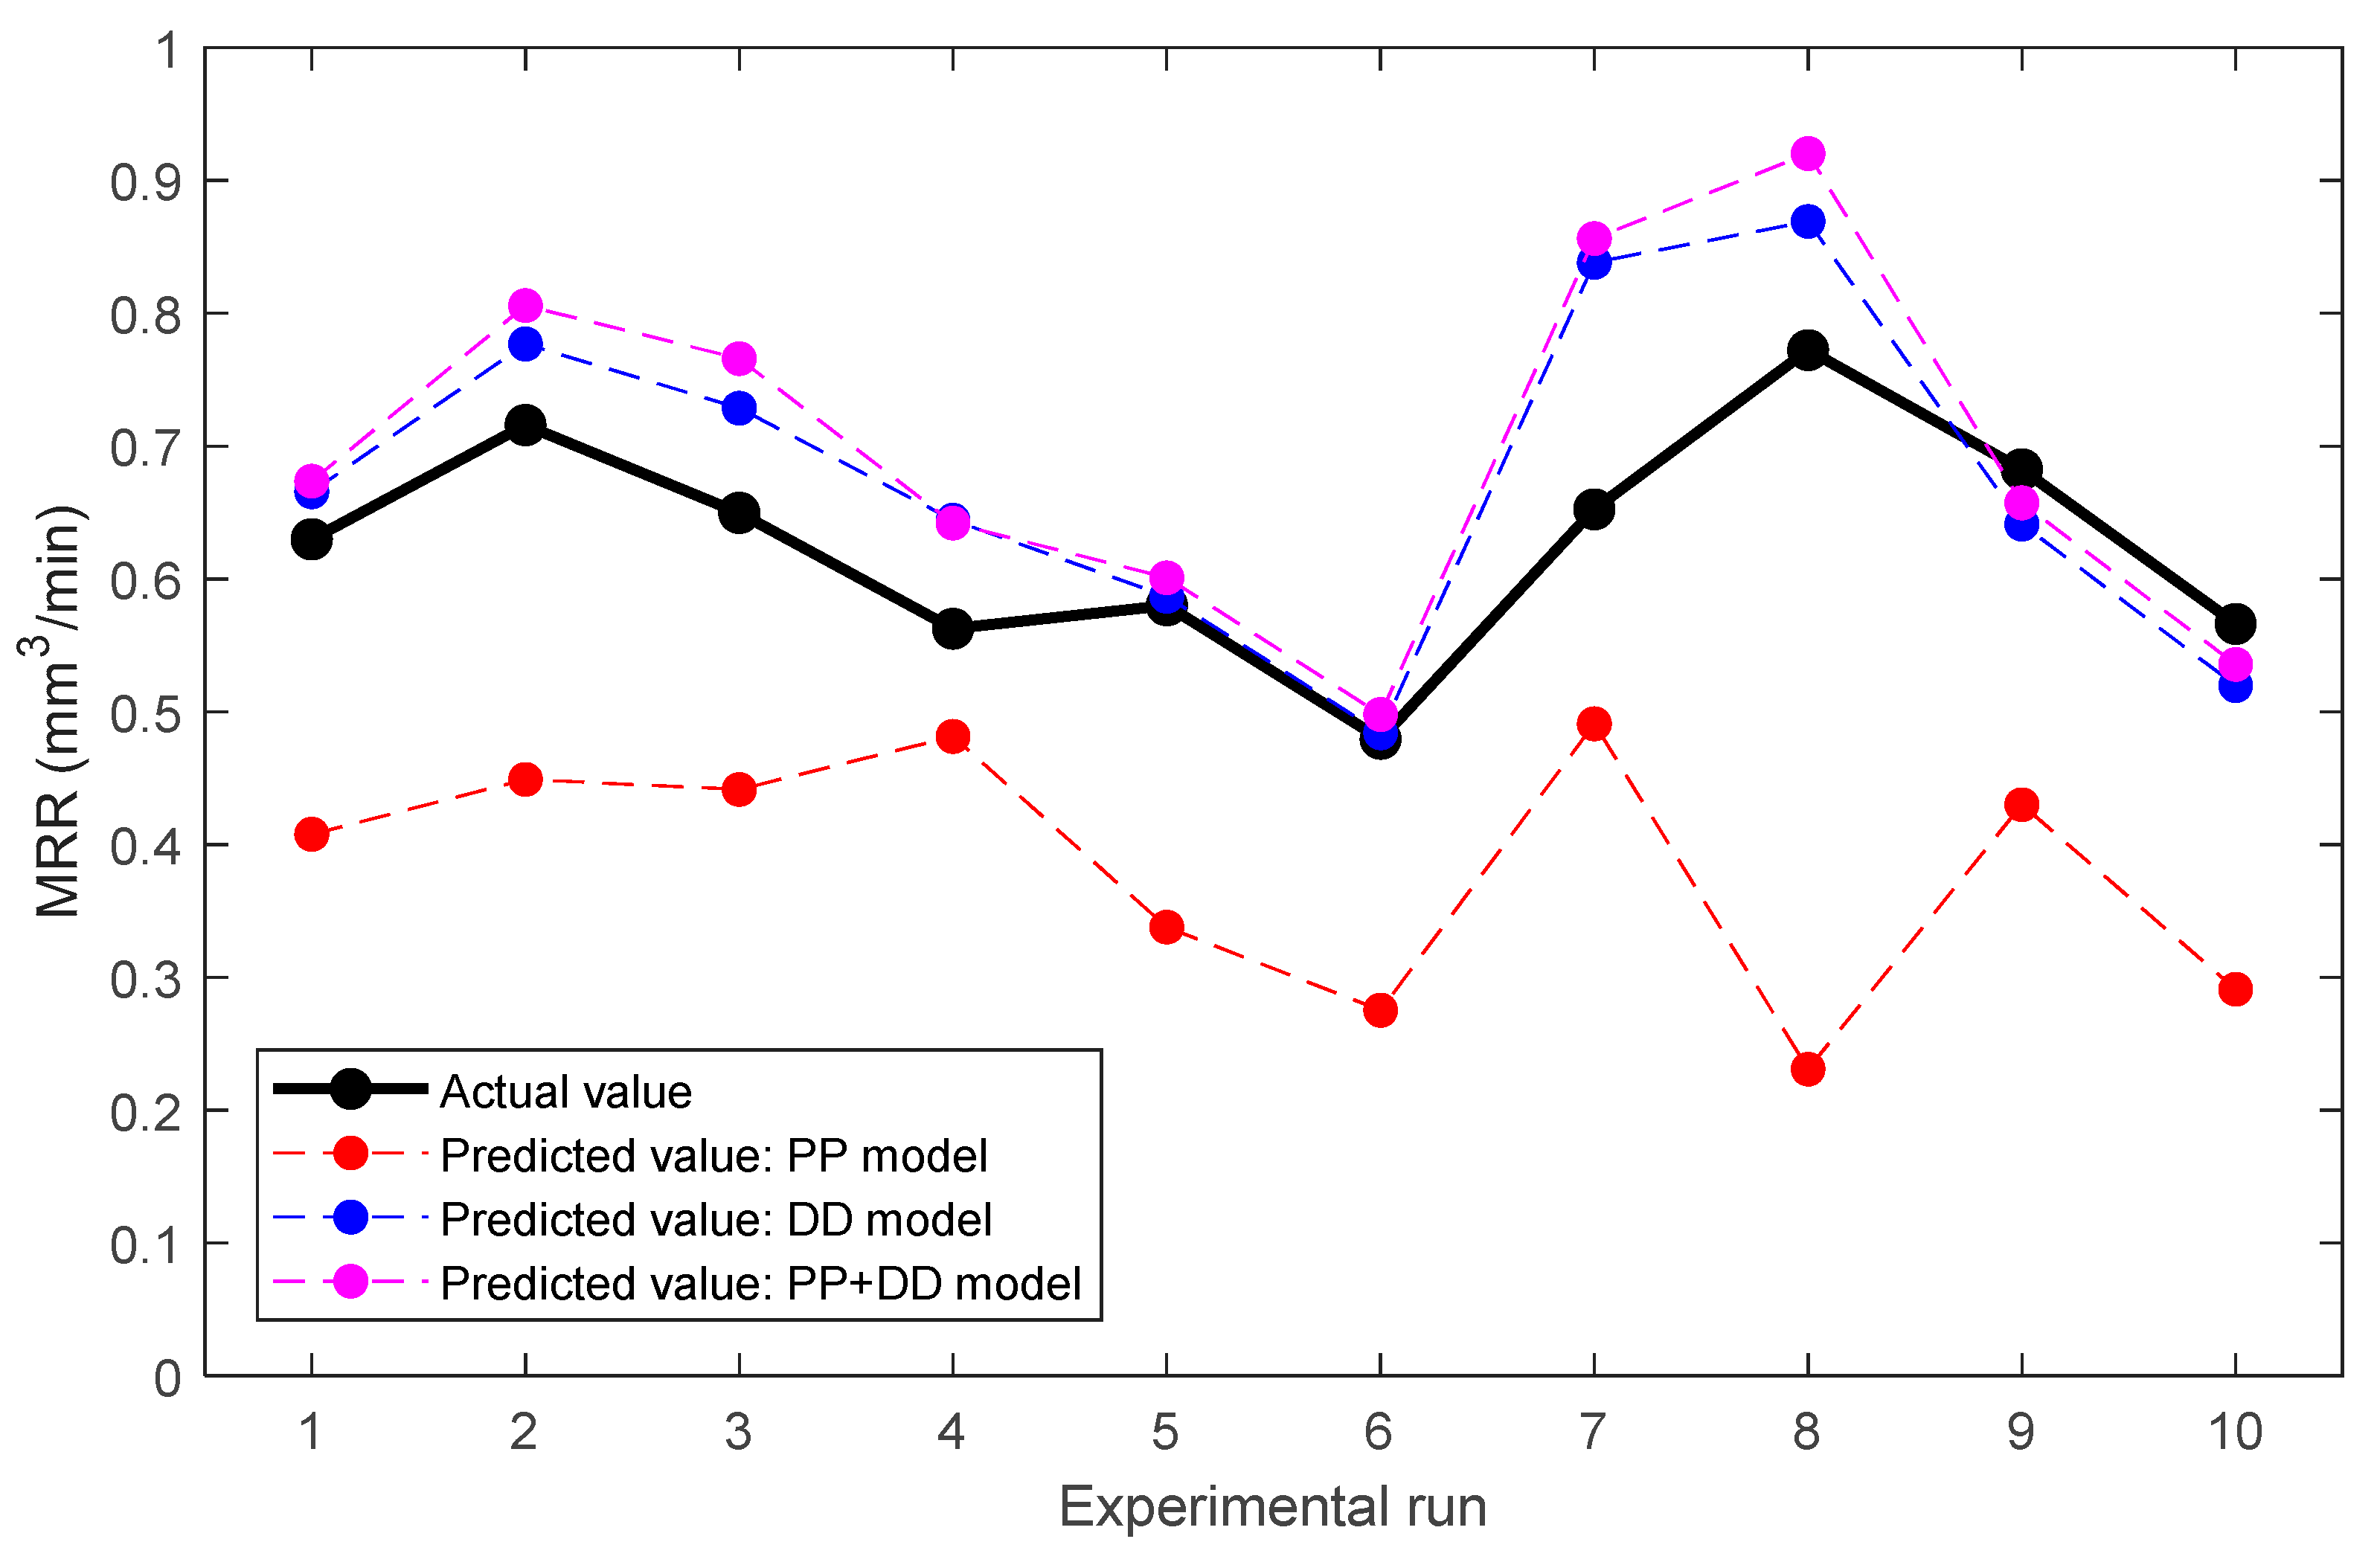
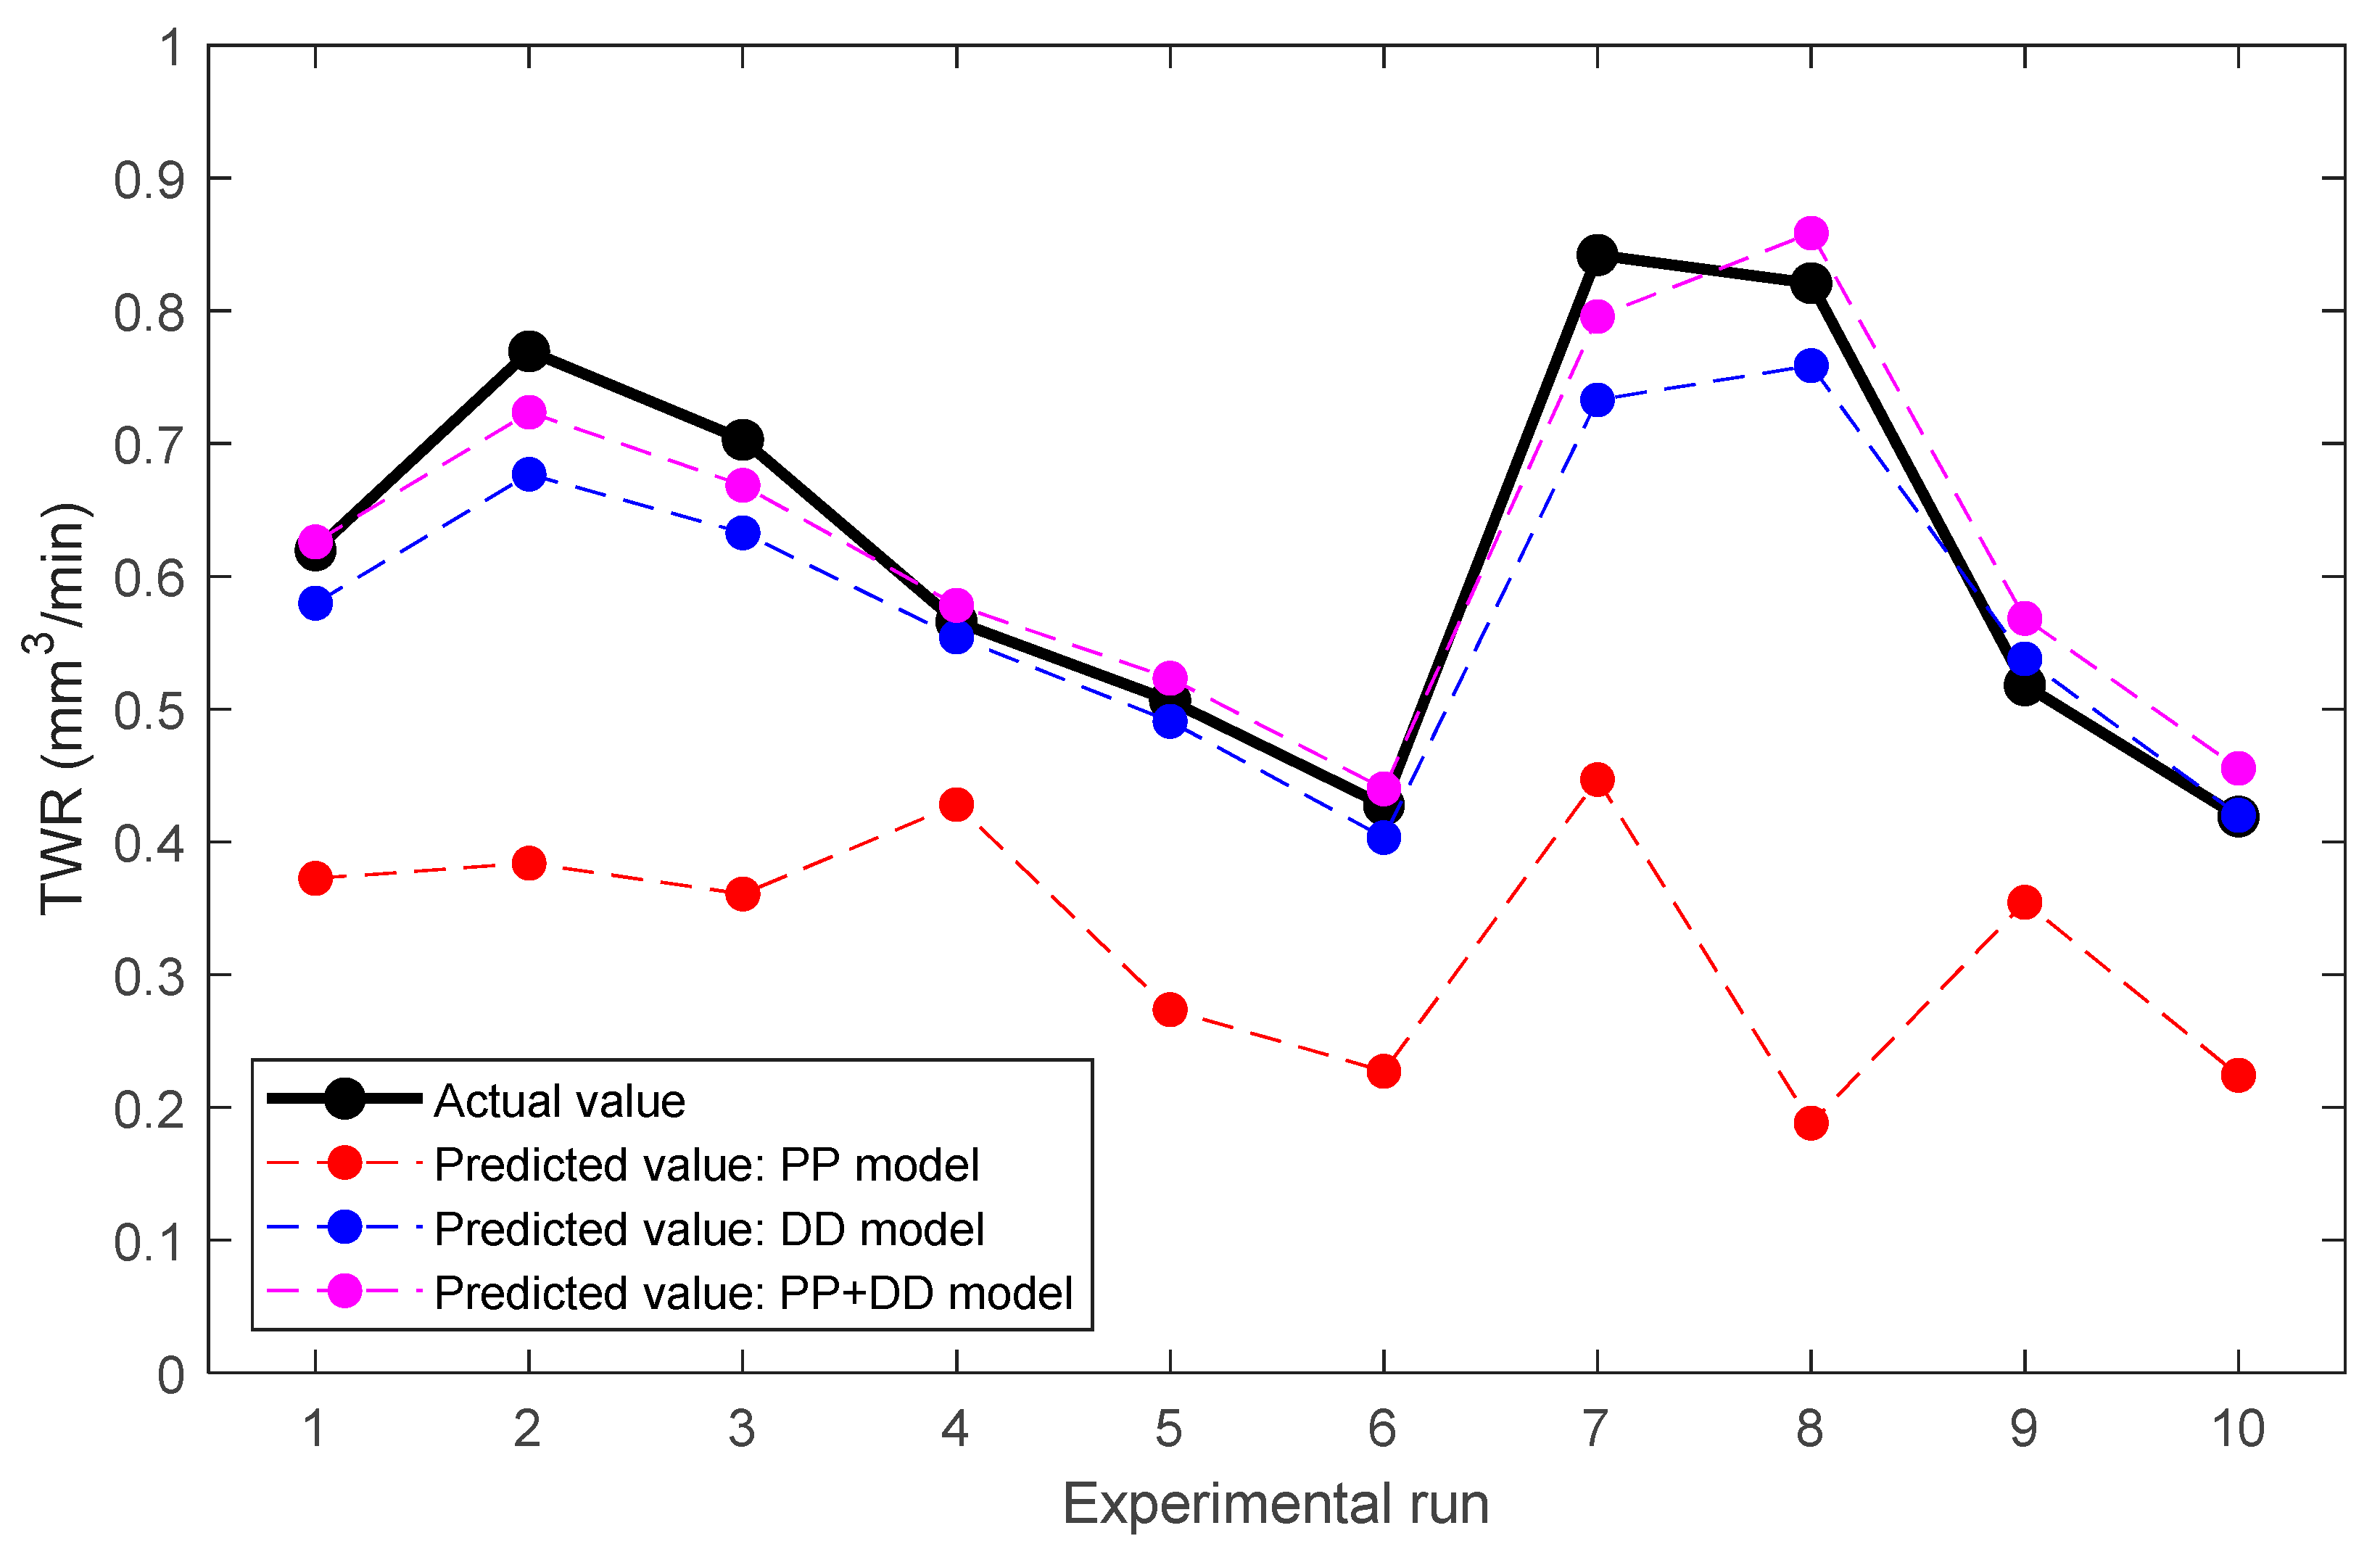
The predictions of the MRR and TWR for the three predictive models are shown in Figure 6 and Figure 7 respectively. When comparing the performance of the DD or DD + PP models with that of the PP model, an improved pattern can be seen. This suggests that, when including the data collected through process monitoring, the prediction is more accurate than when only considering the processing parameters. This is because many factors influence the material removal process besides the set of processing parameters, which is given as input by the machine user. An example is the flow field generated by dielectric flushing, which determines the temperature, pressure and velocity distributions within the discharge gap [30,31,32]. The effects of the flow field have been illustrated and analysed by physical-based models and calculated by finite element methods [30,33,34], showing to have a significant impact on the material removal process by electric discharges. The combination of thermal and electric action in material removal also influences the discharging process [35]. The improved prediction when using data collected during the drilling process shows that data-driven predictive models are capable of considering the effects of other influencing factors besides the processing parameters.
In order to better quantify the prediction accuracy of the three predictive models, the squared difference (SD) for the ten experimental runs can be analysed (Table 5). It can be noticed that the SD values for the DD and PP + DD models are significantly lower than the ones for the PP model, both for the MRR and TWR predictions. In particular, the reduction in the average of the SD values range between 85% and 95%. The standard deviations of the SD values are also considerably smaller for the DD and PP + DD models, indicating a reduction of the maximum deviation between the actual and predicted values of the MRR and TWR. This further proves that data collected during the drilling process can reduce the prediction error of the regression models.
The NRMSE errors for the three regression models are listed in Table 6. For material removal prediction, the NRMSE is decreased of about 69% and 63% when the DD and DD + PP models are respectively used instead of the PP model. For tool wear prediction, the reductions in the NRMSE error are about 82% and 89% respectively. It can be noticed that the DD model is the model performing better when predicting the MRR, while the DD + PP model outperforms the other two models when predicting the TWR. However, the values of the NRMSE errors for the DD and DD + PP models are very close in both cases. If taking into account that the prediction accuracy of the two models is evaluated by considering a very limited number of experimental runs, it is difficult to state which of the two models is actually performing better. Anyway, the advantages of data-driven approaches are clear. Future research work should focus on evaluation of the prediction accuracy of the DD and DD + PP models using a more extensive dataset. The use of data-driven approaches for regression models could also be advantageous for monitoring, predicting and controlling the drilling process in real-time. This is discussed in the following section.
5.3. Real-Time Wear Prediction and Hole Depth Control
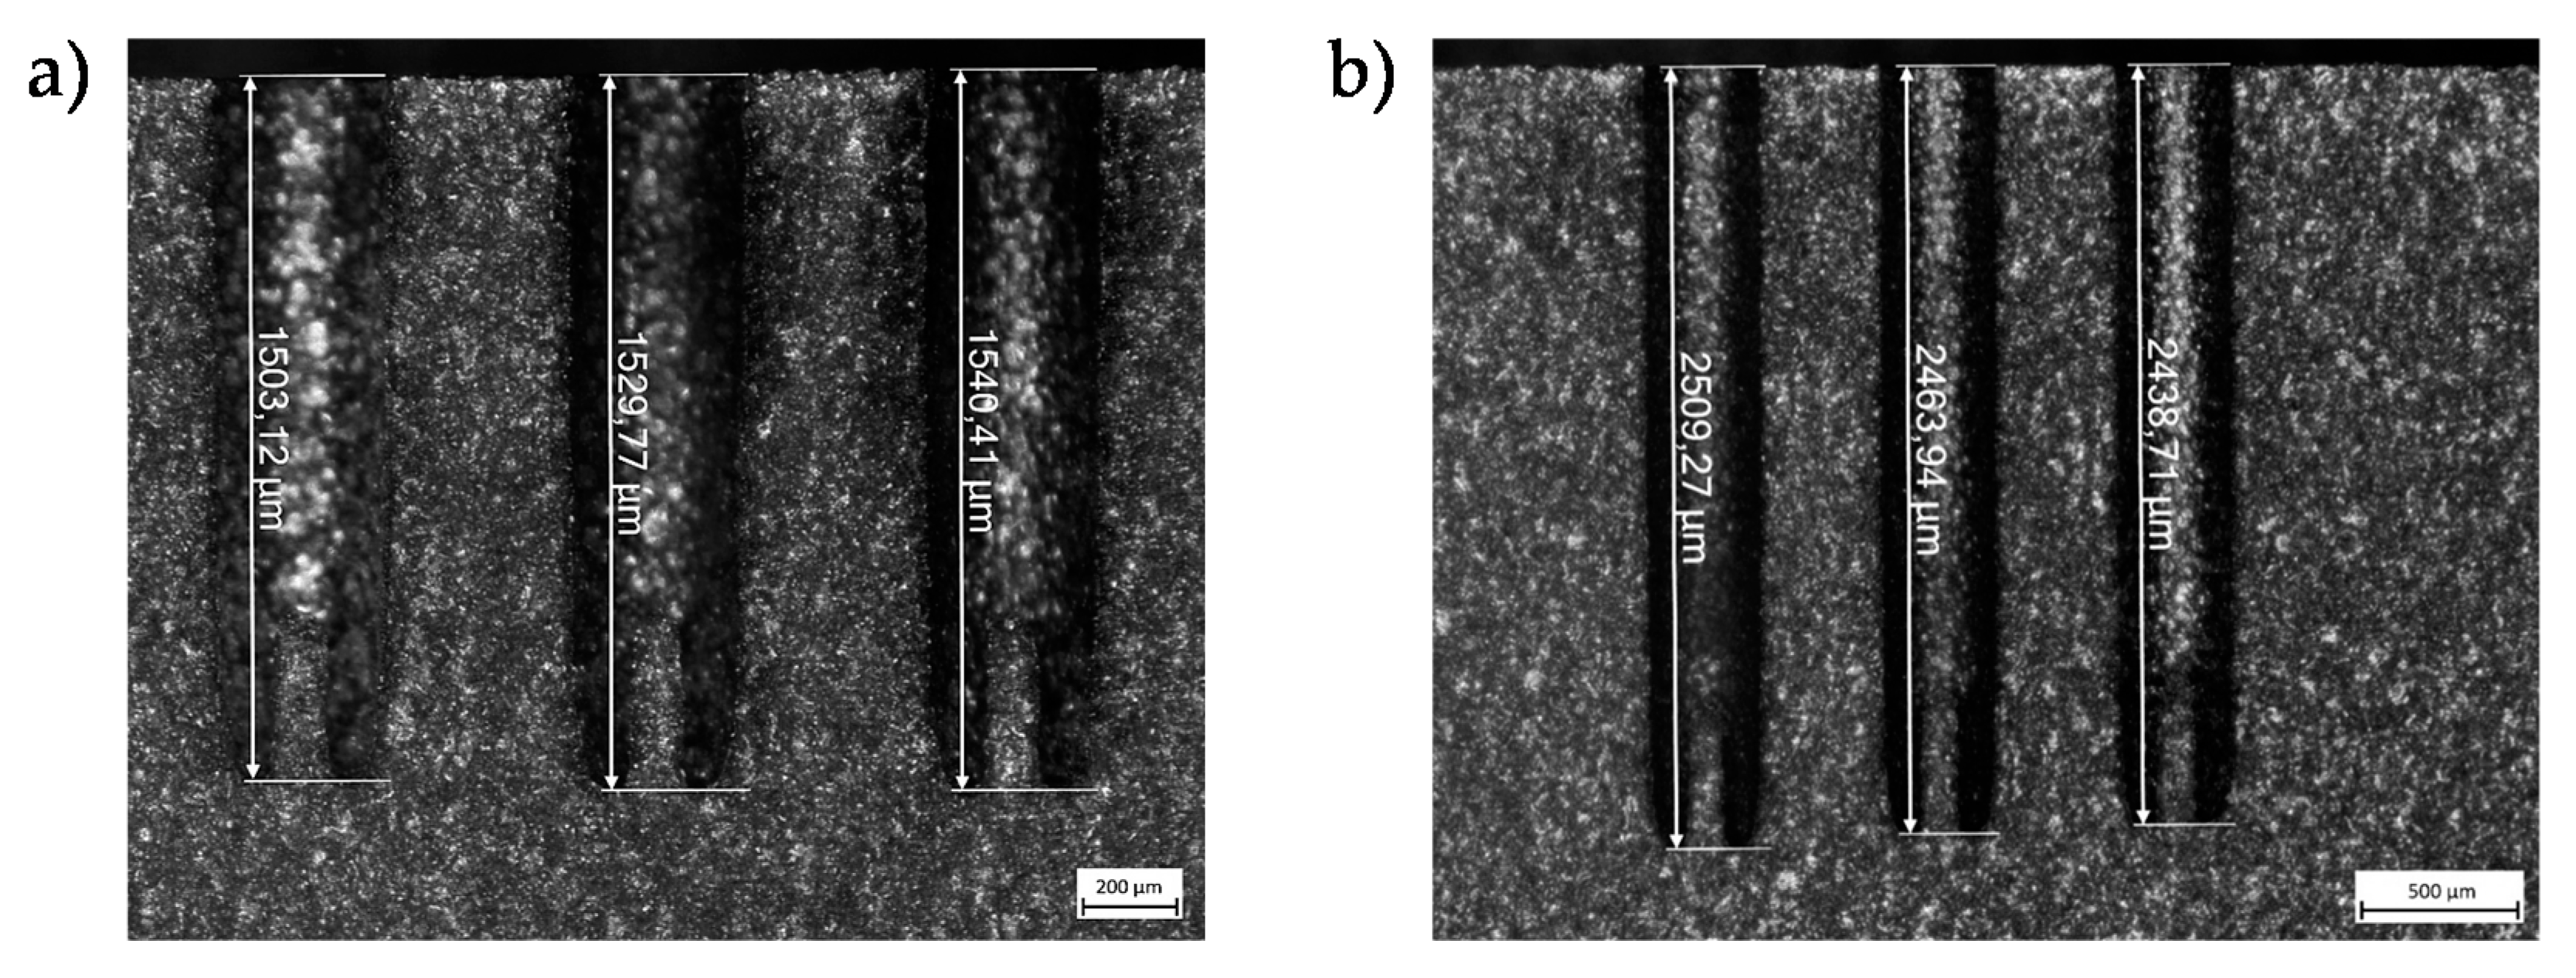
Figure 8a,b show the cross sections of some micro-EDM holes, which were drilled by applying the control strategy presented in Section 4 but choosing different predictive models. In both images it can be seen that the actual hole depth (Ha) is closer to the target hole depth (Ht) when selecting the PP+DD model or DD model for predicting the tool wear. The depth error (ΔH) is below 10 µm when the DD + PP model is selected, while it is as high as 62 µm when the PP model is applied to drill a hole of target depth equal to 2.5 mm. This indicates that tool wear prediction based on data-driven approaches can be considerably more accurate than traditional approaches based on the sole processing parameters. However, it is noteworthy to mention that in this study real-time tool wear prediction is tested in drilling micro holes having an aspect ratio in the range 5–7. This is similar to the aspect ratio of the micro holes that were drilled for generating the training data, which was equal to 5.7. Future investigations will focus on proving the advantages of the DD model in drilling holes having a significantly higher aspect ratio than the ones drilled for generating the training data. In this case, a more advanced strategy for calculating the average values of the monitored quantities (Fp, Vf, and U) might also be required.
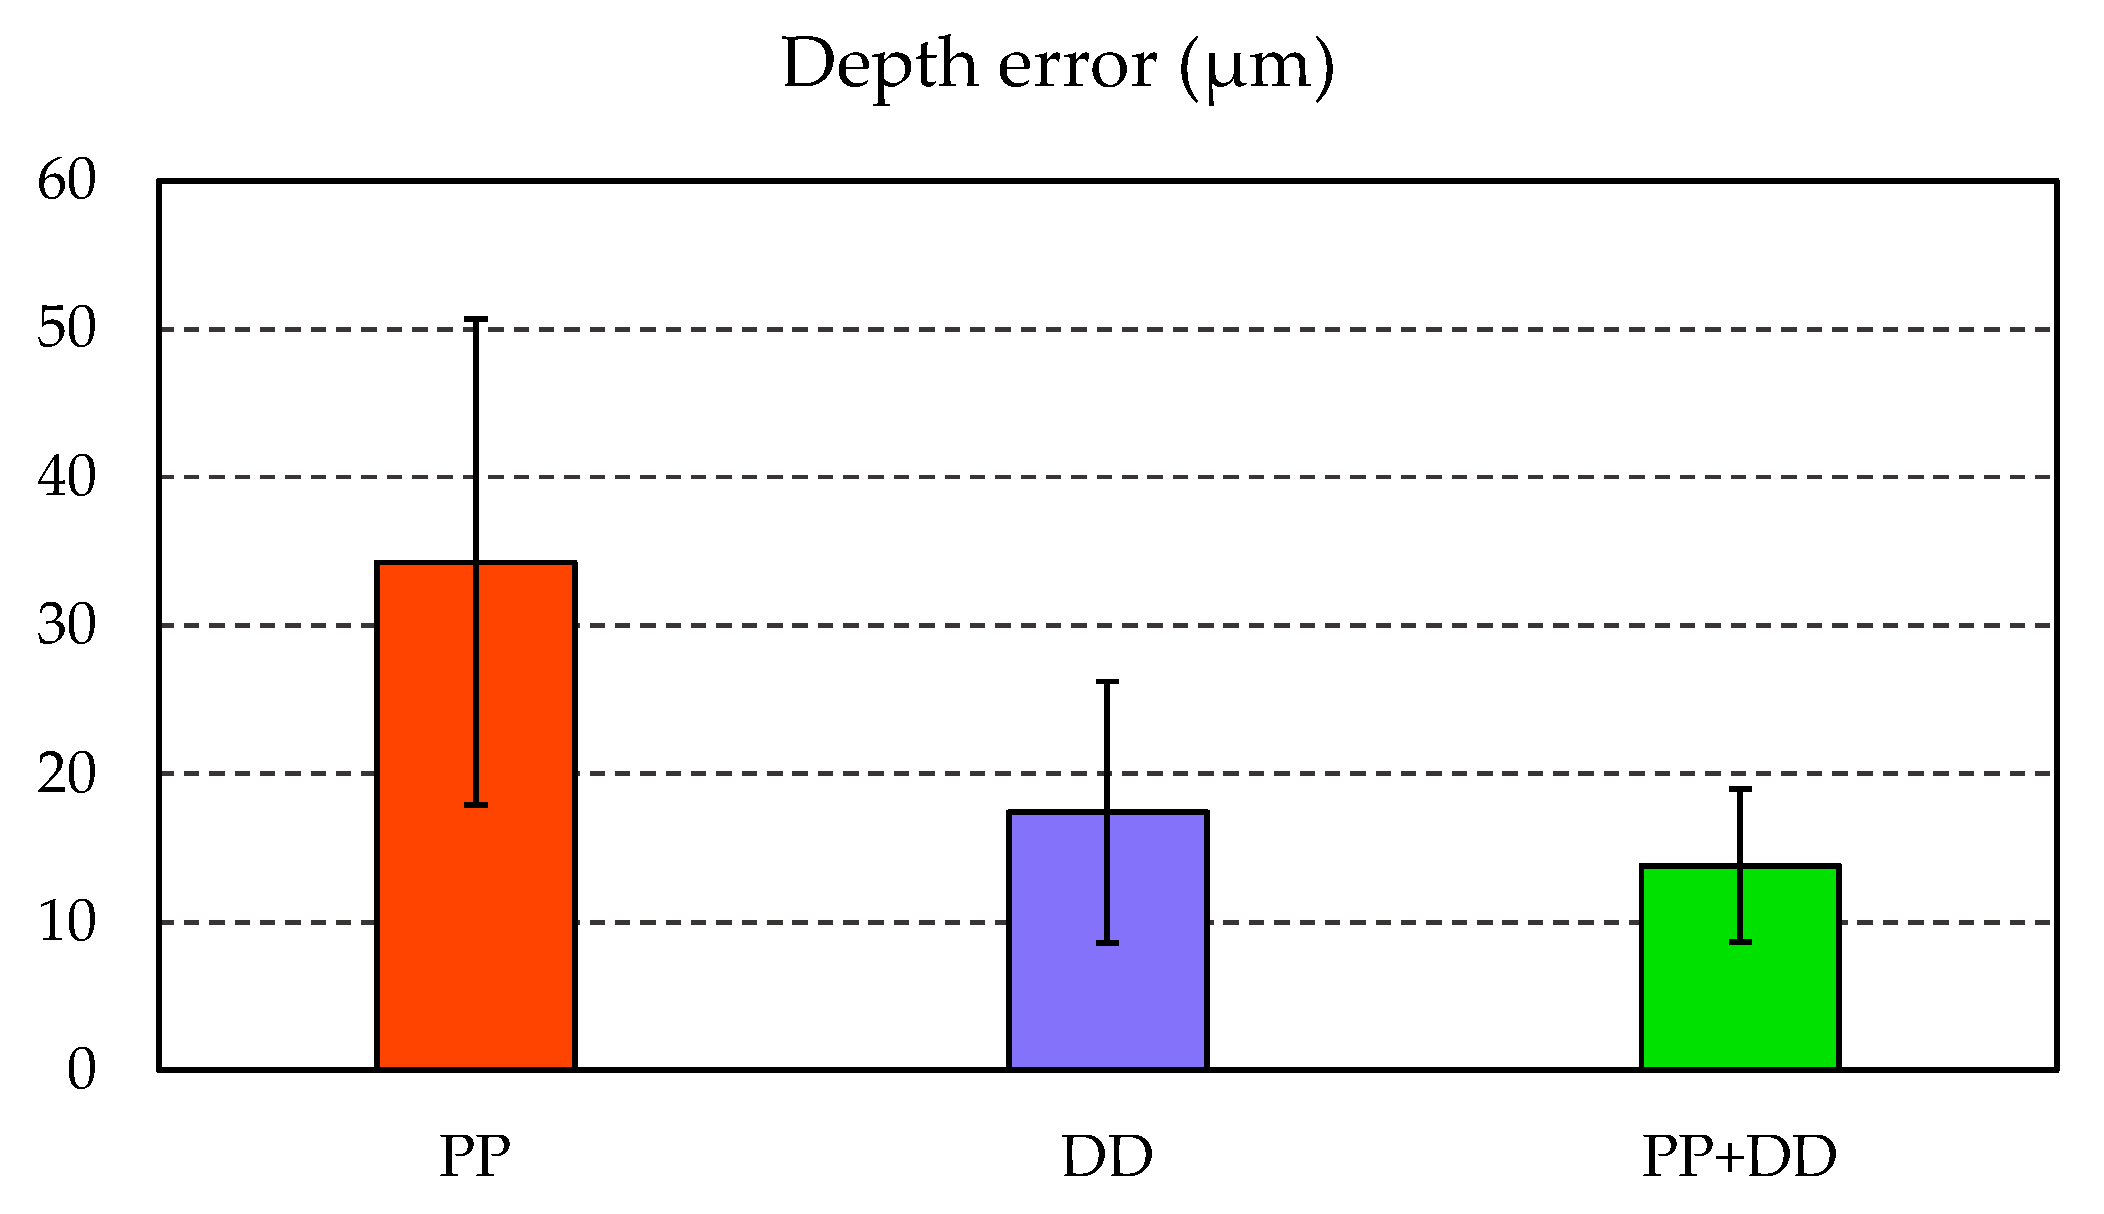
In order to further study the capability of the different predictive models, the micro-EDM drilling experiments were repeated 7 times for each predictive model, for a total of 21 drilled holes. The depth errors for each predictive model are shown in Figure 9. The average depth error when applying the PP + DD model is the lowest. It is roughly 50% lower than the average depth error for the PP model. The deviation between the results is also significantly lower when the PP + DD model or DD model are applied instead of the PP model. The results show that implementing PP + DD or DD model into the control strategy has a clear improvement both on accuracy and precision of the drilling process if compared to the PP model. This demonstrates the significance of data-driven approaches for robust in-process monitoring and controlling strategy in micro-EDM drilling.
In this work, the average values of the amount of normal discharge pulses per unit time, feed rate and gap voltage are considered. However, more advanced techniques for data processing could be implemented in order to obtain more information from the data collected during the process, for example by using pattern recognition techniques [36,37]. This could further increase the prediction accuracy of the regression models, thus reducing the drilling depth error.
6. Conclusions
Methodologies for predicting the material removal rate (MRR) and tool wear rate (TWR) are crucial for precisely controlling the hole depth in micro-EDM drilling. In this work, the capacity and advantages of multiple linear regression (MLR) models, in which data collected through process monitoring are used, have been tested and verified. Data collected by following a Design of Experiments (DoE) have been used for training the MLR models. Validation experiments by applying random processing parameters within the process window defined by the DoE have been used. This way, the prediction accuracy of the different models could be tested in experimental conditions which differ from the ones applied when recording the training data.
The accuracy in predicting the MRR and TWR has been shown to significantly increase when using data-driven approaches rather than traditional methods based only on a correlation between the process performance indicators and the processing parameters. Experiments have also been performed by applying data-driven approaches for real-time tool wear prediction during the drilling process, showing that implementing data-driven MLR models into the process control strategy can lead to a more precise control of the hole depth.
This work has confirmed the advantages of data-driven approaches for tool wear and material removal prediction. Future work will aim to extend the dataset by considering holes of higher aspect ratio (i.e., higher than 30) in order to investigate the applicability of data-driven regression models on a wider variety of industrial applications of the micro-EDM process. With more extensive datasets, future research will also focus on studying more advanced approaches for extracting information from the monitored signals rather than using the average values as well as on investigating different methods than linear regression.
Author Contributions
Conceptualisation, M.B. and M.W.; methodology, M.B. and M.W.; micro-EDM drilling experiments, M.B.; software, M.B.; writing—original draft preparation, M.B.; writing—review and editing, M.W., J.Q. and D.R.; supervision, J.Q. and D.R. All authors have read and agreed to the published version of the manuscript.
Funding
The authors gratefully acknowledge the partial financial support from the European Union’s Horizon 2020 projects Microman (Project ID: 674801) and ProSurf (Project ID: 767589) and from Flanders Make vzw.
Conflicts of Interest
The authors declare no conflict of interest.
References
- Biscaia, R.V.B.; Ribas, M.T.; Júnior, A.B. Effects of processing parameters on the micro-drilling through fast hole electroerosion and laser trepanning in Inconel 718. Int. J. Adv. Manuf. Technol. 2020, 106, 31–45. [Google Scholar] [CrossRef]
- Kumar, K.; Singh, V.; Katyal, P.; Sharma, N. EDM μ-drilling in Ti-6Al-7Nb: Experimental investigation and optimization using NSGA-II. Int. J. Adv. Manuf. Technol. 2019, 104, 2727–2738. [Google Scholar] [CrossRef]
- Mufti, N.A.; Rafaqat, M.; Ahmed, N.; Saleem, M.Q.; Hussain, A.; Al-Ahamri, A.M. Improving the performance of EDM through relief-angled tool designs. Appl. Sci. 2020, 10, 2432. [Google Scholar] [CrossRef] [Green Version]
- Tong, H.; Li, Y.; Zhang, L.; Li, B. Mechanism design and process control of micro EDM for drilling spray holes of diesel injector nozzles. Precis. Eng. 2013, 37, 213–221. [Google Scholar] [CrossRef]
- Li, Z.Y.; Wei, X.T.; Guo, Y.B.; Sealy, M.P. State-Of-Art, Challenges, and Outlook on Manufacturing of Cooling Holes for Turbine Blades. Mach. Sci. Technol. 2015, 19, 361–399. [Google Scholar] [CrossRef]
- D’Urso, G.; Maccarini, G.; Ravasio, C. Process performance of micro-EDM drilling of stainless steel. Int. J. Adv. Manuf. Technol. 2014, 72, 1287–1298. [Google Scholar] [CrossRef]
- Kuppan, P.; Narayanan, S.; Rajadurai, A.; Adithan, M. Effect of EDM parameters on hole quality characteristics in deep hole drilling of Inconel 718 superalloy. Int. J. Manuf. Res. 2015, 10, 45. [Google Scholar] [CrossRef]
- Skoczypiec, S.; Machno, M.; Bizoń, W. The capabilities of electrodischarge microdrilling of high aspect ratio holes in ceramic materials. Manag. Prod. Eng. Rev. 2015, 6, 61–69. [Google Scholar] [CrossRef] [Green Version]
- Puertas, I.; Luis, C.J.; Álvarez, L. Analysis of the influence of EDM parameters on surface quality, MRR and EW of WC-Co. J. Mater. Process. Technol. 2004, 153, 1026–1032. [Google Scholar] [CrossRef]
- Mohan, B.; Rajadurai, A.; Satyanarayana, K.G. Electric discharge machining of Al-SiC metal matrix composites using rotary tube electrode. J. Mater. Process. Technol. 2004, 153, 978–985. [Google Scholar] [CrossRef]
- Suganthi, X.H.; Natarajan, U.; Sathiyamurthy, S.; Chidambaram, K. Prediction of quality responses in micro-EDM process using an adaptive neuro-fuzzy inference system (ANFIS) model. Int. J. Adv. Manuf. Technol. 2013, 68, 339–347. [Google Scholar] [CrossRef]
- Barenji, R.V.; Pourasl, H.H.; Khojastehnezhad, V.M. Electrical discharge machining of the AISI D6 tool steel: Prediction and modeling of the material removal rate and tool wear ratio. Precis. Eng. 2016, 45, 435–444. [Google Scholar] [CrossRef]
- Gao, Q. Impact of electrode length on EDM inclined hole drilling process. Int. J. Adv. Manuf. Technol. 2018, 94, 1171–1175. [Google Scholar] [CrossRef]
- Li, Z.; Bai, J. Impulse discharge method to investigate the influence of gap width on discharge characteristics in micro-EDM. Int. J. Adv. Manuf. Technol. 2017, 90, 1769–1777. [Google Scholar] [CrossRef]
- Bissacco, G.; Hansen, H.; Tristo, G.; Valentincic, J. Feasibility of wear compensation in micro EDM milling based on discharge counting and discharge population characterization. CIRP Ann. Manuf. Technol. 2011, 60, 231–234. [Google Scholar] [CrossRef]
- D’Urso, G.; Ravasio, C. The effects of electrode size and discharged power on micro-electro-discharge machining drilling of stainless steel. Adv. Mech. Eng. 2016, 8, 1–12. [Google Scholar] [CrossRef] [Green Version]
- Bellotti, M.; Qian, J.; Reynaerts, D. Process Fingerprint in Micro-EDM Drilling. Micromachines 2019, 10, 240. [Google Scholar] [CrossRef] [Green Version]
- Mohanty, S.; Kumar, V.; Kumar Das, A.; Dixit, A.R. Surface modification of Ti-alloy by micro-electrical discharge process using tungsten disulphide powder suspension. J. Manuf. Process. 2019, 37, 28–41. [Google Scholar] [CrossRef]
- Qudeiri, J.E.A.; Mourad, A.I.; Ziout, A.; Abidi, M.H.; Elkaseer, A. Electric discharge machining of titanium and its alloys: Review. Int. J. Adv. Manuf. Technol. 2018, 96, 1319–1339. [Google Scholar] [CrossRef]
- Xia, W.; Zhang, Y.; Chen, M.; Zhao, W. Study on Gap Phenomena Before and After the Breakout Event of Fast Electrical Discharge Machining Drilling. J. Manuf. Sci. Eng. 2020, 142. [Google Scholar] [CrossRef]
- Bellotti, M.; Qian, J.; Reynaerts, D. Breakthrough phenomena in drilling micro holes by EDM. Int. J. Mach. Tools Manuf. 2019, 146. [Google Scholar] [CrossRef]
- Moses, M.D.; Jahan, M.P. Micro-EDM machinability of difficult-to-cut Ti-6Al-4V against soft brass. Int. J. Adv. Manuf. Technol. 2015, 81, 1345–1361. [Google Scholar] [CrossRef]
- D’Urso, G.; Merla, C. Workpiece and electrode influence on micro-EDM drilling performance. Precis. Eng. 2014, 38, 903–914. [Google Scholar] [CrossRef]
- Bellotti, M.; Qian, J.; Reynaerts, D. Enhancement of the micro-EDM process for drilling through-holes. Procedia CIRP 2018, 68, 610–615. [Google Scholar] [CrossRef]
- Karthikeyan, G.; Ramkumar, J.; Dhamodaran, S.; Aravindan, S. Micro electric discharge milling process performance: An experimental investigation. Int. J. Mach. Tools Manuf. 2010, 50, 718–727. [Google Scholar] [CrossRef]
- Pham, D.T.; Ivanov, A.; Bigot, S.; Popov, K.; Dimov, S. An investigation of tube and rod electrode wear in micro EDM drilling. Int. J. Adv. Manuf. Technol. 2007, 33, 103–109. [Google Scholar] [CrossRef]
- Kar, S.; Patowari, P.K. Electrode wear phenomenon and its compensation in micro electrical discharge milling: A review. Mater. Manuf. Process. 2018, 33, 1491–1517. [Google Scholar] [CrossRef]
- Qudeiri, J.E.A.; Zaiout, A.; Mourad, A.-H.I.; Abidi, M.H.; Elkaseer, A. Principles and Characteristics of Different EDM Processes in Machining Tool and Die Steels. Appl. Sci. 2020, 10, 2082. [Google Scholar] [CrossRef] [Green Version]
- Bellotti, M.; Qian, J.; Reynaerts, D. Self-tuning breakthrough detection for EDM drilling micro holes. J. Manuf. Process. 2020, 57, 630–640. [Google Scholar] [CrossRef]
- Shabgard, M.; Ahmadi, R.; Seyedzavvar, M.; Oliaei, S.N.B. Mathematical and numerical modeling of the effect of input-parameters on the flushing efficiency of plasma channel in EDM process. Int. J. Mach. Tools Manuf. 2013, 65, 79–87. [Google Scholar] [CrossRef]
- Wu, M.; Liu, J.; He, J.; Chen, X.; Guo, Z. Fabrication of surface microstructures by mask electrolyte jet machining. Int. J. Mach. Tools Manuf. 2020, 148, 103471. [Google Scholar] [CrossRef]
- Nadda, R.; Nirala, C.K. Thermal modeling of single discharge in prospect of tool wear compensation in μEDM. Int. J. Adv. Manuf. Technol. 2020, 107, 4573–4595. [Google Scholar] [CrossRef]
- Somashekhar, K.P.; Panda, S.; Mathew, J.; Ramachandran, N. Numerical simulation of micro-EDM model with multi-spark. Int. J. Adv. Manuf. Technol. 2013, 6, 83–90. [Google Scholar] [CrossRef]
- Li, X.; Wei, D.; Li, Q.; Yang, X. Study on effects of electrode material and dielectric medium on arc plasma in electrical discharge machining. Int. J. Adv. Manuf. Technol. 2020, 107, 4403–4413. [Google Scholar] [CrossRef]
- Guo, J.; Zhang, G.; Huang, Y.; Ming, W.; Liu, M.; Huang, H. Investigation of the removing process of cathode material in micro-EDM using an atomistic-continuum model. Appl. Surf. Sci. 2014, 315, 323–336. [Google Scholar] [CrossRef]
- Neal, R.M. Pattern Recognition and Machine Learning. Technometrics 2007, 49, 366. [Google Scholar] [CrossRef]
- Schmidhuber, J. Deep Learning in neural networks: An overview. Neural Netw. 2015, 61, 85–117. [Google Scholar] [CrossRef] [Green Version]
Figure 1.
Micro-EDM drilling setup.

Figure 2.
Flowchart of the control strategy for hole depth control based on in-process wear prediction.
Figure 2.
Flowchart of the control strategy for hole depth control based on in-process wear prediction.

Figure 3.
Schematic of micro-EDM drilling experiments using two-part specimens.

Figure 4.
Main effect plots of the investigated processing parameters on the material removal rate (MRR) and tool wear rate (TWR).
Figure 4.
Main effect plots of the investigated processing parameters on the material removal rate (MRR) and tool wear rate (TWR).

Figure 5.
Correlation plots of the average amount of normal discharge pulses per time unit (Fp), average tool feed rate (Vf), and average gap voltage (U) with the material removal rate (MRR) and tool wear rate (TWR). In each graph, the data points are the average values computed at the end of each drilling experiments and the dashed line is the linear correlation line. The coefficient of determination (R2) is also shown.

Figure 6.
Prediction of material removal rate (MRR) with different regression models.

Figure 7.
Prediction of tool wear rate (TWR) with different regression models.

Figure 8.
Cross sections of micro-EDMed blind holes. In both images, the three holes are drilled by applying the in-process wear prediction strategy and selecting the following MLR models (from left to right): PP + DD, DD, and PP. The target hole depths are (a) 1500 µm and (b) 2500 µm. The images are taken by means of a ZEISS® SteREO Discovery V20 microscope (Carl Zeiss Microscopy GmbH, Germany).

Figure 9.
Depth error (ΔH) for the control strategy when applying different predictive models. The average depth error considering 7 holes is shown. The error bars are the standard deviations.
Figure 9.
Depth error (ΔH) for the control strategy when applying different predictive models. The average depth error considering 7 holes is shown. The error bars are the standard deviations.


Table 1.
Training dataset: Factors and levels of the DoE.
| Factor | Processing Parameter | Symbol | Unit | Level − 1 | Level + 1 |
|---|---|---|---|---|---|
| A | Pulse-on time | Ton | µs | 3 | 7 |
| B | Open voltage | Uo | V | 80 | 160 |
| C | Charging frequency | F | kHz | 40 | 100 |
| D | Gain factor | K | – | 20 | 80 |
| E | Reference voltage | Ue | V | 30 | 70 |
Table 2.
Validation dataset: Applied processing parameters.
| Run | Processing Parameters | ||||
|---|---|---|---|---|---|
| # | Ton (µs) | Uo (V) | F (kHz) | K (-) | Ue (V) |
| 1 | 7 | 130 | 83 | 62 | 62 |
| 2 | 4 | 139 | 81 | 37 | 45 |
| 3 | 3 | 131 | 83 | 27 | 31 |
| 4 | 6 | 144 | 68 | 77 | 56 |
| 5 | 3 | 117 | 61 | 65 | 55 |
| 6 | 5 | 108 | 67 | 45 | 59 |
| 7 | 7 | 141 | 95 | 53 | 50 |
| 8 | 4 | 82 | 96 | 57 | 54 |
| 9 | 5 | 132 | 57 | 53 | 39 |
| 10 | 4 | 102 | 58 | 61 | 47 |
Table 3.
Explanatory variables used in each predictive model.
| Model | Explanatory Variables | |||||||
|---|---|---|---|---|---|---|---|---|
| X1 | X2 | X3 | X4 | X5 | X6 | X7 | X8 | |
| PP | Ton | Uo | F | K | Ue | - | - | - |
| DD | Fp | Vf | U | - | - | - | - | - |
| PP + DD | Ton | Uo | F | K | Ue | Fp | Vf | U |
Table 4.
Regression coefficients for the predictive models.
| Model | Response | Coefficients | ||||||||
|---|---|---|---|---|---|---|---|---|---|---|
| c0 | c1 | c2 | c3 | c4 | c5 | c6 | c7 | c8 | ||
| PP | MRR | −0.171 | 0.003 | 0.004 | 0.001 | 0.001 | −0.003 | - | - | - |
| DD | MRR | −0.000 | 0.000 | 0.001 | 0.001 | - | - | - | - | - |
| PP + DD | MRR | 0.002 | 0.000 | 0.000 | 0.000 | 0.000 | 0.000 | 0.000 | 0.001 | 0.000 |
| PP | TWR | −0.303 | 0.007 | 0.004 | 0.002 | 0.001 | −0.002 | - | - | - |
| DD | TWR | −0.001 | 0.000 | 0.000 | 0.000 | - | - | - | - | - |
| PP + DD | TWR | −0.083 | 0.003 | 0.001 | 0.000 | 0.000 | 0.001 | 0.001 | 0.043 | 0.000 |
Table 5.
Squared difference (SD) between predicted and observed values.
| Run | Material Removal Prediction | Tool Wear Prediction | ||||
|---|---|---|---|---|---|---|
| # | PP | DD | PP + DD | PP | DD | PP + DD |
| 1 | 0.0518 | 0.0013 | 0.0022 | 0.0679 | 0.0016 | 0.0001 |
| 2 | 0.0697 | 0.0037 | 0.0081 | 0.1435 | 0.0086 | 0.0021 |
| 3 | 0.0411 | 0.0062 | 0.0131 | 0.1080 | 0.0049 | 0.0009 |
| 4 | 0.0070 | 0.0067 | 0.0066 | 0.0209 | 0.0001 | 0.0001 |
| 5 | 0.0561 | 0.0001 | 0.0004 | 0.0481 | 0.0002 | 0.0004 |
| 6 | 0.0417 | 0.0001 | 0.0004 | 0.0402 | 0.0006 | 0.0001 |
| 7 | 0.0279 | 0.0346 | 0.0430 | 0.1668 | 0.0119 | 0.0029 |
| 8 | 0.2901 | 0.0094 | 0.0216 | 0.3918 | 0.0038 | 0.0016 |
| 9 | 0.0637 | 0.0017 | 0.0006 | 0.0267 | 0.0004 | 0.0023 |
| 10 | 0.0742 | 0.0022 | 0.0009 | 0.0354 | 0.0001 | 0.0013 |
| Average | 0.0723 | 0.0066 | 0.0097 | 0.1049 | 0.0032 | 0.0012 |
| Std. dev. | 0.0791 | 0.0103 | 0.0136 | 0.1128 | 0.0041 | 0.0010 |
Table 6.
Normalised mean square error (NRMSE) for the regression models.
| Material Removal Prediction | Tool Wear Prediction | |||||
|---|---|---|---|---|---|---|
| PP | DD | PP + DD | PP | DD | PP + DD | |
| NRMSE | 0.4275 | 0.1289 | 0.1564 | 0.5235 | 0.0921 | 0.0551 |
© 2020 by the authors. Licensee MDPI, Basel, Switzerland. This article is an open access article distributed under the terms and conditions of the Creative Commons Attribution (CC BY) license (http://creativecommons.org/licenses/by/4.0/).
Share and Cite
MDPI and ACS Style
Bellotti, M.; Wu, M.; Qian, J.; Reynaerts, D. Tool Wear and Material Removal Predictions in Micro-EDM Drilling: Advantages of Data-Driven Approaches. Appl. Sci. 2020, 10, 6357. https://0-doi-org.brum.beds.ac.uk/10.3390/app10186357
AMA Style
Bellotti M, Wu M, Qian J, Reynaerts D. Tool Wear and Material Removal Predictions in Micro-EDM Drilling: Advantages of Data-Driven Approaches. Applied Sciences. 2020; 10(18):6357. https://0-doi-org.brum.beds.ac.uk/10.3390/app10186357
Chicago/Turabian StyleBellotti, Mattia, Ming Wu, Jun Qian, and Dominiek Reynaerts. 2020. "Tool Wear and Material Removal Predictions in Micro-EDM Drilling: Advantages of Data-Driven Approaches" Applied Sciences 10, no. 18: 6357. https://0-doi-org.brum.beds.ac.uk/10.3390/app10186357
Note that from the first issue of 2016, this journal uses article numbers instead of page numbers. See further details here.