Article

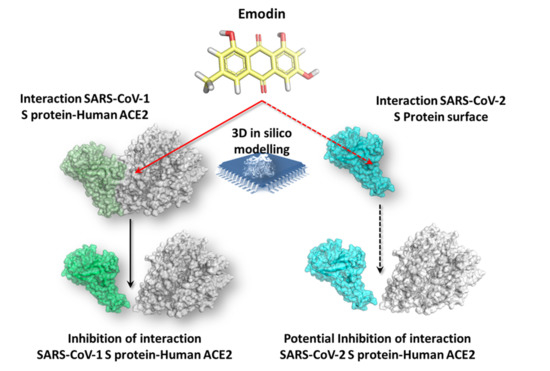
Preventing the Interaction between Coronaviruses Spike Protein and Angiotensin I Converting Enzyme 2: An In Silico Mechanistic Case Study on Emodin as a Potential Model Compound

by
Luca Dellafiora
1,*,
Jean Lou C M Dorne
2,
Gianni Galaverna
1 and
Chiara Dall’Asta
1
1
Department of Food and Drug, University of Parma, Parco Area delle Scienze 27/A, 43124 Parma, Italy
2
European Food Safety Authority (EFSA), Scientific Committee and Emerging Risks Unit, Via Carlo Magno 1A, 43126 Parma, Italy
*
Author to whom correspondence should be addressed.
Submission received: 3 August 2020 / Revised: 3 September 2020 / Accepted: 10 September 2020 / Published: 12 September 2020
(This article belongs to the Special Issue Food Toxicity: Mechanism, Analysis and Disease)

Abstract

:
Emodin, a widespread natural anthraquinone, has many biological activities including health-protective and adverse effects. Amongst beneficial effects, potential antiviral activity against coronavirus responsible for the severe acute respiratory syndrome outbreak in 2002–2003 has been described associated with the inhibition of the host cells target receptors recognition by the viral Spike protein. However, the inhibition mechanisms have not been fully characterized, hindering the rational use of emodin as a model compound to develop more effective analogues. This work investigates emodin interaction with the Spike protein to provide a mechanistic explanation of such inhibition. A 3D molecular modeling approach consisting of docking simulations, pharmacophoric analysis and molecular dynamics was used. The plausible mechanism is described as an interaction of emodin at the protein–protein interface which destabilizes the viral protein-target receptor complex. This analysis has been extended to the Spike protein of the coronavirus responsible for the current pandemic hypothesizing emodin’s functional conservation. This solid knowledge-based foothold provides a possible mechanistic rationale of the antiviral activity of emodin as a future basis for the potential development of efficient antiviral cognate compounds. Data gaps and future work on emodin-related adverse effects in parallel to its antiviral pharmacology are explored.

Graphical Abstract

1. Introduction

Emodin (1,3,8-trihydroxy-6-methylanthraquinone; Figure 1A) is a natural plant-derivative anthraquinone with its common name derived from the Himalayan rhubarb (Rheum emodi). Emodin is particularly abundant in the roots of the Chinese rhubarb (Rheum palmatum), rhubarb (Rheum officinale), buckthorn of the Rhamnus genus, knotweed and knotgrass (Polygonum cuspidatum and multiflorum) as well as Hawaii ‘au‘auko‘i cassia seeds or coffee weed (Semen cassia). Emodin-rich Chinese rhubarb, knotweed and knotgrass have been used for centuries in traditional Chinese medicine. Moreover, emodin constitutes one of the major active principles of the antiviral formulation Lianhua Qingwen [1]. Emodin can also be abundant in certain foods upon mold contamination being produced as a secondary fungi metabolite produced by Aspergillus, Penicillium, Talaromyces, Pyrenochaeta and Pestalotiopsis genera [2]. In this regard, emodin has been recently included in the group of emerging mycotoxins [2] and growing evidence of its occurrence in food is being collected [3,4]. Bioactivity of emodin involves both health-protective and toxic effects. Anticancer, anti-inflammatory, antibacterial and antiviral activities are amongst its potential beneficial properties. In contrast, toxic effects include genotoxicity, nephrotoxicity, hepatoxicity and reproductive toxicity [5,6]. Nonetheless, the mechanisms of action underpinning these activities remain to be investigated to provide a thorough characterization of emodin’s bioactivity as well as to inform about the consumption of emodin-containing plants.
With regard to antiviral properties, in vitro evidence has shown that emodin inhibits the interaction between the etiological agent of the human severe acute respiratory syndrome (SARS), the coronavirus referred to as SARS-CoV-1, and host cells target receptor [7]. Several molecules, including broad-spectrum antiviral drugs, have been described as promising to counteract SARS-CoV-1 infection [8]. These compounds act through diverse mechanisms of action and prevent either viral entry into host cells or viral replication and release [9]. Moreover, a host of natural compounds have also been identified and tested in vitro resulting in promising antiviral activity against SARS-related coronavirus [10]. Among these, emodin was found to block the interaction between the SARS-Cov-1 spike (S) protein and the human target receptor angiotensin I converting enzyme 2 (ACE2) limiting host cell invasion [7]. Emodin was also found to inhibit the 3a protein ion channel activity which may provide a basis for the observed reduction in the virus release [11]. This evidence suggests a multi-target action of emodin highlighting the anthraquinone scaffold as a potential starting point to develop candidate antiviral agents with pharmacological activities. However, the poor mechanistic understanding of emodin’s antiviral action at the molecular level prevents the rational identification of emodin derivatives or natural analogues as a potential candidate compounds for the development of more effective antiviral congeners.
In late 2019, a new coronavirus (SARS-CoV-2) was identified as the agent causing a novel coronavirus-related disease (COVID-19) [12]. The analogies between SARS-CoV-2 and the phylogenetically related SARS-CoV-1 led to further assessment of those molecular scaffolds that counteract with SARS-CoV-1. Specifically, emodin has emerged as a possible candidate for drug formulations targeting SARS-CoV-2 [13]. Nonetheless, as mentioned above, the lack of understanding of emodin’s mechanisms of action limits its potential and rational use as a model compound to design or discover efficient pharmacologically active analogues.
In the last two decades, computational methods, also as stand-alone studies, supported the characterization of small molecules’ activity as well as proteins behavior, and the use of molecular modeling approaches led to advances in their mechanistic understanding [14,15,16]. In this context, the present study relies on a structure-based computational workflow that has previously demonstrated successful as a means to investigate protein–protein and protein–ligand interactions [17,18]. Specifically, this mechanistic study addresses the interaction of emodin with the S protein of SARS-CoV-1 to provide a plausible mechanism of action for the inhibition of ACE2 recruitment described in previous studies [7]. The analysis has been also extended to the S protein of SARS-CoV-2 to investigate the potential functional conservation of emodin to prevent ACE2 recruitment. This study extends knowledge on the possible antiviral activity of emodin, which could be considered a promising model compound for the future development of efficient antiviral analogues.

2. Materials and Methods

2.1. Design of S Protein Models

The models of SARS-CoV-1 and SARS-CoV-2 S protein receptor binding domain (RBD) were derived from the crystallographic structures in the Protein Data Bank (PDB; https://www.rcsb.org) with PDB code 6ACG and 6M0J, respectively [19,20]. The PDB code and GeneBank accession number of proteins under analysis are provided in Table S1 Supplementary Materials). The SARS-CoV-1 S protein RBD-ACE2 crystallographic structure (PDB code 6ACG) contained protein regions that are not relevant to this mechanistic study and, therefore, the S protein (chain C) has been modeled using the specific residues of RBD only (Figure 2; residues ranging from Cys323 to Gly512). Crystallographic structures were processed with UCSF Chimera software (Resource for Biocomputing, Visualization, and Informatics at the University of California, San Francisco, CA, USA, 2000) [21] while checking the consistency of atom- and bond-type assignments and removing the co-crystalized ligands and waters, as previously described [22]. Hydrogen atoms were added using the “AddH” tool of the UCSF Chimera choosing the method that allows the preferential formation of hydrogen bonds. The sequence analysis was conducted using the global pairwise alignment of SARS-CoV-1 and SARS-CoV-2 S protein RBD primary sequence using the web resource EMBOSS-Water Pairwise Sequence Alignment with the Needleman–Wunsch alignment algorithm (http://www.ebi.ac.uk). The chemical structures of emodin, promazine and anthraquinone were retrieved from PubChem (https://pubchem.ncbi.nlm.nih.gov) [23] in the 3D structure-data file (sdf) format.

2.2. Computational Alanine Scanning

The computational alanine scanning was performed using the alanine scanning tool of the full-chain protein structure prediction web server Robetta (http://old.robetta.org/alascansubmit.jsp) [24,25]. This tool allows the energetic contribution of each residue to the binding free energy at the protein–protein interface to be quantified. Briefly, this method uses a physical model to score a series of protein–protein interfaces in which contact residues are individually replaced with alanine and the resulting binding energy is calculated. The output is a list of specific amino acids that are predicted to significantly destabilize the interface when mutated to alanine. Default parameters were applied and the 3D coordinates of both models were used as input while selecting S protein as “Partner 1” and ACE2 as “Partner 2”.

2.3. Docking Simulation

Docking simulations were performed using the GOLD software (version 5.7.2, Cambridge Crystallographic Data Centre, Cambridge, UK, 2019) since it has already been shown to provide reliable results computing protein–ligand interactions (e.g., ref. [26,27]). The binding site was set within a 10 Å sphere radius around the centroid of the surface pocket. Software setting and docking protocol that have been previously reported were used with minor modifications [18]. The protein structure was prepared through a short molecular dynamic simulation providing a suitable model structure for a fine docking study. To do so, 10 poses were generated for emodin and the complex with the best scored pose according to the native GOLD’s scoring function GOLDScore (see below) provided the starting structure for a short molecular dynamic simulation using GROMACS (The GROMACS Developing Team at Uppsala University and The Royal Institute of Technology, Uppsala and Stockholm, Sweden, 2016) (steepest descent algorithm with a maximum of 5000 steps; see below for further details). Considering that the crystallographic structures has no ligand bound to the surface pocket, this procedure aimed at providing a geometrically congruent structure avoiding possible atom clashes and improper atom arrangements. The full docking study was then carried out using the structure with the lowest energy. For each GOLD docking search, a maximum number of 100,000 operations were performed on a population of 100 individuals with a selection pressure of 1.1. Operator weights for crossover, mutation, and migration were set to 95, 95, and 10, respectively. The number of islands was set to 5 and the niche to 2. The hydrogen bond distance was set to 2.5 Å and the vdW linear cut-off to 4.0. Ligand flexibility options “flip pyramidal N”, “flip amide bonds”, and “flip ring corners” were allowed. The GOLD’s internal scoring function GOLDScore was used to score docking poses as an optimal process to analyse the reference set of compounds (vide infra). The proteins were kept semi-flexible, the polar hydrogen atoms were set free to rotate and the ligands were set fully flexible. In addition, since GOLD implements a genetic algorithm that may introduce variability in the results, each simulation was performed in triplicate to avoid non causative score assignments and results were expressed as mean ± standard deviation (SD).

2.4. Pharmacophoric Analysis

The surface pockets of both models were defined using GetCleft algorithm [28], while the respective pharmacophoric imagines were derived using the IsoMIF algorithm [29]. Default parameters were applied with the exception of the maximum distance value between the grid and residues atoms set at 3 with a grid resolution of 1 Å.

2.5. Molecular Dynamics

Molecular dynamics (MD) simulations were performed to investigate the dynamic of ligand interaction with the surface pocket at the protein–protein interface. The best scored binding poses calculated using docking simulations were used as inputs. MD simulations were performed using GROMACS (version 5.1.4) [30] with the CHARMM27 all-atom force field parameters support [31]. Ligands were processed with the CHARMM27 all-atom force field using the SwissParam web server (http://www.swissparam.ch). The MD conditions previously described were used in each simulation (50 ns) [18]. Briefly, input structures were solvated with SPCE waters in a cubic periodic boundary condition, and counter ions (Na+ and Cl) were added to neutralize the system. Prior to MD simulation, the systems were energetically minimized to avoid steric clashes and to correct improper geometries using the steepest descent algorithm with a maximum of 5000 steps. Afterwards, all the systems underwent isothermal (300 K, coupling time 2 psec) and isobaric (1 bar, coupling time 2 psec) 100 psec simulations before running 50 nsec simulations (300 K with a coupling time of 0.1 psec and 1 bar with a coupling time of 2.0 psec). The number of long-lasting and short-range contacts between the viral protein and the human ACE2 was measured through g_contacts software (Version 1.0, CPC Program Library, Queen’s University, Belfast, N. Ireland, 2013) [32] using the “—resndx” option to calculate the non-polar contributions to the inter-molecular interactions at an amino acid level, as previously shown [33,34]. The cut-off frequency for long-lasting contacts was set at 0.25 to identify those that occurred, in at least, 25% of the simulations.

2.6. Statistical Analysis

Statistical analysis of docking results was performed using IBM SPSS Statistics for Linux, version 25 (IBM Corp., Armonk, NY, USA). The data was analysed using one-way analysis of variance (ANOVA, α = 0.05), followed by a post hoc Fisher’s least significant difference (LSD) test (α = 0.05).

3. Results and Discussion

Emodin, promazine (Figure 1B), and to a minor extent the emodin congener anthraquinone (Figure 1C), were shown to inhibit the interaction of SARS-CoV-1 S protein with ACE2 [7]. The SARS-CoV-1 S protein–ACE2 complex is stabilized via protein–protein interaction (PPI) at the complex interface involving the RBD of the S protein’s S1 subunit, as described in crystallographic studies (Figure 2) [20]. Of note, anthraquinones may efficiently prevent protein–protein complex formation disrupting the interaction hotspots of PPI that are mediated by alpha helixes [35,36,37]. Therefore, it was proposed that such a mechanism may contribute to emodin’s action. Hence, the interaction of emodin at the SARS-CoV-1 S protein–ACE2 complex interface was studied to provide a plausible detailed mechanistic assessment of its previously documented antiviral action.
Specifically, the interaction interface of S protein’s RBD-ACE2 complex was analysed to: (i) describe potential PPI hotspots at the S protein–ACE2 complex interface; (ii) describe a possible site of emodin interaction at the S protein–ACE2 complex interface that may inhibit PPI.
The analysis of interaction hotspots and the pocket search was followed by docking studies to assess the ability of emodin to fit the pocket at the complex interface. Subsequently, molecular dynamics were performed to investigate the emodin’s ability to remain at the S protein contact surface over the time. Then, molecular dynamic simulations were used to assess whether emodin’ activity may interact and interfere with the SARS-CoV-1 S protein–target receptor complex. Finally, the analysis was extended also to the SARS-CoV-2 S protein to check a possible functional conservation of emodin on the two orthologous S protein.

3.1. Analysis of Severe Acute Respiratory Syndrome Coronavirus (SARS-CoV-1) S Protein-Angiotensin I Converting Enzyme 2 (ACE2) Complex

The visual inspection of SARS-CoV-1 S protein–ACE2 complex highlighted the prominence of an ACE2 alpha helix (residues 20–53) at the contact interface (Figure 2). Interaction hotspots (i.e., residues with a key role to stabilize PPI) were analysed with a previously validated computational approach through the implementation of the so called “computational alanine scanning” [38] using the Robetta algorithm [24]. Tyr41, Gln42, Gln325 and Lys353 were identified as the amino acid positions of ACE2 with the most marked effect on the PPI, while Tyr442, Tyr475, Tyr484 and Tyr491 were the key residues of S protein (Figure 2; Table S2 Supplementary Materials). Therefore, two different regions with a marked calculated energetic contribution to the PPI were identified at the protein–protein contact surface (Figure 2). One was formed by six out of eight of the key residues identified and such a contact point, enriched in interaction hotspots, was hypothesised to have a prominent role in promoting the PPI. Subsequently, the protein–protein contact interface was visually inspected and a surface pocket that potentially allows hosting molecules with anthraquinone scaffold was identified (Figure 2). This potential site of interaction was contiguous to the protein–protein contact point that was found enriched in interaction hotspots. This result was in line with the aforementioned hypothesis. Indeed, emodin, promazine and to a minor extent anthraquinone, might prevent SARS-CoV-1 S protein–ACE2 complex by docking such a pocket, disrupting a focal contact point and eventually destabilizing the complex. The binding capacity of emodin, promazine and anthraquinone within such surface pocket was assessed by means of docking simulations and molecular dynamics.

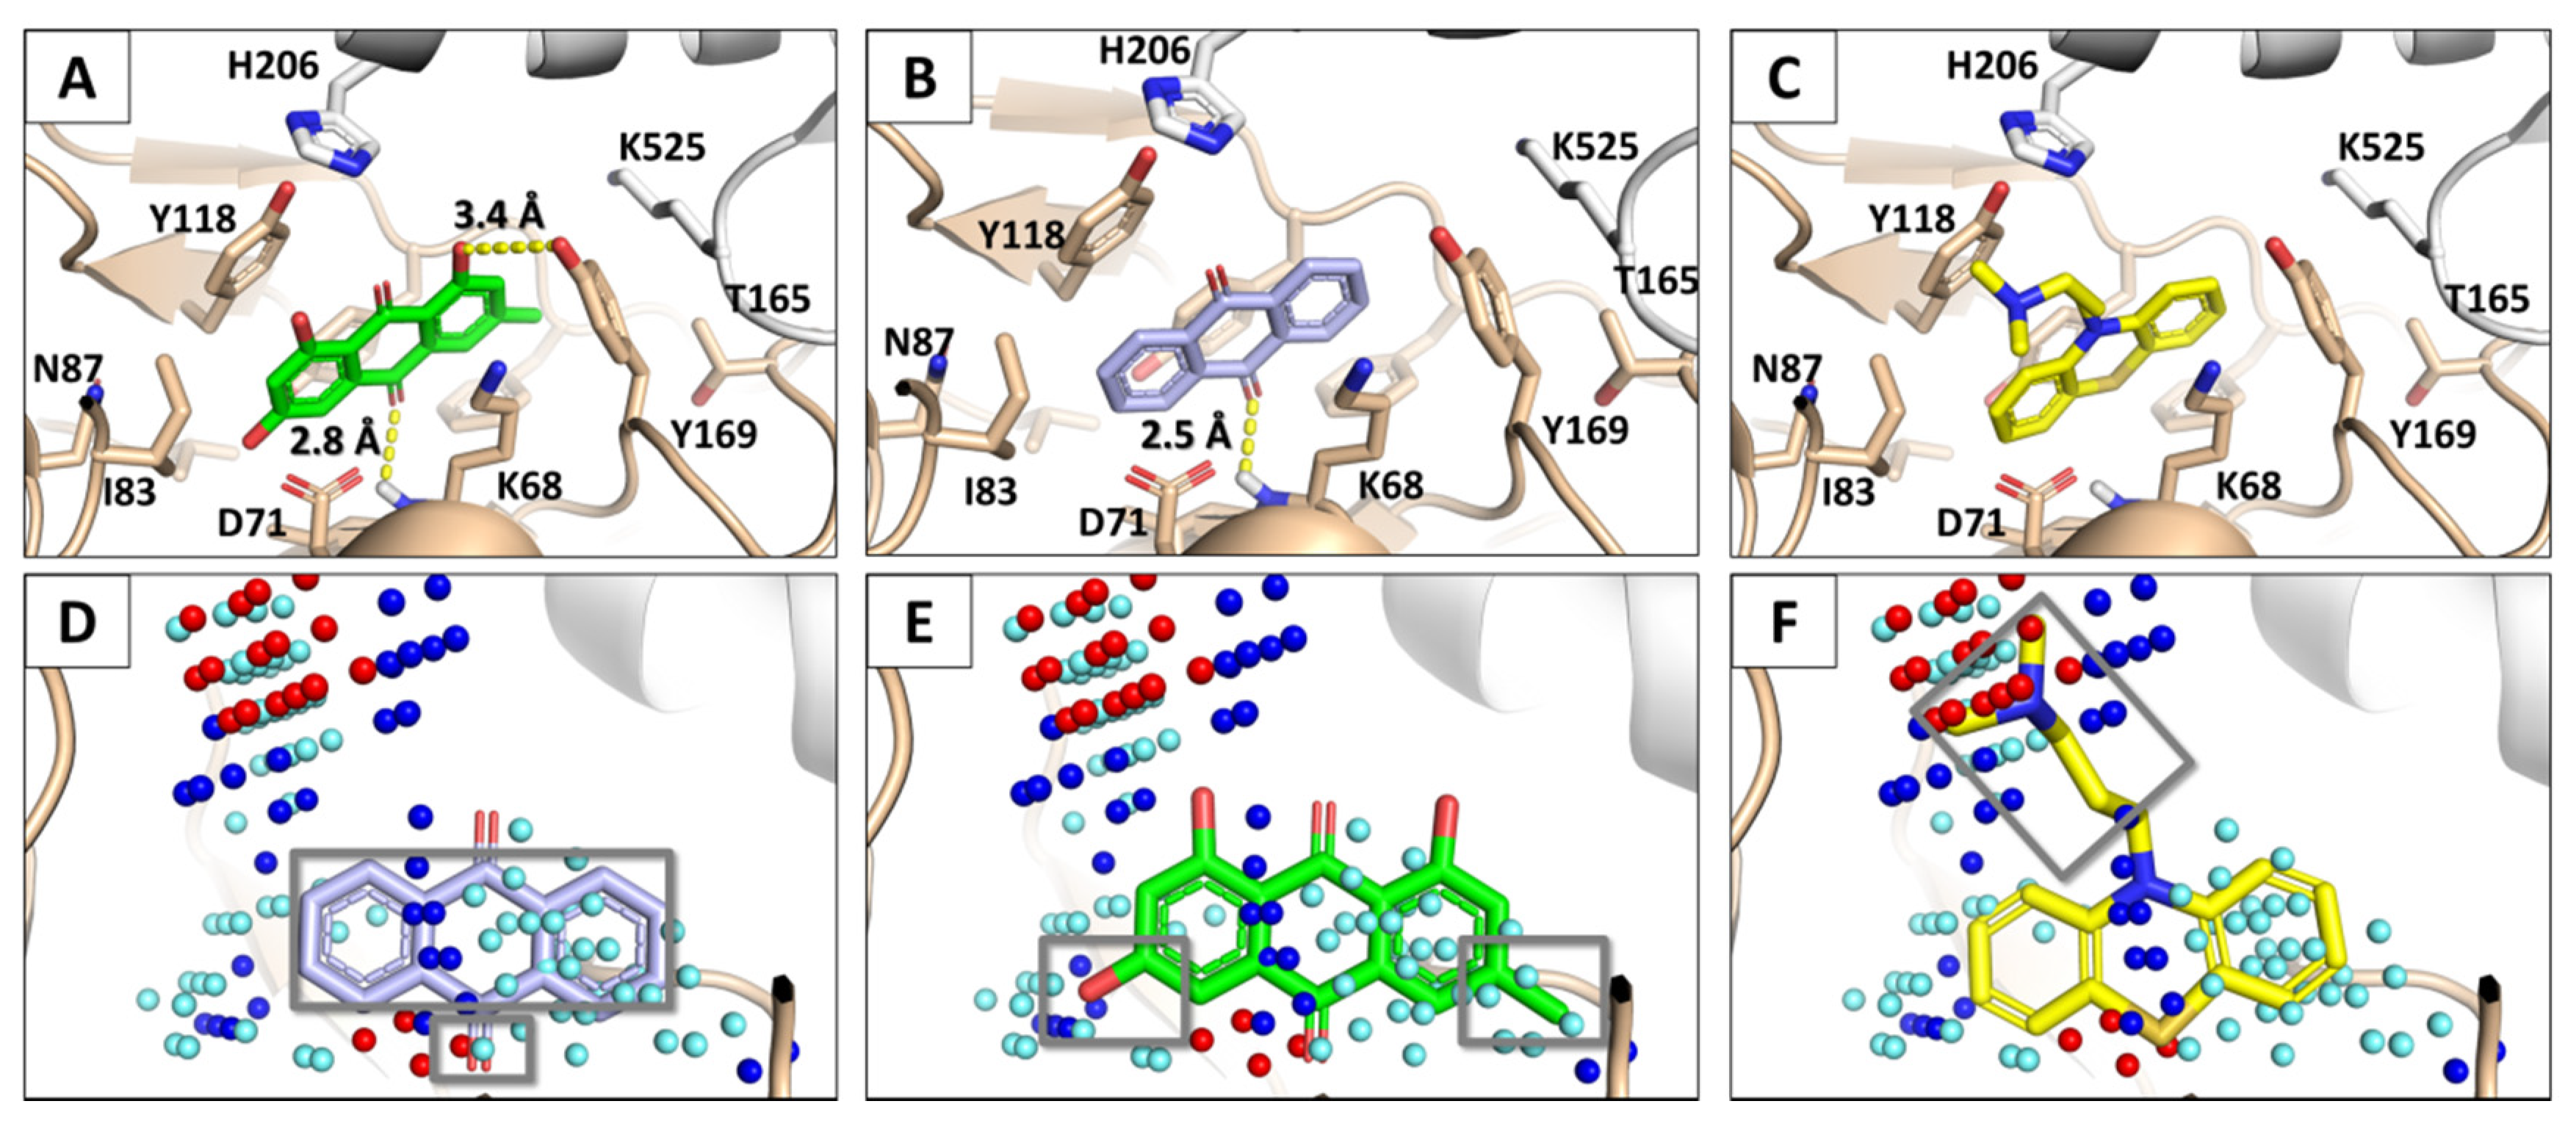
3.2. Docking Simulations of SARS-CoV-1 S Protein–ACE2 Complex

The docking simulations allowed investigation of emodin, promazine and anthraquinone capacities fitting within the aforementioned surface pocket. Although docking simulations reliably allow investigation of ligand–protein interaction [22,26], a fit-for-purpose feasibility assessment was performed by comparing docking scores and experimental outcomes previously reported for emodin, promazine and anthraquinone [7]. The lack of further background data did not allow a wider system validation to be performed. Nonetheless, the results collected supported the model reliability. Indeed, emodin, promazine and anthraquinone recorded 64.8 ± 0.4, 73.9 ± 0.1 and 53.5 ± 0.6 GOLDScore units, respectively. Docking scores, which may correlate with the binding capacity of molecules within the pocket (the higher GOLDScore scoring, the higher the ligand-pocket match), were significantly different for the three compounds (p < 0.001, Fisher’s LSD post hoc test) and reflected the potency rank described by Ho (i.e., promazine > emodine > anthraquinone) [7]. This result reinforced our hypothesis on differences in binding capacity for the three compounds at the protein–protein interface as the basis of their diverse inhibition of SARS-CoV-1 S protein–ACE2 interaction. With regard to binding architectures, emodin, promazine and anthraquinone showed similar pocket occupancy (Figure 3). Emodin engaged through polar contacts the side chain of Tyr169 and the peptidic nitrogen of Lys68 with the hydroxyl group in position 8 and the keto group in position 10, respectively (Figure 3A). Anthraquinone engaged only Lys68 with the keto group in position 10 (Figure 3B), while promazine interacted with the pocket mainly via hydrophobic contacts (Figure 3C).
The comparison between the docking poses and the pharmacophoric fingerprint of the pocket provided a rationale for the score differences recorded. Anthraquinone satisfied the hydrophobic requirements and, in addition, fitted the keto group in a region able to receive a hydrogen-bond acceptor group forming a polar contact (Figure 3D). Conversely, emodin maintained the same matches of anthraquinone along with the involvement of 6-methyl and 3-hydroxyl groups arranged in a region able to receive hydrophobic and hydrogen-bond donor groups, respectively (Figure 3E). These additional pharmacophoric matches show that the structure of emodin satisfies pocket requirements better than anthraquinone. Promazine matched the hydrophobic requirements in similar fashion to anthraquinone and emodin, adding a wide pocket match with the branched chain (propan-1-ammine group), which matched both hydrophobic and polar requirements of the pocket (Figure 3F). Promazine capacity to expand interactions outside the inner part of the pocket with a good pharmacophoric match provided a rationale for the higher computational score compared to emodin and promazine.
Overall, docking results and pharmacophoric analysis supported the model reliability and it was assumed that the extent of ligand-pocket match is a crucial pre-requisite to stably interact at the protein-protein interface to disrupt the complex stability. Also, the agreement between computational scores and experimental outcomes reinforced the hypothesis that such interface pocket provides a relevant site of interaction for small molecules enabling the inhibition of the complex formation.

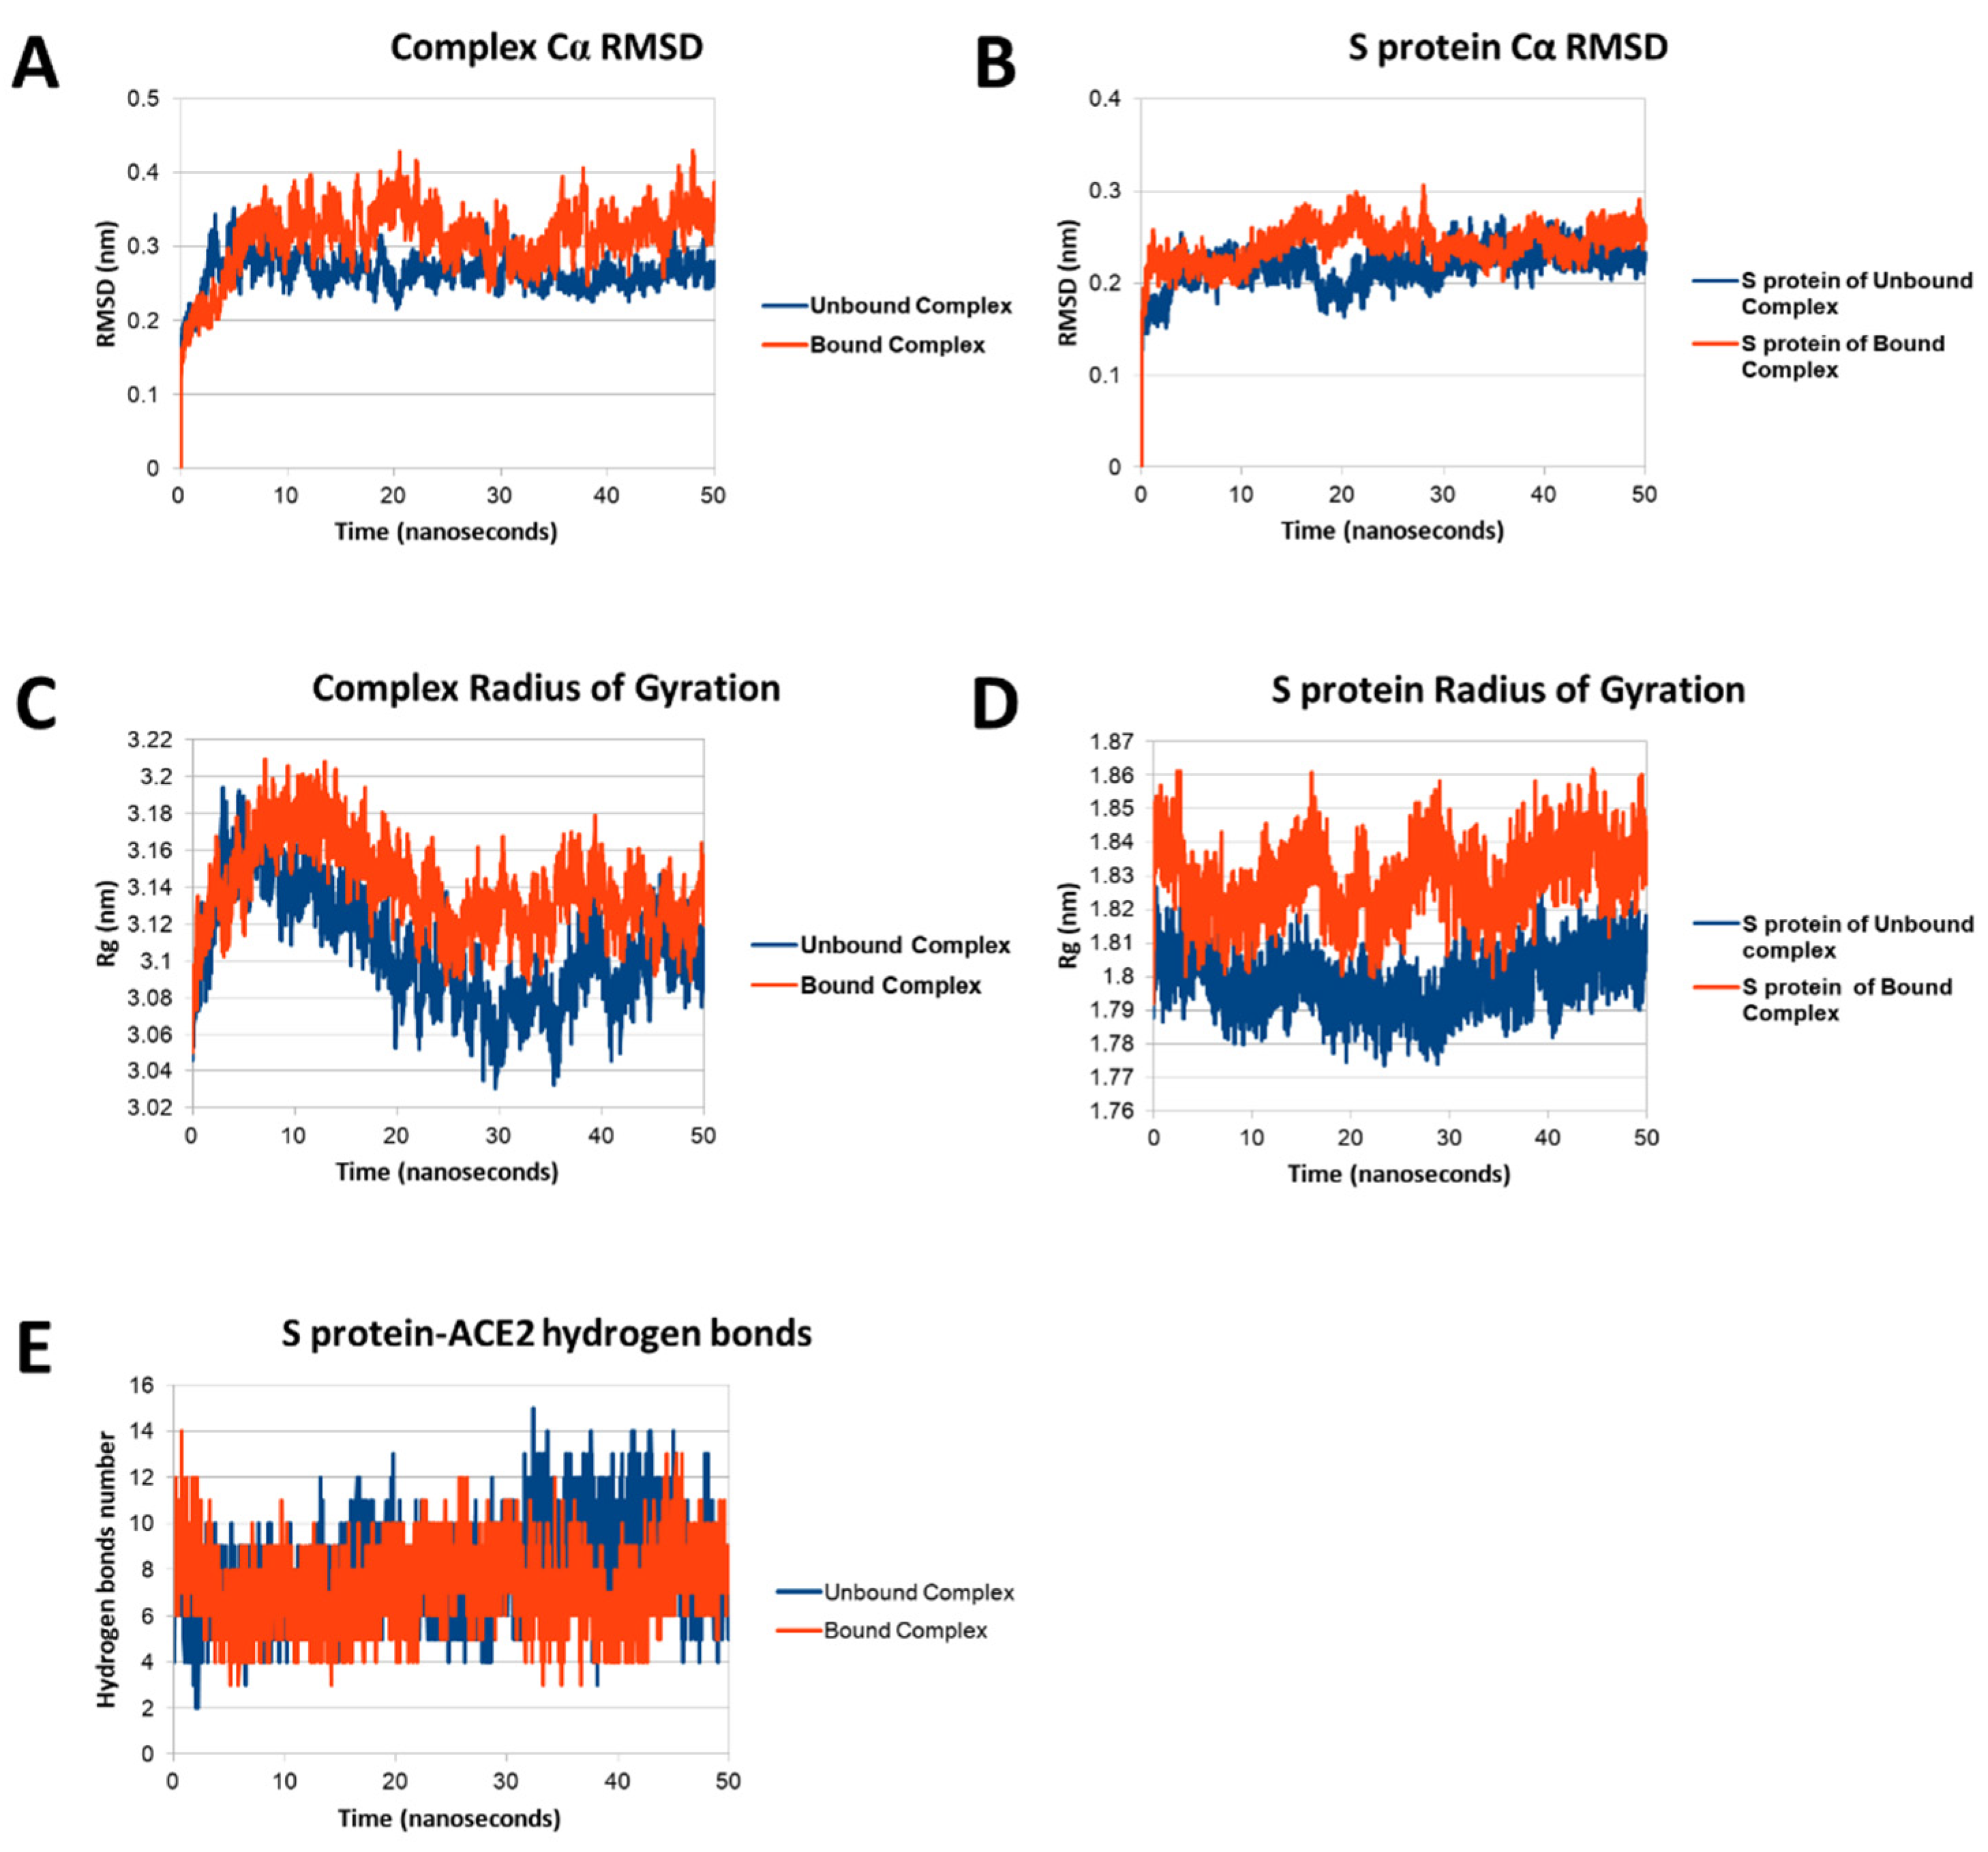
3.3. Molecular Dynamics of SARS-CoV-1 S Protein

Inhibitory activity towards the formation of the SARS-CoV-1 S protein–ACE2 complex was further assessed using molecular dynamics simulations. The best scored docking pose of each compound was used as input coordinates in molecular dynamic simulations to check their capability to persist at the proposed site of interaction. The S protein not bound to ACE2 was used first assuming that complex-disrupting compounds may also interact at the site of interaction prior to the complex formation. The root mean square deviation (RMSD) of protein C-alpha and ligands’ atomic coordinates were analyzed along with ligand trajectories to measure the geometrical stability of complexes, which is inherently linked to ligands’ activity and protein functions [18]. The overall geometrical stability of the S protein was more pronounced (lower RMSD values) when complexed with anthraquinone compared to that with emodin and promazine (Figure 4A).
While assuming that the organization of the S protein is an important facet to recognize its target receptor, the ligand-dependent destabilization of the S protein has a likely role in determining the extent of ligand-dependent inhibition. Specifically, the low capability of anthraquinone to prevent the interaction of SARS-CoV-1 S protein with ACE2 could be partially explained by its lowest capacity to change S protein organization. Conversely, the more potent capacity of emodin and promazine to prevent SARS-CoV-1 S protein–ACE2 interaction compared to anthraquinone may be due to their higher capacity to change S protein organization. A close inspection revealed that the most marked effect was at the level of residues 470–490 (Figure 4C), which form one of the two PPI hotspots identified (see above). Specifically, that region was more stable and compact when the protein was complexed with anthraquinone compared to the complex with emodin or promazine. This localised difference in protein stability could explain in part the experimental differences in the reported activities of the compounds. The analysis of ligands’ RMSD values in respect to the protein coordinates and trajectories revealed a substantial difference between anthraquinone compared with emodin and promazine (Figure 4B,D). In particular, anthraquinone showed a marked increase of RMSD compared to the other two ligands reflecting a poorly stable interaction at the identified binding site. Indeed, an early detachment from the surface pocket with a clear one-way outward trajectory was observed. Emodin and promazine were, instead, able to remain at the surface pocket of S protein over time. Notably, emodin and promazine migrated closer to the region identified as a PPI hotspot for S protein–ACE2 interaction (see above). Conversely, anthraquinone, moves out of the pocket at an early stage and this is consistent with its low inhibitory potency towards S protein–ACE2 complex formation. In this respect, ligands diffusion on protein surface likely foreshadow ligand binding since it has been already observed in molecular dynamic studies [39] and it has been already demonstrated as the causal link for a relevant surface protein-ligand interaction [40]. Hence, these results are in line with our initial hypothesis and further corroborate the causal link between the diverse capacity of these compounds to persist at the protein-protein contact surface and the different experimental inhibitory potencies. The authors note that emodin and promazine did not record appreciable geometrical differences in terms of surface occupancy in the timeframe considered, in spite of the diverse activity found experimentally (the former being less potent than the latter) [7]. Therefore, the different activities reported could not be explained on the basis of their persistence at the surface pocket. However, assuming the duration of the interaction as an important aspect to determine the inhibitory potential, a more lasting interaction can be expected for promazine, which showed a stronger inhibitory activity in vitro [7] compared to emodin.
Considering that emodin is the focus of this work, its capacity to disrupt the geometry of SARS-CoV-1 S protein–ACE2 complex was also assessed. The geometrical stability of the unbound SARS-CoV-1 S protein–ACE2 complex was compared to that of the complex bound to emodin. The RMSD values of the unbound complex described a rather stable geometry either for the protein–protein complex or for the S protein (Figure 5). In contrast, the geometry was less stable and associated with higher RSMD values for the complex in the bound state with emodin (Figure 5A,B). In addition, the radius of gyration (Rg) was calculated for the SARS-CoV-1 S protein–ACE2 complex for both its unbound and bound state with emodin. Rg reflects protein compactness and a large body of evidence is available describing that an increase of Rg compared to a stable folded state is typically associated with unfolding processes and complex dissociation [41,42,43]. The complex in the bound state with emodin showed higher Rg values compared to the unbound complex, particularly at the level of the S protein (Figure 5C,D). Taken together, these data highlight the capacity of emodin to destabilize SARS-CoV-1 S protein–ACE2 complex formation with a particular action on the S protein geometry. Moreover, both the analysis of hydrogen bonds and long-lasting short-range contacts between the S protein and ACE2 were performed to investigate the potential impact of emodin in weakening the network of interaction at the protein-protein interface. The analysis of the number of hydrogen bonds over time revealed a slightly higher number of contacts for the unbound complex toward the end of the simulation compared to the complex bound to emodin (Figure 5E).
These results were in agreement with the analysis of the number of long-lasting short-range contacts namely, 46 and 43 for the unbound and bound complex respectively. It is noted that it was not possible to observe a protein detachment, and this aspect can be further investigated with simulation times, but the decrease of hydrogen bonds and long-lasting short-range contacts can be associated with protein–protein complex instability likely resulting in protein detachment [17]. These data congruently pointed to the inhibitory action of emodin on the SARS-CoV-1 S protein–ACE2 complex formation supporting the hypothesised surface interaction as a plausible mechanistic explanation of emodin activity.

3.4. Molecular Dynamics of SARS-CoV-2 S Protein

Emodin might also prevent the interaction between SARS-CoV-2 S protein and ACE2 on the basis of the conserved mechanism of ACE2 recognition [19]. In addition, emodin has emerged as a possible re-purposable candidate for drug combinations targeting SARS-CoV-2 [13], but more details of its antiviral action are urgently required to provide a more informed assessment of its potential. In this framework, this study provides a preliminarily assessment of the possible functional conservation of emodin. The two S protein ortholog portions under analysis shared nearly 75% of primary sequence identity with a full conservation in terms of 3D organization (Figure 6A,B), further pointing to the plausible conserved activity of emodin. The surface pocket that is potentially able to host emodin was also found at the contact surface of the SARS-CoV-2 S protein–ACE2 complex (Figure S1, Supplementary Materials). Therefore, the inhibitory potential of the SARS-CoV-2 S protein–ACE2 complex formation was investigated by checking the capability of emodin to persist at the protein-protein contact surface of SARS-CoV-2 S over the time. Emodin was docked within the surface pocket and the best scored pose (65.4 ± 0.2 GOLDScore units) was used as an input for the molecular dynamic simulations. Emodin, while complexed with the SARS-CoV-2 S protein, showed a more stable geometry of interaction with lower RMSD values compared to the complex with SARS-CoV-1 S protein (Figure 6). In addition, the analysis of emodin trajectories at the SARS-CoV-2 S protein surface compared to those at SARS-CoV-1 S protein surface, showed a lower spread over the protein surface and a more marked permanence nearest the focal contact point enriched of interaction hotspots, which were also confirmed for the SARS-CoV-2 S protein–ACE2 complex (Table S3 and Figure S1, Supplementary Materials). Taken together, these results provide evidence for the possible inhibition activities of emodin towards complex formation between SARS-CoV-2 S protein and ACE2.

4. Conclusions

The characterization of emodin’s bioactivities requires an understanding of its mechanisms of action for a range of targets. Molecular modeling provides successful means to decipher the mechanisms of action of xenobiotics describing the chemistry of interaction with their respective biological targets [18]. This study has applied such a computational workflow to investigate a possible mechanistic rationale likely underlying the inhibition activity of emodin to prevent SARS-CoV-1 S protein–ACE2 complex formation. This study provided for the first time an account of the plausible surface interaction at the protein–protein contact interface among the possible mechanisms involved, which deserves further specific experimental investigations. Nonetheless, other mechanisms cannot be excluded. Indeed, emodin previously shown a range of biological activities. A wealth of biological targets has been already identified for its potential beneficial effects. With respect to its antiviral activity, emodin provided interesting results against a range of viruses with diverse mechanisms of action [44]. Therefore, complex and multi-target activities against coronavirus are likely. In this respect, emodin was also found to inhibit the 3a protein ion channel activity possibly reducing virus release [11]. Moreover, the involvement of additional targets at the host level, other than ACE2, can be reasonably expected although the shortage of data prevents making sound assumptions and conclusions. However, in light of this complex scenario, the outcomes presented here provide a meaningful and knowledge-based foothold to better characterize the antiviral properties of emodin from a molecular standpoint. As a general remark, this exploratory study described emodin’s potential, as a representative of the anthraquinone class, as a natural-derivative lead compound to develop molecules preventing the viral recognition of ACE2 cells, rather than a strong antiviral compound per se. In parallel, a possible novel mechanism to counteract coronavirus-dependent infections has been proposed. Drawing on a more informed knowledge-base for this widespread compound is of utmost importance to support the possible future design of more effective anti-viral molecules using emodin as a model compound. Of particular relevance, further investigations of the toxicokinetics and toxicity associated with emodin exposure are recommended, since the current understanding prevents its use as a safe and effective antiviral agent as such. In particular, the current understanding of emodin action describes a marked multi-target action that warns about possible off-targets resulting in unwanted adverse effect. Further studies will provide a rationale to design emodin derivatives with optimized pharmacological properties to support their use in feasible and effective antiviral treatment. In addition, available scientific evidence describing the association between emodin’s exposure, genotoxicity, hepatotoxicity, nephrotoxicity and reproductive toxicity is increasing and further research is also needed to address the associated mechanisms. Ultimately, these studies would allow to assess the balance between the beneficial and adverse effects of emodin as a model compound with antiviral properties while supporting the future potential design of more effective and safe anti-viral molecules [5].

Supplementary Materials

Supplementary materials can be found at https://0-www-mdpi-com.brum.beds.ac.uk/2076-3417/10/18/6358/s1. Accession codes of protein under analysis (Table S1); detailed results of computational alanine scanning (Tables S2 and S3); graphical representation of SARS-CoV-2 S protein-ACE2 complex (Figure S1).

Author Contributions

Conceptualization, L.D. and J.L.C.M.D.; methodology, L.D., C.D., G.G.; software, L.D.; formal analysis, L.D.; investigation, L.D., C.D., G.G.; resources, G.G.; data curation, L.D., C.D., G.G.; writing—original draft preparation, L.D., J.L.C.M.D., C.D., G.G.; supervision, C.D. and G.G. All authors have read and agreed to the published version of the manuscript.

Funding

This research received no external funding.

Acknowledgments

This research benefits from the HPC (high performance computing) facility of the University of Parma, Italy.

Conflicts of Interest

The authors declare no conflict of interest. Also, the view expressed in this article are the authors only and do not necessarily represent the views of the European Food Safety Authority.

Abbreviations

ACE2Angiotensin I converting enzyme 2
MDMolecular dynamic
PDBProtein Data Bank
RBDReceptor Binding Domain
RMSDRoot mean square deviation
SARSSevere acute respiratory syndrome

References

  1. Cui, Y.T.; Lu, P.R.; Song, G.; Liu, Q.; Zhu, D.; Liu, X.B. Involvement of PI3K/Akt, ERK and p38 signaling pathways in emodin-mediated extrinsic and intrinsic human hepatoblastoma cell apoptosis. Food Chem. Toxicol. 2016, 92, 26–37. [Google Scholar] [CrossRef] [PubMed]
  2. Romera, D.; Mateo, E.M.; Mateo-Castro, R.; Gomez, J.V.; Gimeno-Adelantadob, J.V.; Jimenez, M. Determination of multiple mycotoxins in feedstuffs by combined use of UPLC-MS/MS and UPLC-QTOF-MS. Food Chem. 2018, 267, 140–148. [Google Scholar] [CrossRef] [PubMed]
  3. Sulyok, M.; Beed, F.; Boni, S.; Abass, A.; Mukunzi, A.; Krska, R. Quantitation of multiple mycotoxins and cyanogenic glucosides in cassava samples from Tanzania and Rwanda by an LC-MS/MS-based multi-toxin method. Food Addit. Contam. A 2015, 32, 488–502. [Google Scholar] [CrossRef] [PubMed]
  4. Ezekiel, C.N.; Sulyok, M.; Ogara, I.M.; Abia, W.A.; Warth, B.; Sarkanj, B.; Turner, P.C.; Krska, R. Mycotoxins in uncooked and plate-ready household food from rural northern Nigeria. Food Chem. Toxicol. 2019, 128, 171–179. [Google Scholar] [CrossRef] [PubMed]
  5. Dong, X.X.; Fu, J.; Yin, X.B.; Cao, S.L.; Li, X.C.; Lin, L.F.; Huyiligeqi; Ni, J. Emodin: A Review of its Pharmacology, Toxicity and Pharmacokinetics. Phytother. Res. 2016, 30, 1207–1218. [Google Scholar] [CrossRef]
  6. Dewanjee, S.; Chakraborty, P.; Mukherjee, B.; De Feo, V. Plant-Based Antidiabetic Nanoformulations: The Emerging Paradigm for Effective Therapy. Int. J. Mol. Sci. 2020, 21, 2217. [Google Scholar] [CrossRef] [Green Version]
  7. Ho, T.Y.; Wu, S.L.; Chen, J.C.; Li, C.C.; Hsiang, C.Y. Emodin blocks the SARS coronavirus spike protein and angiotensin-converting enzyme 2 interaction. Antivir. Res. 2007, 74, 92–101. [Google Scholar] [CrossRef]
  8. Wu, Y.S.; Lin, W.H.; Hsu, J.T.A.; Hsieh, H.P. Antiviral Drug Discovery Against SARS-CoV. Curr. Med. Chem. 2006, 13, 2003–2020. [Google Scholar] [CrossRef]
  9. Elshabrawy, H.A. SARS-CoV-2: An Update on Potential Antivirals in Light of SARS-CoV Antiviral Drug Discoveries. Vaccines 2020, 8, 335. [Google Scholar] [CrossRef]
  10. Li, S.Y.; Chen, C.; Zhang, H.Q.; Guo, H.Y.; Wang, H.; Wang, L.; Zhang, X.; Hua, S.N.; Yu, J.; Xiao, P.G.; et al. Identification of natural compounds with antiviral activities against SARS-associated coronavirus. Antivir. Res. 2005, 67, 18–23. [Google Scholar] [CrossRef]
  11. Schwarz, S.; Wang, K.; Yu, W.J.; Sun, B.; Schwarz, W. Emodin inhibits current through SARS-associated coronavirus 3a protein. Antivir. Res. 2011, 90, 64–69. [Google Scholar] [CrossRef] [PubMed]
  12. Wang, X.; Xia, S.; Wang, Q.; Xu, W.; Li, W.; Lu, L.; Jiang, S. Broad-Spectrum Coronavirus Fusion Inhibitors to Combat COVID-19 and Other Emerging Coronavirus Diseases. Int. J. Mol. Sci. 2020, 21, 384. [Google Scholar] [CrossRef] [PubMed]
  13. Zhou, Y.D.; Hou, Y.; Shen, J.Y.; Huang, Y.; Martin, W.; Cheng, F.X. Network-based drug repurposing for novel coronavirus 2019-nCoV/SARS-CoV-2. Cell Discov. 2020, 6, 1–18. [Google Scholar] [CrossRef] [PubMed] [Green Version]
  14. Talarico, C.; Gervasoni, S.; Manelfi, C.; Pedretti, A.; Vistoli, G.; Beccari, A.R. Combining Molecular Dynamics and Docking Simulations to Develop Targeted Protocols for Performing Optimized Virtual Screening Campaigns on the hTRPM8 Channel. Int. J. Mol. Sci. 2020, 21, 2265. [Google Scholar] [CrossRef] [PubMed] [Green Version]
  15. Huang, S.H.; Chen, L.X.; Mei, H.; Zhang, D.; Shi, T.T.; Kuang, Z.Y.; Heng, Y.; Xu, L.; Pan, X.C. In Silico Prediction of the Dissociation Rate Constants of Small Chemical Ligands by 3D-Grid-Based VolSurf Method. Int. J. Mol. Sci. 2020, 21, 2456. [Google Scholar] [CrossRef] [Green Version]
  16. Poot Velez, A.H.; Fontove, F.; Del Rio, G. Protein–Protein Interactions Efficiently Modeled by Residue Cluster Classes. Int. J. Mol. Sci. 2020, 21, 4787. [Google Scholar] [CrossRef]
  17. Dellafiora, L.; Filipello, V.; Dall’Asta, C.; Finazzi, G.; Galaverna, G.; Losio, M.N. A Structural Study on the Listeria Monocytogenes Internalin A-Human E-cadherin Interaction: A Molecular Tool to Investigate the Effects of Missense Mutations. Toxins 2020, 12, 60. [Google Scholar] [CrossRef] [Green Version]
  18. Dellafiora, L.; Oswald, I.P.; Dorne, J.L.; Galaverna, G.; Battilani, P.; Dall’Asta, C. An in silico structural approach to characterize human and rainbow trout estrogenicity of mycotoxins: Proof of concept study using zearalenone and alternariol. Food Chem. 2020, 312, 10. [Google Scholar] [CrossRef]
  19. Lan, J.; Ge, J.; Yu, J.; Shan, S.; Zhou, H.; Fan, S.; Zhang, Q.; Shi, X.; Wang, Q.; Zhang, L.; et al. Structure of the SARS-CoV-2 spike receptor-binding domain bound to the ACE2 receptor. Nature 2020. [Google Scholar] [CrossRef] [Green Version]
  20. Song, W.F.; Gui, M.; Wang, X.Q.; Xiang, Y. Cryo-EM structure of the SARS coronavirus spike glycoprotein in complex with its host cell receptor ACE2. PLoS Pathog. 2018, 14, e1007236. [Google Scholar] [CrossRef]
  21. Pettersen, E.F.; Goddard, T.D.; Huang, C.C.; Couch, G.S.; Greenblatt, D.M.; Meng, E.C.; Ferrin, T.E. UCSF Chimera-a visualization system for exploratory research and analysis. J. Comput. Chem. 2004, 25, 1605–1612. [Google Scholar] [CrossRef] [PubMed] [Green Version]
  22. Dellafiora, L.; Mena, P.; Del Rio, D.; Cozzini, P. Modeling the effect of phase II conjugations on topoisomerase I poisoning: Pilot study with luteolin and quercetin. J. Agric. Food Chem. 2014, 62, 5881–5886. [Google Scholar] [CrossRef] [PubMed]
  23. Kim, S.; Chen, J.; Cheng, T.J.; Gindulyte, A.; He, J.; He, S.Q.; Li, Q.L.; Shoemaker, B.A.; Thiessen, P.A.; Yu, B.; et al. PubChem 2019 update: Improved access to chemical data. Nucleic Acid Res. 2019, 47, D1102–D1109. [Google Scholar] [CrossRef] [Green Version]
  24. Kortemme, T.; Kim, D.E.; Baker, D. Computational alanine scanning of protein-protein interface. Sci. STKE 2004, 219, pI2. [Google Scholar] [CrossRef] [PubMed] [Green Version]
  25. Kortemme, T.; Baker, D. A simple physical model for binding energy hot spots in protein-protein complexes. Proc. Natl. Acad. Sci. USA 2002, 99, 14116–14121. [Google Scholar] [CrossRef] [Green Version]
  26. Rollinger, J.M.; Schuster, D.; Baier, E.; Ellmerer, E.P.; Langer, T.; Stuppner, H. Taspine: Bioactivity-guided isolation and molecular ligand-target insight of a potent acetylcholinesterase inhibitor from Magnolia x soulangiana. J. Nat. Prod. 2006, 69, 1341–1346. [Google Scholar] [CrossRef] [PubMed] [Green Version]
  27. Maldonado-Rojas, W.; Olivero-Verbel, J. Potential interaction of natural dietary bioactive compounds with COX-2. J. Mol. Graph. Model. 2011, 30, 157–166. [Google Scholar] [CrossRef]
  28. Gaudreault, F.; Morency, L.P.; Najmanovich, R.J. NRGsuite: A PyMOL plugin to perform docking simulations in real time using FlexAID. Bioinformatics 2015, 31, 3856–3858. [Google Scholar] [CrossRef] [Green Version]
  29. Chartier, M.; Najmanovich, R. Detection of Binding Site Molecular Interaction Field Similarities. J. Chem. Inf. Model. 2015, 55, 1600–1615. [Google Scholar] [CrossRef] [Green Version]
  30. Abraham, M.J.; Murtola, T.; Schulz, R.; Páll, S.; Smith, J.C.; Hess, B.; Lindahl, E. GROMACS: High performance molecular simulations through multi-level parallelism from laptops to supercomputers. SoftwareX 2015, 1, 19–25. [Google Scholar] [CrossRef] [Green Version]
  31. Best, R.B.; Zhu, X.; Shim, J.; Lopes, P.E.; Mittal, J.; Feig, M.; Mackerell, A.D.J. Optimization of the additive CHARMM all-atom protein force field targeting improved sampling of the backbone φ, ψ and side-chain χ(1) and χ(2) dihedral angles. J. Chem. Theory Comput. 2012, 8, 3257–3273. [Google Scholar] [CrossRef] [Green Version]
  32. Blau, C.; Grubmuller, H. g_contacts: Fast contact search in bio-molecular ensemble data. Comput. Phys. Commun. 2013, 184, 2856–2859. [Google Scholar] [CrossRef] [Green Version]
  33. Krumm, B.E.; Lee, S.; Bhattacharya, S.; Botos, I.; White, C.F.; Du, H.J.; Vaidehi, N.; Grisshammer, R. Structure and dynamics of a constitutively active neurotensin receptor. Sci. Rep. 2016, 6, 38564. [Google Scholar] [CrossRef] [PubMed] [Green Version]
  34. Owen, M.C.; Kulig, W.; Poojari, C.; Rog, T.; Strodel, B. Physiologically-relevant levels of sphingomyelin, but not GM1, induces a β-sheet-rich structure in the amyloid-β(1-42) monomer. Biochim. Biophys. Acta Biomembr. 2018, 1860, 1709–1720. [Google Scholar] [CrossRef] [PubMed]
  35. Zhang, Z.C.; Li, X.Q.; Song, T.; Zhao, Y.; Feng, Y.G. An Anthraquinone Scaffold for Putative, Two-Face Bim BH3 alpha-Helix Mimic. J. Med. Chem. 2012, 55, 10735–10741. [Google Scholar] [CrossRef]
  36. Vincendeau, M.; Hadian, K.; Messias, A.C.; Brenke, J.K.; Halander, J.; Griesbach, R.; Greczmiel, U.; Bertossi, A.; Stehle, R.; Nagel, D.; et al. Inhibition of Canonical NF-kappa B Signaling by a Small Molecule Targeting NEMO-Ubiquitin Interaction. Sci. Rep. 2016, 6, 1–15. [Google Scholar] [CrossRef]
  37. Yan, Y.Y.; Zheng, L.S.; Zhang, X.; Chen, L.K.; Singh, S.; Wang, F.; Zhang, J.Y.; Liang, Y.J.; Dai, C.L.; Gu, L.Q.; et al. Blockade of Her2/neu Binding to Hsp90 by Emodin Azide Methyl Anthraquinone Derivative Induces Proteasomal Degradation of Her2/neu. Mol. Pharm. 2011, 8, 1687–1697. [Google Scholar] [CrossRef]
  38. Ibarra, A.A.; Bartlett, G.J.; Hegedus, Z.; Dutt, S.; Hobor, F.; Horner, K.A.; Hetherington, K.; Spence, K.; Nelson, A.; Edwards, T.A.; et al. Predicting and Experimentally Validating Hot-Spot Residues at Protein-Protein Interfaces. ACS Chem. Biol. 2019, 14, 2252–2263. [Google Scholar] [CrossRef]
  39. Nerukh, D.; Okimoto, N.; Suenaga, A.; Taiji, M. Ligand Diffusion on Protein Surface Observed in Molecular Dynamics Simulation. J. Phys. Chem. Lett. 2012, 3, 3476–3479. [Google Scholar] [CrossRef]
  40. Del Favero, G.; Mayer, R.M.; Dellafiora, L.; Janker, L.; Niederstaetter, L.; Dall’Asta, C.; Gerner, C.; Marko, D. Structural Similarity with Cholesterol Reveals Crucial Insights into Mechanisms Sustaining the Immunomodulatory Activity of the Mycotoxin Alternariol. Cells 2020, 9, E847. [Google Scholar] [CrossRef] [Green Version]
  41. Duan, L.L.; Guo, X.N.; Cong, Y.L.; Feng, G.Q.; Li, Y.C.; Zhang, J.Z.H. Accelerated Molecular Dynamics Simulation for Helical Proteins Folding in Explicit Water. Front. Chem. 2019, 7, 540. [Google Scholar] [CrossRef] [PubMed] [Green Version]
  42. Huynh, T.; Smith, J.C.; Sanson, A. Protein unfolding transitions in an intrinsically unstable annexin domain: Molecular dynamics simulation and comparison with nuclear magnetic resonance data. Biophys. J. 2002, 83, 681–698. [Google Scholar] [CrossRef] [Green Version]
  43. Rocco, A.G.; Mollica, L.; Ricchiuto, P.; Baptista, A.M.; Gianazza, E.; Eberini, I. Characterization of the protein unfolding processes induced by urea and temperature. Biophys. J. 2008, 94, 2241–2251. [Google Scholar] [CrossRef] [PubMed] [Green Version]
  44. Batista, M.N.; Braga, A.C.S.; Campos, G.R.F.; Souza, M.M.; de Matos, R.P.A.; Lopes, T.Z.; Candido, N.M.; Lima, M.L.D.; Machado, F.C.; de Andrade, S.T.Q.; et al. Natural Products Isolated from Oriental Medicinal Herbs Inactivate Zika Virus. Viruses 2019, 11, 49. [Google Scholar] [CrossRef] [PubMed] [Green Version]
Figure 1. Chemical structure of molecules under analysis. (A) Emodin. (B) Promazine. (C) Anthraquinone.
Applsci 10 06358 g001
Figure 2. Representation of severe acute respiratory syndrome coronavirus (SARS-CoV-1) S protein-angiotensin I converting enzyme 2 (ACE2) complex (Protein Data Bank (PDB) code 6ACG). SARS-CoV-1 S protein is colored yellow, ACE2 is colored in white. The black box on the left figure indicates the protein–protein contact surface. The yellow dotted circles indicate the PPI hotspots (which are highlighted in red sticks in the close-up on the top right). The red box on the left figure indicates the position of the surface pocket identified at the protein–protein contact surface, which is detailed in a surface representation on the bottom-right close-up (the dotted ring indicates the possible arrangement of anthraquinones scaffold, shown in blue sticks).
Applsci 10 06358 g002
Figure 3. Binding poses of emodin, anthraquinone and promazine. Ligands and surrounding residues are represented in sticks. Yellow dotted lines indicate polar contacts. SARS-CoV-1 S protein is colored in yellow, while ACE2 is colored in white. Cyan, red and blue spheres indicate regions sterically and energetically able to receive hydrophobic, hydrogen bond acceptors and hydrogen bond donor groups respectively. (A) Binding pose of emodin. (B) Binding pose of anthraquinone. (C) Binding pose of promazine. (D) Binding pose of anthraquinone and the pharmacophoric fingerprint of pocket. Grey boxes indicate the pharmacophoric matches. (E) Binding pose of emodin and pharmacophoric fingerprint of pocket. Grey boxes indicate the additional pharmacophoric matches compared to anthraquinone. (F) Binding pose of promazine and the pharmacophoric fingerprint of pocket. Grey box indicates the additional pharmacophoric matches due to the branched amino portion.
Applsci 10 06358 g003
Figure 4. Molecular dynamic of emodin, anthraquinone or promazine in complex with SARS-CoV-1 S protein. (A) Root mean square deviation (RMSD) plot of protein Cα. (B) RSMD plot of ligands. (C) Time-step representation of ligands trajectory of localised protein motion (residues 470–490). The switch from red-to-blue color indicates the stepwise changes of protein coordinates along the molecular dynamics (MD) simulation. (D) Time-step representation of ligands trajectory. The from-red-to-blue color switch indicates the stepwise changes of ligand coordinates along the MD simulation. The white dotted rings indicate the localization of the hotspot of interaction enriched in protein-protein contacts. The white arrow indicates the outward trajectory of anthraquinone, while the dashed box highlights its late interaction site.
Applsci 10 06358 g004
Figure 5. Molecular dynamic of SARS-CoV-1 S protein–ACE2 complex in the unbound state or bound to emodin. (A) RMSD plot of complex Cα. (B) RMSD plot of S protein Cα. (C) Plot of complex’s radius of gyration. (D) Plot of S protein’s radius of gyration. (E) Hydrogen bonds plot.
Applsci 10 06358 g005
Figure 6. Comparison between SARS-CoV-1 and SARS-CoV-2. (A) Sequence alignment of S protein receptor binding domain (RBD) portions analyzed in this study. (B) Structure overlap of SARS-CoV-2 S protein RBD (white) and the homolog region of SARS-CoV-1 (yellow) (PDB codes 6ACG and 6M0J, respectively). (C) RMSD plot of emodin. (D) Time-step representation of emodin trajectory. The from-red-to-blue color switch indicates the stepwise changes of ligand coordinates along the MD simulation. The white dotted ring indicates the localization of the hotspot of interaction enriched in protein-protein contacts.
Applsci 10 06358 g006

